
AGRICULTURE RECALL SURVEY Agriculture Recall chapter 2016.pdf · reported livestock diseases rates...
57
LIBERIA POVERTY ASSESSMENT- STATISTICAL ABSTRACT AGRICULTURE RECALL SURVEY 2016 LISGIS- AGRICULTURE TEAM 24 JUNE 2017
Transcript of AGRICULTURE RECALL SURVEY Agriculture Recall chapter 2016.pdf · reported livestock diseases rates...

LIBERIA POVERTY ASSESSMENT-STATISTICAL ABSTRACT
AGRICULTURE RECALL SURVEY 2016
LISGIS- AGRICULTURE TEAM
24 JUNE 2017

I
Table of contents
Table of contents ................................................................................................................................ i
List of tables ...................................................................................................................................... ii
List of figures ................................................................................................................................... iii
Introduction ..................................................................................................................................... 4
1. The data ................................................................................................................................... 6
2 Characteristics of farming Households………………………………………………………………………………..7
3 Farming Characteristics……………………………………………………………………………………………………10
4. Use of modern inputs ............................................................................................................. 15
5. Labor utilization ..................................................................................................................... 18
6. Crop production and sales ...................................................................................................... 22
6.1 Household crop portfolio ............................................................................................... 22
6.2 Productivity of crops ...................................................................................................... 28
6.3 Gender gap in rice productivity ....................................................................................... 31
6.4 Effects of the Ebola crisis on rice farming ...................................................................... 34
6.5 Crop commercialization .................................................................................................. 40
7. Livestock ................................................................................................................................ 45
7.1 Livestock participation and ownership ............................................................................ 45
7.2 Disease rates and vaccination .......................................................................................... 48
Conclusion………………………………………………………………………………………………………………………………..50
Refrences………………………………………………………………………………………………………………………………….49
Appendix…………………………………………………………………………………………………………………………………..50

II
List of tables
Table 1. Linkages between the household and crop cut surveys ........................................................ 6
Table 2. Basic farming household characteristic………………………………………………………………………….8
Table 3. Average land area (ha) cultivated by quintiles ..................................................................... 9
Table 4. Land area cultivated by county ......................................................................................... 12
Table 5. Land tenure by County .................................................................................................... 14
Table 6. Modern inputs utilization and access to extension services ............................................... 16
Table 7. Access to extension services by County ............................................................................ 17
Table 8. Labor utilization ................................................................................................................ 18 Table 9. Distribution of annual agricultural input expenditure and hired labor, by quintiles of land
area cultivated ................................................................................................................................. 19
Table 10. Share of households owning agricultural assets, by quintiles of land area cultivated ......... 19
Table 11. Agricultural labor ............................................................................................................ 20 Table 12. Number of farming households engaged in fruits production by county (Top 4 fruits only)
....................................................................................................................................................... 24 Table 13. Number of farming households engaged in vegetable production by county (Top 6
vegetables only) .............................................................................................................................. 25
Table 14. Number of farming households engaged in cash crops production by county.................. 27
Table 15. Total production of crop by land cultivated quintiles ....................................................... 29
Table 16. Estimated production of rice (based on famer estimate) .................................................. 30
Table 17. Estimated production of cassava (based on farmer estimate) ........................................... 30
Table 18. Regression Results on Gender Differences in rice Productivity........................................ 31
Table 19. Incidence of sales of rice and cassava by county .............................................................. 41
Table 20. Share of sales of crop over total production .................................................................... 44
Table 21. Livestock participation by wealth quintiles ....................................................................... 45
Table 22. Livestock participation by household head gender ........................................................... 45
Table 23. Livestock headcounts by wealth quintiles (averages for Livestock keepers only) .............. 46
Table 24. Livestock headcounts by household head gender (averages for Livestock keepers only) .. 47
Table 25. Disease rates and vaccination by wealth quintiles ............................................................. 48
Table 26. Disease rates and vaccination by household head gender ................................................. 48

III
List of figures
Figure 1. Histogram of area of land cultivated by percentage of households ................................... 10
Figure 2. Area of land cultivated by household head’s gender ......................................................... 11
Figure 3. Land ownership patterns by households head gender ....................................................... 11
Figure 4. Gini coefficient of land area cultivated per capita ............................................................. 13
Figure 5. Land tenure by household head gender ............................................................................ 14
Figure 6. Cause of soil erosion problems ........................................................................................ 15
Figure 7. Use of improved seeds and incidence of purchase seeds .................................................. 17
Figure 8. Labor utilization by household head gender ..................................................................... 22
Figure 9. Incidence of crop cultivation by household ...................................................................... 23
Figure 10. Incidence of intercropping/monocropping .................................................................... 27
Figure 11. Reasons for intercropping .............................................................................................. 28
Figure 12. Gender gap in rice productivity ...................................................................................... 34
Figure 13. Effects of the Ebola crisis on rice farming activities ....................................................... 35
Figure 14. Reasons for not making rice farm during the Ebola crisis ............................................... 35
Figure 15. Effects of the Ebola crisis on land clearing activities on rice farms ................................. 36
Figure 16. Effects of the Ebola crisis on the planting on rice farms ................................................ 37
Figure 17. Effects of the Ebola crisis on chemical fertilizer application on rice farms ..................... 37
Figure 18. Effects of the Ebola crisis on rice harvesting .................................................................. 38
Figure 19. Effects of the Ebola crisis on the timing of rice harvesting ............................................. 38
Figure 20. Reasons for not selling crops output during the Ebola crisis........................................... 39
Figure 21. Incidence of sales of crops ............................................................................................. 40
Figure 22. Incidence of sales of crops during the Ebola crisis ......................................................... 40
Figure 23. Household engagement with the market......................................................................... 42 Figure 24. Local linear non-parametric regression of crop commercialization on land cultivated area
....................................................................................................................................................... 43

4
Introduction
Agriculture sector is the main source of livelihoods for approximately 80 percent of Liberia’s
population1. The sector plays an integral role in Liberia’s economic and social development as
it contributes significantly to employment, food security and household income. In 2016, the
agricultural sector accounted for around 26 percent of the real Gross Domestic Product
(GDP)2, approximately one third of which originates in the livestock subsectors.
Despite the importance of agriculture in Liberian economy, the incidence of poverty is
consistently higher among farming households than non-farming households. According to
the 2014 Household Income and expenditure Surveys (HIES), 77.2 percent of farming
households3 are in absolute poverty, nearly 60 percent are also in food poverty and more than
one-third are in extreme poverty. Therefore, investment in agriculture will benefit to the
majority of the poor population. In addition, cross-country evidence has convincingly shown
that GDP growth in agriculture is more poverty reducing than GDP growth originating
outside agriculture (Loayza and Raddatz, 2010; Christiaensen et al., 2011). This means for
Liberia that fostering agriculture will potentially yield the fastest poverty reduction.
Building a structural transformation program in agriculture sector in Liberia necessitate up to
date data on the sector. Thus, over the past three years, LISGIS has administered a number
of linked household and agricultural surveys that can be used to study rural livelihoods,
including the 2014 and 2016 HIES
This statistical abstract provides an insight into all-important components of the 2016
agricultural recall survey results. The report highlights major characteristics of farming
households and agricultural activities including production of food crops and livestock.
The report points out that farming households have low level of formal education and
limited access to infrastructure and basic services. The highest level of educational
attainment of heads is at the primary school level: on average, the number of years of schooling
1 The African Development Bank, The World Bank. Joint Interim Strategy Note 2007-2008. 2 Central Bank of Liberia, 2016 Annual Report 3 According to the 2014 HIES, the absolute poverty rate is 54.1% at national level; food poverty rate is 45.0% and extreme poverty rate is 18.5%

5
of farming households head is under four years. Fewer than five percent of all Farming
households report having access to an internal flush toilet, electricity and public/private
garbage collection service
Farming is dominated by smallholders with limited land endowment and hire labor to
make up for family labor shortages. Farming households cultivate on average 1.6 hectares
and three percent of farming households cultivate more than five hectares of land. On average,
86 percent of farming households use hired labor or exchange labor (Kuu labor) to make up
for family labor shortage.
Farming sector is characterized by an extremely limited use of modern inputs.
Approximatively 4 percent of the planted area is irrigated while respectively 5 and 2 percent is
fertilised and pesticided. Meanwhile, 43 percent of farming households purchased seeds for
agriculture, only 4 percent used certified improved varieties suggesting that most of the
purchase seeds are traditional varieties.
The vast majority of farming households do not have access to extension services. Only
3 percent of farming households report having access to extension services.
Farming households have a diversify crop portfolio. While rice and cassava are the top
two food crops grown, fruits and vegetables are grown by a high share of farming households.
On average, 60 percent of households report growing vegetables, 27 percent grew fruits and
33 percent permanent cash crop. The top five cash crops grown are cocoa, sugar can, rubber,
coffee and oil palm.
Rice and cassava productivity is extremely low. The national average yield is 1.26 metric
ton per hectare for rice and 5.68 metric ton per hectare for cassava. The estimated total
production of rice and fresh cassava for 2016 is estimated at 335,179 metric ton and 697,604
metric ton respectively.
There is a fair degree of market orientation. Nearly three out of four farming households
sell a portion of their crop output. This suggests that most farmers engage with the market
and have moved well beyond farming for subsistence only. However the share of the sales
over total production is low (26 percent on average).

6
Most farming households have some livestock with high level of livestock diseases
rates and low vaccination. Nearly 50 percent of farming households report holding animals.
However, the average holding is small (10 heads of animals, all types combined). The level of
reported livestock diseases rates is 31 percent while the vaccination rate is less than 3 percent.
1. The data
This chapter is based primarily on Agriculture recall survey covering all Farming households
included in the 2016 HIES, which provides an opportunity to explore Farming household
performance. Data was collected using household questionnaires in which information was
obtained at the individual, household and plot level. Agricultural production data was collected
at farm and crop level, with detail on the allocation of production and the use of inputs such
as fertilizer, pesticides, hired labor, shared labor and household labor activity.
Data on livestock activities were also collected. Livestock data includes the ownership of a
range of animals, the production and sales of products obtained from the animals. Other data
used come from the crop cut surveys for 2014 and 2015. The linkages between the household
and crop cut surveys are listing in the Table 1 below. The 2014 Crop Cut Survey did not cover
the entire country because of the Ebola crisis. In addition, the 2014 and 2016 HIES are
Enumeration Area-level panel surveys (i.e. the same clusters were used but new households
were selected).
Table 1. Linkages between the household and crop cut surveys
Agricultural Survey Field Dates Linked Household Survey
2014 Crop Cut Survey July – Sept 2014 (southern counties only)
2014 HIES
2015 Crop Cut Survey July – Sept 2015 (southern counties) Oct 2015 – Jan 2016 (rest of country)
2014 HIES
2016 Agricultural Recall Survey
January 2016 – January 2017 2016 HIES
2. Characteristics of farming households
Farming households are households who reported being involved in agriculture activities
through cultivating of land or ownership of livestock. They represent 35 percent of Liberian’

7
households in 2016. Table 2 reports basic summary statistics for some key characteristics of
Farming households. These households consist on average of 5 members.
However, there is some differences across regions in households’ human capital
endowment. Farming households in Liberia’s South Eastern B, Montserrado, South Eastern,
North Central and North Western regions have much higher levels of dependency ratio4 than
households in the South Central region. The household size in per adult equivalent5 range
from 3.29 in North western to 4.14 in South Eastern B
The great majority of farming households in Liberia are male-headed (Table 2). One
fifth of household heads are female. Households in the South East B are larger and more likely
to be headed by a woman. The average age of household heads is 44 years reflecting a relatively
high level of experience in farming. Only a few share of Farming household head is single (7
percent).
On average, farming household heads have completed less than four years of
schooling. The highest level of educational attainment of heads is at the primary school level:
on average, the number of years of schooling of farming households head is under four years.
Table 2. Basic farming household characteristics
Mont-serrado
North Central
North Western
South Central
South Eastern A
South Eastern B
National
mean/sd mean/sd mean/sd mean/sd mean/sd mean/sd mean/sd
Household size 5.26 4.81 4.33 4.50 4.73 5.38 4.76 2.40 2.09 2.01 2.04 2.09 2.37 2.12
Household size in per adult equivalent 4.12 3.66 3.29 3.41 3.62 4.14 3.63
4 The dependency ratio is the number of dependents (household members who are less than 14 or more than 65 years old) per household members of working age (14-65 years olds). 5 The adult equivalent measures used are based the standard FAO adult equivalent scales developed in Guinea in 2004, and are therefore considered more relevant to the West African context (see conversion factors in appendix 1)

8
1.94 1.60 1.49 1.56 1.60 1.87 1.63
Dependency ratio 1.21 1.17 1.15 1.08 1.18 1.20 1.16 1.34 1.00 1.03 0.92 0.97 0.96 1.01
Household head characteristics
Household head age 49.29 43.37 45.83 42.23 45.13 46.84 44.26 14.04 14.69 17.78 13.54 14.20 14.11 15.01
Female headed households 0.15 0.21 0.20 0.17 0.21 0.21 0.20 0.36 0.41 0.40 0.38 0.41 0.41 0.40
Married 0.49 0.52 0.67 0.64 0.64 0.63 0.57 0.51 0.50 0.47 0.48 0.48 0.48 0.49
Living together 0.36 0.26 0.16 0.17 0.16 0.18 0.23 0.49 0.44 0.36 0.38 0.36 0.39 0.42
Separated/Divorced/Widow 0.01 0.15 0.11 0.13 0.15 0.13 0.13 0.12 0.35 0.31 0.34 0.36 0.34 0.34
Never married 0.14 0.07 0.06 0.06 0.05 0.05 0.07 0.35 0.26 0.24 0.24 0.22 0.22 0.26
HH head years of schooling 6.23 3.72 3.33 3.37 4.27 4.36 3.85 4.95 4.53 4.52 4.30 4.45 4.76 4.57
Dwelling characteristics
Flush Toilet 0.22 0.04 0.02 0.06 0.01 0.01 0.04 0.42 0.19 0.15 0.23 0.12 0.12 0.21
Flush toilet owned 0.17 0.02 0.01 0.04 0.00 0.01 0.03 0.38 0.14 0.10 0.19 0.05 0.11 0.16
Flush toilet shared 0.05 0.02 0.01 0.02 0.01 0.00 0.02 0.23 0.14 0.10 0.13 0.11 0.04 0.13
Access to electricity 0.08 0.01 0.04 0.03 0.02 0.04 0.02 0.28 0.12 0.19 0.16 0.12 0.19 0.15
Main Cooking Fuel Biomass (Wood/charcoal)
1.00 1.00 0.98 0.99 1.00 1.00 1.00
0.00 0.03 0.14 0.09 0.03 0.06 0.07
Drinking Water from pipeline 0.14 0.36 0.22 0.20 0.26 0.28 0.30 0.35 0.48 0.41 0.40 0.44 0.45 0.46
Drinking Water from Borehole 0.82 0.34 0.44 0.21 0.34 0.44 0.37 0.39 0.47 0.50 0.41 0.48 0.50 0.48
Drinking Water from river/lake 0.02 0.12 0.28 0.52 0.37 0.26 0.22 0.15 0.33 0.45 0.50 0.48 0.44 0.41
Public garbage collection 0.01 0.00 0.00 0.01 0.01 0.01 0.01 0.11 0.07 0.05 0.09 0.07 0.09 0.07
Average time to walk from the farm to (mn):
Home 10.29 40.37 33.17 24.17 36.83 46.72 35.82 21.61 31.45 26.74 21.90 30.97 37.67 30.89
Main road 12.10 41.28 42.75 46.20 46.36 56.68 41.86 17.32 43.43 57.43 54.53 70.66 67.99 51.24
Market 51.98 106.39 123.01 99.01 128.15 128.51 107.62

9
53.95 90.85 87.03 70.74 111.98 91.24 89.83
Access to infrastructure and basic services is also problematic for many Farming
households. Fewer than five percent of all Farming households report having access to an
internal flush toilet, electricity and public/private garbage collection service. Nearly the totality
of Farming household uses wood, dung or charcoal as main source of cooking energy. On
average, one fourth of all Farming households have access to drinking water through rivers
and lakes. This suggests that access to clean drinking water is a challenge for a relatively high
share of farming households. Nationally, farming households have poor access to road and
market since they take on average 42 minutes to reach the nearest road and 108 minutes to
reach the nearest input and output market.
The accessibility to infrastructure and basic services is much higher in Montserrado than in
the other regions. Close to one fourth of farming households in Montserrado have access to
flush toilet, 8 percent have access to electricity and around 96 percent have access to clean
drinking water through pipeline and borehole. They take on average 12 minutes to reach the
nearest road and 52 minutes to reach the nearest market. Farming households in Montserrado
have better access to infrastructure and basic services than in the other regions probably
because of their proximity to Monrovia, the country capital.
Table in appendix 1 shows that farming households are less favored in term of access to
infrastructure and basic services compared to non-farming households. They appear to be
poorer than non-farming households. The per adult equivalent total household expenditure is
58,742 Liberian Dollars for farming households against 108,859 for non-farming households.
3. Farm Characteristics
There is a prevalence of smallholder farmers in Liberia. Households in Liberia own an
average of 2 farms. The average size of land cultivated per household is 1.6 hectares. The
distribution of land cultivated illustrated in Table 3 and Figure 1 shows the prevalence of
smallholder farmers in the country. Less than three percent of Farming households cultivate
more than five hectares of land; even in the top land quintile, average land cultivation is smaller
than 4 hectares.
Table 3. Average land area (ha) cultivated by quintiles

10
Quintiles of land cultivated Household land area cultivated
Household land area cultivated per
capita
Number of observations6
Mean SD Mean SD
Quintile 1 (Smallest farm) 0.34 0.17 0.11 0.10 826
Quintile 2 0.83 0.13
0.23 0.15 1005
Quintile 3 1.25 0.12
0.34 0.24 809
Quintile 4 1.88 0.25
0.51 0.32 772
Quintile 5 (Largest farm) 3.60 1.07
0.84 0.58 636
Total 1.58 1.23 0.40 0.41 4048
Figure 1. Histogram of area of land cultivated by percentage of households
Female farmers have less access to land compare to their male counterpart. Figure 2
present the kernel density estimates of land cultivated by household head gender and confirm
the gap between male-headed households and female-headed households.
6 The figures in the table are weighted. However, the number of observations reflect the count of farming households in the sample
05
10
Perc
ent
0 2 4 6 8Land cultivated in hectares
Land cultivated in hectares [2016]

11
Figure 2. Area of land cultivated by household head’s gender
Female-headed households cultivate on average 79 percent of the national average of land area
cultivated per household. Since female-headed households account for 20 percent of the
country's Farming households, this translate to women only controlling 16 percent of
cultivated land in Liberia (Figure 3). The share of land cultivated controlled by female decrease
further when considering the land area devote to permanent cash crops.
Figure 3. Land ownership patterns by households head gender
0.2
.4.6
De
nsity
-3 -2 -1 0 1 2log (Land cultivated in hectares)
Male headed household Female headed household
log (Land cultivated in hectares)
Kernel density estimation
Share of household, 20%
80%
Share of land …
84%
Share of land cultivated devote to
cash crops , 11%
89%
Land ownership patterns for Males vs Females
Female-headed households Male-headed Households

12
There is also significant difference across counties in term of land area cultivated as
shown in Table 4. Households in Lofa County appear to have the highest land area cultivated
per household.
Table 4. Land area cultivated by county
Male-headed households
Female-headed
Households
All households
Land cultivated per
capita
County Mean SD Mean SD Mean SD Mean SD
Bomi 1.46 0.92 1.30 0.77 1.43 0.89 0.43 0.36
Bong 1.47 1.14
1.06 0.82
1.39 1.09
0.37 0.41
Grand Bassa 1.39 1.14
1.23 0.88
1.37 1.11
0.38 0.36
Grand Cape Mount 1.83 1.28
1.44 0.89
1.75 1.21
0.49 0.42
Grand Gedeh 1.22 0.93
1.07 0.61
1.18 0.86
0.33 0.36
Grand Kru 1.21 0.86
1.00 0.54
1.16 0.81
0.25 0.21
Lofa 2.42 1.50
1.59 1.13
2.20 1.45
0.53 0.45
Margibi 1.15 1.09
0.75 0.58
1.05 1.00
0.25 0.23
Maryland 1.20 1.04
0.89 0.76
1.14 0.99
0.24 0.23
Montserrado 0.74 0.66
0.71 0.82
0.73 0.67
0.16 0.16
Nimba 2.05 1.40
1.47 0.96
1.94 1.35
0.48 0.48
River Cess 1.39 1.03
0.80 0.64
1.29 1.00
0.33 0.30
Sinoe 1.14 0.75
0.93 0.76
1.09 0.75
0.26 0.23
River Gee 1.26 0.81
1.09 0.61
1.22 0.78
0.29 0.24
Gbarpolu 2.05 1.23
1.63 1.28
1.98 1.25
0.54 0.44
National 1.66 1.29 1.25 0.93 1.58 1.23 0.40 0.41
The Table 4 clearly shows that male-headed households cultivate more area of land than
female-headed households across counties. Inequality in access to land measures by the Gini
coefficient (see Figure 4) shows that Montserrado, Margibi and Grand Gedeh are the counties
where farmland is the most unequally distributed among farming households.

13
Figure 4. Gini coefficient of land area cultivated per capita
BOX 1. Inequality Measure
In term of access to farmland, equality can be defined as an equal distribution land area
cultivated per capita across farming households. This means that each share of household
cultivate the same share of land area per capita. The Lorenz Curve compares graphically the
cumulative share of household with their cumulative share of land area cultivated per capita.
A perfectly equal distribution of land area cultivated is indicated by a diagonal. The other
extreme is complete inequality where one households cultivated all the farmland. These two
(theoretical) extremes define the boundaries for observed inequality.
The Gini coefficient is the most commonly used measure for inequality. A Gini coefficient
of 0 indicates perfect equality while 1 signifies complete inequality. In relation to the Lorenz
Curve, the Gini coefficient measures the area between the Lorenz Curve and the diagonal.
The land tenure system is dominated by community, tribal and family land (Table 5).
Only five percent of cultivated farms are privately owned at national level and less than three
percent of households have a deed to their farmland. The same patterns is observed across
counties. Those figures flag out that land tenure security is potentially a challenge for Liberian
farmers. Tenure security is central to agricultural growth and there is a large body of empirical
literature in Africa showing the positive impact of tenure security on investment and
productivity. Hence, improving land tenure security could be a good policy response to the
underinvestment and low productivity in agriculture in Liberia.
4146 45
4247
40 39
4843
52
4641
38 40 40
46
0
10
20
30
40
50
60
Gin
i co
effi
cien
t (p
erce
nt)
Gini coefficient of land area cultivated per capita

14
Table 5. Land tenure by County Land tenure (% of farms)
County Community land
Tribal land
Distributed by family
Privately owned
Rented Farming as a tenant
Bomi 43% 29% 22% 1% 0% 4%
Bong 29% 17% 40% 7% 4% 3%
Grand Bassa 45% 20% 32% 1% 1% 1%
Grand Cape Mount 48% 17% 33% 2% 0% 1%
Grand Gedeh 34% 21% 35% 6% 1% 2%
Grand Kru 56% 30% 11% 2% 0% 0%
Lofa 40% 34% 22% 2% 0% 1%
Margibi 33% 8% 35% 7% 1% 16%
Maryland 47% 21% 24% 6% 1% 2%
Montserrado 21% 6% 32% 17% 18% 6%
Nimba 26% 10% 55% 7% 1% 1%
River Cess 61% 30% 8% 1% 0% 0%
Sinoe 46% 29% 22% 2% 0% 1%
River Gee 32% 38% 21% 8% 0% 2%
Gbarpolu 40% 44% 14% 1% 0% 1%
National 35% 20% 35% 5% 2% 2%
Compared to male-headed households, female-headed households have less access to
communal land (Figure 5) and the difference is statistically significant at 5 percent level. There
is no statistical difference across gender for the other land tenure arrangements.
Figure 5. Land tenure by household head gender
0%
5%
10%
15%
20%
25%
30%
35%
40%
Communityland
Tribal land Distributed byfamily
Privatelyowned
Rented Farming as atenant
Land tenure by Household head gender(% of farms)
Male-headed households Female-headed households National

15
The share of farms that experience soil erosion in 2016 is 30 percent at national level with
minimal variation across counties. The main cause of soil erosion reported is flooding or rain.
On average, 71 percent of Farming households that experience soil erosion problems reported
that the erosion problem was due to flooding/rain while 31 percent of households reported
animals as main cause of soil erosion.
Figure 6. Cause of soil erosion problems
4. Use of modern inputs
The farming sector in Liberia is characterized by an extremely limited use of modern
inputs. Approximatively 4 percent of the planted area is irrigated while respectively 5 and 2
percent is fertilised and pesticided (Table 6). The average amount of chemical fertilizer used
per hectare is less than 5 kilograms. Female-headed households has a lower level of fertilizer
and pesticide usage compare to their male counterparts in per hectare term. Significant
difference also emerge across gender in term of access to extension services with female-
headed households having lesser access than male-headed households
Among other factors, the low input utilization could prevent farmers from achieving the
greatest possible crop yields.
71%
29%
0%
10%
20%
30%
40%
50%
60%
70%
80%
Flooding/Rain Animals
Cause of soil erosion problems

16
Table 6. Modern inputs utilization and access to extension services
Male-headed
households
Female-headed
households
Total
mean/sd mean/sd mean/sd
Share of area planted that is:
Irrigated 0.033 0.052 0.037
0.210 0.216 0.211
Fertilised 0.051 0.066 0.054
0.267 0.242 0.262
Pesticided 0.024 0.010 0.021
0.220 0.090 0.200
Quantity (kg) of inputs use per ha
Chemical fertilizer 3.403 0.345 2.779
29.977 3.821 26.830
Pesticide 0.701 0.058 0.570
7.299 0.643 6.524
Household has access to extension services 0.036 0.028 0.034
0.185 0.165 0.181
At national level, less than five percent of Farming households have access to
extension services7 (
Table 7). The same patterns is observed across counties. The limited access to extension is
not encouraging to improve the adoption of modern inputs. The provision of extension
7 Of note that the survey only capture accessibility to extensions services without providing information on the type of extension services available.

17
service is an important element contributing to enhance productivity and reduce food
insecurity.
Table 7. Access to extension services by County
County Share of households
Bomi 2.9%
Bong 2.4%
Grand Bassa 0.5%
Grand Cape Mount 1.4%
Grand Gedeh 5.0%
Grand Kru 6.1%
Lofa 6.8%
Margibi 3.4%
Maryland 1.5%
Montserrado 2.1%
Nimba 3.5%
River Cess 0.5%
Sinoe 2.3%
River Gee 7.2%
Gbarpolu 8.9%
National 3.4%
There is a low level of use of improve seeds (Figure 7). While the share of households
purchasing seeds is high (43 percent), the use of improve seeds is very low. Only 4 percent of
farming households reported having used improved seeds during the argricultural season 2016.
This suggests that most of the seeds purchased are traditional. This is consistance with the low
level of access to extension services reported earlier.

18
Figure 7. Use of improved seeds and incidence of purchase seeds
5. Labor utilization
Farming households use a combination of family labor and hired labor. A critical
complement to land in the agricultural production process is labor. On average, more than 80
percent of Farming households report using hired/Kuu labor (
Table 8). Some differences emerge across counties.
The share of households using hired/Kuu labor range from 58 percent in Montserrado to 98
percent in Lofa. In general, hired/Kuu labor is mostly used for land clearing and planting
activities. However, in Lofa County, a high level (in term of share of households) of use of
hired/Kuu labor is observed for all farming activities.
The share of female8 labor in agriculture is nearly 50 percent at national level showing a
high engagement of female in agriculture.
Table 8. Labor utilization
Share of household
s using hired/Kuu
labor
Share of households using hired/Kuu labor for
Share of female
labour in agricultur
e
Counties Clearing
Planting
Farm management
Harvesting
8 The share of female labor in agriculture is define as the ratio of total amount of female labor (in person-days) to the overall amount of labor use (in person-days)
4%
43%
0%
5%
10%
15%
20%
25%
30%
35%
40%
45%
Household uses improved seeds Household purchases seeds
Use of improved seeds
19
Bomi 80% 77% 60% 17% 31% 40%
Bong 86% 83% 72% 38% 66% 50%
Grand Bassa 83% 81% 65% 21% 49% 42%
Grand Cape Mount
87% 83% 68% 45% 55% 39%
Grand Gedeh 86% 79% 69% 24% 61% 46%
Grand Kru 78% 72% 68% 31% 53% 50%
Lofa 98% 93% 89% 66% 91% 47%
Margibi 66% 63% 47% 24% 42% 55%
Maryland 84% 79% 67% 38% 45% 43%
Montserrado 58% 56% 34% 14% 34% 41%
Nimba 93% 90% 78% 43% 66% 43%
River Cess 85% 80% 66% 12% 52% 43%
Sinoe 79% 76% 65% 21% 49% 48%
River Gee 85% 80% 64% 31% 47% 48%
Gbarpolu 91% 85% 74% 18% 76% 49%
National 86% 82% 70% 37% 61% 45%
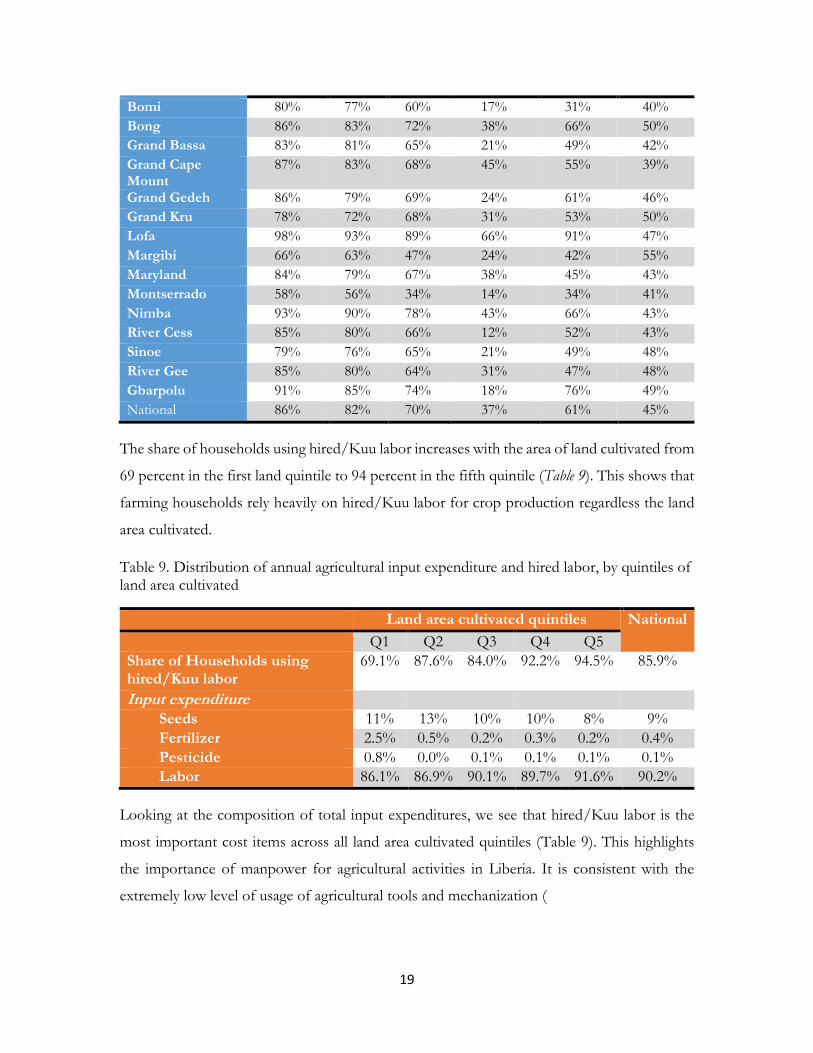
The share of households using hired/Kuu labor increases with the area of land cultivated from
69 percent in the first land quintile to 94 percent in the fifth quintile (Table 9). This shows that
farming households rely heavily on hired/Kuu labor for crop production regardless the land
area cultivated.
Table 9. Distribution of annual agricultural input expenditure and hired labor, by quintiles of land area cultivated
Land area cultivated quintiles National
Q1 Q2 Q3 Q4 Q5
Share of Households using hired/Kuu labor
69.1% 87.6% 84.0% 92.2% 94.5% 85.9%
Input expenditure
Seeds 11% 13% 10% 10% 8% 9%
Fertilizer 2.5% 0.5% 0.2% 0.3% 0.2% 0.4%
Pesticide 0.8% 0.0% 0.1% 0.1% 0.1% 0.1%
Labor 86.1% 86.9% 90.1% 89.7% 91.6% 90.2%
Looking at the composition of total input expenditures, we see that hired/Kuu labor is the
most important cost items across all land area cultivated quintiles (Table 9). This highlights
the importance of manpower for agricultural activities in Liberia. It is consistent with the
extremely low level of usage of agricultural tools and mechanization (

20
Table 10). Most households appear to only own hoes and cutlass. There was less than 1 percent
of households reporting owning tractor even in the top land quintile. The ownership of axe is
relatively high ranging from 42 percent in the first quintile to 78 percent in the fifth quintile
Table 10. Share of households owning agricultural assets, by quintiles of land area cultivated
Land area cultivated quintiles National
Q1 Q2 Q3 Q4 Q5
Hand Hoe 83.0% 84.2% 85.7% 89.9% 91.8% 87.2%
Cutlass 94.7% 95.2% 95.2% 97.7% 99.0% 96.5%
Shovel 32.4% 30.4% 36.6% 35.1% 46.4% 36.8%
Digger 28.6% 26.8% 23.5% 26.8% 32.4% 27.9%
Axe 41.6% 60.3% 58.3% 61.0% 77.7% 60.7%
Rake 17.9% 16.3% 18.4% 15.5% 23.3% 18.6%
Filing / File 50.1% 58.8% 53.7% 57.7% 65.8% 57.6%
Whipper/Wipper 15.0% 5.8% 9.4% 10.4% 11.1% 10.5%
Wheel Barrow 10.5% 6.7% 5.9% 4.6% 8.6% 7.4%

21
Tractor 0.0% 0.1% 0.3% 0.0% 0.0% 0.1%
Saw/Powersaw 0.5% 0.2% 0.6% 1.2% 2.1% 1.0%
Hand-powered Sprayer 1.7% 0.5% 1.4% 0.6% 1.7% 1.2%
Thresher/Sheller 0.0% 0.1% 0.5% 0.0% 0.0% 0.1%
Mill/Grinder 0.8% 0.2% 1.0% 0.1% 0.5% 0.5%
Grater 4.2% 6.9% 2.8% 3.9% 5.4% 4.6%
Watering can/ bucket 19.5% 12.3% 14.1% 12.8% 16.3% 15.2%
Pingalay 10.1% 18.6% 13.5% 12.0% 25.4% 16.3%
Knives 61.9% 76.6% 73.2% 75.0% 80.9% 73.8%
Other 1.0% 1.4% 1.3% 1.0% 2.0% 1.3%
As farm labor demand is time sensitive to the crop cycle,
Table 11 shows agricultural labor used on the household’s cultivated farm for different phases
of the crop cycle: clearing, planting, farm management (weeding, fertilizing, fencing and
caretaking) and harvesting. The table also shows the average number of days that men, women
and under 14 laborers spend on family labor and hired/Kuu labor during the 2016 agricultural
season. Panel A shows hired labor; most of the hired labor occurs during the clearing phase
and at harvest time.
Panel B in
Table 11 shows the number of day household members worked in household agricultural production. The patterns are similar to hired/Kuu labor for land clearing and planting. Overall, males are more engaged in land clearing activities, while female labor is mostly used for planting, managing and harvesting (
Table 11).
Table 11. Agricultural labor
Land area cultivated quintiles
National Q1 Q2 Q3 Q4 Q5
mean/sd mean/sd mean/sd mean/sd mean/sd mean/sd
Panel A: Hired/Kuu labor
Clearing Number of days--Men 18.28 25.63 34.12 40.57 56.52 36.39
47.26 33.29 51.74 58.43 87.24 62.32
Number of days--Women 0.78 1.04 1.41 2.27 1.94 1.53
5.27 5.30 5.72 11.14 7.63 7.48
Planting Number of days--Men 3.47 3.84 9.89 8.37 16.41 8.91
17.51 11.03 34.31 23.01 52.61 33.39

22
Land area cultivated quintiles
National Q1 Q2 Q3 Q4 Q5
mean/sd mean/sd mean/sd mean/sd mean/sd mean/sd
Number of days--Women 8.19 15.12 19.54 25.67 31.71 20.78
16.31 26.17 31.71 39.04 61.03 40.65
Farm management Number of days--Men 1.68 2.65 5.50 4.99 9.54 5.16
7.95 9.78 16.82 16.26 26.81 17.89
Number of days--Women 3.72 6.20 7.51 9.10 15.46 8.82
15.71 32.66 26.47 30.76 83.16 47.69
Harvesting or store preparation Number of days--Men 3.72 6.68 10.22 14.20 21.71 11.98
23.34 33.78 31.53 43.59 70.47 46.21
Number of days--Women 8.03 19.75 23.48 34.03 39.50 25.86
21.35 49.32 50.21 82.69 94.14 68.25
Panel B: Household labor Clearing Number of days--Men 10.31 18.49 23.59 30.62 34.37 24.16
17.58 24.76 32.70 42.43 44.84 36.02
Number of days--Women 5.65 9.45 7.56 8.19 11.47 8.58
11.74 19.76 15.32 17.93 25.27 19.03
Number of days--Under 14 laborers 1.59 2.72 4.81 2.54 4.02 3.17
7.30 11.42 14.15 11.86 15.59 12.60
Planting Number of days--Men 6.92 10.86 12.68 14.65 21.16 13.71
10.00 15.23 20.49 21.18 28.98 21.41
Number of days--Women 11.27 17.25 18.02 21.34 26.46 19.29
12.38 19.47 21.08 25.05 32.42 24.26
Number of days--Under 14 laborers 2.30 3.76 6.17 4.07 8.87 5.24
6.68 10.38 16.33 11.51 19.26 14.14
Farm management Number of days--Men 9.81 16.74 18.16 23.15 30.51 20.30
20.86 28.54 35.28 43.41 62.94 43.14
Number of days--Women 14.15 19.55 20.64 23.84 28.39 21.71
26.18 29.37 31.16 38.21 49.50 37.18
Number of days--Under 14 laborers 4.17 5.94 8.63 5.86 9.59 6.97
21.04 22.20 32.87 27.96 25.57 26.33
Harvesting or store preparation Number of days--Men 11.49 17.69 19.93 27.15 35.70 23.21
18.20 22.95 27.88 40.62 50.07 36.39
Number of days--Women 14.70 21.47 23.02 29.64 34.60 25.28
19.41 23.89 25.12 33.36 43.81 32.17
Number of days--Under 14 laborers 3.93 5.94 8.47 7.75 11.19 7.67
14.02 16.43 24.10 21.23 27.33 21.75

23
Labor inputs by household members who are men are higher on plots controlled by men;
female labor and under 14 household labor are more intensively used on plots controlled by
women (Figure 8)
Figure 8. Labor utilization by household head gender
6. Crop production and sales
6.1 Household crop portfolio
Farming households in Liberia diversify their crop production. During the 2016
agriculture season, Farming households grew on average of 3 different types of crops. In Figure
9, we present the percentage of household reporting growing each type of crop to show the
diversification of household crop portfolio.
Cassava and rice are the main crops grown by Farming households (they account for 74
percent of households’ crop portfolio each). Vegetables growing are also important (60% of
the crop portfolio). The share of households growing corn is 34 percent. Permanent cash
crops are grown by 33 percent of households while only 27 percent of households grow fruits
(Banana, Papaw/Papaya, Pineapple, Plantain etc) and 20 percent grow other tuber or roots
(Eddoes, Ginger, Irish potatoes, Onions, Sweet Potatoes and Yams). These figures vary
51
43
90
71
19
53
54
30
118
37
0 20 40 60 80 100 120 140
Hired/Kuu labor- Men (# pers days/ha)
Hired/Kuu labor- Women (# pers days/ha)
Household labor- Men (# pers days/ha)
Household labor- Women (# pers days/ha)
Household labor- Under 14 laborers (# persdays/ha)
Labor utilization by household head gender
Female-headed households Male-headed households

24
minimally across counties. Some statistical significant gap between male-headed households
and female-headed households emerge in term of incidence of crop cultivation (Appendix 2).
Figure 9. Incidence of crop cultivation by household
The estimated number of farming households growing each type of crop across counties is presented in the presented in the tables below.
1%
17%
20%
27%
33%
34%
60%
74%
74%
0% 10% 20% 30% 40% 50% 60% 70% 80%
Other crops
Legumes / Oil and Nuts
Other tubers / Roots
Fruits
Permanent/cash crops
Corn/Maize
Vegetables
Rice
Cassava
Share of households
incidence of crop cultivation

25
Table 12 shows that banana and plantain growers are concentrated in Nimba, Lofa,
Montserrado and Bong Counies while Montserrado and Bong Counties are home of Papay
growers.
There is a high number of farming households growing vegetables across countie). Only few households reported growing permanent cash crops (Table 14). Coffee is mostly produced in Lofa and Nimba Counties

26
Table 12. Number of farming households engaged in fruits production by county (Top 4 fruits only)
County Total number of
farming households
Banana Papaw/Papaya Pineapple Plantain
Bomi 12 498 640 294 626 891
Bong 53 885 3 583 1 735 3 147 6 790
Grand Bassa 22 294 2 225 28 1 826 4 013
Grand Cape Mount 23 444 1 043 113 1 704 1 686
Grand Gedeh 8 956 1 406 358 914 2 400
Grand Kru 7 725 834 19 470 1 985
Lofa 38 883 6 960 696 2 364 8 632
Margibi 15 668 931 307 436 2 068
Maryland 5 677 800 102 255 1 476
Montserrado 17 061 4 555 5 135 3 020 7 336
Nimba 74 658 9 183 580 4 763 18 888
River Cess 8 491 951 110 701 3 014
Sinoe 9 874 2 044 82 879 3 347
River Gee 5 741 752 21 268 1 326
Gbarpolu 7 459 783 80 1 014 1 872
Total 312 314 36 691 9 659 22 387 65 726

27
Table 13. Number of farming households engaged in vegetable production by county (Top 6 vegetables only)
County Total number of farming households
Bitterballs Cucumber Egg Plant Okra Pepper Pumpkins
Bomi 12 498 4 837 1 837 2 050 3 324 4 787 1 675
Bong 53 885 14 926 7 436 1 579 11 962 21 716 5 927
Grand Bassa 22 294 8 561 2 408 1 175 4 637 8 762 1 208
Cape Mount 23 444 12 027 3 728 8 041 7 197 11 792 2 173
Grand Gedeh 8 956 3 851 419 1 729 2 902 4 684 1 102
Grand Kru 7 725 3 693 1 344 2 480 3 554 4 341 2 202
Lofa 38 883 20 841 9 876 2 737 12 754 25 118 4 394
Margibi 15 668 5 123 616 1 261 4 371 5 546 1 896
Maryland 5 677 2 316 367 1 760 1 720 2 384 835
Montserrado 17 061 7 268 961 942 2 952 4 999 1 535
Nimba 74 658 26 653 8 436 3 882 23 592 31 282 7 615
River Cess 8 491 4 500 1 138 717 3 167 4 619 951
Sinoe 9 874 3 594 1 679 2 202 3 476 4 542 2 083
River Gee 5 741 3 370 660 2 124 2 113 3 255 1 424
Gbarpolu 7 459 4 050 1 417 955 1 604 4 572 977
Total 312 314 125 611 42 321 33 634 89 324 142 400 35 997

28
Table 14. Number of farming households engaged in cash crops production by county
County Total number of
farming households
Cocoa Coffee Oil Palm Rubber Sugar Cane
Bomi 12 498 137 - 307 1 187 204
Bong 53 885 1 304 - 164 8 083 5 265
Grand Bassa 22 294 829 - - 2 631 3 567
Grand Cape Mount 23 444 237 86 1 620 1 744 326
Grand Gedeh 8 956 1 281 39 76 134 18
Grand Kru 7 725 96 - 18 462 125
Lofa 38 883 10 421 10 965 1 485 278 1 170
Margibi 15 668 - - - 1 141 1 598
Maryland 5 677 - - 36 642 999
Montserrado 17 061 363 - 998 - 2 423
Nimba 74 658 17 097 3 151 7 690 21 875 8 660
River Cess 8 491 276 - 132 709 194
Sinoe 9 874 - - 115 101 227
River Gee 5 741 855 - 41 185 175
Gbarpolu 7 459 454 - 38 449 174
Total 312 314 33 350 14 240 12 719 39 620 25 125
The prevailing cropping system is intercropping. An average of 69 percent of the
cultivation is intercropped while only 31 percent is monocropped (Figure 10).
Figure 10. Incidence of intercropping/monocropping
31%
69%
-10%
0%
10%
20%
30%
40%
50%
60%
70%
Share of cultivation monocropped Share of cultivation intercropped
Incidence of intercropping/monocropping
29
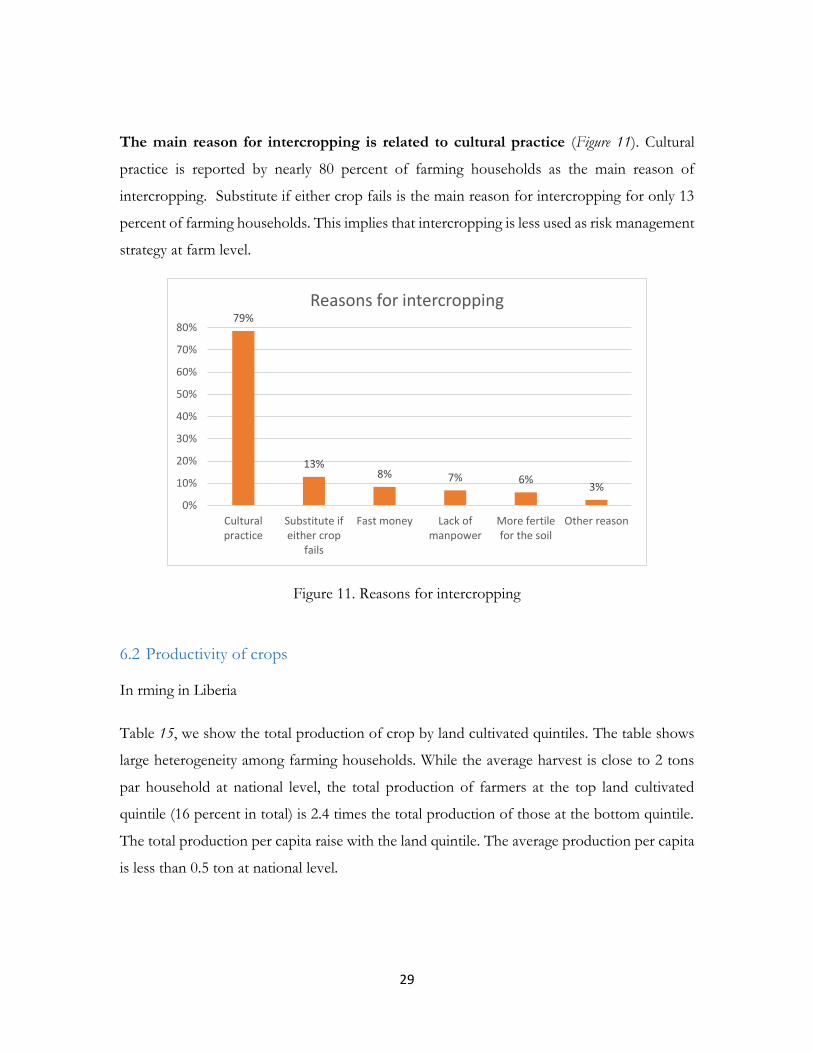
The main reason for intercropping is related to cultural practice (Figure 11). Cultural
practice is reported by nearly 80 percent of farming households as the main reason of
intercropping. Substitute if either crop fails is the main reason for intercropping for only 13
percent of farming households. This implies that intercropping is less used as risk management
strategy at farm level.
Figure 11. Reasons for intercropping
6.2 Productivity of crops
In rming in Liberia
Table 15, we show the total production of crop by land cultivated quintiles. The table shows
large heterogeneity among farming households. While the average harvest is close to 2 tons
par household at national level, the total production of farmers at the top land cultivated
quintile (16 percent in total) is 2.4 times the total production of those at the bottom quintile.
The total production per capita raise with the land quintile. The average production per capita
is less than 0.5 ton at national level.
79%
13%8% 7% 6%
3%
0%
10%
20%
30%
40%
50%
60%
70%
80%
Culturalpractice
Substitute ifeither crop
fails
Fast money Lack ofmanpower
More fertilefor the soil
Other reason
Reasons for intercropping

30
The total production per hectare decreases with the land cultivated quintile. This is consistent
with the inverse relationship between yield and farm size in developing countries found in the
literature. The low level of output reported by farming households in 2016 denote the
prevalence of subsistence farming in Liberia
Table 15. Total production of crop by land cultivated quintiles
Land area cultivated quintiles National
Q1 Q2 Q3 Q4 Q5
mean/sd mean/sd mean/sd mean/sd mean/sd mean/sd
Total production (kg)-all crops
758 1368 1721 2066 3247 1829
857 1491 2851 2333 4123 2711
Total production per ha 1225 776 2903 512 451 1172 1784 1198 2753 727 749 1236
Total production in kg per capita
239 357 448 523 698 452
345 468 763 615 987 690
As shown in the section above, rice and cassava are the most cultivated crops throughout the country. The estimates of production of rice and cassava are shown in
Table 16 and Table 17 below. Of note that the figures in those tables are based on farmer
estimate. The average yield of rice is 1.26 Metric Ton (MT) per hectare at national level and
cassava yield is estimated at 5.28 Metric ton per hectare.

31
Table 16. Estimated production of rice (based on famer estimate)
County Number of farming
households
Average area per
household (Ha)
Average yield /
ha (MT)
Average yield/
household (MT)
Total Production
(MT)
Bomi 12 498 0.85 1.26 1.07 13 413
Bong 53 885 0.85 1.26 1.07 57 830
Grand Bassa 22 294 0.85 1.26 1.07 23 926
Grand Cape Mount 23 444 0.85 1.26 1.07 25 160
Grand Gedeh 8 956 0.85 1.26 1.07 9 612
Grand Kru 7 725 0.85 1.26 1.07 8 291
Lofa 38 883 0.85 1.26 1.07 41 730
Margibi 15 668 0.85 1.26 1.07 16 815
Maryland 5 677 0.85 1.26 1.07 6 093
Montserrado 17 061 0.85 1.26 1.07 18 310
Nimba 74 658 0.85 1.26 1.07 80 124
River Cess 8 491 0.85 1.26 1.07 9 113
Sinoe 9 874 0.85 1.26 1.07 10 597
River Gee 5 741 0.85 1.26 1.07 6 161
Gbarpolu 7 459 0.85 1.26 1.07 8 005
Total 312 314
335 179
Source: HIES, 2016
Table 17. Estimated production of cassava (based on farmer estimate)
County Number of farming
households
Average area per
household (Ha)
Average yield /
ha (MT)
Average yield/
household (MT)
Production (MT)
Bomi 12 498 0.39 5.68 2.23 27 916
Bong 53 885 0.39 5.68 2.23 120 361
Grand Bassa 22 294 0.39 5.68 2.23 49 797
Grand Cape Mount 23 444 0.39 5.68 2.23 52 366
Grand Gedeh 8 956 0.39 5.68 2.23 20 005
Grand Kru 7 725 0.39 5.68 2.23 17 255
Lofa 38 883 0.39 5.68 2.23 86 852
Margibi 15 668 0.39 5.68 2.23 34 997
Maryland 5 677 0.39 5.68 2.23 12 681
Montserrado 17 061 0.39 5.68 2.23 38 109

32
Nimba 74 658 0.39 5.68 2.23 166 761
River Cess 8 491 0.39 5.68 2.23 18 966
Sinoe 9 874 0.39 5.68 2.23 22 055
River Gee 5 741 0.39 5.68 2.23 12 823
Gbarpolu 7 459 0.39 5.68 2.23 16 661
Total 312 314
697 604
Source: HIES, 2016
While the yields per hectare varies among counties, the national average has been used to
estimate the total production to be consistent with FOA methodology. The estimated total
production of rice and fresh cassava for 2016 is estimated at 335,179 MT and 697,604 MT
respectively.
6.3 Gender gap in rice productivity
In order to explore the gender gap in rice productivity, we estimate a production function at
household level using the equation below:
ln 𝑌𝑖 = 𝛼0 + 𝛼1𝐺𝑒𝑛𝑑𝑒𝑟𝑖 + 𝛼2𝐻𝑖 + 𝛽𝑃𝑖 + 𝛾𝐿𝑖 + 𝛿𝑤𝑖 + 휀
Where 𝑌𝑖 is the ith household rice yield in kilogram per hectare, 𝐺𝑒𝑛𝑑𝑒𝑟𝑖 is a dummy variable for the sex or
for the sex or gender of the household head, 𝐻𝑖 is the household head characteristics (age, year of schooling,
year of schooling, access to extension services dummy), 𝑃𝑖 is a vector of land, capital, and other conventional
other conventional inputs, 𝐿𝑖 is labour input (hired/Kuu or family), 𝑤𝑖 is a vector of household
household characteristics and 휀 is the error term. The analysis presented here has been done at household level. at household level. The results of the regression are presented in
Table 18. The independent variables include in the regression are selected based on the empirical literature. The rational behind the inclusion of each of the independent variable can be found in Aguilar et al. (2015), Karamba and Winter (2015) and Slavchevska (2015). The

33
Table 18 shows that households head age and access to agricultural implement display a
positive effect on rice productivity. As usually found in the literature, land area cultivated has
a negative effect on rice productivity.
Table 18. Regression Results on Gender Differences in rice Productivity
(1) (2) Log [Rice yield
kg/ha] Log [Rice yield
kg/ha]
Female headed households -0.133* -0.213*** (0.0742) (0.0795) Household head Characteristics Household head age 0.00351* (0.00188) HH head years of schooling -0.00310 (0.00657) HH has access to extension services 0.160 (0.147) Land Tenancy

34
(1) (2) Log [Rice yield
kg/ha] Log [Rice yield
kg/ha] Log [HA]- total size -0.476*** (0.0583) Number of farms per HH 0.252*** (0.0372) Privately owned 0.130 (0.146) Rented 0.335 (0.265) Farming as a tenant -0.0497 (0.230) Farm Characteristics Share of cultivation intercropped -0.0336 (0.0876) Time to walk from the farm to HOME 0.000120 (0.000914) Time to walk from the farm to MAIN ROAD -0.000310 (0.000478) Time to walk from the farm to MARKET 0.000367 (0.000301) Household's Agricultural Non-Labor Input Use
Farms use (% of Total) Irrigation -0.134 (0.185)
Organic fertilizer 0.683*** (0.211)
Chemical fertilizer -0.0723 (0.568)
Pesticide 0.104 (0.350) Household Uses improved seeds -0.0735 (0.163) Quantity of chemical fertilzer per ha (kgs/Ha) 0.0163 (0.0131) Agricultural Implement Access Index 0.106*** (0.0383) Household's Agricultural Labor Input Use Household labor- Men (# pers days/ha) -0.000746* (0.000400) Household labor- Women (# pers days/ha) 0.000276 (0.000396) Household labor- Under 14 laborers (# pers days/ha)
0.0000963
(0.000627) Hired/Kuu labor per ha (# pers days) 0.000555***

35
(1) (2) Log [Rice yield
kg/ha] Log [Rice yield
kg/ha] (0.000153) Household Characteristics Log [Consumption (LD)] 0.105 (0.0675) Household size -0.0284 (0.0178) Dependency ratio -0.0427 (0.0351) HH sold more than half of production -0.431*** (0.0987) Shocks HH reported pre-harvest loss 0.152* (0.0857) Constant 6.178*** 4.776*** (0.0772) (0.760) County fixed effect Yes Yes Observations 3029 2831
Note: Standard errors are in parentheses. The superscripts ***, **, and * denote statistical significance at the 1%,
5%, and 10% levels.
The gender productivity gap measures are derived from the regression above (Figure 12). The
unconditional gap is derived from model (1) whereas the conditional gap is derived from
model (2). The unconditional gap constitute the difference in the rice productivity measured
in kg per hectare between male-headed households and female-headed households. However,
this unconditional gender gap does not take into account the fact that, on average, female-
headed households work on smaller plots than male-headed households. Also other factors
affect productivity that we control for in the conditional gap estimate. As shown in Figure 12,
the unconditional gap is 12 percent. As expected, the conditional gap is higher, 19 percent on
average. The differences are statistically significant. This suggests that on average, rice farm
households headed by females are 19 percent less productive than their males counterparts.

36
Figure 12. Gender gap in rice productivity
6.4 Effects of the Ebola crisis on rice farming
In this section, we analyse the effect of the Ebola crisis in rice farming. Figure 13 shows the
effect of the Ebola crisis on each farming activity. The main effect is that 52 percent of farming
households did not make rice farm during the Ebola crisis. Of the 48 percent of farming
households that made rice farm, 24 percent reported that the Ebola crisis affected land clearing
and planting. Only 2 percent of those who made rice farming did apply fertilizer during the
Ebola crisis. This figure is close to normal situation (see section 3) and so, there is no evidence
that the Ebola crisis affected fertilizer application. Around 3 percent of farming household
that made rice farm during the Ebola crisis did not harvest any portion of their rice. On
average, 17 percent of farming households harvested their rice later than usual due to the
Ebola crisis.
12
19
0
5
10
15
20
25
Unconditional gap Conditional gap
Pro
du
ctiv
ity
gap
(%
)
Gender gap in rice productivity

37
Figure 13. Effects of the Ebola crisis on rice farming activities
Of the 52 percent of farming households that did not make rice farm during the Ebola crisis,
47 percent reported that they were doing other activities (Figure 14).
Figure 14. Reasons for not making rice farm during the Ebola crisis
48%
24%
24%
2%
97%
95%
17%
52%
76%
76%
98%
3%
5%
83%
M A D E R I C E F A R M I N G
E B O L A A F F E C T E D L A N D C L E A R I N G
E B O L A A F F E C T E D L A N D P L A N T I N G
A P P L I E D F E R T I L I Z E R D U R I N G T H E E B O L A C R I S I S
H A R V E S T E D A T L E A S T A P O R T I O N O F T H E R I C E P L A N T E D
H A R V E S T E D A L L T H E R I C E P L A N T E D
H A R V E S T E D L A T E R T H A N U S U A L
EFFECTS OF THE EBOLA CRISIS ON RICE FARMING ACTIVITIES
Yes No
3%
5%
7%
10%
10%
18%
47%
0% 5% 10% 15% 20% 25% 30% 35% 40% 45% 50%
OTHER SICKNESS/DEATH IN HH
MOVED TO A NEW LOCAITON
OTHER SPECIFY
NOT ENOUGH LABOUR
LAND NOT AVAILABLE
EBOLA SICKESS IN COMMUNITY
DOING OTHER ACTIVITIES
Share of households
Reasons for not making rice farm during the ebola crisis

38
For 18 percent of farming households, Ebola sickness in community was the reason that
prevented them from making rice farm. The availability of land and labor were the reasons for
not making rice farm for 10 percent of farming households
As show in Figure 15, farming households reported that the Ebola crisis affected land clearing
mainly because they could not clear as much land due to the Ebola (78 percent). For 14 percent
of farming households, the land clearing took much longer due to the Ebola crisis potentially
because of the unavailability of kuu labor.
Figure 15. Effects of the Ebola crisis on land clearing activities on rice farms
Nearly two third of farming households that made rice farm planted less area than usual due
to the Ebola crisis (Figure 16). On average 35 percent of them planted later than usual. Close
to 30 percent of farming households reported that, the Ebola has affected their crop
diversification (planted fewer crops).
2%
6%
14%
78%
0% 10% 20% 30% 40% 50% 60% 70% 80%
OTHER
BOTH
TOOK MUCH LONGER
COULD NOT CLEAR AS MUCH LAND
Share of households
Effects of the ebola crisis on land clearing activities on rice farms

39
Figure 16. Effects of the Ebola crisis on the planting on rice farms
The main reason why most farming household did not apply chemical fertilizer during the
Ebola crisis is that it is not necessary (Figure 17). This reinforce our claim that the Ebola crisis
did not have much impact on fertilizer application. Only 22 percent of farming households
did not apply chemical fertilizer on rice farms because it was not available. For 7 percent of
farming households, they did not apply chemical fertilizer on their rice farms because it was
too expensive.
Figure 17. Effects of the Ebola crisis on chemical fertilizer application on rice farms
1%
2%
6%
15%
29%
35%
60%
0% 10% 20% 30% 40% 50% 60% 70%
OTHER
SEEDS COST MORE
DID NOT PLANT AT ALL
DOING OTHER ACTIVITIES
PLANTED FEWER CROPS
PLANTED LATER THAN USUAL
PLANTED LESS AREA
Share of households
Effects of the Ebola crisis on the planting on rice farms
1%
7%
22%
70%
0% 10% 20% 30% 40% 50% 60% 70% 80%
OTHER
TOO EXPENSIVE
NOT AVAILABLE
NOT NECESSARY
Share of households
Reasons for not applying chemical fertilizer on rice farms during the Ebola crisis

40
The Ebola crisis has also some effects on rice harvesting activity. In fact, one third of farming
households that made rice farm during the Ebola crisis did not harvest all the rice planted
because labor was not available (Figure 18). Ebola sickness in community was the main reason
for not harvesting all the rice planted for half of the farming households that make rice farm.
The labor price was also a challenge for 18 percent of them.
Figure 18. Effects of the Ebola crisis on rice harvesting
Close to three fourth of farming household that made rice farm reported that they harvested
later than usual du the unavailability of labor du to the Ebola crisis (Figure 19).
Figure 19. Effects of the Ebola crisis on the timing of rice harvesting
1%
3%
7%
8%
10%
18%
22%
50%
65%
0% 10% 20% 30% 40% 50% 60% 70%
DROUGHT
FLOODING
OTHER
RAINS WERE LATE
OTHER SICKNESS/DEATH IN HH
LABOUR TOO EXPENSIVE
INSECTS/PESTS
EBOLA SICKNESS IN COMMUNITY
LABOUR NOT AVAILABLE
Reasons for not harvesting all of the rice planted
Did not harvest all the rice planted
6%
13%
20%
50%
52%
70%
0% 10% 20% 30% 40% 50% 60% 70% 80%
OTHER SICKNESS/DEATH IN HH
OTHER
LABOUR TOO EXPENSIVE
EBOLA SICKNESS IN COMMUNITY
HARVEST CAME LATE
LABOUR NOT AVAILABLE
Reasons for harvesting later than usual

41
The harvest came late for 52 percent of farming households potentially because the Ebola
crisis has delay their planting.
Looking at the reason for not selling crops output in the Figure 20 below, the Ebola crisis
seems to have limited impact on the sales of crops. The vast majority of farming household
did not sell crop output during the Ebola crisis because they either wanted to have more food
in store or did not harvest enough to sell. Less than one third of farming households reported
that they did not sell crop output because it is too risky to go to market and 10 percent reported
that the market was closed.
Figure 20. Reasons for not selling crops output during the Ebola crisis
4%
4%
4%
10%
30%
58%
73%
1%
2%
4%
8%
32%
61%
88%
0% 10% 20% 30% 40% 50% 60% 70% 80% 90%
OTHER
TRANSPORTATION NOT AVAILABLE
TRANSPORTATION TOO EXPENSIVE
MARKET WAS CLOSED
TOO RISKY TO GO TO MARKET
DID NOT HARVEST ENOUGH TO SELL
WANTED TO HAVE MORE FOOD IN STORAGE
Reasons for not selling crops output during the ebola crisis
Rice Other crops

42
6.5 Crop commercialization
Rice and cassava production is mainly for home consumption for the vast majority of
Farming households. Only 12 percent of rice growers and 37 percent of cassava growers
report selling a portion of their harvest (Figure 21). This is close to the incidence of sales of
crops during the Ebola crisis report in Figure 22.
Figure 21. Incidence of sales of crops
Figure 22. Incidence of sales of crops during the Ebola crisis
12%
37%
39%
45%
55%
55%
59%
64%
71%
0% 10% 20% 30% 40% 50% 60% 70% 80%
Rice/Paddy
Cassava
Other crops
Other tubers / Roots
Permanent/cash crops
Legumes / Oil and Nuts
Fruits
Corn/Maize
Vegetables
Share of households
Incidence of sales of crops
12%
41%
88%
59%
0%
10%
20%
30%
40%
50%
60%
70%
80%
90%
100%
Sold rice from the farm Sold other crops from the farm
Incidence of sales of crops during the Ebola crisis
Yes No

43
The breakdown of the incidence of sales of rice and cassava by county is presented in Table 19
below. Gbapolu and Lofa counties have a relatively higher share of households reporting
selling a portion of their rice production (33 and 26 percent respectively). More than half of
farming households in Bomi, Grand Gedeh and Lofa counties reported selling a portion of
their cassava production.
Table 19. Incidence of sales of rice and cassava by county
Incidence of sales of crops (share of households)
County Rice Cassava
Bomi 10% 56%
Bong 9% 39%
Grand Bassa 7% 49%
Grand Cape Mount 3% 25%
Grand Gedeh 19% 54%
Grand Kru 10% 39%
Lofa 26% 52%
Margibi 5% 29%
Maryland 6% 46%
Montserrado 0% 35%
Nimba 10% 27%
River Cess 9% 43%
Sinoe 17% 44%
River Gee 10% 48%
Gbarpolu 33% 45%
National 12% 37%
Agriculture sector in Liberia is characterized by a fair level of commercialization9.
Nearly three in four farming households sold a portion of their harvested crops (Figure 23)
while an average of 27 percent of farming households are fully subsistence oriented. Only one
9 To analysis the degree of Farming households’ engagement with the market, we measure the relative portion
of agriculture production effectively sold on the market. This indicator known as household commercialization index was introduced by Strasberg et al (1999) and Govereth et al (1999) and seemed to be one of the most objectives to measure the intensity of household engagement with the market. Household commercialization index (HCI) is defined as the ratio of gross value of crop sales and gross value of all crop production. HCI = [
𝐺𝑟𝑜𝑠𝑠 𝑣𝑎𝑙𝑢𝑒 𝑜𝑓 𝑐𝑟𝑜𝑝 𝑠𝑎𝑙𝑒𝑠 (𝑖𝑛 𝐿𝐷)
𝐺𝑟𝑜𝑠𝑠 𝑣𝑎𝑙𝑢𝑒 𝑜𝑓 𝑎𝑙𝑙 𝑐𝑟𝑜𝑝 𝑝𝑟𝑜𝑑𝑢𝑐𝑡𝑖𝑜𝑛 (𝑖𝑛 𝐿𝐷)] x 100. The index measures the extent to which household crop production
is oriented toward the market. A value of zero would signify a totally subsistence oriented household and the closer the index is to 100, the higher the degree of commercialization.

44
fourth of households sold more than 50 percent of their production and the national average
share of sales over total production (all crops combined) is 26 percent. The share of sales over
total production varies minimally across counties (Table 20).
Figure 23. Household engagement with the market
The share of crop output sold raise with the land area cultivated only between 4 and 6
hectares (Figure 24). This suggests that there is no linear relationship between land area
cultivated and the level of household’s engagement in the market.
26%
20%
27%
0%
5%
10%
15%
20%
25%
30%
Share of sales over totalproduction
Household sold more thanhalf of production
Non sellers (Subsistenceoriented)
Household engagement with the market20
30
40
50
Sha
re o
f sa
les o
ver
tota
l p
rod
uctio
n
0 2 4 6 8Land cultivated in hectares
95% CI lpoly smooth
kernel = epanechnikov, degree = 0, bandwidth = .48, pwidth = .73
Local polynomial smooth

45
Figure 24. Local linear non-parametric regression of crop commercialization on land cultivated area

46
Table 20. Share of sales of crop over total production
County Rice/ Paddy
Corn/ Maize Cassava
Other tubers / Roots
Legumes / Oil and Nuts Fruits Vegetables
Permanent cash crops Total
Bomi 5% 48% 46% 29% 24% 42% 45% 37% 37%
Bong 3% 46% 28% 20% 26% 64% 52% 66% 28%
Grand Bassa 1% 47% 34% 48% 74% 67% 52% 35% 24%
Grand Cape Mount 1% 46% 23% 20% 29% 38% 42% 29% 19%
Grand Gedeh 7% 52% 39% 39% 26% 42% 48% 88% 20%
Grand Kru 2% 42% 31% 26% 70% 47% 41% 69% 18%
Lofa 7% 40% 41% 35% 48% 55% 44% 88% 28%
Margibi 1% 49% 24% 12% 47% 45% 38% 39% 22%
Maryland 1% 28% 32% 34% 3% 47% 32% 21% 21%
Montserrado 0% 57% 29% 31% 48% 43% 51% 16% 39%
Nimba 3% 32% 24% 42% 42% 62% 45% 74% 26%
River Cess 2% 42% 25% 43% 43% 58% 46% 58% 20%
Sinoe 4% 41% 28% 35% 37% 47% 45% 42% 23%
River Gee 4% 42% 36% 27% 19% 50% 36% 79% 18%
Gbarpolu 9% 40% 32% 40% 30% 41% 47% 83% 23%
National 4% 42% 29% 33% 41% 54% 46% 67% 26%

47
7. Livestock
7.1 Livestock participation and ownership
Agricultural sector in Liberia is characterized by high participation in livestock
activity. Nearly 50 percent of Farming households reported participating in livestock activity
(Table 21). The participation rate raise with household wealth from 41 percent for the poorest
households (first quintile) to 49 percent for the richest households (fifth quintile). We
observed that the poor keep mainly poultry and relatively wealthier households keep more
small and large ruminants.
Table 21. Livestock participation by wealth quintiles
Per capita expenditure quintiles- Farming households
Q1(Poorest) Q2 Q3 Q4 Q5 (Richest) Total
Percentage of households with animal holdings
40.6% 41.9% 46.3% 44.2% 48.5% 44.3%
Household owning (Livestock keepers only)
Cattle 0.4% 0.4% 0.4% 1.0% 0.5% 0.5%
Calf 0.0% 0.1% 0.0% 0.4% 0.1% 0.1%
Sheep/Goats 24.9% 29.6% 30.2% 27.1% 32.2% 28.9%
Goats 20.9% 23.1% 22.9% 21.3% 21.5% 22.0%
Sheep 7.6% 11.4% 9.9% 8.2% 15.3% 10.6%
Pigs 3.9% 3.3% 6.6% 7.3% 4.0% 5.1%
Poultry 89.8% 90.5% 87.0% 90.8% 88.0% 89.2%
Chickens 86.0% 89.9% 86.2% 89.6% 85.5% 87.4%
Ducks 9.8% 9.1% 6.3% 9.8% 13.1% 9.7%
Guinea fowls 0.0% 0.0% 0.0% 1.7% 0.0% 0.4%
Other animals 0.2% 0.0% 0.0% 0.1% 0.5% 0.2%
Female-headed households have lower level of participation in livestock activity than male-
headed households (Table 22). When considering livestock keepers only, it clearly appear that
female-headed households participle less in sheep and goat rearing than their male counterpart.
However, the level of participation in poultry rearing is higher for female-headed households
than male-headed household. This is consistent with the figures in the previous table given
the fact that female-headed households are in general poorer than male-headed households.
Table 22. Livestock participation by household head gender

48
Male-headed households
Female-headed households
T-test
Percentage of households with animal holdings
45.8% 38.3% **
Household owning (Livestock keepers only)
Cattle 0.6% 0.4%
Calf 0.1% 0.1%
Sheep/Goats 30.2% 22.8% ***
Goats 22.6% 18.8% ***
Sheep 11.3% 7.2%
Pigs 4.9% 5.9%
Poultry 88.5% 92.4% *
Chickens 86.5% 91.6% **
Ducks 10.1% 7.7%
Guinea fowls 0.4% 0.0%
Other animals 0.2% 0.0%
Note: Asterisks denote significant differences based on t-tests across Male and female-headed household as follows: *
significant at 10%; ** significant at 5%; *** significant at 1%.
Herd composition in terms of animal headcounts is analyzed in
Table 23, overall and across Farming household wealth quintiles. The importance of smaller
ruminants such as sheep and Goats and poultry is observed across wealth quintiles.
There is a positive correlation between ownership levels and wealth. However, the
relationship is not linear for poultry and poorer household have comparative level of
ownership to wealthier household. The correlation is somehow linear for Sheep and Goat.

49
Table 23. Livestock headcounts by wealth quintiles (averages for Livestock keepers only)
Per capita expenditure quintiles- Farming households
Q1(Poorest)
Q2 Q3 Q4 Q5 (Richest)
Total
mean/sd mean/sd
mean/sd
mean/sd
mean/sd mean/sd
Livestock--Total count
9.11 10.82 10.36 10.34 10.08 10.15
8.51 10.24 10.37 11.35 9.97 10.15
Cattle--Count 0.01 0.01 0.03 0.02 0.01 0.02
0.11 0.15 0.56 0.24 0.19 0.30
Calf--Count 0.00 0.00 0.00 0.01 0.00 0.00
0.02 0.08 0.00 0.11 0.05 0.06
Sheep/Goats--Count 0.71 1.16 0.97 1.07 1.28 1.04
1.67 2.73 1.88 2.31 2.98 2.39
Pigs--Count 0.18 0.23 0.45 0.34 0.13 0.27
1.34 1.51 2.36 1.90 0.88 1.68
Poultry--Count 8.21 9.42 8.92 8.89 8.59 8.81
8.55 9.93 10.15 10.51 9.37 9.73
In term of livestock headcounts, the only statistical significant difference across gender that is
observed is for sheep and goats (Table 24). This means that even if female-headed households
have higher participation in poultry rearing, they own on average similar amount as male-
headed households do.
Table 24. Livestock headcounts by household head gender (averages for Livestock keepers only)

50
Male-headed households
Female-headed households
T-test
Mean SD Mean SD
Livestock--Total count 10,23 10,62 9,83 7,57
Cattle--Count 0,02 0,31
0,01 0,27
Calf--Count 0,00 0,07
0,00 0,04
Sheep/Goats--Count 1,07 2,33
0,91 2,64 ***
Pigs--Count 0,29 1,82
0,16 0,72
Poultry--Count 8,83 10,18 8,74 7,35
Note: Asterisks denote significant differences based on t-tests across Male and female-headed household as follows: *
significant at 10%; ** significant at 5%; *** significant at 1%.
7.2 Disease rates and vaccination
Table 25 reports the share of households reporting illness and the share reporting vaccination,
among livestock keepers. The reported rates of disease are at an average of 31 percent overall,
ranging from 18 percent among the third quintile to 38 percent among the first quintile of per
capita expenditure. The vaccination rate is less than 3 percent on average with the second
quintile reporting the highest vaccination rate (5 percent).
Table 25. Disease rates and vaccination by wealth quintiles
Per capita expenditure quintiles- Farming households
Q1(Poorest) Q2 Q3 Q4 Q5 (Richest) Total
Any disease reported for livestock owned
38.1% 34.0% 18.3% 27.2% 32.1% 31.2%
Any vaccination reported for livestock owned
0.3% 4.6% 0.0% 3.4% 2.8% 2.3%
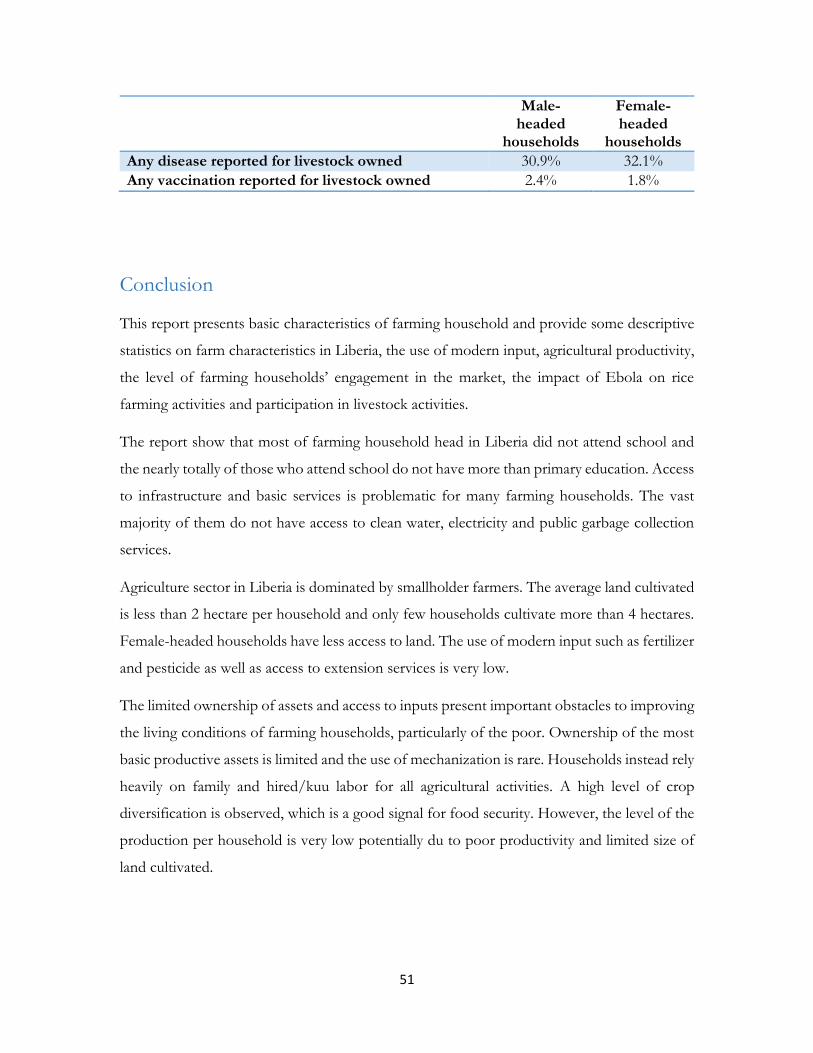
No statistical significant differences were found across gender for the incidence of livestock
disease and vaccination (Table 26).
Table 26. Disease rates and vaccination by household head gender
51
Male-headed
households
Female-headed
households
Any disease reported for livestock owned 30.9% 32.1%
Any vaccination reported for livestock owned 2.4% 1.8%
Conclusion
This report presents basic characteristics of farming household and provide some descriptive
statistics on farm characteristics in Liberia, the use of modern input, agricultural productivity,
the level of farming households’ engagement in the market, the impact of Ebola on rice
farming activities and participation in livestock activities.
The report show that most of farming household head in Liberia did not attend school and
the nearly totally of those who attend school do not have more than primary education. Access
to infrastructure and basic services is problematic for many farming households. The vast
majority of them do not have access to clean water, electricity and public garbage collection
services.
Agriculture sector in Liberia is dominated by smallholder farmers. The average land cultivated
is less than 2 hectare per household and only few households cultivate more than 4 hectares.
Female-headed households have less access to land. The use of modern input such as fertilizer
and pesticide as well as access to extension services is very low.
The limited ownership of assets and access to inputs present important obstacles to improving
the living conditions of farming households, particularly of the poor. Ownership of the most
basic productive assets is limited and the use of mechanization is rare. Households instead rely
heavily on family and hired/kuu labor for all agricultural activities. A high level of crop
diversification is observed, which is a good signal for food security. However, the level of the
production per household is very low potentially du to poor productivity and limited size of
land cultivated.

52
References
Aguilar, A., Carranza, E., Goldstein, M., Kilic, T. and Oseni, G. (2015). Decomposition of
gender differentials in agricultural productivity in Ethiopia. Agricultural Economics, 46, 311–334
Christiaensen, Luc, Lionel Demery, and Jesper Kuhl. 2011. “The (Evolving) Role of
Agriculture in Poverty Reduction: An Empirical Perspective.” Journal of Development Economics
96 (2): 239–254.
Filmer, D., & Pritchett, L. H. (2001). Estimating wealth effects without expenditure Data—
Or tears: An application to educational enrollments in states of India. Demography, 38(1), 115-
132
Karamba, R.W. and Winters, P.C. (2015). Gender and agricultural productivity: implications
of the Farm Input Subsidy Program in Malawi. Agricultural Economics, 46, 357–374
Loayza, Norman V., and Claudio Raddatz. 2010. “The Composition of Growth Matters for
Poverty Alleviation.” Journal of Development Economics 93 (1): 137–51. Elsevier B.V.
Pingali P, Khwaja Y and Meijer M. (2005). Commercializing small farmers: Reducing transaction costs.
FAO/ESA Working Paper No. 05-08. FAO (Food and Agriculture Organization of the
United Nations), Rome, Italy
Rao, N.P., Geleta, D. ,& Suryanarayana, N.(2015). An economic inquiry into
commercialization of small holder agriculture: the case umbullo watershed. International journal
of multidisciplinary educational research, Volume 4, Issue 4(1)
Slavchevska, V. (2015). Gender differences in agricultural productivity: the case of Tanzania.
Agricultural Economics, 46, 335–355
Straberg P.J, Jayne T.S, Yamano T., Nyoro J., Karanja D. and Strauss (1999). Effect of
agriculture commercialization on Food crop input use and productivity in Kenya. MSU
international Development Working paper No 71.

53
Appendix
Appendix 1. Basic household characteristic by farming and non-farming households
Farming
Households
Non-farming
households National T-test
mean/sd mean/sd mean/sd
Household size 4.76 4.01 4.27 ***
2.12 2.36 2.31 Household size in per adult equivalent 3.63 3.13 3.30 ***
1.63 1.85 1.79 Dependency ratio 1.16 0.86 0.96 ***
1.01 0.93 0.97 Household head characteristics
Household head age 44.26 39.85 41.38 ***
15.01 13.49 14.19 Female headed households 0.20 0.33 0.28 ***
0.40 0.47 0.45 Married 0.57 0.36 0.43 ***
0.49 0.48 0.50 Living together 0.23 0.27 0.25 ***
0.42 0.44 0.43 Separated/Divorced/Widow 0.13 0.16 0.15 ***
0.34 0.36 0.36 Never married 0.07 0.22 0.17 ***
0.26 0.41 0.37 HH head years of schooling 3.85 6.49 5.57 ***
4.57 5.73 5.50 Dwelling characteristics
Flush Toilet 0.04 0.40 0.28 ***
0.21 0.49 0.45 Flush toilet owned 0.03 0.20 0.14 ***
0.16 0.40 0.34 Flush toilet shared 0.02 0.21 0.14 ***
0.13 0.40 0.35 HH has acces to electricity 0.02 0.29 0.20 ***
0.15 0.45 0.40 Main Cooking Fuel Biomass (Wood/charcoal) 1.00 1.00 1.00
0.07 0.06 0.06 Drinking Water from pipeline 0.30 0.34 0.33 ***
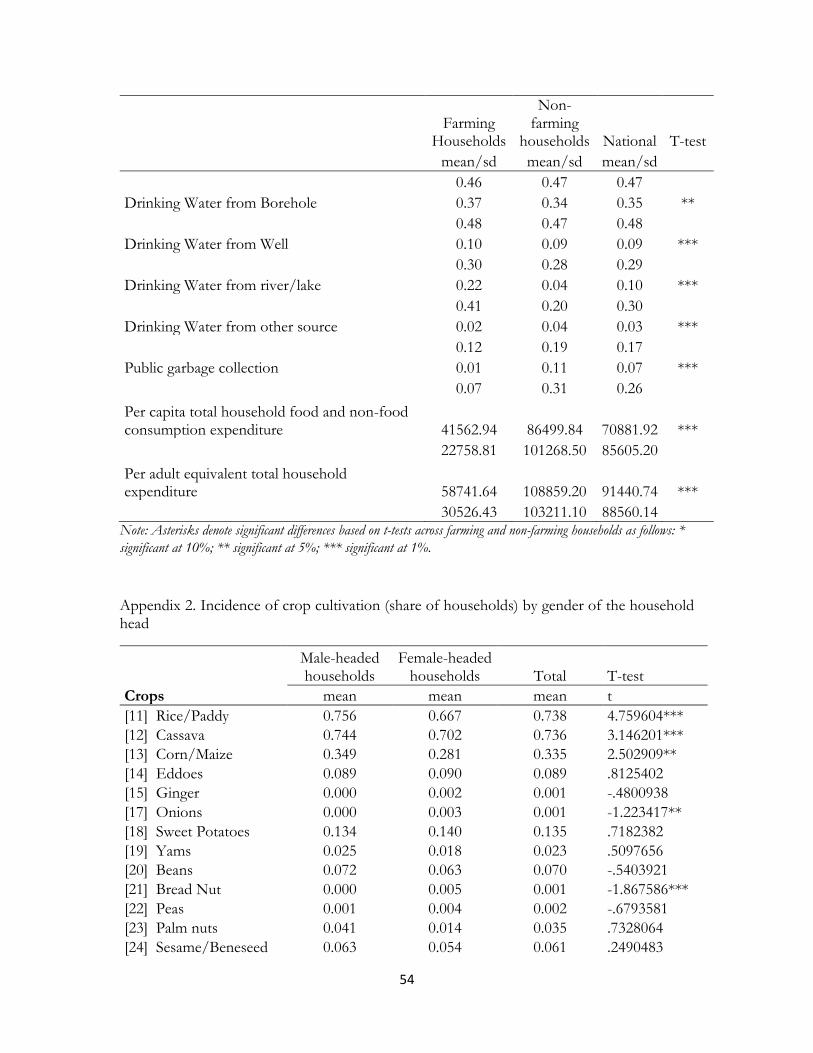
54
Farming
Households
Non-farming
households National T-test
mean/sd mean/sd mean/sd
0.46 0.47 0.47 Drinking Water from Borehole 0.37 0.34 0.35 **
0.48 0.47 0.48 Drinking Water from Well 0.10 0.09 0.09 ***
0.30 0.28 0.29 Drinking Water from river/lake 0.22 0.04 0.10 ***
0.41 0.20 0.30 Drinking Water from other source 0.02 0.04 0.03 ***
0.12 0.19 0.17 Public garbage collection 0.01 0.11 0.07 ***
0.07 0.31 0.26
Per capita total household food and non-food consumption expenditure 41562.94 86499.84 70881.92 ***
22758.81 101268.50 85605.20
Per adult equivalent total household expenditure 58741.64 108859.20 91440.74 ***
30526.43 103211.10 88560.14 Note: Asterisks denote significant differences based on t-tests across farming and non-farming households as follows: *
significant at 10%; ** significant at 5%; *** significant at 1%.
Appendix 2. Incidence of crop cultivation (share of households) by gender of the household head
Male-headed households
Female-headed households Total T-test
Crops mean mean mean t
[11] Rice/Paddy 0.756 0.667 0.738 4.759604***
[12] Cassava 0.744 0.702 0.736 3.146201***
[13] Corn/Maize 0.349 0.281 0.335 2.502909**
[14] Eddoes 0.089 0.090 0.089 .8125402
[15] Ginger 0.000 0.002 0.001 -.4800938
[17] Onions 0.000 0.003 0.001 -1.223417**
[18] Sweet Potatoes 0.134 0.140 0.135 .7182382
[19] Yams 0.025 0.018 0.023 .5097656
[20] Beans 0.072 0.063 0.070 -.5403921
[21] Bread Nut 0.000 0.005 0.001 -1.867586***
[22] Peas 0.001 0.004 0.002 -.6793581
[23] Palm nuts 0.041 0.014 0.035 .7328064
[24] Sesame/Beneseed 0.063 0.054 0.061 .2490483

55
Male-headed households
Female-headed households Total T-test
Crops mean mean mean t
[25] Groundnut 0.025 0.039 0.028 -1.04571
[26] Kola Nut 0.011 0.011 0.011 -1.433434*
[27] Banana 0.123 0.095 0.117 1.909483*
[28] Avocado 0.003 0.012 0.005 -2.035452***
[29] Bittersweet 0.000 0.000 0.000 1.000154
[30] Bread fruit 0.000 0.006 0.001 -1.577143***
[31] Golden Plum 0.007 0.001 0.006 -.5080696
[32] Grapefruit 0.005 0.007 0.005 -.9757318
[33] Guava 0.002 0.000 0.001 2.237793
[34] Lemon 0.002 0.000 0.001 1.732852
[35] Lime 0.001 0.003 0.001 -.6793581
[36] Mango 0.014 0.009 0.013 .1443785
[37] Monkey Apple 0.001 0.000 0.001 1.41465
[38] Orange 0.019 0.015 0.018 -.7736858
[39] Papaw 0.033 0.020 0.031 -.2943728
[40] Passion Fruit 0.000 0.000 0.000 1.000154
[41] Pineapple 0.078 0.046 0.072 2.534465**
[42] Plantain 0.221 0.170 0.210 4.832512***
[43] Sour Sour 0.006 0.003 0.005 -.6919624
[44] Sour Plum 0.000 0.001 0.000 -.7326192
[45] Water Melon 0.002 0.001 0.001 .2016256
[46] Bitterballs 0.418 0.341 0.402 3.568245***
[47] Cabbage 0.003 0.000 0.003 2.451758
[49] Collard Greens 0.001 0.003 0.002 -.8554644
[50] Cucumber 0.140 0.119 0.135 1.970547*
[51] Egg Plant 0.110 0.098 0.108 .1723542
[52] Fever Leaf 0.011 0.010 0.011 -.4977657
[53] Kitilay 0.041 0.033 0.040 .6099879
[54] Lettuce 0.001 0.000 0.001 1.41465
[55] Okra 0.287 0.281 0.286 2.242471**
[56] Pepper 0.474 0.385 0.456 3.878788***
[57] Plato 0.058 0.084 0.063 -.8963432
[58] Pumpkins 0.119 0.101 0.115 1.18779
[60] Tomatoes 0.024 0.017 0.023 1.483547
[61] Water Greens 0.040 0.077 0.047 -2.045844**
[62] Calabash 0.000 0.000 0.000 1.000154
[63] Cashew nut 0.007 0.002 0.006 -.0143921
[64] Cocoa 0.116 0.071 0.107 2.982768***
[65] Coconut 0.018 0.022 0.019 .3038286
[66] Coffee 0.047 0.040 0.046 .4387915
[67] Cotton 0.001 0.000 0.001 1.41465

56
Male-headed households
Female-headed households Total T-test
Crops mean mean mean t
[68] Oil Palm 0.047 0.015 0.041 3.512973***
[69] Rubber 0.149 0.043 0.127 7.126053***
[70] Sugar Cane 0.076 0.099 0.080 -.2358727
[90] OTHER 0.008 0.011 0.009 -1.363581*
Observations 4042 Note: Asterisks denote significant differences based on t-tests across Male and female-headed household as follows: *
significant at 10%; ** significant at 5%; *** significant at 1%.