Agriculture market report in the mena region
24
AGRICULTURE MARKET REPORT IN THE MENA REGION 2016 For Produced by
-
Upload
dr-khalid-shouq -
Category
Business
-
view
35 -
download
0
Transcript of Agriculture market report in the mena region
AGRICULTURE MARKET REPORT IN THE MENA REGION
2016
ForProduced by
TABLE OF CONTENTS PAGE NO.
1 INTRODUCTION 3
2 MARKET OVERVIEW 5
2.1 MARKET CHALLENGES, DRIVERS AND RESTRAINTS 5
2.2 MARKET SIZE 6
3 GROWTH POTENTIAL 8
4 TRADE OVERVIEW 9
4.1 TRADING CONDITIONS IN THE MENA REGION 9
4.1.1 IMPORTS 10
4.2 KEY PLAYERS IN THE MENA REGION 17
5 GOVERNMENT POLICIES 18
6 REGIONAL TRENDS AND INSIGHT 19
7 SWOT ANALYSIS 21
8 OUTLOOK 22
AGRICULTURE MARKET REPORT IN THE MENA REGION | 2016 2
AGRICULTURE MARKET IN THE MENA REGION
1. INTRODUCTION
Agriculture plays an important role in the economies of most countries in the MENA region. The contribution of the agricultural sector to the overall economy quite varies within the countries in the region.
Despite the violence and political instability in the MENA region, it accounts for a significant and growing portion from the total worldwide agricultural production.
In the next 10 years, the consumption of agricultural products will increase which will also stretch the local production in MENA region. This might lead to high imports that necessitates, respective of the government to have regulations controlling the consumption and production of agricultural products, and rethink their development models, along with initiating economic and social reforms.
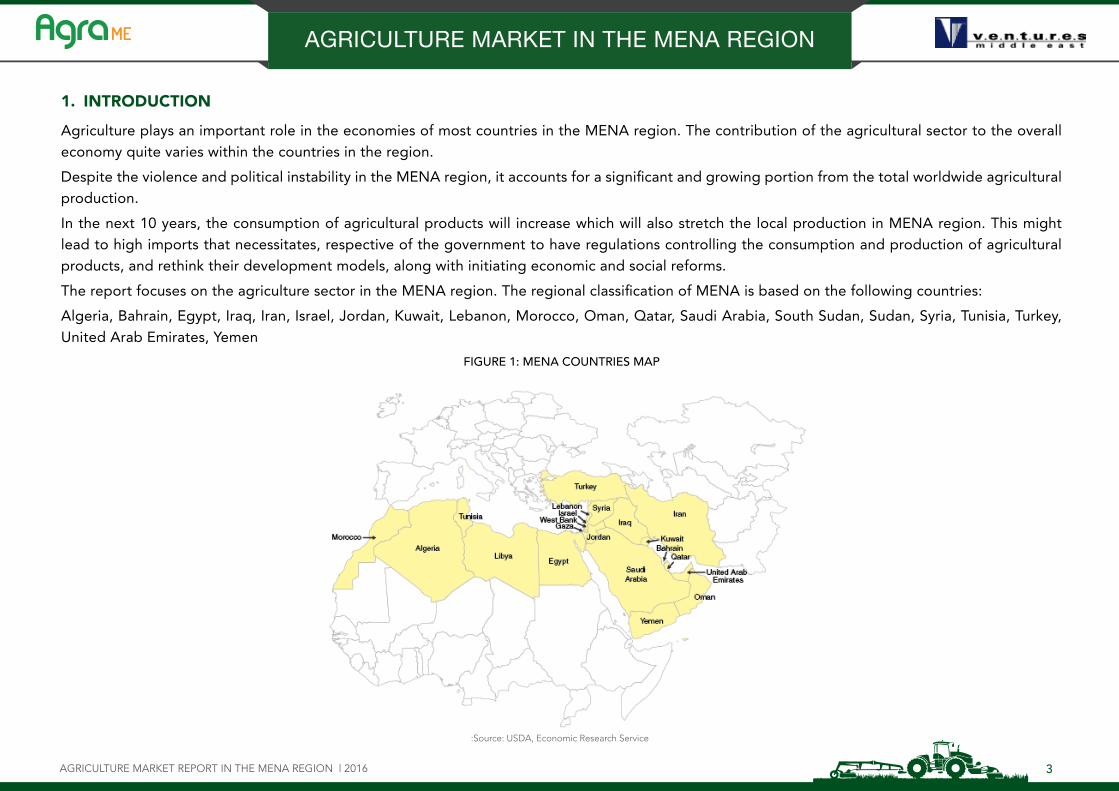
The report focuses on the agriculture sector in the MENA region. The regional classification of MENA is based on the following countries:
Algeria, Bahrain, Egypt, Iraq, Iran, Israel, Jordan, Kuwait, Lebanon, Morocco, Oman, Qatar, Saudi Arabia, South Sudan, Sudan, Syria, Tunisia, Turkey, United Arab Emirates, Yemen
:Source: USDA, Economic Research Service
FIGURE 1: MENA COUNTRIES MAP
AGRICULTURE MARKET REPORT IN THE MENA REGION | 2016 3
AGRICULTURE MARKET IN THE MENA REGION
AGRICULTURE MARKET REPORT IN THE MENA REGION | 2016 4
1. INTRODUCTION
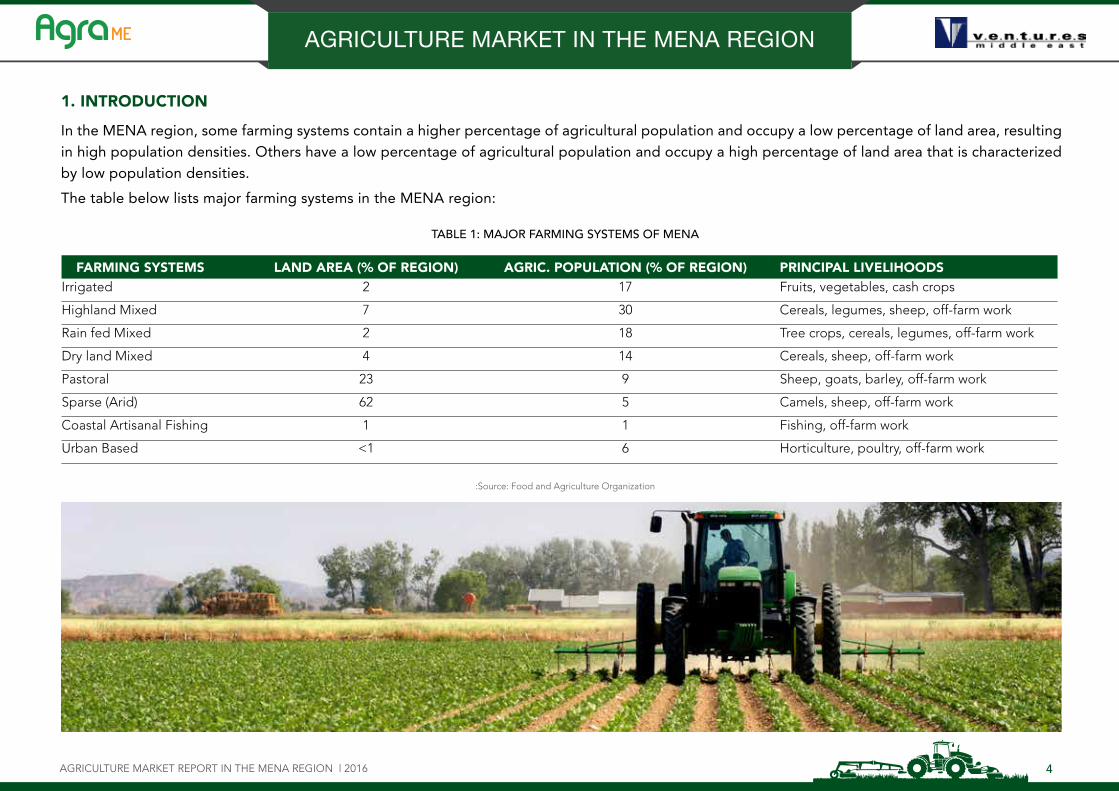
In the MENA region, some farming systems contain a higher percentage of agricultural population and occupy a low percentage of land area, resulting in high population densities. Others have a low percentage of agricultural population and occupy a high percentage of land area that is characterized by low population densities.
The table below lists major farming systems in the MENA region:
TABLE 1: MAJOR FARMING SYSTEMS OF MENA
FARMING SYSTEMS LAND AREA (% OF REGION) AGRIC. POPULATION (% OF REGION) PRINCIPAL LIVELIHOODS Irrigated 2 17 Fruits, vegetables, cash crops
Highland Mixed 7 30 Cereals, legumes, sheep, off-farm work
Rain fed Mixed 2 18 Tree crops, cereals, legumes, off-farm work
Dry land Mixed 4 14 Cereals, sheep, off-farm work
Pastoral 23 9 Sheep, goats, barley, off-farm work
Sparse (Arid) 62 5 Camels, sheep, off-farm work
Coastal Artisanal Fishing 1 1 Fishing, off-farm work
Urban Based <1 6 Horticulture, poultry, off-farm work
:Source: Food and Agriculture Organization
AGRICULTURE MARKET IN THE MENA REGION
AGRICULTURE MARKET REPORT IN THE MENA REGION | 2016 5
2. MARKET OVERVIEW
2.1 MARKET CHALLENGES, DRIVERS AND RESTRAINTS
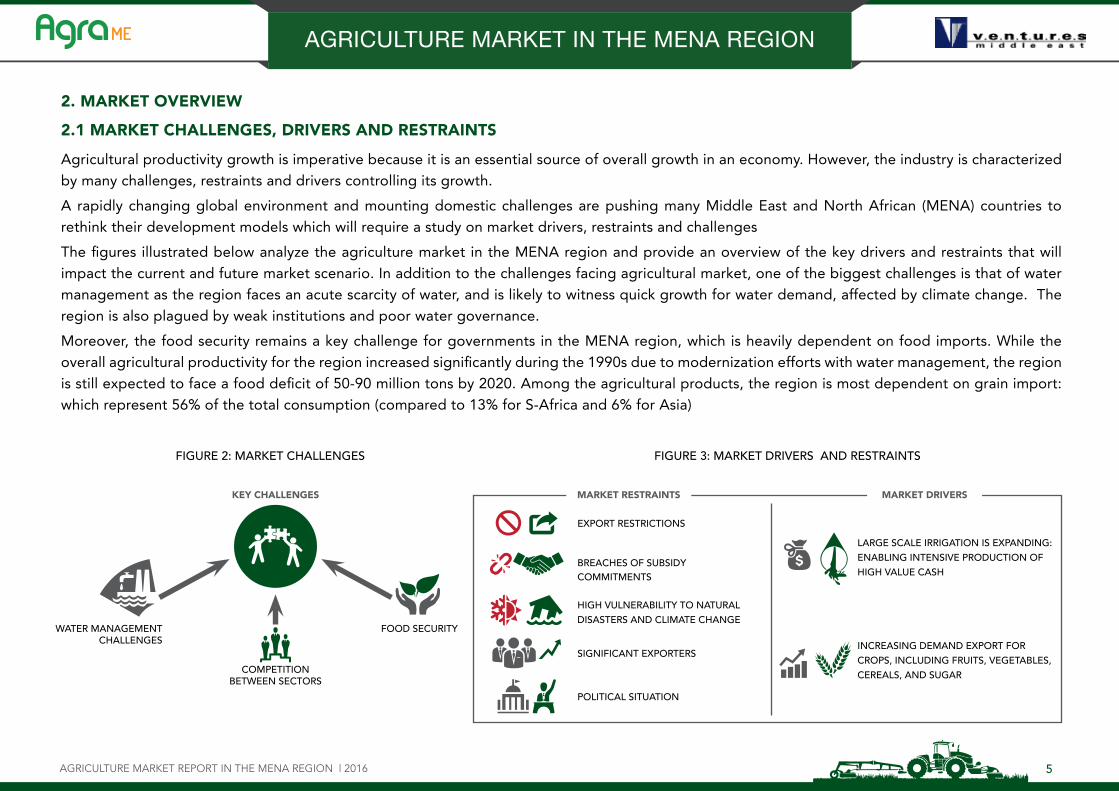
Agricultural productivity growth is imperative because it is an essential source of overall growth in an economy. However, the industry is characterized by many challenges, restraints and drivers controlling its growth.
A rapidly changing global environment and mounting domestic challenges are pushing many Middle East and North African (MENA) countries to rethink their development models which will require a study on market drivers, restraints and challenges
The figures illustrated below analyze the agriculture market in the MENA region and provide an overview of the key drivers and restraints that will impact the current and future market scenario. In addition to the challenges facing agricultural market, one of the biggest challenges is that of water management as the region faces an acute scarcity of water, and is likely to witness quick growth for water demand, affected by climate change. The region is also plagued by weak institutions and poor water governance.
Moreover, the food security remains a key challenge for governments in the MENA region, which is heavily dependent on food imports. While the overall agricultural productivity for the region increased significantly during the 1990s due to modernization efforts with water management, the region is still expected to face a food deficit of 50-90 million tons by 2020. Among the agricultural products, the region is most dependent on grain import: which represent 56% of the total consumption (compared to 13% for S-Africa and 6% for Asia)
FIGURE 2: MARKET CHALLENGES
KEY CHALLENGES
WATER MANAGEMENT CHALLENGES
FOOD SECURITY
COMPETITION BETWEEN SECTORS
FIGURE 3: MARKET DRIVERS AND RESTRAINTS
MARKET RESTRAINTS MARKET DRIVERS
SIGNIFICANT EXPORTERS
POLITICAL SITUATION
EXPORT RESTRICTIONS
BREACHES OF SUBSIDYCOMMITMENTS
HIGH VULNERABILITY TO NATURAL DISASTERS AND CLIMATE CHANGE
INCREASING DEMAND EXPORT FOR CROPS, INCLUDING FRUITS, VEGETABLES, CEREALS, AND SUGAR
LARGE SCALE IRRIGATION IS EXPANDING: ENABLING INTENSIVE PRODUCTION OF HIGH VALUE CASH
AGRICULTURE MARKET IN THE MENA REGION
AGRICULTURE MARKET REPORT IN THE MENA REGION | 2016 6
2. MARKET OVERVIEW
2.2 MARKET SIZE
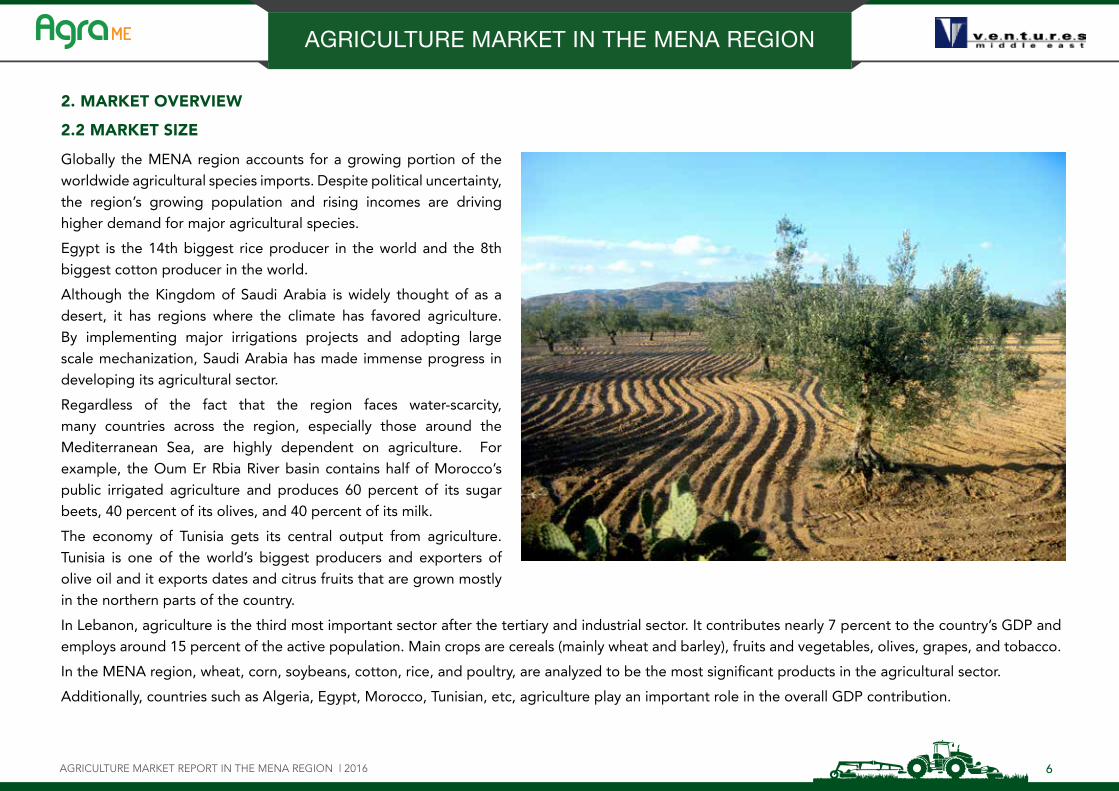
Globally the MENA region accounts for a growing portion of the worldwide agricultural species imports. Despite political uncertainty, the region’s growing population and rising incomes are driving higher demand for major agricultural species.
Egypt is the 14th biggest rice producer in the world and the 8th biggest cotton producer in the world.
Although the Kingdom of Saudi Arabia is widely thought of as a desert, it has regions where the climate has favored agriculture. By implementing major irrigations projects and adopting large scale mechanization, Saudi Arabia has made immense progress in developing its agricultural sector.
Regardless of the fact that the region faces water-scarcity, many countries across the region, especially those around the Mediterranean Sea, are highly dependent on agriculture. For example, the Oum Er Rbia River basin contains half of Morocco’s public irrigated agriculture and produces 60 percent of its sugar beets, 40 percent of its olives, and 40 percent of its milk.
The economy of Tunisia gets its central output from agriculture. Tunisia is one of the world’s biggest producers and exporters of olive oil and it exports dates and citrus fruits that are grown mostly in the northern parts of the country.
In Lebanon, agriculture is the third most important sector after the tertiary and industrial sector. It contributes nearly 7 percent to the country’s GDP and employs around 15 percent of the active population. Main crops are cereals (mainly wheat and barley), fruits and vegetables, olives, grapes, and tobacco.
In the MENA region, wheat, corn, soybeans, cotton, rice, and poultry, are analyzed to be the most significant products in the agricultural sector.
Additionally, countries such as Algeria, Egypt, Morocco, Tunisian, etc, agriculture play an important role in the overall GDP contribution.
AGRICULTURE MARKET IN THE MENA REGION
AGRICULTURE MARKET REPORT IN THE MENA REGION | 2016 7
2. MARKET OVERVIEW
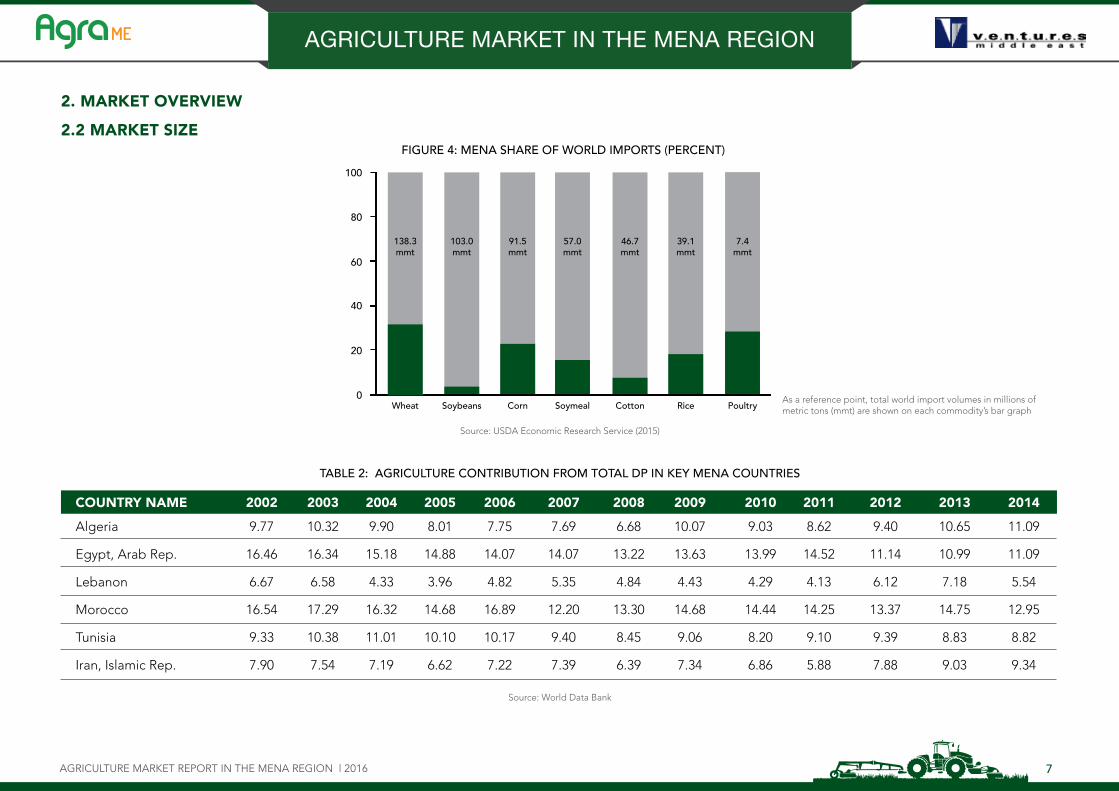
2.2 MARKET SIZE FIGURE 4: MENA SHARE OF WORLD IMPORTS (PERCENT)
0
20
40
60
80
100
Soybeans Corn Soymeal Cotton Rice PoultryWheat
138.3mmt
103.0mmt
91.5mmt
57.0mmt
46.7mmt
39.1mmt
7.4mmt
Source: USDA Economic Research Service (2015)
TABLE 2: AGRICULTURE CONTRIBUTION FROM TOTAL DP IN KEY MENA COUNTRIES
As a reference point, total world import volumes in millions of metric tons (mmt) are shown on each commodity’s bar graph
COUNTRY NAME 2002 2003 2004 2005 2006 2007 2008 2009 2010 2011 2012 2013 2014
Algeria 9.77 10.32 9.90 8.01 7.75 7.69 6.68 10.07 9.03 8.62 9.40 10.65 11.09
Egypt, Arab Rep. 16.46 16.34 15.18 14.88 14.07 14.07 13.22 13.63 13.99 14.52 11.14 10.99 11.09
Lebanon 6.67 6.58 4.33 3.96 4.82 5.35 4.84 4.43 4.29 4.13 6.12 7.18 5.54
Morocco 16.54 17.29 16.32 14.68 16.89 12.20 13.30 14.68 14.44 14.25 13.37 14.75 12.95
Tunisia 9.33 10.38 11.01 10.10 10.17 9.40 8.45 9.06 8.20 9.10 9.39 8.83 8.82
Iran, Islamic Rep. 7.90 7.54 7.19 6.62 7.22 7.39 6.39 7.34 6.86 5.88 7.88 9.03 9.34
Source: World Data Bank
AGRICULTURE MARKET IN THE MENA REGION
AGRICULTURE MARKET REPORT IN THE MENA REGION | 2016 8
Source: World Data Bank
3. GROWTH POTENTIAL
The MENA region is economically varied, including the oil-rich states of the Persian Gulf as well as the relatively resource-scarce countries such as Egypt, Morocco, and Yemen. The region’s population was estimated to be 500 million as of 2014, and has grown at an average of 2.1 percent annually from 2004 to 2013, faster than the world average of 1.2 percent per year and one of the fastest rates in the world.
Source: World Bank 2014
The region’s income is rising, reaching a per capita average of over $7,600 in 2013, and over the past 10 years, with an annual growth of 2.6%. But this average growth rate conceals major variation within the region. In 2013, the United Arab Emirates reported the highest per capita income at $59,885, while the lowest was in Yemen, at $1,135. In 2013, the region’s total GDP accounted for about 5.2 percent of the world’s economy.
Source: USDA United States Department of Agriculture Economic Research Service
Unemployment in the MENA region remains a problem with the growing population and limited economic diversification. Like per capita incomes, unemployment rates in the region vary widely. In Yemen and Tunisia, unemployment is nearly 18 percent, while in Kuwait and the UAE, the rate is less than 5 percent. These rates mask the youth segment from the population, which is expected to face between 25 and 30 percent unemployment over the next 5 years.
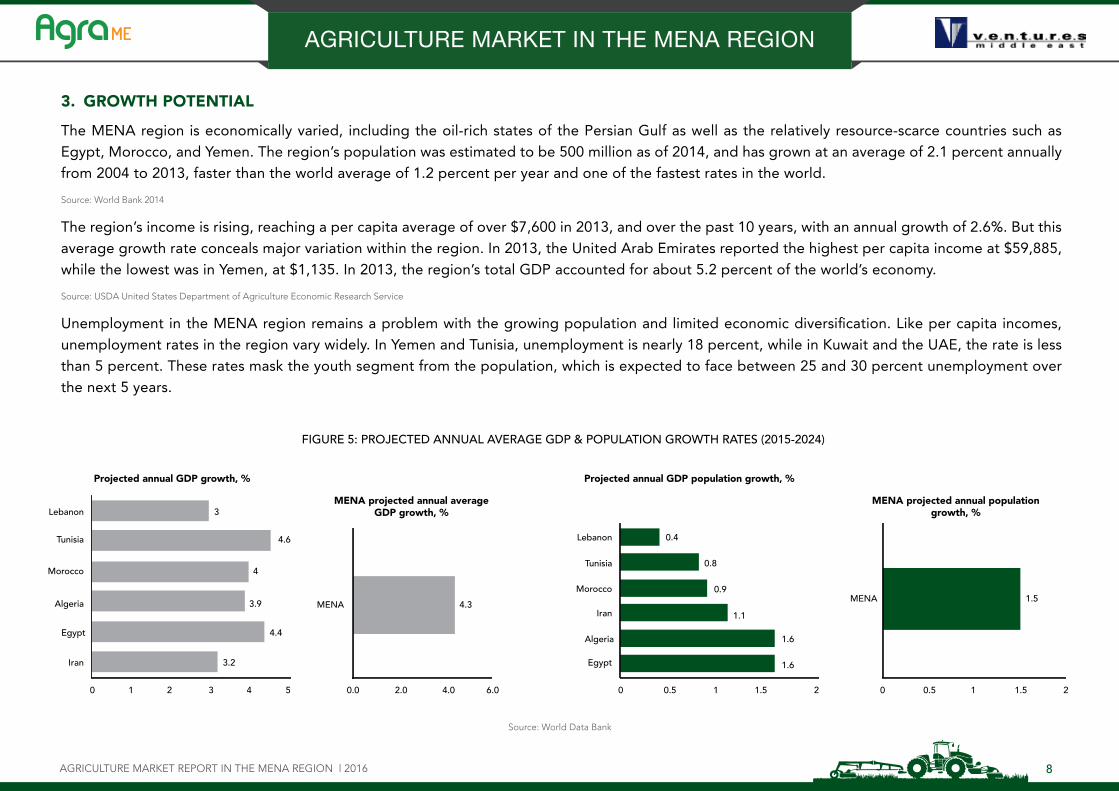
FIGURE 5: PROJECTED ANNUAL AVERAGE GDP & POPULATION GROWTH RATES (2015-2024)
Lebanon
MENA 4.3
0.00 1 2 3 4
3.2
4.4
3.9
4
4.6
3
5 2.0
MENA projected annual averageGDP growth, %
MENA projected annual populationgrowth, %
Projected annual GDP growth, % Projected annual GDP population growth, %
4.0 6.0
Tunisia
Morocco
Algeria
Egypt
Iran
Lebanon
0 0.5 1 1.5 2
1.6
1.6
1.1
0.9
0.8
0.4
Tunisia
Morocco
Iran
Algeria
Egypt
MENA 1.5
1.510 0.5 2
AGRICULTURE MARKET IN THE MENA REGION
AGRICULTURE MARKET REPORT IN THE MENA REGION | 2016 9
Source: Food and Agriculture Organization, UN
4. TRADE OVERVIEW4.1 TRADING CONDITIONS IN THE MENA REGION
MENA region is exporting about $1.4 trillion worth of goods and services and importing about $936 billion (measured in 2012 f.o.b. and c.i.f. $US, respectively), which accounts to less than 10% of total global trade in 2012. While imports are mainly including manufactured goods, exports include fuels and mining products.
Source: USDA United States Department of Agriculture Economic Research Services
As of 2012, trade among MENA countries is relatively low, accounting for less than 10% of all the region’s exports. Agriculture’s share of the region’s total imports was around 15%, and its share of the exports was about 3%. Agricultural net exports from developing countries have been declining.
Source: USDA United States Department of Agriculture Economic Research Services
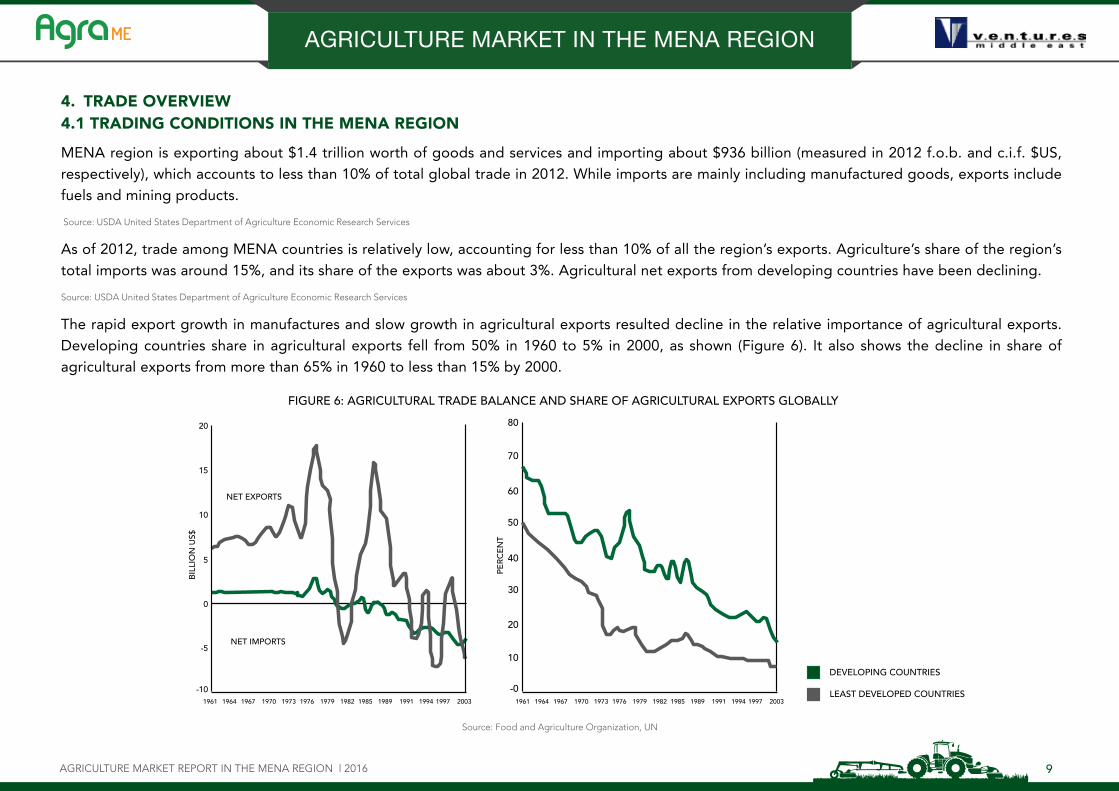
The rapid export growth in manufactures and slow growth in agricultural exports resulted decline in the relative importance of agricultural exports. Developing countries share in agricultural exports fell from 50% in 1960 to 5% in 2000, as shown (Figure 6). It also shows the decline in share of agricultural exports from more than 65% in 1960 to less than 15% by 2000.
FIGURE 6: AGRICULTURAL TRADE BALANCE AND SHARE OF AGRICULTURAL EXPORTS GLOBALLY
1961
-10 -0
10
20
30
40
50
60
70
80
-5
0
5
10
15
20
NET EXPORTS
BIL
LIO
N U
S$
PER
CE
NT
NET IMPORTS
1964 1967 1970 1973 1976 1979 1982 1985 1989 1991 1994 1997 2003 1961 1964 1967 1970 1973 1976 1979 1982 1985 1989 1991 1994 1997 2003
DEVELOPING COUNTRIES
LEAST DEVELOPED COUNTRIES
AGRICULTURE MARKET IN THE MENA REGION
AGRICULTURE MARKET REPORT IN THE MENA REGION | 2016 10
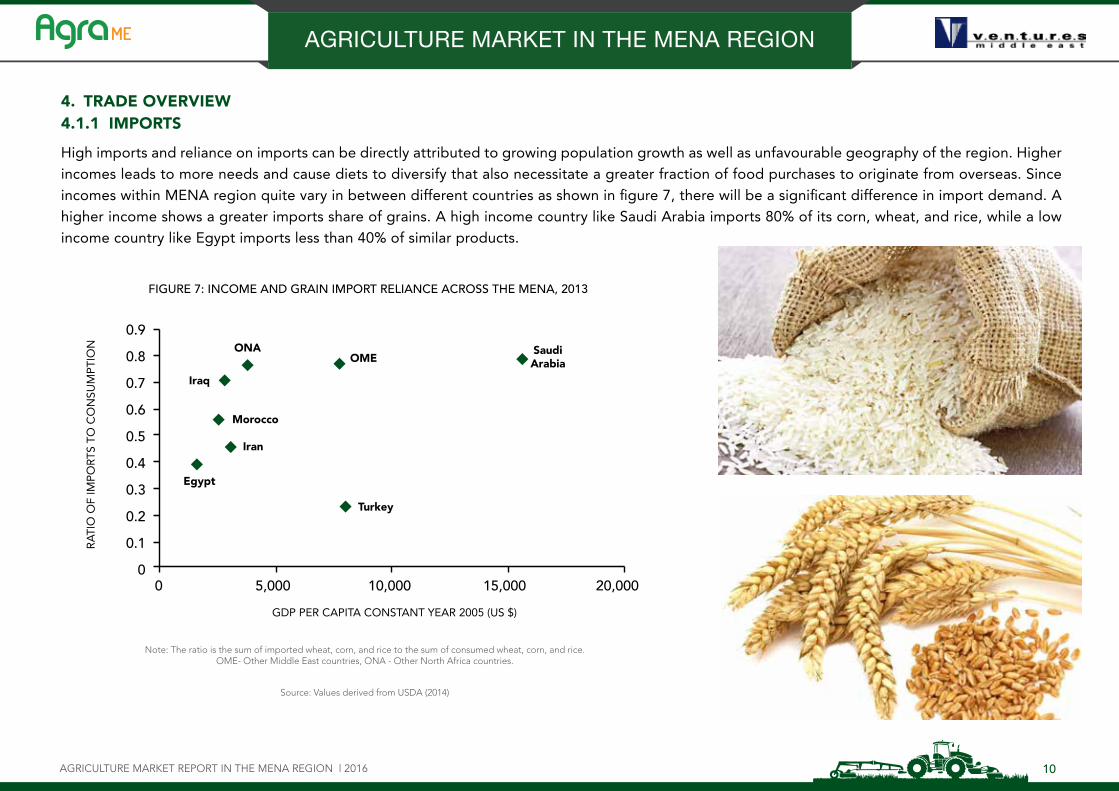
4. TRADE OVERVIEW4.1.1 IMPORTS
High imports and reliance on imports can be directly attributed to growing population growth as well as unfavourable geography of the region. Higher incomes leads to more needs and cause diets to diversify that also necessitate a greater fraction of food purchases to originate from overseas. Since incomes within MENA region quite vary in between different countries as shown in figure 7, there will be a significant difference in import demand. A higher income shows a greater imports share of grains. A high income country like Saudi Arabia imports 80% of its corn, wheat, and rice, while a low income country like Egypt imports less than 40% of similar products.
Source: Values derived from USDA (2014)
Note: The ratio is the sum of imported wheat, corn, and rice to the sum of consumed wheat, corn, and rice. OME- Other Middle East countries, ONA - Other North Africa countries.
FIGURE 7: INCOME AND GRAIN IMPORT RELIANCE ACROSS THE MENA, 2013
RA
TIO
OF
IMP
OR
TS T
O C
ON
SUM
PTI
ON
GDP PER CAPITA CONSTANT YEAR 2005 (US $)
SaudiArabia
Turkey
OMEONA
Iraq
Morocco
Iran
Egypt
0.9
0.8
0.7
0.6
0.5
0.4
0.3
0.2
0.1
00 5,000 10,000 15,000 20,000
AGRICULTURE MARKET IN THE MENA REGION
AGRICULTURE MARKET REPORT IN THE MENA REGION | 2016 11
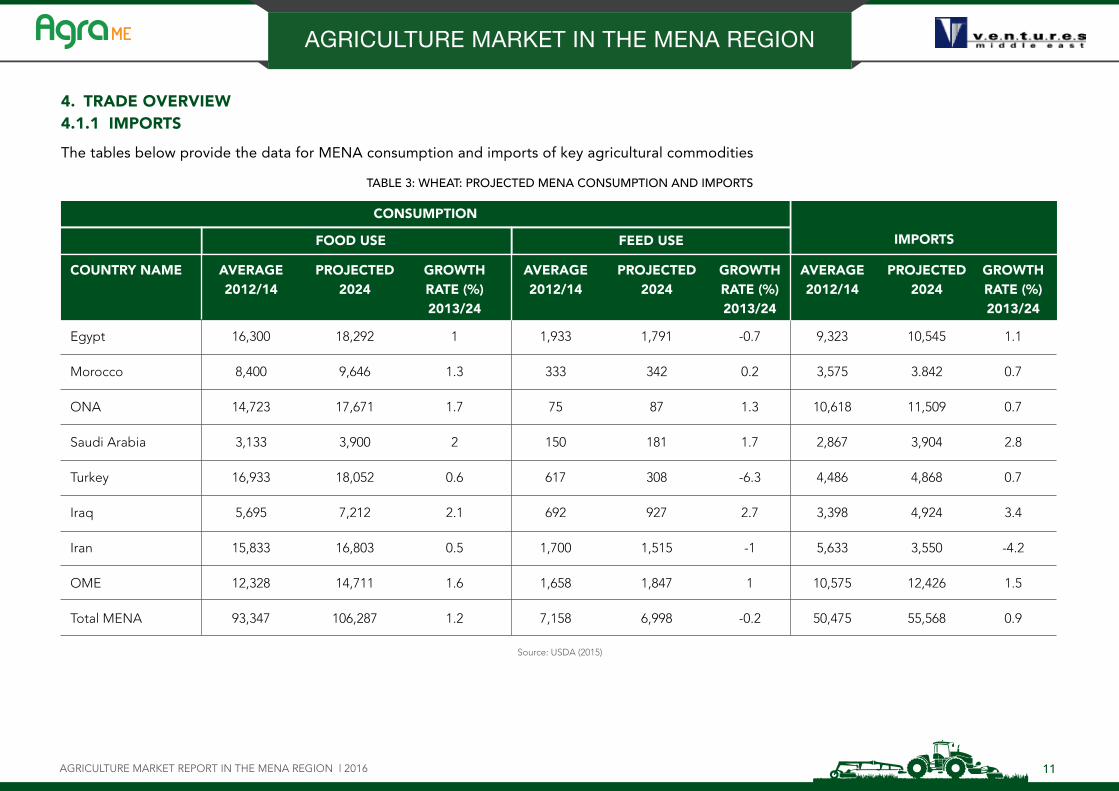
4. TRADE OVERVIEW4.1.1 IMPORTS
The tables below provide the data for MENA consumption and imports of key agricultural commodities
TABLE 3: WHEAT: PROJECTED MENA CONSUMPTION AND IMPORTS
Source: USDA (2015)
COUNTRY NAME AVERAGE PROJECTED GROWTH AVERAGE PROJECTED GROWTH AVERAGE PROJECTED GROWTH 2012/14 2024 RATE (%) 2012/14 2024 RATE (%) 2012/14 2024 RATE (%) 2013/24 2013/24 2013/24
Egypt 16,300 18,292 1 1,933 1,791 -0.7 9,323 10,545 1.1
Morocco 8,400 9,646 1.3 333 342 0.2 3,575 3.842 0.7
ONA 14,723 17,671 1.7 75 87 1.3 10,618 11,509 0.7
Saudi Arabia 3,133 3,900 2 150 181 1.7 2,867 3,904 2.8
Turkey 16,933 18,052 0.6 617 308 -6.3 4,486 4,868 0.7
Iraq 5,695 7,212 2.1 692 927 2.7 3,398 4,924 3.4
Iran 15,833 16,803 0.5 1,700 1,515 -1 5,633 3,550 -4.2
OME 12,328 14,711 1.6 1,658 1,847 1 10,575 12,426 1.5
Total MENA 93,347 106,287 1.2 7,158 6,998 -0.2 50,475 55,568 0.9
CONSUMPTION
FOOD USE FEED USE IMPORTS
AGRICULTURE MARKET IN THE MENA REGION
AGRICULTURE MARKET REPORT IN THE MENA REGION | 2016 12
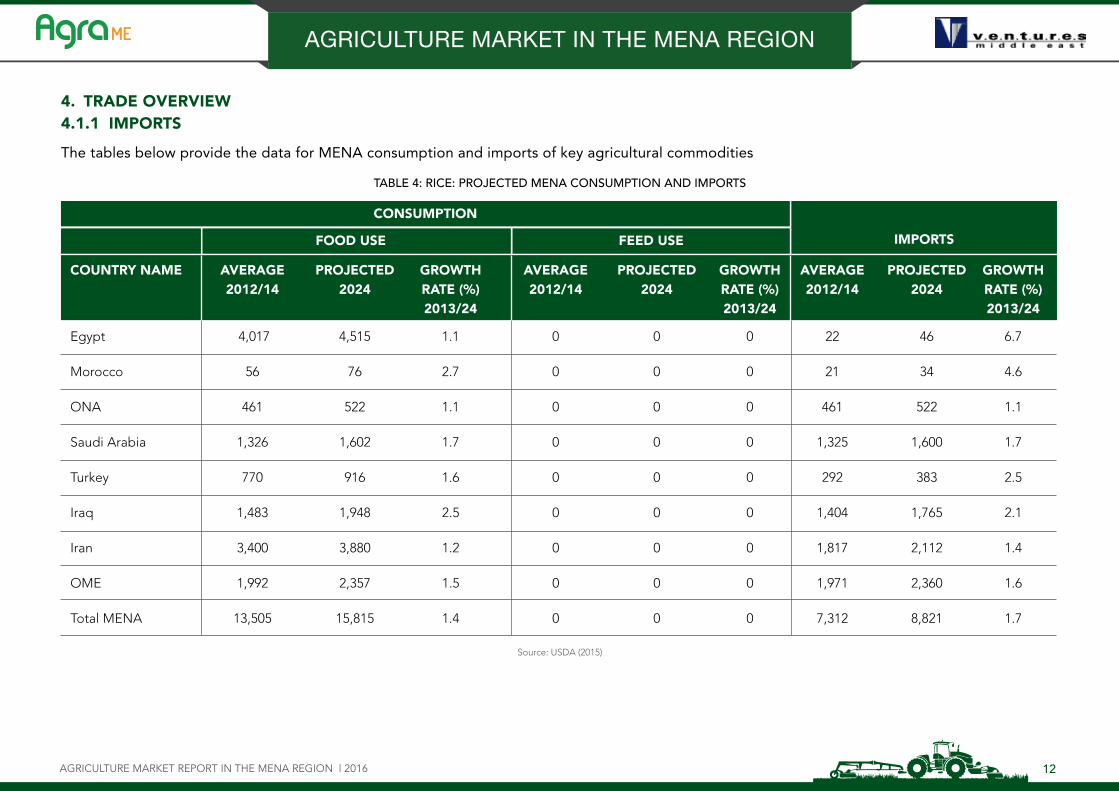
4. TRADE OVERVIEW4.1.1 IMPORTS
The tables below provide the data for MENA consumption and imports of key agricultural commodities
TABLE 4: RICE: PROJECTED MENA CONSUMPTION AND IMPORTS
Source: USDA (2015)
COUNTRY NAME AVERAGE PROJECTED GROWTH AVERAGE PROJECTED GROWTH AVERAGE PROJECTED GROWTH 2012/14 2024 RATE (%) 2012/14 2024 RATE (%) 2012/14 2024 RATE (%) 2013/24 2013/24 2013/24
Egypt 4,017 4,515 1.1 0 0 0 22 46 6.7
Morocco 56 76 2.7 0 0 0 21 34 4.6
ONA 461 522 1.1 0 0 0 461 522 1.1
Saudi Arabia 1,326 1,602 1.7 0 0 0 1,325 1,600 1.7
Turkey 770 916 1.6 0 0 0 292 383 2.5
Iraq 1,483 1,948 2.5 0 0 0 1,404 1,765 2.1
Iran 3,400 3,880 1.2 0 0 0 1,817 2,112 1.4
OME 1,992 2,357 1.5 0 0 0 1,971 2,360 1.6
Total MENA 13,505 15,815 1.4 0 0 0 7,312 8,821 1.7
CONSUMPTION
FOOD USE FEED USE IMPORTS
AGRICULTURE MARKET IN THE MENA REGION
AGRICULTURE MARKET REPORT IN THE MENA REGION | 2016 13
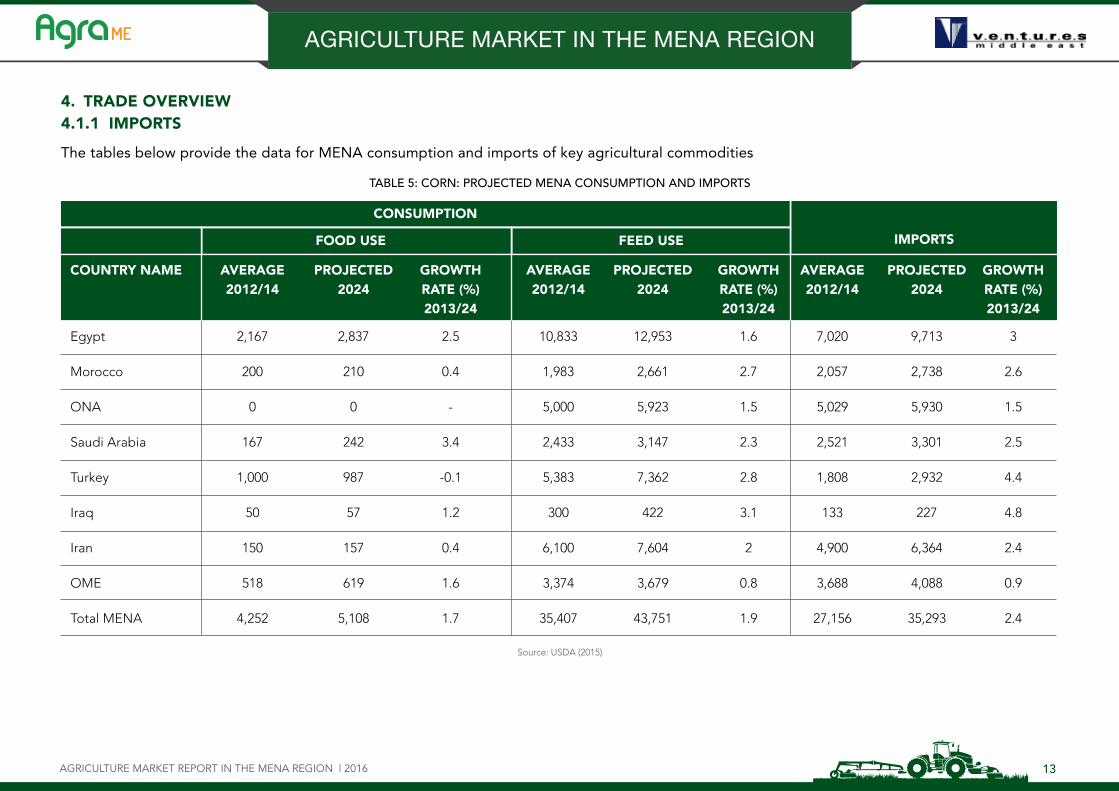
4. TRADE OVERVIEW4.1.1 IMPORTS
The tables below provide the data for MENA consumption and imports of key agricultural commodities
TABLE 5: CORN: PROJECTED MENA CONSUMPTION AND IMPORTS
Source: USDA (2015)
COUNTRY NAME AVERAGE PROJECTED GROWTH AVERAGE PROJECTED GROWTH AVERAGE PROJECTED GROWTH 2012/14 2024 RATE (%) 2012/14 2024 RATE (%) 2012/14 2024 RATE (%) 2013/24 2013/24 2013/24
Egypt 2,167 2,837 2.5 10,833 12,953 1.6 7,020 9,713 3
Morocco 200 210 0.4 1,983 2,661 2.7 2,057 2,738 2.6
ONA 0 0 - 5,000 5,923 1.5 5,029 5,930 1.5
Saudi Arabia 167 242 3.4 2,433 3,147 2.3 2,521 3,301 2.5
Turkey 1,000 987 -0.1 5,383 7,362 2.8 1,808 2,932 4.4
Iraq 50 57 1.2 300 422 3.1 133 227 4.8
Iran 150 157 0.4 6,100 7,604 2 4,900 6,364 2.4
OME 518 619 1.6 3,374 3,679 0.8 3,688 4,088 0.9
Total MENA 4,252 5,108 1.7 35,407 43,751 1.9 27,156 35,293 2.4
CONSUMPTION
FOOD USE FEED USE IMPORTS
AGRICULTURE MARKET IN THE MENA REGION
AGRICULTURE MARKET REPORT IN THE MENA REGION | 2016 14
4. TRADE OVERVIEW4.1.1 IMPORTS
The tables below provide the data for MENA consumption and imports of key agricultural commodities
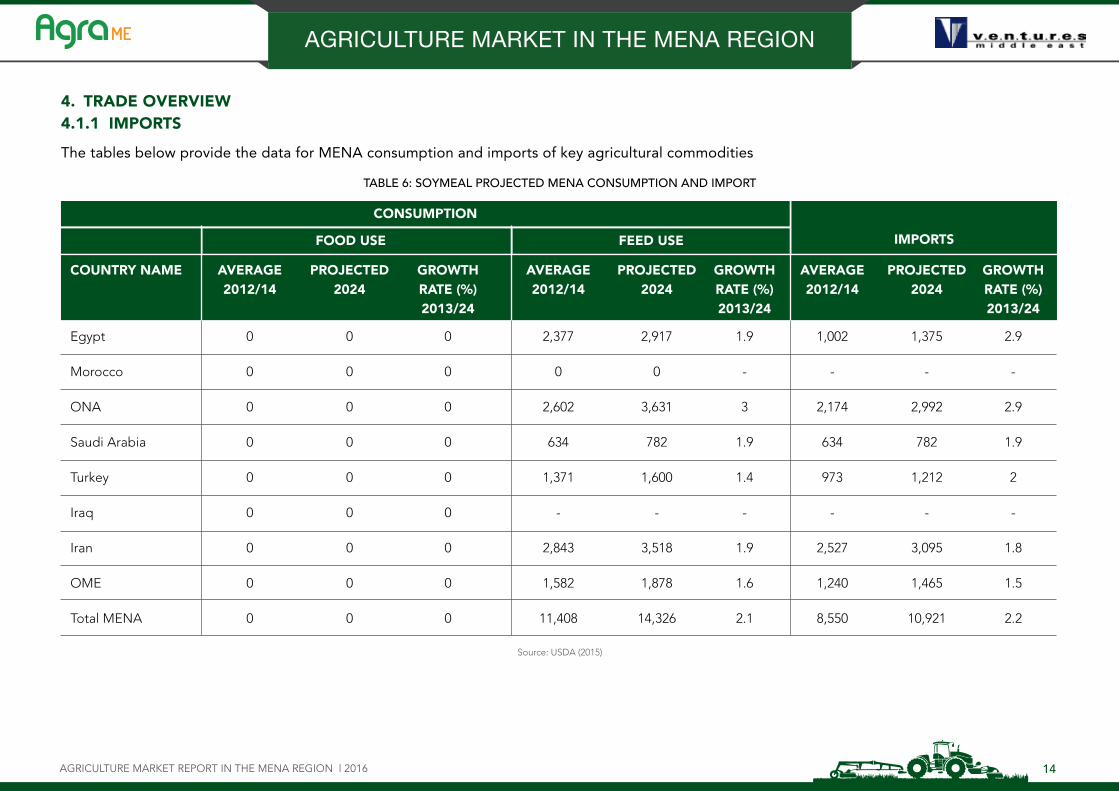
TABLE 6: SOYMEAL PROJECTED MENA CONSUMPTION AND IMPORT
Source: USDA (2015)
COUNTRY NAME AVERAGE PROJECTED GROWTH AVERAGE PROJECTED GROWTH AVERAGE PROJECTED GROWTH 2012/14 2024 RATE (%) 2012/14 2024 RATE (%) 2012/14 2024 RATE (%) 2013/24 2013/24 2013/24
Egypt 0 0 0 2,377 2,917 1.9 1,002 1,375 2.9
Morocco 0 0 0 0 0 - - - -
ONA 0 0 0 2,602 3,631 3 2,174 2,992 2.9
Saudi Arabia 0 0 0 634 782 1.9 634 782 1.9
Turkey 0 0 0 1,371 1,600 1.4 973 1,212 2
Iraq 0 0 0 - - - - - -
Iran 0 0 0 2,843 3,518 1.9 2,527 3,095 1.8
OME 0 0 0 1,582 1,878 1.6 1,240 1,465 1.5
Total MENA 0 0 0 11,408 14,326 2.1 8,550 10,921 2.2
CONSUMPTION
FOOD USE FEED USE IMPORTS
AGRICULTURE MARKET IN THE MENA REGION
AGRICULTURE MARKET REPORT IN THE MENA REGION | DECEMBER 2016 15
4. TRADE OVERVIEW4.1.1 IMPORTS
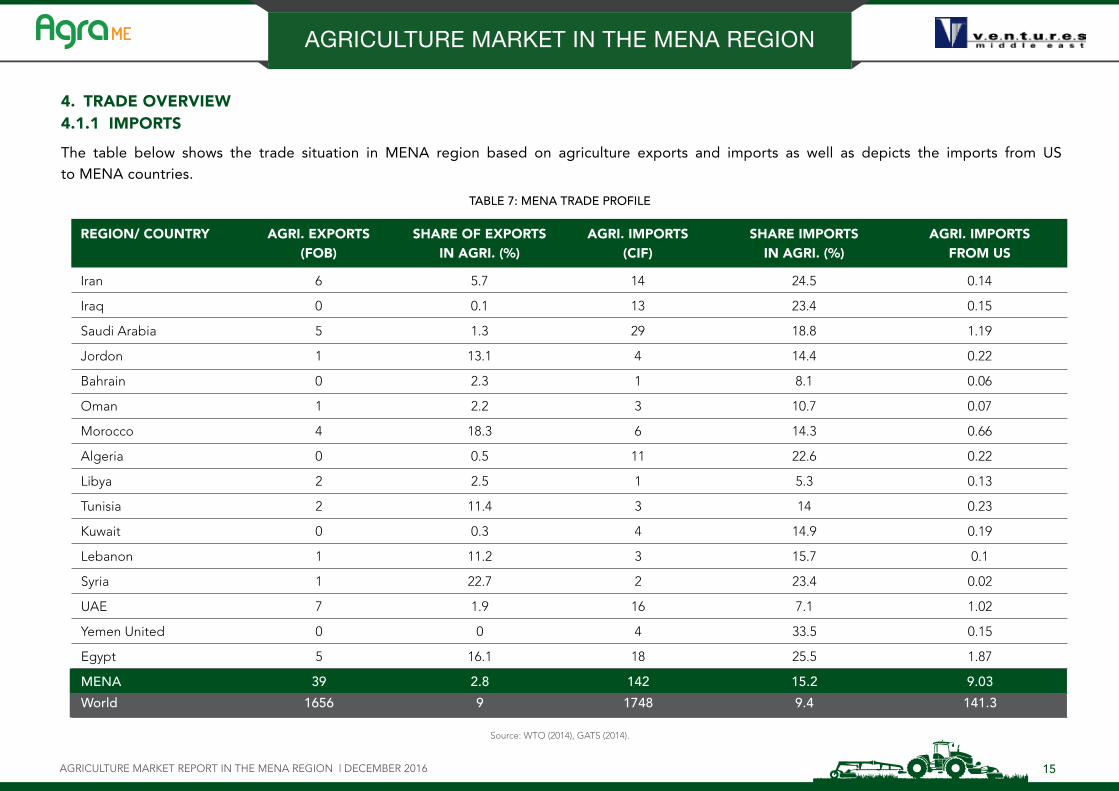
The table below shows the trade situation in MENA region based on agriculture exports and imports as well as depicts the imports from US to MENA countries.
Source: WTO (2014), GATS (2014).
REGION/ COUNTRY AGRI. EXPORTS SHARE OF EXPORTS AGRI. IMPORTS SHARE IMPORTS AGRI. IMPORTS (FOB) IN AGRI. (%) (CIF) IN AGRI. (%) FROM US
Iran 6 5.7 14 24.5 0.14
Iraq 0 0.1 13 23.4 0.15
Saudi Arabia 5 1.3 29 18.8 1.19
Jordon 1 13.1 4 14.4 0.22
Bahrain 0 2.3 1 8.1 0.06
Oman 1 2.2 3 10.7 0.07
Morocco 4 18.3 6 14.3 0.66
Algeria 0 0.5 11 22.6 0.22
Libya 2 2.5 1 5.3 0.13
Tunisia 2 11.4 3 14 0.23
Kuwait 0 0.3 4 14.9 0.19
Lebanon 1 11.2 3 15.7 0.1
Syria 1 22.7 2 23.4 0.02
UAE 7 1.9 16 7.1 1.02
Yemen United 0 0 4 33.5 0.15
Egypt 5 16.1 18 25.5 1.87
MENA 39 2.8 142 15.2 9.03
World 1656 9 1748 9.4 141.3
TABLE 7: MENA TRADE PROFILE
AGRICULTURE MARKET IN THE MENA REGION
AGRICULTURE MARKET REPORT IN THE MENA REGION | 2016 16
4. TRADE OVERVIEW4.1.1 IMPORTS
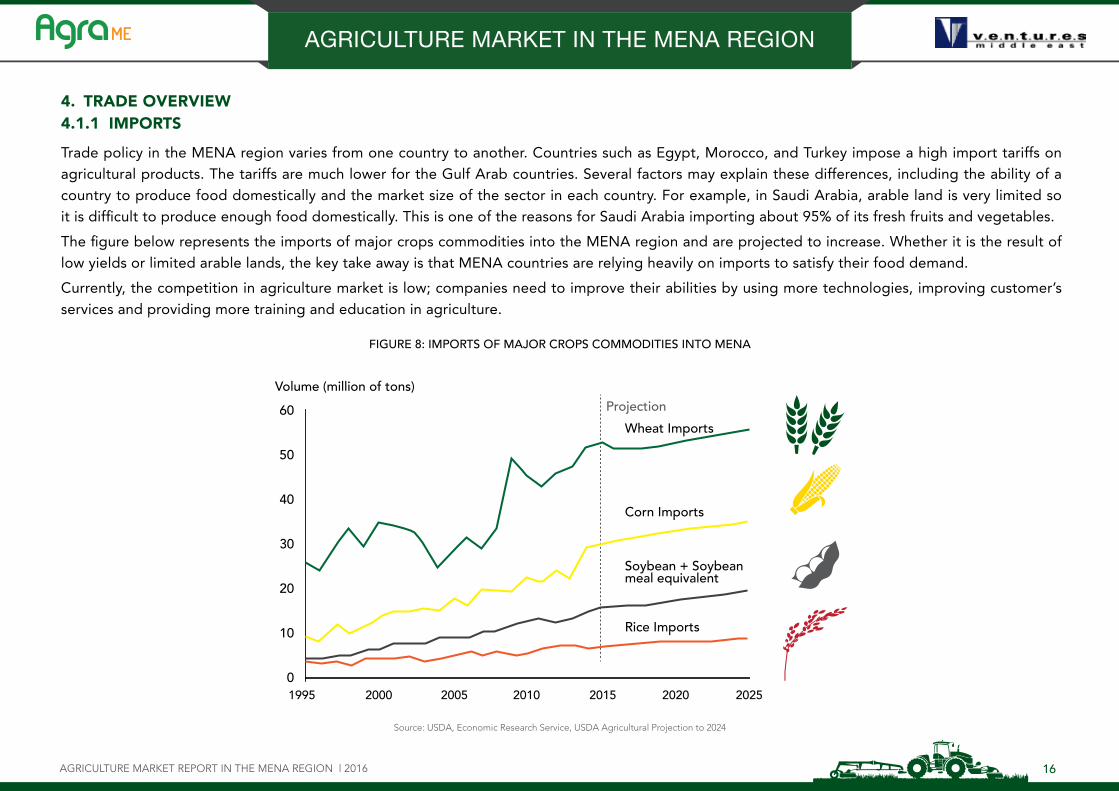
Trade policy in the MENA region varies from one country to another. Countries such as Egypt, Morocco, and Turkey impose a high import tariffs on agricultural products. The tariffs are much lower for the Gulf Arab countries. Several factors may explain these differences, including the ability of a country to produce food domestically and the market size of the sector in each country. For example, in Saudi Arabia, arable land is very limited so it is difficult to produce enough food domestically. This is one of the reasons for Saudi Arabia importing about 95% of its fresh fruits and vegetables.
The figure below represents the imports of major crops commodities into the MENA region and are projected to increase. Whether it is the result of low yields or limited arable lands, the key take away is that MENA countries are relying heavily on imports to satisfy their food demand.
Currently, the competition in agriculture market is low; companies need to improve their abilities by using more technologies, improving customer’s services and providing more training and education in agriculture.
Source: USDA, Economic Research Service, USDA Agricultural Projection to 2024
FIGURE 8: IMPORTS OF MAJOR CROPS COMMODITIES INTO MENA
1995
60
50
40
30
20
10
0
Volume (million of tons)
Wheat Imports
Projection
Corn Imports
Soybean + Soybeanmeal equivalent
Rice Imports
2000 2005 2010 2015 2020 2025
AGRICULTURE MARKET IN THE MENA REGION
AGRICULTURE MARKET REPORT IN THE MENA REGION | 2016 17
4. TRADE OVERVIEW 4.2 KEY PLAYERS IN THE MENA REGION
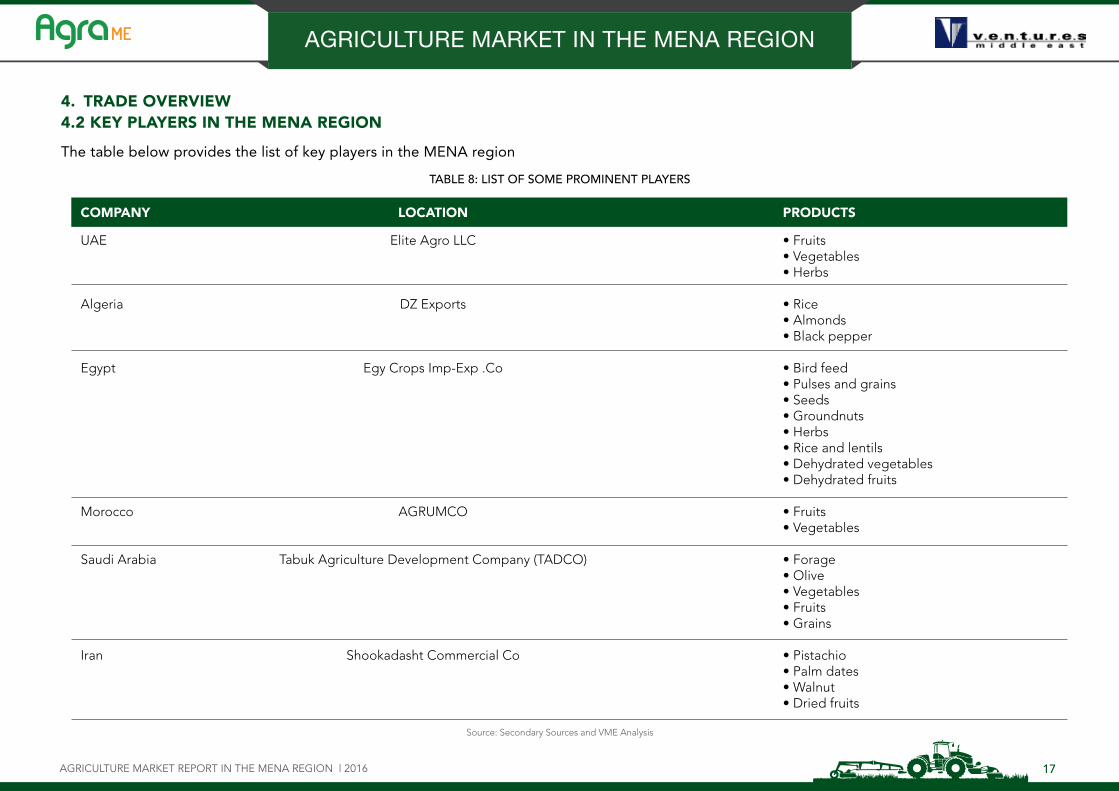
The table below provides the list of key players in the MENA region
Source: Secondary Sources and VME Analysis
TABLE 8: LIST OF SOME PROMINENT PLAYERS
COMPANY LOCATION PRODUCTS
UAE Elite Agro LLC • Fruits • Vegetables • Herbs
Algeria DZ Exports • Rice • Almonds • Black pepper
Egypt Egy Crops Imp-Exp .Co • Bird feed • Pulses and grains • Seeds • Groundnuts • Herbs • Rice and lentils • Dehydrated vegetables • Dehydrated fruits
Morocco AGRUMCO • Fruits • Vegetables Saudi Arabia Tabuk Agriculture Development Company (TADCO) • Forage • Olive • Vegetables • Fruits • Grains
Iran Shookadasht Commercial Co • Pistachio • Palm dates • Walnut • Dried fruits
AGRICULTURE MARKET IN THE MENA REGION
AGRICULTURE MARKET REPORT IN THE MENA REGION | 2016 18
5. GOVERNMENT POLICIES
1. EGYPT
Egypt government is increasing the productivity of cultivatable land already in use through increasing the use of more efficient irrigation methods; and improving the access of small farmers to markets through crop subsidies, remunerative programs, anti-monopoly laws, and easier access to loans.
2. IRAN
Iran government is giving importance and supporting producers with its self-sufficiency strategy, the government provides high support prices to farmers on several commodities. However this policy requires a high level budgetary support which is challenging in the current economic situation.
3. MOROCCO
Morocco has long term goal / 2020 strategy for rural developments and agricultural contribution to its economy. The objectives of this strategic plan are as follows:
- Increasing agricultural production
- Increasing opportunities for agricultural employment and income
- Correcting regional and local imbalances in infrastructure and regional development
AGRICULTURE MARKET IN THE MENA REGION
AGRICULTURE MARKET REPORT IN THE MENA REGION | 2016 19
5. GOVERNMENT POLICIES
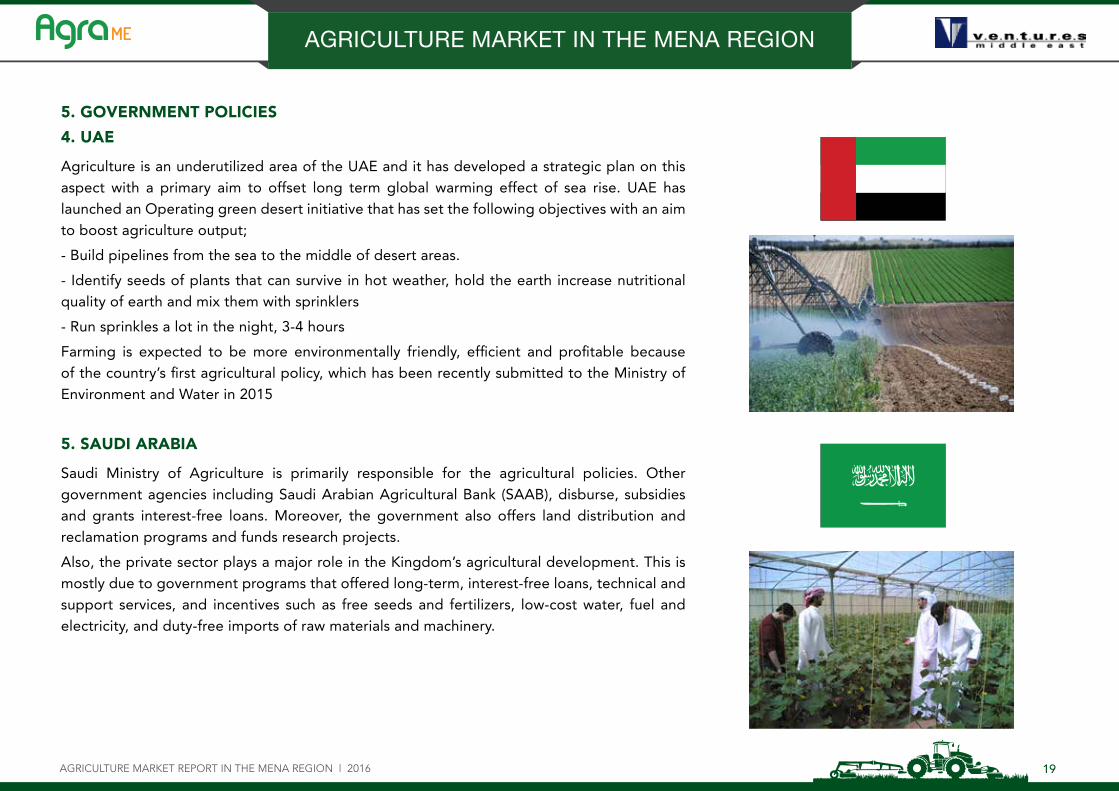
4. UAE
Agriculture is an underutilized area of the UAE and it has developed a strategic plan on this aspect with a primary aim to offset long term global warming effect of sea rise. UAE has launched an Operating green desert initiative that has set the following objectives with an aim to boost agriculture output;
- Build pipelines from the sea to the middle of desert areas.
- Identify seeds of plants that can survive in hot weather, hold the earth increase nutritional quality of earth and mix them with sprinklers
- Run sprinkles a lot in the night, 3-4 hours
Farming is expected to be more environmentally friendly, efficient and profitable because of the country’s first agricultural policy, which has been recently submitted to the Ministry of Environment and Water in 2015
5. SAUDI ARABIA
Saudi Ministry of Agriculture is primarily responsible for the agricultural policies. Other government agencies including Saudi Arabian Agricultural Bank (SAAB), disburse, subsidies and grants interest-free loans. Moreover, the government also offers land distribution and reclamation programs and funds research projects.
Also, the private sector plays a major role in the Kingdom’s agricultural development. This is mostly due to government programs that offered long-term, interest-free loans, technical and support services, and incentives such as free seeds and fertilizers, low-cost water, fuel and electricity, and duty-free imports of raw materials and machinery.
AGRICULTURE MARKET IN THE MENA REGION
AGRICULTURE MARKET REPORT IN THE MENA REGION | 2016 20
6. REGIONAL TRENDS AND INSIGHT
REGIONAL TRENDS
Food Security: In MENA region 50% of food is imported. High food prices and disappearance of international market imports means domestic agriculture has taken on strategic importance in all the food producing countries in MENA. However, non-food producing countries, such as the GCC, are looking at ways of securing from importing many food quantities and motivate the farmers for producing part of the local food needs.
Poverty: In MENA region 70% of poor live in rural areas. Deep rural poverty is not generalized in MENA (with the exception of Yemen). It is available in certain groups in each country, such as households headed by women, farm laborers without any land, and in certain regions, such as Upper Egypt, two specific regions in Iraq, the mountains and steppes plains of Morocco or north-west Tunisia. This allows MENA governments to target clearly the rural and social development programs for the elimination of poverty.
Existing Labor Force: The biggest political challenge is the unemployment of youth in MENA. The unemployment rate in MENA is 13% compared with 6% for all middle-income countries. While rural areas are underdeveloped, jobs in urban areas have not been entirely successful in absorbing the increasing labor force. This also means that ample workforce is available for the labor intensive agriculture sector and if the respective governments can set the right policies, the issue to unemployment can be significantly tackled by effective planning and implementation.
Water: Good agriculture irrigation policies lead to good water-resource management. Water withdrawals in the MENA region represent 67% of renewable water resources, compared with 8% for the developing world overall. 85% of MENA’s water-use is for irrigation. Water security depends on how agriculture uses water and necessitates effective planning and water management practice in agriculture.
AGRICULTURE MARKET IN THE MENA REGION
AGRICULTURE MARKET REPORT IN THE MENA REGION | 2016 21
6. REGIONAL TRENDS AND INSIGHT
REGIONAL INSIGHT
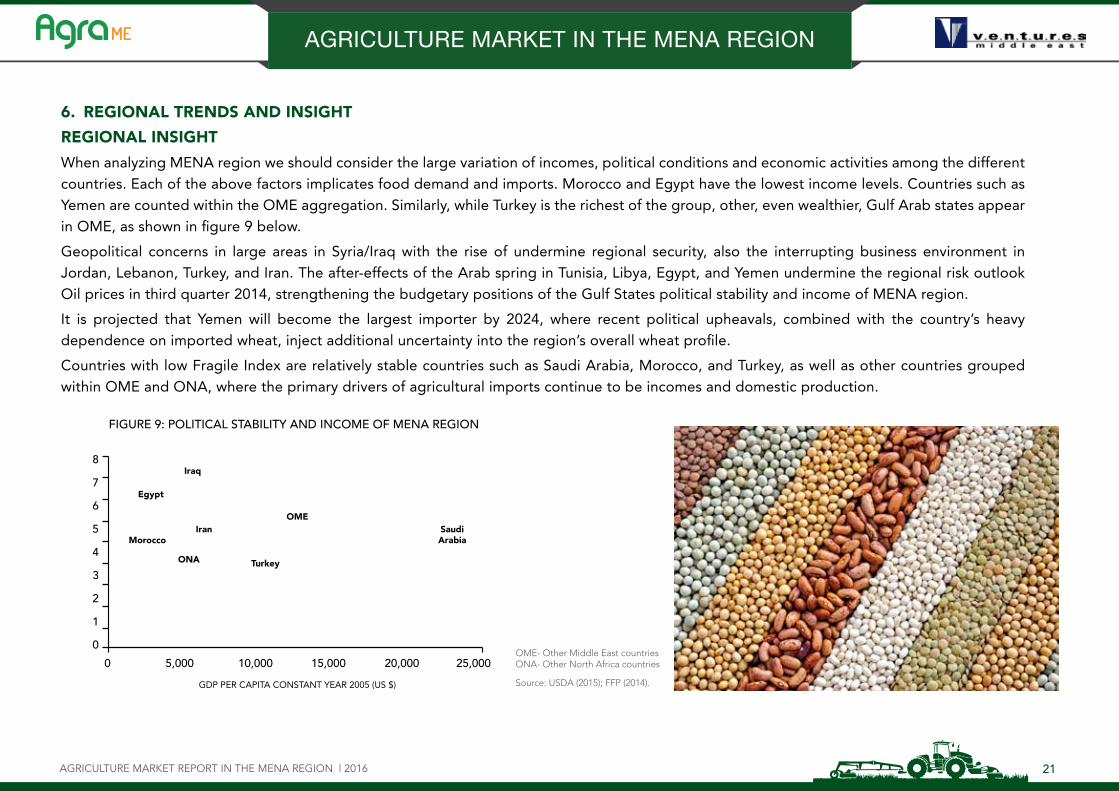
When analyzing MENA region we should consider the large variation of incomes, political conditions and economic activities among the different countries. Each of the above factors implicates food demand and imports. Morocco and Egypt have the lowest income levels. Countries such as Yemen are counted within the OME aggregation. Similarly, while Turkey is the richest of the group, other, even wealthier, Gulf Arab states appear in OME, as shown in figure 9 below.
Geopolitical concerns in large areas in Syria/Iraq with the rise of undermine regional security, also the interrupting business environment in Jordan, Lebanon, Turkey, and Iran. The after-effects of the Arab spring in Tunisia, Libya, Egypt, and Yemen undermine the regional risk outlook Oil prices in third quarter 2014, strengthening the budgetary positions of the Gulf States political stability and income of MENA region.
It is projected that Yemen will become the largest importer by 2024, where recent political upheavals, combined with the country’s heavy dependence on imported wheat, inject additional uncertainty into the region’s overall wheat profile.
Countries with low Fragile Index are relatively stable countries such as Saudi Arabia, Morocco, and Turkey, as well as other countries grouped within OME and ONA, where the primary drivers of agricultural imports continue to be incomes and domestic production.
OME- Other Middle East countries ONA- Other North Africa countries
Source: USDA (2015); FFP (2014).
FIGURE 9: POLITICAL STABILITY AND INCOME OF MENA REGION
GDP PER CAPITA CONSTANT YEAR 2005 (US $)
SaudiArabia
Turkey
OME
ONA
Iraq
MoroccoIran
Egypt
8
7
6
5
4
3
2
1
0
0 5,000 10,000 15,000 20,000 25,000
AGRICULTURE MARKET IN THE MENA REGION
AGRICULTURE MARKET REPORT IN THE MENA REGION | 2016 22
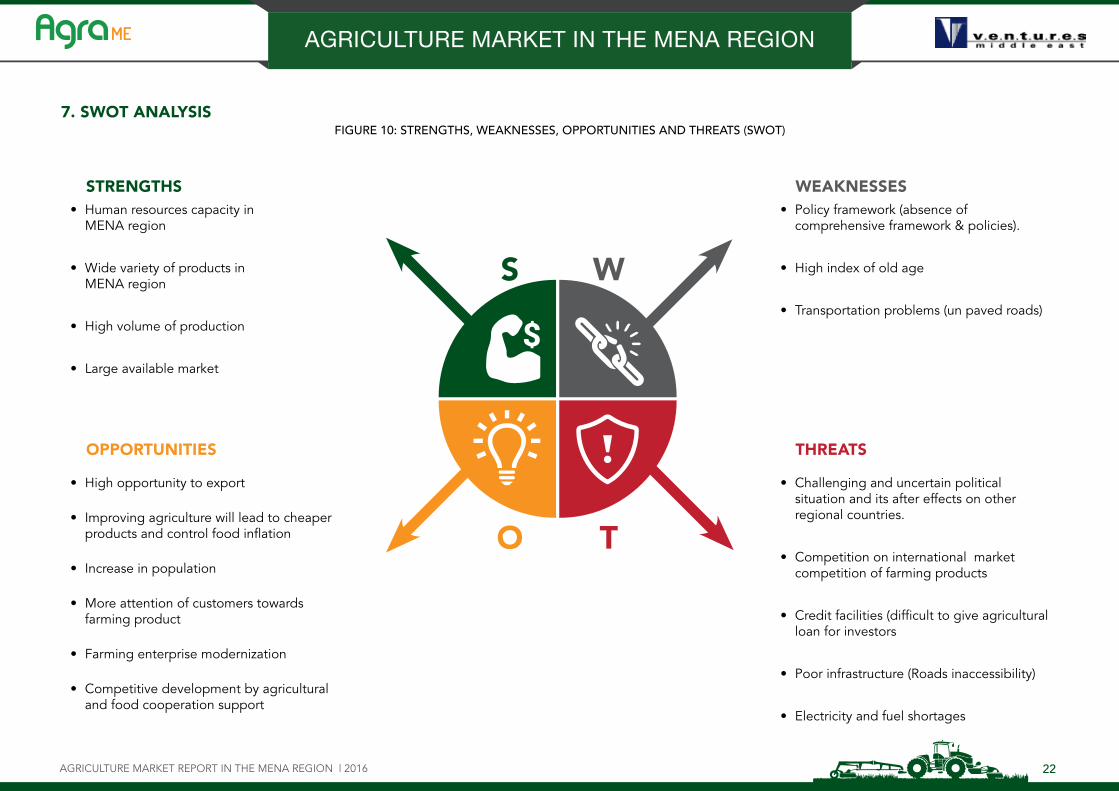
7. SWOT ANALYSISFIGURE 10: STRENGTHS, WEAKNESSES, OPPORTUNITIES AND THREATS (SWOT)
STRENGTHS• Human resources capacity in
MENA region
• Wide variety of products in MENA region
• High volume of production
• Large available market
OPPORTUNITIES
• High opportunity to export
• Improving agriculture will lead to cheaper products and control food inflation
• Increase in population
• More attention of customers towards farming product
• Farming enterprise modernization
• Competitive development by agricultural and food cooperation support
WEAKNESSES• Policy framework (absence of
comprehensive framework & policies).
• High index of old age
• Transportation problems (un paved roads)
THREATS
• Challenging and uncertain political situation and its after effects on other regional countries.
• Competition on international market competition of farming products
• Credit facilities (difficult to give agricultural loan for investors
• Poor infrastructure (Roads inaccessibility)
• Electricity and fuel shortages
S
O
W
T
AGRICULTURE MARKET IN THE MENA REGION

AGRICULTURE MARKET REPORT IN THE MENA REGION | 2016 23
8. OUTLOOK
High population growth in addition to rising incomes in MENA region is driving consumption demand as well as high imports. The rising demand sets a suitable platform for sound agricultural growth policies. However, the regional political stability raises question and has a deep impact of future planning for agriculture projects. Additionally, there exists high opportunities for inter trade among the MENA region, especially the GCC that have almost nil agriculture developments of its own and almost entirely depend on imports.
The figure below shows how investment is diversified and classified across MENA countries.
The agriculture market in the MENA region is expected to grow at accelerated pace and present lucrative opportunities for the investors in this market in the coming years.
FIGURE 11: INVESTMENT DIVERSITY AND FLEXIBILITY WITHIN MENA
Source: United Nations Statistical Division and Government Websites, (updated as of January 15 ‘2016)
FROM LOWER OIL PRICES IN MANUFACTURING & SERVICES
AGRICULTURE MARKET IN THE MENA REGION
10 - 12 APRIL 2017DUBAI INTERNATIONAL CONVENTION AND EXHIBITION CENTRE
THE MIDDLE EAST’S LARGEST TRADE EVENTDEDICATED TO AGRIBUSINESS, POULTRY & LIVESTOCK
+971 4 407 2606 [email protected] www.agramiddleeast.com
AGRICULTURE MARKET IN THE MENA REGION