
Personal Knowledge Management the Foundation of Organisational Knowledge Management

Advance Training Program
on
Agriculture Knowledge Management
Reading Material
NATIONAL INSTITUTE OF AGRICULTURAL EXTENSION MANAGEMENT
An organisation of Ministry of Agriculture, Government of India
Rajendranagar, Hyderabad – 500 030.
Tel. Nos. 040 – 4016702 – 706 : Fax 040 – 4015388
Website: www.manage.gov.in
2
CONTENT
1. Introduction to Knowledge Management 03
2. Agriculture Knowledge Management 08
3. ICTs in Agriculture: Experiences in India 11
4. Database Management 22
5. Overview of Expert Systems 30
6. Geographical Information Systems (GIS) 40
7. Remote Sensing (RS) Technology 58
8. List of Agricultural Websites 67
3
Introduction to Knowledge Management
Knowledge Management comprises of a range of strategies and practices
used in an organization to identify, create, represent, distribute, and enable adoption
of insights and experiences. Such insights and experiences comprise knowledge,
either embodied in individuals or embedded in organizational processes or practice.
Knowledge Management efforts typically focus on organizational objectives
such as improved performance, competitive advantage, innovation, sharing of
lessons learned, integration and continuous improvement of the organization. KM
efforts overlap with organizational learning, and may be distinguished from that by a
greater focus on the management of knowledge as a strategic asset and a focus on
encouraging the sharing of knowledge. KM efforts can help individuals and groups to
share valuable organizational insights, to reduce redundant work, to avoid
reinventing the wheel per se, to reduce training time for new employees, to retain
intellectual capital as employees turnover in an organization, and to adapt to
changing environments and markets.
Different frameworks for distinguishing between knowledge exist. One
proposed framework for categorizing the dimensions of knowledge distinguishes
between tacit knowledge and explicit knowledge. Tacit knowledge represents
internalized knowledge that an individual may not be consciously aware of, such as
how he or she accomplishes particular tasks. At the opposite end of the spectrum,
explicit knowledge represents knowledge that the individual holds consciously in
mental focus, in a form that can be easily communicated to others.
Early research suggested that a successful KM effort needs to convert
internalized tacit knowledge into explicit knowledge in order to share it, but the same
effort must also permit individuals to internalize and make personally meaningful any
codified knowledge retrieved from the KM effort. Subsequent research into KM
suggested that a distinction between tacit knowledge and explicit knowledge
represented an oversimplification and that the notion of explicit knowledge is
self-contradictory. Specifically, for knowledge to be made explicit, it must be
translated into information (i.e., symbols outside of our heads). Later on, Ikujiro
Nonaka proposed a model (SECI for Socialization, Externalization, Combination,
4
Internalization), which considers a spiraling knowledge process interaction between
explicit knowledge and tacit knowledge. In this model, knowledge follows a cycle in
which implicit knowledge is 'extracted' to become explicit knowledge, and explicit
knowledge is 're-internalized' into implicit knowledge. More recently, together with
Georg von Krogh, Nonaka returned to his earlier work in an attempt to move the
debate about knowledge conversion forward.
A second proposed framework for categorizing the dimensions of knowledge
distinguishes between embedded knowledge of a system outside of a human
individual (e.g., an information system may have knowledge embedded into its
design) and embodied knowledge representing a learned capability of a human
body’s nervous and endocrine systems.
A third proposed framework for categorizing the dimensions of knowledge
distinguishes between the exploratory creation of "new knowledge" (i.e. innovation)
vs. the transfer or exploitation of "established knowledge" within a group,
organization, or community. Collaborative environments such as communities of
practice or the use of social computing tools can be used for both knowledge
creation and transfer.
5
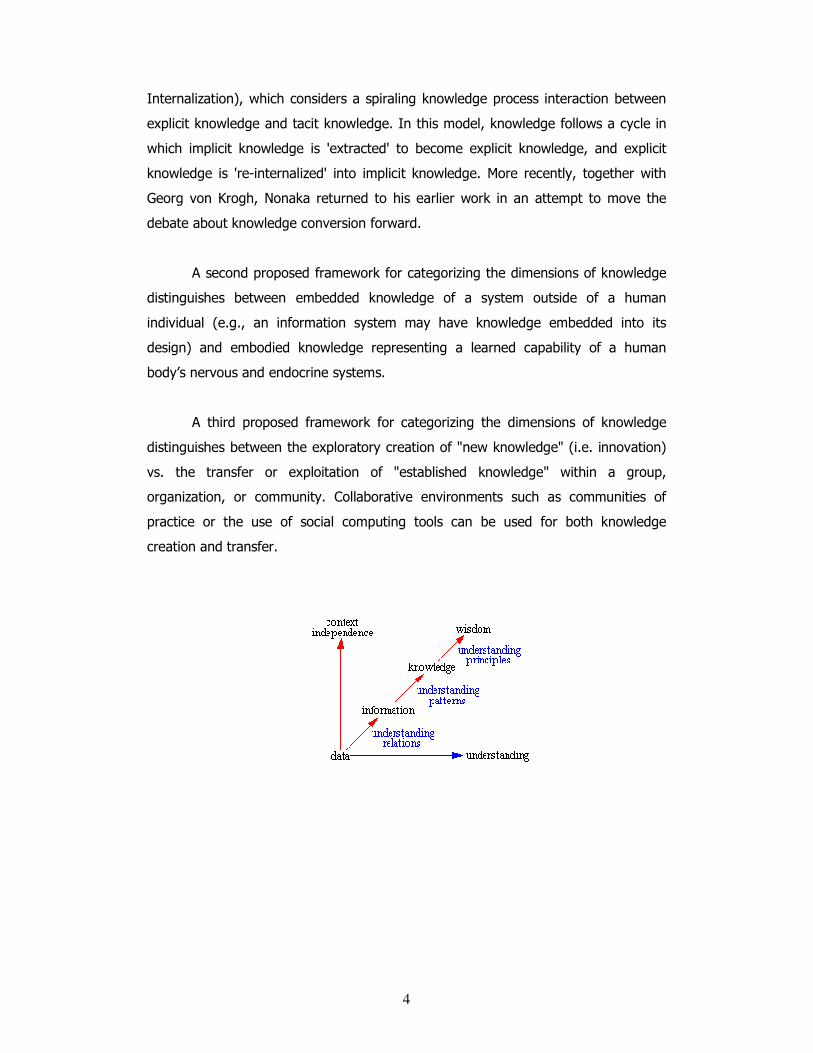
Before attempting to address the question of knowledge management, it's
probably appropriate to develop some perspective regarding this stuff called
knowledge, which there seems to be such a desire to manage, really is. Consider this
observation made by Neil Fleming as a basis for thought relating to the following
diagram.
A collection of data is not information.
A collection of information is not knowledge.
A collection of knowledge is not wisdom.
A collection of wisdom is not truth.
The idea is that information, knowledge, and wisdom are more than simply
collections. Rather, the whole represents more than the sum of its parts and has a
synergy of its own.
We begin with data, which is just a meaningless point in space and time,
without reference to either space or time. It is like an event out of context, a letter
out of context, a word out of context. The key concept here is "out of context." And,
since it is out of context, it is without a meaningful relation to anything else. When
we encounter a piece of data, if it gets our attention at all, our first action is usually
to attempt to find a way to attribute meaning to it. We do this by associating it with
other things. If I see the number 5, I can immediately associate it with cardinal
numbers and relate it to being greater than 4 and less than 6, whether this was
implied by this particular instance or not. If I see a single word, such as "time," there
is a tendency to immediately form associations with previous contexts within which I
have found "time" to be meaningful. This might be, "being on time," "a stitch in time
saves nine," "time never stops," etc. The implication here is that when there is no
context, there is little or no meaning. So, we create context but, more often than
not, that context is somewhat akin to conjecture, yet it fabricates meaning.
That a collection of data is not information, as Neil indicated, implies that a
collection of data for which there is no relation between the pieces of data is not
information. The pieces of data may represent information, yet whether or not it is
information depends on the understanding of the one perceiving the data. I would
also tend to say that it depends on the knowledge of the interpreter, but I'm
probably getting ahead of myself, since I haven't defined knowledge. What I will say
6
at this point is that the extent of my understanding of the collection of data is
dependent on the associations I am able to discern within the collection. And, the
associations I am able to discern are dependent on all the associations I have ever
been able to realize in the past. Information is quite simply an understanding of the
relationships between pieces of data, or between pieces of data and other
information.
While information entails an understanding of the relations between data, it
generally does not provide a foundation for why the data is, what it is, nor an
indication as to how the data is likely to change over time. Information has a
tendency to be relatively static in time and linear in nature. Information is a
relationship between data and, quite simply, is what it is, with great dependence on
context for its meaning and with little implication for the future.
Beyond relation there is pattern, where pattern is more than simply a relation
of relations. Pattern embodies both a consistency and completeness of relations,
which, to an extent, creates its own context. Pattern also serves as an Archetype
with both an implied repeatability and predictability.
When a pattern relation exists amidst the data and information, the pattern
has the potential to represent knowledge. It only becomes knowledge, however,
when one is able to realize and understand the patterns and their implications. The
patterns representing knowledge have a tendency to be more self-contextualizing.
That is, the pattern tends, to a great extent, to create its own context rather than
being context dependent to the same extent that information is. A pattern, which
represents knowledge, also provides, when the pattern is understood, a high level of
reliability or predictability as to how the pattern will evolve over time, for patterns
are seldom static. Patterns, which represent knowledge, have a completeness to
them that information simply does not contain.
Wisdom arises when one understands the foundational principles responsible
for the patterns representing knowledge being what they are. And wisdom, even
more so than knowledge, tends to create its own context. I have a preference for
referring to these foundational principles as eternal truths, yet I find people have a
tendency to be somewhat uncomfortable with this labeling. These foundational
7
principles are universal and completely context independent. Of course, this last
statement is sort of a redundant word game, for if the principle was context
dependent, then it couldn't be universally true, now could it? So, in summary the
following associations can reasonably be made:
• Information relates to description, definition, or perspective (what, who,
when, where).
• Knowledge comprises strategy, practice, method, or approach (how).
• Wisdom embodies principle, insight, moral, or archetype (why).
The Value of Knowledge Management
In an organizational context, data represents facts or values of results, and
relations between data and other relations have the capacity to represent
information. Patterns of relations of data and information and other patterns have
the capacity to represent knowledge. For the representation to be of any utility it
must be understood, and when understood the representation is information or
knowledge to the one that understands. Yet, what is the real value of information
and knowledge, and what does it mean to manage it?
In this example what needs to be managed to create value is the data that
defines past results, the data and information associated with the organization, it's
market, it's customers, and it's competition, and the patterns which relate all these
items to enable a reliable level of predictability of the future. What I would refer to
as knowledge management would be the capture, retention, and reuse of the
foundation for imparting an understanding of how all these pieces fit together, and
how to convey them meaningfully to some other person.
The value of Knowledge Management relates directly to the effectiveness
with which the managed knowledge enables the members of the organization to deal
with today's situations and effectively envision and create their future. Without on-
demand access to managed knowledge, every situation is addressed based on what
the individual or group brings to the situation with them. With on-demand access to
managed knowledge, every situation is addressed with the sum total of everything
anyone in the organization has ever learned about a situation of a similar nature.
Which approach would you perceive would make a more effective organization?
8
Agriculture Knowledge Management: Role of Information and Communication technology
The emergence of Information and Communication Technologies (ICT) in the
last decade has opened new avenues in knowledge management that could play
important roles in meeting the prevailing challenges related to sharing, exchanging
and disseminating knowledge and technologies. ICT allows capitalizing to a greater
extent on the wealth of information and knowledge available for Agriculture
Knowledge, Science and Technology (AKST). The ultimate objectives of AKST
activities are to come up with results that can advance research more in certain
areas, and engender technologies that AKST stakeholders can use to increase
production, conserve the environment, etc.
The first challenge is the poor mechanisms and infrastructure for sharing and
exchanging agriculture knowledge generated from research at national and regional
levels. Many research activities are repeated due to the lack of such mechanisms and
infrastructure at the national level. Researchers can find research papers published in
international journals and conferences more easily than finding research papers
published nationally in local journals, conferences, theses and technical reports. The
second challenge is the inefficient mechanisms and infrastructure for transferring
technologies produced as a result of research to growers either directly or through
intermediaries (extension subsystem). Knowledge and technologies fostering
agricultural production and environment conservation are examples. Although many
extension documents are produced by national agriculture research and extension
systems to inform growers about the latest recommendations concerning different
agricultural practices, these documents are not disseminated, updated or managed
to respond to the needs of extension workers, advisers and farmers. This is also true
for technical reports, books and research papers related to production. The third
challenge is keeping the indigenous knowledge as a heritage for new generations. It
is available through experienced growers and specialists in different commodities.
These inherited agricultural practices are rarely documented, but they embody a
wealth of knowledge that researchers need to examine thoroughly. The forth
challenge is easily accessing and availing economic and social knowledge to different
stakeholders at operational, management and decision-making levels, so that those
9
responsible will be able to make appropriate decisions regarding the profit making of
certain technologies and their effect on resource-poor farmers.
ICT Role in Agriculture Knowledge Management
Knowledge sharing, exchanging and dissemination are elements in a broader
theme which is knowledge management. The central purpose of knowledge
management is to transform information and intellectual assets into enduring value
(Metcalfe, 2005). The basic idea is to strengthen, improve and propel the
organization by using the wealth of information and knowledge that the organization
and its members collectively possess (Milton, 2003). It has been pointed out that a
large part of knowledge is not explicit but tacit (Schreiber et al., 1999). This is true
for knowledge in agriculture where a lot of good practices are transferred without
being well documented in books, papers or extension documents. To manage the
knowledge properly, ICT is needed. In effect, there are many information
technologies that can be used for knowledge management. The following paragraphs
describe these technologies and emphasize their roles in agriculture knowledge
management.
Content management system, in its wider sense, including data bases and
multimedia, is the core technology of information and knowledge management. This
technology can be used in different applications:
Building a national agriculture research information system (NARIS) needs to
include research outcomes, projects, institutions and researchers in every country,
and a regional research information system that works as a portal for all the NARIS.
Developing an information system of indigenous agricultural practices can enable
researchers to examine this knowledge and decide on its usefulness for sustainable
development. Such a system will also keep this knowledge for future generations
before it disappears as a result of advanced technologies. Developing an information
system and recording matured technologies on a trial basis have proven successful,
and success stories that have achieved economic growth will strengthen the
interaction between inventors and innovators. This will lead to an innovation-driven
economic growth paradigm.
10
Storing and retrieving images, videotapes and audiotapes related to different
agricultural activities are necessary. Geographic information systems (GIS) are
needed to store databases about natural resources with a graphical user interface
that enables users to access these data easily using geographical maps. Decision
support system techniques are needed in many applications viz. Simulating and
modeling methods can be used to build computer systems that can model and
simulate the effect of different agricultural production policies on the economy and
the environment to help top management make decisions. Using expert systems
technology to improve crop management and track its effect on conserving natural
resources are essential. Expediting the expert systems development by generating
agriculture specific tools to overcome the well known problem of knowledge is also
required.
Mining growers’ problems database, which is part of the Virtual Extension and
Research Communication Network (VERCON), to discover the best practices from the
solutions provided by the human experts and to find out whether there are any
discrepancies in their recommendations is necessary.
Modern ICT—Internet and Web technology—is needed to make these
systems available regionally and globally. Accessing the Internet will bring a wealth
of information to all agriculture stakeholders in rural and urban areas and will help in
overcoming the digital divide. As most farmers have no hands-on-experience or
access to digital networks, leaders of national agricultural research and extension
systems should be encouraged to consider the ICT option. Training farmers and
extension workers, including women, in ICT will help them access a lot of useful
information if each country tries to develop contents in the language people are
using.
11
IICCTT iinn AAggrriiccuullttuurree –– EExxppeerriieenncceess iinn IInnddiiaa
Information and Communication Technology (ICT) in agriculture is an
emerging field focusing on the enhancement of agricultural and rural development in
India. ICT is affecting all spheres of life. Due to the advancement in technologies,
high-speed reliable computers are available with huge storage capacities at an
affordable cost. Database and data warehousing technologies can be used to store
and retrieve large amount of information and also can be coupled with Mobile &
Internet Technologies to deliver information instantaneously to the community.
Development in ICTs has enabled the maintenance of huge and variety of
information (text, image, voice and video) repositories with negligible downtime that
can be quickly extracted by millions of users concurrently. Data mining technology is
being used to extract useful knowledge from huge databases. Now the research
challenge, here, is to identify the areas in agriculture where progress in ICT could be
used to improve the performance of farmers and farming technologies, and build
efficient ICT-based model / system that improves the living standards of farming
communities.
1. About Media Lab Asia
Media Lab Asia (MLAsia) has been set up by Department of Information
Technology, MCIT, Government of India as a company under section 25 of
Companies Act. MLAsia’s mission is to develop and deploy technological solutions
that are low-cost, accessible and relevant to the common citizen. As a result of
engagement over several years, MLAsia has acquired enough experience in
application of ICT for the grass roots development.
Media Lab Asia's application development is focused on use of ICT for
Healthcare, Education, Livelihood Enhancement and Empowerment of the disabled.
Modes of delivery of data/services being adopted by MLAsia primarily include ICT
tools such as Internet, mobile and satellite. In some cases, the services are being
delivered through centers also.
The importance of the Media Lab Asia projects is amply validated by the
recognition these have received from National and International agencies such as
MSJ&E, NASSCOM, DST-INTEL, National Award, CSI, MANTHAN in India & Stockholm
Challenger Society, DaVinci, UNESCO & WSIS at international level. With the help of
its 75+ projects Media Lab Asia is touching the lives of more than 1 million Indians.
12
Media Lab Asia has been working with a number of academic, R&D,
industry, Government and NGOs in its endeavour of technology development, field-
testing and deployment.
2. ICT in Agriculture: Innovative Models for Agri Communities
Media Lab Asia has been initiating various research and development
programs that leverage ICT to deliver information and advisory services to farming
community such as eSagu, aAqua, Deal, Agrosense, Integrated Agri Services
Program (IASP) etc. A brief of the major innovations / programs of Media Lab Asia
in the area of Agriculture are as follows:
2.1 e-Sagu: IT Based Personalized Agro Advisory System
The eSaguTM system is developed by Media Lab Asia with International
Institute of Information Technology (IIIT), Hyderabad. The eSaguTM is an IT-based
personalized agro advisory system. In this system, the agricultural experts generate
the advice by using the latest information about the crop situation received in the
form of both photographs and text. The agriculture expert advice is delivered to
each farm on a regular basis (typically once in a week/two weeks depending on the
type of crop) from the sowing stage to the harvesting stage to the farmer without
farmer asking a question. Since 2004, operating on several crops and farms in
Andhra Pradesh is developing the eSagu system. It has been found that the
agriculture expert can prepare the expert advice in an efficient manner based on the
crop photographs and the related information. The impact results show that the
expert advices helped the farmers to achieve significant savings in capital investment
and improvement in the yield.
2.1.1 Beneficiaries of eSagu:
(a) Farming Community (b) Rural youth employment (c) Financial Institutions (d)
Environment and (e) Researchers
2.1.2 Description of eSagu system and its architecture
Normally, in traditional agricultural extension system, agriculture expert
should visit the farm for delivering the expert advice of high quality. It is difficult to
build and operate eSagu by making agricultural expert to visit farms for delivering
the expert advice. However, by exploiting the advances in ICTs, it is possible for the
agriculture expert to deliver the expert advice to farm without visiting the farm. The
basic idea of eSagu is as follows: instead of agricultural expert visiting the farm, the
farm situation is brought to him/her in the form of both digital photographs and text
information. The agricultural expert analyzes the crop situation based on the
information thus brought-in and prepares the expert advice, which will be delivered
to the corresponding farmer on the same day (or subsequent day). Two options
exist for sending the photographs from the field. The first option is the farmers
13
themselves can send the photographs of his/her own farms. The other method is,
instead of individual farmers, educated and experienced farmers of the village can be
brought-in as mediators (field coordinators) who will capture and send the
photographs of a group of farms.
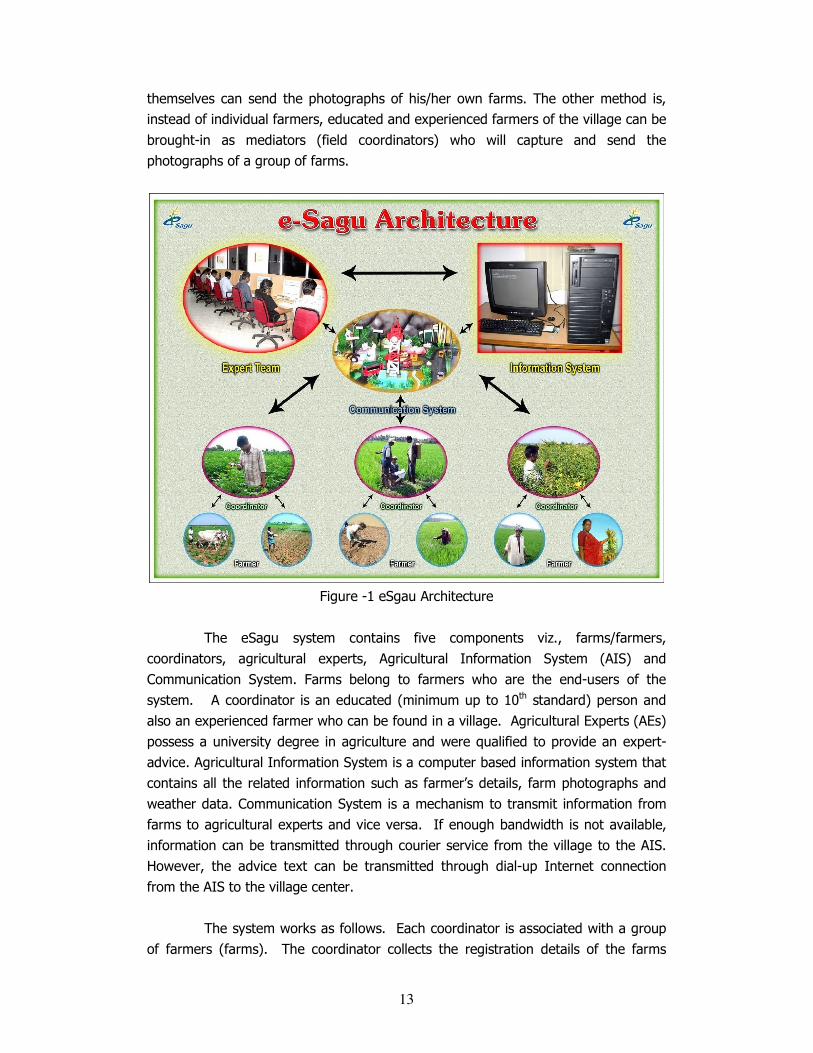
Figure -1 eSgau Architecture
The eSagu system contains five components viz., farms/farmers,
coordinators, agricultural experts, Agricultural Information System (AIS) and
Communication System. Farms belong to farmers who are the end-users of the
system. A coordinator is an educated (minimum up to 10th standard) person and
also an experienced farmer who can be found in a village. Agricultural Experts (AEs)
possess a university degree in agriculture and were qualified to provide an expert-
advice. Agricultural Information System is a computer based information system that
contains all the related information such as farmer’s details, farm photographs and
weather data. Communication System is a mechanism to transmit information from
farms to agricultural experts and vice versa. If enough bandwidth is not available,
information can be transmitted through courier service from the village to the AIS.
However, the advice text can be transmitted through dial-up Internet connection
from the AIS to the village center.
The system works as follows. Each coordinator is associated with a group
of farmers (farms). The coordinator collects the registration details of the farms
14
which he/she is associated with and sends the information to Agriculture Information
System (AIS). Also, a coordinator visits those farms at regular intervals and sends
the farm details in the form of digital photographs and textual information through
the communication system. By accessing the soil data, farmer's details, crop history,
crop manuals, and the information sent by the coordinators, the agriculture experts
prepare the expert advice. The coordinators get the advice by accessing the AIS
through Internet and deliver them to respective farmers.
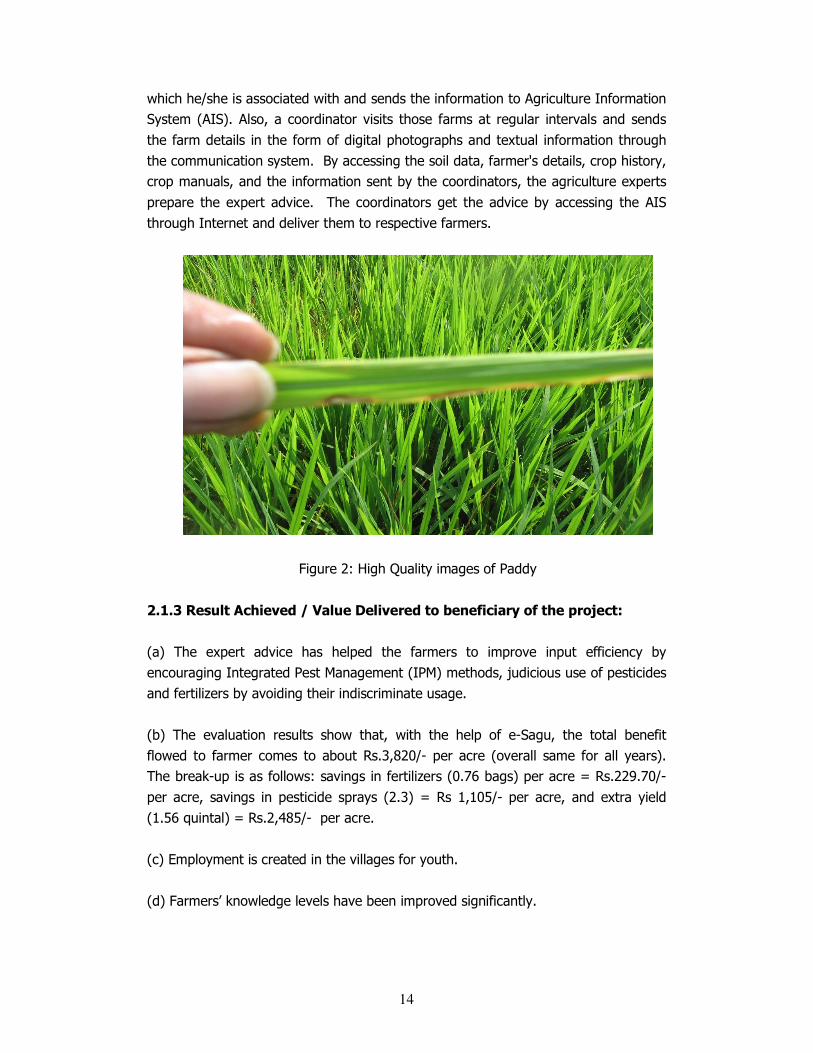
Figure 2: High Quality images of Paddy
2.1.3 Result Achieved / Value Delivered to beneficiary of the project:
(a) The expert advice has helped the farmers to improve input efficiency by
encouraging Integrated Pest Management (IPM) methods, judicious use of pesticides
and fertilizers by avoiding their indiscriminate usage.
(b) The evaluation results show that, with the help of e-Sagu, the total benefit
flowed to farmer comes to about Rs.3,820/- per acre (overall same for all years).
The break-up is as follows: savings in fertilizers (0.76 bags) per acre = Rs.229.70/-
per acre, savings in pesticide sprays (2.3) = Rs 1,105/- per acre, and extra yield
(1.56 quintal) = Rs.2,485/- per acre.
(c) Employment is created in the villages for youth.
(d) Farmers’ knowledge levels have been improved significantly.
15
2.1.4 Deployment details of eSagu
So far, the agri-expert team of eSagu lab has delivered more than Hundred
Thousand (100,000) expert advices to 17,000 farmers on 32 different crops covering
more than 200 villages in 7 districts of Andhra Pradesh. The aqua-expert team at
eSagu lab has delivered about 11,500 expert advices to 500 aqua farmers on both
fish and prawn. Besides agro-advisory, attempts are also being made to provide
input and financial services under franchisee model.
2.2 aAQUA: An Archived Multilingual Multimedia Question Answer based
Communication System
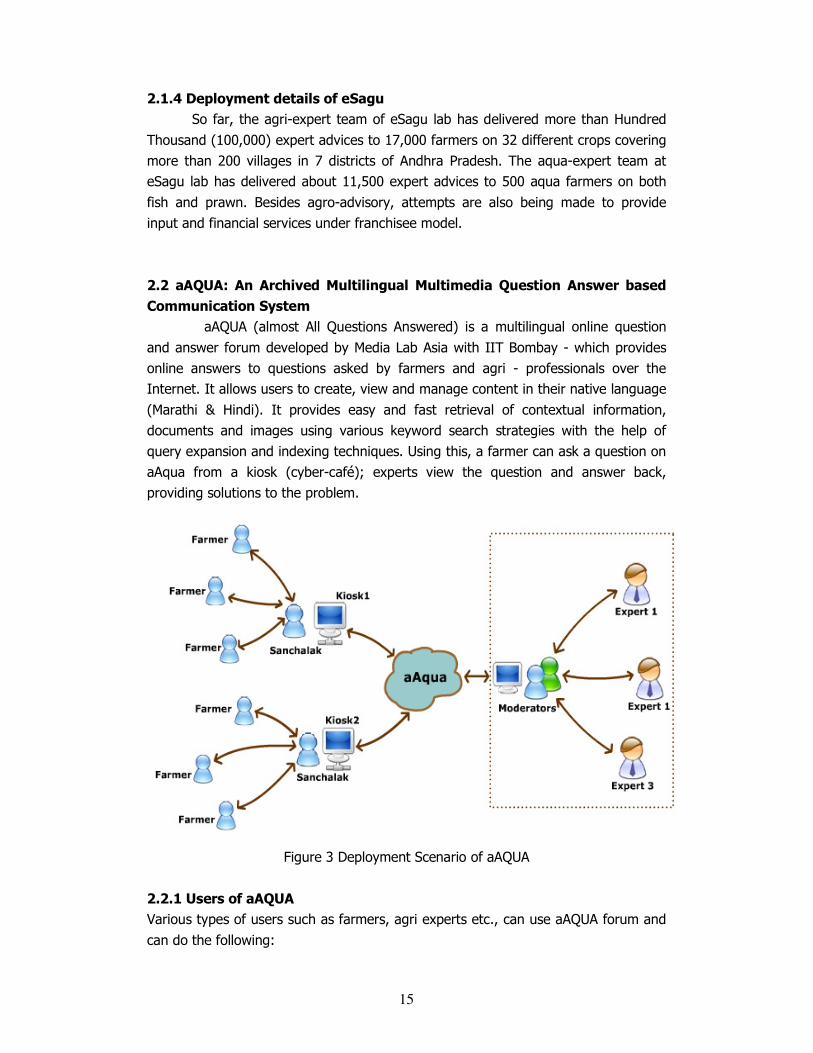
aAQUA (almost All Questions Answered) is a multilingual online question
and answer forum developed by Media Lab Asia with IIT Bombay - which provides
online answers to questions asked by farmers and agri - professionals over the
Internet. It allows users to create, view and manage content in their native language
(Marathi & Hindi). It provides easy and fast retrieval of contextual information,
documents and images using various keyword search strategies with the help of
query expansion and indexing techniques. Using this, a farmer can ask a question on
aAqua from a kiosk (cyber-café); experts view the question and answer back,
providing solutions to the problem.
Figure 3 Deployment Scenario of aAQUA
2.2.1 Users of aAQUA
Various types of users such as farmers, agri experts etc., can use aAQUA forum and
can do the following:
16
2.2.2 Farmers:
• Register online at the website and obtain a unique user id. All queries posted
by them will be under this User ID
• Post queries into a relevant category
• Upload picture files (GIF, JPG, etc.) to support their question. For example, a
farmer may post a picture of pest infestation on a plant to ask a question
like: “What is this pest and how do I eliminate this?” Picture file uploading is
optional, not mandatory.
• Read answers posted by experts to his query on a continuing basis. The
query and all expert answers are visible on a single HTML page.
• Read various queries in the archive for informational purposes.
• Search the archives to see if a similar query was posted before. If the farmer
is satisfied with that answer, he may decide not to post a new query.
2.2.3 Agri-Experts:
• Register as an expert at the website and obtain a unique User ID from the
admin team. All answers posted by them will be under this user id. Experts
will select one or more categories (forums) depending on their area of
expertise.
• Save an “Expert's Profile” along with contact information etc.
• They can also modify their profile at a later date.
• Submit answers to queries posted in their area of expertise.
• View a list of queries in their category as well as other categories.
• Upload pictures (GIF, JPG, etc.) to support their answers. Uploading of
pictures is optional, not mandatory.
• Include URL links in their answers to other sites/web-pages that are
relevant to the query being answered. This is because some sites may
contain an in-depth discussion of the subject matter of the query and it
may not be practical to reproduce it in their answer.
• The expert is also able to browse all the forums for informational purposes.
• Search functionality is provided so that the expert may search the archives.
2.2.4 Moderators:
• Move individual queries from one category to a different category. Farmers
may post queries to a wrong / inaccurate category. This facility allows
moderators to fix those errors. When a query is moved, its Query ID is not
changed.
• Monitor and filter out inappropriate content. If certain queries or answers
are inappropriate or offensive, the moderator can delete them.
• Intervene in the Forums to ensure that the discussion does not go off track.
• Modify and delete questions and answers.
17
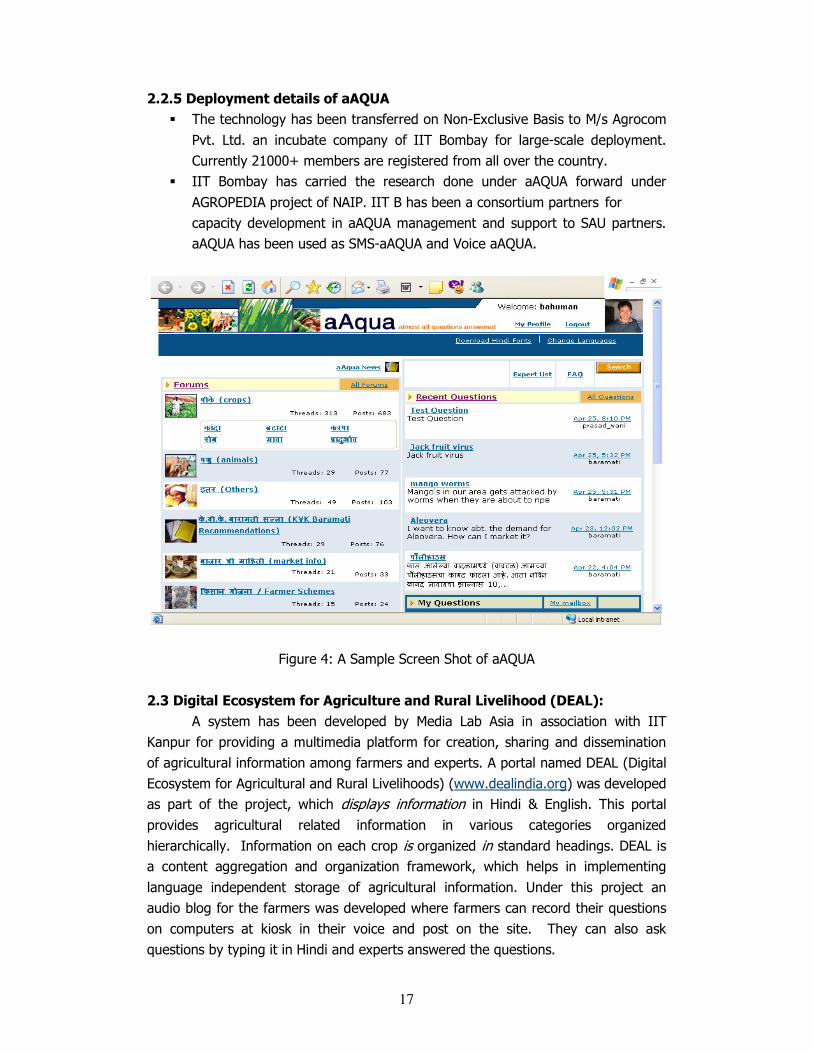
2.2.5 Deployment details of aAQUA
� The technology has been transferred on Non-Exclusive Basis to M/s Agrocom
Pvt. Ltd. an incubate company of IIT Bombay for large-scale deployment.
Currently 21000+ members are registered from all over the country.
� IIT Bombay has carried the research done under aAQUA forward under
AGROPEDIA project of NAIP. IIT B has been a consortium partners for
capacity development in aAQUA management and support to SAU partners.
aAQUA has been used as SMS-aAQUA and Voice aAQUA.
Figure 4: A Sample Screen Shot of aAQUA
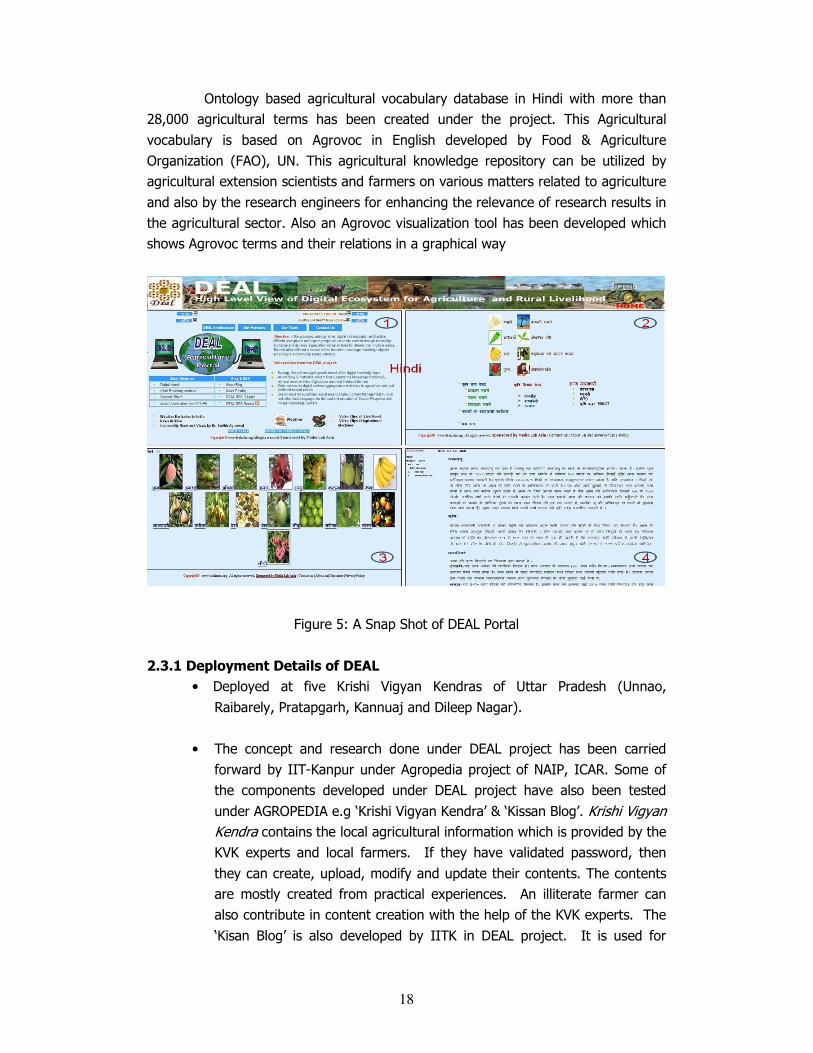
2.3 Digital Ecosystem for Agriculture and Rural Livelihood (DEAL):
A system has been developed by Media Lab Asia in association with IIT
Kanpur for providing a multimedia platform for creation, sharing and dissemination
of agricultural information among farmers and experts. A portal named DEAL (Digital
Ecosystem for Agricultural and Rural Livelihoods) (www.dealindia.org) was developed
as part of the project, which displays information in Hindi & English. This portal
provides agricultural related information in various categories organized
hierarchically. Information on each crop is organized in standard headings. DEAL is
a content aggregation and organization framework, which helps in implementing
language independent storage of agricultural information. Under this project an
audio blog for the farmers was developed where farmers can record their questions
on computers at kiosk in their voice and post on the site. They can also ask
questions by typing it in Hindi and experts answered the questions.
18
Ontology based agricultural vocabulary database in Hindi with more than
28,000 agricultural terms has been created under the project. This Agricultural
vocabulary is based on Agrovoc in English developed by Food & Agriculture
Organization (FAO), UN. This agricultural knowledge repository can be utilized by
agricultural extension scientists and farmers on various matters related to agriculture
and also by the research engineers for enhancing the relevance of research results in
the agricultural sector. Also an Agrovoc visualization tool has been developed which
shows Agrovoc terms and their relations in a graphical way
Figure 5: A Snap Shot of DEAL Portal
2.3.1 Deployment Details of DEAL
• Deployed at five Krishi Vigyan Kendras of Uttar Pradesh (Unnao,
Raibarely, Pratapgarh, Kannuaj and Dileep Nagar).
• The concept and research done under DEAL project has been carried
forward by IIT-Kanpur under Agropedia project of NAIP, ICAR. Some of
the components developed under DEAL project have also been tested
under AGROPEDIA e.g ‘Krishi Vigyan Kendra’ & ‘Kissan Blog’. Krishi Vigyan
Kendra contains the local agricultural information which is provided by the
KVK experts and local farmers. If they have validated password, then
they can create, upload, modify and update their contents. The contents
are mostly created from practical experiences. An illiterate farmer can
also contribute in content creation with the help of the KVK experts. The
‘Kisan Blog’ is also developed by IITK in DEAL project. It is used for
19
enhancing communication through audio format (both hearing and
speaking), so it is also called as the ‘Voice Blog’.
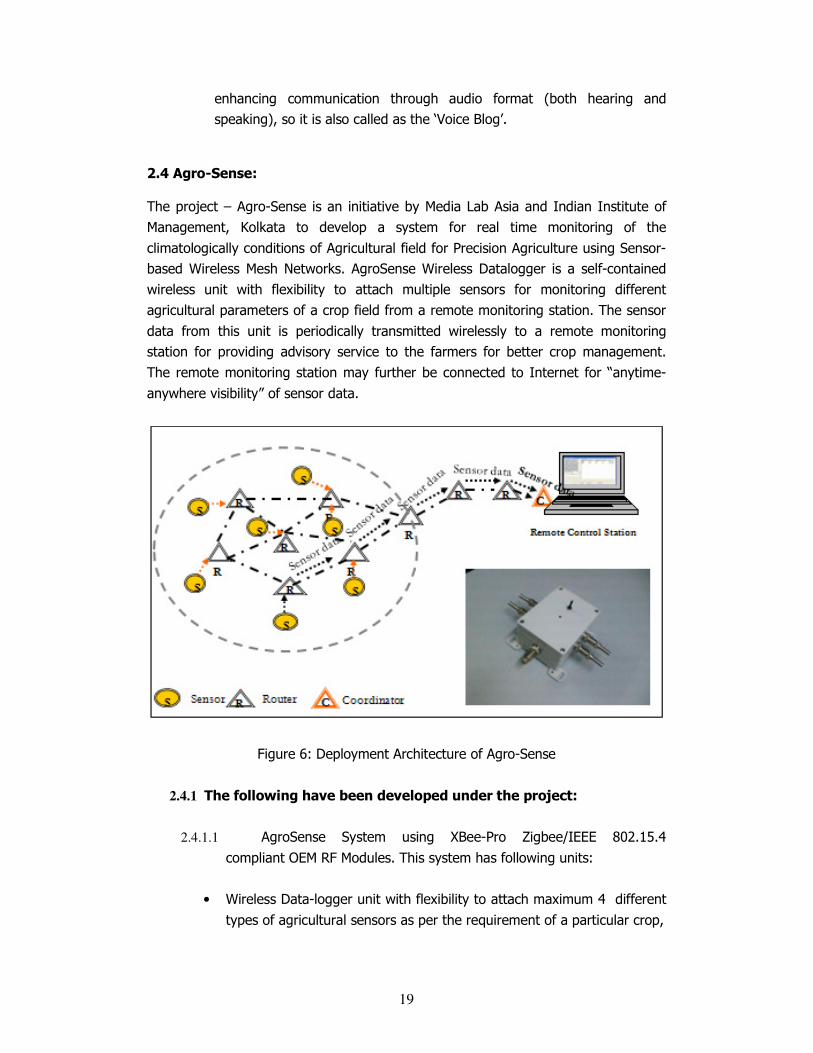
2.4 Agro-Sense:
The project – Agro-Sense is an initiative by Media Lab Asia and Indian Institute of
Management, Kolkata to develop a system for real time monitoring of the
climatologically conditions of Agricultural field for Precision Agriculture using Sensor-
based Wireless Mesh Networks. AgroSense Wireless Datalogger is a self-contained
wireless unit with flexibility to attach multiple sensors for monitoring different
agricultural parameters of a crop field from a remote monitoring station. The sensor
data from this unit is periodically transmitted wirelessly to a remote monitoring
station for providing advisory service to the farmers for better crop management.
The remote monitoring station may further be connected to Internet for “anytime-
anywhere visibility” of sensor data.
Figure 6: Deployment Architecture of Agro-Sense
2.4.1 The following have been developed under the project:
2.4.1.1 AgroSense System using XBee-Pro Zigbee/IEEE 802.15.4
compliant OEM RF Modules. This system has following units:
• Wireless Data-logger unit with flexibility to attach maximum 4 different
types of agricultural sensors as per the requirement of a particular crop,
20
• Long Range Wireless Router unit to relay sensor data from field to
remote monitoring station, and
• Coordinator unit attached to a host computer at the monitoring station
to receive sensor data relayed by the routers from the field.
2.4.1.2 Developed suitable firmware with proper sleep management
scheme and over-the-air parameterization feature for those devices.
This enables the user to change some of the parameters of sensor
nodes wirelessly like beacon interval, sensing interval etc.
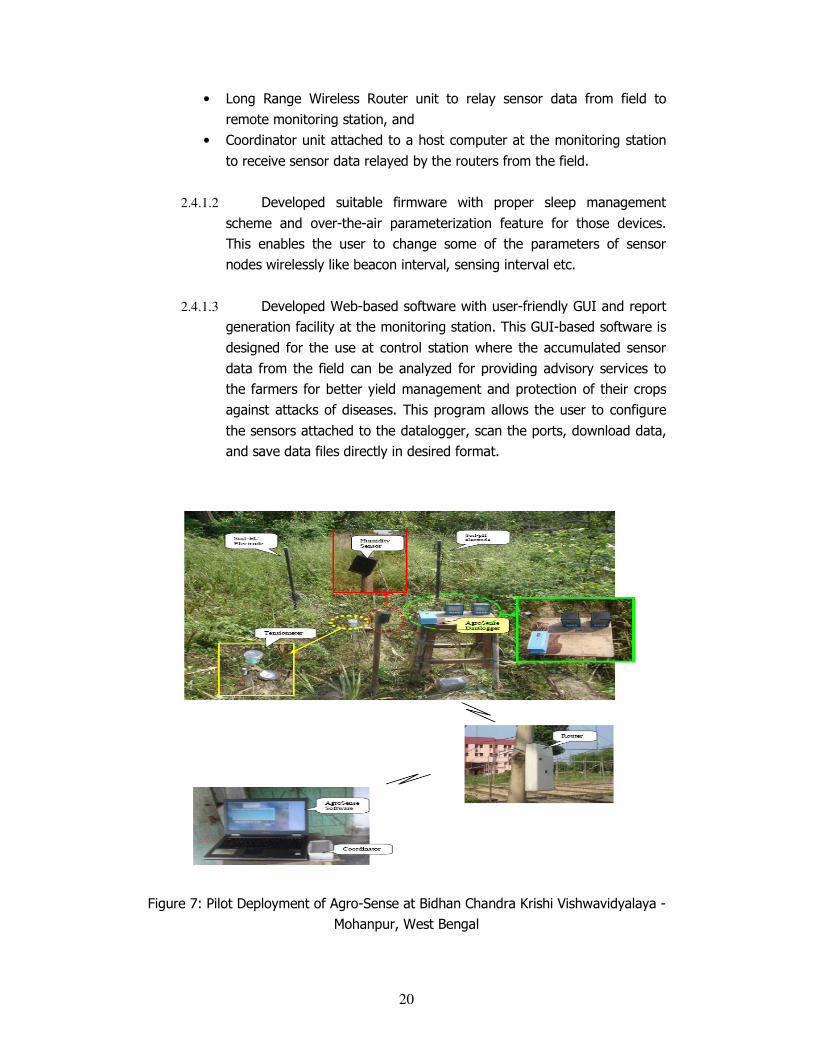
2.4.1.3 Developed Web-based software with user-friendly GUI and report
generation facility at the monitoring station. This GUI-based software is
designed for the use at control station where the accumulated sensor
data from the field can be analyzed for providing advisory services to
the farmers for better yield management and protection of their crops
against attacks of diseases. This program allows the user to configure
the sensors attached to the datalogger, scan the ports, download data,
and save data files directly in desired format.
Figure 7: Pilot Deployment of Agro-Sense at Bidhan Chandra Krishi Vishwavidyalaya -
Mohanpur, West Bengal
21
2.5 Development of Cost-Effective Solution for Community Radio Station
(CRS):
MLAsia recognizes that establishing rural radio forum is a potential G2C
Service in rural service delivery proposition. This can act as a ready medium for
awareness of IT related activities to grass-roots level. Radio covers large population
areas with low cost and in short span of time. Radio can cut across geographic,
cultural and literacy barriers. Given its availability, accessibility, cost-effectiveness
and power, radio represents a practical and creative medium for facilitating spread of
information in urban/rural settings. Recognizing this fact MLAsia had undertaken this
project to develop, engineer cost- effective solutions for Community Radio Stations
(CRS) & deployed the same in following five agricultural universities.
2.5.1 Major Achievements under the project
1000 hours of content in the fields of Agriculture & Allied Sciences; Women
& Child Empowerment; Health & Hygiene; Livelihood generation; Career Counseling
& Entertainment has been created. Training was imparted to 125 persons to make
them radio professionals (radio jockey). Two National-level Workshops on capacity
building for CRS were organized under this project. These workshops were attended
by more than 250 agricultural experts from SAUs & KVKs. Radio Broadcasting
Software (RBS) was developed for educational institutes and KVKs. RBS is simple,
easy to operate and fully integrated radio automation software which turns the PC
into a fully automated radio station.
Incorporating Community Radio as a part of extension program, was taken
up at the highest level in the Ministry of Agriculture. They have accepted that CRS
“would make a major contribution to Agricultural Extension by utilizing reach of
Radio transmission and disseminating information and knowledge produced locally”.
Ministry agreed to fund Community Radio Stations under the scheme “Support to
State Extension Programme of Food Extension Reforms”.
2.5.2 Deployment details of Community Radio Station
Community Radio Stations (CRS) have been deployed in five agricultural
universities viz. (i) Narendra Dev University of Agriculture & Technology, Faizabad;
(ii) Birsa Agriculture University, Ranchi; (iii) Indira Gandhi Agriculture University,
Raipur; (iv) Tamilnadu Agriculture University, Coimbatore; and (v) Chaudhary
Charan Singh Haryana Agricultural University, Hisar.
22
Database Management
1. Database
A database is a systematic collection of data arranged in columns and rows.
It can be used to quickly retrieve, sort and test data meeting specific criterion. In
database language, each row is called a record and each column a field. A database
is used to store large volumes of data.
2. Database Management Systems (DBMS)
A database management system is the software that functions as the
interface between users, other programs and the database itself. It allows the data
to be stored, maintained, manipulated and retrieved.
3. Features of DBMS
The DBMS permits the user to create, maintain and manipulate the
information stored within a file. These features are common to almost all database
packages.
1. Creating a file
2. Entering database records
3. Sorting
4. Deleting
5. Updating
4. Structure of database management packages The structure of DBMS is used to organize the data elements in three basic
ways:
1. Hierarchical database structure
2. Network database stricture
3. Relational database structure
5. Relational Database Management Systems (RDBMS)
A relational database management system is defined as a method of
viewing information from several, separate databases that relate to one another
through keywords or values.
23
Features of RDBMS
1. Tables
2. Queries
3. Forms
4. Reports
Excel as package for RDBMS
To some extent, Microsoft Excel also serves as database management
software, which stores data in the form of columns and rows. In Excel there are 256
columns and 65,536 rows.
Sort: Use the Sort dialog box to sort a range of selected cells. Sort by If you‘re sorting rows, select the first column to sort by. If you‘re sorting
columns, select the first row to sort by.
Then by Use this box if you‘re sorting by more than one column or row. After the
range is sorted by the column or row in the Sort By box, additional columns or rows
sort the range in sequence.
Ascending or Descending Click Ascending to sort the lowest number, the beginning of the alphabet,
or the earliest date first in the sorted range. Click Descending to sort the highest
number, the end of the alphabet, or the latest date first in the sorted range. Blank
cells are always sorted last.
Click Header row to exclude the first row from the sort if your list has
column labels in the uppermost row. Click No header row to include the first row in
the sort if the list doesn't have column labels in the uppermost row.
Filtering Filtering is a quick and easy way to find and work with a subset of data in a
range. A filtered range displays only the rows that meet the criteria (criteria:
Conditions you specify to limit which records are included in the result set of a query
24
or filter.) you specify for a column. Microsoft Excel provides two commands for
filtering ranges:
AutoFilter, which includes filter by selection, for simple criteria
Advanced Filter for more complex criteria. Unlike sorting, filtering does not
rearrange a range. Filtering temporarily hides rows you do not want displayed. When
Excel filters rows, you can edit, format, chart, and print your range subset without
rearranging or moving it.
PivotTable and PivotChart Wizard:
Use the PivotTable and PivotChart Wizard to create PivotTable reports and
PivotChart reports. PivotTable report: An interactive, cross tabulated Excel report
summarizes and analyzes data, such as database records, from various sources,
including those that are external to Excel.
PivotChart report: A chart that provides interactive analysis of data, like a
PivotTable report. You can change views of data, see different levels of detail, or
reorganize the chart layout by dragging fields and by showing or hiding items in
fields.
Perform a statistical analysis: Microsoft Excel provides a set of data analysis tools— called the Analysis
ToolPak— that you can use to save steps when you develop complex statistical or
engineering analyses. You provide the data and parameters for each analysis; the
tool uses the appropriate statistical or engineering macro functions and then displays
the results in an output table. Some tools generate charts in addition to output
tables.
1. On the Tools menu, click Data Analysis.
2. If Data Analysis is not available, load the Analysis ToolPak.
3. In the Tools menu, click Add-Ins.
4. In the Add-Ins available list, select the Analysis ToolPak box, and
then click OK.
5. If necessary, follow the instructions in the setup program.
25
6. In the Data Analysis dialog box, click the name of the analysis tool you
want to use, then click OK.
7. In the dialog box for the tool you selected, set the analysis options you
want.
Access databases:
A database is a collection of information that's related to a particular
subject or purpose, such as tracking customer orders or maintaining a music
collection. If your database isn't stored on a computer, or only parts of it are, you
may be tracking information from a variety of sources that you have to coordinate
and organize yourself. For example, suppose the phone numbers of your suppliers
are stored in various locations, in a card file containing supplier phone numbers, in
product information files in a file cabinet, and in a spreadsheet containing order
information. If a supplier's phone number changes, you might have to update that
information in all three places. In a database, however, you only have to update that
information in one place—the supplier's phone number is automatically updated
wherever you use it in the database.
Access database files Using Microsoft Access, you can manage all your information from a single
database file. Within the file, you can use:
Tables to store your data. Queries to find and retrieve just the data you want. Forms to view, add, and update data in tables. Reports to analyze or print data in a specific layout. Data access pages to view, update, or analyze the database's data from the Internet or an intranet.
Create an Access database Microsoft Access provides three methods to create an Access database.
1. Create a database by using a Database Wizard 2. Create a database by using a Template 3. Create a database without using a Database Wizard
SQL queries (MDB) Note: The information in this topic applies only to a Microsoft Access database (.mdb).
26
An SQL query is a query you create by using an SQL statement. You can
use Structured Query Language (SQL) to query, update, and manage relational
databases such as Microsoft Access. When you create a query in query Design view,
Access constructs the equivalent SQL statements behind the scenes for you. In fact,
most query properties in the property sheet in query Design view have equivalent
clauses and options available in SQL view. If you want, you can view or edit the SQL
statement in SQL view. However, after you make changes to a query in SQL view,
the query might not be displayed the way it was previously in Design view. Some
SQL queries, called SQL-specific queries, can't be created in the design grid. For
pass-through, data-definition, and union queries, you must create the SQL
statements directly in SQL view.
For sub-queries, you enter the SQL in the Field row or the Criteria row of
the query design grid. You can type an expression in an SQL SELECT statement, or
in WHERE, ORDER BY, GROUP BY, or HAVING clauses. You can also type an SQL
expression in several arguments and property settings. For example, you can use an
SQL expression as a:
Where Condition argument of the Open Form or Apply Filter action. Domain or criteria argument in a domain aggregate function
Role of Databases in Modern Agriculture Agenda • Need of Databases in different domain • Why Databases in Agriculture? • What is Power of Database? • Creating tables • Insertion / Deletion / Modification of tables • Extracting data from Tables
Databases in different domain
- In Production Industry – Employee database – Production database – Quality database and analysis – Sales analysis – Stock – Accounting
Service Industry
• Employee • Customer • Different types of services provided • Analysis of quality service given • Accounting
27
Education • Employee • Student • Library • Academics • Results
Databases in Agriculture
• Farmer level Database • Research level Database • Production level Database
Farmer level Database
• Land type • Cultivation of Crops • Yield of Crops in specific type of land • Quality of Grown crops • Income / Expenditure
Research level Database
• Quality and type of soil • Crop grown • Yield of crop • Quality of crop • Fertilizers used • pesticides used to grow
Production level Database
• General report of each crop in different areas • Analysis of the grown crop • Local level, State level, Center level
Power of Database
• Store the information permanently • Extracting the Information in required way • Manipulation of Data stored • Dynamic data updation
How to create tables?
• Problem definition: An investor is looking for the lands wherein he can invest and get the profit.
• The investor maintains the information of different formats, size of available land, soil type, location, source of irrigation, labor availability, crops grown in different area
• The investor makes proper investment depending on his convenience and the information about the farmers.
• Question comes how he can maintain the information?? – Files? – Spread sheets?
• What is wrong with Files and Spread Sheets?
28
• In the File, random information is stored; no structured information is maintained.
• When information itself is not structured, then accessing is very difficult (Find sanjivini in mountain)
• Spread sheet information is stored in proper structure; no tool which retrieves in Proper format
So the DATABASE
• Information is stored in structured manner • Information access is easy and Fast • Secured • Concurrent access • Identify the information attributes to be stored in database • Normalize the identified attributes • Create tables
Identify the attributes Investor identifies the following attributes
• Farmers • Size of available land • Soil type • Location • Source of irrigation • Labour availability • Crops grown
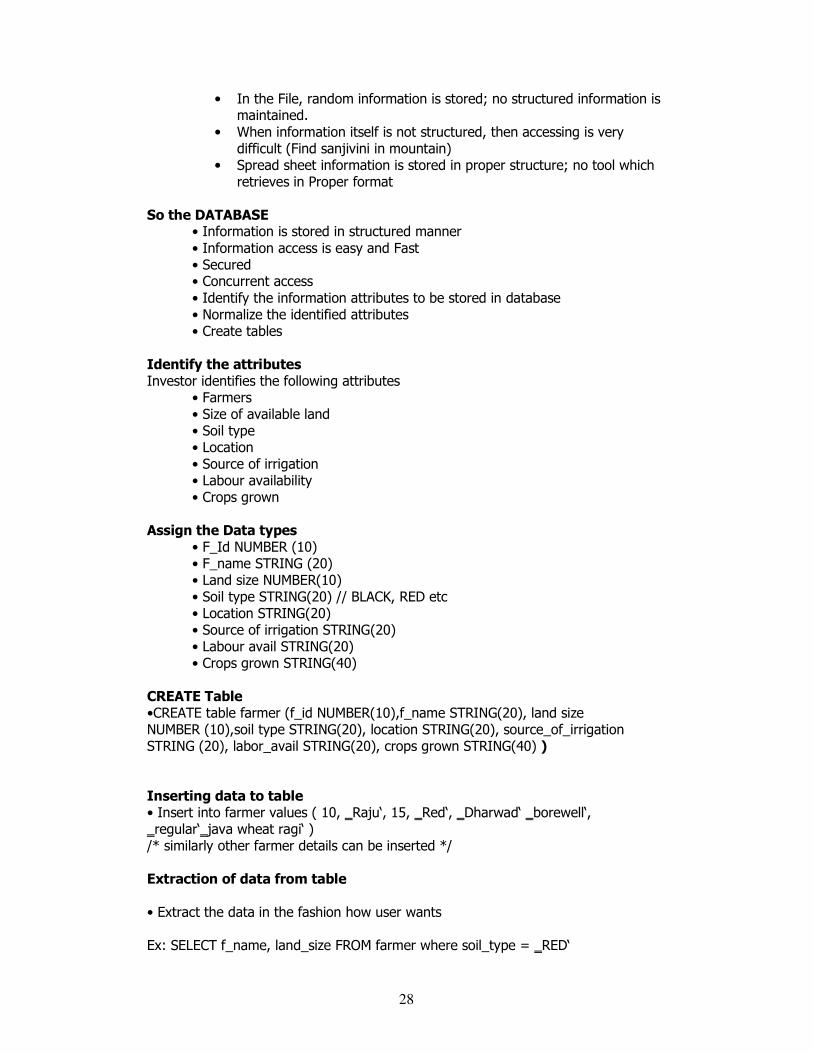
Assign the Data types
• F_Id NUMBER (10) • F_name STRING (20) • Land size NUMBER(10) • Soil type STRING(20) // BLACK, RED etc • Location STRING(20) • Source of irrigation STRING(20) • Labour avail STRING(20) • Crops grown STRING(40)
CREATE Table •CREATE table farmer (f_id NUMBER(10),f_name STRING(20), land size NUMBER (10),soil type STRING(20), location STRING(20), source_of_irrigation STRING (20), labor_avail STRING(20), crops grown STRING(40) ) Inserting data to table • Insert into farmer values ( 10, ‗Raju‘, 15, ‗Red‘, ‗Dharwad‘ ‗borewell‘, ‗regular‘‗java wheat ragi‘ ) /* similarly other farmer details can be inserted */ Extraction of data from table • Extract the data in the fashion how user wants Ex: SELECT f_name, land_size FROM farmer where soil_type = ‗RED‘
29
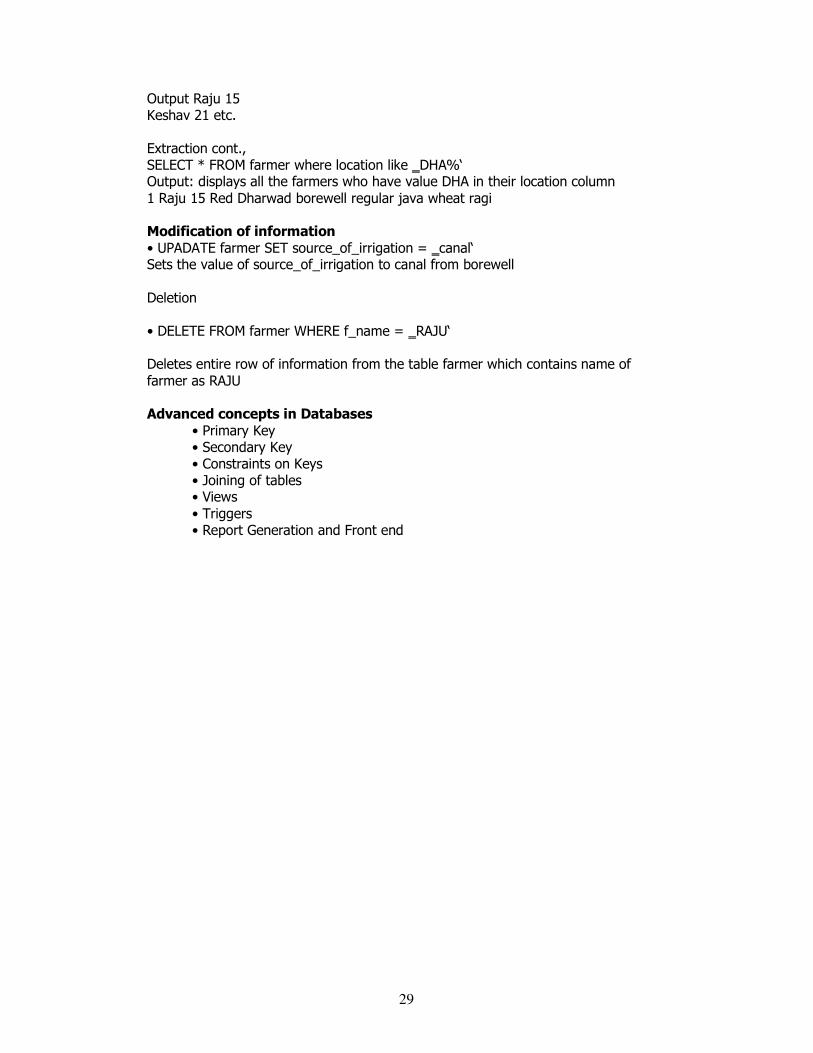
Output Raju 15 Keshav 21 etc. Extraction cont., SELECT * FROM farmer where location like ‗DHA%‘ Output: displays all the farmers who have value DHA in their location column 1 Raju 15 Red Dharwad borewell regular java wheat ragi Modification of information
• UPADATE farmer SET source_of_irrigation = ‗canal‘ Sets the value of source_of_irrigation to canal from borewell Deletion • DELETE FROM farmer WHERE f_name = ‗RAJU‘ Deletes entire row of information from the table farmer which contains name of farmer as RAJU Advanced concepts in Databases
• Primary Key • Secondary Key • Constraints on Keys • Joining of tables • Views • Triggers • Report Generation and Front end
30
Overview of Expert Systems
An expert system is a software application that attempts to reproduce the
performance of one or more human experts. Expert systems are mostly based on a
specific problem domain, and are a traditional application of artificial intelligence.
The expert system is used to behave like a human expert to solve the problem with
the help of pre-set conditions in the software application. A wide variety of methods
can be used to simulate the performance of the expert, which are:(1) Creation of
"knowledge base" which uses some knowledge representation formalism to capture
the subject matter experts’ (SME) knowledge and (2) A process of gathering that
knowledge from the SME and codifying it according to the formalism, which is called
knowledge engineering. Expert systems may or may not have learning components
but a third common element is that once the system is developed it is proven by
being placed in the same real world problem solving situation as the human SME,
typically as an aid to human workers or a supplement to some information system.
As a premiere application of computing and artificial intelligence, the topic
of expert systems has many points of contact with general systems theory,
operations research, business process reengineering, various topics in applied
mathematics, management science and also agriculture sector.
Expert systems, particularly in agriculture sector, can be used effectively to
provide proper advice to the farmers in the area of nutrition management, pest
control system, selection of crop based on soil and water availability and many more.
Overview
The most common form of expert system is a computer program, with a
set of rules, which analyzes information usually supplied by the user of the system
about a specific class of problems, and recommends one or more courses of user
action. The expert system may also provide logical or mathematical analysis of the
problem. The expert system utilizes what appears to be reasoning capabilities to
reach conclusions.
A related term is wizard. A wizard is an interactive computer program that
helps a user solve a problem. Originally the term wizard was used for programs that
31
construct a database search query based on criteria supplied by the user. However,
some rule-based expert systems are also called wizards. Other "Wizards" are a
sequence of online forms that guide users through a series of choices that matches
with the user expectations or diagnosis.
Concepts and Importance of Expert Systems
The branch of computer science, known as Artificial Intelligence (AI),
covers a number of different fields of application. Expert system is one such field
that has attracted significant attention in recent years. Expert systems have been
developed and applied to many fields such as office automation, science, medicine
and agriculture.
Knowledge representation is an issue that arises in both cognitive science
and artificial intelligence. In cognitive science, it is concerned with how people store
and process information. In AI, the primary aim is to store knowledge so that
programs can process it and achieve the verisimilitude of human intelligence. AI
researchers have borrowed representation theories from cognitive science. Thus,
there are representation techniques such as frames, rules and semantic networks,
which have originated from theories of human information processing. Since
knowledge is used to achieve intelligent behavior, the fundamental goal of
knowledge representation is to represent knowledge in a manner as to facilitate
inferencing i.e. drawing conclusions from knowledge.
Knowledge engineers are concerned with the representation chosen for the
expert's knowledge declarations and with the inference engine used to process that
knowledge. A user can use the knowledge acquisition component of the expert
system to input the several characteristics known to be appropriate to a good
inference technique. These are:
� A good inference technique is independent of the problem domain.
� In order to realize the benefits of explanation, knowledge transparency, and
reusability of the programs in a new problem domain, the inference engine
must not contain domain specific expertise.
32
� Inference techniques may be specific to a particular task, such as diagnosis of
hardware configuration. Other techniques may be committed only to a
particular processing technique.
� Inference techniques are always specific to the knowledge structures.
� Successful examples of rule processing techniques are forward chaining and
backward chaining.
Importance of Expert Systems
The complexity of problems faced by farmers are - yield losses, soil erosion,
selection of crop, increasing chemical pesticides’ costs and pest resistance,
diminishing market prices due to international competition, and economic barriers
hindering adoption of farming strategies. The farmer may not become expert
manager of all these aspects of their farming operations. On the other hand,
agricultural researchers need to address problems of farm management and discover
new management strategies to promote farm success. Numerical methods have
failed to provide better solutions because understanding about crop systems are
qualitative, based on experience and cannot be mathematically represented. Expert
systems are computer programs that are different from conventional computer
programs as they solve problems by mimicking human reasoning processes, relying
on logic, belief, rules of thumb opinion and experience. The experience and
knowledge of scientist and SMS will be used to develop expert system on various
issues of agriculture, which will be a handy advisory support system to the farmers.
In agriculture, expert systems are capable of integrating the perspectives of
individual disciplines such as plant pathology, entomology, horticulture and
agricultural meteorology into a framework that best addresses the type of ad hoc
decision-making required of modern farmers. Expert systems can be one of the
most useful tools for accomplishing the task of providing growers with the day-to-
day integrated decision support needed to grow their crops.
Components of Expert Systems
Expert systems are composed of several basic components such as a user
interface, a database, a knowledge base, and an inference mechanism. Moreover,
expert system development usually proceeds through several phases including
33
problem selection, knowledge acquisition, knowledge representation, programming,
testing and evaluation.
User interface
The function of the user interface is to present questions and information to
the user and supplies the user's responses to the inference engine. The questions
are mostly in the form of visuals that are developed as images, animation clips, and
video clips. Any values entered by the user must be received and interpreted by the
user interface. Some responses are restricted to a set of possible legal answers,
others are not. The user interface checks all responses to ensure that they are of the
correct data type. Any responses that are restricted to a legal set of answers are
compared against these legal answers. Whenever the user enters an illegal answer,
the user interface informs the user that his answer was invalid and prompts him to
correct it.
Knowledge base
The knowledge the expert uses to solve a problem must be represented in
a fashion that can be used to code into the computer and then be available for
decision making by the expert system. There are various formal methods for
representing knowledge and usually the characteristics of a particular problem will
determine the appropriate representation techniques employed.
The knowledge base is a collection of rules or other information structures
derived from the human expert. Knowledge bases can be represented by production
rules. These rules consist of a condition or premise followed by an action or
conclusion (IF condition...THEN action). Production rules permit the relationships
that makeup the knowledge base to be broken down into manageable units. Having
a knowledge base that consists of hundreds or thousands of rules can cause a
problem with management and organization of the rules. Organizing rules and
visualizing their interconnectedness can be accomplished through dependency
networks. The knowledge base can be used to good relational database
management systems (DBMS) like Oracle, SQL Server, MySQL, Access databases to
develop the rule base, and the query system can be used to retrieve the knowledge
from DBMS systems.
34
Inference mechanism
The inference mechanism will be integrated as a software program
(inference engine), the part of the program containing reasoning capability. It
interacts with a knowledge base (IF…THEN…ELSE statements), which contains
information about how to solve problems within the problem domain. This is the
global memory where the knowledge based system records information relating to a
specific problem that it is trying to solve. Much of this information comes from the
user but the inference engine to record its own conclusions and to remember its
chain of reasoning also uses the memory. By comparing what it knows about the
problem domain in general with what it knows about the specific problem, the
inference engine tries to proceed logically towards a better solution.
Inference rule
An understanding of the "inference rule" concept is important to
understand expert systems. An inference rule is a statement that has two parts, an
‘if-clause’ and a ‘then-clause’. This rule is what gives expert systems the ability to
find solutions to diagnostic and prescriptive problems. An example of an inference
rule is:
If the symptom of crop is X, Then the nutrition deficiency is Y.
An expert system's rule base is made up of many such inference rules.
They are entered as separate rules and it is the inference engine that uses them
together to draw conclusions. Because each rule is a unit, rules may be deleted or
added without affecting other rules though it should affect which conclusions are
reached. One advantage of inference rules over traditional programming is that
inference rules use reasoning, which more closely resembles human reasoning.
Thus, when a conclusion is drawn, it is possible to understand how this conclusion
was reached. Furthermore, because the expert system uses knowledge in a form
similar to the expert, it may be easier to retrieve this information from the expert.
The knowledge that is represented in the system appears in the rule base.
In the rule base, described in the cross-referenced applications, there are basically
four different types of objects, with associated information present.
35
Classes--these are questions asked to the user
Parameters- a parameter is a placeholder for a character string, which may
be a variable that can be inserted into a class question at the point in the question
where the parameter is positioned.
Procedures--these are definitions of calls to external procedures
Rule Nodes--The inferencing in the system is done by a tree structure,
which indicates the rules or logic that mimics human reasoning. The nodes of these
trees are called rule nodes. There are several different types of rule nodes.
The rule base comprises a forest of many trees. The top node of the tree is
called the goal node, in that it contains the conclusion. Each tree in the forest has a
different goal node. The leaves of the tree are also referred to as rule nodes, or one
of the types of rule nodes. A leaf may be an evidence node, an external node, or a
reference node. An evidence node functions to obtain information from the operator
by asking a specific question. In responding to a question presented by an evidence
node, the operator is generally instructed to answer “yes” or “no” represented by
numeric values 1 and 0 or provides a value of between 0 and 1.
Designing Expert Systems for problem solving
The architecture of expert systems consists of following steps:
1. The sequence of steps taken to reach a conclusion is dynamically synthesized
with each new case. It is not explicitly programmed when the system is built.
2. Expert systems can process multiple values for any problem parameter. This
permits more than one line of reasoning to be pursued and the results of
incomplete reasoning to be presented.
3. Problem solving is accomplished by applying specific knowledge rather than
specific technique. This is a key idea in expert systems technology. It reflects
the belief that human experts do not process their knowledge differently from
others, but they do possess different knowledge. With this philosophy, when
one finds that their expert system does not produce the desired results, work
begins to expand the knowledge base, not to re-program the procedures.
36
There are various expert systems in which a rule base and an inference
engine cooperate to simulate the reasoning process that a human expert pursues in
analyzing a problem and arriving at a conclusion. In these systems, in order to
simulate the human reasoning process, a vast amount of knowledge needed to be
stored in the knowledge base. Generally, the knowledge base of such an expert
system consisted of a relatively large number of "if then" type of statements that
were interrelated in a manner that, in theory at least, resembled the sequence of
mental steps that were involved in the human reasoning process.
Because of the need for large storage capacities and related programs to
store the rule base, most expert systems have, in the past, been run only on large
information handling systems. Recently, the storage capacity of personal computers
has increased to a point where it is becoming possible to consider running some
types of simple expert systems on personal computers.
In some applications of expert systems, the nature of the application and
the amount of stored information, necessary to simulate the human reasoning
process for that application, is just too vast to store in the active memory of a
computer. In other applications of expert systems, the nature of the application is
such that not all of the information is always needed in the reasoning process. An
example of this latter type application would be the use of an expert system to
diagnose a data processing system comprising many separate components, some of
which are optional. When that type of expert system employs a single integrated rule
base to diagnose the minimum system configuration of the data processing system,
much of the rule base is not required since many of the components which are
optional units of the system will not be present in the system.
When the rule base is segmented, preferably into contextual segments or
units, it is then possible to eliminate portions of the rule base containing data or
knowledge that is not needed in a particular application. The segmenting of the rule
base also allows the expert system to be run with systems or on systems having
much smaller memory capacities than was possible with earlier arrangements, since
each segment of the rule base can be paged into and out of the system as needed.
The segmenting of the rule base into contextual segments requires that the
expert system manage various intersegment relationships as segments are paged
37
into and out of memory during execution of the program. Since the system permits a
rule base segment to be called and executed at any time during the processing of
the first rule base, provision must be made to store the data that has been
accumulated up to that point so that at some time later in the process, when the
system returns to the first segment, it can proceed from the last point or rule node
that was processed. Also, provision must be made so that data that has been
collected by the system up to that point can be passed to the second segment of the
rule base after it has been paged into the system, and data collected during the
processing of the second segment can be passed to the first segment when the
system returns to complete processing of that segment.
The user interface and the procedure interface are two important functions
in the information collection process.
End user
The end-user usually sees an expert system through an interactive dialog,
an example of which follows:
Q. Do you know which restaurant you want to go to? A. No Q. Is there any kind of food you would particularly like? A. No Q. Do you like spicy food? A. No Q. Do you usually take soft drink with meals? A. Yes
As can be seen from this dialog, the system is leading the user through a
set of questions, the purpose of which is to determine a suitable set of restaurants to
recommend. This dialog begins with the system asking if the user already knows the
restaurant choice (a common feature of expert systems) and immediately illustrates
a characteristic of expert systems; users may choose not to respond to any question.
In expert systems, dialogs are not pre-planned. There is no fixed control structure.
Dialogs are synthesized from the current information and the contents of the
knowledge base. Because of this, not being able to supply the answer to a particular
question does not stop the consultation.
During the consultation, the rule base is searched for conditions that can be
satisfied by facts supplied by the user. The inference engine performs this operation.
Once all of the conditions (i.e. IF parts of rules) of a rule are matched, the rule is
executed and appropriate conclusion is drawn. Based upon the conclusions drawn
38
and the facts obtained during consultation, the inference mechanism determines
which questions will be asked and in what order. There are various inferencing
methods available to perform the tasks of searching, matching and execution.
A distinctive characteristic of expert systems that distinguishes them from
conventional programs is their ability to utilize incomplete or incorrect data. Given
only a partial data set, an expert is likely to have less than absolute certainty in his
conclusion. The degree of certainty can be quantified in relative terms and included
in the knowledge base. The expert assigns the certainty values during the knowledge
acquisition phase of developing the system. By incorporating rules in the knowledge
base with different certainty values, the system will be able to offer solutions to
problems without a complete set of data. The capacity to deal with uncertainty is
available in development software.
Advantages and disadvantages of Expert Systems
Advantages
� Expert Systems are useful in many aspects and ready to use by end user as
advisory system.
� Provides consistent answers for repetitive decisions, processes and tasks.
� Holds and maintains significant levels of information.
� Encourages human expert to clarify and finalise the logic of their decision-
making.
� Never "forgets" to ask a question, as a human might.
Disadvantages
� Lacks common sense needed in some decision making.
� Cannot make creative responses as human expert would in unusual
circumstances.
� Domain experts not always able to explain their logic and reasoning.
� Cannot adapt to changing environments, unless knowledge base is changed.
Cases of Expert Systems in Agriculture
A. Rice-Crop Doctor
39
National Institute of Agricultural Extension Management has developed an
expert system to diagnose pests and diseases for rice crop and suggest preventive or
curative measures. The expert knowledge on rice pathology and entomology has
been obtained from Scientists of Directorate of Rice Research (DRR) and A.P.
Agricultural University (APAU). The Rice-Crop Doctor illustrates the use of expert
systems broadly in the area of rice production through development of a prototype,
taking into consideration a few major pests and diseases and some deficiency
problems limiting rice yield.
The following diseases and pests have been included in the system for
identification and suggesting preventive and curative measures. The diseases
included are rice blast, brown spots, sheath blight, rice tungro virus, false smut
fungi, bacterial leaf blight, sheath rot and zinc deficiency disease. The pests included
are stem borers, rice gall midge, brown plant hopper, rice leaf folder, green
leafhopper and Gundhi bug.
The brief logic flow of the expert system is as follows: the extension officer gives the
part of the plant where symptoms have been observed:
� The basic symptoms are given as input � Considering these symptoms, the user is expected to give further information
based on other visual symptoms � At this step the disease and pest are identified
� The user is then given the option to either stop or further diagnose and other
disease / pest or get preventive or curative measures on these.
40
Geographical Information Systems
Introduction
Geographical Information System (GIS) is a technology that provides the
means to collect and use geographic data to assist in the development of Agriculture.
A digital map is generally of much greater value than the same map printed on a
paper as the digital version can be combined with other sources of data for analyzing
information with a graphical presentation. The GIS software makes it possible to
synthesize large amounts of different data, combining different layers of information
to manage and retrieve the data in a more useful manner. GIS provides a powerful
means for agricultural scientists to deliver better services to the farmers and farming
community in answering their queries and helping in better decision making to
implement planning activities for the development of agriculture.
Overview of GIS
A Geographical Information System (GIS) is a system for capturing, storing,
analyzing and managing data and associated attributes, which are spatially
referenced to the Earth. The geographical information system is also called as a
geographic information system or geospatial information system. It is an information
system capable of integrating, storing, editing, analyzing, sharing, and displaying
geographically referenced information. In a more generic sense, GIS is a software
tool that allows users to create interactive queries, analyze the spatial information,
edit data, maps, and present the results of all these operations. GIS technology is
becoming an essential tool to combine various maps and remote sensing information
to generate various models, which are used in real time environment. Geographical
information system is the science utilizing the geographic concepts, applications and
systems.
Geographical Information System can be used for scientific investigations,
resource management, asset management, environmental impact assessment, urban
planning, cartography, criminology, history, sales, marketing, and logistics. For
example, agricultural planners might use geographical data to decide on the best
locations for a location-specific crop planning, by combining data on soils,
topography, and rainfall to determine the size and location of biologically suitable
41
areas. The final output could include overlays with land ownership, transport,
infrastructure, labour availability, and distance to market centers.
Components of GIS
GIS enables the user to input, manage, manipulate, analyze, and display
geographically referenced data using a computerized system. To perform various
operations with GIS, the components of GIS such as software, hardware, data,
people and methods are essential.
Software
GIS software provides the functions and tools needed to store, analyze, and
display geographic information. Key software components are (a) a database
management system (DBMS) (b) tools for the input and manipulation of geographic
information (c) tools that support geographic query, analysis, and visualization (d) a
graphical user interface (GUI) for easy access to tools. GIS software is either
commercial software or a software developed on Open Source domain, which is
available for free. However, the commercial software is copyright protected, can be
expensive and is available in terms of number of licensees.
Currently available commercial GIS software includes Arc/Info, Intergraph,
MapInfo, Gram++ etc. Out of these Arc/Info is the most popular software package.
And, the open source software are AMS/MARS etc.
Hardware
Hardware is the computer on which a GIS operates. Today, GIS runs on a
wide range of hardware types, from centralized computer servers to desktop
computers used in stand-alone or networked configurations. Minimum configuration
required to Arc/Info Desktop 9.0 GIS application is as follows:
Product: ArcInfo Desktop 9.0
Platform: PC-Intel
Operating System: Windows XP Professional Edition, Home Edition
Service Packs/Patches: SP 1
SP2 (refer to Limitations)
Shipping/Release Date: May 10, 2004
42
Hardware Requirements
CPU Speed: 800 MHz minimum, 1.0 GHz recommended or higher
Processor: Pentium or higher
Memory/RAM:256 MB minimum, 512 MB recommended or higher
Display Properties: Greater than 256 color depth
Swap Space: 300 MB minimum
Disk Space: Typical 605 MB NTFS, Complete 695 MB FAT32 + 50 MB for installation
Browser: Internet Explorer 6.0 Requirement:
(Some features of ArcInfo Desktop 9.0 require a minimum installation of Microsoft Internet Explorer Version 6.0.)
Data
The most important component of a GIS is the data. Geographic data or
Spatial data and related Tabular data can be collected in-house or bought from a
commercial data provider. Spatial data can be in the form of a map/remotely-sensed
data such as satellite imagery and aerial photography. These data forms must be
properly geo-referenced (latitude/longitude). Tabular data can be in the form of
attribute data that is in some way related to spatial data. Most GIS software comes
with inbuilt Database Management Systems (DBMS) to create and maintain a
database to help organize and manage data.
Users
GIS technology is of limited value without the users who manage the system
and to develop plans for applying it. GIS users range from technical specialists who
design and maintain the system to those who use it to help them do their everyday
work. These users are largely interested in the results of the analyses and may have
no interest or knowledge of the methods of analysis. The user-friendly interface of
the GIS software allows the non-technical users to have easy access to GIS analytical
capabilities without needing to know detailed software commands. A simple User
Interface (UI) can consist of menus and pull-down graphic windows so that the user
can perform required analysis with a few key presses without needing to learn
specific commands in detail.
43
Methods
A successful GIS operates according to a well-designed plan and business
rules, which are the models and operating practices unique to each organization.
Functions of GIS
General-purpose GIS software performs six major tasks such as input,
manipulation, management, query, analysis and visualization.
Input
The important input data for any GIS is digitized maps, images, spatial data
and tabular data. The tabular data is generally typed on a computer using relational
database management system software. Before geographic data can be used in a
GIS, it must be converted into a suitable digital format. The DBMS system can
generate various objects such as index generation on data items to speed up the
information retrieval by a query. Maps can be digitized using a vector format in
which the actual map points, lines and polygons are stored as coordinates. Data can
also be input in a raster format in which data elements are stored as cells in a grid
structure (the technology details are covered in following section).
The process of converting data from paper maps into computer files is called
digitizing. Modern GIS technology has the capability to automate this process fully
for large projects; smaller jobs may require some manual digitizing. The digitizing
process is labour intensive and time-consuming, so it is better to use the data that
already exist. Today many types of geographic data already exist in GIS-
compatible formats. These data can be obtained from data suppliers and loaded
directly into a GIS.
Manipulation
GIS can store, maintain, distribute and update spatial data associated text
data. The spatial data must be referenced to geographic coordinate systems
(latitude/longitude). The tabular data associated with spatial data can be
manipulated with help of data base management software. It is likely that data
types required for a particular GIS project will need to be transformed or
manipulated in some way to make them compatible with the system. For example,
44
geographic information is available at different scales (scale of 1:100,000; 1:10,000;
and 1:50,000). Before these can be overlaid and integrated, they must be
transformed to the same scale. This could be a temporary transformation for display
purposes or a permanent one required for analysis. And, there are many other types
of data manipulation that are routinely performed in GIS. These include projection
changes, data aggregation, generalization and weeding out unnecessary data.
Management
For small GIS projects, it may be sufficient to store geographic information as
computer files. However, when data volumes become large and the number of users
of the data becomes more than a few, it is advised to use a database management
system (DBMS) to help store, organize, and manage data. A DBMS is a database
management software package to manage the integrated collection of database
objects such as tables, indexes, query, and other procedures in a database.
There are many different models of DBMS, but for GIS use, the relational
model database management systems will be highly helpful. In the relational model,
data are stored conceptually as a collection of tables and each table will have the
data attributes related to a common entity. Common fields in different tables are
used to link them together with relations. Because of its simple architecture, the
relational DBMS software has been used so widely. These are flexible in nature and
have been widely deployed in applications both within and without GIS.
Query
The stored information, either spatial data or associated tabular data, can be
retrieved with the help of Structured Query Language (SQL). Depending on the
type of user interface, data can be queried using the SQL or a menu driven system
can be used to retrieve map data. For example, you can begin to ask questions such
as:
• Where are all the soils suitable for sunflower crop?
• What is the dominant soil type for Paddy?
• What is the groundwater available position in a village/block/district?

45
Both simple and sophisticated queries utilizing more than one data layer can
provide timely information to officers and analysts to have overall knowledge about
situation and can take a more informed decision.
Analysis
GIS systems really come into their own when they are used to analyze
geographic data. The processes of geographic analysis, often called spatial analysis
or geo-processing, uses the geographic properties of features to look for patterns
and trends, and to undertake "what if" scenarios. Modern GIS has many powerful
analytical tools to analyze the data. The following are some of the analyses which
are generally performed on geographic data.
A. Overlay Analysis
The integration of different data layers involves a process called overlay. At
its simplest, this could be a visual operation, but analytical operations require one or
more data layers to be joined physically. This overlay, or spatial join, can integrate
data on soils, slope, and vegetation, or land ownership. For example, data layers for
soil and land use can be combined resulting in a new map which contains both soil
and land use information. This will be helpful to understand different behaviours of
the situation on different parameters.
B. Proximity Analysis
GIS software can also support buffer generation that involves the creation of
new polygons from points, lines, and polygon features stored in the database. For
example, to know answer to questions like - How much area covered within 1 km of
water canal? What is the area covered under different crops? And, for watershed
projects, where is the boundary or delineation of watershed, slope, water channels,
different types of water harvesting structures required, etc.
Visualization
GIS can provide hard copy maps, statistical summaries, modeling solutions
and graphical display of maps, for both spatial and tabular data. For many types of
geographic operation, the end result is best visualized as a map or graph. Maps are
very efficient at storing and communicating geographic information. GIS provides
46
new and exciting tools to extend the art of visualization of output information to the
users.
Technology used in GIS
Data creation
Modern GIS technologies use digital information, for which various digitized
data creation methods are used. The most common method of data creation is
digitization, where a hard copy map or survey plan is transferred into a digital
medium through the use of a computer-aided design program with geo-referencing
capabilities. With the wide availability of rectified imagery (both from satellite and
aerial sources), heads-up digitizing is becoming the main avenue through which
geographic data is extracted. Heads-up digitizing involves the tracing of geographic
data directly on top of the aerial imagery instead of through the traditional method
of tracing the geographic form on a separate digitizing tablet.
Relating information from different sources
If you could relate information about the rainfall of a state to aerial
photographs of the county, you might be able to tell which wetlands dry up at
certain times of the year. A GIS, which can use information from many different
sources in many different forms, can help with such analyses. The primary
requirement for the source data consists of knowing the locations for the variables.
Location may be annotated by x, y, and z coordinates of longitude, latitude, and
elevation, or by other geo-code systems like postal codes. Any variable that can be
located spatially can be fed into a GIS. Different kinds of data in map form can be
entered into a GIS.
A GIS can also convert existing digital information, which may not yet be in
map form, into forms it can recognize and use. For example, digital satellite images
generated through remote sensing can be analyzed to produce a map-like layer of
digital information about vegetative covers. Likewise, census or hydrologic tabular
data can be converted to map-like form, serving as layers of thematic information in
a GIS.
Data representation
GIS data represents real world objects such as roads, land use and elevation
with digital data. Real world objects can be divided into two abstractions: discrete
47
objects (a house) and continuous fields (rain fall amount or elevation). There are two
broad methods used to store data in a GIS for both abstractions: Raster and Vector.
Raster
A raster data type is, in essence, any type of digital image. Anyone who is
familiar with digital photography will recognize the pixel as the smallest individual
unit of an image. A combination of these pixels will create an image, distinct from
the commonly used scalable vector graphics, which are the basis of the vector
model. While a digital image is concerned with the output as representation of
reality, in a photograph or art transferred to computer, the raster data type will
reflect an abstraction of reality. Aerial photos are one commonly used form of raster
data, with only one purpose, to display a detailed image on a map or for the
purposes of digitization. Other raster data sets will contain information regarding
elevation, a DEM (Digital Elevation Model), or reflectance of a particular wave length
of light.
Digital Elevation Model (DEM), map, and vector data, Raster data type
consists of rows and columns of cells each storing a single value. Raster data can be
images (raster images) with each pixel containing a color value. Additional values
recorded for each cell may be a discrete value such as land use, a continuous value
such as temperature, or a null value if no data is available. While a raster cell stores
a single value, it can be extended by using raster bands to represent RGB (red,
green, blue) colors, color maps (a mapping between a thematic code and RGB
value), or an extended attribute table with one row for each unique cell value. The
resolution of the raster data set is its cell width in ground units.
Raster data is stored in various formats; from a standard file-based structure
of TIF, JPEG formats to binary large object (BLOB) data stored directly in a relational
database management system (RDBMS) similar to other vector-based feature
classes. Database storage, when properly indexed, typically allows for quicker
retrieval of the raster data but can require storage of millions of significantly sized
records.
Vector
A simple vector map, using each of the vector element points for wells, lines
for rivers, and a polygon for the lake. In a GIS, geographical features are often
expressed as vectors, by considering those features as geometrical shapes. In the
48
popular ESRI Arc series of programs, these are explicitly called shape files. Different
types of geometry best express different geographical features:
Points
Zero-dimensional points are used for geographical features that can best be
expressed by a single grid reference; in other words, simple location. For example,
the location of wells, peak elevations, features of interest or trailheads. Points convey
the least amount of information of these file types.
Lines or poly-lines
One-dimensional lines or poly-lines are used for linear features such as rivers,
roads, railroads, trails, and topographic lines.
Polygons
Two-dimensional polygons are used for geographical features that cover a
particular area of the earth's surface. Such features may include lakes, park
boundaries, buildings, city boundaries or land uses. Polygons convey the most
amount of information of the file types.
Each of these geometries is linked to a row in a database that describes their
attributes. For example, a database that describes lakes may contain a lake's depth,
water quality and pollution level. This information can be used to make a map to
describe a particular attribute of the dataset. For example, lakes could be coloured
depending on level of pollution. Different geometries can also be compared. For
example, the GIS could be used to identify all wells (point geometry) that are within
one mile (1.6 km) of a lake (polygon geometry) that has a high level of pollution.
Vector features can be made to respect spatial integrity through the
application of topology rules such as 'polygons must not overlap'. Vector data can
also be used to represent continuously varying phenomena. Contour lines and
triangulated irregular networks (TIN) are used to represent elevation or other
continuously changing values. TINs record values at point locations, which are
49
connected by lines to form an irregular mesh of triangles. The face of the triangles
represents the terrain surface.
Advantages and disadvantages
There are advantages and disadvantages in using a raster or vector data
model to represent reality. Raster data sets record a value for all points in the area
covered, which may require more storage space than representing data in a vector
format that can store data only where needed. Raster data also allows easy
implementation of overlay operations, which are more difficult with vector data.
Vector data can be displayed as vector graphics used on traditional maps, whereas
raster data will appear as an image that may have a blocky appearance for object
boundaries. Vector data can be easier to register, scale, and re-project. This can
simplify combining vector layers from different sources. Vector data are more
compatible with relational database environment. They can be part of a relational
table as a normal column and processes using a multitude of operators.
The file size for vector data is usually much smaller for storage and sharing
than raster data. Image or raster data can be 10 to 100 times larger than vector
data depending on the resolution. Another advantage of vector data is it can be
easily updated and maintained. For example, a new highway is added. The raster
image will have to be completely reproduced, but the vector data, "roads," can be
easily updated by adding the missing road segment. In addition, vector data allow
much more analysis capability especially for "networks" such as roads, power, rail,
telecommunications, etc. For example, with vector data attributed with the
characteristics of roads, ports, and airfields, allows the analyst to query for the best
route or method of transportation. In the vector data, the analyst can query the data
for the largest port with an airfield within 60 miles and a connecting road that is at
least two-lane highway. Raster data will not have all the characteristics of the
features it displays.
Voxel
Selected GIS additionally support the voxel data model. A voxel (a
portmanteau of the words volumetric and pixel) is a volume element, representing a
value on a regular grid in three-dimensional space. This is analogous to a pixel,
which represents 2D image data. Voxels can be interpolated from 3D point clouds
(3D point vector data) or merged from 2D raster slices.
50
Non-spatial data
Additional non-spatial data can also be stored besides the spatial data
represented by the coordinates of vector geometry or the position of a raster cell. In
vector data, the additional data are attributes of the object. For example, a forest
inventory polygon may also have an identifier value and information about tree
species. In raster data, the cell value can store attribute information, but it can also
be used as an identifier that can relate to records in another table.
Data capture
Data capture—entering information into the system—consumes much of the
time of GIS practitioners. There are a variety of methods used to enter data into a
GIS where it is stored in a digital format.
Existing data printed on paper or PET film maps can be digitized or scanned
to produce digital data. A digitizer produces vector data as an operator traces points,
lines, and polygon boundaries from a map. Scanning a map results in raster data
that could be further processed to produce vector data.
Survey data can be directly entered into a GIS from digital data collection
systems on survey instruments. Positions from a Global Positioning System (GPS),
another survey tool, can also be directly entered into a GIS.
Remotely sensed data also plays an important role in data collection and
consist of sensors attached to a platform. Sensors include cameras, digital scanners
and LIDAR, while platforms usually consist of aircraft and satellites.
The majority of digital data currently comes from photo interpretation of
aerial photographs. Soft copy workstations are used to digitize features directly from
stereo pairs of digital photographs. These systems allow data to be captured in 2 and
3 dimensions, with elevations measured directly from a stereo pair using principles of
photogrammetry. Currently, analog aerial photos are scanned before being entered
into a soft copy system, but as high quality digital cameras become cheaper this step
will be skipped.
51
Satellite remote sensing provides another important source of spatial data.
Here satellites use different sensor packages to passively measure the reflectance
from parts of the electromagnetic spectrum or radio waves that were sent out from
an active sensor such as radar. Remote sensing collects raster data that can be
further processed to identify objects and classes of interest, such as land cover.
When data is captured, the user should consider if the data should be
captured with either a relative accuracy or absolute accuracy, since this could not
only influence how information will be interpreted but also the cost of data capture.
In addition to collecting and entering spatial data, attribute data is also
entered into a GIS. For vector data, this includes additional information about the
objects represented in the system.
After entering data into a GIS, the data usually requires editing, to remove
errors or further processing. For vector data it must be made "topologically correct"
before it can be used for some advanced analysis. For example, in a road network,
lines must connect with nodes at an intersection. Errors such as undershoots and
overshoots must also be removed. For scanned maps, blemishes on the source map
may need to be removed from the resulting raster. For example, a fleck of dirt might
connect two lines that should not be connected.
Raster-to-vector translation
A GIS to convert data into different formats can perform data restructuring.
For example, a GIS may be used to convert a satellite image map to a vector
structure by generating lines around all cells with the same classification, while
determining the cell spatial relationships, such as adjacency or inclusion.
More advanced data processing can occur with image processing, a technique
developed in the late 1960s by NASA and the private sector to provide contrast
enhancement, false colour rendering and a variety of other techniques, including use
of two dimensional Fourier transforms.
52
Since digital data are collected and stored in various ways, the two data
sources may not be entirely compatible. So a GIS must be able to convert
geographic data from one structure to another.
Projections, coordinate systems and registration
A property ownership map and a soil map might show data at different
scales. Map information in a GIS must be manipulated so that it registers, or fits,
with information gathered from other maps. Before the digital data can be analyzed,
they may have to undergo other manipulations—projection and coordinate
conversions for example, that integrate them into a GIS.
The earth can be represented by various models, each of which may provide
a different set of coordinates (e.g., latitude, longitude, elevation) for any given point
on the earth's surface. The simplest model is to assume the earth is a perfect
sphere. As more measurements of the earth have accumulated, the models of the
earth have become more sophisticated and more accurate. In fact, there are models
that apply to different areas of the earth to provide increased accuracy (e.g., North
American Datum, 1927 - NAD27 - works well in North America, but not in Europe).
See Datum for more information.
Projection is a fundamental component of map making. A projection is a
mathematical means of transferring information from a model of the Earth, which
represents a three-dimensional curved surface, to a two-dimensional medium—paper
or a computer screen. Different projections are used for different types of maps
because each projection particularly suits certain uses. For example, a projection that
accurately represents the shapes of the continents will distort their relative sizes. See
Map projection for more information.
Since much of the information in a GIS comes from existing maps, a GIS uses
the processing power of the computer to transform digital information, gathered
from sources with different projections and/or different coordinate systems, to a
common projection and coordinate system. For images, this process is called
rectification.
53
SPATIAL ANALYSIS WITH GIS
Data modeling
It is difficult to relate wetlands’ maps to rainfall amounts recorded at different
points such as airports, television stations, and high schools. A GIS, however, can be
used to depict two and three-dimensional characteristics of the Earth's surface,
subsurface, and atmosphere from information points. For example, a GIS can quickly
generate a map with isopleths or contour lines that indicate differing amounts of
rainfall.
Such a map can be thought of as a rainfall contour map. Many sophisticated
methods can estimate the characteristics of surfaces from a limited number of point
measurements. A two-dimensional contour map created from the surface modeling
of rainfall point measurements may be overlaid and analyzed with any other map in
a GIS covering the same area.
Additionally, from a series of three-dimensional points, or digital elevation
model, isopleth lines representing elevation contours can be generated, along with
slope analysis, shaded relief, and other elevation products. Watersheds can be easily
defined for any given reach, by computing all of the areas contiguous and uphill from
any given point of interest. Similarly, an expected thalweg of where surface water
would want to travel in intermittent and permanent streams can be computed from
elevation data in the GIS.
Topological modeling
In the past years, were there any gas stations or factories operating next to
the swamp? Any within two miles (3 km) and uphill from the swamp? A GIS can
recognize and analyze the spatial relationships that exist within digitally stored
spatial data. These topological relationships allow complex spatial modeling and
analysis to be performed. Topological relationships between geometric entities
traditionally include adjacency (what adjoins what), containment (what encloses
what), and proximity (how close something is to something else).
54
Networks
If all the factories near a wetland were accidentally to release chemicals into
the river at the same time, how long would it take for a damaging amount of
pollutant to enter the wetland reserve? A GIS can simulate the routing of materials
along a linear network. Values such as slope, speed limit, or pipe diameter can be
incorporated into network modeling in order to represent the flow of the
phenomenon more accurately. Network modeling is commonly employed in
transportation planning, hydrology modeling, and infrastructure modeling.
Cartographic modeling
The "cartographic modeling" was (probably) coined by Dana Tomlin in his
Ph.D. dissertation and later in his book, which has the term in the title. Cartographic
modeling refers to a process where several thematic layers of the same area are
produced, processed, and analyzed. Tomlin used raster layers, but the overlay
method (see below) can be used more generally. Operations on map layers can be
combined into algorithms, and eventually into simulation or optimization models.
Map overlay
The combination of two separate spatial data sets (points, lines or polygons)
to create a new output vector data set. These overlays are similar to mathematical
Venn diagram overlays. A union overlay combines the geographic features and
attribute tables of both inputs into a single new output. An intersect overlay defines
the area where both inputs overlap and retains a set of attribute fields for each. A
symmetric difference overlay defines an output area that includes the total area of
both inputs except for the overlapping area.
Data extraction is a GIS process similar to vector overlay, though it can be
used in either vector or raster data analysis. Rather than combining the properties
and features of both data sets, data extraction involves using a "clip" or "mask" to
extract the features of one data set that fall within the spatial extent of another data
set.
In raster data analysis, the overlay of data sets is accomplished through a
process known as "local operation on multiple rasters" or "map algebra," through a
function that combines the values of each raster's matrix. This function may weigh
55
some inputs more than others through use of an "index model" that reflects the
influence of various factors upon a geographic phenomenon.
GIS software
Geographic information can be accessed, transferred, transformed, overlaid,
processed and displayed using numerous software applications. Within industry,
commercial offerings from companies such as ESRI and Mapinfo dominate offering
an entire suite of tools. Government and military departments often use custom
software, open source products, such as Gram++, GRASS, or more specialized
products that meet a well-defined need. Free tools exist to view GIS data sets and
online resources such as Google Earth and interactive web mapping dominate public
access to geographic information.
Originally up to the late 1990s, when GIS data was mostly based on large
computers and used to maintain internal records, software was a stand-alone
product. However, with increased access to the Internet and networks and demand
for distributed geographic data grew, GIS software gradually changed its entire
outlook to the delivery of data over a network. GIS software is now usually marketed
as a combination of various interoperable applications and APIs.
Data creation
GIS processing software is used for the task of preparing data for use within
a GIS. This transforms the raw or legacy geographic data into a format usable by
GIS products. For example an aerial photograph may need to be stretched using
photogrammetry so that its pixels align with longitude and latitude gradations. This
can be distinguished from the transformations done within GIS analysis software by
the fact that these changes are permanent, more complex and time consuming.
Thus, a specialized high-end type of software is generally used by a skilled person in
GIS processing aspects of computer science for digitization and analysis. Raw
geographic data can be edited in many standard database and spreadsheet
applications and in some cases a text editor may be used as long as care is taken to
properly format data.
A geo-database is a database with extensions for storing, querying, and
manipulating geographic information and spatial data.
56
Management and analysis
GIS analysis software takes GIS data and overlays or otherwise combines it
so that the data can be visually analysed. It can output a detailed map or image
used to communicate an idea or concept with respect to a region of interest. This is
usually used by persons who are trained in cartography, geography or a GIS
professional as this type of application is complex and takes some time to master.
The software performs transformation on raster and vector data sometimes of
differing datums, grid system, or reference system, into one coherent image. It can
also analyse changes over time within a region. This software is central to the
professional analysis and presentation of GIS data. Examples include the ArcGIS
family of ESRI GIS applications, Smallworld, Gram++ and GRASS.
Statistical
GIS statistical software uses standard database queries to retrieve data and
analyse data for decision making. For example, it can be used to determine how
many persons of an income of greater than 60,000 live in a block. The data is
sometimes referenced with postal codes and street locations rather than with
geodetic data. Computer scientists and statisticians with computer science skills, with
an objective of characterizing an area for marketing or governing decisions, use this.
Standard DBMS or specialized GIS statistical software can be used. These are many
times setup on servers so that they can be queried with web browsers. Examples are
MySQL or ArcSDE.
Readers
GIS readers are computer applications that are designed to allow users to
easily view digital maps as well as view and query GIS-managed data. By definition,
they usually allow very little, if any, editing of the map or underlying map data.
Readers can be normal stand-alone applications that need to be installed locally,
though they are often designed to connect to data servers over the Internet to
access the relevant information. Readers can also be included as an embedded
application within a web page, obviating the need for local installation. Readers are
designed to be relatively simple and easy to use as well as free.
Web API
This is the evolution of the scripts that were common with most early GIS
systems. An Application Programming Interface (API) is a set of subroutines
57
designed to perform a specific task. GIS APIs are designed to manage GIS data for
its delivery to a web browser client from a GIS server. They are accessed with
commonly used scripting language such as VBA or Java Script. They are used to
build a server system for the delivery of GIS that is to make available over an
Intranet.
Distributed GIS
Distributed GIS concerns itself with Geographical Information Systems that do
not have all of the system components in the same physical location. This could be
the processing, the database, the rendering or the user interface. Examples of
distributed systems are web-based GIS, Mobile GIS, Corporate GIS and GRID
computing.
Mobile GIS
GIS has seen many implementations on mobile devices. With the widespread
adoption of GPS, GIS has been used to capture and integrate data in the field.
Open-source GIS software
Many GIS tasks can be accomplished with open-source GIS software, which is
freely available over Internet downloads. With the broad use of non-proprietary and
open data formats such as the Shape File format for vector data and the Geotiff
format for raster data, as well as the adoption of OGC standards for networked
servers, development of open source software continues to evolve, especially for
web and web service oriented applications. Well-known open source GIS software
includes GRASS GIS, Quantum GIS, MapServer, uDig, OpenJUMP, gvSIG and many
others. PostGIS provides an open source alternative to geo-databases such as
Oracle Spatial and ArcSDE.
58
Remote Sensing Technology
Introduction
Remote Sensing (RS) is a technology that provides the means to collect and
use geographic data to assist in the development of Agriculture. Remote Sensing in
the most generally accepted meaning refers to instrument-based techniques
employed in the acquisition and measurement of spatially organized or
geographically distributed data on some properties such as spectral, spatial, physical
of an array of target points of objects and materials from a defined distance from the
observed target. Remote sensing of the environment by geographers is usually done
with the help of mechanical devices known as remote sensors. These gadgets have a
greatly improved ability to receive and record information about an object without
any physical contact. Often, these sensors are positioned away from the object of
interest by using helicopters, planes, and satellites. Most sensing devices record
information about an object by measuring an object's transmission of
electromagnetic energy from reflecting and radiating surfaces.
Remote sensing imagery has many applications in mapping land use and
cover, agriculture, soils mapping, forestry, city planning, archaeological
investigations, military observation, and geological surveying.
Overview of Remote Sensing Technology
Remote Sensing is the technology that is now the principal tool by which the
Earth's surface and atmosphere, the planets, and the entire Universe are being
observed, measured, and interpreted from such vantage points as the terrestrial
surface, earth-orbit, and outer space. Ms Evelyn Pruitt coined the term “remote
sensing” in the mid-1950's when she was working with the U.S. Office of Naval
Research (ONR) outside Washington, D.C as a oceanographer.
Remote Sensing in the most generally accepted meaning refers to
“Instrument-based techniques employed in the acquisition and measurement of
spatially organized data/information on some properties such as spectral, spatial,
physical of an array of target points within the sensed scene that correspond to
features, objects, and materials, doing this by applying one or more recording
59
devices not in physical, intimate contact with the item(s) from at a finite distance
from the observed target, in which the spatial arrangement is preserved. Various
techniques involved are pertinent to the sensed scene (target) by utilizing
electromagnetic radiation, force fields, or acoustic energy sensed by recording
cameras, radiometers and scanners, lasers, radio frequency receivers, radar systems,
sonar, thermal devices, sound detectors, seismographs, magnetometers,
gravimeters, scintillometers, and other instruments.
In simpler terms, Remote Sensing can be defined as “gathering data and
information about the physical ‘world’ by detecting and measuring signals composed
of radiation, particles, and fields emanating from objects located beyond the
immediate vicinity of the sensor devices”.
In the broadest sense, remote sensing is the small or large-scale acquisition
of information of an object or phenomenon, by the use of either recording or real-
time sensing device that is not in physical or intimate contact with the object such as
by way of aircraft, spacecraft and satellite. In practice, remote sensing is the stand-
off collection through the use of a variety of devices for gathering information on a
given object or area. Thus, Earth observation or weather satellite collection
platforms, ocean and atmospheric observing weather buoy platforms, Magnetic
Resonance Imaging (MRI), Positron Emission Tomography (PET), and space probes
are all examples of remote sensing. In modern usage, the term generally refers to
the use of imaging sensor technologies including but not limited to the use of
instruments aboard aircraft and spacecraft, and is distinct from other imaging-related
fields such as medical imaging.
There are two kinds of remote sensing. (1) Passive sensors detect natural
energy / radiation that is emitted or reflected by the object or surrounding area
being observed. Reflected sunlight is the most common source of radiation measured
by passive sensors. Examples of passive remote sensors include film photography,
infrared, and radiometers. (2) Active collection, on the other hand, emits energy in
order to scan objects and areas whereupon a passive sensor then detects and
measures the radiation that is reflected or backscattered from the target. RADAR is
an example of active remote sensing where the time delay between emission and
60
return is measured, establishing the location, height, speed and direction of an
object.
Remote sensing makes it possible to collect data on inaccessible areas.
Remote sensing applications include monitoring deforestation, the effects of climate
change on Arctic and Antarctic regions, coastal and ocean depths, availability of
water in the ground, and many more.
Orbital platforms collect and transmit data from different parts of the
electromagnetic spectrum, which in conjunction with larger scale aerial or ground-
based sensing and analysis, provides researchers with enough information to monitor
trends such as natural long and short term phenomena. Other uses include different
areas of the earth sciences such as natural resource management, agricultural fields
such as land usage and conservation, national security, ground-based and stand-off
collection on border areas.
History of Remote Sensing
Beyond the primitive methods of remote sensing, our earliest ancestors used
to stand on high mountains or trees to view the landscape. The modern discipline
arose with the development of flight. The balloonist made photographs of cities
from their balloons. The first tactical use was during the civil war. Messenger
pigeons, kites, rockets and unmanned balloons were also used for early images. With
the exception of balloons, these first, individual images were not particularly useful
for map making or for scientific purposes.
Systematic aerial photography was developed for military use beginning in
World War I and reaching a climax during the Cold War with the use of modified
combat aircraft. A more recent development is that of increasingly smaller sensor
pods such as those used by law enforcement and the military, in both manned and
unmanned platforms. The advantage of this approach is that this requires minimal
modification to a given airframe. Later imaging technologies would include Infra-red,
conventional, Doppler and synthetic aperture radar.
The development of artificial satellites in the latter half of the 20th century
allowed remote sensing to progress to a global scale as of the end of the cold war.
61
Instrumentation aboard various Earth observing and weather satellites such as
Landsat, the Nimbus and more recent missions such as RADARSAT and UARS
provided global measurements of various data for civil, research and military
purposes. Space probes to other planets have also provided the opportunity to
conduct remote sensing studies in extra-terrestrial environment; synthetic aperture
radar aboard the Magellan spacecraft provided detailed topographic maps of Venus.
Recent developments include, beginning in the 1960s and 1970s with the
development of image processing of satellite images. Several research groups in
Silicon Valley, including NASA, developed Fourier transform techniques leading to the
first notable enhancement of imagery data.
The introduction of online web services for easy access to remote sensing
data in the 21st century mainly low/medium-resolution images, like Google Earth,
has made remote sensing more familiar to every one and has popularized the
science.
Data acquisition techniques
Electromagnetic Radiation
Remote sensing is the practice of measuring an object or a phenomenon
without being in direct contact with it. It is non-intrusive. This requires the use of a
sensor situated remotely from the target of interest. A sensor is the instrument
(camera) that takes the remote measurements. There are many different types of
sensors, but almost all of them share something what they "sense" or take
measurements of is usually Electro-Magnetic Radiation (EMR) or light energy. EMR
is energy propagated through space in the form of tiny energy packets called
photons that exhibit both wave-like and particle-like properties. Unlike other modes
of energy transport, such as conduction (heating a metal skillet) or convection (flying
a hot air balloon), radiation (as in EMR) is capable of propagating through the
vacuum of space. The speed of that EMR in a vacuum (outer space) is approximately
300,000 kilometers per second (3 x 10⁸ meters/second-1 or 186,000 miles/second-
1). This is an extremely fast communications medium with visible light with its red,
green, and blue colors, that we see daily, and are an example of EMR. But there is a
much larger spectrum of such energy. We often characterize this spectrum or range
in terms of the wavelengths of different kinds of EMR. For a variety of reasons, there
62
are some wavelengths of EMR that are more commonly used in remote sensing than
other wavelengths.
Recording Electromagnetic Radiation
There are two broad categories of sensor systems used in remote sensing —
active and passive. Passive sensors rely on EMR from existing sources, most
commonly the Sun. Due to the extreme temperatures and nuclear activity on the
surface of the Sun, this massive energy source emits a broad and continuous range
of EMR, of which visible light is only a small fraction. EMR emitted from the Sun
travels through the vacuum of space, interacts with the atmosphere, and reflects off
objects and phenomena on Earth's surface. That EMR must again interact with the
atmosphere before arriving at a remote sensor system in the air or in orbit. Target
objects such as water absorb some of the Sun’s energy, rocks etc. on the surface of
Earth and these are often heated as a result. Absorbed energy can then be re-
emitted at longer wavelengths. Certain passive sensor systems are designed to
record portions of this emitted energy.
On the other hand, active sensors themselves generate the EMR that they need
to remotely sense objects or phenomena. The active sensors' EMR propagates from
the sensor, interacts with the atmosphere, arrives at target object trees, rocks,
buildings, etc., interacts with these objects, and must be reflected in order to travel
back through the atmosphere and be recorded at the sensor. Generally there are two
types of active sensors:
A. Radar (Radio Detection and Ranging), which utilizes microwave energy, and
B. LiDAR (Light Detection and Ranging), which utilizes near-infrared or
visible energy.
Reflectance of Electromagnetic Energy
Remote sensing would be of little use if every object or phenomenon on
Earth behaved in exactly the same way when interacting with EMR. Fortunately,
different objects reflect portions of the electromagnetic spectrum with differing
degrees of efficiency. Similarly, different objects emit previously absorbed EMR with
differing degrees of efficiency. In the visible spectrum, these differences in reflective
efficiency account for the myriad of colors that we see. For example, green plants
appear of that color because they reflect greater amounts of green light than of blue
63
or red light. Plotting the spectral reflectance levels of a given object or phenomenon
by wavelength yields a spectral reflectance curve, or spectral signature. This
signature is the remote sensing key to distinguish between one type of target and
another. For example, the signature of a deciduous tree is entirely different from
that of an evergreen tree.
Analog or Film-based Sensors
Today, we hear the terms analog and digital when referring to a wide range
of electronic devices. In general, analog devices operate using dynamic physical
properties (e.g., chemical changes) while digital devices operate using numbers (0s
and 1s). Remote sensor systems record patterns in incoming EMR using analog
detectors. While all remote sensor systems have at least a partial complement of
analog components, some sensor systems are completely analog. A prime example
of this is a film-based aerial camera. The emulsion of silver halide crystals in film
responds chemically to EMR exposure. Further, analog processing is used to
generate negative and positive transparencies and hardcopy photographs.
In an analog aerial camera, the length of exposure to incoming EMR is
controlled through a shutter that opens for just a fraction of a second. While the
shutter is open, the incoming light is focused on the film plane at the back of the
camera using a high quality lens. With each exposure, the focused image of EMR
causes a lasting chemical change to the exposed portion of film and a new
unexposed section of film is needed in order to repeat the process.
A film-based camera used for remote sensing differs in a few ways from a
typical camera used for photography. For one thing, the film itself is much larger
(nine inches wide). For another, the camera's focal length is much longer (about 175
mm). Without delving in detail into the science of photography, these differences
allow the aerial camera to take better, larger-scale photographs even from a moving
platform. Most cameras designed for this purpose are metric, meaning that their
internal dimensions have been precisely calibrated and are reported to the user. This
is vital to the practice of photogrammetry or taking detailed measurements on
photographic maps.
64
Digital Sensors
Digital sensors also measure patterns in incoming EMR using analog
detectors. However, measurements of EMR taken by each detector element are
recorded, not using an analog medium such as film, but using numbers. These
measurements are digitized through a process called analog-to-digital (A-to-D)
conversion. Possible values are in a pre-defined range, such as 0 to 255. Each
recorded numerical value is then stored on some kind of digital medium, such as a
hard disk, as part of a raster dataset. The value in each raster cell represents the
amount of energy received at the sensor from a particular circular area,
instantaneous-field-of-view (IFOV) on the ground. Digital sensors make use of the
same basic technology as a computer document scanner or a digital camera. In fact,
specialized digital cameras are often used to acquire remote sensor data and
professional-grade document scanners are often used to convert analog remote
sensing data to digital data.
The detectors in a digital sensor can be arranged in a number of different
ways. One method utilizes a single detector for each frequency band. A scanning
mirror is then used to capture EMR at each IFOV along a scan line. The forward
motion of the sensor allows for additional scan lines and therefore a two dimensional
image. This type of instrument is often referred to as a scanning mirror sensor.
A second method is to have a linear array of detectors for each band. Each
detector in an array records EMR for a single IFOV in the cross-track dimension i.e.,
perpendicular to the direction of flight. The forward motion of the sensor again
allows for repeated measurements and two-dimensional imagery. This type of sensor
system is often called a linear array push-broom scanner. Push-broom systems have
several advantages over scanning mirror sensors. They have fewer moving parts, so
they are generally more durable. Also, the process of assigning coordinates to push-
broom data is much easier.
A third digital sensor configuration is the one that is most like the operation
of analog film-based systems. In this case, an entire area array is placed at the back
of the sensor. Energy is focused through a lens onto this bank of detectors. These
types of sensors are called digital cameras, or area array sensors. They are often
used in similar applications as film-based cameras.
65
Remote Sensing Software
The most used software in remote sensing is ESRI (Environmental Systems
Research Institute), ERDAS, RSI ENVI, MapInfo, ERMapper, AutoDesk etc. The most
free remote sensing software seems to be Chips (Copenhagen Image Processing
System) for windows and a large number of popular Free and Open Source software
options exist for remote sensing data analysis, ranging from programming APIs and
toolkits like GDAL, to full featured desktop applications like GRASS GIS, and OpenEV.
Applications of Remote Sensing and GIS
Remote sensing is an important tool to provide important information on
soils, land evaluation, land degradation, crop distribution, crop growth, availability of
water resources etc. The information of Remote Sensing can be improved in its
efficiency by combining with conventional technologies / ground surveys and also the
advanced tools such as GIS for analysis and interpretation.
Remote sensing data is available in digital form and can be used as an input
layer to GIS software. The software such as ArcInfo/ERDAS, supports both remote
sensing and GIS data. The advent of technology in storage capacity, processing
capabilities, relational databases, and enhanced graphical user interface has given
more capabilities to work on remote sensing and GIS data for analysis and
interpretation of data. Use of GIS in combination with remote sensing enhances the
decision-making in following ways:
• Process identification to enable comparison of different acquisitions through time
• Identification of agricultural and other development problems • Evaluation of possible technical interventions for conservation or reclamation
measures. • Monitoring of soils, water, and land degradation processes.
Crop Production Databases
Crop production database is used to know how many hectares have been
cultivated, where the cultivation has occurred and how will be likely production of
food i.e. Area and Production of various crops can be assed with the help of remote
sensing and GIS applications. Crop distribution helps in modeling of climatic and
other environmental changes and their effects on agriculture.
66
Crop growth and yield determination:
Crop growth and yield are determined by a number of factors such as genetic
potential of crop cultivar, soil, weather, cultivation practices such as date of sowing,
amount of irrigation, fertilizer and biotic stresses. However, generally for a given
area, year-to-year yield variability has been mostly modeled through weather as a
predictor using either empirical or crop simulation approach. With the launch and
continuous availability of multi-spectral (visible, near-infrared) sensors on polar
orbiting earth observation satellites, RS data has become an important tool for yield
modeling. RS data provide timely, accurate, synoptic and objective estimation of
crop growing conditions or crop growth for developing yield models and issuing yield
forecasts at a range of spatial scales. RS data have certain advantage over
meteorological observations for yield modeling, such as dense observational
coverage, direct viewing of the crop and ability to capture effect of non-
meteorological factors. An integration of the three technologies, viz., crop simulation
models, RS data and GIS can provide an excellent solution to monitoring and
modeling of crop at a range of spatial scales.
Crop monitoring
The use of GIS along with RS data for crop monitoring is an established
approach in all phases of the activity, namely preparatory, analysis and output. In
the preparatory phase, GIS is used for (a) stratification/zonation using one or more
input layers (climate, soil, physiography, crop dominance etc.), or (b) preparing input
data (weather, soil and collateral data) which is available in different formats to a
common format. In the analysis phase, use of GIS is mainly through operations on
raster layers of NDVI or computing VI profiles within specified administrative
boundaries. The final output phase also involves GIS for aggregation and display of
outputs for defined regions (e.g., administrative regions) and creating map output
products with required data integration through overlays.
67
List of Agricultural Websites
1. Farmer portal of Min. of Agriculture: http://farmer.gov.in
2. Agriculture Cooperative http://agricoop.nic.in/
3. Agri. Market Rates website (NIC) http://www.agmarknet.nic.in
4. Digital Mandi, IIT Kanpur http://digitalmandi.iitk.ac.in
5. Agro e-commerce Portal http://www.agroecommerce.com
6. National Institute of Agricultural Extension Management (MANAGE)
www.manage.gov.in
7. NABARD http://www.nabard.org/
8. Tamil Nadu Agricultural University Portal: http://agritech.tnau.ac.in
9. CDAC – INDG portal: http://www.indg.in
10. Rice Knowledge Management Portal: www.rkmp.co.in
11. Agropedia web portal: www.agropedia.iitk.ac.in
12. Andhra Pradesh AGRISNET: www.apagrisnet.gov.in
13. IMD Portal: www.imd.gov.in
14. Village Organics http://www.villageorganics.in/
15. Ikisan Portal http://www.ikisan.com
16. Agronet Website http://www.indiaagronet.com
17. MCX Commodity Exchange http://www.mcxindia.com
18. National Multi Commodity Exchange http://www.nmce.com
19. NCDEX Commodity Exchange http://www.ncdex.com
20. Agriwatch Portal http://www.agriwatch.com
21. Commodity India Portal: http://www.commodityindia.com/
22. Agriculture Today http://www.agriculturetoday.in/
23. Agriculture Statistics www.indiaagristat.com
24. Agricultural and Processed food products Export Development Authority
(APEDA) http://www.apeda.gov.in
25. Department of Fertilizers http://www.fert.nic.in
26. IFFCO http://www.iffco.nic.in
27. Ministry of food processing industries http://mofpi.nic.in/
28. National Agricultural cooperative Marketing federation: http://www.nafed-
india.com
68
29. National fertilizer ltd http://www.nationalfertilizers.com/
30. National cooperative consumer’s federation: http://www.nccf-india.com
31. National Centre for Disease Control: http://www.ncdc.nic.in
32. National Dairy Development Board: http://www.nddb.org
33. National Fisheries Development Board: http://nfdb.ap.nic.in/
34. Fertilizer Association of India http://www.faidelhi.org
35. Indian farmers http://indianfarmers.org/
36. Indian Society of Agribusiness Professionals http://www.isapindia.org
37. eFresh http://www.efreshindia.com/efresh/
38. Jalaspandana http://www.jalaspandana.org/
39. Kribhco http://www.kribhco.net
40. Krishi World Website Portal http://www.krishiworld.com
41. FAO website: www.fao.org
42. Maharashtra Agricultural Department: www.mahaagri.gov.in