Enterprise Drupal Migrations: Lessons From Large-Scale Migrations
Upload
aileen-franklinCategory
view
222download
4
Agriculture and Rural-Urban migrations
in Developing Countries: facts and policy implications
Jacques Vercueil – presentation based on an FAO study
from the « Roles of Agriculture » (RoA) Project
National Agricultural Policy Center,
Damascus – 12 December 2004

0
100
200
300
400
500
600
700
800
1950 1955 1960 1965 1970 1975 1980 1985 1990 1995 2000
Mil
lio
n m
igra
nts
Worldwide rural exodus since 1950
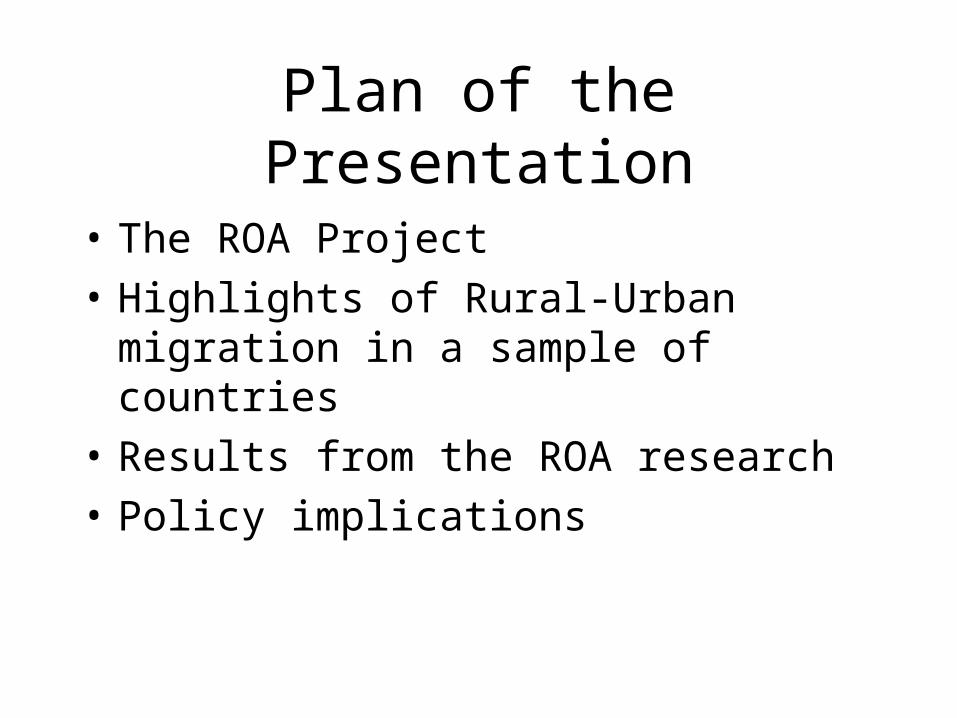
Plan of the Presentation
• The ROA Project
• Highlights of Rural-Urban migration in a sample of countries
• Results from the ROA research
• Policy implications

The Roles of Agriculture
• Is Agriculture « special »?– Economic roles
– Social roles
– Environmental roles
– Cultural roles

Sample of RoA countries

The Country-Case-Studies framework
• Module 1: Historical Policy framework
• M2: environmental role, national and local
• M3: anti-poverty role
• M4: national & household food security
• M5: buffer role against crises
• M6: social viability (Rural-urban migration)
• M7: perception and cultural role

Module 6: Social Viability
The role of agriculture in
rural-to-urban migrations (RUM)

Overview of Migration in the RoA Countries and Syria
• Trends in the Urban Share of Population
• History of the « Migration Drive »

0
10
20
30
40
50
60
70
80
90
100
1950 1955 1960 1965 1970 1975 1980 1985 1990 1995 2000
Urba
n sh
are
of p
ôpul
atio
n (%
)
Chile
Mexico
Dominican Rp
South Africa
Morocco
Syria
Indonesia
China
Ghana
Mali
India
Ethiopia PDR
Trends of urbanisation
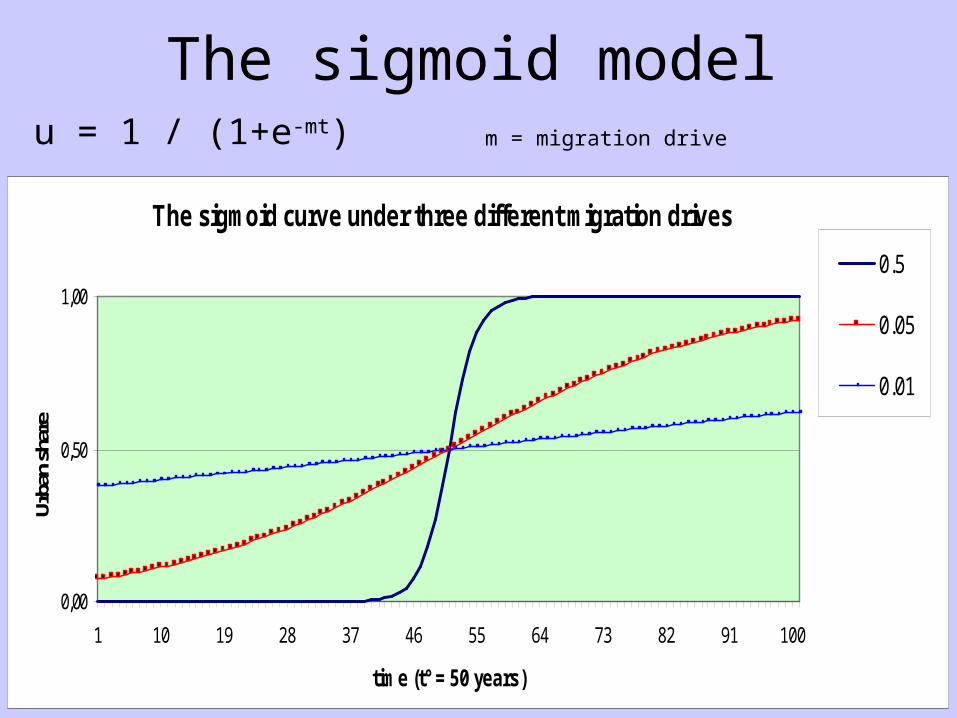
u = 1 / (1+e-mt) m = migration drive
The sigmoid curve under three different migration drives
0,00
0,50
1,00
1 10 19 28 37 46 55 64 73 82 91 100
time (t° = 50 years)
Urba
n sh
are
0.5
0.05
0.01
The sigmoid model

0
10
20
30
40
50
60
70
80
90
100CHILE
MEXICO
DOM REP
SOUTH AFRICA
MOROCCO
INDONESIA
CHINA
GHANA
MALI
INDIA
ETHIOPIA
SIGMOID
The cross-country path of urbanisation

Decreasing drive
0
1
2
3
4
5
6
7
1950 1955 1960 1965 1970 1975 1980 1985 1990 1995 2000
Dominican Rp
Ethiopia
Chile
Syria
Ghana
Mexico

Increasing drive
-1
0
1
2
3
4
5
6
1950 1955 1960 1965 1970 1975 1980 1985 1990 1995 2000
Indonesia
China
South Africa
Mali
Morocco
India

Lessons from the studies
• Who migrates why?
• Urban development patterns and costs
• The role of agriculture

Ethiopia 1994
RU
UU
UR
RR
Ghana 1991-1998
UU
UR
RR
RU
Examples of internal migrations

0%10%20%30%40%50%
60%70%80%90%
100%
Heads Non Heads
Migrants in town
Other reason
Studies
More jobs in town
Bad economic sit.
Lack of land
Lack of job
Who migrates why?
Survey from Dominican Republic

Mali (Bamako)
Dominican Republic (Santo Domingo)
Ethopia (Addis Ababa)
Ghana (Accra)
Chile (Santiago)
Syria (Aleppo)
Mexico (Mexico)
Indonesia (Jakarta)
Morocco (Casablanca)
South Africa (Johannesburg)
India (Mumbai)
China (Shanghai)
0,0 10,0 20,0 30,0 40,0 50,0 60,0 70,0 80,0
Urban development problemsPrimacy in the
sample countries

The Role of Agriculture
• The anti-poverty role of agriculture• The size of agriculture• Sub-sector differences:
– Commodity differences– Institutional differences– Development projects
• Rural-to-rural migration (seasonal or permanent) • Agriculture and rural development
20
30
40
50
60
70
80
90
100
110
120
130
1940 1950 1960 1970 1980 1990 2000 2010Sha
re (%
) of A
gric
ultr
ual i
n R
ural
pop
ulat
ion
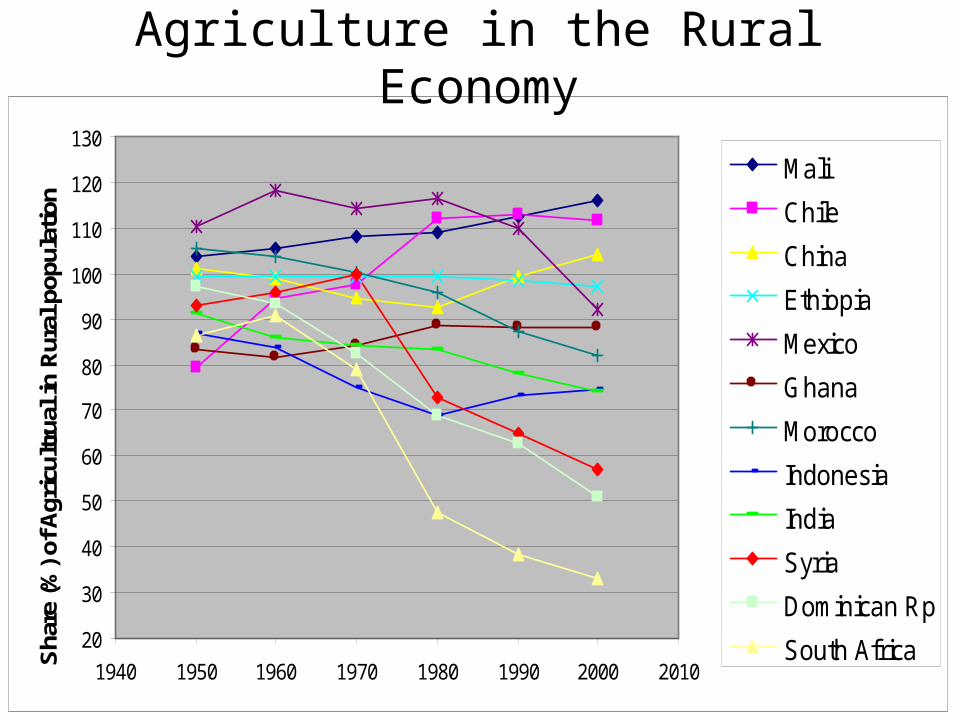
Mali
Chile
China
Ethiopia
Mexico
Ghana
Morocco
Indonesia
India
Syria
Dominican Rp
South Africa
Agriculture in the Rural Economy

Agri / Rural population (%) - 112 developing countries
(MAX-MIN)/MEAN
0,60
0,80
1,00
1,20
1,40
1,60
1,80
1950 1960 1970 1980 1990 2000
0
20
40
60
80
100
120
140
160
1940 1950 1960 1970 1980 1990 2000 2010

Agricultural policies
• Agriculture terms of trade
• Profitable labour intensive agriculture
• Capital markets
• Agricultural insecurity

Sub-sector differences
• Commodity differences
• Institutional differences
• Local agricultural development (projects)

Agriculture and Rural development
• The entire rural economy matters for migrations
• Rural infrastructures and services
• Agricultural links with the non-farm economy
• How to maintain the social fabric in rural areas?

Other policies
• Migration policies
• Social policies
• Urban policies
• Spatial development management

To conclude
“Revitalization of rural areas must also be a priority to enhance social stability and help redress the excessive rate of rural-to-urban migration confronting many countries”. Rome Declaration on World Food Security, paragraph 5 (World Food Summit, November 1996)

Thank you for your attention