AGRICULTURE AND NATURAL RESOURCES SECTOR PROGRAM … · Agriculture and Natural Resources Sector...
26
CAPE India, Supplementary Linked Document 12 AGRICULTURE AND NATURAL RESOURCES SECTOR PROGRAM IN INDIA: A BACKGROUND PAPER AND DESK REVIEW A. Introduction 1. Indian agriculture needs to secure food supplies for a population of 1.2 billion. It accounts for 20.4% of the world’s agriculture and, in terms of India’s food production alone, it has grown more than five times since the 1950s when it was producing 50.8 million tons a year (Figure 1). India currently produces more than 250 million tons of food grains a year (the highest ever production was 264.8 million tons in financial year (FY) 2013–2014). 1 With the People’s Republic of China, India is the first or second largest global producer of many agricultural commodities including rice, wheat, pulses, groundnuts, sugarcane, cotton, jute, milk, fruits, and vegetables. 2 The green revolution technology of the late 1960s, the spread of irrigation, and the expanded use of biochemical fertilizers have played a vital role in this achievement. 2. Drawing upon India’s rural population of 689 million, agriculture employs 263 million workers either as cultivators or as agriculture labor 3 tilling an average of 1.15 hectares (ha) per household (Figures 2 and 3). As of the 2011 census, women constitute a little more than one-third (34.9%) of the rural working population. However, there were fewer female cultivators (23.4% of the total) than female agriculture laborers (43.1%). 4 Most of the cultivators grow two crops—one in the wet season (June to September) and one in the dry season (November to March), locally known as a kharif and rabi crops respectively. 3. Notwithstanding the tremendous achievement of Indian agriculture, per capita per day food availability in the country hovers around 450–500 grams. Increases in income mean that the pattern of consumption is gradually shifting away from food grains to dairy products, meat, fruit, and vegetables. Within the food basket, the availability of pulses (a major source of protein for vegetarians) has 1 A good monsoon in 2016 promises another bumper crop. The kharif crop is expected to be exceed the previous year’s crop by 10%–12% and will perhaps be setting a new all-time record of annual production. 2 Government of India. 2015. Agricultural Statistics at a Glance 2014. Delhi: Oxford University Press. p.241. Table 7.2. 3 The number of cultivators has declined sharply in recent years. There are now more agriculture laborers than cultivators in India (Figure 2). 4 For a gender break-up of data in agriculture, Footnote 2. Tables 2.3 (b) and 2.3 (c). Figure 1: Food Grain Production, 1950–2016 (million tons per year) Sources: Government of India. Ministry of Agriculture, Department of Agriculture and Cooperation, Directorate of Economics and Statistics. 2015. Agricultural Statistics at a Glance 2014. Delhi: Oxford University Press. p. 241, Table 7.2, combined with the latest estimates; S. Mukherjee. 2016. Centre lowers pulses output estimate. Business Standard. 2 August. 0 50 100 150 200 250 300
Transcript of AGRICULTURE AND NATURAL RESOURCES SECTOR PROGRAM … · Agriculture and Natural Resources Sector...

CAPE India, Supplementary Linked Document 12
AGRICULTURE AND NATURAL RESOURCES SECTOR PROGRAM IN INDIA:
A BACKGROUND PAPER AND DESK REVIEW
A. Introduction
1. Indian agriculture needs to secure food supplies for a population of 1.2 billion. It accounts for
20.4% of the world’s agriculture and, in terms of India’s food production alone, it has grown more
than five times since the 1950s when it was producing 50.8 million tons a year (Figure 1). India
currently produces more than 250 million tons of food grains a year (the highest ever production was
264.8 million tons in financial year (FY) 2013–2014).1 With the People’s Republic of China, India is the
first or second largest global producer of many agricultural commodities including rice, wheat, pulses,
groundnuts, sugarcane, cotton, jute, milk, fruits, and vegetables.2 The green revolution technology of
the late 1960s, the spread of irrigation, and the expanded use of biochemical fertilizers have played a
vital role in this achievement.
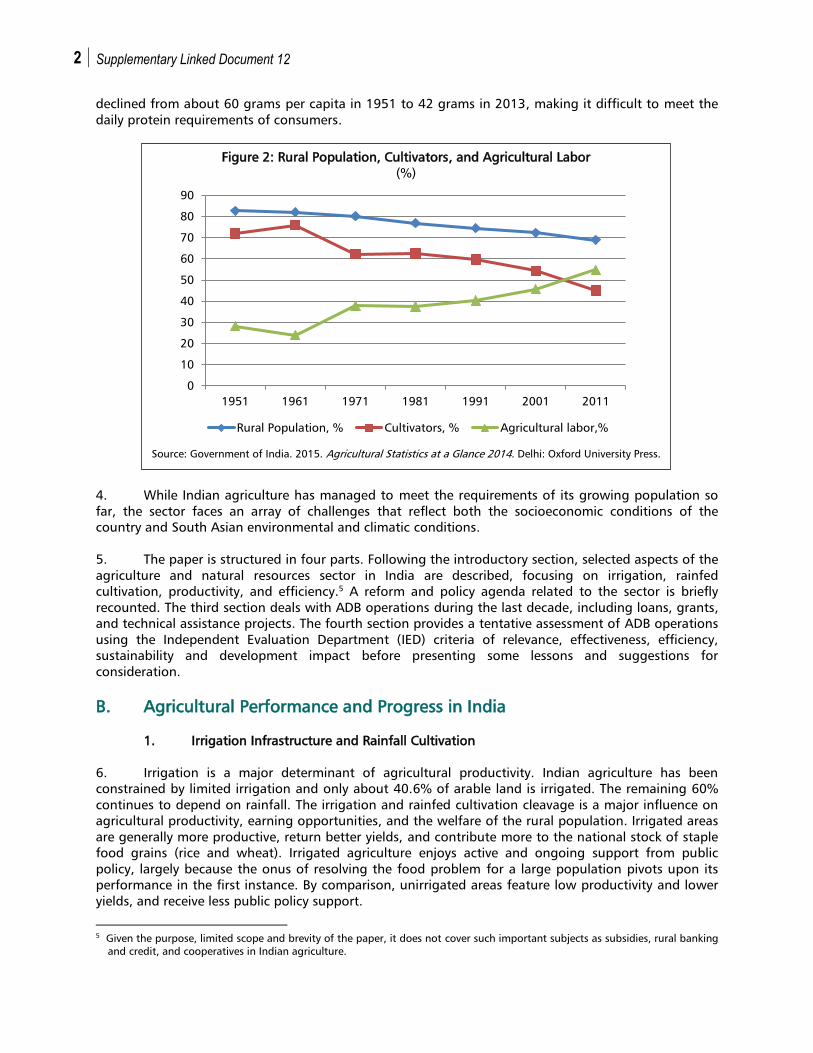
2. Drawing upon India’s rural population of 689 million, agriculture employs 263 million workers
either as cultivators or as agriculture labor3 tilling an average of 1.15 hectares (ha) per household
(Figures 2 and 3). As of the 2011 census, women constitute a little more than one-third (34.9%) of the
rural working population. However, there were fewer female cultivators (23.4% of the total) than
female agriculture laborers (43.1%).4 Most of the cultivators grow two crops—one in the wet season
(June to September) and one in the dry season (November to March), locally known as a kharif and rabi
crops respectively.
3. Notwithstanding the tremendous achievement of Indian agriculture, per capita per day food
availability in the country hovers around 450–500 grams. Increases in income mean that the pattern of
consumption is gradually shifting away from food grains to dairy products, meat, fruit, and vegetables.
Within the food basket, the availability of pulses (a major source of protein for vegetarians) has
1 A good monsoon in 2016 promises another bumper crop. The kharif crop is expected to be exceed the previous year’s crop by
10%–12% and will perhaps be setting a new all-time record of annual production.
2 Government of India. 2015. Agricultural Statistics at a Glance 2014. Delhi: Oxford University Press. p.241. Table 7.2.
3 The number of cultivators has declined sharply in recent years. There are now more agriculture laborers than cultivators in
India (Figure 2).
4 For a gender break-up of data in agriculture, Footnote 2. Tables 2.3 (b) and 2.3 (c).
Figure 1: Food Grain Production, 1950–2016
(million tons per year)
Sources: Government of India. Ministry of Agriculture, Department of Agriculture and
Cooperation, Directorate of Economics and Statistics. 2015. Agricultural Statistics at a Glance
2014. Delhi: Oxford University Press. p. 241, Table 7.2, combined with the latest estimates;
S. Mukherjee. 2016. Centre lowers pulses output estimate. Business Standard. 2 August.
0
50
100
150
200
250
300
2 Supplementary Linked Document 12
declined from about 60 grams per capita in 1951 to 42 grams in 2013, making it difficult to meet the
daily protein requirements of consumers.
4. While Indian agriculture has managed to meet the requirements of its growing population so
far, the sector faces an array of challenges that reflect both the socioeconomic conditions of the
country and South Asian environmental and climatic conditions.
5. The paper is structured in four parts. Following the introductory section, selected aspects of the
agriculture and natural resources sector in India are described, focusing on irrigation, rainfed
cultivation, productivity, and efficiency.5 A reform and policy agenda related to the sector is briefly
recounted. The third section deals with ADB operations during the last decade, including loans, grants,
and technical assistance projects. The fourth section provides a tentative assessment of ADB operations
using the Independent Evaluation Department (IED) criteria of relevance, effectiveness, efficiency,
sustainability and development impact before presenting some lessons and suggestions for
consideration.
B. Agricultural Performance and Progress in India
1. Irrigation Infrastructure and Rainfall Cultivation
6. Irrigation is a major determinant of agricultural productivity. Indian agriculture has been
constrained by limited irrigation and only about 40.6% of arable land is irrigated. The remaining 60%
continues to depend on rainfall. The irrigation and rainfed cultivation cleavage is a major influence on
agricultural productivity, earning opportunities, and the welfare of the rural population. Irrigated areas
are generally more productive, return better yields, and contribute more to the national stock of staple
food grains (rice and wheat). Irrigated agriculture enjoys active and ongoing support from public
policy, largely because the onus of resolving the food problem for a large population pivots upon its
performance in the first instance. By comparison, unirrigated areas feature low productivity and lower
yields, and receive less public policy support.
5 Given the purpose, limited scope and brevity of the paper, it does not cover such important subjects as subsidies, rural banking
and credit, and cooperatives in Indian agriculture.
Figure 2: Rural Population, Cultivators, and Agricultural Labor
(%)
Source: Government of India. 2015. Agricultural Statistics at a Glance 2014. Delhi: Oxford University Press.
0
10
20
30
40
50
60
70
80
90
1951 1961 1971 1981 1991 2001 2011
Rural Population, % Cultivators, % Agricultural labor,%

Agriculture and Natural Resources Sector Program in India: A Background Paper and Desk Review 3
7. In the northern Indo-Gangetic plains, the states of Punjab, Haryana, Uttar Pradesh, and Bihar
have more than 60% of their cultivated area irrigated. Andhra Pradesh, Gujarat, Rajasthan, and West
Bengal have parts of their agricultural land irrigated and depend on both monsoon rains and irrigation
systems. At the other extreme, Assam, Chhatisgarh, Himachal Pradesh, Kerala, Jharkhand, Maharashtra,
Odisha, and Uttarakhand have smaller irrigated areas and are predominantly dependent upon rainfall
for agricultural production.
8. Given the urgency of the food problems in the 1950s and 1960s, the segmentation of Indian
agriculture into irrigated and rainfed cultivation is understandable. More than four decades have
passed since the 1970s when the green revolution firmly took roots in the country, and India became
self-sufficient in the food supply, but progress since then in bridging the gap between irrigated and
rainfed cultivation has been slow. There is a need to modernize Indian agriculture as a whole. This
paper suggests that more proactive support to rainfed cultivation could resolve a number of challenges
facing Indian agriculture at present.
9. The growth of irrigation infrastructure has been slow, despite its potential role in increasing
yields, feeding the population, and improving the welfare of the rural masses.6 The accelerated
irrigation benefit program (AIBP) has been increasing the number of irrigated areas in various states,
creating 8.05 million hectares between FY1996–1997 and FY2011–2012, a gain of a little more than
500,000 ha every year.7 On 1 July 2015, the government launched the Prime Minister’s Krishi Sinchai
Yojana (the Prime Minister’s agriculture irrigation plan).8
6 The total irrigation potential in India is about 140 million hectares (Government of India. 2016. Economic Survey, 2015-16.
p. 103, para. 528).
7 Footnote 2. pp. 319–320, Table 13.6.
8 PMKSY amalgamated a number of ongoing schemes: the Accelerated Irrigation Benefit Programme (AIBP) of the Ministry of
Water Resources, River Development & Ganga Rejuvenation; Integrated Watershed Management Programme (IWMP) of the
Department of Land Resources; and the On Farm Water Management of the Department of Agriculture and Cooperation
(DAC). See www.pmksy.gov.in
Figure 3: Distribution of Holding Size (%)
Source: Government of India. Ministry of Agriculture, Department of Agriculture and
Cooperation, Directorate of Economics and Statistics. 2015. Agricultural Statistics at a
Glance 2014. Delhi: Oxford University Press.
Marginal
Small
Semi-medium
Medium
Large

4 Supplementary Linked Document 12
Table 1: Major Agricultural States: Irrigation, Production, and Yields
Extent of
Irrigation
Major States with Area Under
Irrigation (%)
Share of All-India
Food Grain
Production (%) Main Crops
Average Yield
(kg//ha)
States with
more than 60%
irrigation
coverage
Punjab (98.7%), Haryana (88.9%),
Uttar Pradesh (76.1%), Bihar
(67.4%),Tamil Nadu (63.5%), and
Andhra Pradesh (62.5%)
Accounting for 52%
of the national food
production
Rice, wheat,
maize, sugarcane,
coconut, and jute
2,957
30%–60%
irrigation
Madhya Pradesh (50.5%), West
Bengal (49.3%), Gujarat (46%) and
Uttarakhand (44%)
19.4% of the
national food
production
Wheat, pulses,
oilseeds, coconut,
and jute
2,068
Less than 30%
irrigation
Chhatisgarh (29.7%) Odisha (29.0%),
Karnataka (28.2%), Rajasthan
(27.7%), Maharashtra (16.4%),
Jharkhand (7.0%) and Assam (4.6%)
28.6% of the
national food
production
Maize, pulses,
oilseeds,
sugarcane,
coconut, and jute
1,595
kg/ha = kilogram per hectare.
Note: Data relate to FY2013–2014.
Source: Government of India. Ministry of Agriculture, Department of Agriculture and Cooperation, Directorate of Economics and
Statistics. 2015. Agricultural Statistics at a Glance 2014. Delhi: Oxford University Press. Table 4.5(b).
10. It is recognized that the division in Table 1 between irrigation and rainfed agriculture masks the
fact that some features could be common to both groups. The critical aspect of the classification is the
geographic unit at which the analysis is carried out. Table 1 is at the state level. Analysis at the district
or lower levels (block or panchayat levels) would yield finer results, but for the purposes of a brief
review such as the present paper, the state-level analysis suffices.
2. Irrigation and Cropping Choice
11. The magnitude and method of irrigation impacts different aspects of agricultural production in
various ways. The choice of crop, quality of output and its timing in the market all tend to vary with the
type of irrigation.9 For example, irrigated states have been largely concentrating on wheat and rice
production, whereas coarse grains, pulses, oil seeds, and fibers are cultivated more in unirrigated
areas.10
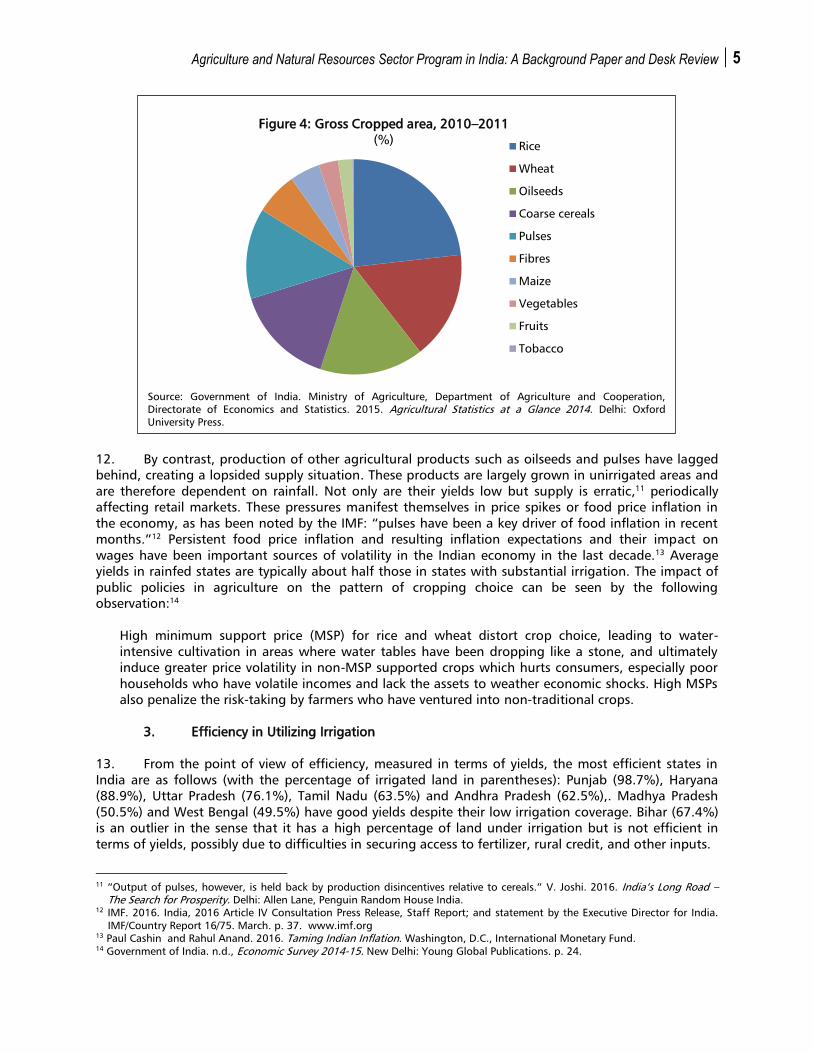
The green revolution has enabled India to register high growth rates for wheat and rice since
the early 1970s and these are the main crops in Uttar Pradesh, Punjab, Madhya Pradesh, West Bengal
and Andhra Pradesh. These two crops account for more than three-quarters of India’s total food grain
production (Figure 4). All have a high share of irrigation, with West Bengal with least coverage at about
50%. The average yield across these states is 2,775 kilograms per hectare (kg/ha), typical of irrigated
agriculture in India, against the Indian average of 2,100 kg/ha.
9 N. Kohli. 2015. Use of Information Technology for Predicting Rainfall Patterns for Rainfed Farming. In Upendra Kumar. 2015.
Rainfed Farming and Sustainable Agriculture – Innovative Approaches. Delhi: Regal Publications. pp. 25–34.
10 Some argue that the greater emphasis on rice and wheat has changed food consumption patterns in India from coarse grains
to wheat and rice; see R. Kumar (Ed). 2016. Putting Wheat in its Place, Or Why the Green Revolution was not Quite What it’s
made out to be? WIRE. 31 October.
Agriculture and Natural Resources Sector Program in India: A Background Paper and Desk Review 5
12. By contrast, production of other agricultural products such as oilseeds and pulses have lagged
behind, creating a lopsided supply situation. These products are largely grown in unirrigated areas and
are therefore dependent on rainfall. Not only are their yields low but supply is erratic,11
periodically
affecting retail markets. These pressures manifest themselves in price spikes or food price inflation in
the economy, as has been noted by the IMF: “pulses have been a key driver of food inflation in recent
months.”12
Persistent food price inflation and resulting inflation expectations and their impact on
wages have been important sources of volatility in the Indian economy in the last decade.13
Average
yields in rainfed states are typically about half those in states with substantial irrigation. The impact of
public policies in agriculture on the pattern of cropping choice can be seen by the following
observation:14
High minimum support price (MSP) for rice and wheat distort crop choice, leading to water-
intensive cultivation in areas where water tables have been dropping like a stone, and ultimately
induce greater price volatility in non-MSP supported crops which hurts consumers, especially poor
households who have volatile incomes and lack the assets to weather economic shocks. High MSPs
also penalize the risk-taking by farmers who have ventured into non-traditional crops.
3. Efficiency in Utilizing Irrigation
13. From the point of view of efficiency, measured in terms of yields, the most efficient states in
India are as follows (with the percentage of irrigated land in parentheses): Punjab (98.7%), Haryana
(88.9%), Uttar Pradesh (76.1%), Tamil Nadu (63.5%) and Andhra Pradesh (62.5%),. Madhya Pradesh
(50.5%) and West Bengal (49.5%) have good yields despite their low irrigation coverage. Bihar (67.4%)
is an outlier in the sense that it has a high percentage of land under irrigation but is not efficient in
terms of yields, possibly due to difficulties in securing access to fertilizer, rural credit, and other inputs.
11
“Output of pulses, however, is held back by production disincentives relative to cereals.” V. Joshi. 2016. India’s Long Road –
The Search for Prosperity. Delhi: Allen Lane, Penguin Random House India.
12 IMF. 2016. India, 2016 Article IV Consultation Press Release, Staff Report; and statement by the Executive Director for India.
IMF/Country Report 16/75. March. p. 37. www.imf.org
13 Paul Cashin and Rahul Anand. 2016. Taming Indian Inflation. Washington, D.C., International Monetary Fund.
14 Government of India. n.d., Economic Survey 2014-15. New Delhi: Young Global Publications. p. 24.
Source: Government of India. Ministry of Agriculture, Department of Agriculture and Cooperation,
Directorate of Economics and Statistics. 2015. Agricultural Statistics at a Glance 2014. Delhi: Oxford
University Press.
Figure 4: Gross Cropped area, 2010–2011
(%)Rice
Wheat
Oilseeds
Coarse cereals
Pulses
Fibres
Maize
Vegetables
Fruits
Tobacco
6 Supplementary Linked Document 12
14. Given the slow expansion of irrigation, it is important that the existing irrigation facilities are
fully exploited, and that the removal of other constraints on irrigation are prioritized to enhance
productivity. Yields in irrigated states are much higher than the all India average (about 2,100 kg/ha),
but the range of variations even within the irrigated group is also quite large from 1,971 kg/ha in Bihar
to 4,400 kg/ha in Punjab.15
As these states enjoy a high level of irrigation, and are largely cultivating the
staple crops of rice and wheat, the inter-state variations point to the significance of access to related
resources and to different cultivation practices. In other words, one would have expected differences in
yields in states with similar irrigation to be less than differences across the system.
15. As the 2014–2015 Economic Survey observed: “There are wide differences in the yields within
states. Even the best of the states have much lower yield in different crops when compared to the best
in the world.”16
Yields vary from a low of 1,038 kilogram per hectare (kg/ha) to more than 4,000 kg/ha
with all-India average of 2,129 kg/ha. The average yield in the four states with more than 60%
irrigation was 2,957 kg/ha. Punjab (3890 kg/ha) and Haryana (3,689 kg/ha) have yields that are nearly
double the all-India average.
16. Low yields in agriculture have been a major reason for low incomes and slow poverty reduction
in India. Yields need to be increased, especially in rainfed areas.17
The average productivity in Indian
agriculture can increase rapidly, if improving the performance of lagging rainfed agriculture is made a
priority.
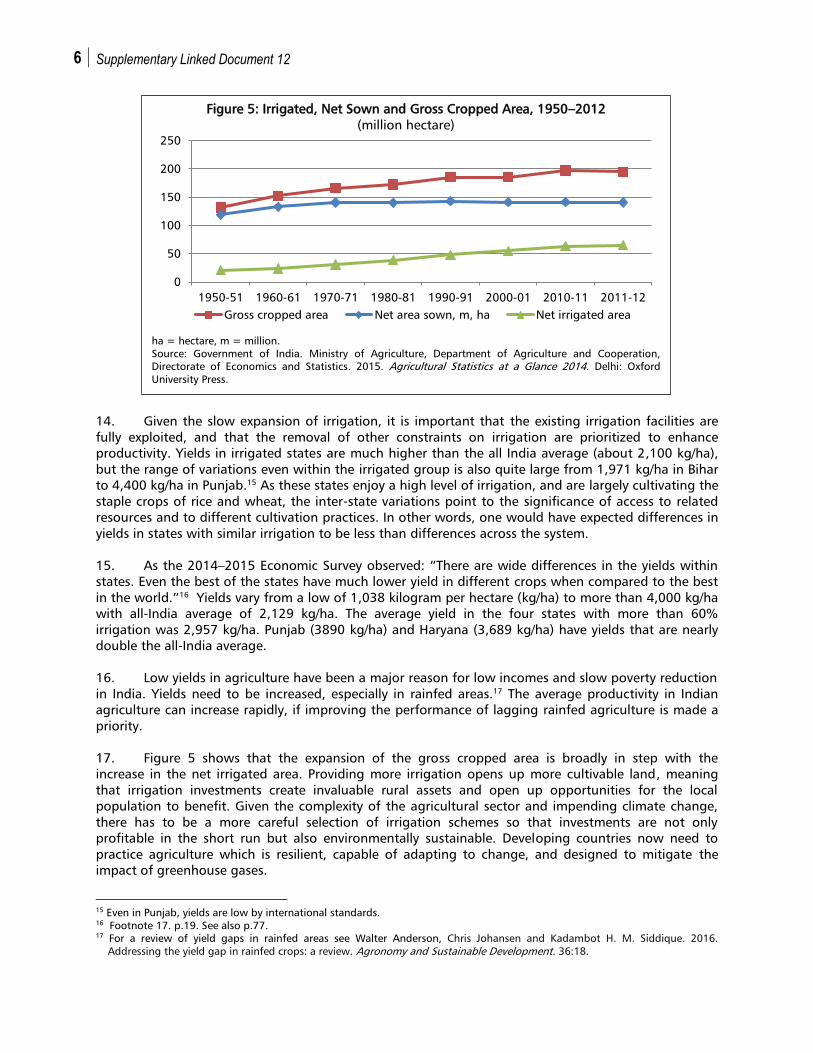
17. Figure 5 shows that the expansion of the gross cropped area is broadly in step with the
increase in the net irrigated area. Providing more irrigation opens up more cultivable land, meaning
that irrigation investments create invaluable rural assets and open up opportunities for the local
population to benefit. Given the complexity of the agricultural sector and impending climate change,
there has to be a more careful selection of irrigation schemes so that investments are not only
profitable in the short run but also environmentally sustainable. Developing countries now need to
practice agriculture which is resilient, capable of adapting to change, and designed to mitigate the
impact of greenhouse gases.
15
Even in Punjab, yields are low by international standards.
16 Footnote 17. p.19. See also p.77.
17 For a review of yield gaps in rainfed areas see Walter Anderson, Chris Johansen and Kadambot H. M. Siddique. 2016.
Addressing the yield gap in rainfed crops: a review. Agronomy and Sustainable Development. 36:18.
Figure 5: Irrigated, Net Sown and Gross Cropped Area, 1950–2012
(million hectare)
ha = hectare, m = million.
Source: Government of India. Ministry of Agriculture, Department of Agriculture and Cooperation,
Directorate of Economics and Statistics. 2015. Agricultural Statistics at a Glance 2014. Delhi: Oxford
University Press.
0
50
100
150
200
250
1950-51 1960-61 1970-71 1980-81 1990-91 2000-01 2010-11 2011-12
Gross cropped area Net area sown, m, ha Net irrigated area

Agriculture and Natural Resources Sector Program in India: A Background Paper and Desk Review 7
4. Ground Water and Watershed Management
18. The water resource situation in India is rapidly worsening, and it is likely to become severe
during coming decades. Per capita availability of water is low, and the water is of poor quality. The
groundwater table is receding as aquifers are being emptied by excessive extraction by tube-wells and
submersible pumps. The water stress is visibly mounting in river basins. Contamination of ground water
signals alarming situation. The north-west of India, which has been leading the wheat and rice
revolution, is the most stressed, although as much as 54% of the country is adversely affected.
19. Irrigation is the major user of water, accounting for more than four-fifths of the total used
water. However, the system is grossly inefficient with existing infrastructure neither well maintained
nor efficiently utilized. Estimates suggest that about one-fifth of the irrigation infrastructure (57 million
ha) remains unutilized. Irrigation practices are in general wasteful and not geared to water
conservation. Simple basic operation and maintenance (O&M) could save significant amounts of this
valuable resource.
20. India is divided in 5,842 water assessment units (2009), consisting of blocks or talukas.18
Of
these, 802 (about 14%) are overexploited while 169 (3%) are critical and another 523 (9%) are semi-
critical. Thus, 26% of the assessment units are already adversely affected and need to be monitored
closely. The remaining 74% are declared to be safe, and in a number of states 100% of the water
assessment units are safe (e.g., Assam, Goa, and other states including in the north-east).
21. Figure 6 shows only those states where assessment units are affected severely and need to be
monitored. In addition to Delhi, major agricultural states such as Haryana, Punjab and Tamil Nadu are
particularly stressed. Rajasthan, which is primarily a desert, is the most severely affected, which does
not come as a surprise. Haryana and Punjab have a high share of canal irrigation, and yet the ground
water condition in these states is precarious. In comparison, over-exploited blocks are fewer in states
with low levels of irrigation.
18
“Water assessment unit” is a generic term used in water sector analysis, although different names are used in different parts of
the country in reference to geographic areas. The term “block” is common and is used in Bihar, Chhattisgarh, Haryana,
Jharkhand, Kerala, Madhya Pradesh, Manipur, Mizoram, Orissa, Punjab, Rajasthan, Tamil Nadu, Tripura, Uttar Pradesh,
Uttarakhand and West Bengal. In the context of command and non-command areas, taluka is used in Karnataka, and is also
used in Goa, Gujarat, Maharashtra and the national capital region of Delhi. Mandal is used in Andhra Pradesh. “Districts
(Valley)” is used in Assam, Himachal Pradesh, Meghalaya, Mizoram, Nagaland, Sikkim, and Tripura. “Region” is used in
Puducherry.
Figure 6: Stressed Water Assessment Units, 2009
(%)
Source: Government of India. Ministry of Agriculture, Department of Agriculture and Cooperation, Directorate of
Economics and Statistics. 2015. Agricultural Statistics at a Glance 2014. Delhi: Oxford University Press.
0%
20%
40%
60%
80%
100%
Over-exploited including critical and semi-critical

8 Supplementary Linked Document 12
22. The condition of assessment units is also linked with the adequacy of rainfall, groundwater
recharging, and the presence of watersheds. If groundwater is not safe, cultivation becomes
precariously dependent on monsoon rains, which adds to the volatility in output.19
The government has
promoted reforms through its National Water Policy, 1987 and 2002, which emphasized participatory
irrigation and integrated water resource management to promote more efficient water use, but much
more needs to be done and with stronger commitment.
23. Private sector and public support. Indian agriculture is, at one level, a private sector enterprise
that is largely driven by the private sector investments. The share of the private sector has been
growing (Figure 7). There is a broad-based public sector support in favor of Indian agriculture because
of the need to maintain food security. The public sector provides cheap power to farmers, ensures
supplies of crucial inputs such as fertilizers at subsidized prices, buys agricultural produce at attractive
and assured prices, provides cheap credits, and regulates the marketing of agricultural products
through legislation and agricultural product marketing committees (APMCs).
24. This amalgam of private initiative and public sector support and regulation makes Indian
agriculture highly complex. Policy reforms and interventions have to pick their way through this maze
extremely carefully. This is especially because, while most of the stimulations and initiatives may
originate with the central government, virtually all programs are implemented at the state level.
Identifying needed reforms and their implementation requires a thorough understanding and deft
handling at multiple levels of administration to ensure robust implementation.
25. Open informal sector. Indian agriculture remains an informal sector of the economy.20
The land
holdings are small, and are being continuously subdivided and fragmented, although there does not
seem to be any striking link, either positive or negative, between the size of holding and the availability
of irrigation (Figure 8). Critical production inputs are often not widely provided by markets or the
organized economy through business credits (except for some large farmers). Disposal of production to
the mills or markets is also, by and large, organized by the farmers themselves on their own or through
19
On details of groundwater see M. Dinesh Kumar. 2007. Groundwater Management in India: Physical, Institutional and Policy-
Alternatives. Delhi: Sage.
20 An important aspect of this informal characterization relates to the mobility of agricultural labor from one region to another.
This has an important developmental implication for the sector, both at the source and the destination of migration.
Figure 7: Public and Private Investments in Indian Agriculture (2004–2005 Prices)
(%)
Source: Government of India. Ministry of Agriculture, Department of Agriculture and Cooperation, Directorate
of Economics and Statistics. 2015. Agricultural Statistics at a Glance 2014. Delhi: Oxford University Press.
0
0.5
1
1.5
2
2.5
3
3.5
2004-05 2005-06 2006-07 2007-08 2008-09 2009-10 2010-11 2011-12 2012-13
Private, %
Public, %

Agriculture and Natural Resources Sector Program in India: A Background Paper and Desk Review 9
brokers or commission agents. In brief, the essential agricultural production model continues to be that
of a peasant farmer.
26. Agricultural development in India since the early 1950s has been successful in its basic task of
ensuring food self-sufficiency for the country’s burgeoning population. However, two successive
droughts in 2014 and 2015 showed how vulnerable the sector is. Food grain production is significantly
down from the highs of 2013–2014 (more than 264 million tons). In the subsequent two years it has
been hovering around 252 million tons, a decrease of 4.5%.
27. The supply of products such as pulses that depend upon rainfall is of crucial importance. The
latest assessment is that during FY2015–2016, the production of coarse grains declined by 11.5% and
pulses by 4% on a year-on-year basis. The production of oilseeds declined by 8% and that of cotton by
more than 13%.21
In a recent decision, the government has decided to increase the buffer for pulses
from 0.8 million tons to 2.0 million tons and has entered into a multiyear contract with Mozambique to
supply pulses. During FY2014–2015, pulses worth $2.78 billion were imported to meet local demand
and ease the pressure on domestic prices, and in FY2015–2016 imports rose $3.9 billion.22
28. The important long-term question is whether Indian agriculture can continue to meet the
challenges it faces now. Needs include: improvements in water resource management for irrigation
purposes, especially in rainfed agricultural areas, and enhancing the efficiency and productivity of the
sector across all categories of agriculture. Reforms and policy support are required to address these two
over-riding concerns.23
Agricultural support will require finance, technology, institutions, and, most
importantly, a re-orientation that views agriculture as a modern business sector of an open economy in
the globalizing context. Some of these aspects are discussed below.
21
Sanjeeb Mukherjee. 2016. Centre Lowers Pulses Output Estimate. Business Standard. 2 August.
22 Sanjeeb Mukherjee. 2016. States too responsible for high pulse prices. Business Standard. 4 August.
23 In February 2011, the Indian Council of Agricultural Research (ICAR) launched a network called National Innovations for Climate
Resilient Agriculture (NICRA) to enhance resilience of Indian agriculture to climate change and climate vulnerability through
strategic research and technology demonstration. For details see: http://www.nicra-icar.in/nicrarevised/index.php/home1
Figure 8: Irrigation by Size of Holding
Source: Government of India. Ministry of Agriculture, Department of Agriculture and Cooperation, Directorate of
Economics and Statistics. 2015. Agricultural Statistics at a Glance 2014. Delhi: Oxford University Press.
0
5000
10000
15000
20000
25000
30000
35000
40000
Unirrigated
Partially Irrigated
Wholly Irrigated
10 Supplementary Linked Document 12
5. Climate Change Interface of Indian Agriculture
29. The adverse global and regional description of environment and climate change caused by
anthropogenic factors is rapidly gathering momentum. The evidence is mounting that the use of
factors like land, water and energy need to be altered radically, if mankind is to avoid major
catastrophic climatic change. Indian agriculture is particularly fragile as it continues to depend on
monsoon rains. A significant shift in the magnitude of rains, or its timing, or its spread across the
subcontinent is capable of disrupting production and supplies. Ground water reservoirs that can serve
as a backup are already under stress in many parts of the country, especially in the northwest, the
bread-basket of the country, Punjab and Haryana.
30. Irregular or heavy monsoons may cause floods in agricultural fields for hundreds of miles along
riverbanks. Much of the water runs off without being harvested or put to any use and causes heavy loss
of life and economic resources. The indiscriminate removal of trees, especially from mountain slopes,
can cause mudslides and flashfloods in hilly regions and adjoining plains. It is estimated that more than
two-fifths of the land in India suffers from one or other features of land degradation, e.g., salinity,
acidity, erosion, and waterlogging,24
sometimes compounded by other types of geo-genetic
contaminations of water resources.
31. At present the Indian countryside lacks the infrastructure needed to protect water, soil and
energy supplies, exposing many people to climate change risks. This neglect could threaten the welfare
of millions, especially vulnerable populations; the poor, women, children and the old. Indian agriculture
needs comprehensive interventions to mitigate such risks and to put in place long-term adaptation
measures.
6. Inclusive Growth and Indian Agriculture
32. Most poor people in India live in rural areas. They belong to socially weaker sections and have
few or no assets. They work as agricultural laborers and are dependent upon wage earnings for their
subsistence. The latest available data show that in 2011 there were about 144 million agricultural
laborers, about 62 million of whom were female. These men and, especially, women are the subject of
inclusive growth programs in rural areas and are a priority to benefit from inclusive growth. India has a
number of programs to provide social protection and extend positive discrimination to these target
groups since achieving Independence in the late 1940s. These have helped to ameliorate conditions of
the poor. However, inclusive development in India is still a work in progress.
33. The rural employment guarantee scheme, the Mahatama Gandhi National Rural Employment
Guarantee Act (MNREGA) is an elaborate program to address the needs of the rural poor. Under the
program, 100 days of employment are guaranteed to at least one member of the household, and
about one-third of the opportunities are reserved for women. In FY2015–2016, more than 13 billion
person-days of work were provided under the scheme, 7.7 billion of which were taken up by women
workers. There are many other programs that target women’s self-help groups and extend
opportunities for gainful employment to women. Notwithstanding, India has one of the lowest labor
force participation rates for women in the world. The present government has launched a number of
new schemes to enhance the skills of women, including the Deen Dayal Upadhaya Grameen Kaushalya
Yojana (DDU-GKY).
34. Despite these activities, growing inequalities in recent years are threatening to erode the gains
of earlier programs. With the greater commercialization of agriculture in pursuit of efficiency and
productivity, there is a need to establish procedures that enhance the poor’s capacity to take part in
24
See P. K. Viswanathan, and Jharna Pathak. 2014. Economic Growth and the State of Natural Resources and the Environment in
Gujarat—A Critical Assessment. in In Indira Hirway, Amita Shah, and Ghanshyam Shah. 2014. Growth or Development –
Which Way is Gujarat Going?. Delhi: Oxford University Press. Table 10.3, p. 396.

Agriculture and Natural Resources Sector Program in India: A Background Paper and Desk Review 11
market-led opportunities.25
There is a need to support inclusive policies and programs, especially when
growth falters, rains fail, or disasters strike. Social inclusion programs in India need to extend effective
protection to vulnerable groups including women, children, the old, scheduled castes and tribes, and
members of other minorities.
7. Toward a Reform and Policy Agenda for the Indian Agriculture
35. Indian policy makers have traditionally been anxious about the need to ensure fail-safe
mechanisms for producing adequate food grain for the growing population. There has been an over-
riding concern to protect farmers from the fickleness of market operations, and a belief that there is a
legitimate role for public policy in balancing the interests of consumers and peasant farmers. Such a
stance has contributed to a rush to ensure production, pro-active procurement, excessive regulation,
and an unwillingness to take any decision that might upset the food grain production process. To the
credit of the system, the immediate objective has been achieved.
36. However, there is a need for a new policy emphasis to address the current concerns of Indian
agriculture and food security. The sector now contributes more than $300 billion to the gross domestic
product. It has succeeded in building food stocks of more than 50 million tons (about 20% of average
annual production). Financial resources are available to import food from overseas markets in case of
shortages. Agricultural exports have exceeded imports during the last few decades (Figure 9), reducing
anxiety about possible food shortages. However, new issues have emerged that need to be addressed.
Some of these are briefly described below.
25
As evidence of growing commercialization, some make the point that in the rural areas it is the non-farm sector that is now
emerging as the major source of employment opportunities rather than the agricultural sector. See Binswanger-Mkhize, Hans
P. 2012. India 1960‐2010: Structural Change, the Rural Nonfarm Sector, and the Prospects for Agriculture. University of
California, Berkley, Department of Agriculture and Resource Economics, May 11.
Figure 9: Indian Agriculture Imports and Exports
Source: Government of India. Ministry of Agriculture, Department of Agriculture and Cooperation, Directorate of Economics
and Statistics. 2015. Agricultural Statistics at a Glance 2014. Delhi: Oxford University Press.
0
5
10
15
20
25
19
90
-9
1
19
91
-9
2
19
92
-9
3
19
93
-9
4
19
94
-9
5
1995-96
19
96
-9
7
19
97
-9
8
19
98
-9
9
19
99
-0
0
20
00
-0
1
20
01
-0
2
20
02
-0
3
20
03
-0
4
20
04
-0
5
20
05
-0
6
20
06
-0
7
20
07
-0
8
20
08
-0
9
20
09
-1
0
20
10
-1
1
20
11
-1
2
20
12
-1
3
20
13
-1
4
Share of national imports,%
Share of national exports, %
3 per. Mov. Avg. (Share of
national imports,%)
Linear (Share of national
imports,%)
3 per. Mov. Avg. (Share of
national exports, %)
3 Period moving average
(Share of national
imports, %)
Linear (Share of national
imports, %)
3 Period moving average
(Share of national exports,
%)

12 Supplementary Linked Document 12
37. Rainfed agriculture. Indian agriculture has traditionally been dependent on monsoon rains and
only about 40% of cultivable land is irrigated. Given the variability of rains in terms of their magnitude
and phasing during the season, agricultural productivity is a risky activity. Farmers need to look for
plants that are less water intensive, but this also often means the production technology is not fully
developed, the crop is not supported by public procurement policy to the same extent as the main
staples (most public subsidies are not applicable to rainfed agriculture), and the crops do not fetch
high prices in the market. It is a sobering thought such conditions affect 60% of cultivation in India,
more if one takes into account that much of the groundwater irrigation is in fact recharged
groundwater supply from the previous rainy season. In this sense, the ground water is an important
hedge against the variability of rains.
38. The supply of fertilizer, pesticide, and insecticides required for rainfed agriculture need to be
ensured26
to raise current levels of productivity. Rainfed agriculture can make up the deficit in critical
areas such as pulses and oilseeds; shortages in these products are currently fueling price spikes and
adding to macroeconomic vulnerabilities.27
Climate change means that supporting rainfed agriculture is
a step toward strengthening sustainable development, as such agriculture has a low environmental
footprint. As many of the rural poor depend upon rainfed agriculture, such a policy would have a
positive influence on poverty reduction and inclusive development.
39. The government established the National Rainfed Area Authority in 2006, but it remained
dormant for a number of years, until the present government took up the task of reviving the
organization and making it functional.28
40. Watershed development. A striking feature of the monsoon is that a high proportion of the
annual rainfall takes place within 2–3 months, resulting in massive floods and run-offs. Except for the
water that goes into charging the groundwater, the rest is wasted and hardly used for cultivation.
Rainwater harvesting is at a nascent stage. Despite hundreds of research studies29
in support of
designing and maintaining watersheds, attention has not been paid to their management. Experience
in some parts of the country indicates that watershed management can have positive impact on the
rabi crop and can smooth out the availability of water over the year for day-to-day use in rural areas.30
It helps the soil to retain moisture and reduces soil erosion and is particularly helpful for the upkeep of
cattle and animal husbandry. Watershed management should be part of larger improvements in water
utilization, including integrated water resource management (IWRM). The Office of Watershed
Management is now being merged with and restructured under PMKSY.
41. Irrigation infrastructure. The pace of building irrigation infrastructure has been slow and has
constrained progress in agricultural productivity. New seed varieties and fertilizers depend upon regular
and timely irrigation to yield results. Progress has not been encouraging, and more attention to
irrigation is required to address the gap in productivity between areas with or without irrigation. In
many areas where irrigation facilities have been built, they are not fully used because of poor
operations, lack of maintenance, or the bureaucratic handling of water users’ associations.
26
“Many rainfed cropping systems appear to have relatively large yield gaps that could be closed with existing technologies but
persist largely for economic reasons.” David B. Lobell, Kenneth G. Cassman, and Christopher B. Field. 2009. Crop Yield Gaps:
Their Importance, Magnitudes and Causes. Annual Review of Environment and Resources. 2 July, p. 200 (emphasis added).
27 “The one significant upside possibility is a good monsoon. This would increase real consumption and, to the extent that it
dampens price pressures, open up further space for monetary easing.” Government of India. 2015. Economic Survey 2015–16.
New Delhi: Commercial Law Publishers (Pvt) Ltd. p.16. para. 149.
28 See nraa.gov.in
29 Including ICRISAT and the M.S. Swaminath Foundation, among others.
30 “A large part of the increased irrigation area in the post-2000 period is likely to be due to favorable rainfall and a massive drive
for constructing small check dams for developing groundwater irrigation, especially in the western part of the state.” in Amita
Shah and Itishree Pattanaik. 2014. High Growth Agriculture in Gujarat – An Enquiry into Inclusiveness and Sustainability. In
Indira Hirway, Amita Shah, and Ghanshyam Shah. 2014. Growth or Development – Which Way is Gujarat Going?. Delhi:
Oxford University Press, p. 232.

Agriculture and Natural Resources Sector Program in India: A Background Paper and Desk Review 13
42. Irrigation policy has favored tube-wells, which draw upon electricity supply and related
subsidies and can deplete aquifers. The groundwater table in several states is now low. In many areas,
groundwater is now contaminated by salinity, iron, fluoride, and arsenic.
43. The present government is trying to speed up construction of irrigation infrastructure under the
Prime Minister’s Kisan Sinchai Yojana (Prime Minister’s Farmer Irrigation Scheme). Under this program,
irrigation schemes are now being drawn up in every district in an integrated manner, and will be
consolidated at the state level.
44. The International Water Management Institute, in collaboration with Sir Ratan Tata Trust, is
now undertaking a North Gujarat Groundwater Initiative to introduce “water efficient irrigation
devices, water-efficient crops, and land management practices among farmers in an effort to help them
cut down groundwater use in irrigated agriculture without adversely affecting the economic prospects
of farming.”31
In summary, despite the framework of planning in India, much of the progress that has
been made in irrigated agriculture has remained oblivious to the long-term sustainability of its
operations.
45. Productivity differentials. Productivity levels in Indian agriculture vary a lot, sometimes by as
much as ten times within the same district or a province, indicating uneven outreach and application of
technology, expertise, or other inputs. Such variations are difficult to understand when both areas are
equipped with irrigation facilities. Through demonstration effects, training, and visits, it should have
been possible to spread good farm practices to holdings that are not performing well quite easily. At
the state level, average productivity in lagging states is about 50% of that in the leading states. Much
of the concern and anxiety about the production of staples could be minimized if cultivators in lagging
areas could be brought up to the levels of the leading states.
46. States with substantial areas under irrigation need to perform better in terms of yields and
agricultural productivity. Bihar is a prime example. About two-thirds (67.4%) of the cultivated area is
under irrigation yet yields are barely above all India average. Bihar’s total production of food grains is
only about 13 million tonnes. For jute and mesta, Bihar is a distant second to West Bengal. India could
make rapid progress by improving productivity in such areas. The government’s enhanced emphasis on
yield and productivity is captured in the following observation.32
A rising concern in recent times has been the high level of food inflation, seasonal and short-
term price spikes in some commodities like onions, tomatoes, and potatoes which have become
more frequent, more severe, and more lasting, hurting consumers and causing economic
instability. A strategy of price-led growth in agriculture is, therefore, not sustainable; also the
room for increasing production through raising cropped area is virtually non-existent. Hence
the strategy for growth in agriculture has to rely more on the non-price factors, viz., yield and
productivity.
47. Fertilizer production and pricing policy. The government needs to take a fresh look at policy
supporting the production and pricing of fertilizers in India. Fertilizers continue to be a source of
agricultural subsidies to farmers. For example, the price of urea, which accounts for bulk of subsidies,
has remained largely unchanged for over a decade. It remains heavily subsidized in relation to both
international prices as well as relative to phosphate and potassium fertilizers.33
48. The government is contemplating a new policy, and is beginning to take some steps. For
example, in July 2016 the government decided to revive three defunct fertilizer factories in Bihar,
31
P. K. Viswanathan and Jharna Pathak. 2014. Economic Growth and the State of Natural Resources and the Environment in
Gujarat. Footnote 32. p. 417.
32 Footnote 16. p. 76.
33 Footnote 14. p. 69.

14 Supplementary Linked Document 12
Jharkhand, and Uttar Pradesh, with a view to (i) increasing the production of urea, and
(ii) manufacturing it near areas with unmet demand. In addition to increasing supplies, the location of
the factories is likely to reduce freight subsidies. An appropriate fertilizer pricing policy is needed not
only to improve public finances but also because it incentivizes the use and the relative share of
different fertilizers (urea, phosphate and potassium) in cultivation.
49. Production and marketing disconnect. A significant part of production is lost in the process of
marketing due to institutional impediments, the distant location of markets, lack of storage and
transportation facilities, and the absence of sorting and grading of produce. To some extent this is
because of deficient infrastructure (e.g., cold storage, transport, and rural roads) and to some extent
because of excessive regulation under the Agricultural Production Marketing Committee Act (APMC
Act). In this context, the Economic Survey 2014–15 observes:34
“Even the model APMC Act treats the
APMC as an arm of the State, and, the market fee, as the tax levied by the State, rather than a fee
charged for providing services. This is a crucial provision which acts as a major impediment to creating
national common market in agricultural commodities.”
50. At present, the market for agricultural produce is highly segmented and subdivided. There is no
national uniform market for agricultural produce in India. As a result, even if there are buyers willing to
pay, local producers are not able to make their first sale outside the prescribed markets (mandis), which
are dominated by commission agents and contractors. The present government is now taking steps to
create a nationwide market for agricultural produce. The problem is particularly severe in the case of
perishable products such as fresh fruits, vegetables and flowers.
51. Organizational efficiency. Organizing cultivators into bigger groups would facilitate their
participation in the functioning of markets, whether as buyers of inputs (e.g., seeds, fertilizers,
pesticides, and insecticides) or as collective sellers able to charge higher prices in distant markets, or as
cultivators in the form of contract farming. The main principle is to reorganize agricultural activities in a
manner that is conducive to efficient production and value-addition. If farming is to change from a
consumption-oriented activity conducted by the peasantry into a business activity, it has to pursue
efficiency, economize in inputs, and augment efforts to add value. This is particularly important when
farming is supported by rural credit, meaning that risky investments are being made with borrowed
funds. Access to new technology and knowledge about varieties of produce is hard to secure in the
absence of an agile functioning organization at the field level. Training and visits by extension services
need to be organized more effectively and efficiently as part of organizational reforms in farming.
52. Crop insurance and social safety nets. Given the multiple hazards that agricultural production is
exposed to, crop insurance is also needed. Such insurance policies have been employed in the
agricultural sector of developed economies for more than a 100 years and in India a proposal published
as early as 1920 examined the potential of applying rainfall-index based drought insurance in the then
State of Mysore (the region now included in the state of Karnataka).35
53. In recent times, yield-based crop insurance made a formal entry as government policy in India
under the Comprehensive Crop Insurance Scheme in 1985. This was expanded in 1999 as the National
Agricultural Insurance Scheme. Weather-based crop insurance was launched in 2007.36
The World Trade
Organization support for subsidizing insurance premiums and agriculture insurance is an important and
legitimate instrument of controlling and mitigating risks arising out of climate change and
environmental disasters. However, the coverage and the effectiveness of insurance in Indian agriculture
has been limited.37
This prompted the present government to introduce a modified crop insurance
34
Footnote 16. p.117.
35 J.S. Chakravarti. 1920. Agricultural Insurance: A Practical Scheme Suited to Indian Conditions. Bangalore: Government Press.
36 ICICI bank piloted a credit-linked crop insurance scheme in a district of Andhra Pradesh.
37 There are also some crop-specific insurance schemes covering apples, grapes, coconut, and palm plantations.

Agriculture and Natural Resources Sector Program in India: A Background Paper and Desk Review 15
scheme in January 2016 under the banner of Pradhan Mantri Fasal Bima Yojana (PMFBY, or Prime
Minister’s Crop Insurance Scheme).
54. Before the new policy was introduced, 45.3 million hectares (23.3% of the gross cropped area
of 194.4 million hectares) was covered under crop insurance in 2014–2015. The range of coverage was
highest in the case of vegetables at 38%, and least in the case of sugar cane crops (2.7%). For the
staple crops, the coverage was 23.4% for rice and 25.4% for wheat. In terms of states, the coverage
was highest at about 50% in Rajasthan and the least about 4% in Andhra Pradesh. There is a need to
bring greater awareness of the program as some states (e.g., Punjab and Haryana) do not subscribe to
the idea of insurance and do not see any merit in joining the program.38
55. In its present form, PMFBY has been modified to function as a social safety net. Coverage under
the scheme has increased while premiums have been reduced. PMFBY covers major crops in both the
kharif (2% premium rate) and rabi (1.5% premium rate) seasons, with a premium rate of 5% for
commercial and horticulture crops. It is envisaged that the gross cropped area under insurance will
increase from about 23% (in FY2014–2015) to about 50% in the next 2–3 years.
56. The global outlook for grain production is of unprecedented bumper crops of wheat, corn and
soya beans. The International Grain Council expects world stocks to exceed 2 billion tonnes. This is
because the US is reporting a glut in grain production for the fourth year in the row,39
and the news
from major producers of food grain elsewhere also points to excessive production in Russia, Ukraine,
and the EU. These bumper crops are aided by favorable weather as the producing regions have moved
out of the El Niño effect. The latter, however, caused in India, a second successive year of widespread
drought with a marginal decline in agricultural production, especially in unirrigated areas.
C. Agriculture in ADB’s India Country Partnership Strategy and Operation
1. Country strategy and focal areas in agriculture
57. Prepared in the wake of ADB’s poverty reduction strategy (1999), ADB’s India country strategy
and program, 2003–2006 identified operations in agriculture, irrigation, and rural infrastructure as
important entry points for addressing rural poverty as well as for negotiating the impending water
crisis. ADB prepared itself for operations in these areas by undertaking studies on: (i) the policies and
priorities of the government in the agriculture sector, (ii) the prevalence of participatory irrigation
management, (iii) integrated water resource management (IWRM), (iv) tank irrigation systems, and (v)
prospects for agribusiness development. ADB’s first operation, a loan supporting the renovation of a
minor participatory irrigation system in Chhattisgarh, was prepared with the help of project
preparatory technical assistance (PPTA), and was approved in 2005.40
58. The succeeding country partnership strategy (CPS), 2008–2012 reaffirmed ADB’s engagement
in rural infrastructure, including irrigation, water resources management, rural markets, and transport
facilities. The proposed investments were in line with the priorities of the government’s five year plan
and ADB’s Strategy 2020 and a broader water fina
59. This section provides a profile of ADB’s loan operations in the agriculture and natural resources
(ANR) sector, followed by a description of grant projects, mainly supported by Japan Fund for Poverty
38
Livestock insurance schemes are a separate issue and are not included in the discussion here.
39 The US is reportedly expecting a yield of 50.5 bushels per acre for the winter wheat (a wheat bushel at 13.5% moisture by
weight is equivalent to 60 pounds, or 27.2155 kilograms). Financial Times. 12 July 2016. This works out to a yield of 1,375
kilograms per acre, or about 4,000 per hectare, compared with the Indian wheat yield of about 3,000 per irrigated hectare.
40 ADB. 2005. Report and Recommendations of the President to the Board of Directors: Proposed Loan to India for the
Chhattisgarh Irrigation Development Project. Manila.
16 Supplementary Linked Document 12
Reduction (JFPR). It is followed by a description of ADB’s technical assistance operations, and a
summary of the evaluation of ANR sector in India based on the last CPS final report (2012).
2. ADB Loan Operations
a. Orissa Integrated Irrigated Agriculture and Water Management Investment
Program
60. The Orissa Integrated Irrigated Agriculture and Water Management Investment Program (OIIA)
was approved in 2008 as a multitranche financing facility (MFF) for $188.2 million.41
The program
sought to enhance productivity, water use efficiency and sustainability of the irrigation schemes in the
four northern river basins, as well as to extend investment support to a part of the Mahanadi river
delta. The program included six major and nine medium-sized irrigation schemes covering a net
irrigated area of 185,000 ha and 1,400 community-based minor lift irrigation schemes covering an
additional 30,000 ha. In all, 1.7 million people were expected to benefit under the program.42
The
Odisha Department of Water Resources was designated as the executing agency for the program.
61. The program’s scope included: (i) renovation and extension of irrigation and related
infrastructure, (ii) empowerment of water users’ associations (WUAs) and their progressive involvement
in O&M, and (iii) agriculture-related support services and livelihood enhancement of the poor. It was
expected to reduce inefficiency in irrigation systems as over 30% of the area equipped with irrigation at
present did not receive a regular supply because of the lack of field channels, poor design and
operations, and insufficient maintenance. Besides improving the functioning of the irrigation system,
the program seeks to promote the conjunctive use of groundwater in a bid to improve water-use
efficiency, crop intensification, and diversification.
62. OIIA envisages a number of capacity-building steps. The program emphasizes the strategic role
of beneficiary participation, especially for those at the end of the irrigation channel or canal. The Water
and Land Management Institute, a state-level training and research institute under the Department of
Water Resources (DOWR), is expected to provide technical and institutional backup and training
support for participatory irrigation management and IWRM. OIIA intended to establish a fund to
strengthen the institution and its autonomous functioning. As a part of institution building, the state’s
Pani Panchayat Act 2002 (water council legislation) and Pani Panchayat Rules (water council guidelines)
should be strengthened and made to serve as an instrument of dispensing water-sharing decisions.
63. Project 1 was completed on 30 September 2015, after an extension of 24 months. It was
cofinanced by the OPEC Fund for International Development for $30 million. The outcomes of project 1
as of 30 June 2015 were: the irrigated area increased by 43% (the target was 40%); cropping intensity
increased by 44% (target 20%); and crop production increased more than three times (target 50%).
However, an assessment of the increase in irrigation efficiency has not been made. Progress in terms of
the sustainability of institutions has been slow as empowerment of the Pani Panchayat has been
delayed. Since many of the project 1 outputs had made substantial progress toward achieving their
targets, ADB approved a project 2 loan of $120 million on 30 June 2015. It became effective on 28
June 2016 and is expected to be completed on 17 September 2018.
41
ADB. 2008. Report and Recommendations of the President to the Board of Directors: Proposed Multitranche Financing Facility
to India for the Orissa Integrated Irrigated Agriculture and Water Management Investment Program. Manila (MFF 0022 and
Loan 2444).
42 On 13 February 2009, the ADB Board approved the administration of an OPEC Fund for International Development (OFID) loan
of $30 million and decreased the amount of the MFF to $157.5 million. In February 2015, the President approved an extension
of the MFF availability period until 17 September 2018.

Agriculture and Natural Resources Sector Program in India: A Background Paper and Desk Review 17
b. Agribusiness Infrastructure Development Investment Program43
64. The Agribusiness Infrastructure Development Investment Program aims to address three main
constraints on agriculture growth in India: (i) outdated technologies and management; (ii) lack of
public investment in linking infrastructure (such as roads from production areas to collection points);
and (iii) lack of private investment and management in modern marketing infrastructure (such as cold
chains, controlled atmosphere storages, and automated grading). Focusing on integrated value chains
(IVC) in agriculture, the program seeks to plug physical and institutional gaps by (i) supporting site and
infrastructure development for agribusiness, (ii) providing connectivity and basic services across the
value-addition chain, (iii) linking back with agriculture production through contract farming and
producer companies, and (iv) upgrading technical and managerial skills and capacity building along the
value chain.
65. The program seeks to develop (i) spatially and institutionally linked value chains for high-value
horticultural crops, and (ii) small producers to associate in groups, e.g., into producer companies to
partake in marketing opportunities effectively. The investment program outputs include (i) functional
IVC infrastructure, (ii) stakeholders effectively participating in and properly managing the IVCs, and (iii)
state government officials efficiently performing their regulatory and oversight functions over the IVCs
and the public–private partnership (PPP) contracts.
66. Although Indian agriculture is predominantly a private sector activity, and it has traditionally
strongly been supported by the public policy, public investments, R&D inputs and extension services,
there have not been many formal PPP transactions in the sector. The scope of PPPs to add to the value
chains in the sector is almost limitless. The program seeks to open up this potential in India.
67. The program covers horticulture in the selected regions of Bihar and Maharashtra. The two
states differ from each other in terms of infrastructure, water resources, and climate as well as having
different marketing policies for agricultural produce. Bihar promotes agricultural marketing as a
private-sector-led activity, and Maharashtra keeps the role of public sector as a regulator and market
manager while supporting private sector participation
68. The Bihar Department of Agriculture, and the Maharashtra Department of Cooperation,
Marketing and Textiles, are the executing agencies for the program. They faced a steep learning curve
as previously they had only limited experience of implementing internationally funded programs.
Project management units within these departments functioned as implementing agencies. The
program is supported by a Japan Fund for Poverty Reduction (JFPR) project, Improving Small Farmers’
Access to Integrated Value Chains in Bihar and Maharashtra, for $3 million. The ADB Board approved
the project on 30 July 2010 to complement the loan-funded program.
69. Upon approval, the program faced some start-up issues. It underwent a major change in scope
in 2011. In ADB, MFFs are expected to begin implementation within 12 months of Board approval so
the initial delay necessitated seeking Board’s sanction to renew its approval for implementation.
Implementation arrangements for the two states needed to be separated so that Bihar and
Maharashtra could implement the programs at their own individual pace rather than implementing the
program together as was stipulated in the program loan design.44
70. As of 30 June 2015, there was little to report on the Bihar project. Apparently, the state
government of Bihar was not fully on board with the proposed PPP model. Maharashtra too faced
43
ADB. 2010. Report and Recommendation of the President to the Board of Directors: Proposed Multitranche Financing Facility to
India for the Agribusiness Development Investment Program. Manila (Loan 2837).
44 ADB. 2011. Report and Recommendation of the President to the Board of Directors: Proposed Multitranche Financing Facility to
India for the Agribusiness Infrastructure Development Investment Program Major Change in Implementation Arrangements.
Manila.

18 Supplementary Linked Document 12
some difficulties in implementing the project and as of 30 June 2015 was awaiting selection of a PPP
partner. Both projects have since been closed. (see also para. 104).
c. Sustainable Coastal Protection Investment Program
71. India has a long coastline of about 9.6 thousand kilometers. A significant proportion of its
total population (20%–25%) lives on and around its shores. The safety of the inhabitants and their
sustained development is a high priority of the government, especially with climate change and more
frequent and disruptive natural disasters increasingly damaging the coastline. Approved in 2010 for
$250.0 million, the Sustainable Coastal Protection Investment Program is an innovative MFF program
seeking to improve planning and management of India’s western coastline across states of Goa,45
Karnataka and Maharashtra on a sustainable basis.46
The program seeks to promote participatory
practices and the involvement of the private sector in coastal management of the country.
72. The program outcomes are: (i) providing a protected and managed shoreline in the three
states, (ii) meeting the needs of stakeholders, and (iii) protecting the environment. Program outputs
include: (i) developed sustainable plans and management of shorelines; (ii) reduced coastal erosion and
instability, and (iii) enhanced capacity for shoreline planning and management. The second output is
the focal concern, accounting for about 89% of the base cost of the program. In terms of the
program’s approach toward protecting shorelines, traditional methods have relied almost exclusively
on physical interventions such as seawalls, groins, or protective boulders on the coastline. The new
approaches to coastal management under the program, however, prefer softer interventions such as
sand dunes, mangroves and reefs, to replace or supplement traditional methods.
73. Each of the focal states has its own executing agency. In Karnataka the Public Works, Ports and
Inland Water Transport Department; and in Maharashtra, the Maharashtra Maritime Board. A program
management unit, headed by a full-time project director, was envisaged for each state. A number of
agencies and organizations at the central and state levels are involved in coastal management in India,
primarily dealing with the environment, water, and forestry, but there are variations across the states.
Coastal management under the program presents the challenge of coordinating a disparate group of
institutions in each state.
74. The progress report as of 30 June 2015 relates to the states of Karnataka and Maharashtra.
Progress has been slow and the project duration was extended by 24 months. The latest reports
indicate that, in the case of Maharashtra, there has been some progress in terms of reef construction
and recruitment of consultants but all other activities under the project were pending and showing no
disbursement. These activities included training, studies and surveys, and community initiatives. Reef
construction itself seemed to have been delayed and started only in November 2015. The shore
management plan is being held up because consultants have not been engaged so far under the
project. The state of Karnataka, accounting for 80% of the total loan under project 1, is reported to
have made progress. In the meantime, at the request of the government, ADB has agreed to cancel
$4.19 million of the loan amount (to save commitment charges). The quality of reporting needs to be
improved.
d. Karnataka Integrated and Sustainable Water Resources Management
Investment Program
75. The MFF for the Karnataka Integrated and Sustainable Water Resource Management
Investment Program, approved in 2014 for loan financing of $150 million, seeks to improve water
availability in selected river basins in the state of Karnataka to improve the growing demand for water
45
Goa component was not eventually implemented. Consequently, project scope was confined to the remaining two states.
46 ADB. 2010. Report and Recommendation of the President to the Board of Directors: Proposed Multitranche Financing Facility to
India for the Sustainable Coastal Protection Investment Program. Manila.

Agriculture and Natural Resources Sector Program in India: A Background Paper and Desk Review 19
in the state. The program follows the integrated water resources management (IWRM) approach and is
aimed at improving water use efficiency in irrigated agriculture, thereby enhancing economic
opportunities and improving rural incomes.
76. The outcome of the facility is expected to be integrated water resources management
successfully implemented in selected river basins in Karnataka. The expected outputs of the program
include: (i) state and basin institutions strengthened for IWRM, (ii) irrigation system infrastructure and
management modernized, and (iii) program management systems operational. The Karnataka Neeravari
Nigam Limited (state water corporation) was designated as the executing agency.
77. About 2.5 million hectares of irrigation have been developed in the state in the post-
Independence period. However, utilization of these facilities for irrigating crops is quite low, about
40% of total capacity. The major reasons are deficient infrastructure, especially poor maintenance and
management of water systems. As a result, agriculture and the water situation are stressed, and
growing urban demands for water threatens to squeeze this further. The program pursues improved
water management methods which can be immensely beneficial for the state.
78. A number of departments and agencies in the state have overlapping jurisdictions and roles in
relation to water, water policy, water resource utilization and its management. These include ground
water resources, irrigation, mines and geology, agriculture and horticulture, animal husbandry and
fisheries, forestry, ecology and environment, industries and commerce, rural development and
Panchayat Raj institutions. As project was approved only in 2014, not much progress had been
reported as of 30 June 2015.
3. Grant Projects
79. In terms of grant projects in the Indian ANR sector, the Japan Fund for Poverty Reduction has a
number of projects in tandem with the loan operations of ADB.
a. Capacity Building and Livelihood Enhancement of Poor Water Users (Financed
by the Japan Fund for Poverty Reduction, Grant 9134)
80. The Capacity Building and Livelihood Enhancement of Poor Water Users47
project was funded
by a $2.0 million grant. It intends to develop, on a pilot basis, models to strengthen poor water users.
The project sought to (i) improve their livelihoods, (ii) strengthen their participation and representations
in Pani Panchayat (water council) systems, and (iii) build the capacity of the Department of Water
Resources (DOWR) and water sector NGOs. The project was envisaged to run for 3 years.
81. The project intended to establish informal subgroups and to include in water councils groups
that were dependent upon the use of reservoir water and irrigation channels for their livelihood,
including fishers, fisheries self-help groups, livestock owners, and washermen (persons whose
occupation is washing clothes). In order to promote their welfare and participation, Pani Panchayats
needed to evolve into and function as multifacility service providers. The project intended to assist in
pilot testing the inclusion and equal representation of vulnerable people in Pani Panchayats to support
the informal livelihood interests of different groups and subgroups.
47
ADB. 2009. Proposed Grant Assistance to India for Capacity Building and Livelihood Enhancement of Poor Water Users
(Financed by the Japan Fund for Poverty Reduction). Manila.

20 Supplementary Linked Document 12
b. Improving Small Farmers’ Access to Market in Bihar and Maharashtra (Financed
by the Japan Fund for Poverty Reduction, Grant 9147)
82. The project for Improving Small Farmers’ Access to Markets in Bihar and Maharashtra was
financed by the Japan Fund for Poverty Reduction48
for $3.0 million. It was approved to enhance
integration of small-scale fresh fruit and vegetable farmers, including female and scheduled caste and
scheduled tribe farmers, into the horticulture value chains in those states. The project was envisaged to
be implemented over 3 years.
83. The outputs of the project were to be: (i) 2,000 small-scale farmers organized into 20 effective
farmer groups (six in Bihar, 14 in Maharashtra); (ii) four farmer groups developed into producer
companies (one in Bihar, three in Maharashtra); (iii) 20 farmer groups and four producer companies
trained in business, technical, and organizational management skills; and (iv) farmer groups and
producer companies to establish long-term mutually beneficial agreements with buyers. The main
activities of the project were: (i) formation of farmer groups and producer companies; (ii) capacity
development; (iii) facilitation of farmer–buyer linkages; and (iv) project management, monitoring, and
evaluation.
84. With a view to facilitating the emergence of an all-India market for agricultural produce and
after long deliberations, the government finally modified the Agriculture Produce Market Committee
Act (APMC Act) and produced model legislation to be used by states. It gave states the option to
handle the marketing of their produce at their discretion. Under this provision, Maharashtra State
Government adopted a Model APMC Act in 2007, while Bihar State government repealed its APMC Act
in 2006. This has opened up space for new initiatives in the marketing of fresh fruit and vegetables to
emerge in both states.
c. Livelihood Improvement for River Erosion Victims in Assam (Financed by the
Japan Fund for Poverty Reduction, Grant 9168)
85. The project Livelihood Improvement for River Erosion Victims in Assam (financed by the Japan
Fund for Poverty Reduction)49
was approved for $2.5 million to improve incomes of vulnerable victims
of river erosion in the subproject areas of Kaziranga, Dibrugarh and Palasbari in Assam state. The
project defines vulnerable groups comprehensively. They include the displaced, the landless, the
marginalized, the capital and asset poor, the unskilled, and those likely to experience multiple
dimensions of poverty (e.g., households headed by females and widows). The project was envisaged to
be implemented over 3 years.
86. The project includes three type of target groups: (i) the Eri silk spinning and weaving group, (ii)
fresh fruit and vegetable producers and vendors, and (iii) training youth and skill upgrading. The Eri
silk spinning and weaving component focuses on improving the profitability of women in Palasbari by
supporting training, providing technology, establishing links and organizing spinners and weavers into
a producer organization to ensure a more sustainable intervention.
87. The vegetable production and sales component focuses on improving the vegetable production
and marketing skills of 1,000 families (800 in Kaziranga and 200 in Palasbari). Technical assistance
would be provided for an appropriate package of practices for improved seed and for improving access
to the market by aggregating, collecting and transporting members’ produce.
48
ADB. 2010. Proposed Grant Assistance to India for Improving Small Farmers’ Access to Market in Bihar and Maharashtra
(Financed by the Japan Fund for Poverty Reduction). Manila.
49 ADB. 2012. Proposed Grant Assistance to India for Livelihood Improvement for River Erosion Victims in Assam (Financed by the
Japan Fund for Poverty Reduction). Manila.
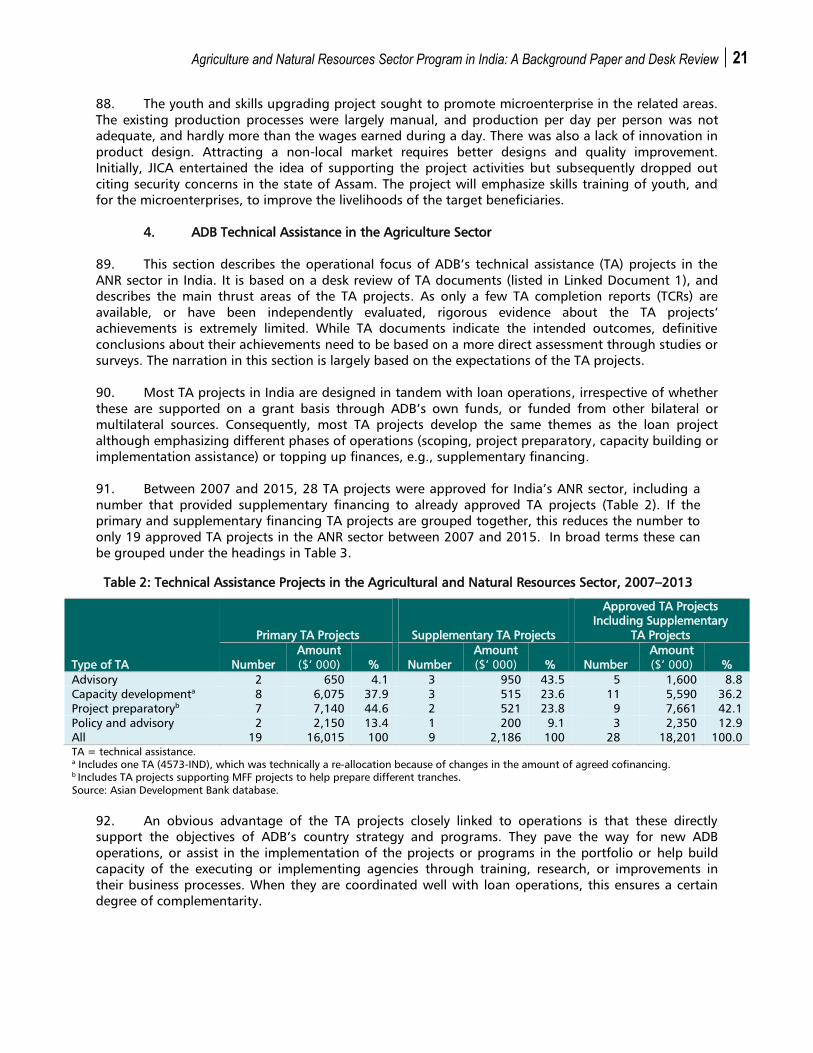
Agriculture and Natural Resources Sector Program in India: A Background Paper and Desk Review 21
88. The youth and skills upgrading project sought to promote microenterprise in the related areas.
The existing production processes were largely manual, and production per day per person was not
adequate, and hardly more than the wages earned during a day. There was also a lack of innovation in
product design. Attracting a non-local market requires better designs and quality improvement.
Initially, JICA entertained the idea of supporting the project activities but subsequently dropped out
citing security concerns in the state of Assam. The project will emphasize skills training of youth, and
for the microenterprises, to improve the livelihoods of the target beneficiaries.
4. ADB Technical Assistance in the Agriculture Sector
89. This section describes the operational focus of ADB’s technical assistance (TA) projects in the
ANR sector in India. It is based on a desk review of TA documents (listed in Linked Document 1), and
describes the main thrust areas of the TA projects. As only a few TA completion reports (TCRs) are
available, or have been independently evaluated, rigorous evidence about the TA projects’
achievements is extremely limited. While TA documents indicate the intended outcomes, definitive
conclusions about their achievements need to be based on a more direct assessment through studies or
surveys. The narration in this section is largely based on the expectations of the TA projects.
90. Most TA projects in India are designed in tandem with loan operations, irrespective of whether
these are supported on a grant basis through ADB’s own funds, or funded from other bilateral or
multilateral sources. Consequently, most TA projects develop the same themes as the loan project
although emphasizing different phases of operations (scoping, project preparatory, capacity building or
implementation assistance) or topping up finances, e.g., supplementary financing.
91. Between 2007 and 2015, 28 TA projects were approved for India’s ANR sector, including a
number that provided supplementary financing to already approved TA projects (Table 2). If the
primary and supplementary financing TA projects are grouped together, this reduces the number to
only 19 approved TA projects in the ANR sector between 2007 and 2015. In broad terms these can
be grouped under the headings in Table 3.
Table 2: Technical Assistance Projects in the Agricultural and Natural Resources Sector, 2007–2013
Type of TA
Primary TA Projects Supplementary TA Projects
Approved TA Projects
Including Supplementary
TA Projects
Number
Amount
($’ 000) % Number
Amount
($’ 000)
% Number
Amount
($’ 000) %
Advisory 2 650 4.1 3 950 43.5 5 1,600 8.8
Capacity developmenta 8 6,075 37.9 3 515 23.6 11 5,590 36.2
Project preparatoryb 7 7,140 44.6 2 521 23.8 9 7,661 42.1
Policy and advisory 2 2,150 13.4 1 200 9.1 3 2,350 12.9
All 19 16,015 100 9 2,186 100 28 18,201 100.0
TA = technical assistance.
a Includes one TA (4573-IND), which was technically a re-allocation because of changes in the amount of agreed cofinancing.
b Includes TA projects supporting MFF projects to help prepare different tranches.
Source: Asian Development Bank database.
92. An obvious advantage of the TA projects closely linked to operations is that these directly
support the objectives of ADB’s country strategy and programs. They pave the way for new ADB
operations, or assist in the implementation of the projects or programs in the portfolio or help build
capacity of the executing or implementing agencies through training, research, or improvements in
their business processes. When they are coordinated well with loan operations, this ensures a certain
degree of complementarity.

22 Supplementary Linked Document 12
Table 3: Type of Technical Assistance across Major Activity Groups
Particulars
ADTA PPTA CDTA PATA
No. and
Value ($’000)
No. and
Value ($’000)
No. and
Value ($’000)
No. and
Value ($’000)
Agricultural Production,
Marketing and Distribution 2 ($650) 2 ($2,000) 4 ($2,575) 0
River Basins, Water Resource
and Flood Management 0 3 ($3,000) 2 ($1,300) 0
Conservation, Natural
Resources, Climate Change
and Coastal Management 0 2 ($2,140) 2 ($2,200) 2 ($2,150)
Total 2 ($650) 7 ($7,140) 8 ($6,075) 2 ($2,150)
ADTA = advisory technical assistance, CDTA = capacity development technical assistance, PATA = policy and advisory technical assistance,
PPTA = project preparatory technical assistance.
Source: Asian Development Bank database.
93. In India, most TA projects focus directly on states where ADB has operations, e.g., Assam (flood
management), Goa (coastal protection), Karnataka (river-basin and integrated water resource
management and coastal protection), Maharashtra (agribusiness and coastal protection), Odisha
(participatory irrigation and integrated water resource management) and Tamil Nadu (integrated water
resource management). The downside is that a tight link can make the TA program ad hoc and
narrowly focused. TA projects in such situations can ignore larger sector-wide issues and reforms
beyond the approved loan operations and may miss an opportunity to form a complete picture about
the underlying rationale and coherence of sector interventions, and their potential impact on the
development process in the country.
D. Assessment of ADB Operations
1. Country Partnership Strategy Final Report Validation—An Assessment of Agriculture
and Natural Resource Operations
94. IED carried out a validation of the 2008–2012 country partnership strategy final report (CPSFR)
in 2013.50
It assessed agriculture and natural resource (ANR) projects as relevant, effective, efficient and
likely sustainable. The overall conclusion was that the sector interventions were successful. The
assessment was largely based on a field visit and discussions in the field and at state level as none of
the ANR projects had been completed or evaluated at that time. IED observed that investments in the
ANR sector and rural infrastructure development were moving slowly and taking time to grow. The
program had received only a small amount of the allocation and interventions had been confined to
one or two states. According to IED, this situation did not correspond to the importance of the issues
that had been identified in the approach of the CPS to India’s development concerns.
95. The CPSFR concluded that the ANR program was likely to make a significant impact on the
wider economy of the irrigated area. Agricultural yield was expected to improve as an outcome of
investments under the projects. Improved irrigation would allow for crop diversification. This, in turn,
would generate more employment opportunities and more income in neighboring rural areas,
especially for women. Water users’ associations (WUAs) were likely to catalyze not only improved water
resource management but other development activities at the local level, once the stakeholders became
organized as change agents and saw the results of their efforts. In this sense, WUAs could eventually
become a useful instrument of change and development in rural regions. Likewise, improvements in
flood control and water resource management were likely to impact agriculture as well as other sectors
50
IED. 2013. Country Partnership Strategy Final Review Validation: India, 2009–2012. Manila.
Agriculture and Natural Resources Sector Program in India: A Background Paper and Desk Review 23
in the adjacent geographical and downstream areas. The CPSFR validation, thus, concluded that ANR
operations in India were on track and were moving in the right direction to achieve their objectives.
2. Evaluation of Agriculture and Natural Sector Projects
96. The Indian ANR portfolio is relatively young. There is no project completion report (PCR) for any
of the ANR projects covered by the CAPE. In the meantime, interim assessments have been prepared
based on design considerations, some progress reports, and expected results. Such assessments are,
naturally, tentative and need to be interpreted cautiously as they are likely to be revised when more
information becomes available.
97. This is particularly so because the Indian portfolio predominantly consists of MFFs, which tend
to be more flexible about eventual outcomes and outputs during implementation of different tranches.
The final picture is therefore unlikely to be clear till after the closure of projects and the preparation of
PCRs. Only then will a more definitive understanding about the outcomes of MFFs emerge.
Nevertheless, the following observations can be made about the assessment of ANR as per the IED
criteria relevance, effectiveness, efficiency, sustainability and development impacts.
98. Relevance. ANR interventions address poverty reduction, as the poor, especially the rural poor,
are likely to face hardship in the absence of ample agricultural produce, or because of environmental
disasters. The ANR portfolio resonates well with priority areas of the government and with the
country’s development objectives. The portfolio is also aligned with ADB’s corporate strategies,
especially Strategy 2020 which focuses on rural infrastructure, inclusive economic growth, and
environmentally sustainable growth. The JFPR projects in India are well-designed and address rural
poverty. However, the total magnitude of ANR operations is limited so the impacts remain very local.
99. There are only six loans in the ANR sector: three are related to water resource management and
irrigation (Odisha and Karnataka), one is concerned with coastal management, and two are in
agribusiness. Water resources and irrigation are at the heart of agricultural development in India, and
the projects are fully aligned with government priorities. Coastal management in Karnataka and
Maharashtra is crucial for tourism, services especially ICT, and manufacturing industries.51
100. ADB interventions to strengthen environmental sustainability through coastal management
and river-basin development in Karnataka address the poverty reduction focus of ADB operations. In
the absence of asset and resources, the poor, whether rural or urban, are likely to suffer from the
volatility in agricultural production or during floods or other environmental disasters.
101. Projects are distributed across a broad spectrum of types and in different geographical areas.
However, the magnitude of ADB operations is limited. This review echoes the observation in the CPSFR
validation that the extent of ADB’s involvement in the ANR sector does not fully reflect the importance
attached to the sector in the CPSs. This could be because operations feel that there is a need for
“learning by doing” before replicating efforts more widely.52
This could be why ADB has not yet
pursued a more geographically dispersed response, given that major states in India differ significantly
from each other in terms of their socioeconomic profiles and institutional frameworks. ADB’s own
capacity in the ANR sector is limited, and this is now emerging as a constraint following the relegation
of agricultural operations to the non-core category at the time of the adoption of Strategy 2020 in
2008.
102. The capacity of the government, especially at state and field levels, is extremely limited when it
comes to implementing internationally supported projects and undertaking market-oriented reforms.
ADB has responded to the issue by launching a series of capacity development interventions in the form
51
As mentioned earlier (footnote 48) the Goa component was not implemented.
52 Some interesting proposals are under consideration in Madhya Pradesh.
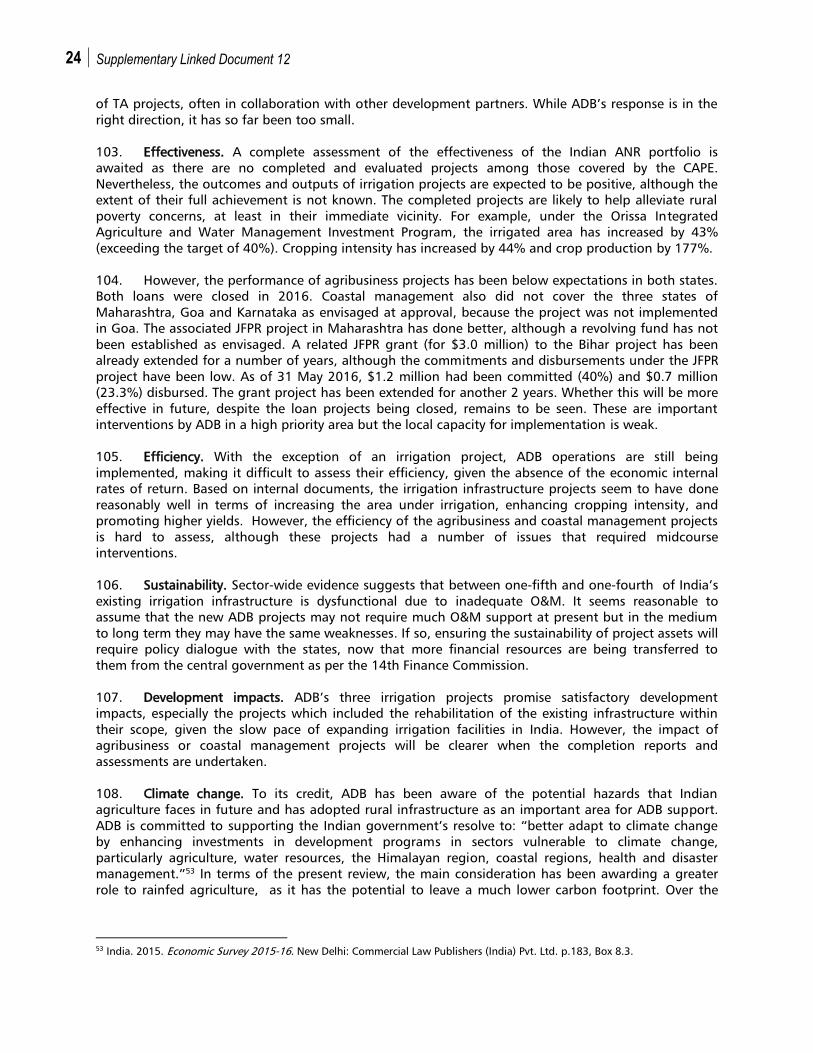
24 Supplementary Linked Document 12
of TA projects, often in collaboration with other development partners. While ADB’s response is in the
right direction, it has so far been too small.
103. Effectiveness. A complete assessment of the effectiveness of the Indian ANR portfolio is
awaited as there are no completed and evaluated projects among those covered by the CAPE.
Nevertheless, the outcomes and outputs of irrigation projects are expected to be positive, although the
extent of their full achievement is not known. The completed projects are likely to help alleviate rural
poverty concerns, at least in their immediate vicinity. For example, under the Orissa Integrated
Agriculture and Water Management Investment Program, the irrigated area has increased by 43%
(exceeding the target of 40%). Cropping intensity has increased by 44% and crop production by 177%.
104. However, the performance of agribusiness projects has been below expectations in both states.
Both loans were closed in 2016. Coastal management also did not cover the three states of
Maharashtra, Goa and Karnataka as envisaged at approval, because the project was not implemented
in Goa. The associated JFPR project in Maharashtra has done better, although a revolving fund has not
been established as envisaged. A related JFPR grant (for $3.0 million) to the Bihar project has been
already extended for a number of years, although the commitments and disbursements under the JFPR
project have been low. As of 31 May 2016, $1.2 million had been committed (40%) and $0.7 million
(23.3%) disbursed. The grant project has been extended for another 2 years. Whether this will be more
effective in future, despite the loan projects being closed, remains to be seen. These are important
interventions by ADB in a high priority area but the local capacity for implementation is weak.
105. Efficiency. With the exception of an irrigation project, ADB operations are still being
implemented, making it difficult to assess their efficiency, given the absence of the economic internal
rates of return. Based on internal documents, the irrigation infrastructure projects seem to have done
reasonably well in terms of increasing the area under irrigation, enhancing cropping intensity, and
promoting higher yields. However, the efficiency of the agribusiness and coastal management projects
is hard to assess, although these projects had a number of issues that required midcourse
interventions.
106. Sustainability. Sector-wide evidence suggests that between one-fifth and one-fourth of India’s
existing irrigation infrastructure is dysfunctional due to inadequate O&M. It seems reasonable to
assume that the new ADB projects may not require much O&M support at present but in the medium
to long term they may have the same weaknesses. If so, ensuring the sustainability of project assets will
require policy dialogue with the states, now that more financial resources are being transferred to
them from the central government as per the 14th Finance Commission.
107. Development impacts. ADB’s three irrigation projects promise satisfactory development
impacts, especially the projects which included the rehabilitation of the existing infrastructure within
their scope, given the slow pace of expanding irrigation facilities in India. However, the impact of
agribusiness or coastal management projects will be clearer when the completion reports and
assessments are undertaken.
108. Climate change. To its credit, ADB has been aware of the potential hazards that Indian
agriculture faces in future and has adopted rural infrastructure as an important area for ADB support.
ADB is committed to supporting the Indian government’s resolve to: “better adapt to climate change
by enhancing investments in development programs in sectors vulnerable to climate change,
particularly agriculture, water resources, the Himalayan region, coastal regions, health and disaster
management.”53
In terms of the present review, the main consideration has been awarding a greater
role to rainfed agriculture, as it has the potential to leave a much lower carbon footprint. Over the
53
India. 2015. Economic Survey 2015-16. New Delhi: Commercial Law Publishers (India) Pvt. Ltd. p.183, Box 8.3.

Agriculture and Natural Resources Sector Program in India: A Background Paper and Desk Review 25
previous decade, the ANR portfolio has been growing as ADB has rapidly acquired experience of
operating in different climatic and administrative regions.
109. The Acme Mumbai Power Private Limited (Acme-EDF Solar Power Project) TA project supported
a national action plan for climate change and focused on examining water resource systems in India,
particularly in three sub-basins (Sutlej in Punjab, Kshipara in Madhya Pradesh, and Cauvery in Tamil
Nadu). The TA developed a strategic framework for the Indian water system, elaborating and spelling
out the recommendations earlier identified under the national water mission. The TA supported the
Indian Institute of Tropical Meteorology, and helped it in its efforts to identify and implement climate
change adaptation measures in India.
110. In addition, other studies with significant implications for climate change were undertaken to
promote water use efficiency in irrigated agriculture during 2012 and 2014. Supporting the National
Water Mission, these were sector studies which synthesized the existing knowledge, and drafted action
plans for improving water user efficiency in irrigated agriculture. Recommendations sought to promote
more “judicious use of irrigation water (with higher efficiency ratios; equitability, sufficiency and
reliability in distribution, productivity and rationalized use aligned with basic water balance) with a
provision of systematic inputs by synthesizing the analytical framework and recommend options …” An
accompanying study developed a program for improvements in water use efficiency to be implemented
by state governments. The study prepared a framework for assessing and improving water use
efficiency for major and medium irrigation schemes.
111. JFPR financed a regional TA project, Innovations for More Food with Less Water, to identify,
assess, and design new investments for more sustainable water-efficient irrigated agriculture. TA
activities were linked to assessing and improving water use efficiency in medium-sized and major
irrigation schemes. Two pilot schemes (Dharoi irrigation project in Gujarat, and Sanjay Sarovar
Irrigation Project in Madhya Pradesh) were undertaken under the TA, which also included a
reconnaissance study for small-scale hill irrigation in Sikkim. The study used the Food and Agricultural
Organization’s rapid appraisal methodology, along with remote sensing. The exercise produced a
project-level water balance framework as well as accounting information about water use.
112. Inclusive growth. Many of minor irrigation schemes under ADB’s integrated water management
or participatory irrigation management projects help women directly by irrigating fields, or help to
create employment opportunities by augmenting agricultural production. ADB has actively supported
the participation of women in water users’ associations under different projects. The main
recommendation from this review is that ADB should continue to strengthen watershed development
in India. This will go a long way to improving the welfare of the local population, especially the poor
and women. The approach implicit in this review looks at watershed development as a rallying point
for participatory development and hence inclusive growth. ADB’s agribusiness investments were
expected to support inclusive development across a variety of agricultural development activities.
E. Lessons and Suggestions
113. This background analysis identified the following steps to strengthen the response of Indian
agriculture to the global socioeconomic and climatic changes it faces. ADB can consider supporting
some of these.
(i) Irrigation has been an important constraint on Indian agriculture, but building new
irrigation facilities has been progressing extremely slowly. It is therefore important that
available facilities are utilized to full capacity. One-fifth to one-fourth of the irrigation
infrastructure is not fully functional, due to lack of O&M and public service apathy.
Repairing this infrastructure should be a priority as this would yielding rapid results.

26 Supplementary Linked Document 12
(ii) There is tremendous variation in crop yields even within irrigated areas, presumably
due to uneven access to other inputs such as fertilizers, pesticides, and new varieties of
seeds. Ensuring cultivators have access to these missing ingredients in irrigated areas
should improve production across a variety of crops, and reduce agriculture’s
dependence on groundwater extraction. Operationally, such micro- and specific
interventions should be focused on low-productivity irrigated districts (or blocks) to
elicit maximum impact within a short time.
(iii) About a third of agricultural production, especially fresh fruit and vegetables, are
wasted due to lack of processing, transportation and storage facilities. Investment in
such rural infrastructure should be prioritized. This would not only create assets and
enhance employment opportunities, it would make more use of the already produced
crop. Since networks are needed, the chain of infrastructure should begin in demand
centers and fan-out deep into sources of supply in the hinterland.
(iv) Improvements in watershed management are required not only for the sake of
agricultural production but also for the broader development of rural areas, including
dairy farming, fisheries, forestry and other ancillary non-farm activities. Watershed
management in rural areas can serve as a rallying platform for broader and more
inclusive social development, as it is capable of forging unity of purpose and action
among local inhabitants (i.e., engendering social capital). The requisite expertise for
better watershed management is already available in India, and can help relieve
pressure on water-stressed regions.
(v) Incentives need to be provided to farmers engaged in rainfed agricultural production
and technical support offered to increase yields. The low productivity of rainfed
agriculture has been a disincentive to investment in the past. However, rainfed
agriculture has a low carbon footprint and needs to be recognized and rewarded.
(vi) Poor pricing policies (in the provision of fertilizers, electricity supply, agricultural
finance, minimum support prices, and other related subsidies) are recognized as the
main impediment to sustainable agriculture in India. The sooner this is resolved, the
better it will be for farmers and the wider Indian economy.
(vii) Self-help groups, producers’ groups, and buyers’ collectives can re-group and re-orient
the rural population, especially vulnerable, weaker sections and women. Given the
small size of land holdings in India, such community organizations are an important
means of reducing transaction costs. A number of indigenous models are already
available and are waiting to be replicated with some support. Panchayat raj institutions
and civil society organizations have a tremendously important role to play in this
regard. The needed policy support has, however, been tentative.
114. In future, a series of large policy-based ADB loans addressing national policy issues
comprehensively (in such areas as rural banking and finance, irrigation and watershed management,
and development of single market and international trade in agricultural commodities) could
streamline the sector so it is better equipped to absorb larger investments yielding rapid growth. Given
that implementation of agricultural development is a state subject, ADB needs to relate to the states
themselves and to design projects which command the states’ ownership, interests and priorities.
115. ADB’s involvement in Indian agriculture faces a steep learning curve, but has already done well
in terms of developing a broad spectrum of interventions, from flood control to participatory irrigation,
integrated water resource management, coastal protection and agribusiness value chains. Given the
size and significance of the sector to the Indian economy, it is important that a sustainable
development path is identified and pursued on a long-term basis.