AGRICULTURAL SERVICES - sgs.com · 4 HIGHLIGHTS & OUTLOOK 1st semester 2012 results • Total...
32
1
Transcript of AGRICULTURAL SERVICES - sgs.com · 4 HIGHLIGHTS & OUTLOOK 1st semester 2012 results • Total...

1

2
V

3
4
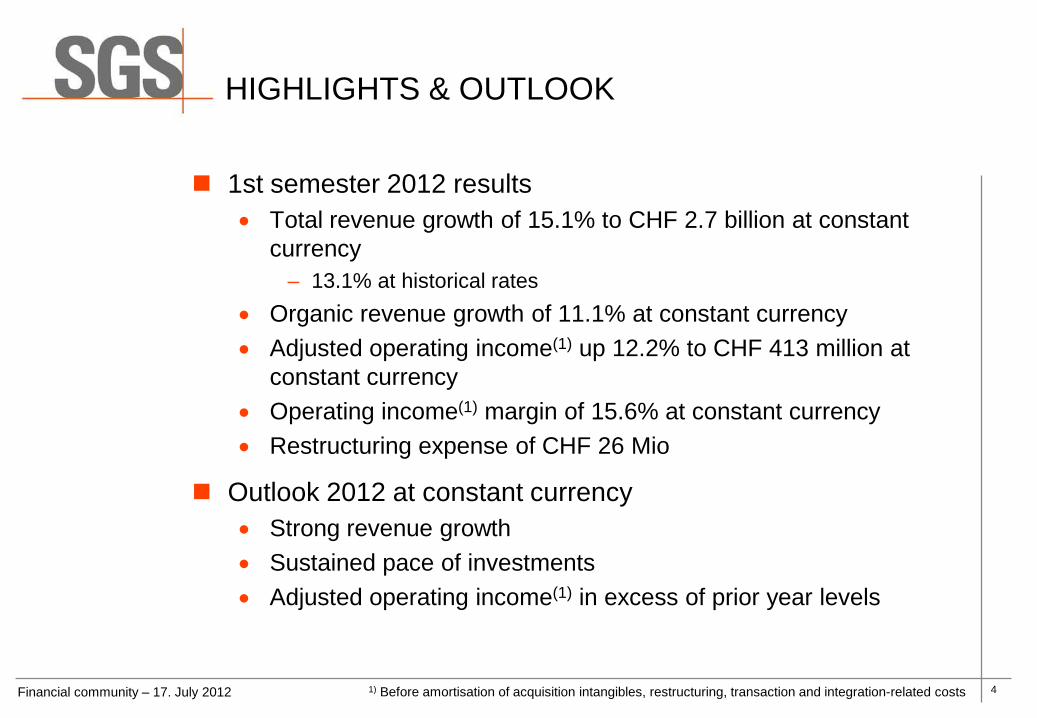
HIGHLIGHTS & OUTLOOK
1st semester 2012 results • Total revenue growth of 15.1% to CHF 2.7 billion at constant
currency – 13.1% at historical rates
• Organic revenue growth of 11.1% at constant currency • Adjusted operating income(1) up 12.2% to CHF 413 million at
constant currency • Operating income(1) margin of 15.6% at constant currency • Restructuring expense of CHF 26 Mio
Outlook 2012 at constant currency • Strong revenue growth • Sustained pace of investments • Adjusted operating income(1) in excess of prior year levels
Financial community – 17. July 2012 1) Before amortisation of acquisition intangibles, restructuring, transaction and integration-related costs

5
FINANCIAL HIGHLIGHTS
1) Before amortisation of acquisition intangibles, restructuring, transaction and integration-related costs 2) Constant currency basis
Financial community – 17. July 2012
CHF million 2012June
2011June
2011June
Pro-forma(2) Published
Revenue 2,651 2,303 2,345 Change in % 15.1 % 13.1 %
Adjusted Operating Income(1) 413 368 374 Change in % 12.2 % 10.4 %
Adjusted Operating Income Margin (1) 15.6 % 16.0 % 16.0 %
Operating Income (EBIT) 373 357 363 Change in % 4.5 % 2.8 %
Net income 245 241 246 Change in % 1.7 % (0.4)%
Adjusted Basic EPS (CHF) 36.26 33.08 33.71 Basic EPS (CHF) 32.16 31.72 32.30 Period end no. of employees 76,993 67,144

6
SERVICE PORTFOLIO
Financial community – 17. July 2012
AGRI6.0%
MIN18.8%
OGC14.8%
LIFE1.8%CTS
23.9%
SSC7.6%
IND9.8%
ENVI2.9%
AUTO7.6%
GIS6.8%
ADJUSTED OPERATING INCOME(1)AGRI
6.5%
MIN15.9%
OGC18.8%
LIFE3.6%CTS
16.5%
SSC7.0%
IND15.9%
ENVI5.7%
AUTO5.5%
GIS4.6%
REVENUE
EUROPE / AFRICA /
MIDDLE EAST48.2%
AMERICAS23.6%
ASIA PACIFIC28.2%
REVENUE REGION
1) Before amortisation of acquisition intangibles, restructuring, transaction and integration-related costs

7

8
REVENUE GROWTH COMPOSITION
Financial community – 17. July 2012
RevenuesJune 11 Organic Acquisitions Disposals
Currencyimpact
RevenuesJune 12
2,345
256 92
(42)
2,651
11.1% 4.0% 0.0% (2.0)% 13.1%
Constant currency growth: 15.1%

9
YEAR-OVER-YEAR H1 REVENUE GROWTH
Financial community – 17. July 2012
11.5% 15.1%
4.1%
1.0%
9.7% 11.1%
0.3%
1.9% 1.9% 0.7%
3.1% 4.0%
1.4%
(7.0)%
(4.7)%
(0.7)%
(13.1)%
(2.0)%
2007 2008 2009 2010 2011 2012
Organic Acquisitions/Disposals Currency Impact
13.2% 10.0% 1.3% 1.0% (0.3)% 13.1 %
15.1%

10
LOCAL CURRENCY GROWTH BY BUSINESS
Financial community – 17. July 2012
11.1%
20.5%
5.3%
5.5%
9.0%
6.0%
11.5%
(2.5)%
11.2%
20.6%
13.3%
4.0%
3.1%
6.1%
9.4%
1.5%
0.9%
0.6%
10.9%
0.7%
TOTAL
GIS
AUTO
ENVI
IND
SSC
CTS
LIFE
OGC
MIN
AGRI
Organic Acquisition Disposal
14.0%
31.5%
11.8%
(1.6)%
13.0%
6.0%
18.4%
11.6%
8.4%
20.5%
15.1%
11
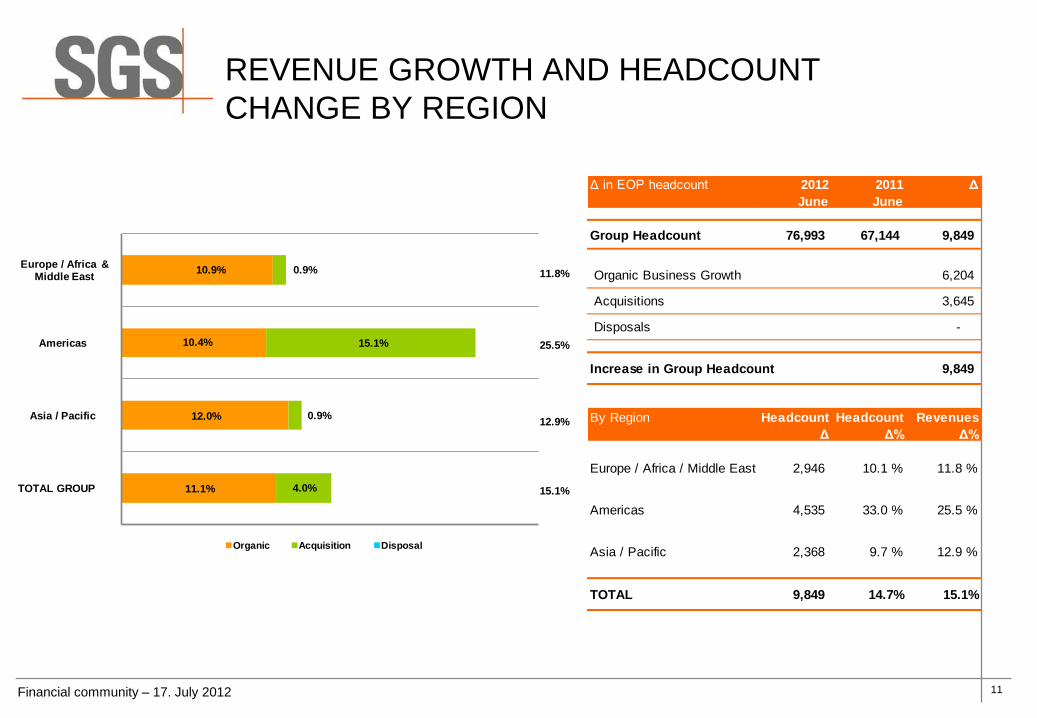
REVENUE GROWTH AND HEADCOUNT CHANGE BY REGION
Financial community – 17. July 2012
11.1%
12.0%
10.4%
10.9%
4.0%
0.9%
15.1%
0.9%
TOTAL GROUP
Asia / Pacific
Americas
Europe / Africa & Middle East
Organic Acquisition Disposal
11.8%
25.5%
12.9%
15.1%
Δ in EOP headcount 2012June
2011June
Δ
Group Headcount 76,993 67,144 9,849
Organic Business Growth 6,204
Acquisitions 3,645
Disposals -
Increase in Group Headcount 9,849
By Region Headcount Δ
Headcount Δ%
Revenues Δ%
Europe / Africa / Middle East 2,946 10.1 % 11.8 %
Americas 4,535 33.0 % 25.5 %
Asia / Pacific 2,368 9.7 % 12.9 %
TOTAL 9,849 14.7% 15.1%

12

13
ADJUSTED OPERATING INCOME(1) GROWTH
Financial community – 17. July 2012
Op. IncomeJune 11 Organic Acquisitions Disposals
Currencyimpact
Op. IncomeJune 12
374
35 10
(6)
413
9.5% 2.7% 0.0% (1.8)% 10.4%
Constant currency growth: 12.2%
1) Before amortisation of acquisition intangibles, restructuring, transaction and integration-related costs

14
ADJUSTED OPERATING MARGIN(1) BY BUSINESS
Financial community – 17. July 2012
13.7
%
18.4
%
13.0
%
10.4
%
23.6
%
17.4
%
10.8
%
8.6%
21.1
%
20.7
%
14.4
% 18
.4%
12.2
%
7.9%
22.5
%
16.9
%
9.5%
8.0%
21.8
%
22.8
%
5.0%
10.0%
15.0%
20.0%
25.0%
AGRI
MIN
OG
C
LIFE
CTS
SSC
IND
ENV
AUTO GIS
June 11 June 12
1) Before amortisation of acquisition intangibles, restructuring, transaction and integration-related costs

15
RESTRUCTURING COSTS
Financial community – 17. July 2012
AGRI2.7%
MIN19.4%
OGC11.8%
LIFE1.9%
CTS12.9%SSC
6.1%
IND19.0%
ENVI19.8%
AUTO6.4%
RESTRUCTURING BY BUSINESS
Activity closures
21.5%
Location closures
13.9%Cost optimisation
64.6%
RESTRUCTURING BY TYPE

16
CASH FLOW
Financial community – 17. July 2012
CHF million Jun 12 Jun 11
PROFIT FOR THE PERIOD 259 259 Non-cash items 251 208
Depreciation, amortisation and impairment 130 113 Share based payments 9 9 Tax 96 93 Other 16 (7)
(Increase)/decrease in net working capital (155) (130) Taxes paid (111) (109)
OPERATING CASH FLOW 244 228 Net (purchase)/sale of fixed assets (176) (134) Acquisition and divestments of businesses (103) (27) Other from investing activities 4 (5)
CASH FLOW FROM INVESTING ACTIVITIES (275) (166) Dividend paid to equity holders of SGS SA (497) (494) Dividend paid to non-controlling interests (5) (4) Net cash received/(paid) on treasury shares 76 (30) Proceeds of corporate bonds - 714 Interest paid (26) (14) Net flows on interest rate swaps 7 - (Decrease)/increase in borrowings (15) 8
CASH FLOW FROM FINANCING ACTIVITIES (460) 180 Currency translations 7 (10)
INCREASE/(DECREASE) IN CASH AND CASH EQUIVALENTS (484) 232

17
CAPITAL EXPENDITURE
Financial community – 17. July 2012
AGRI6.6%
MIN22.1%
OGC17.1%
LIFE5.0%
CTS21.0%
SSC1.7%
IND8.8%
ENVI5.5%
AUTO2.8%
GIS9.4%
CAPEX BUSINESS
EUROPE / AFRICA /
MIDDLE EAST43.6%
AMERICAS20.5%
ASIA PACIFIC35.9%
CAPEX REGION
150
250
350
450
550
Capital Expenditure Depreciation & amortisation
2007 2008 2009 2010 2011 2012
ANNUAL CAPEXCHF million

18
FOREIGN CURRENCY REVENUES H1 2012
Financial community – 17. July 2012
EUR29.2%
USD14.6%
CNY9.5%
AUD5.8%
CAD4.6%
GBP3.0%
CLP2.9%
TWD2.8%
HKD2.3%
Other25.3%
2012 2011 ChangeEUR 1.2052 1.2713 (5.2)% USD 0.9287 0.9072 2.4 % CNY 0.1469 0.1387 6.0 % AUD 0.9584 0.9366 2.3 % CAD 0.9234 0.9287 (0.6)% GBP 1.4643 1.4650 (0.0)% CLP 0.0019 0.0019 (1.2)% TWD 0.0313 0.0312 0.4 % HKD 0.1197 0.1166 2.7 % INR 0.0178 0.0202 (11.6)%
AVERAGE RATES

19
FOREIGN CURRENCY SENSITIVITY ANALYSIS
Financial community – 17. July 2012
EURO 1.17 1.21 1.24
Revenues (23) 0 22Income (2) 0 2
USD 0.91 0.93 0.95
Revenues (8) 0 9Income (1) 0 1
CNY 0.143 0.147 0.153
Revenues (8) 0 10Income (2) 0 3


21
AGRICULTURAL SERVICES (AGRI)
Overview H1 2012 • Seed and Crop Services continued their positive
trend with +40% revenue growth including 3 acquisitions from 2011. Investments continue to expand the business into new geographies and widen the service offering.
• Trade Services benefited from good export volumes from the Black Sea; overall improved volumes and increased market share especially in cereals.
• Market Research; Information Services; Process plant monitoring and Supply Chain Services reported excellent growth.
Outlook 2012 • Black Sea exports expected to reduce slightly, partly
offset by solid global demand for all agricultural commodities.
• Demand for Seed and Crop Services drives development in Asia-Pacific & Sub-Saharan Africa.
• Continued investments in US, Canada, South Africa, and India enhance our presence in Food Safety.
• Outlook for agricultural sustainability and precision farming services remains positive.
Financial community – 17. July 2012
CHF million June2012
June2011
June2011
Pro-forma2 Published
Revenue 173.1 151.8 155.8 Change in % 14.0 11.1
Adj. Operating Inc.(1) 24.9 20.8 21.4 Change in % 19.7 16.4
Margin %1 14.4 13.7 13.7
(2) Constant currency basis
(1) Before amortisation of acquisition intangibles, restructuring, transaction and integration-related costs

22
MINERALS SERVICES (MIN)
Overview H1 2012 • Total revenue growth of 31.5%, of which 20.6%
organic and margin improvement (CIMM acquisition dilutive to margin).
• Sustained growth across all regions and service portfolio, the key drivers being exploration and metallurgical projects.
• Expansion of the commercial laboratory network including coal labs in Australia and geochemical labs in Liberia and Turkey.
• Key project wins include AGA & Independence Tropicana Gold Mine in Australia and the BHP exploration coal programme in South Africa.
Outlook 2012 • Pipeline in all major laboratories and metallurgical
testing facilities robust for H2. • Financing for junior mining companies difficult due to
the general financial situation. • The major mining companies, whilst reviewing their
investment plans, continue to announce investments in key expansion projects.
• Continued investments planned to handle high sample volumes and meet client demand.
Financial community – 17. July 2012
CHF million June2012
June2011
June2011
Pro-forma2 Published
Revenue 421.7 320.7 323.2 Change in % 31.5 30.5
Adj. Operating Inc.(1) 77.6 58.8 59.4 Change in % 32.0 30.6
Margin %1 18.4 18.3 18.4
(2) Constant currency basis
(1) Before amortisation of acquisition intangibles, restructuring, transaction and integration-related costs

23
OIL, GAS & CHEMICALS SERVICES (OGC)
Overview H1 2012 • Strong growth in Upstream Services with contract
wins in Australia, Middle East and sub-surface consultancy in Europe.
• Oil Condition Monitoring expansion in South America and Asia.
• Cargo Treatment Services grew strongly, particularly in the USA and South East Asia.
• Growth in PTO continues, driven by the USA and Europe and the underlying outsourcing trend.
• Margin impacted by changes in business pattern (refinery closures in Europe and the Caribbean) and ramp-up costs in Upstream Services.
Outlook 2012 • Existing business segments with continued growth
(Trade Related, PTO, Oil Condition Monitoring, Upstream, Cargo Treatment Services).
• Major growth from new innovative services wrapped around new proprietary technologies.
• Sustained growth in Upstream Services: • Metering projects in Mid East, Americas, Asia. • Unconventional gas projects. • Expansion of well testing and onsite analysis.
Financial community – 17. July 2012
CHF million June2012
June2011
June2011
Pro-forma2 Published
Revenue 498.9 446.2 451.0 Change in % 11.8 10.6
Adj. Operating Inc.(1) 60.9 57.7 58.8 Change in % 5.5 3.6
Margin %1 12.2 12.9 13.0
(2) Constant currency basis
(1) Before amortisation of acquisition intangibles, restructuring, transaction and integration-related costs

24
LIFE SCIENCE SERVICES (LIFE)
Overview H1 2012 • Double-digit organic revenue growth in laboratory
segment offset, as expected, by Clinical Research. • Laboratory growth driven by expansion in Asia and
leveraging state-of-the-art laboratories in Europe and North America.
• Biologics: M-Scan acquisition contributing above expectations and services enriched by the Vitrology acquisition in the UK.
• Very difficult semester for Clinical Research with market volume decline affecting revenue and operating income margins.
Outlook 2012 • Laboratory growth and margins to increase,
supported by global key accounts managers. • Biologics service expansion will continue fully
leveraging new acquisitions and recent investment in centers of excellence (biosimilar, cell-based assay, serology, protein characterisation).
• Clinical Research activity will remain under pressure. Efficiency improvements on-going.
Financial community – 17. July 2012
CHF million June2012
June2011
June2011
Pro-forma2 Published
Revenue 94.8 96.3 99.5 Change in % (1.6) (4.7)
Adj. Operating Inc.(1) 7.5 10.0 10.3 Change in % (25.0) (27.2)
Margin %1 7.9 10.4 10.4
(2) Constant currency basis
(1) Before amortisation of acquisition intangibles, restructuring, transaction and integration-related costs

25
CONSUMER TESTING SERVICES (CTS)
Overview H1 2012 • Good revenue growth driven by Western Europe,
South America and all Asia both in traditional and new services.
• Capital investments and personnel development progressing as planned to support 2014 targets.
• All business sectors, and particularly softlines, food and E&E, benefited from improved global economic conditions in H2 last year and during the semester.
• Margin below prior year reflecting a transition period in product mix, investments in new activities and acquisitions not yet fully performing.
Outlook 2012 • Unstable markets but strong order pipeline makes
us optimistic about full year 2012 results. • Strong growth in Europe, despite the crisis; South
America to continue on its solid path; Asia expected to continue on track but with some cost pressure.
• Further investments (E&E, Auto) to meet new technological and regulatory requirements (functional safety, wireless).
Financial community – 17. July 2012
CHF million June2012
June2011
June2011
Pro-forma2 Published
Revenue 437.8 387.4 387.5 Change in % 13.0 13.0
Adj. Operating Inc.(1) 98.7 92.7 91.4 Change in % 6.5 8.0
Margin %1 22.5 23.9 23.6
(2) Constant currency basis
(1) Before amortisation of acquisition intangibles, restructuring, transaction and integration-related costs

26
SYSTEMS & SERVICES CERTIFICATION (SSC)
Overview H1 2012 • Excellent market share gains and double digit
growth in Asia, Eastern Europe, South America and Africa.
• Strong recovery in Japan after last year’s natural disaster.
• Difficult market conditions in Spain and Italy impact both growth in Europe and margin.
• Growing demand for sustainability related audit schemes.
• New mandates ensure compliance of supply chains with environmental, health, safety and social norms.
Outlook 2012 • Expect solid growth across major markets
particularly in Asia, Eastern Europe and the Americas.
• Training activity becomes an important source of growth.
• Further cost optimisation in key affiliates in response to increasingly competitive environment.
• Continued investments to diversify the portfolio of services with new industry bespoke services.
Financial community – 17. July 2012
CHF million June2012
June2011
June2011
Pro-forma2 Published
Revenue 186.0 175.5 177.4 Change in % 6.0 4.8
Adj. Operating Inc.(1) 31.4 30.6 30.8 Change in % 2.6 1.9
Margin %1 16.9 17.4 17.4
(2) Constant currency basis
(1) Before amortisation of acquisition intangibles, restructuring, transaction and integration-related costs

27
INDUSTRIAL SERVICES (IND)
Overview H1 2012 • Strong organic growth, especially in Asia, Australasia
and Middle East. • Margin under pressure in Europe, Africa and North
America as investment projects are delayed and public spending reduces.
• Continued restructuring to align organisational structures to the new market conditions in Europe.
• Acquisition of ETSA in Colombia for engineering project supervision and Metlab in South Africa for metallurgical testing; Margins dilutive in H1 due to strong seasonality.
Outlook 2012 • Expect continued growth in revenue and operating
income supported by 5 recent acquisitions. • First revenues in H2 from large inspection service
contracts with oil majors signed last year. • Investing in new testing capabilities in North America. • Increasing exploration activity in Asia & Australasia to
benefit our upstream services. • First revenues in H2 from investments made last year
in organic growth initiatives. Financial community – 17. July 2012
CHF million June2012
June2011
June2011
Pro-forma2 Published
Revenue 422.1 356.4 368.7 Change in % 18.4 14.5
Adj. Operating Inc.(1) 40.3 38.1 39.8 Change in % 5.8 1.3
Margin %1 9.5 10.7 10.8
(2) Constant currency basis
(1) Before amortisation of acquisition intangibles, restructuring, transaction and integration-related costs

28
ENVIRONMENTAL SERVICES (ENVI)
Overview H1 2012 • Accelerated growth in Africa, Asia and South
America with focus on mining and oil sectors. • European and Canadian operations maintained high
levels of activity thanks to their diversified portfolio of services (lab and non lab).
• Operating income impacted by ongoing investments in new service offerings.
– New laboratories in Congo and Guinea and new environmental studies offices in Paris, Shanghai, Durban, Doha, Kuwait, Dubai, Conakry and Krakow.
• Acquisitions in Brazil (Environ) and USA (Analytical Perspective).
Outlook 2012 • Continued investments in emerging markets to meet
rapidly growing environmental demands. • Diversification of service portfolio to directly serve
end-customers and enhance margins. • Implement a plan to enter new African countries and
serve mining customers with on-site services. • Significant demand for SGS E-data (data
management) services in Australia and Europe.
Financial community – 17. July 2012
CHF million June2012
June2011
June2011
Pro-forma2 Published
Revenue 151.4 135.7 140.2 Change in % 11.6 8.0
Adj. Operating Inc.(1) 12.1 11.6 12.0 Change in % 4.3 0.8
Margin %1 8.0 8.5 8.6
(2) Constant currency basis
(1) Before amortisation of acquisition intangibles, restructuring, transaction and integration-related costs

29
AUTOMOTIVE SERVICES (AUTO)
Overview H1 2012 • Statutory business showed solid results in Europe,
the Americas and Africa, with additional stations in Spain, Morocco, South Africa and Ivory Coast.
• Non-statutory activities in the USA still negatively impacted by significantly lower volumes.
• Strong engine testing results in the USA from the ETC acquisition, however vehicle testing remains slightly below expectations.
• Tender secured with the Road Safety Authority in Ireland to develop an IT platform for the control, monitoring and enforcement of commercial vehicles inspections.
Outlook 2012 • Statutory business expected to continue delivering
solid results. • Low commercial inspection volumes likely to remain
throughout 2012 in the USA. • Several opportunities being pursued in the statutory
field in Asia, South America and Africa. • Expand statutory business into Road Safety
Services.
Financial community – 17. July 2012
CHF million June2012
June2011
June2011
Pro-forma2 Published
Revenue 143.1 132.0 136.6 Change in % 8.4 4.8
Adj. Operating Inc.(1) 31.2 27.3 28.8 Change in % 14.3 8.3
Margin %1 21.8 20.7 21.1
(2) Constant currency basis
(1) Before amortisation of acquisition intangibles, restructuring, transaction and integration-related costs
30
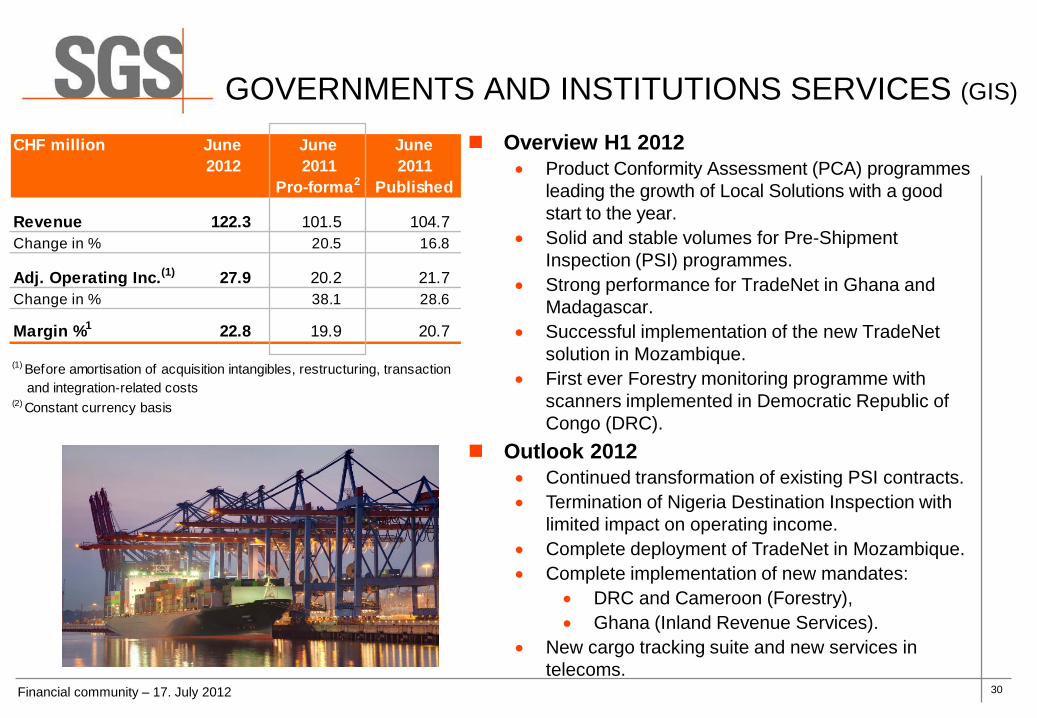
GOVERNMENTS AND INSTITUTIONS SERVICES (GIS)
Overview H1 2012 • Product Conformity Assessment (PCA) programmes
leading the growth of Local Solutions with a good start to the year.
• Solid and stable volumes for Pre-Shipment Inspection (PSI) programmes.
• Strong performance for TradeNet in Ghana and Madagascar.
• Successful implementation of the new TradeNet solution in Mozambique.
• First ever Forestry monitoring programme with scanners implemented in Democratic Republic of Congo (DRC).
Outlook 2012 • Continued transformation of existing PSI contracts. • Termination of Nigeria Destination Inspection with
limited impact on operating income. • Complete deployment of TradeNet in Mozambique. • Complete implementation of new mandates:
• DRC and Cameroon (Forestry), • Ghana (Inland Revenue Services).
• New cargo tracking suite and new services in telecoms.
Financial community – 17. July 2012
CHF million June2012
June2011
June2011
Pro-forma2 Published
Revenue 122.3 101.5 104.7 Change in % 20.5 16.8
Adj. Operating Inc.(1) 27.9 20.2 21.7 Change in % 38.1 28.6
Margin %1 22.8 19.9 20.7
(2) Constant currency basis
(1) Before amortisation of acquisition intangibles, restructuring, transaction and integration-related costs


32
WWW.SGS.COM
© SG
S SA
2012
. ALL
RIG
HTS
RESE
RVED
.

![15.1(1) SWIMMINGPOOLSANDSPAS 15.1(2) · IAC6/3/09 PublicHealth[641] Ch15,p.1 CHAPTER15 SWIMMINGPOOLSANDSPAS 641—15.1(135I)Applicability. 15.1(1) Theserulesapplytoswimmingpools,spas,wadingpools,waterslides](https://static.fdocuments.net/doc/165x107/5f08ea2d7e708231d42456b9/1511-swimmingpoolsandspas-1512-iac6309-publichealth641-ch15p1-chapter15.jpg)