სასოფლო-სამეურნეო კოოპერატივების გზამკვლევი/ Guide for Agricultural Cooperatives

AGRICULTURAL PRODUCTION COOPERATIVES IN THE E.U.:
EXPLAINING VARIATION IN COOPERATIVE DEVELOPMENT
by
Alexander Christian Borst
Presented in partial fulfillment of the requirements for completion of the Bachelor of Arts
degree in International Studies at the Croft Institute for International Studies
Croft Institute for International Studies
Sally McDonnell Barksdale Honors College
The University of Mississippi
University, Mississippi
May 2017
Approved by:
___________________________
Advisor: Dr. John Green
_____________________________
Reader: Dr. William Schenck
_______________________________
Reader: Dr. Michèle Alexandre
© 2017
By Alexander C. Borst
ALL RIGHTS RESERVED

ii
ABSTRACT
This thesis examines variations in the development of cooperative businesses across
member states in the European Union to identify and explain patterns in cooperative
participation. Through a comparative analysis of statistical indicators coupled with
regional analyses of historical determinants that may have incentivized cooperative
participation, the current state of cooperatives in each region is highlighted and the
relevance of each cooperative development indicator is discussed. This thesis uses
literature on the early European cooperative movement, the development of the
Common Agricultural Policy, and the current state of cooperative agricultural
production to present a historically contextualized look at the European model of
agricultural production and to highlight the patterns in cooperative development across
regional groupings. The findings show that there is a strong association between
regional groupings and average members per agricultural producers’ cooperative (APC)
and a moderate association between average agricultural output and average members
per APC. When knowledge of region and average agricultural output is present, there
are reductions in error in predicting average members per APC. The findings indicate
that cooperative development expectations among the different regional groupings
might be changing as regions succeed in unexpected ways.

iii
TABLE OF CONTENTS
Title Page…………………………………………………………………………………..i
Abstract……...……………………………………………………...…………………......ii
Table of Contents……………………………………...………………………………….iii
Tables and Figures………………………...……………………………………………...iv
Abbreviations……………………………………………………………………………...v
Chapter 1: Introduction………………………...………………………………………….1
1.1 What is a Cooperative?.......................................................................................1
1.2 The Economic Advantages of Cooperation …………………...……………....2
1.3 Variation in Cooperative Development in the EU …………………………….4
1.4 Research Question and Data………………...…………………………………8
Chapter 2: Literature Review………………………...…………………………………..13
2.1 Early Cooperatives in Europe …………………………………………....13
2.2 History of Agricultural Cooperatives in the EU…………………………..17
2.3 The Structure and Organization of the Common Agricultural Policy...…..22
2.4 Producer Organizations……...…………………………………………...26
2.5 Philosophical Underpinnings and the Social Economy……………...…...28
2.6 Hypothesis……………..………………………………………………...32
Chapter 3: Methods and Analysis…………………………...……………………………33
Chapter 4: Findings…………………………...………………………………………….36
Chapter 5: Discussion and Conclusion…………………………..………………….……44
Appendix…………………………..………………………………………………….….47
References……………..………………………………………………………….……...48

iv
TABLES AND FIGURES
Table 1: Descriptive Statistics for EU Member States………………..……………..…...37
Table 2: APCs Per Capita…………...…………………………………………………....38
Table 3: Average Members per APC………………..……………………………….…...39
Table 4: APC Members per Capita……………………………………..……………..….40
Table 5: Average Agricultural Output……………………………..…………………..…41
Table 6: Association Between Region and Cooperative Development Indicators……......41
Table 7: Association Between Output and Cooperative Development Indicators……….42
Table 8: Summary of Cooperative Development Variables by Country and Region……..48

v
ABBREVIATIONS
APC – Agricultural Producers Cooperative
CEECs – Central and Eastern European Countries
CAP – Common Agricultural Policy of the European Union
COGECA – General Confederation of Agricultural Cooperatives in the European Union
CMO – Common Organization of the Markets in Agricultural Products
COPA – Committee of Professional Agricultural Organizations
EAFRD – European Agricultural Fund for Rural Development
EC – The European Commission
EU – The European Union
F&V – Fruit and Vegetable
ICA – International Cooperative Alliance
MS – Member States of the European Union
MSE – Mediterranean and Southern European
NWE – Northern and Western European
PO – Producer Organization
WTO – World Trade Organization

1
CHAPTER ONE: INTRODUCTION
1.1 What is a Cooperative?
Cooperative organizations are not new inventions in regards to their structure and
principles, however their presence amidst the post-industrial landscape of the 21st century
can be seen as a quiet protest against conventional individual and corporate means of
ownership and production. Cooperatives provide an alternative business model that has the
capacity to compete against traditional and investor-owned businesses through cooperative
participation and marketing. The International Co-operative Alliance (ICA) defines a
cooperative as “an autonomous association of persons united voluntarily to meet their
common economic, social, and cultural needs and aspirations through a jointly-owned and
democratically-controlled enterprise” (Fairbairn, 2004, p. 24). Building on this definition,
the Canadian Co-operative Association defined cooperatives as “business organizations
owned by the members who use their services” (Fairbairn, 2004, p. 25). The definition of
what a cooperative is remains contested due to differences in ownership (producer, worker,
or consumer) and purpose (credit, housing, grocery, etc.) but these three principles
underscore the importance of democracy and autonomy in all cooperative organizations
(Bijman et al., 2012):
1. The User-Owner Principle:
• Those who own and finance the cooperative are those who use the cooperative.
2. The User-Control Principle:
• Those who control the cooperative are those who use the cooperative.
3. The User-Benefits Principle:

2
• The cooperative’s sole purpose is to provide and distribute benefits to its users on
the basis of their use.
The qualifications and requirements that structure how a cooperative is legally
defined vary from country to country depending on the specific sector and whether the
government wants to incentivize or discourage cooperative participation (Bijman &
Iliopoulos, 2014). While cooperatives can be organised for a variety of purposes, this thesis
focuses specifically on agricultural producers’ cooperatives (APCs). APCs are
organizations that unite agricultural producers under a common business which is them
used to aggregate, market, and sell the agricultural goods of member farmers. The benefits
of participating in an APC include the ability to share risk, achieve economies of scale,
lower transaction costs, gain competitive advantage, and more easily access resources
(Bijman et al., 2012). When APCs are referenced in this thesis, the term includes not only
the legally recognized and financially supported producer organizations (POs) in the
European Union (EU) but it also includes the agricultural cooperatives that belong to
sectors that are not yet financially supported by the EU.
1.2 The Economic Advantages of Cooperation
According to a landmark study in 2012 meant to garner support for cooperatives in
the EU, the economic benefits of APCs are worthy of EU support through pro-APC
policies, public support through the purchasing of products produced by APCs, and farmer
support through becoming a member of an APC (Bijman et al., 2012). In 2010, dairy APCs
in the EU reached a 57% market share while APCs from all agricultural product sectors
reached a 40% market share across the EU (Bijman et al., 2012). In some sectors, there is

3
evidence that APCs can provide increases in profits to both members and nonmember
producers and that APCs can achieve a higher market share in relation to investor-owned
businesses (Bijman et al., 2012). The Competitive Yardstick Theory claims that the
presence of cooperatives in an agricultural sector improves competition which in turn
provides benefits such as higher prices to both producers who are members of cooperatives
and to producers who are not (Bijman & Iliopoulos, 2014). However, APCs enjoy varying
levels of success depending on which agricultural sector they are operating. A study by
Hanisch et al. (2013) suggests that in countries where dairy cooperatives have a higher
market share than dairy cooperatives in other countries, higher market shares are
accompanied by higher prices (Hanisch et al., 2013). This study supports the Competitive
Yardstick Theory and lends credence to the ability of APCs in certain sectors to bring both
members and nonmembers higher prices for their goods (Hanisch et al., 2013).
The recognition of the economic benefits of APCs by the European Commission
(EC) led it to commission a study in 2010 entitled “Support for Farmers’ Cooperatives”
which provided both policy makers and producers with a resource guide that outlined the
benefits, the barriers, and the state of increased cooperative agricultural participation in the
EU (Bijman et al., 2012). This study set out to describe the overall state of agricultural
cooperatives in the EU and to identify the laws and regulations that help or hinder farmers
who produce cooperatively or who would like to produce cooperatively, as well as to “help
farmers organise themselves in cooperatives as a means to consolidate their market
orientation and so generate a solid market income” (Bijman et al., 2012, p. 7).
However, APCs are less prevalent in many Central and Eastern European countries
(CEECs), many of which are considered “transition societies” where socialism and

4
communism negatively impacted the public image of cooperative participation
(Gijselinckx & Bussels, 2014, p. 517). Mediterranean and Southern European countries
face challenges to development of cooperative agricultural sectors such as a lack of access
to risk capital (Bijman et al., 2012). Barriers to cooperative development call into question
whether current EU policies foster cooperative participation and are effective across
regions with different historical and socioeconomic legacies.
1.3 Variation of Cooperative Development in the EU
Variation in the development of APCs across the EU has been well studied and
documented with some countries facing specific challenges regarding levels of cooperative
memberships compared to other countries. Many Northern and Western European
countries such as France, Germany, Belgium, Ireland, the United Kingdom, Netherlands,
Austria, and Denmark all have a membership intensity, or percentage of producers who are
members of APC, of over 50% (Gijselinckx & Bussels, 2014). Mediterranean and Southern
European countries have a membership intensity of around 30% to 50%, while CEECs
such as Estonia, Latvia, Lithuania, Poland, Czech Republic, Hungary, Slovak Republic,
Romania, and Bulgaria all have a membership intensity of below 30% and in some cases
below 10% (Gijselinckx & Bussels, 2014). Concerning the market share of agricultural
products marketed by way of APCs, the Northern and Western European countries market
over 40% and in some cases over 50% of agricultural products through cooperatives
(Bijman & Iliopoulos, 2014). Mediterranean and Southern European countries such as
Spain, Portugal, Italy, and Greece market around 25% to 50% of agricultural products

5
through cooperatives, while CEECs fall into the 0% to 25% bracket according to Bijman
et al. (2012).
The propensity of some countries to produce cooperatively more than others can be
at least partially explained by the political systems and historical legacies that the countries
in these regional groupings have experienced. No country in Northern and Western Europe
has experienced a communist regime and no Northern and Western European country falls
below a membership intensity of 50% or below a 40% market share of cooperatively
marketed agricultural products (Bijman et al., 2012). This link between both higher
membership intensity and higher market shares of cooperatively produced agricultural
goods and countries that have not experienced communism provides insight into the culture
of wariness towards cooperative institutions that has developed in post-Soviet and post-
Yugoslavic states that does not exist in states without communist legacies. Those countries
that have experienced communist regimes typically have the lowest membership intensity
percentages and the lowest percentage of agricultural products markets cooperatively in
the EU-28. When looking at the literature, CEECs have shown a rapid decline in APC
membership after the fall of communism and during the privatization of agricultural sectors
(Gijselinckx & Bussels, 2014). CEECs with traditions of cooperative participation before
communism have yet to see a full rebound since 1989.
According to Gijselinckx and Bussels (2014) in “Social and Historical
Determinants of Cooperative Membership in Agriculture,” although membership rates
might be low in post-communist CEECs, this could be accounted for by the “propaganda
of individual success” that national governments used to promote privatization and
entrepreneurship. Additionally, post-communist CEECs such as Poland and Czech

6
Republic which implemented more liberal forms of communism have levels of
membership intensity and cooperative marketing of agricultural product ratios that are
higher than other CEECs (Gijselinckx & Bussels, 2014). Over 80% of Polish farmers
resisted the collectivization of their farms under communism (De Master, 2012). While
there were repercussions to resisting collectivization such as severely restricted access to
petrochemical fertilizers, the ability of a significant percentage of Polish farms to resist
collectivization without more severe repercussions signals the relative liberality of its
communist regime (De Master, 2012). This suggests that stricter forms of communism had
more negative effects on cooperative development than less strict forms. The effects of
inefficient state-mandated collectivism have made APC membership unappealing to
producers who lived through the old regimes as well as the transition periods that followed.
Lissowska’s study “The deficit of cooperative attitudes and trust in post-transition
economies” (2012) adds to the “propaganda of individual success” argument by suggesting
that countries which were making the transition from communism to market economies
based their transitions off the idea that “self-interested individuals competing in the market
would provide the best economic results” (Lissowska, 2012, p. 2). Lissowska argues that
trust and cooperation were not part of the original transition plans 20 years ago and because
of this, the current state increased trust and cooperation found across the EU is largely
absent in post-transition countries. Through qualitative research, Lissowska’s study
indicates that “post-transition societies still constitute a relatively homogenous group and
are different from the others from the point of view of level of trust and type of social
engagement,” a conclusion which helps to explain the lesser degree of cooperative

7
development seen in many Central and Eastern European post-Soviet and post-Yugoslavic
countries (Lissowska, 2012, p. 2).
In Mediterranean and Southern European countries, the literature linking historical
and socioeconomic determinants to different measures of cooperative development are
sparse. However, studies have identified key problems that explain why Mediterranean and
Southern European countries produce less efficiently through APCs. In the case of Greece,
government interference in the affairs of cooperatives has made Greek APCs into some of
the least productive in the EU, with Greek APCs producing less value per APC than in any
other country (Iliopoulos & Valentinov, 2012). In the 1980s and 1990s, APCs in Greece
were courted by major political parties to try and gain the support of their leaders and
members. During this same period, farmers began joining APCs not because of the benefits
that they provided economically, but because being a member of a cooperative helped
farmers gain access to politicians. APCs became more effective as political tools than as
businesses because farmers represented around 20% of the electorate. When global
competition was increasing and commodity prices began to decrease in the 1990s and
2000s at the same time as the EU halted its use of direct subsidies to support farms, leaders
of APCs became increasingly unable to protect the incomes of farmers, a problem which
was never fully remedied (Iliopoulos & Valentinov, 2012).
In the case of Spain, Italy, and Portugal in the olive oil sector which have achieved
national APC market shares of 70%, 5%, and 35% respectively, all three have gradually
seen their share of the market diminish (Bijman et al., 2012). This could be due to a general
lack of integration between producers and downstream processing activities such as
bottling. The federated structure of two-tier cooperative systems used in Spain where “first-

8
tier” olive APCs send their olives to “second-tier” APCs which then extract, bottle, and
brand the oil seems to be more inefficient than other more integrated approaches, though
Spanish olive oil APCs probably make up for some efficiency by being larger than the
average APC in other Mediterranean and Southern European countries (Bijman et al.,
2012). The CMO for fruit and vegetables, which provides financial incentives for fruit and
vegetable POs, has been effective in some Mediterranean and Southern European member
states, with both Spanish and Italian APCs maintaining around 50% of the fruit and
vegetable market (Bijman et al., 2012). While some agricultural sectors have seen positive
growth for APCs, other sectors face difficulties, making it hard to point to specific issues
that member states collectively face across the board.
1.4 Research Question and Data
This thesis adds to the literature on variations in cooperative development across
agricultural sectors by using quantitative indicators of cooperative development to identify
contemporary patterns in cooperative development between distinct regional groups. This
thesis focuses specifically on APCs within the EU and the variability of their prevalence
across different cultural, economic, historical, and political landscapes. While the EU is
guided by its Common Agricultural Policy (CAP) and its guidance on producer
organizations, the CAP gives each of the 28 member states of the EU a level of autonomy
in how they individually define and support APCs and whether they incentivize or
discourage cooperative participation. This thesis does not seek to undeservingly glorify or
idealize APCs, but rather it seeks to build on the literature on the past and present state of
9
APCs to understand why farmers some member states produce cooperatively more than
other member states.
National policies regarding APCs reflect the unique histories and socioeconomic
characteristics of each member state. I posit here that the differences and similarities in the
legacies of regional groupings of member states can help us to better understand variations
in cooperative participation by contextualizing the current state of participation within the
legacies of these regional groups. This study is different from others present in the literature
because of the indicators used to measure levels of cooperative participation. By using
recent data available for all four cooperative development indicators and analyzing regional
differences within the context of the historical regional characteristics, this thesis provides
a path for further studies of cooperative participation in the EU. The overarching research
question is: What patterns exist regarding the level of participation in agricultural
producers’ cooperatives across groups of historically and politically contrasting countries
within the European Union, and how does each group’s economic, historical, and political
background play into levels of cooperative participation?
One way to approach the topic of varying levels of cooperative participation in the
EU would be to look at the evolution of agricultural producer cooperatives over time and
to link historical statistics to national and EU-level policy decisions which have affected
cooperative agricultural enterprises and their members. However, the absence of complete
and comparable historical data on agricultural producer cooperatives makes this kind of
analysis difficult. Instead, I have utilized a dataset produced by COGECA in 2015 as a part
of their annual “Development of Agricultural Cooperatives in the EU.” This source
provides some of the key statistics on agricultural cooperatives for each member state such

10
as number of cooperatives, number of cooperative members, and annual turnover
(COGECA, 2015). This report provided both EU institutions and member state
governments with an overview of the state of the EU and the different cooperative
agricultural sectors in each of its member states. A report by Cooperatives Europe in 2015
entitled “The Power of Cooperation” was also used to fill in missing data from the
COGECA report (Cocolina, 2016). The report provides key statistics such as member and
employee numbers for member states.
In this thesis, I identify the relevant indicators that provide insight into the current
state of APCs and their members across three regional groupings of member states with
similar historical and socioeconomic legacies. These groups are: Austria, Belgium,
Denmark, France, Finland, Germany, Ireland, Luxembourg, Netherlands, Sweden, and
United Kingdom as a “Northern and Western European” group; Bulgaria, Czech Republic,
Croatia, Estonia, Hungary, Latvia, Lithuania, Poland, Romania, Slovakia, and Slovenia as
a “Central and Eastern European” group; and Spain, Portugal, Italy and Greece as a
“Mediterranean and Southern European” group. The reasons behind these groupings stem
from the varying prevalence and institutional structure of cooperatives in different parts of
the EU as was previously discussed. Cyprus and Malta were not included in country the
country groupings because neither country was consistently examined in the literature as
part of any of the three regional groupings. This lack of a regional association could be due
to the fact that Cyprus and Malta are both island countries and are not geographically
connected to continental Europe.
Many Western and Northern European countries have cooperative traditions that
reach back over 150 years. These countries face challenges concerning the internal

11
governance of large, increasingly international APCs which have been so successful that
they are outgrowing their legal and structural boundaries (Hagedorn, 2014). In Central and
Eastern European Countries, the memory of state farms and nationalized lands and the
“communist legacy” with which they are associated has made farmers skeptical of “forced
cooperation” and hence more prone to organizing traditional family farm businesses that
were not members of APCs (Hagedorn, 2014, 557). In Mediterranean European countries,
while countries such as Spain and Greece have achieved high rates of cooperative
membership and participation, the problem lies in difficulties with internal governance and
the level of “trust in political institutions” by producers (Bijman et al., 2012, 89). The great
success of APCs and POs in Northern and Western Europe is contrasted against the
difficulties that many CEECs and Mediterranean and Southern European member states
have had when developing cooperative enterprises.
Through an analysis of each group of countries and the different cooperative
development indicators of APC members per capita, APCs per capita, average members
per APC, and total agricultural output, this thesis seeks to identify patterns in cooperative
development for each group of countries and outline arguments for how these patterns fit
into the political and historical legacies of each group. For all instances where “per capita”
is used in the context of these cooperative development indicators, the measure is per
100,000 people. APC members per capita was used as a cooperative development indicator
because it provides information on how many producers per 100,000 people are in each
member state or region. This knowledge is useful for comparing the number of APC
members and non-members between regional groupings and member states. By that same
logic, the APCs per capita and average membership per APC indicators are useful for

12
comparing densities of APCs and densities of members per APC between regional
groupings and member states. Lastly, the total agricultural output cooperative development
indicator shows how agriculturally productive different countries and regions are overall.

13
CHAPTER TWO: LITERATURE REVIEW
2.1 Early Cooperatives in Europe:
While agricultural cooperatives are seen today as another form of business
enterprise that farmers across the globe use to aggregate and sell their goods, the ethos of
agricultural cooperatives is found in the early history of the larger cooperative movement.
To understand the role and varying levels of prevalence of agricultural cooperatives in the
modern context of the European Union, it is important to examine the history and evolution
of cooperatives in Europe. Cooperative organizations arose in direct opposition to the
development of industrial capitalism and modernism in the eighteenth century (Fairbairn,
2004). Advances in mechanized technology that were developed during England’s
Industrial Revolution (1750-1850) brought an end to the widespread home-based business
movement that existed before the Industrial Revolution. This was due to the inability of
home-based producers to compete with the low-cost consumer goods that factories could
provide (Center for Cooperatives, 2015).
Workers who were displaced from these home-based operations moved into
overcrowded cities where jobs were scarce and labor standards and wages were low while
increased efficiency in agriculture sent more workers out of the field and into the city. As
the working class and their allies looked for ways to fight socio-economic stratification
during the latter half of the nineteenth century and the beginning of the twentieth century,
cooperatives were conduits for organising the average worker in opposition to the factory
owner. The advent of cooperatives allowed factory workers to gain a new level of
autonomy by providing a practical way for them to compete against those with much more
money by pooling resources and participating in a cooperatively owned enterprise.

14
“Friendly Society” organizations in England were some of the earliest iterations of
civil society organizations that functioned similarly to cooperatives. They promoted mutual
benefits for workers of the same trade who participated in what would be now considered
insurance programs where each worker paid into a fund which was used to assist workers
who were injured on the job or who fell ill and were unable to work for a period. In 1702,
a definition for Friendly Society organizations was provided by author Daniel Defoe in his
An Essay on Projects. Defoe explains how these friendly societies could provide a social
safety net to help keep workers from falling into ruin due to accidents or illness. Defoe
characterized Friendly Society organizations as, “a number of people entering into a mutual
compact to help one another in case any disaster or distress fall upon them” (Defoe, 1702,
p. 118). This kind of community-based insurance program is an early example of a self-
help organization that originated when business and government failed to adequately
compensate or provide assistance to workers when they encountered hardship.
Over 100 years later, Defoe’s vision was developed further through the work of
William King, a doctor and educator who saw the difficulties that workers were facing at
finding decent paying jobs in Brighton, England. In 1827, Dr. King helped to create the
first cooperative in the history of England: The Brighton Co-operative Society, which used
member dues of one penny per week to publish The Co-operator magazine (Simkin, 1993).
The Co-operator was used to explain to the working class the importance of mutually
beneficial cooperative organizations over capitalist establishments. The Co-operator
eventually sold 12,000 copies a month and could pay fair wages to its employees as well
as finance the work of the Brighton Co-operative Society. It did so well that the Brighton

15
Co-operative Society invested into several Brighton businesses that paid their workers
more than the going wage of non-cooperatively managed businesses.
In 1922, The British Co-operative Union chronicled the life and work of Dr. King
in Dr. William King and the Co-operator, a book comprised of an introduction by William
Mercer followed by all issues of The Co-operator that were published between 1828-1830.
Included within the introduction is a description of the mutual-aid society founded by
students of Dr. King called the Brighton Co-operative Benevolent Fund Association. Its
objectives were, “first, to raise by a small weekly contribution a fund for the purpose of
enabling proper persons (who have not themselves the means) to join Co-operative
Communities, by giving the whole or part of the capital, as the circumstances of the
individual may require; and, secondly, to spread a knowledge of the co-operative system”
(King & Mercer, 1922, p. XX). The introduction notes that the main reason why Dr. King
began self-publishing The Co-operator was to raise awareness of the associations and
societies of his students, a goal which he indeed accomplished.
The work of King along with early cooperative pioneers such as Robert Owen stand
as early examples of collective action around cooperative participation in the industrial
age. Robert Owen, often called the “Father of Socialism”, pioneered an experiment of
mutually beneficial participation in Lanarkshire, Scotland called New Lanark which he
owned from 1800-1825 (Williams & Thompson, 2011, p. 56). Owen provided his workers
with free health care and free education on top of their pay, benefits which were not offered
other industrialists in England during that time. Owen himself described the project as “the
most important experiment for the happiness of the human race that had yet been instituted
at any time in any part of the world” (Kumar, 1990, p. 14). The form of Utopian Socialism

16
that Owen promoted became a model for industrial production that kept in mind the needs
of workers and provided them with amenities and benefits that were not yet the norm in
Western industrial countries and which went against the business practices of the day
(Dowd, 2012). The principles that pioneers such as Defoe, King, and Owen developed still
help to inform how organizations such as the International Co-operative Alliance define
and assist cooperatives even as they evolve into iterations that look much different than
they did in the 18th and 19th centuries (Fairbairn, 2004).
While cooperatives were being used in the 18th and 19th in British industrial sectors
to protect workers against rampant capitalism, early cooperative movements in Denmark
and Poland provided workers with the same protection against exploitation in the
agricultural sector. The Danish cooperative agriculture movement, also called the
Andelsbevaegelsen in Danish, became a formidable force as cooperative dairies began to
form in 1882 (Choloupkova, Svendsen, & Svendsen, 2003, p. 248). Over the next several
decades, cooperative movements formed in other sectors including the fodder,
slaughterhouses, and banks, eventually becoming the de facto way to organize businesses
in rural Denmark. These cooperative business ventures were formed by peasants who,
before 1882, had been producing their own agricultural goods and selling them to traders,
a process which was expensive and unpredictable. When dairies began to organize
cooperatively in 1882, members saw immediate results in the quality, quantity, and price
of butter that was produced cooperatively (Choloupkova et al., 2003). The social capital
that developed in rural communities in the latter half of the 19th century remains strong
today in the Danish cooperative dairy sector as well as in other sectors.

17
While the Danish cooperative agricultural sector remained strong throughout the
20th century like those of its Western European neighbors, the Polish cooperative
agricultural sector paints a dismal picture of the rise and fall of cooperative agricultural
sectors in the CEECs. Between 1918 to 1939, the cooperative dairy sector in Poland
flourished and plentiful cooperative banks were able to provide credit to Polish farmers
(Choloupkova et al., 2003). By 1939, there were over 14,000 cooperative organizations in
Poland. However, the post-World War II communist regime decimated the industrial,
financial, and agricultural cooperative sectors in Poland and the road to recovery after 1989
bas been littered with many challenges. According to Chloupkova et al. (2003), “private
farms were in advance obliged to sign contracts specifying the volumes of produce they
would sell to the state and accept the prices set by the state” (Choloupkova et al., 2003, p.
248). This and other policies restricted voluntary cooperation, and forced cooperation made
many farmers reluctant to work with the government during the communist regime and
suspicious of cooperative policies after 1989. This suspicion of the state and of cooperation
is a central theme in the cooperative agricultural legacy of other CEECs and will be
highlighted throughout this thesis.
2.2 History of Agricultural Cooperatives in the EU
The global agricultural status quo of the post-World War II era has been oriented
towards maintaining a stable supply of food and agricultural goods in the face of rising
levels of consumption and increasing populations. The leaders of this new era of agriculture
were countries such as the United States, Australia, and New Zealand which all developed
national subsidy programs to incentivize farmers to produce as much of specific kinds of

18
agricultural goods as possible (Almas & Campbell, 2012). Technological advances in the
agricultural sciences helped to boost yields while a free trade regime that included countries
in the developing world provided the competition and subsequent increases in productivity
necessary to provide consumers with historically inexpensive food (Almas & Campbell,
2012). One of the goals of this new era of globalized agricultural production and trade was
to effectively end world hunger by providing an excess of cheap agri-food products to
rapidly expanding populations in both developed and developing countries. The European
model took the opportunity to implement a system that would work with World Trade
Organization (WTO) guidelines on subsidies and tariffs while the U.S. system continued
to utilize productivist policies that often clashed with WTO rules.
Many European countries participated in this era of cheap food by developing the
same kind of direct-subsidy regimes found in the United States and Australia. It was not
until the late 1980s that the supply and demand problem of under-production moved to a
problem of over-production (Almas & Campbell, 2012). During this time, the debate over
agricultural production practices in Europe moved from focusing solely on hunger to
focusing also on the environmental effects of agricultural production, animal welfare, and
human health. In 1992, European governments began to respond to the outcry against
direct-subsidy regimes and took steps to decouple the link between production and
subsidies while also promoting alternative income-generating practices such as “organic
farming, farm tourism, on- and off-farm diversification, and environmental and cultural
landscape management” (Almas & Campbell, 2012, p. 4). In making these changes to the
subsidy regime in the EU, policymakers were responding not only to public discourse but
also to changes in WTO rules that sought to end direct payment and price support. These

19
neoliberal changes to the agri-food system were founded in “market competitiveness,
comparative advantage, and improved market share”, shunning traditional models of
“market protection, state assistance, and export promotion” (Potter & Tilzey, 2007, p.
1293).
The paradigm of agricultural production in the EU that formed after the WTO
policy reforms of the early 1990s is known as “multifunctional agriculture”.
Multifunctional agriculture incorporates a strong moral grounding in sustainable
production that elevates maintaining environmentally and economically stable rural
communities over potentially disruptive intensive production practices (Almas &
Campbell, 2012). Multifunctionalism argues that agriculture has multiple functions in both
the economic and traditionally noneconomic realms. One of the aims of the EU’s
multifunctional model is to use agriculture to maintain “rural landscapes, protect
biodiversity, generate employment, and contribute to the viability of rural areas” in
addition to food production (De Master, 2012, p. 93). However, multifunctionality has been
highly contested within international discourses on global agricultural policy with critics
arguing that it is “an exeptionalist excuse for continued agricultural protectionism” due to
its continued use of certain forms of subsidies (Potter & Tilzey, 2007, p. 1291).
For others, multifunctionality is a form of resistance to continued trade
liberalization and an important step towards incentivizing more sustainable forms of
agricultural production and trade. In its Agenda 2000 report, the European Commission
explained why CAP subsidies are aimed towards promoting a successful multifunctional
agricultural model. The report said that “the fundamental difference between the European
model and that of our main competitors lies in the multifunctional nature of agriculture in

20
Europe and the role it plays in the economy and the environment, in society, and in the
conservation of the countryside” (De Master, 2012, p. 93). Proponents view the principle
of multifunctionality as a novel approach to developing a more holistic agricultural system
that incorporates social and environmental concerns into agricultural policies. Farmers are
envisioned as stewards of public goods, acting as custodians of rural landscapes and the
environment. According to Van Huylenbroeck et al. (2007), the multiple functions that are
served through multifunctional production exist in several different groups (Huylenbroeck,
2007, p. 6). These groups include:
• “Green functions: landscape management and the upkeep of landscape amenities,
wildlife management, the creation of wildlife habitat and animal welfare, the
maintenance of biodiversity, improvement of nutrient recycling and limitation of
carbon sinks;
• Blue services: water management, improvement of water quality, flood control,
water harvesting and creation of (wind-) energy;
• Yellow services: the role of farming for rural cohesion and vitality, ambience and
development, exploiting cultural and historical heritages, creating a regional
identity and offering hunting, agro-tourism and agro-entertainment; and
• White functions: food security and safety”.
The movement of many of the countries in the European Union towards
multifunctional agriculture also corresponds with the European tradition of cooperation,
even as the definition of cooperation differs depending on the cultural, economic,
historical, and political legacies of each member state. As Europe recovered from the
devastation of World War II, cooperation was key to ensuring a peaceful and prosperous

21
future for the continent. APCs became a centerpiece in the Common Agricultural Policy
(CAP) of the European Community because the Community wanted more integration and
cooperation between member states concerning their individual agricultural policies
(COGECA, 2010). The Treaty of Rome, which was signed in 1957 and established the
CAP, gave rise to the possibility for representation and influence of farmers and farming
experts on CAP provisions. With the support of the European Commission, the Committee
of Professional Agricultural Organizations (COPA) and the General Committee for
Agricultural Cooperation in the European Union (COGECA) were formed in 1958 and
1959 as representative organizations aimed at supporting the interests of APCs and farm
workers at the EC level (COGECA, 2010). Today, COPA and COGECA remain the two
largest agri-cooperative and farmer lobbying organizations in the EU.
The inclination towards cooperative participation in Europe remained strong as the
European Community morphed into the set of supranational and intergovernmental
institutions that presently make up the European Union. The current macro view of how
APCs are faring in the EU today can be observed by looking at the market share that APCs
hold in a specific agricultural sector or across all sectors (Brusselaers, Poppe, & Azcarate,
2014). In 2010, the average market share of APCs in the EU was around 40% across all
agricultural sectors, with APCs in some countries achieving over 50% market share across
all agricultural sectors (Bijman & Iliopoulos, 2014). According to the 2015 COGECA
document, COPA and COGECA currently represent 70 national farming and cooperative
organizations at the EU level and 22,000 farmers’ cooperative organizations across the
continent (COGECA, 2015). In 2015, Cooperatives Europe reported that the European
Union contained over 51,392 APCs with over 9,592,704 members, 675,566 employees,

22
and over 347 € billion in annual turnover in the cooperative agricultural sector. The
turnover in the cooperative agricultural sector was 39.34% of the total turnover from all
sectors cooperative enterprises (Cocolino, 2016). The Cooperatives Europe document also
notes that from 2011 – 2012, the turnover of the top 100 performing APCs represented by
COGECA increased by 4% and by 14% from 2012–2013.
Although these macro statistics paint a positive picture of APCs in the EU, and
while some member states have cooperative agricultural sectors with high shares of the
market, the cooperative agricultural sectors of other member states are sometimes much
less developed (Brusselaers, Poppe, & Azcarate, 2014). In 2010, while Finland, Denmark,
Sweden, Ireland, the Netherlands, France, and Austria all had cooperative agricultural
sectors with market shares of over 50% over eight distinct sectors, other countries had
much lower market shares across the same sectors or only had strong percentages in a few
sectors (Brusselaers, Poppe, & Azcarate, 2014). Based on these data, the tendency of many
Northern and Western states to produce cooperatively is clear. However, how can we
explain the lower market shares present is other countries, many of which are in Central
and Eastern European member states? To tackle this question, it is important to look at the
scholarship surrounding the Common Agricultural Policy to understand how its policy
tools are used to support APCs.
2.3 The Structure and Organization of the Common Agricultural Policy
The Common Agricultural Policy is itself a test of European cooperation after WTO
rules threatened an era of unfettered trade liberalization. Since 1992 when the EU began to
move away from market interventionist policies towards policies to foster rural

23
development and environmental sustainability, the CAP has undergone a series of policy
reforms and adapted the tools that it uses to monitor and regulate the agricultural sector
(Matthews, 2011). During the past twenty years, reforms to build a financial safety net for
producers, develop environmental requirements for farmers, and foster rural development
have changed the way in which the CAP intervenes within the agricultural sector. While
90% of the CAP budget in 1992 was allocated towards market management by way of
export refunds and intervention purchases of member state products, in 2013 market
intervention had dropped to only 5% of the CAP budget, showing a clear transition away
from an interventionist subsidy regime towards allowing the decisions of consumers to
allow the market to set its own unsubsidized prices (European Commission, 2013).
The CAP is organizationally comprised of a two-pillar structure, each pillar
maintaining specific foci and competencies regarding agriculture and rural development in
the European Union. The first pillar, or the “common organization of the markets in
agricultural products” (CMO), is concerned with maintaining a stable market and ensuring
high levels of productivity across the different agricultural sectors in the EU (Ragonnaud,
2016a). Prior to 2003, there were 21 different CMO programs that each covered specific
agricultural products and the direct payments to farmers that were linked to production.
The Luxembourg reform of 2003 began the process of decoupling payments from
production and moving towards a single payment scheme that allowed farmers to produce
what the market wanted instead of what the subsidy programs incentivized (Ragonnaud,
2016a). After 2007, the 21 different CMO programs were combined into one singular CMO
that supports all forms of agricultural products. These changes to the first pillar of the CAP
moved price support intervention measures from the CAPs main form of agricultural

24
support into a safety net option used only in times of market disruption (Ragonnaud,
2016a). Since the reforms made to the CAP in 2013, the CMO plays a much different role
than it did prior to 2003. The current structure of the CMO has both an internal and external
focus regarding production and trade in the EU. Internally, the CMO maintains its role in
market intervention while also managing the rules on marketing and producer
organizations. Externally, the CMO manages the rules regarding import and export duties,
tariff quotas, and export refunds.
The direct payments paid to farmers by the CMO target specific objectives that are
outlined as followed: 1) a payment per hectare based off of national or regional criteria; 2)
payments for “greening”, or the specific environmental public good provided by farms that
are not accounted for in market transactions; 3) payments for five years to young farmers;
4) “redistributive payments”; 5) income support for farmers producing in environments
with “natural constraints”; 6) some coupled to production support based off of economic
or social goals; 7) payments to “small farmers” (Massot, 2017). The first three of these
objectives are mandatorily funded while the following four are optionally or partially
funded based on the needs of each member state. The funding to pay for these direct
payments under the first pillar of the CAP is paid out to member states who then appropriate
the money based off their own needs. Thirty percent of funding is required to go towards
the “greening” component while the other 70% is earmarked to fund the optional
components (Massot, 2017). This system provides member states with flexibility in how
they individually allocate dollars towards national and regional agricultural goals and
objectives while providing an overall direction for agriculture in the EU with a heavy focus
on incentivizing environmentally friendly production practices.

25
The second pillar of the CAP is known as the rural development policy.
Implemented in 2000, the rural development policy is funded by the European Agricultural
Fund for Rural Development (EAFRD) which is aimed at promoting growth and
employment through sustainable rural development that is conscious of maintaining a
healthy environment (Ragonnaud, 2016b). Member states work with the EAFRD on rural
development projects based on an extensive “menu” of approved measures provided by the
EAFRD. Rural development projects are co-developed and co-financed by member states
and the EAFRD after a project is ascertained to support the priorities of the EAFRD and
target a specific measure on the menu and then approved by the EC (Ragonnaud, 2016b).
Similar to the approach that the CMO uses to allocate funding in pillar one, the process of
deciding upon rural development projects is based on the specific needs of each member
state. The priorities laid out by the new rural development policy are outlined on the
website of the European Parliament as (Ragonnaud, 2016b):
• To promote knowledge transfer and innovation in agriculture and forestry;
• To increase the viability and competitiveness of all types of agriculture,
promote innovative agricultural technologies and support sustainable forest
management;
• To promote the organization of the food production chain, animal welfare
and risk management in farming;
• To restore, preserve and enhance agricultural and forest ecosystems;
• To promote the efficient use of resources and support the transition to a low-
carbon economy; and
• To promote social inclusion, poverty reduction and economic development.

26
2.4 Producer Organizations
The details of the Common Agricultural Policy require not only a knowledge of its
current configuration but also a knowledge of the CAP reforms over the past two decades
to fully understand its impact and trajectory. Understanding the way that CAP is organized
and the ever-changing policy instruments at its disposal is necessary to build an informed
understanding of how the policy defines and affects APCs. In the context of the CAP,
agricultural cooperatives are legally codified as “voluntary agricultural producer
organizations” (POs) which the European Commission has committed to support through
the development of a policy environment that promotes POs (Brusselaers, Poppe, &
Azcarate, 2014). A common definition of a PO is: “a rural business, owned and controlled
by producers, and engaged in collective marketing activities… Thus, in a broad sense, POs
are, like cooperatives, user-owned, user-controlled, and user–benefit organizations”
(Bijman et al., 2012, p. 18). The term “producer organization” is the way in which APCs
are defined and codified in EU law, although there are distinct differences in how POs
function in practice. POs deal much less with the processing of members’ products but
instead engage in the joint marketing and sale of members’ products (Bijman et al., 2012).
POs in the fruit and vegetable (F&V) sector are the only POs financially supported by CAP.
EU legislation was passed to support POs in the dairy sector in 2012 and in other sectors
in 2014, signaling that growth in the F&V sector has led to increased EU support of POs
in other sectors (Bijman & Iliopoulos, 2014).
Prior to 2007, the prevalence of small F&V farms that lacked the capacity to
consolidate and realize a larger production capacity was observed and noted by EU
officials. Since the 2007 CAP reforms to the Common Market Order (CMO) which aimed

27
to support farmers who were members of POs in the F&V sector, new provisions focusing
on supporting them yielded increases in cooperative development and participation
(Brusselaers, Poppe, & Azcarate, 2014). Financial support of F&V POs has largely been a
test to see if increased cooperative participation could be fostered through incentivizing
production in specific sectors.
One example of increased cooperative participation was in the case of Italian F&V
POs. POs in this sector utilized a new CAP co-financing scheme that allowed the POs to
co-finance investments with CAP funds, especially investments aimed at product
marketing support (Brusselaers, Poppe, & Azcarate, 2014). These F&V POs performed
much better than APCs in other sectors that were only supported by national law without
EU financial support. In Italy, they reached a 33% market share of the overall F&V sector
while POs in other sectors only made up 4% of the market. Additionally, reforms of CAP
in 1996 to the F&V CMO created new subsidies which helped to spur the development of
new POs. These reforms broadened the definition of POs which allowed POs that existed
in various other legal forms before 1996 to access these subsidies (Brusselaers, Poppe, &
Azcarate, 2014).
EU legislation in 2007 that allowed EU-recognized POs to expand into the hops,
olive oil, table olives, and silkworm sectors legally recognized farmers in these sectors with
the express directive that these organizations should focus on: “(i) concentrating supply
and marketing the produce of the members; (ii) adapting production jointly to the
requirements of the market and improving the product; (iii) promoting the rationalisation
and mechanisation of production” (Bijman et al., 2012, p. 20). Additionally, legislation in
2012 opened the dairy sector to the concept of POs, allowing farmers to use POs to

28
collectively negotiate contract terms such as the price of raw milk. However, neither of
these legislative changes mandate mutual ownership or democratic governance of POs as
is outlined in EU law for POs in the F&V sector, meaning that the only POs currently
recognized by the EU that can be classified as true APCs are those in the F&V sector
(Bijman et al., 2012). The variation in cooperative development across the EU signals that
while both POs and APCs flourish in some parts of the EU based on current CAP programs,
if the EU seeks a more evenly distributed development of POs and APCs, its policies
towards POs and APCs must take into account the varying cultural, economic, historical,
and political legacies that exist in different member states (Bijman & Iliopoulos, 2014).
The success of the F&V PO program indicates that expanding financial support into sectors
that presently have less membership density and lower percentages of market shares of
cooperatively produced goods would be beneficial to bolster sectoral cooperative
participation.
2.5 Philosophical Underpinnings and the Social Economy
The economic advantages of risk sharing, collective bargaining, and aggregation
realized through cooperative participation have been expounded upon already, but a strong
philosophical argument can be made for how APCs promote rural development and
agriculture as public goods. Karl Polanyi pioneered the idea that economic interests are not
the only forces pushing a person to act, but instead social relationships surround a person’s
economic interests, and these relationships drive one’s economic performance (Polanyi,
Arensberg, & Pearson, 1957). He considers both economic and nonmarket goods as
important, meaning that society benefits overall when nonmarket goods, goods such as
29
environmental sustainability and rural development, are invested in and protected.
Nonmarket goods are often undervalued because these goods are characterized as abundant
and ubiquitous. However, when there is a chance that nonmarket goods could be lost or
harmed, production practices and market transactions evolve in ways that elevate the
protection of nonmarket goods that are of value to society (Polanyi, Arensberg, & Pearson,
1957). The socially embedded economy helps us to understand variations in cooperative
participation by providing a framework for how different member states might or might
not value specific nonmarket goods or how they might have differing mechanisms for
protecting nonmarket goods.
This idea that the economy should be embedded within society centers around
reciprocity and redistribution. Polanyi believed that reciprocal acts in tribal societies
maintained a level of social cohesion that are absent in relationships in the industrial market
economy (Filip, 2012). Polanyi writes that, “…all social obligations are reciprocal, and
their fulfillment serves also the individual’s give-and-take interests best. Such a situation
must exert a continuous pressure on the individual to eliminate economic self-interest from
his consciousness to the point of making him unable… even to comprehend the
implications of his own actions in terms of such an interest” (Polanyi, 1945, 46). Polanyi
argues here that social interactions depend on reciprocal transactions even if those
transactions are not immediately visible to the parties involved. Reciprocity is often
complemented by redistribution in Polanyi’s socially embedded economy. Redistribution
is the spreading of wealth between the rich and the poor to help make society more secure
overall and is in Polanyi’s view a major function and obligation of the state.

30
Polanyi believed that the industrial economy creates poverty and economic
inequality, problems which must be remedied through redistribution. Institutions such as
public education and job training must be protected to give the working class a fair chance.
In analyzing Polanyi’s motives for supporting redistribution, Filip writes that, “Polanyi
aimed to restore a moral and ethical relationship between human beings by establishing an
institutional framework that regulates the activities of individuals” (Filip, 2012).
Reciprocity and redistribution are integral to understanding variations in cooperative
participation across the EU. This is because countries have different historical and
socioeconomic legacies that affect how member states view reciprocal transactions and the
redistribution of wealth. For instance, the stigmatization of collectivization in CEECs could
be a contributing factor to the lower levels of cooperative development present in these
countries. Even though the success of the F&V CMO and the success of EU dairy APCs in
raising prices paid to farmers show that there are benefits to cooperative participation,
perhaps the focus on individual success observed by Gijselinckx and Bussels (2014)
provides an explanation for the stigmatization of cooperative participation.
Understanding the differences between the socially embedded and the market-
dominated economy also relies on an understanding of what Polanyi calls fictitious
commodities. Fictitious commodities are elements not meant to be economically evaluated
and traded through market transactions. In The Great Transformation, Polanyi writes, “To
allow the market mechanism to be sole director of the fate of human beings and their natural
environment indeed, even of the amount and use of purchasing power, would result in the
demolition of society” (Polanyi, 1945, p. 76). The commodities that Polanyi was referring

31
to were land, labor, and capital, all things which have over time been commodified to the
point that their intrinsic value has been questioned and threatened.
There is a limit to how much a system can commodify land and human labor before
the system itself implodes, examples of such times being the Great Depression and the
Great Recession in the US context. The website OnTheCommons.org published an article
at the beginning of 2009 shortly after the beginning of the Great Recession with title “Why
Karl Polanyi Still Matters” offers a glimpse into the arguments that it makes regarding
fictitious commodities in the 21st century (Bollier, 2009). An excerpt from the article reads,
“The big cultural project of our time is learning to accept the reality that nature has its own
needs and limits, that human beings are not fungible units of labor, and that even money is
a social creation based on social trust and governance” (Bollier, 2009, 1). Polanyi’s work
on fictitious commodities is a reminder that humankind and nature both have limits and
that treating land and labor as expendable is not the way to organize a sustainable economic
system. The democratic and mutually beneficial nature of APCs makes them ideal for
utilizing Polanyian reciprocity and redistribution to re-embed markets back into society.
Polanyian reciprocity is found in APCs because producers realize greater benefits through
cooperation than without cooperation.
Polanyi’s concept of “double movement” argues that attempts of self-protection
transform societies in very different ways. Double movement is the idea that as self-
regulating, free markets continue to dominate, those who feel the negative effects of market
failures or of structural economic transitions will resist and form alternative economic
models to embed social considerations back into the economy (Maertens, 2008). These
counter movements are bred out of protectionist pressure to give national governments

32
more control over their labor force and economies than is accessible under international
free trade regimes. These movements range from fascist totalitarianism (Nazi Germany and
Mussolini’s Italy) that promote top-down control to bottom-up, socialist leaning
movements that promote democracy and social development as alternatives to the
disruptive effects of the unfettered free market. It could be argued that the democratic,
mutually beneficial nature of APCs represents the latter movement.
2.6 Hypothesis
Drawing on insights from the literature review, the following hypotheses were
tested using national-level data and making regional comparisons:
- The different historical and socioeconomic legacies of Northern and Western
European, Central and Eastern European, and Southern and Mediterranean European
member states have an effect on the level of cooperative participation as measured by
cooperative development indicators.
- The degree to which the historical and socioeconomic legacies of each regional
grouping affect their level of cooperative participation will be reflected in the density
of APC membership, with higher density reflecting higher levels of cooperative
participation and lower density reflecting lower levels of cooperative participation.

33
CHAPTER THREE: METHODS AND ANALYSIS
To discern which indicators are correlated with the level of participation in APCs
in the European Union, this thesis largely relies on analyzing patterns of cooperative
development across groups of countries. Three groups of member states were identified as
having comparable historical and political backgrounds and varying levels of cooperative
development. The three groups of member states are: Northern and Western European,
Central and Eastern European, and Mediterranean and Southern European. To quantify the
level of cooperative development between groups, variables were chosen that reveal how
groups or individual countries compares against one another. These cooperative
development variables include APCs per capita, average members per APC, APC members
per capita, and average agricultural output.
The APCs per capita variable was calculated using David Grace and Associates
(2014) population figures for each member state and COGECA (2015) figures on the
number of agricultural cooperatives in each member state. Agricultural cooperatives in the
COGECA study are treated as synonymous with APCs in this thesis and therefore the
number of agricultural cooperatives is treated as the number of APCs. This decision was
made because the COGECA study uses a similar definition for cooperatives as the
definition for APCs. The COGECA definition reads: “Cooperatives are the extension of
the farming activity, as they enable farms to increase their bargaining power, which is
essential to reduce cost when supplying inputs and material” (COGECA, 2015, p. 15).
Average members per PC was calculated using aggregated membership data for each
member state from Cooperatives Europe (2015), David Grace and Associates (2014), and
COGECA (2015) figures on the number of agricultural cooperatives in each member state.

34
APC members per capita was calculated using aggregated membership data for each
member state from Cocolina (2016), David Grace and Associates (2014), and COGECA
(2015) population figures for each member state. Average agricultural output was
calculated using an average of EUROSTAT (2013-2016) data on the total output of the
agricultural industry in millions of euros over three years for each member state.
Using SPSS 26 for data management and analysis, each cooperative development
indicator was analyzed to find the median, mean, standard deviation, minimum, and
maximum for all member states. Additionally, member states were coded as 1, 2, or 3 into
one of the three groups: 1 if the member state is Northern and Western European, 2 if the
member state is Central and Eastern European, or 3 if the member state is Mediterranean
and Southern European. Member states were then coded into a “low”, “medium”, or “high”
categories for each indicator, “low” representing the lowest 33.33%, “medium”
representing the middle 33.33%, and “high” representing the highest 33.33%. Once these
groups were created, a crosstabulation was conducted to see how many members of each
group of countries fall into the “low”, “medium”, and “high” categories for each of the
cooperative development indicators. Comparing column percentages, this analysis was
undertaken to see if any specific patterns in cooperative development exist between groups
of countries which have specific historical and socioeconomic linkages that were identified
in the literature.
This thesis also uses lambda and the uncertainty coefficient to measure the effect,
size, or degree of association between indicators. Lambda incorporates the proportional
reduction error when considering the independent variable to predict the dependent
variables, with 0 indicating that there is no association and 1 indicating that the independent

35
variable predicts the dependent variable (Loether & McTavish, 1993). The uncertainty
coefficient shows “the proportional reduction in error when values of one variable are used
to predict values of the other variable” (IBM, 2017). The uncertainty coefficient shows
how much knowledge of an indicator reduces the error in predicting another indicator. The
p-values for lambda and the uncertainty coefficient show the level of statistical significance
for each association, with p < .10 indicating a statistically significant association (Loether
& McTavish, 1993).
36
CHAPTER FOUR: FINDINGS
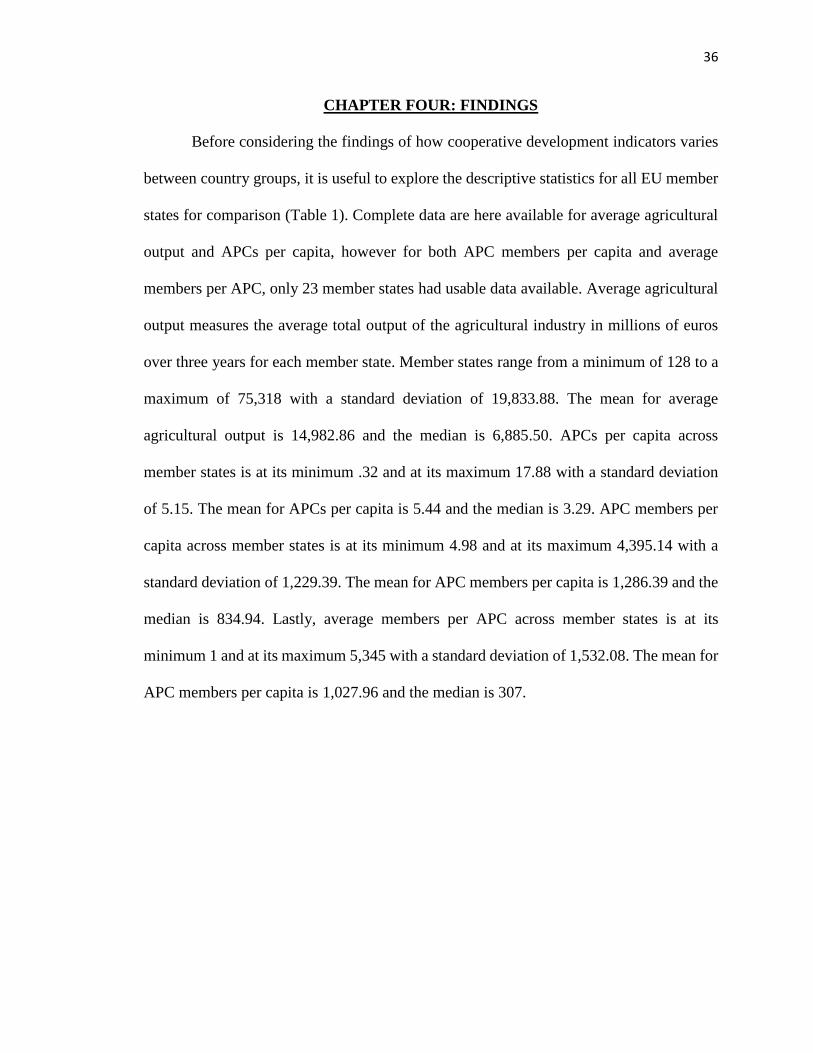
Before considering the findings of how cooperative development indicators varies
between country groups, it is useful to explore the descriptive statistics for all EU member
states for comparison (Table 1). Complete data are here available for average agricultural
output and APCs per capita, however for both APC members per capita and average
members per APC, only 23 member states had usable data available. Average agricultural
output measures the average total output of the agricultural industry in millions of euros
over three years for each member state. Member states range from a minimum of 128 to a
maximum of 75,318 with a standard deviation of 19,833.88. The mean for average
agricultural output is 14,982.86 and the median is 6,885.50. APCs per capita across
member states is at its minimum .32 and at its maximum 17.88 with a standard deviation
of 5.15. The mean for APCs per capita is 5.44 and the median is 3.29. APC members per
capita across member states is at its minimum 4.98 and at its maximum 4,395.14 with a
standard deviation of 1,229.39. The mean for APC members per capita is 1,286.39 and the
median is 834.94. Lastly, average members per APC across member states is at its
minimum 1 and at its maximum 5,345 with a standard deviation of 1,532.08. The mean for
APC members per capita is 1,027.96 and the median is 307.

37
Table 1: Descriptive Statistics for European Union Member States
Average
Agricultural
Output
APCs per Capita APC Members per
Capita
Average Members
per APC
Total Countries 28 28 23 23
Mean 14982.86 5.44 1286.39 1027.96
Median 6885.50 3.29 834.94 307.00
Std. Deviation 19833.88 5.15 1229.39 1532.08
Minimum 128.00 .32 4.99 1
Maximum 75318.00 17.88 4395.14 5345
Sources: Cooperatives Europe (2015), David Grace and Associates (2014), EUROSTAT (2013-2016), and
COGECA (2015). Additional calculations by author.
The descriptive statistics in Table 1 demonstrate the wide range of variation present
between member states for each cooperative development indicator. This information is
useful when comparing a group of member states against the whole of the EU regarding
the cooperative development indicators. However, crosstabulations are more useful for the
purposes of this thesis because they allow for a comparison of different groups against one
another and not only against all EU member states. The crosstabulations below demonstrate
for these member state group comparisons within the “low”, “medium”, and “high”
categories for each cooperative development variable as was explained in the “Methods
and Analysis” section above.
Although the focus of this study is between region comparisons, it is important to
summarize the within region variation that exists between regional groupings. Augmenting
Table 1, Table 8 in the appendix demonstrates that across all regional groupings, there is
variation in members per APC and APCs per capita, signaling that within each region,
member states engage in cooperative participation in the agricultural sector to varying
degrees. For instance, while there are 358 members per APC in France, there are 4879
members per APC in Finland. Coupled with the fact that Finland produces only about one-
sixteenth of France’s average agricultural output, this variation in members per APC could

38
mean that there is a larger focus on cooperative production in Finland or that members in
France are more consolidated with larger levels of production per member. When it comes
to APCs per capita, Central and Eastern European member states range from .32 APCs per
capita in Romania to 14.37 APCs per capita in Croatia. These data signal that further
studies on interregional variation in cooperative participation is the next logical step to
understanding cooperative variation in the EU.
Table 2: Agricultural Producers Cooperatives Per Capita
in European Union Member States
Category Northern and
Western
European
Central and
Eastern
European
Mediterranean
and Southern
European
Total
Low 45.5%
(5)
27.3%
(3)
0.0%
(0)
30.8%
(8)
Medium 45.5%
(5)
18.2%
(2)
50.0%
(2)
34.6%
(9)
High 9.1%
(1)
54.5%
(6)
50.0%
(2)
34.6%
(9)
Total
(n)
100.0%
(11)
100.0%
(11)
100.0%
(4)
100.0%
(26)
Sources: David Grace and Associates (2014) and COGECA (2015). Additional
calculations by author.
In analyzing tables 2 through 4, patterns can be identified between the different
regional groups and the cooperative development indicators. For instance, table 2 indicates
that 45.5% of Northern and Western European member states are in the “low” category for
APCs per capita while 54.5% of the Central and Eastern European member states are in
the “high” category for the same cooperative development indicator. Additionally, half of
the Mediterranean and Southern European member states are in the “medium” category
and half are in the “high” category for APCs per capita. This means that there is a higher
density of APCs in CEECs than in Northern and Western member states and that
Mediterranean and Southern European member states tend to also have a higher density of

39
APCs. While historical data on APCs per capita over time is not available, the rise in APCs
per capita in CEECs could indicate an increase in cooperative participation within CEECs.
However, the size of each APC is important because some APCs could have very low
membership, meaning that a high number of APCs per capita is not necessarily linked to a
higher average membership per APC.
Table 3: Average Members per Agricultural Producers Cooperative
in European Union Member States
Category Northern and
Western
European
Central and
Eastern
European
Mediterranean
and Southern
European
Total
Low 0.0%
(0)
77.8%
(7)
33.3%
(1)
38.1%
(8)
Medium 44.4%
(4)
11.1%
(1)
66.7%
(2)
33.3%
(7)
High 55.6%
(5)
11.1%
(1)
0.0%
(0)
28.6%
(6)
Total
(n)
100.0%
(9)
100.0%
(9)
100.0%
(3)
100.0%
(21)
Sources: Cooperatives Europe (2015), David Grace and Associates (2014), and COGECA
(2015). Additional calculations by author.
Table 3 helps to fill this knowledge gap by providing information on the average
membership density per APC, this being an important cooperative development indicator
because it shows how many producers use each APC to aggregate and market their product.
Table 3 shows that 44.4% of Northern and Western European member states fall into the
“medium” category and 55.6% fall into the “high” category while 77.8% of CEECs fell
into the “low” category, indicating that Northern and Western member states tend to have
higher density APCs than in CEECs. Table 2 and table 3 together indicate that Northern
and Western European Countries have developed APCs that are larger with more
membership per APC than in CEECs and in Mediterranean and Southern European
countries but which are less numerous per capita than in the other regional groups.

40
Table 4: Agricultural Producers Cooperative Members per Capita
in European Union Member States
Category Northern and
Western
European
Central and
Eastern
European
Mediterranean
and Southern
European
Total
Low 20.0%
(2)
45.5%
(5)
50.0%
(2)
36.0%
(9)
Medium 30.0%
(3)
45.5%
(5)
0.0%
(0)
32.0%
(8)
High 50.0%
(5)
9.1%
(1)
50.0%
(2)
32.0%
(8)
Total
(n)
100.0%
(10)
100.0%
(11)
100.0%
(4)
100.0%
(25)
Sources: Cooperatives Europe (2015), David Grace and Associates (2014), and COGECA
(2015). Additional calculations by author.
Table 4 demonstrates the APC members per capita which provides insight into how
each regional grouping does against one another regarding density of APC members. Half
of all Northern and Western European countries fall into the “high” category, but 30% also
fall into the “medium” category and 20% fall into the “low” category, showing a wide
spread APC membership density across this regional grouping. Ninety-one percent of all
CEECs fall into the “low” and “medium” categories, revealing that many CEECs have low-
to-medium levels of participation when it comes to cooperative participation. This table
indicates that while most Northern and Western European member states are on the
medium-to-high end of APC member density, CEECs are on the medium-to-low end.

41
Table 5: Average Agricultural Output in European Union Member States
Category Northern and
Western
European
Central and
Eastern
European
Mediterranean
and Southern
European
Total
Low 9.1%
(1)
54.5%
(6)
0.0%
(0)
26.9%
(7)
Medium 45.5%
(5)
27.3%
(3)
50.0%
(2)
38.5%
(10)
High 45.5%
(5)
18.2%
(2)
50.0%
(2)
34.6%
(9)
Total
(n)
100.0%
(11)
100.0%
(11)
100.0%
(4)
100.0%
(26)
Source: EUROSTAT (2005-2016). Additional calculations by author.
The average agricultural output table does not necessarily provide insight into how
regional groupings compare against one another in regards to cooperative development.
However, it does provide context into how different groups compare against one another
when it comes to overall agricultural development and production. Greater amounts of total
agricultural production could be the result of more highly developed systems of agricultural
production than in member states with lower levels of total agricultural production.
Table 6: Association Between Region and Cooperative Development Indicators
Indicators of Cooperative
Development
Lambda
(p)
U
(p)
APCs per Capita .235
p = .337
.159
p = .060
Average Members per APC .462
p = .017
.379
p = .002
APC Members per Capita .188
p = .244
.149
p = .086
Average Agricultural Output .383
p = .106
.152
p = .073
Table 6 contains two measures of the strength of association, lambda and the
uncertainty coefficient, which both measure the degree of association between nominal
variables. The lambda coefficient for the association between region and average members

42
per APC is .462, representing a strong association between region and average members
per APC. This association reflects the variation in average membership per APC between
regional groupings and suggests that region plays a role in the density of average members
per APC. The p-value for the lambda measure of average members per APC is .017 which
meets the p < .10 bar for statistical significance. The uncertainty coefficient for average
members per APC is .379, meaning that knowledge of region helps to reduce errors in the
prediction of the values of average members per APC by 38%. The p-value for the
uncertainty coefficient measure of the relationship between region and average members
per APC is .002, making the test statistically significant and further strengthening the case
for region as an indicator of membership density.
The association between region and average agricultural output is strong in the
lambda measure and weak to moderate under the uncertainty coefficient measure. The
lambda coefficient is .383 for average agricultural output, showing a moderate to strong
association between region and average agricultural output. The weak to moderate
association between region and average agricultural output signals that region has
somewhat of a potential influence on the average agricultural output of member states.
Table 7: Association Between Output and Cooperative Development Indicators
APCs per Capita Average Members per
APC
APC Members per
Capita
Lambda
(p)
U
(p)
Lambda
(p)
U
(p)
Lambda
(p)
U
(p)
Average Agricultural
Output
.333
p = .092
.108
p = .157
.467
p = .034
.292
p = .005
.222
p = .085
.101
p = .119
Table 7 also uses the lambda and uncertainty coefficient to test the strength of
association between variables. It shows the strength of relationship between average
agricultural output and the three other cooperative development indicators, APCs per

43
capita, average members per APC, and APC members per capita. The association between
average agricultural output and average members per APC in the lambda test is strong with
a coefficient of .467. The p-value for lambda is .034 which also meets the p < .10 test for
statistical significance. The uncertainty coefficient of .292, meaning that knowledge of
average agricultural output helps to reduce errors in predicting the values of average
members per APC helps reduce uncertainty in predicting agricultural output by 29%.

44
CHAPTER FIVE: CONCLUSION AND DISCUSSION
The findings shown in Chapter Four suggest that out of the four cooperative
development indicators comparing column percents and using the lambda measure, the
association between region and average members per APC is moderate to strong and the
association between region and average agricultural output is moderate. This indicates that
the variations in membership density between regional groupings can be at least partially
attributed to region when it comes to average members per APC and average agricultural
output. However, the other two cooperative development indicators show weaker
associations with region. The uncertainty coefficient values for table 6 are all statistically
significant, however all the associations are weak to moderate besides that association
between region and average members per APC where a strong association is present. This
reveals not only that region is strongly associated with membership density of APCs in the
EU, but also that knowledge of region helps to predict the values of average members per
APC. Table 7 indicates that for lambda, a strong association exists between average
agricultural output and average members per APC, with the uncertainty coefficient
signaling that knowledge of average agricultural output helps to predict the values of
average members.
These findings do not support the first hypothesis concerning variation across all
cooperative development indicators because the higher numbers of APCs per capita and
APC members per capita in CEECs and Mediterranean and Southern European member
states indicate that variation in these areas is not consistent with the suspicion of
cooperation that has been present in these groupings for generations. However, these
findings support the second hypothesis which states that the density of APC membership

45
affects the level of cooperative participation because patterns in the crosstabulation and the
lambda value for the association between region and members per APC indicate a strong
relationship. While CEECs and Mediterranean and Southern European member states
show higher density than Northern and Western European member states in the realm of
APCs per capita, Northern and Western European member states show higher membership
density per APC than either of the other groupings. This indicates that APCs in Northern
and Western European member states are larger and denser than either of other regional
groupings.
This thesis adds to the literature on variations of cooperative development by
providing a quantitatively based snapshot of variation in cooperative development to
complement existing literature on historically determinant explanations for variation in
Chloupkova et al. (2003), Gijselinckx and Bussels (2014), Hagedorn (2014), Bijman et al.
(2012), and Lissowska (2012). The associations identified between region and cooperative
development indicators and the associations between average agricultural output and the
other cooperative development indicators pave the way for more research on associations
between cooperative development variables and region. Additionally, this thesis connects
the literature of Polanyi and his ideas on the socially embedded economy with
contemporary developments in cooperative agricultural participation. By placing Polanyi’s
ideas on the nature of economic and social transactions into a modern context, this thesis
attempts to link widespread use of cooperative organizations in the EU to his theories on
reciprocity, redistribution, and fictitious commodities.
Above all else, this thesis revealed that economic cooperation in the agricultural
sector looks different depending on national and regional context in the EU. The variations
46
identified between regional groupings in the areas of average members per APC and
average agricultural output signal not only that regional variations exist, but also that inter-
regional variations exist. The successful financial incentivization for F&V POs by the CAP
makes evident that expanding financially incentivized PO programs to other sectors could
be beneficial to increased cooperative participation. However, barriers to cooperative
participation in post-Soviet, post-Yugoslavic, and transition member states such as low
levels of trust, difficulties protecting farmers’ incomes, and the “propaganda of individual
success” outlined in Gijselinckx and Bussels (2014), Lissowska (2012), and Iliopoulos and
Valentinov (2012) could also stand in the way of further cooperative participation,
especially in CEECs.
National data on output per APC would be useful in future studies because the data
used in this study do not provide insight into the level of production per APC or the level
of production by all APCs in each member state. While the perspective of this study
focused on member states in the European Union, the same methodology could be used in
other international and global contexts by grouping nations together with similar historical
or socioeconomic legacies to examine levels of cooperative development and participation.
An analysis between countries in each region would be an interesting start for further
research. Additionally, larger numbers of countries per regional grouping would make it
easier for the researcher to come to definitive conclusions with more statistical relevance
in further studies. Using additional cooperative development indicators alongside those
identified and analyzed here would also be prudent, especially if different national or
regional contexts necessitated the inclusion of these indicators due to their situation.

47
APPENDIX
Table 8: Summary of Cooperative Development Variables by Country and Region
Region
Country
Name
Members
per APC
APC
Members
per Capita
APCs per
Capita
Average
Agricultural
Output1
NWE2 Austria 1412 1411.52 2.56 7054
NWE Belgium - - 2.70 8512
NWE Denmark 1633 817.64 0.50 11270
NWE Finland 4879 3154.17 0.65 4777
NWE France 358 1306.00 3.65 75318
NWE Germany 600 1759.19 2.93 56172
NWE Ireland 2689 4395.14 1.63 7267
NWE Luxembourg - - 10.35 430
NWE Netherlands 651 834.94 1.28 27379
NWE Sweden 5345 1684.95 0.32 6315
NWE United Kingdom 690 218.29 0.32 30524
CEEC3 Bulgaria 170 2099.52 12.32 4373
CEEC Croatia 18 251.56 14.37 2532
CEEC Cyprus 1780 2207.01 1.24 693
CEEC Czech Republic 1 4.98 5.21 4924
CEEC Estonia 97 152.01 1.57 907
CEEC Hungary 28 317.22 11.22 7755
CEEC Latvia - - 2.42 1305
CEEC Lithuania 32 432.09 13.47 2878
CEEC Malta 101 433.83 4.30 128
CEEC Poland 2637 930.55 0.35 23301
CEEC Romania - - 0.32 16312
CEEC Slovakia 9 104.51 11.035 2399
CEEC Slovenia 45 803.59 17.88 1179
SME4 Greece - - 4.88 10412
SME Italy 148 1417.19 9.58 55349
SME Portugal 13 91.35 6.98 6717
SME Spain 307 2551.65 8.32 43338 Source: EUROSTAT (2013-2016). Additional calculations by author.
1 Millions of euros, average of years 2012 – 2014 2 Northern and Western European 3 Central and Eastern European 4 Southern and Mediterranean European

48
REFERENCES
Almas, R., & Campbell, H. (2012). Reframing Policy Regimes and the Future Resilience
of Global Agriculture. Rethinking Agricultural Policy Regimes Research in Rural
Sociology and Development, 285-300.
Brusselaers, J., Poppe, K., and Azcarate, T.G. (2014). Do Policy Measures Impact the
Position and Performance of Farmers’ Cooperatives in the EU. Annals of Public
& Cooperative Economics, 85(4), 531-553.
Bijman, J., and Iliopoulos, K., (2014). Farmers’ Cooperatives in the EU: Policies,
Strategies, and Organization. Annals of Public and Cooperative Economics,
85(4), 497-508.
Bijman, J., Iliopoulos, C., Poppe, K. J., Gijselinckx, C., Hagedorn, K., Hanisch, M.,
Sangen, G. (2012). Support for Farmers' Cooperatives. 1-9. Wageningen UR.
Bollier, D. (2009). Why Karl Polanyi Still Matters. Retrieved February 27, 2017, from
http://www.onthecommons.org/why-karl-polanyi-still-matters
Center for Cooperatives. (2015). Cooperatives in the United States. Retrieved from:
http://www.uwcc.wisc.edu/whatisacoop/History/.
Chloupkova, J., Svendsen, G. L., & Svendsen, G. T. (2003). Building and destroying
social capital: The case of cooperative movements in Denmark and Poland.
Agriculture and Human Values, 20(3), 241-252.
Cocolina, C.Q. (2016). The Power of Cooperation: Key Figures 2015. Retrieved from
https://coopseurope.coop/resources/projects/power-cooperation-cooperatives-
europe-key-figures-2015.
COGECA. (2010). Agricultural Cooperatives in Europe: Main Issues and Trends.

49
Retrieved from: http://www.agro-alimentarias.coop/ficheros/doc/03020.pdf
COGECA. (2015). Development of Agricultural Cooperatives in the EU – 2014.
Retrieved from:
http://www.europarl.europa.eu/meetdocs/2014_2019/documents/agri/dv/copa-
cogecareport_/copa-cogecareport_en.pdf
David Grace and Associates. (2014). Measuring the Size and Scope of the Cooperative
Economy. United Nation’s Secretariat, Department of Economic and Social
Affairs, Division for Social Policy and Development.
Defoe, D. (1702). Essays upon several subjects, or, Effectual ways for advancing the
interest of the nation: wherein are plainly laid down the means by which the
subjects in general may be eased and enriched, the poor relieved, and trade
encreased in the most material branches of it. London: Printed and sold by the
Booksellers of London and Westminster.
De Master, K. (2012). Designing Dreams or Constructing Contradictions? European
Union Multifunctional Policies and the Polish Organic Farm Sector. Rural
Sociology, 77(1).
Dowd, D.F. (2012). Robert Owen. In Encyclopædia Britannica online. Retrieved from
https://www.britannica.c'om/biography/Robert-Owen.
European Commission. (2013). Overview of CAP Reform 2014-2020: An Agricultural
Policy Perspectives Brief. Retrieved from: http://ec.europa.eu/agriculture/cap-
post-2013_en
EUROSTAT. (2013-2016). Output of the agricultural industry - basic and producer
prices. Retrieved from:

50
http://ec.europa.eu/eurostat/tgm/table.do?tab=table&init=1&plugin=1&language=
en&pcode=tag00102
Fairbairn, B. (2004). History of Cooperatives. In Merrett, C. & Walzer, N. (Eds.).
Cooperatives and Local Development: Theory and Applications for the 21st
Century. 23-51. Armonk, New York: M.E. Sharpe.
Filip, B. (2012). Polanyi and Hayek on Freedom, the State, and Economics. International
Journal of Political Economy, 41(4), 69-87.
Gijselinckx, C., & Bussels, M. (2014). Farmers' Cooperatives in Europe: Social and
Historical Determinants of Cooperative Membership in Agriculture. Annals of
Public and Cooperative Economics, 85(4), 509-530.
Hagedorn, K. (2014). Post‐Socialist Farmers’ Cooperatives in Central and Eastern
Europe. Annals of Public and Cooperative Economics, 85(4), 555-577.
Hanisch M., Rommel J., and Müller, M. (2013). The cooperative yardstick revisited:
panel evidence from the European dairy sectors. Journal of Agricultural & Food
Industrial Organization. p. 151.
IBM Knowledge Center. (n.d.). Retrieved March 26, 2017, from
https://www.ibm.com/support/knowledgecenter/SSLVMB_22.0.0/com.ibm.spss.s
tatistics.help/spss/base/idh_xtab_statistics.htm
Iliopoulos, C., and V. Valentinov. (2012). Opportunism in Agricultural Cooperatives in
Greece. Outlook on Agriculture, 41(1): 15–19.
King, W., and Mercer, T. W. (1922). Dr. William King and the Co-operator, 1828-1830;
with introduction and notes by T.W. Mercer. XII-XXIII. Manchester: The Co-
operative Union.

51
Kumar, K. (1990). Utopian Thought and Communal Practice: Robert Owen and the
Owenite Communities. Theory and Society. 19(1). 1–35.
Lissowska, M. (2012). The deficit of cooperative attitudes and trust in post-transition
economies. Paper presented at the 16th Annual Conference of the International
Society for New Institutional Economics, California, June 14–16, 2012. [http://
papers.isnie.org/paper/626.html].
Loether, H. J., & McTavish, D. G. (1993). Descriptive and inferential statistics: an
introduction. Boston: Allyn and Bacon.
Maertens, E. (2008). Polanyi’s Double Movement: A Critical Reappraisal. Social
Thought and Research.
Massot, A., (2017). First pillar of the Common Agricultural Policy (CAP): II – Direct
payments to farmers. In Fact Sheets on the European Union – 2017. Retrieved
from:
http://www.europarl.europa.eu/atyourservice/en/displayFtu.html?ftuId=FTU_5.2.
5.html
Matthews, A. (2011). Post-2013 EU Common Agricultural Policy, Trade And
Development. ICTSD Programme on Agricultural Trade and Sustainable
Development.
Polanyi, K. (1945). Origins of our time: the great transformation. London: V. Gollancz.
Polanyi, K., Arensberg, C. M., & Pearson, H. W. (1957). Trade and market in the early
empires: economies in history and theory. Glencoe, IL: Free Press.

52
Potter, C., & Tilzey, M. (2007). Agricultural multifunctionality, environmental
sustainability and the WTO: Resistance or accommodation to the neoliberal
project for agriculture? Geoforum, 38(6), 1290-1303.
Ragonnaud, G. (2016a). First pillar of the CAP: I — Common organization of the
markets (CMO) in agricultural products. In Fact Sheets on the European Union –
2017. Retrieved from:
http://www.europarl.europa.eu/atyourservice/en/displayFtu.html?ftuId=FTU_5.2.
4.html
Ragonnaud, G. (2016b). Second pillar of the CAP: rural development policy. In Fact
Sheets on the European Union – 2017. Retrieved from:
http://www.europarl.europa.eu/atyourservice/en/displayFtu.html?ftuId=FTU_5.2.
6.html
Simkin, J. (1993). Bright Spark: Doctor and Father of Workers Cooperatives. E12. The
Guardian.
Van Huylenbroeck, G., Vandermeulen, V., Mettepenningen, E., & Verspecht, A. (2007).
Multifunctionality of Agriculture: A Review of Definitions, Evidence and
Instruments. Living Reviews in Landscape Research, 1, 6.
Williams, C., and Thompson, N. (Eds.). (2011). Robert Owen and his Legacy (1).
Cardiff, GB: University of Wales Press. Retrieved from
http://www.ebrary.com.umiss.idm.oclc.org.