
Agricultural land classification study - Walgett shire · Agricultural Land Classification Study -...
34
Agricultural Land Classification Study - Walgett Shire Hindle, J. P., Grosskopf, T. & Watson, C. R. July 2000
Transcript of Agricultural land classification study - Walgett shire · Agricultural Land Classification Study -...

Agricultural Land ClassificationStudy - Walgett Shire
Hindle, J. P., Grosskopf, T. & Watson, C. R.July 2000

ii
Agricultural Land Classification Study - Walgett Shire
Notes to Accompany Agricultural Land Classification Map
ContentsPREFACE.............................................................................................................................................................. 2
1. INTRODUCTION ....................................................................................................................................... 3
2. AN OVERVIEW OF CLASSIFYING AGRICULTURAL LAND.......................................................... 4
2.1 BACKGROUND ........................................................................................................................................... 42.2 DESCRIPTION OF CLASSES .......................................................................................................................... 42.3 LAND THAT NEED NOT BE EVALUATED FOR AGRICULTURE......................................................................... 62.4 ASSUMPTIONS FOR CLASSIFICATION PROCESS ............................................................................................ 62.5 THE ROLE OF CURRENT LAND USE IN AGRICULTURAL LAND CLASSIFICATION............................................. 7
3 AGRICULTURAL LAND CLASSIFICATION METHODOLOGY ..................................................... 7
3.1 LIMITATIONS OF WALGETT MAP SCALE ........................................................................................................ 73.2 COLLECTION OF BACKGROUND DATA AND INFORMATION .......................................................................... 73.3 AGRICULTURAL PRODUCTION IN WALGETT SHIRE RELATIVE TO SURROUNDING SHIRES............................. 93.4 THE LAND SUITABILITY ASSESSMENT PROCESS ........................................................................................ 123.5 CREATING THE MAP ................................................................................................................................. 14
4. AGRICULTURAL LAND CLASSIFICATION ..................................................................................... 16
4.1 THE EVALUATION OF RURAL LANDS IN WALGETT SHIRE.......................................................................... 164.2 DESCRIPTION OF THE AGRICULTURAL LAND CLASSIFICATION CLASSES .................................................... 19
REFERENCES.................................................................................................................................................... 24
APPENDICES ..................................................................................................................................................... 25
APPENDIX 1 - YIELD DATA FOR SELECTED CROPS............................................................................................. 25
Environmental Planning and ManagementNSW AgricultureLocked Bag 21ORANGE NSW 2800July 2000
1
ACKNOWLEDGMENTS.Funding for this project was provided through the National Land and Water Audit, aninitiative under the Natural Heritage Trust.
NSW Agriculture would like to thank the following officers from the Department of Land andWater Conservation for their valuable contribution to this study.
D. Barber, DLWC, DubboD. Campbell, DLWC, DubboK. J. Miller, DLWC, WalgettG.R. Sawtell, DLWC, Dubbo
The authors also wish to acknowledge the valuable contribution to this project made byseveral officers of NSW Agriculture, namely:
M. Worsley, Technical Assistant, OrangeH. Mavi, Agroclimatologist, OrangeR. Roger, Spatial Information Officer, OrangeA. Kennedy, Agricultural Environment Officer, Orange
AUTHORSHindle, John – Scientific Officer (Land Use), Berry. Principal author, responsible for thecreation of the agricultural land classification map and field work.Grosskopf, Tom - Agricultural Environment Officer, Orange. Contributing author, technicaleditor and field verification of mapWatson, Craig - Agricultural Environment Officer, Gunnedah. Contributing author and fieldverification of map.
NOTE TO MAP USERS
The Walgett Shire Agricultural Land Classification map was produced for use ata scale of 1:100 000 it must not be used at a more detailed scale (for example1:50 000).
The map should be interpreted in conjunction with the information containedwithin this report and Chapter 9 of the Rural Lands Evaluation Manual(Department of Planning, 1988)

2
AGRICULTURAL LAND CLASSIFICATION STUDY
WALGETT SHIRE
TECHNICAL REPORT
PREFACE
The Walgett Agricultural Land Classification (ALC) Project was carried out with theassistance of the National Land and Water Audit (NLWA), a program of the Natural HeritageTrust. The Audit, initiated in 1998, had as one of its main themes, Australia’s ‘VegetationCover, Condition and Use’. New South Wales managed the implementation project for thistheme; ‘Native Vegetation mapping to support vegetation management in the low-rainfallcropping areas of Walgett Shire, NSW’.
NSW Agriculture’s contribution to the implementation project was the preparation of anAgricultural Land Classification map for Walgett Shire. The Department’sstate-wide program of ALC mapping was considered by the NLWA project management teamas an expedient method of building socio-economic parameters into native vegetationmanagement. Other elements of the implementation project included protocols for upgradingthe Murray Darling Basin woody-non woody vegetation mapping, improved vegetationmapping for Walgett and work on 1750 native vegetation data base modelling.
The NSW Agriculture component of the implementation project was managed by an internalteam that involved input from agronomy, land classification, spatial information and policyspecialists. The Walgett project has enabled the Department to further develop its agriculturalland classification system through the use of more refined data sets. This outcome will haveapplication to ALC mapping elsewhere in NSW. The assistance of the National Land andWater Audit in pursing this project is acknowledged.

3
1. INTRODUCTION
The Walgett Agricultural Land Classification Report applies to the Walgett LocalGovernment Area. This report is produced to allow interpretation of the Walgett AgriculturalLand Classification Map produced by Mr John Hindle, Scientific Officer (Land Use) NSWAgriculture in October 1999.
The map was compiled by NSW Agriculture to assist with the preparation of strategic landuse plans. It is inappropriate to use this map for property development at the farm level.The map was produced at a scale of 1: 100 000 and must not be used at a more detailed scale(for example 1:50 000). The map provides a generalised interpretation of agricultural landsuitability based on the landform, soil, vegetation, climatic, economic and socialcharacteristics of the area. These characteristics were compared to the agronomic needs ofagricultural enterprises typical for the area and lands ranked in accordance to their suitabilityfor sustained agricultural production. In general terms, the greater the range of crops able to beproduced economically, the higher the yields and the more reliable the production of a localitythe higher the land class (class 1 being the best land class).
The agricultural land classification scheme used in this report is based on the system describedin Chapter 9 of the Rural Land Evaluation Manual (Department of Planning 1988). Howeverthe land class definitions used in the manual are not entirely applicable to land uses in WalgettShire, or for many western areas of the NSW wheat belt. Consequently the standarddefinitions have been modified in this report to reflect land use in these areas. The intent andmuch of the wording of the standard definitions is still reflected in the modified ones used forWalgett Shire and they serve the same purpose of prioritising land on the basis of itssuitability for agriculture.
Because the land class definitions are not the same as those appearing in the Rural LandEvaluation Manual (RLEM) (Department of Planning, 1988), drawing direct parallelsbetween this Walgett mapping study and those areas mapped under the standard system,should only be done with care.Despite the modifications to the land class definitions theagricultural land classification scheme is still based on a state-wide system, therefore it ispossible for an area to be without some classes of agricultural lands. In the case of WalgettShire there are no class 1 lands and class 2 lands are restricted to areas where irrigation ispresent and rainfall reliability is greatest. The delineation between class 3 and class 4agricultural lands are subtle and rely as much on climatic variables as edaphic and landscapecharacteristics. Areas of class 5 lands have extreme limitations to agricultural production andare limited in extent.
The agricultural land classification classes have been delineated using field observations,topographic maps, an analysis of the relative yield and reliability of production for cropscommon to the north west of NSW, satellite imagery, soils data and vegetation information.
As detailed in Table 1, the study shows class 2 making up approximately 8 % of the studyarea. Class 3 lands are the dominant class in the Central Division, incorporating the majorityof the dryland cropping areas, and making up some 33 % of Walgett Shire. The WesternDivision is characterised by a predominance of class 4 lands, which comprise in total some56 % of the Shire. Class 5 lands are generally restricted to areas of very dense vegetation or

4
areas of particularly poor soils, they comprise only 1.2 % of the area.
Table 1: Walgett Shire agricultural land classification classes:area and percentage of the Shire
Agricultural Land Class Area (ha) % Shire
Class 2 176,000 7.9Class 3 747,000 33.5Class 4 1,260,000 56.4Class 5 27,600 1.2Other 22,722 1.0Total 2,233,322 100
2. AN OVERVIEW OF CLASSIFYING AGRICULTURAL LAND
2.1 BackgroundAgricultural land classification is based on evaluating a limited set of biophysical, social andeconomic constraints that influence the use of land for agriculture. In general terms the fewerthe constraints that are placed on the land, the greater its value for agriculture. The evaluationprocess enables the preparation of agricultural land classification maps that can be used forstrategic planning including regional and local environmental planning instruments, regionaleconomic development and natural resource management.
It is important to note that land in any given class will have a similar degree of limitation butnot necessarily the same type of limitation. For example, an area may be placed into class 4because of one significant limitation, such as high soil erosion hazard, or several minorlimitations such as slope, stoniness, soil depth and distance to markets / handling facilities.
The evaluation of physical, social and economic constraints for agricultural productionrequires expertise in natural resource survey techniques as well as knowledge of sustainableagricultural systems. Officers from NSW Agriculture who undertake agricultural landclassification have these skills. It must be recognised that the process of agricultural landclassification relies upon interpretation of information by an expert and that the map marks apoint in time reflecting current understanding of agricultural systems, infrastructure, andmarket and resource conditions.
The classification of land as suitable for a particular agricultural activity, for examplecultivation, does not mean that NSW Agriculture recommends that these lands shouldbe developed for this use, only that they are suitable for a particular use or enterprise.Other considerations (for example, nature conservation) may prevail making the landunsuitable for agricultural development.
2.2 Description of classesAgricultural land classification maps place land into one of five classes according to itssuitability for a wide range of agricultural activities. As mentioned in the introduction,Walgett Shire has been mapped using a system closely based on the Agricultural Land

5
Classification system as described in the RLEM. However, the standard definitions forClasses 2, 3 and 4 have been modified for use in Walgett Shire. The modifications differ fromthe standard definitions by removing references to crop-pasture rotations, and to the suitabilityof land for pasture improvement. In Walgett Shire, and in much of the western wheat belt,cropping sustainability is based much less on crop-pasture rotations and more on croppingfrequency, fallow management, reduced tillage, stubble retention and crop rotation. Therevised definitions refer to this and the distinction between Classes 2, 3 and 4 reflect thedegree to which these management approaches are necessary to achieve sustainable cropping.
As much of the shire is, as far as slope and soil type is concerned, arable, the reliance on thiscriteria to distinguish between classes is reduced in the revised definitions. More emphasis isplaced, particularly with regard to Class 4 land, on the influences of climate variability (andreduced effective rainfall) and distance to services and infrastructure.
The definitions for land classes used for the Walgett Shire study are listed below.
Class 1: Arable land suitable for intensive cropping where constraints to sustained highlevels of agricultural production are minor or absent.
Class 2: Land suited for regular cultivation and suitable for a range of crops forincorporation into rotations. Land is also highly suited to grazing. It has amoderate to high overall suitability for agriculture with some environmentalconstraints which reduce overall level of production.
Class 3: Land suited to cropping but with increased reliance on conservation tillage andfallowing to reduce production risk. Good grazing land. Soil and/or climaticfactors limit long term production to moderate levels.
Class 4: Land best suited to grazing. Cultivation of crops possible on capable soils, butassociated with high production risk requiring fallow management and‘opportunity cropping’1. Production may be seasonally high however overallproduction level is low as a result of major environmental constraints.
Class 5: Land unsuitable for agriculture or at best suited only to light grazing.Agricultural production is very low or zero as a result of severe constraints,including economic factors which preclude land improvement.
For the purposes of comparison the standard RLEM definitions are listed below.
Class 1: Arable land suitable for intensive cropping where constraints to sustained highlevels of agricultural production are minor or absent.
Class 2: Arable land suitable for regular cultivation for crops, but not suited tocontinuous cultivation. . It has a moderate to high suitability for agriculture but
1 Cropping requiring careful management and particularly flexible fallow length to ensure adequate soil moisturefor crop success. Crop frequency often less than 1 crop per year.

6
edaphic or environmental constraints reduce the overall level of productionand may limit cropping to a rotation with sown pastures.
Class 3: Grazing land or land well suited to pasture improvement. It may be cultivatedor cropped in rotation with sown pasture. The overall production level ismoderate because of soil or environmental constraints.
Class 4: Land suitable for grazing but not for cultivation. Agriculture is based on nativepastures or improved pastures established using minimum tillage techniques.Production may be seasonally high but overall production level is low as aresult of major environmental constraints.
Class 5: Land unsuitable for agriculture or at best suited only to light grazingAgricultural production is very low or zero as a result of severe constraints,including economic factors that preclude land improvement.
2.3 Land that need not be evaluated for agricultureCertain lands can be clearly excluded from agricultural land classification assessment due totheir tenure or land use. These types of lands include national parks, state forests, mines,coastal dunes and areas zoned urban or village. In Walgett the areas that have been excludedfrom the mapping are: state forests, urban areas and nature reserves.
A distinctive feature of the agricultural land classification map is the identification ofTravelling Stock Routes (TSRs) as class 4 lands. It is a requirement of the RLEM mappingmethod that these areas of Crown Land are mapped. TSRs are a valuable agriculturalresource, particularly when their grasslands are utilised by travelling livestock or grazed bylivestock to supplement feed shortages during dry periods or droughts. These lands are notavailable for the production of crops and are best classified as class 4.
2.4 Assumptions for classification processIn classifying agricultural land assumptions are made about agricultural land use. Theseassumptions, which are specified in the RLEM, are:• appropriately high management level and technology is used;• land with constraints that have been modified or removed should be assessed on its present
status (eg irrigation areas, flood mitigation areas, cleared land);• land with constraints that could be economically removed should be assessed as if they
have been removed eg low chemical fertility, presence of stones;• legislative constraints which limit areas or restrict production may be ignored if change is
likely (or vice versa);• economic inputs based on realistic farm management should be assumed;• land suitable for intensive uses such as cropping is also suitable for less intensive uses such
as grazing forestry, recreation etc;• assessment reflects long-term capacity for sustained agricultural productivity;• assessment may need to be reviewed if technological developments permanently change
the productivity of the land.

7
2.5 The role of current land use in agricultural land classification Given the above assumptions, existing land use may not always be a good indicator ofappropriate land use and hence land class. The system of land classification is aimed atassessing physical, social and economic attributes of land rather than its current use. Never theless it must be noted that current land use often reflects land suitability. Where land is usedbeyond its physical capability land degradation is often evident.
3 AGRICULTURAL LAND CLASSIFICATION METHODOLOGY
3.1 Limitations of Walgett Map Scale When using agricultural land classification maps it is important to understand the limitationsof the scale at which the maps were produced. In addition it is essential that the map only beused within the limitations of the scale of mapping reliability. Map scale is the relationship between a unit of length on a map and the actual length itrepresents on the ground. This scale is usually expressed as a ratio. A scale of 1:100 000means that one unit on a map corresponds to 100 000 units on the ground. For example, 1 cmon the map corresponds to 100 000 cm or 1 km on the ground. One square centimetrecorresponds to one square kilometre; one square millimetre represents one hectare. Theminimum area that can be legibly delineated on a map is usually about 40 square millimetres(a circle of about 7 mm in diameter). At a scale of 1:100,000 this represents an area on theground of approximately 40 hectares. The logical conclusion is that features of an area ofless than 40 hectares will not be represented on this map. Biophysical features usually have transitional zones between unique groups or classes. In thefield, there are few instances where a sharp boundary line divides classes. In thesecircumstances, the boundary line represents the best fit position or a half way point betweenthe two classes. The accuracy for locating the class boundary lines is expressed as aconfidence limit. For a 1:100 000 map this limit is ± 1.5 mm representing a confidence limitof ± 150 m in the field (Riddler 1987). As the boundary precision is a function of the levelof detail recorded and observed in the field, the scale of agricultural land classificationmaps should not be enlarged. In addition, while the final maps show areas as being divided into discrete classes, in practicenature usually presents a mix of geology, terrain and soils, and sudden changes are unusual.Any map unit will include areas whose characteristics differ from those of the dominant class.For an area less than 40 mm2 (7 mm diameter) on the map, these inclusion are too small to belegibly shown at the scale of mapping but they may occupy up to 40% of the unit. This isimportant to note, as errors in interpretation will occur if the map is enlarged beyond itsoriginal scale because these inclusions will not be shown. It is particularly easy and thereforetempting to enlarge maps when they are in digital form, however this should not be done.
3.2 Collection of background data and information Four key sources of spatial background data were used for this survey—topographic maps,vegetation surveys, soil surveys, and satellite imagery. Additional information was alsoobtained by interviewing professional officers. These are discussed in the followingsubsections.

8
3.2.1 Topographic Maps The topographic maps covering Walgett Shire were obtained from the Land InformationCentre. The Eastern Division is covered mostly by 1:50 000 maps and Western Division, by1:100 000 maps. These maps gave base-line information in relation to landscape features andwatercourses as well as cultural features such as roads, towns and railways. 3.2.2 Vegetation Surveys The distribution of vegetation across the Shire was mapped as part of the Murray DarlingBasin M305 Basincare Project in the period 1992–1995 and was based on satellite imageryfrom 1991 and earlier. That project generated two products: a map differentiating woodyfrom non-woody vegetation, and a map showing structural floristics (Ritman, 1995). TheM305 structural floristics maps are presented at 1:100,000 scale, and the smallest area theymap is 50 hectares. This project used only the structural floristics maps. 3.2.3 Soil Survey Information about soils in the Shire was obtained from several sources. Data on soils in theWestern Division were obtained from “Soils of the Northern Floodplains Regional PlanningArea” (D.P. King, 1998). Data on the soils of lake beds in the Western Division from the“Land Systems Map - Angledool - Moree” (Walker and Boyd, 1972). For the Eastern Divisionthe report “Field guide to soils of the Western Barwon Region Floodplains” (L. Keady and R.Banks, 1998) was used 3.2.4 Satellite Imagery For this project, a Landsat Thematic Mapper (TM) multispectral satellite image, recorded inDecember 1997, was used. The digital data was radiometrically and geometrically correctedto level 4 and, subsequently, georeferenced to 30 m accuracy. A number of benefits accrue from the use of satellite imagery in natural resource surveys suchas agricultural land classification. These benefits include:
• satellite imagery provides access to data from the electromagnetic spectrum outsidethe visible range (which helps to characterise vegetation);
• imagery can be selected from a range of sources to ensure that spectral and spatialresolution and band selection are appropriate for the project;
• ability to access repeat satellite coverage to accommodate land cover changes overtime; and,
• ability to classify areas that are inaccessible from the ground. 3.2.5 Information from Professional Officers In addition to these published resources, interviews were held with professional officers (bothfrom NSW Agriculture and other agencies) with experience in soil surveying, agricultural landuse assessment, agronomy, horticulture and farm management practices. Information oncurrent agricultural practices was also sought from a number of landholders in the Shire. Thekey themes covered in these discussions included:
• existing and potential agricultural and livestock practices, their role and limitationsin view of the present state of technology for each enterprise;
• inter-relationships, opportunities and limitations for relevant physical, social andeconomic attributes used by particular, pasture, grain cropping and livestockenterprises;

9
• characterisation of agricultural land suitability classes for the Walgett area in termsof resource condition and agricultural system needs. Particular attention was paid tosoil erosion hazards, climatic factors (rainfall) and current land use practices.
3.2.6 Climate data Climatic data for Walgett Shire can be organised in a number of different ways. For this studythe annual average rainfall data for the thirty year period 1961 to 1990 has been used. Average annual rainfall has been employed, as it is a figure commonly used by farmers in thelocality. A thirty year period has been chosen as it is considered long enough to remove theinfluence of extreme events (wet or dry) in single years. It is important to note that had a different range of years been used the values for averageannual rainfall would be different. By way of illustration average annual rainfall in Walgettcan be described in a number of ways each with a different average rainfall value, see table 2. What becomes apparent from this analysis is that it is not the actual rainfall values that areimportant but the relative values and the reliability of the rainfall. Table 2
Walgett Post Office Average Annual Rainfall
Since 1879 Last 50 years 1931 – 1960 1961 – 1990 455 mm 497 mm 482 mm 487 mm
Source: CSIRO & Bureau of Meteorology, 1998
3.3 Agricultural production in Walgett Shire relative to surroundingshires
3.3.1 Agricultural production in Walgett Shire Dryland farming and livestock production, primarily beef, wool and sheep meat, dominatesagriculture in Walgett Shire. In terms of dryland farming, wheat predominates the area ofproduction. An average area of about 130,000 hectares of wheat was grown each year between1983 and 1997 (ABS 1999). Wheat areas in 1998 and 1999 are estimated at over 200,000 ha,reflecting the advances in crop production technology for western cropping areas. Grainlegume crops such as chickpeas are increasingly being incorporated into rotations. 1999 areaestimates for chickpeas are in excess of 20,000 ha. Total summer crop areas are considerablysmaller than winter crop areas. Grain sorghum is the main dryland summer crop grown. (ABS1999). Some irrigated agriculture is present in Walgett Shire. While suitable for a range ofcommodities irrigated agriculture focuses on cotton production. The areas dedicated toirrigated cotton has been growing steadily and in 1997 occupied some 14,300 hectares (ABS1999).
3.3.2 The relative value of agricultural production The agricultural land classification system applied by NSW Agriculture is a state-widesystem. Therefore, before land classes can be applied to specific areas a sense of the relative

10
agricultural merit of the study area is required. In order to assess the relative merits twoproduction indices are employed: relative yield and production variability (Singh, Dhingra andDhillon, unpublished). Relative yield is a measure of the productive potential of an area when compared to theaverage level of production for a region or state. In order to assess the relative yield forWalgett Shire the production figures for the Shires which fall within a 200 km radius of thetown of Walgett were compared, see map 3 for location of shires. The figures were comparedto give a relative yield figure, calculated in the following manner: • relative yield = average yield for the shire / average yield for the region x 100 Using this formula production values were broken into three classes: high, medium and low. More than 95% of the relative yield values for all the crops considered, range between 50 and150% and their major concentration is between 75 and 125%. The values in this range havebeen defined as 'Medium Relative Yield'. Values above 125% are defined as 'High RelativeYield' and values below 75 defined as 'Low Relative Yield. Production Variability, or the coefficient of variation in production, is a measure of thereliability of production. Coefficients of variation, up to 30% are considered to represent acomparatively stable or reliable level of production between years. High coefficients ofvariation, those greater than 30%, are considered unstable. Stability in production isimportant as it reflects the level of risk associated with production in an area. The greater thecoefficient of variation the less reliable crop production the greater the risk of economic cropfailure. The coefficient of variation is calculated in the following way: • Coefficient of variation = standard deviation of region yield / shire yield x 100
The results of the analysis of shires included within a 200km radius of Walgett aresummarised in Table 3, details for each crop and each local government area are given inAppendix 1. From the information provided in Table 3 it is apparent that with the exceptionof irrigated cotton agricultural production in Walgett is low for all major commodities andwhere production levels are medium, barley, oats and chickpeas, production is unstable. Based on this analysis it is apparent that as a general guide, crop production in Walgett Shireis less reliable and more variable than the average of it and its surrounding shires. The notableexception to this rule is where irrigation is available. The high productivity, high stabilityresult for irrigated cotton demonstrates the productive potential of the area but also highlightsthe dramatic impact of climatic variation on agricultural systems in the area.
As a result of this analysis class 1 agricultural lands have been excluded from Walgett, class 2lands are limited to areas under irrigation or lands in the east of the Shire where rainfall ishighest and reliability is greatest. Class 3 lands are the dominant land class representing muchof the dryland farming areas. There is no doubt that these areas are highly capable, in terms oflandscape and soil conditions, of crop production but the harsh and uncertain climaticconditions that prevail in this area exclude these lands from class 2.

11
Table 3 Crop Productivity of Shires Relative to the Regional Average
Stable high production Unstable high production Stable medium production Unstable medium production Low productionShire Relative yield >125 %
CV up to 30%Relative yield > 125 %
CV > 30%Relative yield 75 - 125 %
CV up to 30 %Relative yield 75 - 125 %
CV > 30%Relative yield < 75 %
Barraba Irrigated Cotton Wheat Barley SorghumBingara Wheat Barley Irrigated Cotton SorghumBogan Barley Wheat Chickpeas Sorghum
Brewarrina Irrigated Cotton Wheat Barley Sorghum
Coonamble Irrigated Cotton Wheat Barley Chickpeas Sorghum
Coonabarabran
Sorghum Dryland Cotton Wheat Barley Chickpeas
Gilgandra Barley Wheat Chickpeas Sorghum
Gunnedah Wheat Sorghum Irrigated Cotton Chickpeas
Moree Chickpeas Sorghum Irrigated Cotton Wheat Barley Dryland Cotton
Narrabri Chickpeas Sorghum Irrigated Cotton Wheat BarleyDryland Cotton
Walgett Irrigated Cotton Chickpeas Wheat Triticale SorghumDryland Cotton, Barley
Warren Sorghum Irrigated Cotton Wheat Barley Chickpeas DrylandCotton

12
3.4 The land suitability assessment processFollowing the establishment of the relative value of agriculture in Walgett Shire, classificationof the lands within the Shire was undertaken. This evaluation of the physical, social andeconomic resources of the Shire was carried out using established principles as set out for landevaluation/suitability surveys (Dent and Young, 1981). The land suitability assessmentprocess involves three successive stages.
1. identification of the land’s characteristics,2. assessment of natural resource qualities for sustainable agricultural production, and,3. the evaluation of rural lands in terms of suitability for agricultural enterprises.
These processes are based on interpretation strategies such as location and association,temporal change and convergence of evidence (Hindle,1986).
Stage 1The first stage involved identification, analysis and interpretation of land characteristics. Afield reconnaissance survey was undertaken during February 1999 to examine the followingnatural resource characteristics: landform, drainage patterns and soils as well as the presenceof grasslands and timber cover. These characteristics were recorded on topographic maps.
Existing roads and tracks were used to systematically traverse the Shire, particularlyagricultural lands adjacent major rivers and creeks. The following areas were visited duringthe field trip, Walgett, Cumborah, Narran River, Angledool, Lightning Ridge, Cryon, BurrenJunction, Pilliga, Come-by-Chance, Collarenebri, Mogil Mogil, Merrywinebone, and Carinda.See Map 1 for location of these areas and roads travelled in the Walgett Shire.
Map 1 Location of areas and roads travelled in the Walgett Shire.

13
The primary factors used to assess soil quality were slope, soil type, soil fertility, vegetationcover and current land use practices. The assessment was based, in the main, on theinformation sources identified in section 3.2
The distribution of vegetation in the Eastern and Western Divisions was obtained from theM305 structural floristics map mentioned in section 3.2.2.
The spatial distribution of landform features (topography, drainage patterns and erosion) wasobtained by observing pattern and texture on the Landsat image, supplemented by theinformation on the topographic maps.
Stage 2The second stage assessed the capability of the natural resources to sustain agriculturalproduction.
In this process, consideration was given to the productive potential of the land resource, aswell as limitations to use. Deliberately conservative estimates of resource capability wereemployed to avoid land degradation through soil structural decline, dryland salinity and windand water erosion as well as to ensure the protection of water quality.
Stage 3The final stage in the land suitability assessment process was the evaluation of the rurallandscape for its suitability to support sustainable agricultural systems. The basis of thisevaluation process is the matching of the natural resource qualities to the needs of a range ofsustainable agricultural systems. During the evaluation process the RLEM guidelines wereused to establish relationships between physical, social and economic attributes observed inthe field, natural resource qualities and suitability for agricultural enterprises.
In undertaking the evaluation for Walgett Shire it became apparent that the attributes listed inTable 4 were critical in determining agricultural land suitability classes
Table 4 Key attributes in determining agricultural land suitability classes
Physical attributes Social and economic attributesLandformVegetationSoilsPotential for land degradationClimate (effective rainfall)Current land use
Skilled labourRoad infrastructure and conditionDistance to markets, handling facilitiesAccess to capital
In August 1999 further field work was undertaken to check the validity and accuracy of themap in terms of its evaluation of the rural landscape for sustainable agricultural production. The field work concentrated on areas immediately to the south and west of Walgett, the CryonPlain, Lightning Ridge and Angledool. The field work confirmed the importance of climateas a limiting factor for agricultural production and the quality of soil resources.
14
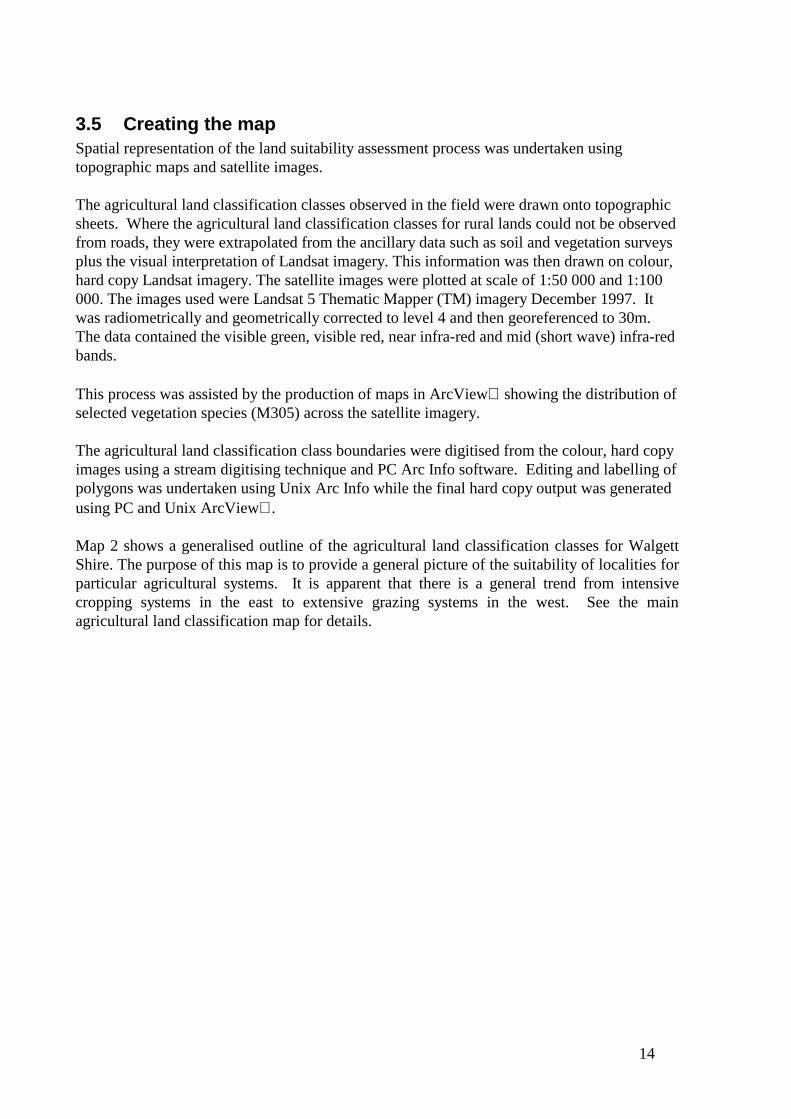
3.5 Creating the mapSpatial representation of the land suitability assessment process was undertaken usingtopographic maps and satellite images.
The agricultural land classification classes observed in the field were drawn onto topographicsheets. Where the agricultural land classification classes for rural lands could not be observedfrom roads, they were extrapolated from the ancillary data such as soil and vegetation surveysplus the visual interpretation of Landsat imagery. This information was then drawn on colour,hard copy Landsat imagery. The satellite images were plotted at scale of 1:50 000 and 1:100000. The images used were Landsat 5 Thematic Mapper (TM) imagery December 1997. Itwas radiometrically and geometrically corrected to level 4 and then georeferenced to 30m.The data contained the visible green, visible red, near infra-red and mid (short wave) infra-redbands.
This process was assisted by the production of maps in ArcView showing the distribution ofselected vegetation species (M305) across the satellite imagery.
The agricultural land classification class boundaries were digitised from the colour, hard copyimages using a stream digitising technique and PC Arc Info software. Editing and labelling ofpolygons was undertaken using Unix Arc Info while the final hard copy output was generatedusing PC and Unix ArcView .
Map 2 shows a generalised outline of the agricultural land classification classes for WalgettShire. The purpose of this map is to provide a general picture of the suitability of localities forparticular agricultural systems. It is apparent that there is a general trend from intensivecropping systems in the east to extensive grazing systems in the west. See the mainagricultural land classification map for details.

15
Agricultural Land ClassificationClass 2Class 3Class 4Class 5
Barwon River
0 25 50 75 100 Kilometers
Map 2 Walgett Shire - Agricultural Land Classification (Simplified)
N
15
16
4. AGRICULTURAL LAND CLASSIFICATION
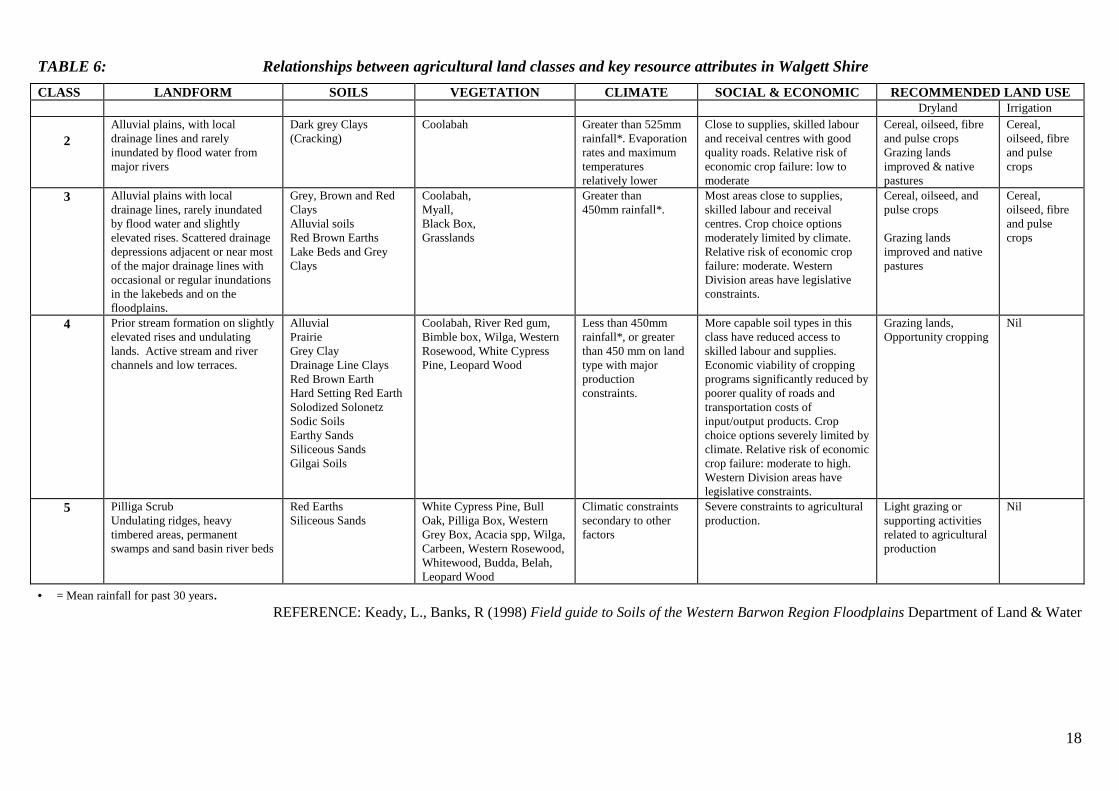
4.1 The evaluation of rural lands in Walgett ShireThe evaluation of rural lands is essentially a matching of the inherent physical, social andeconomic attributes of the rural landscape against the needs of sustainable agriculturalsystems. These relationships have been summarised in the following tables. Table 5illustrates the relationship between the agricultural land classification classes and potentialagricultural systems, while Table 6 shows the relationship between agricultural landclassification classes and land form, soils, vegetation, climate, land use as well as social andeconomic attributes.

17
Table 5: Guide to agricultural land based on land uses for Walgett Shire -SUITABILITY CLASSES LAND USES
Class 2. DESCRIPTION Field Crops Grazing / PastureSummer crops1 Winter crops1 Improved Unimproved
Irrigated Rainfed Non-continous Irrigated Rainfed
2Land suited for regular cultivation and suitablefor a range of crops for incorporation intorotations. Land is also highly suited to grazing.It has a moderate to high overall suitability foragriculture with some environmental constraintswhich reduce overall level of production
✩ ★ ★ ✩ ★ ★
3Land suited to cropping but with increasedreliance on conservation tillage and fallowing toreduce production risk. Good grazing land. Soiland/or climatic factors limit long termproduction to moderate levels.
● ✩ ✩ ● ✩ ★
4
Land best suited to grazing. Cultivation of cropspossible on capable soils, but associated withhigh production risk requiring fallowmanagement and ‘opportunity cropping.Production may be seasonally high howeveroverall production level is low as a result ofmajor environmental constraints.
❍ ❍ ❍ ❍ ● ✩
5 Land unsuitable for agriculture or suited only tolight grazing. Agricultural production is verylow or zero as a result of severe constraints,including economic factors which preclude landimprovement.
❍ ❍ ❍ ❍ ❍ ●
★ Class having requirements in excess of those needed for sustained production from the land use✩ Class having the minimum requirements for sustained production from the land use● Class may be suited to the land use depending on the nature of the limiting factors to crop production❍ Class not suited to land use because of limiting factors to cultivation and/or productionNotes:1. The ability to cultivate is a pre-requisite for cropping in this table. In Walgett Shire the establishment of opportunity crops on class 4 lands using minimum tillage techniques is not represented.
18
TABLE 6: Relationships between agricultural land classes and key resource attributes in Walgett ShireCLASS LANDFORM SOILS VEGETATION CLIMATE SOCIAL & ECONOMIC RECOMMENDED LAND USE
Dryland Irrigation
2Alluvial plains, with localdrainage lines and rarelyinundated by flood water frommajor rivers
Dark grey Clays(Cracking)
Coolabah Greater than 525mmrainfall*. Evaporationrates and maximumtemperaturesrelatively lower
Close to supplies, skilled labourand receival centres with goodquality roads. Relative risk ofeconomic crop failure: low tomoderate
Cereal, oilseed, fibreand pulse cropsGrazing landsimproved & nativepastures
Cereal,oilseed, fibreand pulsecrops
3 Alluvial plains with localdrainage lines, rarely inundatedby flood water and slightlyelevated rises. Scattered drainagedepressions adjacent or near mostof the major drainage lines withoccasional or regular inundationsin the lakebeds and on thefloodplains.
Grey, Brown and RedClaysAlluvial soilsRed Brown EarthsLake Beds and GreyClays
Coolabah,Myall,Black Box,Grasslands
Greater than450mm rainfall*.
Most areas close to supplies,skilled labour and receivalcentres. Crop choice optionsmoderately limited by climate.Relative risk of economic cropfailure: moderate. WesternDivision areas have legislativeconstraints.
Cereal, oilseed, andpulse crops
Grazing landsimproved and nativepastures
Cereal,oilseed, fibreand pulsecrops
4 Prior stream formation on slightlyelevated rises and undulatinglands. Active stream and riverchannels and low terraces.
AlluvialPrairieGrey ClayDrainage Line ClaysRed Brown EarthHard Setting Red EarthSolodized SolonetzSodic SoilsEarthy SandsSiliceous SandsGilgai Soils
Coolabah, River Red gum,Bimble box, Wilga, WesternRosewood, White CypressPine, Leopard Wood
Less than 450mmrainfall*, or greaterthan 450 mm on landtype with majorproductionconstraints.
More capable soil types in thisclass have reduced access toskilled labour and supplies.Economic viability of croppingprograms significantly reduced bypoorer quality of roads andtransportation costs ofinput/output products. Cropchoice options severely limited byclimate. Relative risk of economiccrop failure: moderate to high.Western Division areas havelegislative constraints.
Grazing lands,Opportunity cropping
Nil
5 Pilliga ScrubUndulating ridges, heavytimbered areas, permanentswamps and sand basin river beds
Red EarthsSiliceous Sands
White Cypress Pine, BullOak, Pilliga Box, WesternGrey Box, Acacia spp, Wilga,Carbeen, Western Rosewood,Whitewood, Budda, Belah,Leopard Wood
Climatic constraintssecondary to otherfactors
Severe constraints to agriculturalproduction.
Light grazing orsupporting activitiesrelated to agriculturalproduction
Nil
• = Mean rainfall for past 30 years.REFERENCE: Keady, L., Banks, R (1998) Field guide to Soils of the Western Barwon Region Floodplains Department of Land & Water

19
4.2 Description of the agricultural land classification classesFollowing is a brief description of the physical (landform, soil and climatic) social andeconomic attributes for agricultural enterprises within each agricultural land class as mappedfor the Walgett Shire. For detailed descriptions of the soils in the Walgett Shire, refer to D.P.King, 1998, Keady and Banks, 1998 and Walker and Boyd, 1972.
Class 1There are no class 1 agricultural lands found in Walgett Shire.
Class 2This class includes rural lands suitable for the production of a wide range of broadacre (cereal,oilseed, fibres and pulse) crops, under irrigated or dryland conditions. Class 2 lands are foundin the areas of greatest rainfall (greater than 525* mm/annum) and rainfall reliability, that is lands in the east of the Shire. Irrigation areas suitable for the production of summer andwinter crops are also class 2 regardless of rainfall.
The land form element within this class has only local drainage lines and are only inundatedfor long periods in major flood events.
In dryland areas soils in this class include only dark grey Clays (Vertosols). These soils havea uniform colour and texture (clay profile) with self-mulching characteristics at the surfaceand represent the most productive soil type found in the shire. Seasonal cracking featuresallow the summer rainfall to enter the subsoil. These soils have few limitations for thecultivation of dryland, irrigated, summer and winter crops. The influence of these limitationscan be reduced when sound agricultural management practices are used in sustainable farmingsystems. However, in intensive cropping rotations, over cultivation of potentially sodic anddispersive topsoils can break down the soil structure and create self-sealing characteristics. These features mainly apply to irrigation areas with reductions in soil permeability, impairedgermination and plant growth.
Class 2 land includes Coolabah (Eucalyptus coolabah ) vegetation communities which areassociated with the dark grey Clays.
Minimum tillage combined with stubble retention will assist in maintaining soil moisture, soilfertility, soil structure and adequate grain yields. These techniques can be used in conjunctionwith long fallows where summer and/or winter rainfall is stored in the soil profile. Sustainablefarming programs should be flexible and based on a range of crops. Oilseed, fibre and pulsecrops (grain legumes) should be included in rotations to reduce the instances of diseases, andadd nitrogen to the soil for use by following crops.
Class 2 includes irrigated areas suitable for production of summer crops, particularly on theDark Grey, Cracking Clays. In the western section of the Central Division portion of theShire, the light Brown Alluvial Soils used for the production of irrigated cotton have beendown graded to class 3 lands, due to the lower soil fertility and lower water holding capacities.
Heavy pesticide use has the potential to limit the suitability of land for agriculture throughaccumulation of residues. If soil pesticide residues become too high, it will restrict use of theland and may result in down-grading of the land class.
20
The social and economic limitations do not represent a limiting factor to the adoption ofagricultural systems.
The presence of few biophysical limitations for the cultivation of broadacre crops provides amoderate to high suitability for sustained agricultural enterprises within this class. Productivity potential is high to very high for a wide range of irrigated and dryland crops.
Class 3Class 3 is the broadest class in the system, with the land being suitable for a wide range ofagricultural enterprises and management practices. These include the potential cultivation ofdryland and irrigated broadacre crops. The overall level of productivity is moderate. Class 3land has lower agricultural suitability rating due to the presence of physical social andeconomic limitations on moderate agricultural enterprises. This may be expressed as limitingthe range of suitable broadacre crops as well as crop yields compared to class 2 land.
Class 3 land occurs on the Cryon Plain, in the Collarenebri, Rowena Burren, Junction and Walgett areas, west of the Barwon River on clay soils, and some lake beds in the WesternDivision. There are various methods for determining the western boundary for the economicproduction of winter grain crops. For this study the 450mm isohyet (mean 30 year rainfall)provided the most practical, easily understood and widely accepted method for determiningthe western boundary for class 3 land. West of this isohyet distance from services and grainhandling infrastructure also becomes more of a limiting factor.
Class 3 land is associated with a wide range of landform elements and soil types:
� Grey, Brown and Red Clays (Vertosols) These soils are associated with scattered drainage depressions on the flood plains adjacent, ornear, most of the major drainage lines. In some cases, the drainage depressions may be broadflat areas, known as warrambools. These areas having a low flooding frequency are oftensuitable for dryland cropping enterprises. The soils are deep, sometimes self-mulching, with aclay texture and moderate to high soil fertility. Sometimes the soils have slight sodiclimitations and may be infrequently flooded. These soils have low to moderate limitations for cultivation and are suitable for arablecropping programs in rotation with pastures. � Alluvial Soils (Grey Clays/Grey Vertosols) The alluvial soils occur adjacent the main rivers, with stream migration producing meanderscrolls, cutoffs and ox-bow lakes. The soil texture ranges from sands to clays, depending onflood history. The Grey Vertosols again occur adjacent the main rivers and have a medium clay texture. Both soils have moderate soil fertility with the major limitation being flood hazard and water-logging. � Red Brown Earths (Red and Brown Chromosols) These soils are found on the upper or elevated flood plains, down slope from the Red Earths. The texture ranges from clay loam or sandy clay loam overlaying a reddish brown mediumclay subsoil. The limitations are low soil fertility, hard setting and sodic characteristics. When cultivated these soils are prone to wind and water erosion with production of minor

21
scalded surfaces. � Lake Beds and Grey Clays (Grey Vertosols) These soils occur in the lake beds. They have a heavy texture, seasonal crackingcharacteristics, and are often sodic at depth and have a moderate soil fertility. These soils areassociated with the Narran and Rotten Plain land system units. The limitations are floodhazard, shallow water tables, and surface crusting.
Class 3 land includes Coolabah (Eucalyptus coolabah ) / Black Box (Eucalyptus largiflorens),Coolabah/Myall (Acacia pendula) and Myall vegetation communities. These timber speciesare associated with the above soil types. On class 3 land, minimum tillage and stubble retention becomes an essential part of drylandcropping management programs. This is particularly applicable where the soils havemoderate water holding capacities, low to moderate soil fertility and moderate soil structure. In these cases, long fallows and crop rotation, will assist in maintaining grain yields and soilfertility, particularly where suitable broadleaf (pulse, oilseed and fibre) crops and pastures areused in the crop rotations. On class 3 land a reduced range of crops can be economicallygrown compared with class 2 land. In the Western Division portion of the Shire, and where mean annual rainfall is greater than450 mm, only heavy textured soils with high moisture holding capability (ie. generally withplant available water capacities of > 200mm/m of soil) have been included into class 3. In the more isolated areas of the Shire transportation costs associated with crop inputs ,whencombined with the adverse influence of lower rainfall on crop yield, the reduced range ofcrops that can be economically grown and limited management options results in thedowngrading of the agricultural land classification to classes 3 or 4. The combination of the above limitations for class 3 land produces a moderate suitability forcultivation, with cropping only sustainable in rotations including strategic fallowing, andusing conservation farming techniques such as stubble retention and reduced tillage.Incorporation of pasture phases into the rotation may also improve sustainability. Class 3land has high levels of productivity for suitable improved pastures and moderate levels ofproductivity for crops well suited to the area.
Class 4 This class includes a major part of the grazing lands within the Shire. The grasslands canprovide good grazing for livestock, while scattered timber (both individual trees and pocketsof remnant vegetation) can provide shade and shelter for livestock. The overall level ofproduction is low to moderate from locally adapted pastures. Adverse soil characteristics,variability in climatic conditions, particularly rainfall, and moderate to severe social andeconomic constraints, restrict production of grain crops. Although Travelling Stock Routes (TSRs) are Crown Lands, they are included in class 4.TSRs are a valuable agricultural resource, particularly when their grasslands are utilised bytravelling livestock or grazed by livestock to supplement feed shortages during dry periods ordroughts. In some years, it may be possible to produce ‘opportunity’ crops on some class 4 land whichhave soils with a high capacity to store water. Opportunity cropping involves a flexible

22
approach to fallow length whereby a crop is sown whenever the soil water reaches apredetermined trigger. It contrasts to a fixed approach whereby the fallow length is setirrespective of the amount of stored soil water (Hayman, et al.1996). For many farmers in theeastern zone of the northern grains region the predetermined trigger on a vertosol is 100 mmavailable stored water for wheat and 150 mm for sorghum. These values correspond to 60 and90 cm of wet soil as measured by a push probe
Production will need to be based on minimum tillage techniques. However, the potential foreconomic failure is very high, due to the unreliable annual rainfall, particularly west of the450 mm isohyet. The presence of severe limitations for production of grain crops (bothphysical, social and economic) is the principal reason for downgrading these lands to class 4. The boundary of Class 3 and 4 land in some areas is based solely on mean annual rainfall andconsequently appears quite arbitrary. Appropriate fallow management is important for the success of all cropping programs inWalgett Shire. Through the use of correct fallow management techniques high yielding cropscan be at times be obtained on some class 4 land. However as we move from class 4 to class 3then to class 2 the frequency with which these crops can be obtained increases. Croppingfrequency on class 4 land will generally be less than 1 crop per year. Class 4 lands occur north and west of Burren Junction, particularly in the old Burren Junctionarea and along the Cubbaroo Warrambool, west of Pilliga, south of Pian Creek in theWanourie area, south of the Castlereagh River, and in the Western Division on ridges andlower flood channels, particularly north of Collarenebri and west of the Barwon River to theQueensland border. Class 4 land occurs on a wide range of landform elements and soil types such as: � Alluvial Soils, Prairie Soils (Grey Dermosols) and Grey Clay Soils (Grey Vertosols) These soils occur along active streams, river channels and low terraces. The topsoils rangefrom a sandy clay loam, clay loam to a clay with moderate to high soil fertility. These soils are associated with the River Red Gums communities adjacent the major channellines. Limitations such as flood hazards, and high erodibility, particularly stream bankerosion, severely restrict the cultivation of these areas. Most of these areas are protected landsunder the Soil Conservation Act and its various amendments and clearing for agriculturaldevelopment is generally not permitted without special consent. � Grey and Brown Clays plus Drainage Line Clays (Warrambools) These soils are found along or adjacent small inactive and intermittently active drainage lines(warrambools). Soils are deep heavy-textured, seasonal cracking and of moderate fertility. Limitations are undulating surfaces, slow or impaired drainage, flooding and soil erosionhazards. Some soils are sodic and/or saline at depth and sometimes occur on protected lands. � Red Brown Earth and Hard Setting Red Earths These soils occur along former stream channels now mainly abandoned. They have a sandyclay loam topsoil with a medium clay subsoil. These “prior streams” are located on the highersections of the flood plain and are usually associated with Bimble Box (Eucalyptus populnea). Major limitations are hard setting, low infiltration and drainage, scalding and low fertility.

23
� Solodized Solonetz and Sodic Soils The soils occur on the most elevated positions on the flood plains. Formation of scalds asevidence of land degradation. In most cases the shallow clay loam topsoil has been eroded toexpose the medium clay subsoil. Major limitations are surface sealing, low infiltration rate,hard setting surfaces, absence of topsoil, surface crusting, sodic and dispersive subsoils. � Earthy Sands and Siliceous Sands The earthy sands are usually associated with a Pilliga Scrub and the siliceous sands, south-west of Mungindi. These soils carry timber vegetation and are only useful in providingseasonal grazing and shelter for livestock. � Gilgai Soils These soils have the characteristic features of undulating surfaces with rapid changes in soiltypes across the Gilgai depressions. Grey Clay soils occur in the depressions with Red Clay and Red-Brown Earths on the shelvesand crests. Limitations include the high shrink swell, water ponding characteristics anduneven growth of crops and pastures. Class 4 land has moderate to high physical, social and economic limitations for agriculturalproductivity, particularly the difficulty in preparing cultivated seed beds due to adverserainfall and soil characteristics, high input/output costs (particularly transport costs ofproducts) and labour/capital limitations. These limitations were particularly applicable in theWestern Division where their influence increases in a westerly direction.
Class 5 Land generally unsuitable for agriculture but may provide shelter for livestock. Agriculturalproduction, if any, is very low due to severe constraints. Severe or absolute constraints to agricultural production have resulted from adverse physical,climatic, environmental social and economic factors. Lands included in this class are denselytimbered areas consisting of mature trees and/or regrowth areas, permanent swamps and sandbars in beds of major rivers. � Red Earth (Red Kandosols) and Siliceous Sands (Tenosols) RidgesThese soils are associated with the undulating ridges as an elevated landform above thefloodplains. Although their small size may preclude them from appearing on the map, opalfields fall into Class 5 lands.

24
REFERENCES
Australian Bureau of Statistics (1999) Agstats: small area commodity data 1996-1997.Rev.ed. [CD-ROM] Available: ABS Catalogue No. 7117.0.30.001 [August 31, 1999]
CSIRO & Bureau of Meterology (1998) Metaccess ® Analysing Weather Records. Version:Dec 98 [CD-ROM] Available: Horizon Technology, PO Box 598, Roseville NSW2069, AUSTRALIA.
Hayman, P.T., D.M. Freebairn, and A.K.S. Huda. (1996) Opportunity cropping on theLiverpool Plains: A comparison of risk assessment by farmers and simulation models.In 'Proceedings of the 8th Australian Agronomy conference'. Toowoomba. (Ed MAsghar) p293 - 296. (The Australian Society of Agronomy: Toowoomba, Qld)
Keady, L. and Banks, R. (1998) Field Guide to Soils of the Western Barwon RegionFloodplains. Department of Land and Water Conservation.
King, D.P. (1998) Soils of the Northern Flood plains Regional Planning Areas. Departmentof Land and Water Conservation.
NSW Department of Planning, (1988) Rural land evaluation – a manual for conducting arural land evaluation exercise at the local planning level – Revised edition. Department of Urban Affairs and Planning, Sydney
Riddler, A.M.H. (1987) Advisory Note: Agricultural classification maps – uses andlimitations 2. Reliability and scale. NSW Agriculture No. 2/87 November 1987
Singh, M., Dhingra, K.K. and Dhillon, M.S. (Unpublished) Efficient Crop Zones of Indiabased on productivity indices. Punjab Agricultural University, Ludhiana, India.
Vegetation Mapping (1995) Murray Darling Basin Project M305. Murray Darling BasinCommission.
Walker, P.J. and Boyd, S.G. (1972) Land Systems Map - Angledool - Moree. SoilConservation Service of NSW, Sydney
25
APPENDICES
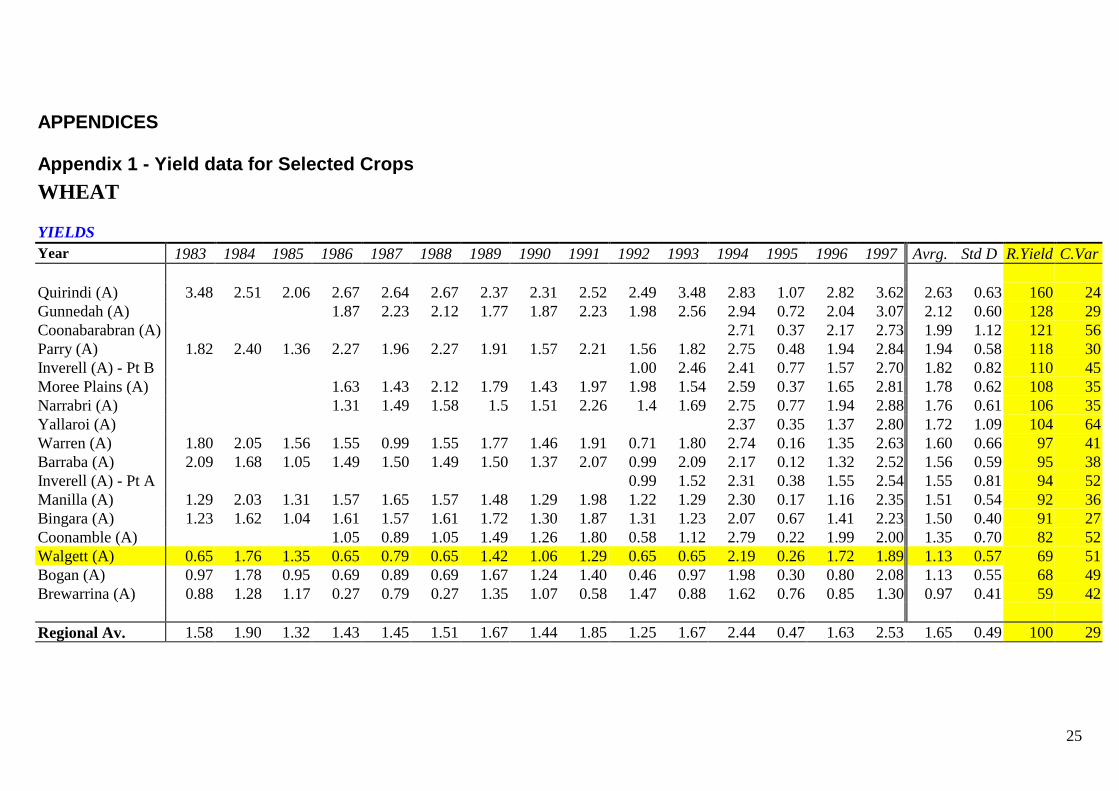
Appendix 1 - Yield data for Selected CropsWHEAT
YIELDSYear 1983 1984 1985 1986 1987 1988 1989 1990 1991 1992 1993 1994 1995 1996 1997 Avrg. Std D R.Yield C.Var
Quirindi (A) 3.48 2.51 2.06 2.67 2.64 2.67 2.37 2.31 2.52 2.49 3.48 2.83 1.07 2.82 3.62 2.63 0.63 160 24Gunnedah (A) 1.87 2.23 2.12 1.77 1.87 2.23 1.98 2.56 2.94 0.72 2.04 3.07 2.12 0.60 128 29Coonabarabran (A) 2.71 0.37 2.17 2.73 1.99 1.12 121 56Parry (A) 1.82 2.40 1.36 2.27 1.96 2.27 1.91 1.57 2.21 1.56 1.82 2.75 0.48 1.94 2.84 1.94 0.58 118 30Inverell (A) - Pt B 1.00 2.46 2.41 0.77 1.57 2.70 1.82 0.82 110 45Moree Plains (A) 1.63 1.43 2.12 1.79 1.43 1.97 1.98 1.54 2.59 0.37 1.65 2.81 1.78 0.62 108 35Narrabri (A) 1.31 1.49 1.58 1.5 1.51 2.26 1.4 1.69 2.75 0.77 1.94 2.88 1.76 0.61 106 35Yallaroi (A) 2.37 0.35 1.37 2.80 1.72 1.09 104 64Warren (A) 1.80 2.05 1.56 1.55 0.99 1.55 1.77 1.46 1.91 0.71 1.80 2.74 0.16 1.35 2.63 1.60 0.66 97 41Barraba (A) 2.09 1.68 1.05 1.49 1.50 1.49 1.50 1.37 2.07 0.99 2.09 2.17 0.12 1.32 2.52 1.56 0.59 95 38Inverell (A) - Pt A 0.99 1.52 2.31 0.38 1.55 2.54 1.55 0.81 94 52Manilla (A) 1.29 2.03 1.31 1.57 1.65 1.57 1.48 1.29 1.98 1.22 1.29 2.30 0.17 1.16 2.35 1.51 0.54 92 36Bingara (A) 1.23 1.62 1.04 1.61 1.57 1.61 1.72 1.30 1.87 1.31 1.23 2.07 0.67 1.41 2.23 1.50 0.40 91 27Coonamble (A) 1.05 0.89 1.05 1.49 1.26 1.80 0.58 1.12 2.79 0.22 1.99 2.00 1.35 0.70 82 52Walgett (A) 0.65 1.76 1.35 0.65 0.79 0.65 1.42 1.06 1.29 0.65 0.65 2.19 0.26 1.72 1.89 1.13 0.57 69 51Bogan (A) 0.97 1.78 0.95 0.69 0.89 0.69 1.67 1.24 1.40 0.46 0.97 1.98 0.30 0.80 2.08 1.13 0.55 68 49Brewarrina (A) 0.88 1.28 1.17 0.27 0.79 0.27 1.35 1.07 0.58 1.47 0.88 1.62 0.76 0.85 1.30 0.97 0.41 59 42
Regional Av. 1.58 1.90 1.32 1.43 1.45 1.51 1.67 1.44 1.85 1.25 1.67 2.44 0.47 1.63 2.53 1.65 0.49 100 29

26
OATS
YIELDSYear 1983 1984 1985 1986 1987 1988 1989 1990 1991 1992 1993 1994 1995 1996 1997 Avrg. Std D R.Yield C.Var
Inverell (A) - Pt B 0.82 2.00 1.54 0.72 1.27 1.41 1.29 0.47 125 37Quirindi (A) 0.57 1.17 0.97 1.52 1.51 1.52 1.46 1.02 0.82 0.94 1.89 1.63 0.24 1.82 1.27 1.22 0.46 118 38Brewarrina (A) 1.82 1.68 0.50 0.17 1.27 0.17 0.94 0.00 1.30 1.12 1.43 3.70 0.00 1.77 2.39 1.22 1.01 118 83Moree Plains (A) 1.07 1.17 1.26 1.11 1.28 1.41 1.18 1.09 1.55 0.19 0.85 1.13 1.11 0.34 107 31Gunnedah (A) 0.83 1.16 1.17 1.16 1.1 1.02 1 1.58 1.47 0.26 1.03 1.28 1.09 0.33 105 31Parry (A) 0.29 1.08 1.10 1.39 1.31 1.39 1.26 1.38 1.24 0.95 1.01 1.10 0.43 1.12 1.23 1.08 0.33 105 30Coonabarabran (A) 1.50 0.36 1.17 1.31 1.08 0.50 105 46Barraba (A) 0.36 0.86 0.90 1.33 1.27 1.33 1.29 1.20 1.12 0.82 1.17 1.82 0.23 0.69 1.25 1.04 0.41 101 39Narrabri (A) 0.81 1.01 1.21 0.97 0.94 1.3 0.8 0.79 1.7 0.38 1.07 1.40 1.03 0.34 100 33Warren (A) 0.37 1.48 1.30 1.10 0.92 1.10 1.09 1.12 0.88 0.53 0.79 1.43 0.21 0.99 1.78 1.00 0.42 97 42Yallaroi (A) 1.42 0.58 0.85 1.09 0.99 0.35 95 36Inverell (A) - Pt A 0.53 1.30 1.26 0.41 1.15 1.22 0.98 0.40 95 41Bingara (A) 0.52 0.76 1.21 1.16 1.08 1.16 1.15 1.02 1.18 0.61 0.79 1.27 0.48 1.02 1.22 0.98 0.27 94 28Coonamble (A) 0.99 0.82 0.99 1.06 0.96 0.97 0.43 0.75 1.46 0.47 1.26 1.38 0.96 0.32 93 33Walgett (A) 0.16 1.03 1.11 0.81 0.76 0.81 1.02 1.17 1.00 0.19 0.26 1.45 0.46 1.32 1.77 0.89 0.47 86 53Manilla (A) 0.14 0.94 0.72 0.98 1.10 0.98 1.21 1.17 1.17 0.68 0.60 1.06 0.07 0.92 1.02 0.85 0.35 82 41Bogan (A) 0.01 1.31 0.85 0.62 0.85 0.62 1.32 1.14 1.06 0.13 0.72 1.15 0.10 0.52 1.14 0.77 0.43 74 57
Regional Av. 0.47 1.15 0.96 0.98 1.09 1.05 1.16 1.04 1.11 0.72 1.08 1.56 0.33 1.11 1.37 1.03 0.31 100 30

27
BARLEY
YIELDSYear 1983 1984 1985 1986 1987 1988 1989 1990 1991 1992 1993 1994 1995 1996 1997 Avrg. Std D R.Yield C.Var
Quirindi (A) 2.12 1.53 1.95 2.63 2.31 1.07 2.35 2.94 2.11 0.60 135 28Parry (A) 1.71 2.20 1.52 2.11 2.49 0.79 2.07 2.55 1.93 0.58 123 30Inverell (A) - Pt B 1.01 1.93 2.74 1.28 1.94 2.66 1.93 0.70 123 36Gunnedah (A) 1.68 2 1.49 2.17 2.46 0.56 1.76 2.60 1.84 0.64 118 35Inverell (A) - Pt A 1.38 2.35 2.21 0.63 1.96 2.47 1.83 0.71 117 39Yallaroi (A) 2.09 0.85 1.46 2.71 1.78 0.80 114 45Coonabarabran (A) 1.82 0.89 2.00 2.32 1.76 0.62 113 35Moree Plains (A) 1.59 2.16 1.17 1.43 2.34 0.70 1.50 2.63 1.69 0.64 108 38Narrabri (A) 1.35 1.95 1.39 1.72 2.36 0.64 1.66 2.38 1.68 0.57 108 34Bingara (A) 1.48 1.87 1.23 1.52 2.07 0.87 1.37 1.99 1.55 0.41 99 26Barraba (A) 1.26 1.55 0.51 1.39 2.35 0.30 1.66 2.19 1.40 0.72 90 51Warren (A) 1.05 1.62 0.95 1.57 1.66 0.42 0.97 2.57 1.35 0.65 86 48Coonamble (A) 1.30 1.40 0.78 1.04 1.88 0.47 1.62 1.77 1.28 0.49 82 38Manilla (A) 1.06 1.45 0.85 0.71 1.82 0.30 1.66 2.18 1.25 0.63 80 50Bogan (A) 1.78 1.56 0.50 1.21 1.48 0.42 0.84 1.85 1.21 0.56 77 46Walgett (A) 1.36 1.12 0.56 0.45 1.95 0.28 1.64 1.83 1.15 0.65 73 57Brewarrina (A) 0.75 0.75 0.07 1.29 0.47 1.07 1.45 0.84 0.48 53 57
Regional Av. 1.42 1.63 1.09 1.49 2.08 0.64 1.62 2.30 1.56 0.52 100 33

28
SORGHUM
YIELDSYear 1983 1984 1985 1986 1987 1988 1989 1990 1991 1992 1993 1994 1995 1996 1997 Avrg. Std D R.Yield C.Var
Quirindi (A) 1.45 3.72 1.87 3.35 2.65 3.35 2.50 3.06 2.59 3.50 3.69 3.28 2.45 4.51 5.82 3.19 1.06 151 33Coonabarabran (A) 2.38 2.13 3.43 3.75 2.92 0.79 138 27Inverell (A) - Pt B 3.27 2.51 2.03 2.38 3.42 3.29 2.82 0.58 133 21Gunnedah (A) 1.87 2.34 2.62 2.23 2.96 2.65 3.26 2.57 2.95 1.79 3.23 3.85 2.69 0.60 127 22Warren (A) 1.45 2.13 3.01 2.44 1.41 2.44 3.83 1.02 3.19 4.97 2.94 2.08 2.97 2.41 3.72 2.67 1.03 126 39Inverell (A) - Pt A 3.14 2.17 2.30 2.24 2.51 2.87 2.54 0.39 120 15Parry (A) 0.81 3.60 1.28 3.08 2.26 3.08 2.43 2.71 1.97 3.12 1.51 1.95 1.66 4.01 3.79 2.48 0.96 117 39Yallaroi (A) 1.37 2.13 2.44 2.76 2.18 0.60 103 27Bingara (A) 0.93 2.54 1.17 1.60 2.25 1.60 1.65 1.92 2.07 2.68 1.76 2.11 1.62 3.99 2.47 2.02 0.73 96 36Barraba (A) 0.67 2.79 0.79 2.55 1.30 2.55 0.40 3.00 2.00 1.40 2.37 1.28 1.94 3.22 1.88 0.91 89 49Narrabri (A) 1.28 1.87 1.94 1.85 1.42 1.96 2.43 1.01 1.88 1.50 2.71 2.57 1.87 0.52 88 28Moree Plains (A) 1.67 1.59 1.61 1.53 1.91 1.91 2.21 1.27 1.58 2.09 1.92 2.28 1.80 0.31 85 17Manilla (A) 0.33 2.58 0.94 1.99 1.31 1.99 2.03 1.73 2.33 0.89 1.20 1.44 0.81 1.99 3.04 1.64 0.74 78 45Coonamble (A) 1.32 0.42 1.32 0.37 2.10 1.60 0.53 2.45 1.44 1.51 4.52 1.60 1.17 76 73Brewarrina (A) 2.69 0.76 2.30 0.00 0.86 1.97 1.73 1.79 0.00 1.98 0.00 3.10 1.43 1.08 68 76Walgett (A) 0.63 0.78 0.25 0.78 0.12 0.78 2.94 1.67 1.42 1.13 0.63 1.05 1.40 2.34 1.90 1.19 0.77 56 65Bogan (A) 0.17 1.01 5.00 0.07 0.00 0.00 1.04 1.98 49 190
Regional Av. 0.89 2.60 1.26 1.99 1.65 2.12 1.81 2.03 2.02 2.52 1.80 2.11 1.76 2.49 3.12 2.11 0.55 100 26

29
TRITICALE
YIELDSYear 1983 1984 1985 1986 1987 1988 1989 1990 1991 1992 1993 1994 1995 1996 1997 Avrg. Std D R.Yield C.Var
Narrabri (A) 1.25 2.25 1.51 0.81 1.64 1.03 2.61 4.78 3.77 2.40 2.55 5.68 2.52 1.52 187 60Inverell (A) - Pt A 1.46 0.63 2.63 2.10 1.70 0.86 126 51Moree Plains (A) 1.91 1.65 2.72 1.47 1.67 2.14 0.54 0.68 2.03 0.13 2.60 2.86 1.70 0.88 126 52Quirindi (A) 1.31 1.46 1.50 2.86 1.92 2.86 1.82 1.28 0.96 1.07 2.00 0.18 1.20 2.50 1.64 0.75 121 46Coonabarabran (A) 1.63 1.45 1.80 1.63 0.17 120 11Manilla (A) 0.42 1.86 0.94 1.08 1.65 1.08 0.50 1.25 2.50 1.11 3.13 2.86 1.00 1.49 0.86 110 58Coonamble (A) 1.20 0.80 1.20 1.08 0.94 0.79 2.35 1.91 2.97 1.47 0.77 109 52Gunnedah (A) 1.15 2.09 1.71 1.43 0.92 1.98 0.59 1.39 1.41 0.52 104 37Warren (A) 0.64 1.73 1.82 1.72 0.69 1.72 1.39 0.56 103 40Barraba (A) 0.40 0.92 0.80 2.13 1.06 0.75 79 70Bogan (A) 1.00 2.00 0.80 0.25 0.71 0.25 2.02 0.82 1.57 1.05 0.67 77 64Parry (A) 0.46 1.64 0.76 1.15 1.00 1.15 0.63 0.38 1.63 0.60 1.50 0.50 0.50 1.60 0.97 0.48 72 50Walgett (A) 0.98 0.73 0.75 2.08 0.06 0.92 0.74 68 80Bingara (A) 0.98 1.31 0.99 1.26 1.10 1.26 0.25 0.07 0.30 0.64 0.33 0.00 0.77 0.71 0.48 53 67Brewarrina (A) 1.00 0.20 0.60 0.57 44 94Inverell (A) - Pt BYallaroi (A)
Regional Av. 0.77 1.41 0.95 1.38 1.45 1.55 1.01 1.14 1.42 1.19 1.91 2.90 0.91 1.62 2.28 1.35 0.56 100 42

30
IRRIGATEDCOTTON
YIELDSYear 1983 1984 1985 1986 1987 1988 1989 1990 1991 1992 1993 1994 1995 1996 1997 Avrg. Std D R.Yield C.Var
Walgett (A) 1.59 1.85 1.66 1.70 0.14 132 8Brewarrina (A) 1.27 1.91 1.71 1.63 0.33 126 20Warren (A) 1.69 1.25 1.82 1.59 0.30 123 19Narrabri (A) 1.65 1.45 1.57 1.56 0.10 121 7Barraba (A) 1.62 1.41 1.51 0.15 117 10Coonamble (A) 1.40 1.24 1.89 1.51 0.34 117 22Yallaroi (A) 1.32 1.45 1.65 1.47 0.17 114 11Inverell (A) - Pt A 1.34 1.49 1.41 0.10 110 7Moree Plains (A) 1.11 1.27 1.66 1.34 0.28 104 21Parry (A) 1.70 1.62 0.58 1.30 0.62 101 48Gunnedah (A) 1.51 1.09 1.24 1.28 0.21 99 17Quirindi (A) 1.39 0.50 1.21 1.03 0.47 80 45Bingara (A) 1.01 0.98 0.99 0.02 77 2Bogan (A) 0.92 0.92 72Coonabarabran (A) 0.09 0.09 7Manilla (A)Inverell (A) - Pt B
Regional Av. 1.38 1.35 1.38 1.29 0.02 100 1

31
DRYLANDCOTTON
YIELDSYear 1983 1984 1985 1986 1987 1988 1989 1990 1991 1992 1993 1994 1995 1996 1997 Avrg. Std D R.Yield C.Var
Bogan (A) 1.74 1.74 220 0Parry (A) 1.03 1.03 130Quirindi (A) 0.90 1.10 1.00 0.14 127 14Warren (A) 1.62 0.10 0.86 1.08 109 126Coonabarabran (A) 0.67 0.96 0.93 0.85 0.16 108 19Gunnedah (A) 0.84 0.93 0.68 0.82 0.13 103Yallaroi (A) 0.58 0.77 1.06 0.81 0.24 102Narrabri (A) 0.48 0.68 1.09 0.75 0.31 95 41Moree Plains (A) 0.28 0.61 0.68 0.52 0.22 66 41Walgett (A) 0.21 0.42 0.31 0.15 40 48Inverell (A) - Pt A 0.26 0.26 33 0Brewarrina (A) 0Barraba (A)Bingara (A)Manilla (A)Inverell (A) - Pt BCoonamble (A)Regional Av. 0.62 0.71 1.04 0.79 0.22 100 28

32
CHICKPEAS
YIELDSYear 1983 1984 1985 1986 1987 1988 1989 1990 1991 1992 1993 1994 1995 1996 1997 Avrg. Std D R.Yield C.Var
Bingara (A) 1.43 1.45 0.72 1.43 2.00 1.39 1.57 1.43 0.37 181 26Parry (A) 1.57 0.90 1.57 0.99 1.11 1.31 0.62 1.15 0.35 146 31Quirindi (A) 0.94 0.00 1.55 1.67 1.55 1.68 1.65 1.49 1.09 0.94 0.70 0.59 1.28 0.86 1.14 0.50 145 44Inverell (A) - Pt A 0.92 0.55 0.92 2.56 0.69 0.85 1.51 1.14 0.69 145 61Yallaroi (A) 1.46 0.45 1.03 1.56 1.12 0.51 142 45Moree Plains (A) 1.24 1.19 1.22 1.36 0.95 1.52 0.6 0.78 1.35 0.42 0.95 1.64 1.10 0.37 140 33Narrabri (A) 0.29 1.06 1.04 0.96 0.98 1.67 0.71 0.93 1.11 0.68 1.00 2.02 1.04 0.45 132 43Coonamble (A) 0.66 0.90 0.48 0.90 0.74 1.38 1.13 0.27 0.66 1.03 0.34 1.35 1.73 0.89 0.43 113 48Gunnedah (A) 0.68 1.35 1.12 1.04 0.82 1.73 0.74 0.35 0.77 0.00 0.80 1.26 0.89 0.46 113 52Walgett (A) 0.82 1.60 1.25 0.79 0.48 0.38 0.82 0.99 0.07 1.02 0.88 0.83 0.42 105 50Warren (A) 0.81 0.45 1.09 0.78 1.09 1.11 0.28 1.16 0.35 0.81 0.66 0.32 0.72 1.33 0.78 0.34 99 44Bogan (A) 0.40 0.63 0.51 0.16 65 31Coonabarabran (A) 0.58 0.17 0.38 0.29 48 77Inverell (A) - Pt B 0.71 0.00 0.71 0.00 0.35 0.41 45 115Barraba (A)Manilla (A)Brewarrina (A)
Regional Av. 0.90 1.60 0.23 1.05 1.06 1.21 1.14 0.93 1.26 0.55 0.84 1.20 0.36 1.04 1.32 0.91 0.37 116 40


