Agricultural Institutions, Industrialization and Growth ...Agricultural Institutions,...
27
Transcript of Agricultural Institutions, Industrialization and Growth ...Agricultural Institutions,...

Agricultural Institutions, Industrialization and Growth:
The Case of New Zealand and Uruguay in 1870-1940�
Jeorge �Alvarez
(Universidad de la Rep�ublica, Uruguay)
Ennio Bilanciniy
(Universit�a di Modena e Reggio Emilia, Italy)
Simone D'Alessandro
(Universit�a di Pisa, Italy)
Gabriel Porcile
(Universidade Federal do Paran�a, Brazil)
Abstract
In this paper we apply a model of early industrialization to the case of New Zealandand Uruguay in 1870-1940. We show how di�erences in agricultural institutionsmay have contributed to the di�erent development path of the two countries, whichotherwise were similar under many respects. While in New Zealand the active role ofthe Crown in regulating the land market contributed to reduce land ownership con-centration, in Uruguay a small group of landowners largely controlled land property.Our model shows that land concentration may have negatively in uenced industri-alization and growth by impeding the formation of a large group of middle-incomelandowners and, as a consequence, the development of a domestic demand for basicmanufactures.
JEL classi�cation: D33; O14; P52; Q15Keywords: Agricultural Institutions; Industrialization; Growth; New Zealand; Uruguay
Functional Distribution; Agricultural surplus.
�We would like to thank Davide Fiaschi and all the participants to the Conference The Institutionaland Social Dynamics of Growth and Distribution. All mistakes remain ours.
yCorresponding author: Department of Economics, University of Modena and Reggio Emilia, VialeBerengario 51, 41100 Modena, Italy. E-mail: ennio.bilancini(at)unimore.it.
1

1 Introduction
In this paper we investigate how institutions governing the agricultural sector may havea�ected the evolution of industrial production and GDP in New Zealand and Uruguayduring the period 1870-1940. To this aim we apply a model of early industrializationunder functional distribution and hierarchical preferences, proving that the given dif-ferences in agricultural institutions can in principle produce the observed patterns ofindustrialization and growth.
New Zealand and Uruguay were two countries of relatively new settlement that beforethe end of the 19th Century succeeded in achieving a moderately high income per capita.Both countries prospered thanks to their ourishing agricultural sectors: they werecharacterized by the abundance of natural resources and by scarce population, formedmostly by descendants of European immigrants. Their initial economic growth was basedon exports of food and raw materials to a rapidly expanding international economy. Bythe last quarter of the 19th century New Zealand and Uruguay had achieved levelsof income per capita higher than many leading European countries. However, theirsubsequent trajectories had been quite di�erent. Although it is true that both countriesfound increasing di�culties to sustain growth in the �rst half of 20th century, the case ofUruguay was particularly disappointing. The country grew at high rates in the twenties,when the external markets were buoyant, but it could not sustain growth after 1930:its GDP per capita in 1940 was about the same as in 1912. On the other hand, NewZealand, while experiencing a fall in the rate of growth, was able to trigger a non-negligible industrial takeo�, especially if measured in terms of horsepower usage andsize of productive units (Willebald and B�ertola, 2007).
Our aim is to help to shed light on this puzzle by taking into account the agricul-tural institutions of the two countries. Indeed, although similar under many respects,New Zealand and Uruguay had rather di�erent institutions governing their agriculturalsector. In particular, they had di�erent rules and practices for what concerns the accessto land and the distribution of agricultural product among the suppliers of productionfactors. In New Zealand the British Crown adopted a policy of land distribution tonew migrants, and in general to those entering the labor market, that rapidly expandedthe number of landowners in the country. Instead, in Uruguay land ownership rapidlyconcentrated { as a consequence of the appropriation of public lands by a few landlords{ and remained highly concentrated afterwards. Furthermore, the share of agriculturalproduct retained by New Zealander landowners was systematically lower than that oftheir Uruguayan counterparts. Our basic idea is that these di�erences, shaping thedistribution of purchasing power in the population, had a major impact on the sizeof the domestic markets for manufactured goods. More precisely, in Uruguay domes-tic demands for basic manufactures were smaller than in New Zealand, generating asystematic relative disadvantage for Uruguay in the exploitation of mass production.
In order to make precise our intuition we present a model of early industrializationbased on Murphy et al. (1989). The main result of this model is that industrial takeo�depends on the composition of domestic demand for manufactures which, in turn, isshown to depend on the distribution of income. Two key assumptions give rise to such
2

an outcome: �rst, consumers have hierarchical preferences; second, industrializationin the manufacturing sector entails the substitution of an increasing return technology(with �xed start-up costs) for a constant return technology. Bilancini and D'Alessandro(2008a,b) have shown that adding the assumption of functional distribution of incomeis su�cient for industrial takeo� to depend on both the distribution of land ownershipand the distribution of agricultural product between landowners and peasants.
The main contribution of the present paper is to apply this framework to the case ofNew Zealand and Uruguay. In order to keep our argument as parsimonious as possible,we suppose that the two countries were equal under any respect but the concentrationof land ownership and the share of agricultural product going to workers. We show howsuch di�erences may have produced divergence in terms of both industrialization andGDP growth. In other words, we provide a theoretical argument whose implications areconsistent with available historical evidence about the evolution of the two countries. Ofcourse, we do not intend to argue that this is the only cause of the di�erent developmentpath followed by New Zealand and Uruguay. We only claim that the mechanism thatwe highlight { and that to the best of our knowledge has not being put forward incomparative studies of about these two countries { may have played a role.
In the last decades, the debate on geography and institutions revived the interest onthe determinants of divergent development paths across countries. A growing body ofliterature has sought to compare the institutions emerging from the colonization processin di�erent regions (Acemoglu et al., 2001; Galor et al., 2008) and particularly in theregions of new settlement (Denoon, 1983; Engerman and Sokolo�, 1997, 2005). Unlikesuch a literature which focuses on a kind of indirect e�ect of agrarian institutions oneconomic development, the present paper suggests that there is a direct relation goingthrough the demand side and which has to do with the composition of manufactures'demand (Murphy et al., 1989; Willebald, 2007).1
We recognize that the interest in comparing the development of Uruguay with that ofNew Zealand is not new. By the end of the seventies two Uruguayans historians pointedout that \Uruguayans have been comparing themselves with New Zealand for at leastseventy years", (Barr�an and Nahum, 1978, p.191). Notwithstanding this long tradition,most comparative studies were produced in the 1960s and 1970s. Two strands of litera-ture can be identi�ed. The �rst looked at New Zealand and Uruguay within the contextof the countries of new settlement, comprising a more general comparison between theRiver Plate and the Australasian regions (see for instance B�ertola and Porcile, 2002;Williamson, 2002; Willebald and B�ertola, 2007; Blattman et al., 2007). The second ap-proach emerged from studies of the agrarian sector which emphasized the potential forthe di�usion in Uruguay of the technology and productive practices that were successfulin New Zealand.2 In this direction, Kirby (1975), studying the period between 1960s and
1Other authors focus on the key link between access to frontier land, institution building and growth,which has been explored by the economic history literature since the seminal work by Jackson Turner.In the case of the United States, the existence of free land in the frontier may have contributed to keepreal wages higher in the East (Margo, 1999), encouraging the use of more advanced technology andleading to higher labor productivity growth.
2Our proposed explanation is independent of { though not incompatible with { those which stress
3

Non-industrial exports Exports as % of GDPas % of Total exports
Period 1870-1899
New Zealand 99% 16%Uruguay 100% 22%
Period 1890-1909
New Zealand 96% 23%Uruguay 100% 19%
Period 1920-1939
New Zealand 99% 25%Uruguay 100% 18%
Table 1: Share of non-industrial exports (live animals, foods, drinks, raw materials or simply preparedproducts) and share of GDP due to export revenues: New Zealand and Uruguay Sources: Blattmanet al. (2007), Willebald (2007).
1970s, presents an interesting analysis of the main similarities between the two coun-tries and investigates their land tenure systems. Although his concerns were tied to thepolicies which Uruguay should implement in order to promote economic development,he clearly pointed out that \the parallel development of New Zealand and Uruguay ob-viously stopped short, or diverged, sometime in the past" (Kirby, 1975, p. 264). In thisrespect, our paper focuses on a plausible explanation of this earliest divergence.
The rest of the paper is organized as follows. Next section highlights the similaritiesbetween the two countries as well as their di�erent evolution in terms of industrializa-tion and GDP per capita. In section 3, we review the available historical evidence aboutthe agricultural institutions in New Zealand and Uruguay and argue about their conse-quences in terms of property rights and income distribution. In section 4 we apply themodel developed in Bilancini and D'Alessandro (2008a,b) to the case of New Zealand andUruguay, showing how agricultural institutions may have generated divergent industrialand GDP growth. Section 5 provides our �nal remarks.
2 New Zealand and Uruguay between 1870 and 1940
At the end of the 19th Century, the economies of Uruguay and New Zealand weresimilar under many respects. In the �rst place, the GDP per capita of both countrieswas relatively high even if compared with that of developed countries. In real terms theGDP per capita of New Zealand was slightly higher than that of United States, whilethe GDP of Uruguay was at about the same level (Maddison, 2003). Moreover, bothcountries were heavy exporters of non-industrial (mostly agricultural) goods. During theFirst Globalization era (1870-1914) both countries specialized in exporting foodstu�s toa dynamic international economy. As table 1 shows, such a specialization persisted
di�erences in the performance of the agricultural sectors or the lack of su�cient stimuli for agriculturalproduction { such as pointed out in the classical comparison of Davie, 1960; Duncan and Fogarthy, 1984;�Alvarez and Bortagaray, 2007 between Australia and Argentina.
4

New Zealand Uruguay
Latitude of southern-northern extremities 35� 47o 30� 35o
Annual average temperature (Celsius) 12:8 17January mean temperature (Celsius) 18:0 24:5July mean temperature (Celsius) 8:0 10:9
Annual frost days 15 21Average annual rainfall (mm) 992 1005Lowest monthly rainfall (mm) 61 March 65:6 July
Table 2: A comparison of climate indicators for areas of intensive pastoral activity: San Jos�e de Mayo(Uruguay) and Palmerston North (New Zealand). Sources: Kirby (1975).
up to the Second World War. Moreover, for both countries exports represented a verysigni�cant fraction of GDP { between one-sixth and one-fourth { though for New Zealandit had been increasing and for Uruguay it has been somewhat decreasing.
Another element of similitude is factor endowments, in particular population andland. In 1870 New Zealand and Uruguay had a similar population mostly made ofearly European colonizers. After 1870 and up to the Second World War, both coun-tries experienced a rapid population growth and received massive in ows of Europeanimmigrants.3 Overall, between 1824 and 1924 the temperate regions of new settlementreceived about 43 million of people emigrated from Europe; New Zealand and Uruguaymade no exception to this (Kenwood and Lougheed, 1990). Between 1870 and 1940 thepopulation of New Zealand increased from 291.000 to 1.633.645 inhabitants, to whichimmigration contributed with 413.847 people.4 In the same period Uruguay increased itspopulation from 420.000 to 1.980.000 inhabitants, being the contribution of immigrationof about 297.185 people (�Alvarez, 2005).
Given the available technologies, the total amount of potentially productive landin the two countries was remarkably similar. It was about 17 millions of hectares.However, such a potential was actually occupied in di�erent periods by Uruguayansand New Zealanders. Uruguay had 17 millions of hectares already in 1870 and thisamount remained almost constant thereafter. New Zealand reached 17 million hectaresby 1911, while in 1870 only about 8 millions hectares were occupied. This was a relativeadvantage for Uruguay. Furthermore, the climate was quite similar in the two countries.As shown by table 2, in the typical area of intensive pastoral activities the relevantclimate indicators were very close. Finally, although the quality of land was not exactlythe same in the two countries, the literature points out that this factor could not accountfor the di�erent economic performance (see �Alvarez and Bortagaray, 2007).
Notwithstanding such similarities, in the early 20th Century New Zealand was de-veloping faster than Uruguay and substantially increased the gap during the last decade
3The First Globalization era witnessed massive emigration of Europeans to many regions of theglobe, spurred by rapid population growth in Europe and migration from rural areas (Williamson,2002). Substantial increase in transports productivity in the last quarter of the 19th Century alloweda dramatic fall in transportation costs and the integration to world markets of new regions supplyingfood and raw materials.
4The small Maori population is considered in the population �gures of New Zealand.
5

New Zealand Uruguay
GDP per capita, PPP Dollars 1995
1870 3100 22251938 6463 3723
Relative GDP per capita, New Zealand = 100
1870 100 771938 100 58
Annual rate of growth
1870-1938 1:05% 0:75%1870-1913 1:20% 1:00%1913-1938 0:90% 0:35%
Table 3: GDP per capita and annual growth rates in 1870-1938: New Zealand and Uruguay. Sources:Maddison (2003), Willebald and B�ertola (2007) .
before the Second World War. Table 3 reports the annual rate of growth experiencedby the two countries during the whole period as well as in the two subperiods 1870-1913and 1913-1940. As mentioned above, the income per capita of New Zealanders washigher than that of Uruguayans already in 1870. However, the gap increased during thefollowing seventy years. While in 1870 GDP per capita in Uruguay was only 23% lessthan that of New Zealand, in 1938 it was 42% less than the latter (Maddison, 2003).Both countries lost ground with respect to the faster industrializing countries such asthe United States, but Uruguay lost substantially more than New Zealand.
The most striking di�erence is the asymmetric development of industrial productionand, in general, the asymmetric adoption of industrial technologies. As shown in theupper part table 4, New Zealand and Uruguay had a small industrial sector in the early20th Century { the countries' production was largely made of non-industrial goods.During the second decade New Zealand had been producing relatively more machineryand metallic products than Uruguay, which is often seen as an indication of greaterapplication of industrial technology. Moreover, a relatively greater fraction of Uruguay'sproduction was related to food, drink and tobacco. However, in the fourth decadeUruguay's manufacturing sector seems to had adjusted towards a more capital intensiveproduction and, in this regard, it somewhat kept up with New Zealand. The relevantdi�erence here is the kind of technology applied. As shown in the lower part of table4, New Zealand productive units were in larger number, employed a larger number ofworkers and used a greater amount of horsepowers than their Uruguayan counterparts.Moreover, such a di�erence markedly increase from the �rst to the fourth decade of the20th Century. This is especially true for the amount of horsepowers per productive unit{ a reasonable proxy for the di�usion of industrial technologies.
Summing up, at the end of the 19th Century New Zealand and Uruguay were re-markably similar but this did not su�ce to grant them a similar development in thefollowing seventy years. More precisely, although the two countries had similar GDPs,productions, exports, populations and land stocks, New Zealand managed to grow mod-erately faster and to develop a quite larger industrial sector. The last fact is especially
6
New Zealand Uruguay
Share of gross manufactures values in 1915-1916 1919Foods, drinks and tobacco 59:8 69:1Textile, clothing and leather 18:8 7:6
Machinery and metallic products 7:4 0:0Other 14:0 23:3
Share of gross manufactures values in 1937-1938 1936Foods, drinks and tobacco 57:4 57:0Textile, clothing and leather 9:8 19:2
Machinery and metallic products 12:6 8:7Other 20:2 15:1
Horsepower and employment in 1910 1908Thousands of horsepower 100 23
Horsepower per production unit 28:4 16:8Total employees 45965 22224
Employees per production unit 13:1 9:2
Horsepower and employment in 1939 1936Thousands of horsepower 903 115
Horsepower per production unit 142:4 10:9Total employees 108722 65962
Employees per production unit 17:1 6:3
Table 4: Data on manufacturing in the �rst half of the 20th Century: New Zealand and Uruguay.Note: data for 1908 refer only to the Montevideo district. Sources: Willebald and B�ertola (2007) andreferences therein.
surprising if one considers that neither country exported a substantial amount of indus-trial goods. Actually, New Zealand's larger demand for industrial goods must had beensustained by domestic demand. This in turn testimonies that the two countries haddi�erent patterns of domestic demand. In next two sections we explore how di�erencesin agricultural institutions between New Zealand and Uruguay can be responsible forthis.
One last comment is worth doing. The described process of increasing di�erences inthe economic performance of New Zealand and Uruguay did not stop after the SecondWorld War. On the contrary, the gap between the two countries deepened with respect toboth industrial development and GDP growth (Maddison, 2003; Willebald and B�ertola,2007). In this paper we do not try to explain such a later divergence. However, if onefollows Kirby (1975) in suspecting that what happened after the Second World War hasits roots in what happened during the period 1870-1940, then the analysis that we carryout in the next two sections may be of some interest even for understanding more recentfacts.
3 Institutional Di�erences in the Agricultural Sector
So far we have contrasted the similarities between New Zealand and Uruguay at the endof the 19th Century with the di�erences showed in their subsequent GDP growth and
7

industrial development. However, if one looks at the institutional framework governingthe agricultural sector, the two countries did show signi�cant di�erences already in 1870.
Although the productive capacity of the potential land stock was very similar, landoccupation followed rather di�erent patterns in New Zealand and Uruguay. This resultedin major institutional di�erences in the ruling agricultural institutions. In New Zealandthe British Crown strictly regulated the land marked, facilitating a steady increasein the number of landowners. In Uruguay land was early appropriated by a smallnumber of landowners, resulting in a great di�culty for newcomers and newborns toaccess land and, hence, maintaining the number of landowners small. Furthermore, thetwo countries were characterized by a di�erent distribution of the agricultural productbetween landowners and landless peasants. More precisely, the share of agriculturalproduct appropriated by landowners was higher in Uruguay than in New Zealand.
As we will argue, both a lower concentration of land ownership and a more equaldistribution of land product contributed to produce a larger fraction of people withenough purchasing power to buy manufactures which, in turn, made the introduction ofindustrial technology more pro�table.
3.1 The Institutional Setting in the 19th Century
New Zealand. The New Zealand historiography has emphasized that the process ofland distribution in the country was highly idiosyncratic, representing a factor thatcontributed to the emergence of an agrarian society with high welfare levels. The distri-bution of land constituted a political and economic resource that the state used widelyin the 19th Century with a view to securing the e�cient use of land.
In Article II of the Waitangi Treaty of 1840 the UK acknowledged the individualand collective rights of the native Maories over their territories. The Waitangi Treatywas a turning point in New Zealand economic history, as it represented the moment inwhich the Maories ceded the sovereignty of their territory in exchange for autonomy andproperty rights. In general terms, the Treaty was systematically disrespected, giving riseto a massive transfer of land to European colonizers.
Land distribution among the colonizers followed the British tradition of makingexplicit the Royal origin of property titles. Colonizers could not negotiate directly withthe natives, but the intermediation of the Crown was required. The Colonial authoritiesand the representatives of the autonomous government created a juridical frameworkthat regulated the expropriation of land from the Maories and the granting of propertytitles to the European colonizers. Between 1840 and 1860 the process of land distributionaccompanied the arrival of new immigrants, providing for the e�ective occupation andexploration of the allotments of land. The state controlled land distribution rigorouslyin order to allow an ample sector of the population to have access to this critical asset.Public land was sold or leased by the state for long periods under certain conditions,which included the e�ective exploration of the allotments, measures for soil conservationas well as the improvement of eroded lands (Prichard, 1970; Hawke, 1985, 1999).
In the 1870s, in the context of the political and administrative reform that elimi-nated the provincial system and centralized the structure of the state, it was established
8
the Torrens system that highly simpli�ed the registration of property, facilitating theformation of a market for land. The extending of the territorial frontier since 1890,the active role of the state in distributing land and the positive e�ects of refrigeration(that encouraged the division of the large estates with a view to adopting more capita-intensive techniques), highly contributed to the transformation of the structure of landproperty in New Zealand.5
The Land for Settlement Acts of 1892 and 1894 were key juridical pieces regulatingthe distribution of land between 1892 and 1912. The �rst established the abolition ofthe system of selling land in installments and incorporated the leasing of public lands(including a purchase option up top a maximum of 8.000 hectares). The initial periodof leasing was 10 years with a purchase option, but the leasing could be renovated for amaximum of 25 years, after which the land was occupied in perpetuity (900 years). Bymeans of this mechanism the producer, as a matter of fact, was the owner of the land.The same Law granted to the government a budget of 50.000 sterling pounds per yearto expropriate land and promote the division of the latifundia, increasing this amountto 250.000 sterling pounds in 1894.6 The extension of latifundia fell from 3.2 million ofhectares in 1891 to 1.4 million in 1910, as a result of both the in uence of the publicpolicy and the advantages of a more capital-intensive type of exploitation. In 1907 theNational Endowment Act provided for an extension of the amount of public lands forleasing, with a view to �nancing the system of public education and supporting theold-age pension system adopted in 1894.
In sum, New Zealand established property rights in the rural sector at the initialstages of colonization. This secured the extension of property rights for the new wavesof white colonizers, while at the same time kept a tight control over the destinationand uses of public land. By doing so, New Zealand facilitated the access to land toa signi�cant part of its population, e�ectively preventing the control of land by smalloligarchic groups.
Ururguay. In the 19th Century Uruguay showed a major vulnerability in politicaland institutional terms, marked by recurrent �nancial crisis and the lack of e�ectivecontrol over the national territory. Between 1830 and 1870, the successive governmentsthat ruled the country adopted a policy of selling public land instead of o�ering thisland for leasing contracts. Moreover, the continuous political instability that hauntedthe Uruguayan history in that period prevented the consolidation and e�ective workingof a market for factors of production. The state lost its control over public lands infavor of latifundia, being unable to determine precisely their extension and localizationin the national territory.
In 1830, when Uruguay adopted its �rst Constitution, public lands represented 80%
5The 1891 Land and Income Tax established a progressive tax on land property for three categoriesof tax-payers. Keall (2000) suggests that income from this tax represented in 1922 about 10 % of thetotal income of the state.
6The estimation of the income received by the state out of the renting of public lands between 1982and 1894 was high enough so as to pay for the costs of the expropriation of the large estates in thisperiod (as shown in �Alvarez, 2005).
9

of the territory, the national frontiers had already been occupied and the populationof the country only reached 70.000 inhabitants. The access of the population to landwas a highly con icting process that the state could not organize properly, being unableto resist the pressure of large landowners, the �nancial demands produced by frequent�scal crises, and the military and political power of the caudillos, of paramount in uenceamong the rural population that had neither formal property titles nor leasing contractsprotecting their interests.7
The consolidation of property rights in the rural sector was attained in the secondhalf of the 1870s, in the context of the military regimes which begun with ColonelLatorre in March 1876. The emergence of new technologies in weaponry (the Mauserand Remington ri es), transportation (railways) and communication (telegraph) o�ereda decisive advantage over the rural caudillos. At the same time, the delimitation of therural properties was made possible by the di�usion of the iron fence, the alambramiento,in the landscape of the pampas (Barr�an and Nahum, 1967, 1971, 1972, 1973; Jacob,1969; Millot and Bertino, 1996; Moraes, 2001; Franco, 1968). This consolidated thedominance of large estates in the rural sector, to which a substantial part of publiclands was eventually incorporated.
In sum, property rights in the Uruguayan rural sector were fragile at the beginning.They had been consolidated only in the last quarter of the 19th Century. This coincidedwith the transfer of large stocks of land to a small group of landowners, which bylarge remained of about the same size for several decades thereafter. This type of landoccupation e�ectively restricted the access to land and fostered land concentration.
Year New Zealand Year Uruguay
1891 438081896 58940 1908 435891911 73876 1913 585301930 829851940 90931 1937 73414
Table 5: Number of farms in New Zealand and Uruguay. Sources: Uruguay - Censo de poblaci�on yagropecuarios (1908, 1916, 1937) y Base de datos del Programa de Poblaci�on - UM - FCS { UDELAR.Nueva Zelanda - Hawke (1985); Briggs (2003).
3.2 Distribution of Land Ownership and Agricultural Product
An rough idea of the distribution of land ownership can be obtained by looking at theaverage number of farms in the two countries. Table 5 shows the number of farmsin New Zealand and Uruguay at di�erent points in time. The number of farms was
7The occupation of public land was such a chaotic process that at the beginning of the 20th Century,when the Batlle and Ordo~nez administration sought to implement new policies for encouraging agricul-tural production, the amount of public lands was still unknown. It is likely that these lands did notrepresent at that time more than 15% of the national territory, and the state received no income fromthem.
10

Year Total Rural
Uruguay New Zealand Uruguay New Zealand
1890 24 12 122 231895 21 18 107 351900 19 17 95 341905 17 16 65 331910 15 161915 13 15 63 351920 12 141925 11 131930 10 111935 9 11 50 351940 9 11
Table 6: Hectares of Occupied Land per Population (Total and Rural), NZ and Uruguay. Sources:
Uruguay - Censo de poblaci�on y agropecuarios (1908, 1916, 1937) y Base de datos del Programa dePoblaci�on - UM - FCS { UDELAR. Nueva Zelanda - Hawke (1985); Briggs (2003).
signi�cantly greater in the case of New Zealand.8 This is relevant especially becauseNew Zealand had a smaller amount of available land than Uruguay until 1911. Table 6presents the evolution of occupied land per population in the rural sector. The �guresare much larger in Uruguay. In 1890 there was about half of the people per hectare inthe Uruguayan rural sector than in the New Zealander one. Moreover, occupied land perrural population remained substantially stable in New Zealand, re ecting the fact thatthe rural population increased pari passu with the supply of land. These di�erences arealso re ected in the evolution of occupied land per capita, which remained stable in NewZealand while falling sharply in Uruguay. Overall, this suggests that land ownership wasmore concentrated in Uruguay.
Information about the distribution of agricultural product in the two countries canbe obtained by looking at the ratio between the price of land and real wages and at theshare of agricultural product going to wages. The �rst variable gives a rough idea ofthe relative value { and, hence, of the relative economic scarcity { of the two factors ofproduction. The second variable represents a �rst approximation of the residual productaccruing to those controlling the land stock.
Time series are available for wages and land prices for both New Zealand andUruguay (see the Appendix for additional information on data sources). This allowsus to compare the evolution of the rental/wage ratios between 1875 and 1940. We stress
8In this paper, we totally abstract from Uruguayan small-farm problem. Kirby (1975) reported somecomparative data for minifundios in the period after the Second World War, \45 percent of Uruguayanholdings are less than 20 hectares, compared with 26 percent in New Zealand" [p. 270]. Moreover whilethe modal size was 20-49 hectares, the average size was 209 hectares (see also I.B.R.D./F.A.O., 1951,62). This suggest that although the number of farms in Uruguay increases, the relevant number oflandowners in 1940 was at about the same level than that in 1870. Moreover, the increase in the numberof farms in Uruguay largely occurred due to the subdivision of farms which had less than 100 hectares,not due to the reduction of latifundia. Therefore, this increase did not represent an improvement in theaccess to land in Uruguay (Barr�an and Nahum, 1978; Bertocchi, 2004).
11

Figure 1: the Rental/Wage Ratio in New Zealand and Uruguay. Sources: New Zealand, Real Wagesand Real Land Prices: Greasley and Oxley (2008, 27, 28); Uruguay, Real land price index estimatedfrom the nominal land price index of Banco de Datos PHES e IPC by B�ertola et al. (1998). Real wageswere estimated from B�ertola et al. (1998).
that comparing the absolute values of the rental/wage ratios is not safe given the natureof our data. Nonetheless, supposing that both countries were exposed to similar shocks,there are interesting insights that can be drawn from the relative movements of thetwo trends. Figure 1 shows that the rental/wage ratio in New Zealand and Uruguayfollowed a fairly similar trend: it increased until the �rst decades of the 20th centuryand declined since 1915. This trend probably expresses the impact of the higher pricesfor foodstu�s and raw materials in the international economy until 1915, which in turna�ected land prices in the exporting countries.9
Interestingly, while in the 1870s New Zealand had a sensibly larger rental/wage ratiothan Uruguay, in the 1930s the two were almost the same. In other words, the landrental had become more and more important in Uruguay relatively to New Zealand.This may be linked to the institutional di�erences mentioned above. Indeed, since theland stock is the same in the two countries, this �gure suggests that control on land
9One should have expected a less marked deterioration of income distribution in New Zealand thanin Uruguay, to the extent that the supply of land was more elastic in the former country. However,the increase in the supply of land in New Zealand was most probably compensated by the much higherin ow of migrants, who settled mainly in the rural areas.
12
New Zealand
Year Wage Share Residual Rent Share Agrarian Product
1891 33.1 66.9 1001896 31.9 68.1 1001911 21.4 78.6 1001936 33.1 66.9 100
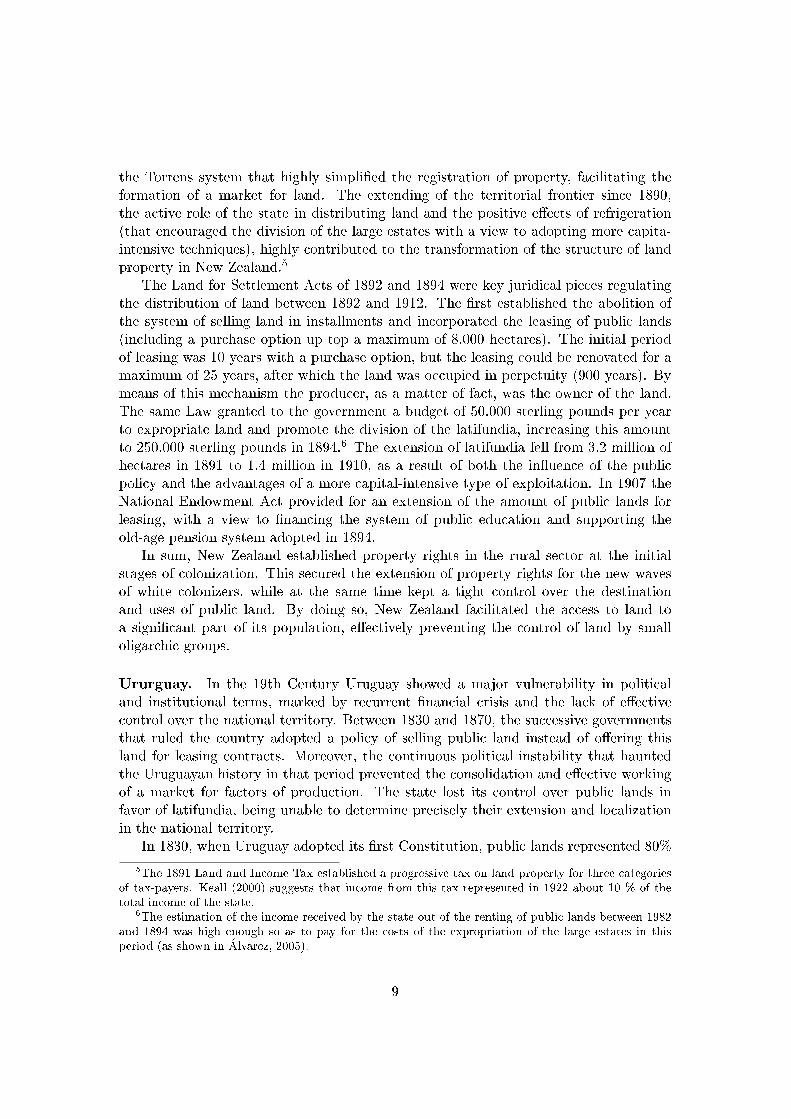
Table 7: Functional distribution of the incomes in the agrarian sector: New Zealand. Sources: Briggs(2003); Bloom�eld (1984); Greasley and Oxley (1998, 14,33); Greasley and Oxley (2003);Prichard (1970,137, 138, 193, 194, 335); Hawke (1985, 102,234, 235).
Uruguay
Year Wage Share Residual Rent Share Agrarian Product
1892 22.0 78.0 1001895 22.0 78.0 1001908 20.3 79.7 1001911 19.5 81.5 1001916 24.6 75.6 1001930 21.5 78.5 1001937 22.8 77.02 1001940 22.0 78.0 100
Table 8: Functional distribution of the incomes in the agrarian sector: Uruguay. Sources: AnuarioEstad��stico (1938), Censos Agropecuarios (1908, 1916, 1930, 1937 and 1943); Ardente et al. (2004);B�ertola et al. (1998); Barr�an and Nahum (1978); Barr�an and Nahum (s/f, 319); Barr�an and Nahum(1971, 637); Barr�an and Nahum (1972, 430); Barr�an and Nahum (1973, 467); Barr�an and Nahum (1977,429); Balbis (1995, fecha:123); Vigorito and Reig (1986, 183,184); BROU (1933, 53); Jacob (1981, 181).
was relatively more concentrated in Uruguay or that, in practice, latifundia made landavailable to a lesser extent.
Turning our attention to the distribution of the agricultural product we see againrelevant di�erences between New Zealand and Uruguay. Tables 7 and 8 report estimatesof the product shares. In Uruguay agricultural workers obtained about 20% of the totalagricultural output. In the case of New Zealand these �gures were instead about 30%.10
This suggests that in Uruguay landowners were able to obtain a larger share of theagricultural product than their New Zealander counterparts.
4 The Model
In this section we present a simple model of industrial takeo�, based on Bilancini andD'Alessandro (2008a,b), and apply it to the case of New Zealand and Uruguay 1870-
10In New Zealand the agrarian rent was made of two parts, one accruing to the government (about4% of total output) and the other to private landowners (about 20%). Public property of land was animportant di�erence between New Zealand and Uruguay, since it crucially a�ected the availability ofland to be distributed and allowed the New Zealand to enjoy during most of the period a much moreequilibrated �scal situation.
13

1940.11 We proceed in three steps. First, we give a brief description of the model as-sumptions. Second, we characterize industrialization as an equilibrium outcome. Third,we particularize the model for the case of New Zealand and Uruguay, showing that in-stitutional di�erences in the agricultural sector can lead to di�erent equilibria in termsof both industrialization and income.
4.1 Assumptions
There are two sectors, agriculture and manufacture. Agriculture produces a single ho-mogeneous divisible good, named food, which is used as numeraire. In the other sector,there is instead a continuum of manufactured goods represented by the open interval[0;1) 2 <. Each good is denoted by its distance q from the origin. Individuals followthe same consumption pattern. There is a subsistence level of food consumption �! and aminimum amount of food z which is preferred to the consumption of any manufacture,with z > �!. Beyond z any unit of income is spent to buy the manufactured goodsfollowing the indexed order. Such a consumption pattern is intended as a simple wayof introducing a common ranking of necessities: people �rst need to buy food up to thelevel z, then basic manufactures and durables which allow better life standards and, onlyafter that, they buy luxuries. For simplicity, we assume that only one unit is bought ofany manufactured good. In other terms, any individual with income ! � z uses her �rstz of income to purchase food and (! � z) to purchase the manufactured goods. Anyindividual with ! < z consumes only food.12
Food is produced using land and labor. Labor is assumed to be homogeneous.Production is given by the constant returns function F (LF ; T ), where LF is the numberof peasant workers and T is the amount of cultivated land. Moreover, F1 > 0, F11 < 0,F2 > 0 and F22 < 0, where Fi is the derivative of F with respect to the i-th argument andsimilarly for Fij . The agricultural product is shared between peasants and landlords.Agricultural wages is equal to wF = �F (LF ; T )=LF while the total amount of rents isR = (1��)F (LF ; T ), where the parameter � denotes the peasants' share of agriculturalproduct.13 We assume that property rights on cultivated land are equally distributedamongM landowners, thus the income of each landowner is equal to R=M . Therefore,Mcan be interpreted as a rough index of land property concentration. We also assume thatlandlords are richer than peasants, i.e.R=M � wF , which implies that � � LF =(LF+M).
The manufacturing sector is constituted by a continuum of markets where each one is
11In the present paper we abstract from most model details and all proofs. See Bilancini andD'Alessandro (2008b) for proofs of equilibrium existence and comparative statics about land owner-ship concentration. See Bilancini and D'Alessandro (2008a) for the model extension where agriculturalproduct is exogenously distributed between landowners and peasants. Moreover, the basic underlyingmechanism is largely based on Murphy et al. (1989).
12This behavior is a particularization of the hypothesis of hierarchical preferences. It can be easilyrationalized by means of a utility function. See Bilancini and D'Alessandro (2008b, fn 7) for an explicitanalysis of this issue.
13We remark that � is exogenous to the model. It may be though of as re ecting institutionalpeculiarities due to the historical evolution of the country. It may also be interpreted as representingpower relationships between landlords and farmers.
14
in�nitely small with respect to the entire economy. The number of workers employed inthe manufacturing sector as a whole is denoted by LM while the ruling wage is denotedby wM . Each commodity q con be produced with either of the two following technologies.The �rst, labeled Traditional Technology or TT, requires � units of labor in order toproduce one unit of output. This represents the case in which commodities are producedby artisans who, at the same time, organize production and work like other wage-paidlaborers. The second, labeled Industrial Technology or IT, requires k units of labor tostart up plus � units of labor per unit of output produced, with 0 < � < �.14 Lastly,we denote by E the number of entrepreneurs.
The market structure in the manufacturing sector is the following. A group of com-peting artisans operates in each market q of the economy. Artisans compete among eachother so that no pro�ts are earned using TT. Besides, in each market there exists oneand only one artisan who knows the IT. If she decides to be an entrepreneur she canbecome a monopolist. As shown in Bilancini and D'Alessandro (2008b), she �nds con-venient to charge a price equal to �wM . Hence, the pro�ts of the monopolist operatingin market q are equal to �(q) = [(�� �)Dq � k]wM where Dq is demand for commodityq. Therefore, an artisan knowing the IT will decide to become an entrepreneur if andonly if Dq � � � (k + 1)=(�� �).15
Finally, we assume perfect mobility of labor among sectors and markets so thatwF = wM = w. The working population is denoted by L = LF + LM + E and eachworker either supplies inelastically one unit of labor or becomes an entrepreneur. Thetotal supply of labor is hence equal to L�E. Total population is denoted by N = L+M .
4.2 Industrialization.
Industrialization is de�ned here as the adoption of IT in place of TT. Industrial pro-duction in this context does not mean industrial goods, but that both the agrarian andagricultural productions are based on larger-scale, increasing returns modern techniques.Recall that we assume that the two countries have access to the same technology: thecritical di�erence between them will be, as it is argued later, in terms of the economicincentives to adopt the TT or IT technology (more precisely, in terms of their relativepro�tability). In other words, the model will not explain divergence based on techno-logical asymmetries (technology-gap), but on di�erent incentives for adopting the IT.The pattern of land ownership in turn played a key role in de�ning these incentives.
Consider, for the sake of the argument, an economy whose agricultural sector isalready in equilibrium. Denote with m the total expenditure in manufactures andwith ! the income of a generic individual. Since every consumer who has alreadybought z units of food spends her remaining income to get a unit of each manufacturein the speci�ed order, the demand Dq faced by a generic market q is determined by thenumber of individuals who earn enough income to buy at least commodity q, namely
14Note that TT shows constant returns to scale while IT shows increasing returns. The di�erencebetween these two technologies represents the economic advantage of industrialization.
15We also impose that (k + 1) > (� � �), because if (k + 1) � (� � �) then IT never requires moreunits of labor with respect to TT and, hence, it is always preferred by artisans.
15
the number of individuals who satisfy (! � z)=�w > q.Assume, for the moment, that � is such that workers are poor and consume only food,
i.e. w � z. Thus, the demand for manufactures is shaped by the distribution of landproperty rights because the latter determines the number of individuals with incomegreater than z. If, for instance, there are only a few rich landowners, then the extent ofthe manufacturing sector will be quite large and the demand faced by each market willbe relatively small. If, on the contrary, landowners are many but each with a low income,then the extent of the manufacturing sector will be quite small and the demand faced byeach of these markets will be relatively large. Since IT is introduced only if demand goesover a certain pro�tability threshold, a too concentrated land ownership may preventthe takeo� even if m is large. Otherwise if land ownership is su�ciently distributedthen the pro�tability threshold may be exceeded. In such a case, some artisans becomesentrepreneurs, earn positive pro�ts and the market in which they operate industrialize.The new earnings obtained by entrepreneurs start a multiplicative process of demandfor manufactures. New demand generates new pro�ts and new pro�ts generate newdemand.16 Such a feedback process can take place several times but in each round theamount of new pro�ts diminishes because only a fraction of the new demand becomesnew pro�ts { the remaining part going to cover production costs. The process endswhen new generated pro�ts fail to industrialize new markets or to generate new demandfor markets already industrialized.
Consider now the case where � is large enough to imply that w > z, that is, work-ers demand for manufactures is positive. Thus, if (M + L) > � then some marketsindustrialize. As described above, the extra earnings obtained by entrepreneurs of in-dustrialized markets start a multiplicative process of demand which may further expandindustrialization and aggregate income. In general, under the hypothesis that w � z, agreater � implies a larger w which in turn produces an increase in both industrializa-tion and income by fostering demand for basic manufactures and, hence, a more intenseexploitation of mass production (see Bilancini and D'Alessandro, 2008a for a proof ofthis). We emphasize that the latter mechanism based on workers' purchasing power andthe previous one based on land distribution may trigger industrialization independentlyto each other. However, they may also work together in a synergic way.
4.3 New Zealand and Uruguay between 1870 and 1940
We particularize the model to the case of New Zealand and Uruguay by introducinga few additional assumptions. Our aim is to translate the stylized facts reported insection 2 and 3 into the language of the model. In order to better clarify our argumentwe disregard any other possible di�erence between the two countries.
A superscript j 2 fNZ;Ug indicating the country { NZ stands for New Zealand, Ufor Uruguay { and a subscript t 2 f0; 1g indicating the date { 0 stands for 1870, 1 for1940 { are added to the model variables and parameters. According to this notation wehave, for instance, that NNZ
0is the population of New Zealand in 1870 while NU
1is the
16The precise outcome depends on how pro�ts are distributed among entrepreneurs. This issue isinvestigated in detail in Bilancini and D'Alessandro (2008b).
16

population of Uruguay in 1940. We assume that available technologies are identical in thetwo countries and constant over time. Hence, we drop both subscripts and superscriptsfor F (�), �, � and k.
We further assume that the two countries are identical under all respects but two: (i)the 1870 endowment of cultivated land is greater in Uruguay while the 1940 endowmentis the same, and (ii) the number of landowners grows proportionally with the land stockin New Zealand while is constant in Uruguay (see footnote 8).17 Table 9 reports ourassumptions on factor endowments and land distribution for the year 1870.
Exogenous variables in 1870 New Zealand vs Uruguay
Total Population NNZ
0 = NU
0
Number of Landowners MNZ
0 =MU
0 < �
Peasants' Share of Agricultural Product �NZ0 = �U0
Available Cultivated Land TNZ
0 =TU0k
< TU
0
Working Population LNZ0 = LU0 > �
Table 9: Factor endowments and land distribution in 1870, where k > 1.
Since land is more scarce in New Zealand { while total rents are the same { the(rental) price of land is higher in New Zealand. Moreover, agricultural labor is moreproductive in Uruguay implying that Uruguayan wages are higher (consistently withretal/wage data, see �gure 1). However, Uruguayan landowners are as rich as NewZealander ones since they own a larger amount of land per capita (this is consistentwith, though not implied by, Tables 5 and 6).
Furthermore, since in 1870 both New Zealand and Uruguay had per capita incomesamong the highest worldwide, we �nd convenient to assume that wages are slightlygreater than z in both countries. This implies that the amount of food produced andconsumed in the two countries is the same { denoted by F j
t { although in Uruguay foodis produced using more land than in New Zealand and, as a consequence, less labor.These equilibrium relations are summarized in Table 10.
Note that in both countries the number of landowners is too small to trigger indus-trialization while the size of the working population is su�cient to break-even in somemarkets. Hence, in each country an industrial sector exists though its size is very small interms of both people employed and variety of manufactures produced. The equilibriumproduction of manufactures is represented in Figure 2 for New Zealand and in Figure3 for Uruguay. The two manufacturing sectors, considered as whole, are of similar size
17Later on, we will also suppose that (iii) New Zealand had a systematically higher share of agriculturalproduct going to wages than Uruguay. Such a delay is intended to show that (i) and (ii) are enough togenerate some divergence which, in turn, is fostered by (iii).
17

Equilibrium variables in 1870 New Zealand vs Uruguay
Food Produced FNZ0 = FU0
Wages wNZ
0 = �NZ
0
FNZ0
LNZF0
< �U
0
FU0LUF0
= wU
0
Total Rents RNZ0 =�1� �0NZ
�FNZ0 =
�1� �0U
�FU0 = RU0
Landowners' incomeRNZ0
MNZ
0
=RU0MU
0
Rental price rNZ
0 =RNZ0
TNZ0
>RU0TU0
= rU
0
Rental-Wage RatiorNZ0
wNZ0
>rU0wU0
Table 10: Equilibrium outcomes in 1870
6
-q
Dq
0
�
MNZ0
QR
NNZ0
�!
QL
MNZ0
+ ENZ0
�!
Q�
Figure 2: New Zealand manufacturing sector in 1870. The vertical axis measures the amount ofmanufactures produced while the horizontal axis identi�es the type of manufacture. The intervals[0; QL], [0; Q�] and [0; QR] represent the types of commodities demanded by, respectively, workers,entrepreneurs and landowners.
in terms of variety of commodities produced. This is because landowners { which arethe richest and hence have the most diversi�ed consumption { earn the same incomein the two countries. However, the industrial sector is slightly larger in Uruguay thanin New Zealand because workers demand a somewhat lager variety of manufactures. Inconclusion, under (i) and (ii) our model predicts that, if anything, in 1870 Uruguay wasin a slightly better position than New Zealand for both industrial takeo� and economic
18

6
-q
Dq
0
�
MU0
QR
NU0�!
QL
MU0+ EU
0�!
Q�
Figure 3: Uruguay manufacturing sector in 1870. The vertical axis measures the amount of manufac-tures produced while the horizontal axis identi�es the type of manufacture. The intervals [0; QL], [0; Q�]and [0; QR] represent the types of commodities demanded by, respectively, workers, entrepreneurs andlandowners.
growth.We now study the equilibrium in 1940. Following (i) and (ii), we have that population
is still identical in the two countries but substantially larger than in 1870. Moreover,while New Zealand has a ratio between the number of landowners and that of non-landowners that is the same of 1870, Uruguay has the same number of landowners thatit had in 1870. In addition, in 1940 New Zealand has reached the same stock of cultivatedland of Uruguay which, instead, has the same stock of 1870. As a consequence, landownership is substantially more concentrated Uruguay than in New Zealand. Theseassumptions are formally stated in table 11.
Exogenous variables in 1940 New Zealand vs Uruguay
Total Population NNZ
1 = NU
1 = kN0
Number of Landowners MNZ
1 = kMNZ
0 > � > MU
1 =MU
0
Peasants' Share of Agricultural Product �NZ1 = �NZ0 = �U0 = �U1
Available Cultivated Land TNZ1 = TU1 = TU0 > TNZ0
Working Population � < LNZ1 = kLNZ0 < LU1 = NU
1 �MU
0
Table 11: Factor endowments and land distribution in 1940, where k > 1.
Our model shows that such di�erences are su�cient to imply a gap in both industri-alization and income growth. The intuition is the following. In New Zealand population
19

growth comes with the proportional growth of the land stock and the number of landown-ers. Since agricultural production shows constant return to scale and demand for foodis proportional to population, we have that equilibrium wages remain at the same levelof 1870 while total rents increase proportionally to population. This also means thatthe income of each landowner remains at the level of 1870 since also their number growsproportionally to population. However, mass production expands because the greaternumber of landowners makes the adoption of the industrial technology pro�table fora greater variety of manufactures. So, also industrial employment and income growsubstantially. On the contrary, in Uruguay population growth does not come with agreater number of landowners and the stock of land is constant and equal to that ofNew Zealand in 1940. This implies, with respect to 1870, a lower average agriculturalproductivity of labor { due to decreasing returns { which, in turn, implies higher rentsper landowner and lower wages. Furthermore, since in 1940 food production is the samein the two countries, so are wages and total rents. Therefore, the model predicts thatthe rental-wage ratio of Uruguay converges to that of New Zealand during the yearsbetween 1870 and 1940 (again, consistently with what described in section 3). Theseequilibrium outcomes are summarized in Table 12.
Equilibrium variables in 1940 New Zealand vs Uruguay
Food Produced FNZ1 = FU1 = kFNZ0 = kFU0
Wages wNZ
1 = �NZ
1
kFNZ0
kLNZF0
= wNZ
0 = wU
1 < wU
0
Total Rents RNZ1 = kRNZ0 = kRU0 = RU1
Landowners' incomeRNZ1
MNZ
1
=kRNZ0
kMNZ
0
<RU1MU
1
=kRU0MU
0
Rental price rNZ
1 =kRNZ0
kTNZ0
= rNZ
0 = rU
1 =kRU0TU0
> rU
0
Rental-Wage RatiorNZ1
wNZ1
=rU1wU1
Table 12: Equilibrium outcomes in 1940, where k > 1
We �nd useful to describe in greater detail what our model predicts about the devel-opment of the manufacturing sectors. Since Uruguayan landowners becomes substan-tially richer than their New Zealander counterparts, Uruguay's manufacturing sector asa whole expands more than the New Zealand's one. However, Uruguay has a smallerindustrial sector { both in terms of industrial employment and variety of commoditiesproduced { because most Uruguayan manufactures are still produced with the tradi-tional technology. Indeed, in Uruguay, the only commodities produced with the indus-trial technology are the few types that are demanded by workers. Thus, entrepreneurs
20
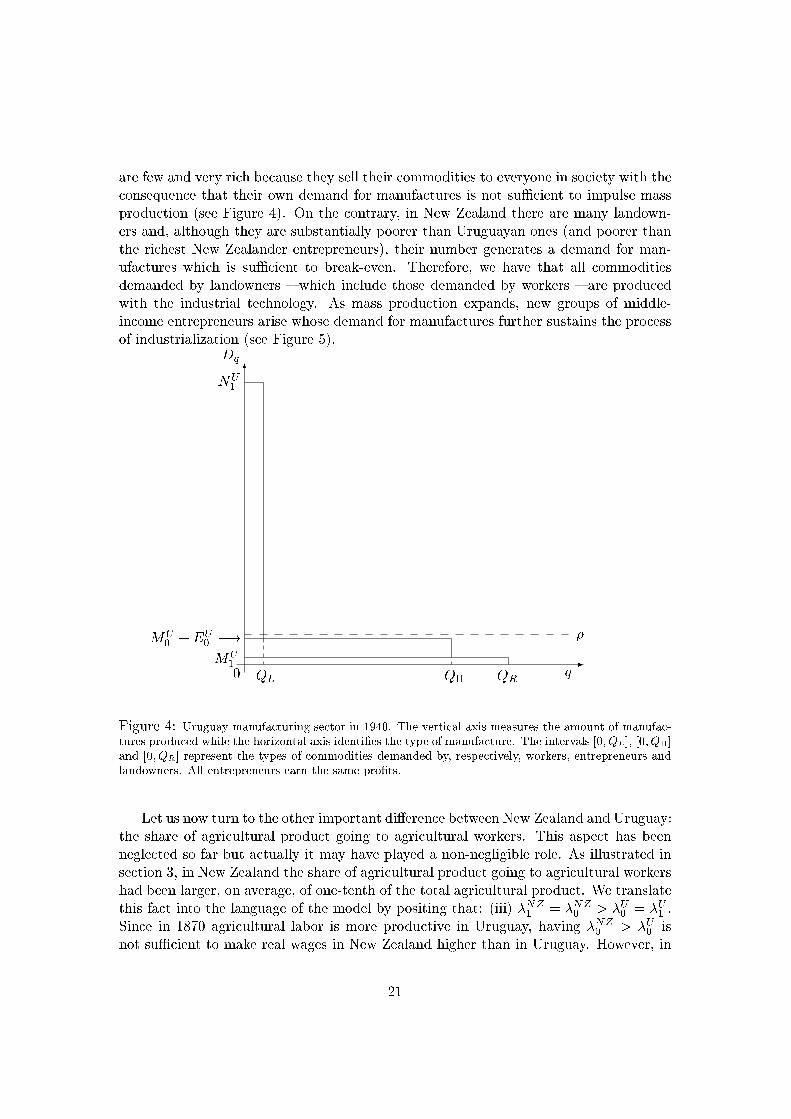
are few and very rich because they sell their commodities to everyone in society with theconsequence that their own demand for manufactures is not su�cient to impulse massproduction (see Figure 4). On the contrary, in New Zealand there are many landown-ers and, although they are substantially poorer than Uruguayan ones (and poorer thanthe richest New Zealander entrepreneurs), their number generates a demand for man-ufactures which is su�cient to break-even. Therefore, we have that all commoditiesdemanded by landowners { which include those demanded by workers { are producedwith the industrial technology. As mass production expands, new groups of middle-income entrepreneurs arise whose demand for manufactures further sustains the processof industrialization (see Figure 5).
6
-q
Dq
0
�
MU1
QR
NU1
QL
MU0+ EU
0�!
Q�
Figure 4: Uruguay manufacturing sector in 1940. The vertical axis measures the amount of manufac-tures produced while the horizontal axis identi�es the type of manufacture. The intervals [0; QL], [0; Q�]and [0; QR] represent the types of commodities demanded by, respectively, workers, entrepreneurs andlandowners. All entrepreneurs earn the same pro�ts.
Let us now turn to the other important di�erence between New Zealand and Uruguay:the share of agricultural product going to agricultural workers. This aspect has beenneglected so far but actually it may have played a non-negligible role. As illustrated insection 3, in New Zealand the share of agricultural product going to agricultural workershad been larger, on average, of one-tenth of the total agricultural product. We translatethis fact into the language of the model by positing that: (iii) �NZ
1= �NZ
0> �U
0= �U
1.
Since in 1870 agricultural labor is more productive in Uruguay, having �NZ0
> �U0is
not su�cient to make real wages in New Zealand higher than in Uruguay. However, in
21

6
-q
Dq
0
�MNZ
1
QR
NNZ1
QL
6
- Entrepreneurs' Demand
Figure 5: New Zealand manufacturing sector in 1940. The vertical axis measures the amount ofmanufactures produced while the horizontal axis identi�es the type of manufacture. The intervals [0; QL]and [0; QR] represent the types of commodities demanded by, respectively, workers and landowners. Sincenot all entrepreneurs earn the same pro�ts, the variety of commodities that they demand can vary acrossentrepreneurs.
1940 the land stock is the same in the two countries and, hence, labor productivity inagriculture is equal. Therefore, workers in New Zealand earn a higher wage which trans-lates in a larger variety of manufactured goods demanded. Thus, more artisans becomesentrepreneurs and make positive pro�ts. These e�ects further foster industrializationand growth in New Zealand. They can be easily seen by slightly modifying Figure 5:QL is larger and QR is smaller while entrepreneurs' demand for manufactures expandsfor most commodities.18
In conclusion, the predictions of our model are consistent with the facts reported insection 2 and 3.19 In 1870 the similarities between Uruguay and New Zealand would
18Note that a reduction of entrepreneurs' demand is possible for some commodities produced with theIT because a greater � may imply a lower income for some entrepreneur. More precisely, a greater �reduces the variety of commodities demanded by landowners and, hence, the revenue of some producers.However, this is always more than compensated by the extra revenue of the remaining entrepreneurs.
19Note that under assumption (i) , (ii) and (iii) the predicted rental-wage ratio in New Zealandis systematically lower than that predicted under (i) and (ii). Therefore, perfect convergence of therental-wage ratios is lost. However, under these three assumptions, the two ratios become more andmore similar between 1870 and 1940. We do not believe that this is an issue. As already noted insection 2, data on the rental-wage ratios may not be fully comparable because absolute values may notbe comparable. Therefore, the important feature to match is the fact that the rental/wage ratio in
22
have suggested that, if anything, Uruguay was hardly going to perform worse than NewZealand. However, we have shown that the important institutional di�erences in theagricultural sector had the potential to generate the subsequent observed divergence.
5 Final Remarks
In this paper we have proposed a model of early industrialization which provides a the-oretical argument for the di�erent economic performances of New Zealand and Uruguaybetween 1870 and 1940. More precisely, we advanced the idea that di�erences in agri-cultural institutions a�ected industrial development and growth.
We have also provided supportive historical evidence. Indeed, though similar undermany respects, Uruguay and New Zealand showed substantial di�erences in the insti-tutions governing both access to land and distribution of agricultural product. In NewZealand the Crown adopted a policy that strongly facilitated the access to land to whitecolonizers and European descendants. This in turn allowed an increasing number oflandowners, which expanded along with immigration and population growth. Instead,in Uruguay land was heavily concentrated in the hands of a small group of landownersthat bene�ted from massive transfers of public lands. Moreover, Uruguayan landownershad been granted a larger share of the agricultural product than their New Zealandercounterparts.
Our model suggests that the gap in industrial development and GDP per capita maybe linked to such institutional di�erences. The basic intuition is that New Zealand'sinstitutions have generated a more equal distribution of both land ownership and agri-cultural product. This in turn has produced a larger domestic demand for basic manu-factures which has fostered New Zealand's industrial production and GDP.
We recognize that our model abstracts form many other plausible di�erences betweenthe two countries. Of course, we do not claim that such other di�erences did not playany role. Actually, we believe that there are several additional factors that might havea�ected the evolution of the economies under consideration, not least the internationalenvironment to which they were exposed. A few remarks in this regard are worthdoing. One potential limitation of our model is the absence of international trade, sinceboth New Zealand and Uruguay were well integrated in the international trade system.However, we claim that this is not a serious problem. As we pointed out in section 2,both countries had been almost exclusively exporters of non-industrial goods. Therefore,the qualitative results and the predictions of our model are not a�ected if we allow forinternational trade { at least if shocks in prices are supposed to have similar impacts onthe two economies.
Another potential limitation is that we abstracted from credit markets and, hence,from the role of credit rationing. Indeed, the possibility of using land as collateral inthe credit market may have created relevant asymmetries in terms of access to credit(Deininger and Squire, 1996). One would expect that, thank to land ownership, New
Uruguay performed worse than in New Zealand and not that the two ratios had become almost equalin 1940.
23

Zealand's farmers have had a much easier time in obtaining credit than their Uruguayancounterparts.20 However, this argument does not seem to contrast ours. If anything, itreinforces the idea that a more equal distribution of land ownership is likely to providea better ground for industrialization.
Appendix: Sources for the estimation of the Agricultural
Product, Wages and Land Rent
New Zealand The estimation of total wages in New Zealand was based on:
1. Time series for the wages of rural workers as provided by Briggs (2003) (who in turn usedBloom�eld (1984) series computed from census data).
2. Wages of rural workers obtained from Greasley and Oxley (1998, 2003).
The estimation of total rents was based on:
1. Land prices taken from Prichard (1970); Greasley and Oxley (2003). The series of the latterauthors are de ated by the IPC series produced by Briggs (2003);
2. Total land occupied and exploited each year, identifying public and private lands in the total, aspublished by Prichard (1970).
The estimation of the agrarian product was drawn from Hawke (1985); Prichard (1970).
Uruguay The estimation of total wages was based on:
1. Series for rural workers elaborated on the basis of the CIDE (1967), Anuario Estad��stico (1938),Censos Agropecuarios (1908, 1916, 1930, 1937 y 1943); and the series elaborated by Ardente et al.(2004); B�ertola (2005).
2. Wages series of rural workers estimated by B�ertola et al. (1998); B�ertola (2005); Ardente et al.(2004).
The estimation of the volume of the land rent was based on:
1. Time series data for land prices provided by the PHES data bank, elaborated from Barr�an andNahum (s/f, 319) for the period (1886-1895); Barr�an and Nahum (1973) for the period 1896-1905;Barr�an and Nahum (1978) for the period 1906-1913; Balbis (1995) for the period 1916 and 1930;Vigorito and Reig (1986) for the period 1931-40.
2. Prices for rural leasing elaborated on the basis of PHS databank; Moraes (2001); Barr�an andNahum (1971) for the years 1908-1911; BROU (1933) for the years 1916 and 1930;Jacob (1981)for the year 1940.
The estimation of the agrarian output was based on B�ertola et al. (1998) Bertino and Tajam (1999)and B�ertola (2005).
20Actually, in New Zealand a speci�c institution { the stock and station agent { provided long termcredit for buying land and equipment, as well as information about external markets, and legal andtechnical assistance to farmers (Ville, 2000). The situation in Uruguay was quite di�erent in thisrespect.
24
References
Acemoglu, D., D. Johnson, and J. Robinson (2001). \The Colonial Origins of Comparative Development:An Empirical Investigation". American Economic Review (91), 369{401.
�Alvarez, J. (2005). \Crescimento Econ�omico, Distribuci�on del Ingreso e Instituciones. una MiradaComparada: Nueva Zelanda y Uruguay (1870 - 1940)". Boleti��n de AUDHE (Asociaci�on Uruguayade Historia Econ�omica) 3 (4), Montevideo.
�Alvarez, J. and I. Bortagaray (2007). \El Marco Institucional de la Innovaci�on Agropecuaria en el LargoPlazo". in Primos Ricos y Empobrecidos: Crecimiento, Distribuci�on del Ingreso e Instituciones enAustralia-Nueva Zelanda versus Argentina-Uruguay (eds. �Alvarez, J.; B�ertola, L. and Porcile, G.).
Ardente, A., F. D��az, and T. Rossi (2004). \Crescimento Econ�omico y Distribuci�on del Ingreso elUruguay". Decon. Fcs. Udelar. 10 (04), (Montevideo).
Balbis, J. (1995). \La Evoluci�on del Precio de la Tierra en Uruguay (1914-1924)". Quantum 2 (5),114{141.
Barr�an, J. P. and B. Nahum (1967). Historia Rural del Uruguay Moderno. Tomo I (1851 - 1885).Montevideo: Ed. Banda Oriental.
Barr�an, J. P. and B. Nahum (1971). Historia Rural del Uruguay Moderno. Tomo II (1886 - 1894).Montevideo: Ed. Banda Oriental.
Barr�an, J. P. and B. Nahum (1972). Historia Rural del Uruguay Moderno. Tomo III (1895 - 1904).Montevideo: Ed. Banda Oriental.
Barr�an, J. P. and B. Nahum (1973). Historia Rural del Uruguay Moderno. Tomo IV, Historia social delas revoluciones de 1897 - 1904. Montevideo: Ed. Banda Oriental.
Barr�an, J. P. and B. Nahum (1977). Agricultura, Cr�edito y Transporte Bajo Batlle (1905-1914), HistoriaRural de Uruguay Moderno, Tomo VI. Montevideo: Ed. Banda Oriental.
Barr�an, J. P. and B. Nahum (1978). La Civilizaci�on Ganadera Bajo Batlle (1905-1914), Historia Ruralde Uruguay Moderno, Tomo VII. Montevideo: Ed. Banda Oriental.
Bertino, M. and H. Tajam (1999). El PBI del Uruguay. 1900 - 1955. Instituto de Econom��a. Montevideo:Facultad de Ciencias Econ�omicas y Administraci�on.
Bertocchi, G. (2004). \The Law of Primogeniture and the Transition from Landed Aristocracy toIndustrial Democracy". CEPR Discussion Paper (3723).
B�ertola, L. (2005). A 50 a~nos de la curva de Kuznets: crecimiento econ�omico y distribuci�on del ingresoen Uruguay y otras econom��as de nuevo asentamiento desde 1870. Madrid: En Investigaciones deHistoria Econ�omica.
B�ertola, L., L. Calicchio, M. Camou, and G. Porcile (1998). Southern Cone Real Wages Compared: aPurchasing Power Parity. Approach to Convergence and Divergence Trends, 1870-1996. Facultad deCiencias Sociales, Montevideo: DT 43, Unidad Multidisciplinaria,.
B�ertola, L. and G. Porcile (2002). \Rich and impoverished cousins: economic performance an incomedistribution in southern settler societies". paper presented to the XIII Internation Economic HistoryCongress.
Bilancini, E. and S. D'Alessandro (2008a). \Distribution of Agricultural Surplus and Industrial Take-o�". in Geography and Structural Change in Development: Theory and Empirics (Edited by P.Commendatore, N. Salvadori and M. Tamberi), Cheltenham, UK: Edward Elgar forthcoming.
25

Bilancini, E. and S. D'Alessandro (2008b). \Functional Distribution, Land Ownership and IndustrialTakeo�: The Role of E�ective Demand". The B.E. Journal of Economic Analysis & Policy, Contri-butions 8 (1), art.34.
Blattman, C., J. Hwang, and J. Williamson (2007). \Winners and losers in the commodity lottery: Theimpact of terms of trade growth and volatility in the Periphery 1870-1939". Journal of DevelopmentEconomics (82), 156{179.
Bloom�eld, G. T. (1984). A Handbook of New Zealand Statistics. Boston: Hall & Co.
Briggs, P. (2003). Looking at the number. A view of New Zealand economic history. Wellington: NZIER.
BROU (1933). Sinopsis econ�omico �nanciera de la Rep�ublica Oriental del Uruguay. Montevideo: Secci�onestad��stica.
CIDE, O. (1967). Estudio Econ�omico y Social de la Agricultura en el Uruguay (1967), Tomo I and II -Plan Nacional de Desarrollo Econ�omico y Social. Montevideo: Ministerio de Ganader��a y Agricultura.
Davie, F. (1960). El Ejemplo de Nueva Zelana. Montevideo: Juan A. Peri.
Deininger, K. and L. Squire (1996). \Measuring Income Inequality: a New Data-Base". World BankEconomic Review 10 (3), 565{591.
Denoon, D. (1983). Settler Capitalism: The Dynamics of Dependent Development in the SouthernHemisphere. Oxford: Clarendon University Press.
Duncan, T. and J. Fogarthy (1984). Australia and Argentina: On Parallel Paths. Melbourne: MelbourneUniversity Press.
Engerman, S. L. and K. L. Sokolo� (1997). \Factor Endowments, Institutions and Di�erential Paths ofGrowth Among New World Economies: A View From Economic Historians of the United States". inHow Latin America Fell Venid (eds. in Haber, S.), 260{304.
Engerman, S. L. and K. L. Sokolo� (2005). \The Evolution of Su�rage Institutions in the New World".Journal of Economic History (65), 891{921.
Franco, G. V. (1968). Ingleses, ferrocarriles y frigor���cos. Montevideo: Enciclopedia Uruguaya, Ed.Arca.
Galor, O., O. Moav, and D. Vollrath (2008). \Inequality in Land Ownership, the Emergence of HumanCapital Promoting Institutions, and the Great Divergence". Review of Economic Studies 75.
Greasley, D. and L. Oxley (1998). \A Tale of Two Dominions: Comparing the Macroeconomic Recordsof Australia and Canada since 1870". Economic History Review 51 (2), 294{318.
Greasley, D. and L. Oxley (2003). \growth and distribution: New zealand land prices and real wages inthe refrigeration era". Mimeo, University of Western Australia.
Greasley, D. and L. Oxley (2008). \the pastoral boom and long swings in new zealand economicgrowth: explaining the long depression of the 1920s". Working Papers in Economics University ofCanterbury(08/02).
Hawke, G. (1985). The Making of New Zealand. An Economic History. Cambridge: Cambridge Univer-sity Press.
Hawke, G. (1999). \Visionaries, Farmers and Markets: an Economic History of New Zealand Agricul-ture". Presented to the 43rd Annual Conference of the Australian Agricultural and Resource EconomicSociety Chirstchurch, New Zealand.
26
I.B.R.D./F.A.O. (1951). The Agricultural Development of Uruguay. Washington and Rome.
Jacob, R. (1969). Consecuencias sociales del alambramiento (1872-1880). Montevideo: Ed. EBO.
Jacob, R. (1981). Uruguay 1929 - 1938: depresi�on ganadera y desarrollo fabril. Montevideo: Ed. FCU.
Keall, R. D. (2000). \New Zealand". American Journal of Economics and Sociology 59 (5), 417{438.
Kenwood, G. and A. L. Lougheed (1990). The Growth of the International Economy 1820-1990. London& New York: Routledge.
Kirby, J. (1975). \On the Viability of Small Countries: Uruguay and New Zealand Compared". Journalof Interamerican Studies and World A�air 17 (3), 259{280.
Maddison, A. (2003). The world economy. A Millenial Perspective. Paris, France: OECD.
Margo, R. (1999). \Regional Wage Gaps and the Settlements of the Middwest". Explorations inEconomic History (36), 128{143.
Millot, J. and M. Bertino (1996). Historia Econ�omica del Uruguay. Montevideo: Ed. Fundaci�on deCultura Universitaria.
Moraes, I. (2001). Las determinantes tecnol�ogicas e institucionales del desempe~no ganadero en el largoplazo, 1870-1970. Universidad de la Rep�ublica, Montevideo: Tesis de maestr��a. UM. PHES.
Murphy, K. M., A. Shleifer, and R. W. Vishny (1989). \Income Distribution, Market Size, and Indus-trialization". Quarterly Journal of Economics 104, 537{564.
Prichard, L. (1970). An economic history of New Zealand to 1939. Auckland and London: Collins.
Vigorito, R. and N. Reig (1986). Excedente ganadero y renta de la tierra. Uruguay 1930 - 1970. Mon-tevideo: Ed. Banda Oriental.
Ville, S. (2000). The Rural Entrepreneurs. Cambridge: Cambridge University Press.
Willebald, H. (2007). \Desigualdad, Desempe~no y Especializaci�on: Una Panor�Amica Hist�orico-Comparada de las Econom��as Templadas de Nuevo Asentamiento". in Primos Ricos y Empobrecidos:Crecimiento, Distribuci�on del Ingreso e Instituciones en Australia-Nueva Zelanda versus Argentina-Uruguay (eds. �Alvarez, J.; B�ertola, L. and Porcile, G.).
Willebald, H. and L. B�ertola (2007). \Distribution, Structural Change and Economic Performance inSettler Societies, 1870-2000". mimeo, Universidad de la Rep�ublica, Uruguay .
Williamson, J. (2002). \Land, Labour and Globalization in the Pre-industrial Thirld World 1870 -1940".Journal of Economic History 62 (1), 55{85.
27