Agricultural Bias in Focus - iisd.org
26
Agricultural Bias in Focus Sofia Baliño, David Laborde, Sophia Murphy, Marie Parent, Carin Smaller and Fousseini Traoré September 2019
Transcript of Agricultural Bias in Focus - iisd.org

Agricultural Bias in Focus
Sofia Balintildeo David Laborde Sophia Murphy Marie Parent Carin Smaller and Fousseini Traoreacute
September 2019
2 AGRICULTURAL BIAS IN FOCUS
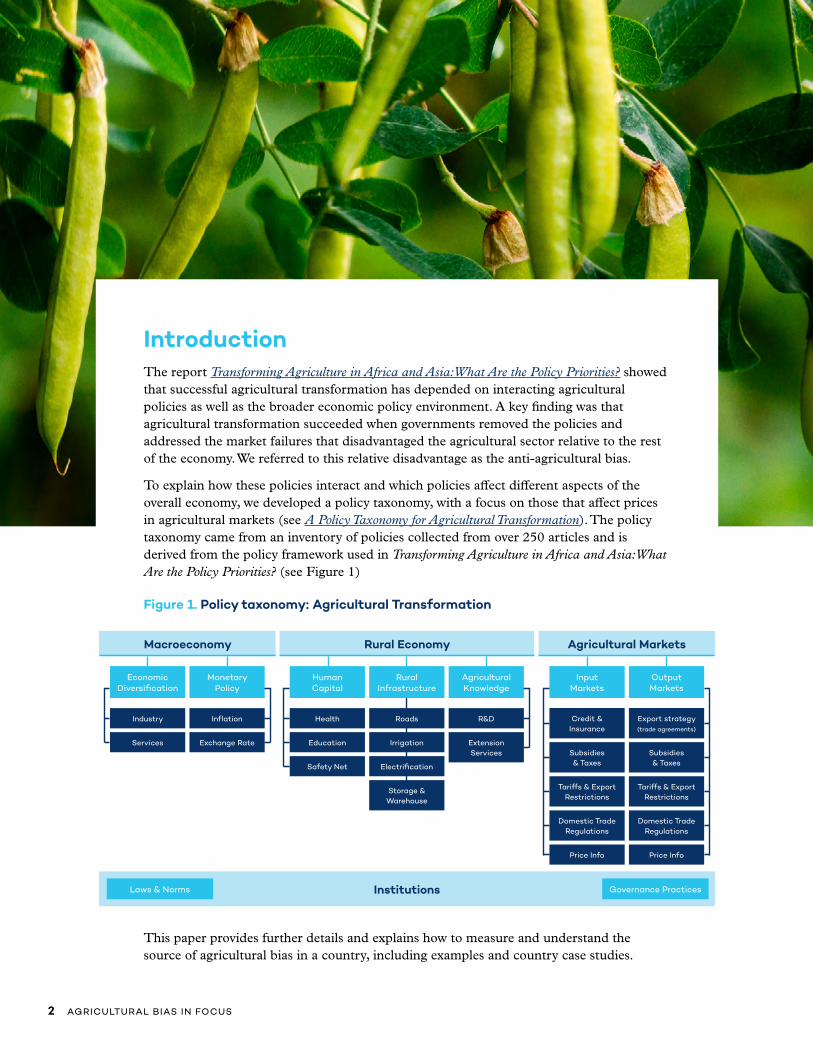
IntroductionThe report Transforming Agriculture in Africa and Asia What Are the Policy Priorities showed that successful agricultural transformation has depended on interacting agricultural policies as well as the broader economic policy environment A key finding was that agricultural transformation succeeded when governments removed the policies and addressed the market failures that disadvantaged the agricultural sector relative to the rest of the economy We referred to this relative disadvantage as the anti-agricultural bias
To explain how these policies interact and which policies affect different aspects of the overall economy we developed a policy taxonomy with a focus on those that affect prices in agricultural markets (see A Policy Taxonomy for Agricultural Transformation) The policy taxonomy came from an inventory of policies collected from over 250 articles and is derived from the policy framework used in Transforming Agriculture in Africa and Asia What Are the Policy Priorities (see Figure 1)
Figure 1 Policy taxonomy Agricultural Transformation
This paper provides further details and explains how to measure and understand the source of agricultural bias in a country including examples and country case studies
Policy taxonomy agricultural transformation
Institutions
Health RampDRoads
Education Extension Services
Irrigation
Safety Net Electrifi cation
Storage amp Warehouse
Human Capital
Rural Infrastructure
Agricultural Knowledge
Rural Economy
Industry Infl ation
Services Exchange Rate
Economic Diversifi cation
Monetary Policy
Macroeconomy Agricultural Markets
Input Markets
Credit amp Insurance
Export strategy (trade agreements)
Subsidies amp Taxes
Subsidies amp Taxes
Tariffs amp Export Restrictions
Domestic Trade Regulations
Tariffs amp Export Restrictions
Domestic Trade Regulations
Price Info Price Info
Output Markets
Laws amp Norms Governance Practices
AGRICULTURAL BIAS IN FOCUS 3
1 How to Measure the Anti-Agricultural BiasEconomists have developed the following indicators to quantify the anti-agricultural bias concept (Balassa 1965 Corden 1966)
1 The Nominal Rate of Protection This indicator compares the farm gate price for a commodity to a reference price usually based on the world price If the farm gate price is higher a positive agricultural bias exists If the farm gate price is lower accounting for transportation and other normal marketing costs then farmers are facing disincentives to produce that commodity which contributes to an anti-agricultural bias The effect is comparable to that of an indirect tax on a producerrsquos profit compared to what they would earn if they were operating freely on world markets This metric is heavily affected by agricultural trade policies In most developing countries where domestic support to agriculture is minimal the nominal rate of protection is a good proxy for measuring the direct incentives perceived by farmers where farm gate prices remain the main signal for their production choice
2 The Nominal Rate of Assistance This indicator is more complex It looks beyond market prices to include the various taxes farmers pay and the subsidies they receive as these also affect farmersrsquo production decisions The nominal rate of assistance includes the nominal rate of protection plus or minus the subsidies received or taxes paid The result is a more comprehensive metric of the level of bias In most OECD countries the nominal rate of protection has been reduced in the last 30 years but many farmers enjoy a relatively high nominal rate of assistance due to the existence of various subsidies and other transfer payments
3 The Relative Rate of Assistance This indicator compares the rate of assistance in agriculture to the rate of assistance in the rest of the economy It provides a measure that compares agriculture to other sectors showing the actual and combined effects of incentives faced by farmers It captures the anti-agricultural bias in a true general equilibrium framework where economic agents have to decide in which activity they will work and invest
4 Effective Rate of Protection This indicator aims to track normally at the commodity level the net effects of various policies on farm value added1 It compares the distortions on farm output and input agent prices looking at the
1 The difference between farm production value and intermediate consumption
4 AGRICULTURAL BIAS IN FOCUS
actual cost structure for farmers It combines data and concepts from the three previous indicators It can be used to monitor the anti-agricultural bias in a partial equilibrium framework and is rarely used to look at long-term agricultural transformation Its value lies in its strong explanatory power when analyzing value chain development
Figure 2 shows the relationship between the main indicators for measuring the anti-agricultural bias and the biasrsquos link to policies Practically to assess the level of the anti-agricultural bias we start by comparing prices for a given commodity in-country with a reference price This allows us to compute the nominal rate of protection International market prices are commonly used as the reference even though they are also to some extent distorted by policy interventions More detail is available in Part 4 Defining Prices
Figure 2 Measuring the Relative Rate of Assistance main indicators and linkages with the policy space
Source Authorsrsquo design
Why are subsidies in the non-agriculture sector not included in the calculation of the nominal rate of assistance in non-agriculture The primary reason for this omission is that an inventory of these subsidies would be impractical given the vast scope of products and sectors that fall within the overarching heading of non-agriculture The effect of not including these subsidies likely means that we underestimate the anti-agricultural bias
Under normal conditions both the nominal rate of protection and the relative rate of assistance are lower than the nominal rate of assistance Historically developing countries (Anderson 2009) would often implement measures that in practice taxed rather than protected their agriculture sector while providing extensive protection to industry This meant they had a larger relative anti-agricultural bias as shown by providing industry a higher rate of assistance than their farm sectors Over time this trend has been reversed in transforming or transformed economies (AgIncentives nd Tsakok 2011) In the countries that have transformed the most such as Brazil they now use a small amount of border protection reinforced with farm subsidies (a pro-agricultural bias) (See Figure 3 for a subset of countries belonging to various stages of agricultural transformation as defined in Laborde et al [2017])
Agriculture
Pol
icie
sIn
dica
tors
Nominal Rate of Assistance in Agriculture
Non-Agriculture
Nominal Rate of Assistance in
Non-Agriculture
Nominal Rate of Protection in Agriculture Relative Rate of
Assistance in Agriculture
Import Taxes amp Export Taxes
SubsidiesImport Taxes amp Export Taxes
AGRICULTURAL BIAS IN FOCUS 5
Figure 3 Evolution of the anti-agricultural bias over time and phases of agricultural transformation Brazil Ghana Tanzania United States
The different indicators used to measure the anti-agricultural bias are useful to understand the political economy of policy reform On the one hand changes in the nominal rate of protection involve a redistribution of real income between consumers of these agricultural goods and producers of the same policies that keep farm gate prices low are bad for these producers and good for these buyers On the other hand changes in the nominal rate of assistance could come from a change in the level of protection or in the various taxes paid by farmers or subsidies received by them In this case there is a redistribution between agricultural producers and taxpayers2
It is important to note that these indicators measure solely the biasrsquos extent rather than its source Understanding the cause of the bias and developing a menu of policy options requires further information and analysis
2 Due to the heterogeneity of households and their individual contribution to tax revenue but also their exposure to food prices it is important to differentiate between taxpayers and consumers Rich households spend a tiny fraction of their income on food products but contribute largely to public finance both in absolute and relative terms while very poor household spend most of their income on food products but have no or very limitedmdashmainly through indirect taxationmdashcontribution to public finance
-90
-70
-50
-30
-10
10
30
5019
74-1
976
1989
-19
91
200
4-2
00
6
1974
-19
76
1989
-19
91
200
4-2
00
6
1974
-19
76
1989
-19
91
200
4-2
00
6
1974
-19
76
1989
-19
91
200
4-2
00
6
Brazil Ghana Tanzania USA
Nominal Rate of Protection Agriculture
Nominal Rate of Assistance Manufacture
Nominal Rate of Assistance Agriculture
Relative Rate of Assistance
1 1 1 12 23 3 3 5 5 5
Ag
ricu
lura
lTr
ansf
orm
atio
nS
tage
Industrialized Economies
Moving Labour Outof Agriculture
Agriculture as aContributor to Growth
Agriculture Integrated Into the Macro Economy
Getting Agriculture Moving
Subsistence Agriculture
1
2
3
4
5
6
6 AGRICULTURAL BIAS IN FOCUS
2 Policies That Drive Anti-Agricultural BiasA broad range of policies drive a countryrsquos agricultural bias Table 1 shows a non-exhaustive list of the policies that are included in the measurement directly or indirectly of the anti-agricultural bias
Table 1 Sources of Anti-Agricultural Bias What policies are included
Source Authorsrsquo design
Nominal Rate of
Protection
Nominal Rate of
Assistance
Relative Rate of
Assistance
Relevant but not included in indicators
Import taxessubsidiesquotasbans
Export taxessubsidiesquotasbans
Commodity boards
Intervention prices
Production subsidies
Input subsidies
Subsidized credit amp insurance
Quota fees
Income support to farmers and social safety nets
sometimes sometimes
Payments for ecosystem services sometimes sometimes
Agricultural RampD sometimes sometimes
Public investments in improved storage amp marketing (off-farm)
sometimes sometimes
Non-agricultural import taxessubsidies
Non-agricultural export taxessubsidies
Non-agricultural non-tariff barriers
Subsidies to the industrial sector
Food subsidies
Biofuel policies
Land reform
Public spending in rural infrastructure health and education
AGRICULTURAL BIAS IN FOCUS 7
Most of these policies affect agricultural markets directly on either the output or input side Figure 4 shows the policies that drive a countryrsquos agricultural bias While these are representative examples they are not necessarily exhaustive The darker the shade of blue for the policy the more direct the impact is on the agricultural bias while the lighter shades are for policies that have less impact The boxes in greymdashwhile having an impact on farmers and rural household livelihoodsmdashhave a very limited and indirect impact on anti-agricultural bias
The policies that affect agricultural bias have evolved over time Historically developing economies tended to tax their domestic agricultural sectors while advanced economies subsidized their farmers This trend started to shift in the 1980s as structural adjustment policies in developing economies ended both many of the de facto taxes on agriculture and the subsidies that had favoured industry (Tsakok 2011 Anderson amp Valdes 2008 Anderson amp Martin 2009) Developed countries also cut back on the use of border measures to protect agriculture as well as their use of direct price supports which combined to reduce the level of distortion on prices in international markets to the benefit of agriculture in developing countries
Figure 4 Sources of the anti-agricultural bias historical overview
Source Authorsrsquo design
The anti-agricultural bias historical
Health RampDRoads
Education Extension Services
Irrigation
Safety Net Electrifi cation
Storage amp Warehouse
Human Capital
Rural Infrastructure
Agricultural Knowledge
Rural Economy
Industry Infl ation
Services Exchange Rate
Economic Diversifi cation
Monetary Policy
Macroeconomy Agricultural Markets
InstitutionsLaws amp Norms Governance Practices
Input Markets
Credit amp Insurance
Export strategy (trade agreements)
Subsidies amp Taxes
Subsidies amp Taxes
Tariffs amp Export Restrictions
Domestic Trade Regulations
Tariffs amp Export Restrictions
Domestic Trade Regulations
Price Info Price Info
Output Markets
8 AGRICULTURAL BIAS IN FOCUS
Today the anti-agricultural bias that exists in the countries reviewed in the report Transforming Agriculture in Africa and Asia What are the policy priorities and which have not yet transformed their agricultural sectors comes mainly from market failures Some of these failures are due to policies that distort agricultural markets while others relate to an absence of policies that disadvantage small-scale producers and do not allow markets to operate efficiently (see Figure 5)3
Figure 5 Sources of the anti-agricultural bias present
Source Authorsrsquo design
3 In order to operate efficiently markets require a number of regulations (intellectual property rights competition policy) and institutions (eg for contract enforcement) In less advanced economies some of these market regulationsmdashand the institutions required to enforce themmdashare weak and contribute to declining farmer welfare especially for smallholders who lack economic and political power
The anti-agricultural bias present
Industry Infl ation
Services Exchange Rate
Economic Diversifi cation
Monetary Policy
Macroeconomy Agricultural Markets
Health RampDRoads
Education Extension Services
Irrigation
Safety Net Electrifi cation
Storage amp Warehouse
Human Capital
Rural Infrastructure
Agricultural Knowledge
Rural Economy
InstitutionsLaws amp Norms Governance Practices
Input Markets
Credit amp Insurance
Export strategy (trade agreements)
Subsidies amp Taxes
Subsidies amp Taxes
Tariffs amp Export Restrictions
Domestic Trade Regulations
Tariffs amp Export Restrictions
Domestic Trade Regulations
Price Info Price Info
Output Markets
AGRICULTURAL BIAS IN FOCUS 9
3 Examples of Agricultural Bias in an EconomyThis section shows how various policies located in different policy categories jointly affect the assessment of the level and direction of agricultural bias in a given economy The examples below include the assumption that all other things remain equal within that same economymdashwhat is known in economics as ceteris paribus
Case A Agricultural import tariff
Scenario Agriculture is the only sector protected using import tariffs
Agricultural markets
Input markets
Credit amp insurance
Subsidies and taxes
Tariffs and export taxes
Agricultural tariff (output) 10
Price information
Output markets
Export strategy X
In this first case the agricultural sector is singled out for protection which creates a pro-agricultural bias for the producer The tariff protects domestic farmers by increasing domestic prices by 10 per cent compared to international prices Its effect is to limit the possibility of a larger influx of lower-priced imports which would otherwise drive down domestic prices and make it harder for that countryrsquos producers to compete The result is a price benefit for domestic agricultural producers though it penalizes consumers of those products We can express the pro-agricultural bias in mathematical terms showing a net result that is greater than 0 which indicates a positive bias for agriculture
Relative Rate of Assistance = - 1 = 10 gt 01 + 10
1 + 0
10 AGRICULTURAL BIAS IN FOCUS
Case B Agricultural import tariff plus input subsidies
Scenario Agriculture is protected with tariffs and supported with a fertilizer subsidy
Agricultural markets
Input markets
Credit amp insurance
Subsidies and taxes
Fertilizer subsidy 5
Tariffs and export taxes
Agricultural tariff (output) 10
Price information
Output markets
Export strategy X
We assume that the value of the subsidy is equivalent to 5 per cent of farmer sales
Case B builds on Case A by adding a fertilizer subsidy The policy mix provides an additional incentive for producers by reducing their production costs The cost is borne by taxpayers while consumers do not pay more for their food The result is a stronger pro-agricultural bias
Relative Rate of Assistance = - 1 = 15 gt 01 + 10 + 5
1 + 0
AGRICULTURAL BIAS IN FOCUS 11
Case C Agricultural import tariff input subsidies and industrial tariffs
Scenario Agriculture is less protected than the rest of the economy but still subsidized
Macroeconomy
Monetary policy
Inflation
Exchange rate
Economic diversification
Industry Industrial tariff 20
Services
Agricultural markets
Input markets
Credit amp insurance
Subsidies and taxes
Fertilizer subsidy 5
Tariffs and export taxes
Agricultural tariff (output) 10Industrial tariff (input) 20
Price information
Output markets
Export strategy X
In Case C several policies interact though at times they do so in opposite directions Agriculture still benefits from a 10 per cent tariff and a fertilizer subsidy This scenario also includes policies specific to non-agricultural products Industrial goods are also protected and at a higher level than agriculture with tariffs of 20 per cent
For domestic agricultural producers these industrial goods include inputs such as tractors which they require for farm production while their outputs are not as well protected from foreign competition as industrial goods are This leaves agriculture less well-off compared to non-agricultural sectors It also makes agriculture less appealing to investors than the rest of the economy The policies combine to produce a negative (or anti)-agricultural bias In mathematical terms the net outcome for the producer is a rate of assistance that is less than zero
Relative Rate of Assistance = - 1 = -42 gt 01 + 10 + 5
1 + 20
12 AGRICULTURAL BIAS IN FOCUS
4 Defining PricesPrices are a crucial part of understanding agricultural transformation There are different types of prices at play and which price is being observed when making policy choices is crucial For example the market price is easy to observe but often agents (farmers or buyers) are responding not only to that price signal but also to other factors such as a subsidy incentive program or tax These other factors modify the agentrsquos expectations and create what economists call the agentrsquos price The agentrsquos price is a better predictor of how agents will behave than the market price
Similarly the world price is a vital measure in economic analysis but it is also in important ways a fiction The world price is not a price that actual buyers and sellers expect in their market there is no single ldquoworld marketrdquo where we can observe prices Instead we pick a proxy using a large trading centre such as the Kansas price for a fixed grade and variety of wheat based on the International Monetary Fundrsquos [IMFrsquos] commodity price monitoring Another option involves deriving a proxy price using an average of prices from several centres Here we introduce some different prices to highlight what each can tell an observer (see Figure 6)
Market PricesThe market price is the price paid by a buyer to a seller in an open transaction A market price can be distorted by market failures or policy interventions or it can be relatively undistorted It is the price arrived at by two independent actors operating broadly in conditions of good information on available supply and demand and acting without duress and under the protection of rules that are known and enforced Different markets might have different prices for the same good depending on where the market is located for example if is international or local or if the market is wholesale or retail Changes in market prices directly impact the welfare of both buyers and sellers
Photo Courtesy of Jonathan TorgovnikGetty Images Reportage
AGRICULTURAL BIAS IN FOCUS 13
Agent PricesEconomic agents make their production and consumption decisions based not only market prices but also on what economists call the ldquoagentrsquos pricerdquo An agent is either the buyer or the seller in agriculture typically the producer or consumer Agent prices capture the actual cost paid andor benefits received by economic agents including any policies that modify the market price such as taxes or subsidies For example a consumer who receives a food stamp to spend at a food market has more purchasing power and can pay more than a consumer who does not The producer benefits from this Not all of these non-market factors are policy-based gender race caste and age can all change the price an agent is willing or expected to pay
Farm Gate PricesThe farm gate price is the price the farmer receives upon selling their product It is one of various prices along the value chain Other prices in the chain include the price that incorporates the cost of transportation to the export market or processor the price paid on the wholesale market the price at a terminal port if the commodity is to be exported and the price paid by a contract holder on a futures exchange
50
100
200
300
400500
1000
1400
1996
199
7
1998
199
9
200
0
200
1
200
2
200
3
200
4
200
5
200
6
200
7
200
8
200
9
2010
2011
2012
2013
2014
2015
Pri
ce C
urre
nt U
SD
(log
sca
le)
Domestic Agent (producer) Price at Farm Gate Domestic Market Price at Farm Gate
Global Wheat Price (Source IMF) Wheat World Price (Source Comtrade)
Differences in various concepts of world prices
Difference between
world and domestic
prices
Farm gate pricesdifference between agent
and market prices
Figure 6 Price case study ndash wheatSource Authorsrsquo compilation of data sources1 Authorsrsquo computation based on OECD Japan PSE database 2 International Monetary Fund based on Wheat No1 Hard Red Winter ordinary protein Kansas City USDmetric ton May 1 20193 Authorsrsquo computation based on UN COMTRADE retrieved from WITS May 1 2019
The graph compares the evolution of world price with farm gate prices The two world prices show similar dynamics but diverge during specific years when US market dynamics differ from other main exporters (The International Monetary Fundrsquos [IMFrsquos] global wheat price uses Kansas prices as their proxy while we use Comtrade to derive a composite of different market prices to create an average price) The two farm gate prices show the difference between agent and market prices over time As a country shifts from tariff protection to subsidies the market price comes closer to the world price but the gap between the producer (agent) and market prices persists Current USD means the current year of the data point
14 AGRICULTURAL BIAS IN FOCUS
World PricesThere are several ways to derive a world price such as by dividing the value of trade flows of a commodity by the quantity traded The result is a unit value or nominal price per given unit Examples of such units include bushels or tonnes No specific transaction in the world is made at this price but it provides an average price that can serve as a reference such as when measuring agricultural distortions in domestic markets Another common way to identify a world price for heavily traded commodities is to use the spot price or a futures price on a given exchange such as Chicago or London or at a large export or delivery facility such as New Orleans or Rotterdam For commodities like rice that are not heavily traded or are traded in more dispersed markets the price at a central trading place might not be relevant Some commodities such as dairy products are particularly distorted by national policies in major markets and trading places In this case New Zealandrsquos export price provides the world price reference since it is a relatively undistorted producer and major exporter
Photo Courtesy of Jonathan TorgovnikGetty Images Reportage
AGRICULTURAL BIAS IN FOCUS 15
5 Country Case Studies
The country case studies revisit the findings of Transforming Agriculture in Africa and Asia What Are the Policy Priorities to identify key policy sources of anti-agricultural bias for 12 countries that have yet to realize inclusive agricultural transformation These countries are Burkina Faso Ethiopia India Kenya Malawi Mali Mozambique Rwanda Tanzania Uganda Zambia and Zimbabwe We limit the list to countries where data availability allows us to provide a more granular assessmentmdashqualitatively and quantitativelymdashof the drivers of anti-agricultural bias
As noted previously while indicators and methods exist to measure the degree of anti-agricultural bias these indicators themselves do not pinpoint the causes of the problem4 Indeed a contributing factor toward a negative relative rate of assistance measurement could be the result of the presence of a detrimental policy or the absencemdashby design or oversightmdashof a basic policy that is a foundation of a well-functioning market To diagnose the cause of a positive or negative agricultural bias requires answering the following questions
1 Does the negative relative rate of assistance in agriculture mainly originate from policies tied to the agricultural sector or the non-agricultural sector This question is answered by comparing the nominal rate of assistance in agriculture to that in industry5
2 When focusing on agricultural policies especially when the nominal rate of assistance is negative are the main distortions andor incentives homogenously distributed across commodities or are they concentrated in a few products Since the main source of a negative rate of assistance in agriculture tends to be a negative rate of protection we check to see if this indicator points us to a particular agricultural commodity If distortions appear to be homogenous rather than concentrated on a few products what are the systemic market or policy failures faced by the agricultural sector overall
3 After having identified the most positively or negatively distorted commodities which actual policies targeting these commodities best explain the results
4 If these policies are changing over time to what extent are they contingent measures rather than long-term choices
4 For more on measurements of anti-agricultural bias including relative rate of assistance and nominal rate of assistance please see the introductory materials in this series5 For non-agricultural goods it is standard practice to focus on trade policies and mainly import tariffs for industrial goods when assessing the nominal rate of assistance for these sectors
The work in this section is based on various quantitative and qualitative sources including press releases documenting policy reforms The main quantitative source involves a dataset published by the Ag-Incentives Consortium (wwwag-incentivesorg) and primarily collected by the Monitoring and Analysing Food and Agricultural Policies (MAFAP) program of the Food and Agriculture Organization of the United Nations (FAO) MAFAP collects agricultural policy data and the program also has various monitoring and analytical pieces at the country level This data has allowed us to review and track how policies change across countries over time In particular the report Agricultural Policy Incentives in Sub-Saharan Africa in the Last Decade (2005ndash2016) has been a very valuable resource for our work
MAFAP also focuses on working with countries as they develop their own approaches to tracking and assessing policies in these areas and developing them further in the future
Additional information is available at httpwwwfaoorgin-actionmafaphomeen
16 AGRICULTURAL BIAS IN FOCUS
In the first section we provide a cross country review of question 2 which shows how policies vary from one country to another and from one crop to another The analysis shows some interesting patterns and also some important challenges for setting a consistent agricultural transformation agenda at the country level Next we revisit all four questions in relation to each focus country While this exercise is not an exhaustive review of policies it provides important insights to explain existing policies and identify the main policy drivers
51 Anti-Agricultural Bias by ProductFigure 7 provides a snapshot of the market price distortions faced by farmers in 10 of our 12 countries of interest over the last four years of available data based on the Ag-Incentives project We use the nominal rate of protection6 as our indicator which as described previously compares the farm gate price7 for a commodity to a reference price which is usually a world price
For each country in Figure 7 the nominal rate of protection (NRP) for the agricultural sector is indicated by a black dot The coloured bars indicate the relative contribution to the NRP by product with bars to the right of the vertical axis indicating that the product has a positive NRP while bars to the left indicate a negative NRP The size of the contribution of a given product to the NRP depends on the product-level NRP and the size of each product in the value nation-wide of all agricultural production This measurement approach cannot count products that face such high taxes that they are simply not grown or only in marginal quantities If a product is taxed at 100 per centmdashan
6 See Measuring the anti-agricultural bias information sheet of a discussion of indicators7 See Information sheet on prices for definition
Figure 7 A heterogenous pattern of distortions for the agricultural sector of the focus countries 2011ndash2015 averageSource Authorsrsquo computations based on the Ag-Incentives database Togo Zambia and Zimbabwe are excluded due to missing data
AGRICULTURAL BIAS IN FOCUS 17
NRP of -100 per centmdashno producer will ever try to produce it it will thus contribute nothing to the national value of production
Figure 7 teaches three valuable lessons
bull In most countries three or four products capture most of the distortions helping identify where policy reform will have the most effect
bull Most countries have a mix of both positive and negative product-level NRPs
bull At the product-level the following trends appear cash crops such as cashew nuts groundnuts and tea are taxed in many countries Meanwhile maize production continues to be highly distorted though this distortion can be positive or negative depending on the country Rice is never discriminated against and often benefits from a highly positive NRPmdashit benefits from the protection of regional Common External Tariffs (see further discussion on this in the next section at the country level)
This variation in product-level NRP is important A highly positive NRP for maize as seen in Kenya means that more maize will be produced by Kenyan farmers than if NRP were the same for all products Policy incentives and disincentives to farmers may distort their production patterns and affect their choice of crops to produce beyond just their decisions on quantities of production
Farmers specialize by product meaning that changing the balance of product-level NRP does not affect all farmers equally Farmersrsquo product specialization will often overlap with demographic variables meaning that changes to the NRP for one product can cause differential distributional and political economy effects Differential effects can occur at the following levels and forms
bull Region different agroecological zones grow different crops (InterAcademy Council 2004)
bull Gender men and women have different patterns of specialization by crop (Laborde amp Lallemant 2018)
bull Ethnic groups in many areas ethnic groups tend to specialize in either livestock or crops (Michalopoulos 2012)
bull Small and large farmers some crops are mainly the specialization of larger plantations while other are mainly produced by smallholders and sold to local markets (Smalley 2013)
52 Country-Level DiagnosticsThis section reviews the 12 focus countries Burkina Faso Ethiopia India Kenya Malawi Mali Mozambique Rwanda Tanzania Uganda Zambia and Zimbabwe
Table 2 provides a set of key indicators used in our assessment of the anti-agricultural bias measured using the relative rate of assistance Our focus is on the recent past centered around 2015 but we also provide value for 2010 to check the trend over the last five years This assessment of bias also incorporates the rate of protection in agriculture and non-agricultural sectors with a specific focus on import trade policies We also indicate recent evolutions in the relative rate of assistance
Reviewing individual country experiences we need to check first if the bias is coming from a difference in tariffs (if agriculture is less nominally protected than non-agricultural products) before digging into other measures We follow this analytical process for each country
18 AGRICULTURAL BIAS IN FOCUS
Table 2 Contributions to anti-agricultural bias selected indicators
Country Rem
ove
anti
-ag
ricu
ltur
e bi
as p
rior
ity
(lab
ord
e et
al
20
18)
Rel
ativ
e ra
te o
f as
sist
ance
(20
09
-20
11)
Rel
ativ
e ra
te o
f as
sist
ance
(20
14-2
016
)
Evol
utio
n rr
a
(ove
r 5
yea
rs)
Nom
inal
rat
e of
pro
tect
ion
(nrp
)
(20
14-2
016
)
Rol
e of
impo
rt t
arif
fs in
nrp
Mfn
tar
iff
- no
n-ag
ricu
ltur
e
(sim
ple
avg
20
15)
Mfn
- a
gri
cult
ure
(sim
ple
avg
20
15)
Pub
lic a
g e
xpen
ditu
res
(as
sha
re o
f g
dp
20
12)
Ethiopia -42 -67 -61 low 17 22
India -21 -25 -18 low 10 33
Kenya -16 13 20 high 12 20 6
Rwanda 23 -16 -11 low 12 20 6
Burkina Faso -9 5 9 high 12 15 9
Malawi -29 -26 -21 low 12 18 4
Tanzania 2 21 36 high 12 20
Togo -13 -7 12 15 5
Uganda -19 -5 35 high 12 20 3
Zambia -42 -12 13 19
Mali -28 -34 -26 low 12 15
Mozambique -13 1 9 high 10 14 2
Source Authorsrsquo compilation from various sources Ag-incentivesorg SPEED (IFPRI) TRAINS (UNCTAD) Laborde et al 2017
Note ldquoRemove of anti-agricultural biasrdquo priority is based on the agricultural transformation project Higher number of dots indicates a higher
level of priority
AGRICULTURAL BIAS IN FOCUS 19
EthiopiaAnti-agricultural bias in Ethiopia is driven by very low output prices for farmers which equates to a large negative NRP while the rest of the economy enjoys significant protection The average most-favoured nation (MFN) tariff rate is 17 per cent
This negative NRP is not due to a lack of import tariffs on agricultural products which average about 22 per cent
The negative rate of protection on farm products is driven by teff and maize at three-quarters of the overall cost of distortions with farm gate prices at about 70 per cent on average lower than world prices These negative prices largely overwhelm other policies linked to government support for agriculture
Key Sources of Anti-Agricultural Bias
bull Imposition of an export ban for maize intermittently throughout the period reviewed (2010ndash2015) which penalized domestic producersrsquo prices by reducing total demand for the commodity
bull Market distortionsmdashincluding asymmetry of information between producers and wholesalers along with unbalanced market powermdashcontributed to a lack of integration of domestic markets with international ones alongside poor price transmission between international and local markets
IndiaAnti-agricultural bias is moderate in India Although agriculture is highly protected compared to other sectors in terms of tariffsmdashaveraging 33 per cent versus 10 per centmdashdomestic prices are still far below world prices In 72 per cent of observations (15 commodities considered over 10 years) commodity prices were below export parity prices with the main commodities being rice groundnuts and cotton This is due to the use of export restrictions meant to protect domestic consumers by keeping these domestic commodity prices low
Key Sources of Anti-Agricultural Bias
bull Export restrictions especially in the form of export bans on rice and wheat in the 2000s kept domestic prices low Temporary export prohibitions and quotas were also put in place for milk powder edible oil peas and pulses
bull Beyond staples export commodities such as bananas and mangoes receive low producers prices due to policies and institutions that result in a high level of domestic market fragmentation and limited competition
bull Facing low domestic prices the government initiated a policy of minimum support prices for 23 commodities and subsidies for inputs These subsidies were mainly for fertilizers but government support was also provided for irrigation and credit The government also provided high-yielding seed varieties at a subsidized price These support measures did not offset the negative effect of the export restrictions
20 AGRICULTURAL BIAS IN FOCUS
KenyaAnti-agricultural bias is present in Kenya but to lesser degree than neighbouring Ethiopia On average agricultural tariffs are much higher than the economy-wide average at 20 per cent compared to 13 per cent Thus anti-agricultural bias is not caused by differentiated tariffs
Importantly Kenya has a notable mix of active policies contributing to both pro- and anti-agricultural biases For instance a price-setting mechanism for tea creates significant positive support that stabilizes income for producers when world prices fall
Key Sources of Anti-Agricultural Bias
bull Excessive market access costs within the country such as poor road networks in rural areas along with high margins8 lead to lower prices for producers
bull During the 2000s good organization of the tea value chain with monitoring of all stages by the Tea Development Agency contributed to positive price incentives for tea production
RwandaRwanda has no anti-agricultural bias Average protection for agricultural products is 20 per cent versus 12 per cent for all products
Key Sources of Agricultural Bias
bull Rice producers are protected by a particularly high tariffmdash the East African Community Common External Tariff (EAC CET) of 75 per cent for the considered period9mdashand minimum farm gate prices This allows them to enjoy an NRP of more than 100 per cent
bull Inputs particularly fertilizers are heavily subsidized
bull For exported products an inefficient government price-setting mechanism and high marketing costs reduce producersrsquo price for tea
Burkina FasoAnti-agricultural bias is present in Burkina Faso though it is declining Average economy-wide product protection is at 12 per cent compared to agricultural product protection at 15 per cent so the anti-agricultural bias is the result of other factors
Key Sources of Anti-Agricultural Bias
bull The temporary suspension of import tariffs in the wake of the 2008 food price crisis reduced price incentives for rice producers
bull Subsidized sales of rice by state agencies lowered market prices and thus reduced price incentives
bull Farmersrsquo bargaining power was low at the wholesale level due to the oligopolistic structure of markets
bull Privatization of the public cotton company coupled with a price stabilization fund benefited cotton producers providing stable prices and moderate incentives
8 For the Kenya Tea Development Agency (KTDA) for instance9 The EAC CET on rice has been reduced recently to 35 per cent in 2018 However partner states use numerous exemptions approved on a year-by-year basis EAC Gazette Notice No 8 of 2018
AGRICULTURAL BIAS IN FOCUS 21
MalawiThe level of anti-agricultural bias in Malawi is high Trade policy is not biased against agriculture the average agricultural tariff rate is 18 per cent compared to the economy-wide average of 12 per cent
Key Sources of Anti-Agricultural Bias
bull Intermittent import bans have caused large variations in maize prices Since 2010 the NRP for this commodity has oscillated between -38 per cent to +42 per cent
bull Minimum support prices for maize for farmers were not effective maize was subject to -23 per cent of the NRP on average in the recent years
bull Poor rural infrastructure and high trader margins created disincentives for maize producers
bull A significant input subsidy program supports maize production but does not offset the disincentives
bull On the export side tea producers have suffered from an overvalued exchange rate and a price-setting mechanism that systematically sets prices lower than world equivalents There is an NRP of -52 per cent
TanzaniaThere is currently no anti-agricultural bias in Tanzania a strong shift compared to 10 years ago Agriculture is more protected than other sectors with an average tariff for agricultural products of 20 per cent compared to 12 per cent for all products
Key Sources of Anti-Agricultural Bias
bull The implementation of EAC CET at 75 per cent contributed to price incentives for the rice sector10
bull On the export side intermittent export bans and limited competition reduced farmersrsquo bargaining power penalizing the maize sector However this was partly offset by a government price support program The NRP has averaged 53 per cent in recent years but has fluctuated by more than 50 points on a year-to-year basis
UgandaThe level of anti-agricultural bias in Uganda is moderate Tariffs protect agriculture more than the other sectors at 20 per cent for agricultural products versus 12 per cent for all products and the structure of border protection is not the driver of the anti-agricultural bias
A fall in external demand has negatively affected the price of some export products like maize
Key Sources of Anti-Agricultural Bias
bull As in Tanzania implementation of EAC CET at 75 per cent for rice largely protected rice production Rice has an NRP of 70 per cent
bull Restrictions on cross-border trade for animal products has hurt livestock producers creating a negative rate of protection in contrast to the removal of such restrictions for most crops
bull Liberalization (dismantling of parastatals) of maize and coffee markets in the 1990s yielded volatile prices but contributed to shifting incentives from negative to positive
bull High market access costs such as transportation are still penalizing maize exports
10 See also Footnote 19
22 AGRICULTURAL BIAS IN FOCUS
ZambiaThe level of anti-agricultural bias in Zambia is high yet agricultural tariffs are higher than the economy-wide average at 19 per cent versus 13 per cent respectively Disincentives were particularly high for cotton groundnuts tobacco and maize Export bans on maize are recurring even if their imposition is temporary Maize accounts for the largest portion of Zambiarsquos agricultural production value Its domestic prices are at 68 per cent below the world price creating most of the anti-agricultural bias
Key Sources of Anti-Agricultural Bias
bull Producers faced prices below world average prices in the 1990s and the 2000s mainly due to the monopsonistic nature of agricultural markets and the overvaluation of the exchange rate Liberalization of the maize market started in the 1990s but was not effective the market remained concentrated with low competition in addition the government continued to intervene in the form of a food reserve agency that manages buffer stocks and is the largest distributor of fertilizers
bull Large input subsidy programs and minimum price systems did not offset the negative effects of other policies A uniform pricing system has hurt poor farmers in non-border areas by failing to allow geography and domestic market access to be reflected in price
MaliAnti-agricultural bias in Mali is high and has been increasing since 2000 There is no bias from tariffs The average tariff rate for agricultural products is 15 per cent compared to 12 per cent for all products
Key Sources of Anti-Agricultural Bias
bull For rice the introduction of the West African Economic and Monetary Union (WAEMU) CET in the 2000s contributed to incentives for producers but this was offset by tariff removals in the wake of the 2008 food price crisis along with price ceilings in 2008ndash2009 to protect consumer access to food
bull Large input subsidies for both rice and maize contributed to lower production costs however poor infrastructure high transportation costs and illicit taxes (illegal payments linked to road harassment) contributed to lower net output prices for producers
bull The mix of policies lead to varied outcomes depending on the crop with a positive NRP of 21 per cent on rice and a negative rate of protection of 71 per cent for maize
AGRICULTURAL BIAS IN FOCUS 23
MozambiqueAnti-agricultural bias is moderate in Mozambique Agriculture is protected with tariffs averaging 14 per cent compared to 10 per cent for all products
Key Sources of Anti-Agricultural Bias
bull For rice the depreciation of the local currency vis-agrave-vis the USD benefited local producers making imports more expensive This effect was dampened and even offset by ineffective application of import tariffs (with various import flows avoiding taxation) and input subsidies combined with low levels of price transmission between international and local markets
bull For cotton which is mainly exported a price floor system was set up to protect producers from price drops However it also prevented from producers from benefiting from high prices thus disincentivizing production A cotton development tax initiated on cotton trade also disincentivized cotton production Cotton producers lost bargaining power with the reform of the domestic market which resulted in lower competition among buyers
ZimbabweAnti-agricultural bias is high in Zimbabwe Agriculture is more protected than other sectorsmdashaverage tariffs are 14 per cent for agricultural products versus 10 per cent for other products
Anti-agricultural bias is driven by distortions on groundnuts tobacco cotton soybean and maize
Key Sources of Anti-Agricultural Bias
bull Marketing boards with monopsonistic practices and low minimum prices drove down producer prices particularly for maize and cotton until the mid 2000s
bull A persistently overvalued exchange rate during the 1976ndash2004 period also contributed to price disincentives
bull Direct assistance through input subsidies could not offset disincentives from the market power and exchange rate
bull Liberalization of agriculture in the late 1990s did not bring the expected benefits in terms of price incentives Furthermore the parastatal company that had controlled the maize sector continued to enjoy a monopoly over international maize trading
24 AGRICULTURAL BIAS IN FOCUS
ReferencesAgIncentives (nd) Retrieved from httpwwwag-incentivesorg
Anderson K amp Valdes A (Eds) (2008) Distortions to agricultural incentives in Latin America Washington DC World Bank Retrieved from httpsiteresourcesworldbankorgINTTRADERESEARCHResources544824-1146153362267LAC_overview_0708pdf
Anderson K amp Martin W (Eds) (2009) Distortions to agricultural incentives in Asia Washington DC World Bank Retrieved from httpsiteresourcesworldbankorgINTTRADERESEARCHResources544824-1146153362267Asia_e-book_0209pdf
Anderson K (Ed) (2009) Distortions to agricultural incentives A global perspective 1955 to 2007 London Palgrave Macmillan and Washington DC World Bank Retrieved from httpssiteresourcesworldbankorgINTTRADERESEARCHResources544824-1272467194981DAI_Global_Perspectivepdf
Balassa B (1965) Tariff protection in industrial countries An evaluation Journal of Political Economy 73 573ndash594
Balieacute J Ghins L amp Pernechel V (2018) Agricultural policy incentives in sub-Saharan Africa in the last decade (2005-2016) (Monitoring and Analysing Food and Agricultural Policies [MAFAP] synthesis study) Rome FAO Retrieved from httpwwwfaoorg3i8997enI8997ENpdf
Corden W M (1966) The structure of a tariff system and the effective protective rate Journal of Political Economy 74(3) 221ndash237
InterAcademy Council (2004) African agricultural production systems and productivity in perspective In Realizing the promise and potential of African agriculture Washington DC
Laborde D amp Lallemant T (2017) Agricultural price incentives Towards gender-differentiated indicators (IFPRI-PIM working paper)
Laborde D Lallemant T McDougal K Smaller C amp Traore F (2018) Transforming agriculture in Africa and Asia What are the policy priorities Washington DC IFPRI and Winnipeg IISD
Michalopoulos S (2012) The origins of ethnolinguistic diversity American Economic Review 102(4) 1508ndash1539
Smalley R (2013) Plantations contract farming and commercial farming in Africa A comparative review (Future Agriculture Land and Agricultural Commercialization in Africa (LACA) Project Working Paper 055) Retrieved from httpwwwfaoorguploadsmediaFAC_Working_Paper_055pdf
Tsakok I (2011) Success in agricultural transformation What it means and what makes it happen Cambridge Cambridge University Press
AGRICULTURAL BIAS IN FOCUS 25
This work was undertaken as part of Economic Law and Policy program of the International Institute for Sustainable Development (IISD) and the CGIAR Research Program on Policies Institutions and Markets (PIM) led by the International Food Policy Research Institute (IFPRI)
Funding support for this study was provided by the Bill and Melinda Gates Foundation
This publication has gone through the standard quality assurance procedure of IISD
The opinions expressed here belong to the authors and do not necessarily reflect those of IISD PIM IFPRI or CGIAR
copy 2019 The International Institute for Sustainable Development Published by the International Institute for Sustainable Development
2 AGRICULTURAL BIAS IN FOCUS
IntroductionThe report Transforming Agriculture in Africa and Asia What Are the Policy Priorities showed that successful agricultural transformation has depended on interacting agricultural policies as well as the broader economic policy environment A key finding was that agricultural transformation succeeded when governments removed the policies and addressed the market failures that disadvantaged the agricultural sector relative to the rest of the economy We referred to this relative disadvantage as the anti-agricultural bias
To explain how these policies interact and which policies affect different aspects of the overall economy we developed a policy taxonomy with a focus on those that affect prices in agricultural markets (see A Policy Taxonomy for Agricultural Transformation) The policy taxonomy came from an inventory of policies collected from over 250 articles and is derived from the policy framework used in Transforming Agriculture in Africa and Asia What Are the Policy Priorities (see Figure 1)
Figure 1 Policy taxonomy Agricultural Transformation
This paper provides further details and explains how to measure and understand the source of agricultural bias in a country including examples and country case studies
Policy taxonomy agricultural transformation
Institutions
Health RampDRoads
Education Extension Services
Irrigation
Safety Net Electrifi cation
Storage amp Warehouse
Human Capital
Rural Infrastructure
Agricultural Knowledge
Rural Economy
Industry Infl ation
Services Exchange Rate
Economic Diversifi cation
Monetary Policy
Macroeconomy Agricultural Markets
Input Markets
Credit amp Insurance
Export strategy (trade agreements)
Subsidies amp Taxes
Subsidies amp Taxes
Tariffs amp Export Restrictions
Domestic Trade Regulations
Tariffs amp Export Restrictions
Domestic Trade Regulations
Price Info Price Info
Output Markets
Laws amp Norms Governance Practices
AGRICULTURAL BIAS IN FOCUS 3
1 How to Measure the Anti-Agricultural BiasEconomists have developed the following indicators to quantify the anti-agricultural bias concept (Balassa 1965 Corden 1966)
1 The Nominal Rate of Protection This indicator compares the farm gate price for a commodity to a reference price usually based on the world price If the farm gate price is higher a positive agricultural bias exists If the farm gate price is lower accounting for transportation and other normal marketing costs then farmers are facing disincentives to produce that commodity which contributes to an anti-agricultural bias The effect is comparable to that of an indirect tax on a producerrsquos profit compared to what they would earn if they were operating freely on world markets This metric is heavily affected by agricultural trade policies In most developing countries where domestic support to agriculture is minimal the nominal rate of protection is a good proxy for measuring the direct incentives perceived by farmers where farm gate prices remain the main signal for their production choice
2 The Nominal Rate of Assistance This indicator is more complex It looks beyond market prices to include the various taxes farmers pay and the subsidies they receive as these also affect farmersrsquo production decisions The nominal rate of assistance includes the nominal rate of protection plus or minus the subsidies received or taxes paid The result is a more comprehensive metric of the level of bias In most OECD countries the nominal rate of protection has been reduced in the last 30 years but many farmers enjoy a relatively high nominal rate of assistance due to the existence of various subsidies and other transfer payments
3 The Relative Rate of Assistance This indicator compares the rate of assistance in agriculture to the rate of assistance in the rest of the economy It provides a measure that compares agriculture to other sectors showing the actual and combined effects of incentives faced by farmers It captures the anti-agricultural bias in a true general equilibrium framework where economic agents have to decide in which activity they will work and invest
4 Effective Rate of Protection This indicator aims to track normally at the commodity level the net effects of various policies on farm value added1 It compares the distortions on farm output and input agent prices looking at the
1 The difference between farm production value and intermediate consumption
4 AGRICULTURAL BIAS IN FOCUS
actual cost structure for farmers It combines data and concepts from the three previous indicators It can be used to monitor the anti-agricultural bias in a partial equilibrium framework and is rarely used to look at long-term agricultural transformation Its value lies in its strong explanatory power when analyzing value chain development
Figure 2 shows the relationship between the main indicators for measuring the anti-agricultural bias and the biasrsquos link to policies Practically to assess the level of the anti-agricultural bias we start by comparing prices for a given commodity in-country with a reference price This allows us to compute the nominal rate of protection International market prices are commonly used as the reference even though they are also to some extent distorted by policy interventions More detail is available in Part 4 Defining Prices
Figure 2 Measuring the Relative Rate of Assistance main indicators and linkages with the policy space
Source Authorsrsquo design
Why are subsidies in the non-agriculture sector not included in the calculation of the nominal rate of assistance in non-agriculture The primary reason for this omission is that an inventory of these subsidies would be impractical given the vast scope of products and sectors that fall within the overarching heading of non-agriculture The effect of not including these subsidies likely means that we underestimate the anti-agricultural bias
Under normal conditions both the nominal rate of protection and the relative rate of assistance are lower than the nominal rate of assistance Historically developing countries (Anderson 2009) would often implement measures that in practice taxed rather than protected their agriculture sector while providing extensive protection to industry This meant they had a larger relative anti-agricultural bias as shown by providing industry a higher rate of assistance than their farm sectors Over time this trend has been reversed in transforming or transformed economies (AgIncentives nd Tsakok 2011) In the countries that have transformed the most such as Brazil they now use a small amount of border protection reinforced with farm subsidies (a pro-agricultural bias) (See Figure 3 for a subset of countries belonging to various stages of agricultural transformation as defined in Laborde et al [2017])
Agriculture
Pol
icie
sIn
dica
tors
Nominal Rate of Assistance in Agriculture
Non-Agriculture
Nominal Rate of Assistance in
Non-Agriculture
Nominal Rate of Protection in Agriculture Relative Rate of
Assistance in Agriculture
Import Taxes amp Export Taxes
SubsidiesImport Taxes amp Export Taxes
AGRICULTURAL BIAS IN FOCUS 5
Figure 3 Evolution of the anti-agricultural bias over time and phases of agricultural transformation Brazil Ghana Tanzania United States
The different indicators used to measure the anti-agricultural bias are useful to understand the political economy of policy reform On the one hand changes in the nominal rate of protection involve a redistribution of real income between consumers of these agricultural goods and producers of the same policies that keep farm gate prices low are bad for these producers and good for these buyers On the other hand changes in the nominal rate of assistance could come from a change in the level of protection or in the various taxes paid by farmers or subsidies received by them In this case there is a redistribution between agricultural producers and taxpayers2
It is important to note that these indicators measure solely the biasrsquos extent rather than its source Understanding the cause of the bias and developing a menu of policy options requires further information and analysis
2 Due to the heterogeneity of households and their individual contribution to tax revenue but also their exposure to food prices it is important to differentiate between taxpayers and consumers Rich households spend a tiny fraction of their income on food products but contribute largely to public finance both in absolute and relative terms while very poor household spend most of their income on food products but have no or very limitedmdashmainly through indirect taxationmdashcontribution to public finance
-90
-70
-50
-30
-10
10
30
5019
74-1
976
1989
-19
91
200
4-2
00
6
1974
-19
76
1989
-19
91
200
4-2
00
6
1974
-19
76
1989
-19
91
200
4-2
00
6
1974
-19
76
1989
-19
91
200
4-2
00
6
Brazil Ghana Tanzania USA
Nominal Rate of Protection Agriculture
Nominal Rate of Assistance Manufacture
Nominal Rate of Assistance Agriculture
Relative Rate of Assistance
1 1 1 12 23 3 3 5 5 5
Ag
ricu
lura
lTr
ansf
orm
atio
nS
tage
Industrialized Economies
Moving Labour Outof Agriculture
Agriculture as aContributor to Growth
Agriculture Integrated Into the Macro Economy
Getting Agriculture Moving
Subsistence Agriculture
1
2
3
4
5
6
6 AGRICULTURAL BIAS IN FOCUS
2 Policies That Drive Anti-Agricultural BiasA broad range of policies drive a countryrsquos agricultural bias Table 1 shows a non-exhaustive list of the policies that are included in the measurement directly or indirectly of the anti-agricultural bias
Table 1 Sources of Anti-Agricultural Bias What policies are included
Source Authorsrsquo design
Nominal Rate of
Protection
Nominal Rate of
Assistance
Relative Rate of
Assistance
Relevant but not included in indicators
Import taxessubsidiesquotasbans
Export taxessubsidiesquotasbans
Commodity boards
Intervention prices
Production subsidies
Input subsidies
Subsidized credit amp insurance
Quota fees
Income support to farmers and social safety nets
sometimes sometimes
Payments for ecosystem services sometimes sometimes
Agricultural RampD sometimes sometimes
Public investments in improved storage amp marketing (off-farm)
sometimes sometimes
Non-agricultural import taxessubsidies
Non-agricultural export taxessubsidies
Non-agricultural non-tariff barriers
Subsidies to the industrial sector
Food subsidies
Biofuel policies
Land reform
Public spending in rural infrastructure health and education
AGRICULTURAL BIAS IN FOCUS 7
Most of these policies affect agricultural markets directly on either the output or input side Figure 4 shows the policies that drive a countryrsquos agricultural bias While these are representative examples they are not necessarily exhaustive The darker the shade of blue for the policy the more direct the impact is on the agricultural bias while the lighter shades are for policies that have less impact The boxes in greymdashwhile having an impact on farmers and rural household livelihoodsmdashhave a very limited and indirect impact on anti-agricultural bias
The policies that affect agricultural bias have evolved over time Historically developing economies tended to tax their domestic agricultural sectors while advanced economies subsidized their farmers This trend started to shift in the 1980s as structural adjustment policies in developing economies ended both many of the de facto taxes on agriculture and the subsidies that had favoured industry (Tsakok 2011 Anderson amp Valdes 2008 Anderson amp Martin 2009) Developed countries also cut back on the use of border measures to protect agriculture as well as their use of direct price supports which combined to reduce the level of distortion on prices in international markets to the benefit of agriculture in developing countries
Figure 4 Sources of the anti-agricultural bias historical overview
Source Authorsrsquo design
The anti-agricultural bias historical
Health RampDRoads
Education Extension Services
Irrigation
Safety Net Electrifi cation
Storage amp Warehouse
Human Capital
Rural Infrastructure
Agricultural Knowledge
Rural Economy
Industry Infl ation
Services Exchange Rate
Economic Diversifi cation
Monetary Policy
Macroeconomy Agricultural Markets
InstitutionsLaws amp Norms Governance Practices
Input Markets
Credit amp Insurance
Export strategy (trade agreements)
Subsidies amp Taxes
Subsidies amp Taxes
Tariffs amp Export Restrictions
Domestic Trade Regulations
Tariffs amp Export Restrictions
Domestic Trade Regulations
Price Info Price Info
Output Markets
8 AGRICULTURAL BIAS IN FOCUS
Today the anti-agricultural bias that exists in the countries reviewed in the report Transforming Agriculture in Africa and Asia What are the policy priorities and which have not yet transformed their agricultural sectors comes mainly from market failures Some of these failures are due to policies that distort agricultural markets while others relate to an absence of policies that disadvantage small-scale producers and do not allow markets to operate efficiently (see Figure 5)3
Figure 5 Sources of the anti-agricultural bias present
Source Authorsrsquo design
3 In order to operate efficiently markets require a number of regulations (intellectual property rights competition policy) and institutions (eg for contract enforcement) In less advanced economies some of these market regulationsmdashand the institutions required to enforce themmdashare weak and contribute to declining farmer welfare especially for smallholders who lack economic and political power
The anti-agricultural bias present
Industry Infl ation
Services Exchange Rate
Economic Diversifi cation
Monetary Policy
Macroeconomy Agricultural Markets
Health RampDRoads
Education Extension Services
Irrigation
Safety Net Electrifi cation
Storage amp Warehouse
Human Capital
Rural Infrastructure
Agricultural Knowledge
Rural Economy
InstitutionsLaws amp Norms Governance Practices
Input Markets
Credit amp Insurance
Export strategy (trade agreements)
Subsidies amp Taxes
Subsidies amp Taxes
Tariffs amp Export Restrictions
Domestic Trade Regulations
Tariffs amp Export Restrictions
Domestic Trade Regulations
Price Info Price Info
Output Markets
AGRICULTURAL BIAS IN FOCUS 9
3 Examples of Agricultural Bias in an EconomyThis section shows how various policies located in different policy categories jointly affect the assessment of the level and direction of agricultural bias in a given economy The examples below include the assumption that all other things remain equal within that same economymdashwhat is known in economics as ceteris paribus
Case A Agricultural import tariff
Scenario Agriculture is the only sector protected using import tariffs
Agricultural markets
Input markets
Credit amp insurance
Subsidies and taxes
Tariffs and export taxes
Agricultural tariff (output) 10
Price information
Output markets
Export strategy X
In this first case the agricultural sector is singled out for protection which creates a pro-agricultural bias for the producer The tariff protects domestic farmers by increasing domestic prices by 10 per cent compared to international prices Its effect is to limit the possibility of a larger influx of lower-priced imports which would otherwise drive down domestic prices and make it harder for that countryrsquos producers to compete The result is a price benefit for domestic agricultural producers though it penalizes consumers of those products We can express the pro-agricultural bias in mathematical terms showing a net result that is greater than 0 which indicates a positive bias for agriculture
Relative Rate of Assistance = - 1 = 10 gt 01 + 10
1 + 0
10 AGRICULTURAL BIAS IN FOCUS
Case B Agricultural import tariff plus input subsidies
Scenario Agriculture is protected with tariffs and supported with a fertilizer subsidy
Agricultural markets
Input markets
Credit amp insurance
Subsidies and taxes
Fertilizer subsidy 5
Tariffs and export taxes
Agricultural tariff (output) 10
Price information
Output markets
Export strategy X
We assume that the value of the subsidy is equivalent to 5 per cent of farmer sales
Case B builds on Case A by adding a fertilizer subsidy The policy mix provides an additional incentive for producers by reducing their production costs The cost is borne by taxpayers while consumers do not pay more for their food The result is a stronger pro-agricultural bias
Relative Rate of Assistance = - 1 = 15 gt 01 + 10 + 5
1 + 0
AGRICULTURAL BIAS IN FOCUS 11
Case C Agricultural import tariff input subsidies and industrial tariffs
Scenario Agriculture is less protected than the rest of the economy but still subsidized
Macroeconomy
Monetary policy
Inflation
Exchange rate
Economic diversification
Industry Industrial tariff 20
Services
Agricultural markets
Input markets
Credit amp insurance
Subsidies and taxes
Fertilizer subsidy 5
Tariffs and export taxes
Agricultural tariff (output) 10Industrial tariff (input) 20
Price information
Output markets
Export strategy X
In Case C several policies interact though at times they do so in opposite directions Agriculture still benefits from a 10 per cent tariff and a fertilizer subsidy This scenario also includes policies specific to non-agricultural products Industrial goods are also protected and at a higher level than agriculture with tariffs of 20 per cent
For domestic agricultural producers these industrial goods include inputs such as tractors which they require for farm production while their outputs are not as well protected from foreign competition as industrial goods are This leaves agriculture less well-off compared to non-agricultural sectors It also makes agriculture less appealing to investors than the rest of the economy The policies combine to produce a negative (or anti)-agricultural bias In mathematical terms the net outcome for the producer is a rate of assistance that is less than zero
Relative Rate of Assistance = - 1 = -42 gt 01 + 10 + 5
1 + 20
12 AGRICULTURAL BIAS IN FOCUS
4 Defining PricesPrices are a crucial part of understanding agricultural transformation There are different types of prices at play and which price is being observed when making policy choices is crucial For example the market price is easy to observe but often agents (farmers or buyers) are responding not only to that price signal but also to other factors such as a subsidy incentive program or tax These other factors modify the agentrsquos expectations and create what economists call the agentrsquos price The agentrsquos price is a better predictor of how agents will behave than the market price
Similarly the world price is a vital measure in economic analysis but it is also in important ways a fiction The world price is not a price that actual buyers and sellers expect in their market there is no single ldquoworld marketrdquo where we can observe prices Instead we pick a proxy using a large trading centre such as the Kansas price for a fixed grade and variety of wheat based on the International Monetary Fundrsquos [IMFrsquos] commodity price monitoring Another option involves deriving a proxy price using an average of prices from several centres Here we introduce some different prices to highlight what each can tell an observer (see Figure 6)
Market PricesThe market price is the price paid by a buyer to a seller in an open transaction A market price can be distorted by market failures or policy interventions or it can be relatively undistorted It is the price arrived at by two independent actors operating broadly in conditions of good information on available supply and demand and acting without duress and under the protection of rules that are known and enforced Different markets might have different prices for the same good depending on where the market is located for example if is international or local or if the market is wholesale or retail Changes in market prices directly impact the welfare of both buyers and sellers
Photo Courtesy of Jonathan TorgovnikGetty Images Reportage
AGRICULTURAL BIAS IN FOCUS 13
Agent PricesEconomic agents make their production and consumption decisions based not only market prices but also on what economists call the ldquoagentrsquos pricerdquo An agent is either the buyer or the seller in agriculture typically the producer or consumer Agent prices capture the actual cost paid andor benefits received by economic agents including any policies that modify the market price such as taxes or subsidies For example a consumer who receives a food stamp to spend at a food market has more purchasing power and can pay more than a consumer who does not The producer benefits from this Not all of these non-market factors are policy-based gender race caste and age can all change the price an agent is willing or expected to pay
Farm Gate PricesThe farm gate price is the price the farmer receives upon selling their product It is one of various prices along the value chain Other prices in the chain include the price that incorporates the cost of transportation to the export market or processor the price paid on the wholesale market the price at a terminal port if the commodity is to be exported and the price paid by a contract holder on a futures exchange
50
100
200
300
400500
1000
1400
1996
199
7
1998
199
9
200
0
200
1
200
2
200
3
200
4
200
5
200
6
200
7
200
8
200
9
2010
2011
2012
2013
2014
2015
Pri
ce C
urre
nt U
SD
(log
sca
le)
Domestic Agent (producer) Price at Farm Gate Domestic Market Price at Farm Gate
Global Wheat Price (Source IMF) Wheat World Price (Source Comtrade)
Differences in various concepts of world prices
Difference between
world and domestic
prices
Farm gate pricesdifference between agent
and market prices
Figure 6 Price case study ndash wheatSource Authorsrsquo compilation of data sources1 Authorsrsquo computation based on OECD Japan PSE database 2 International Monetary Fund based on Wheat No1 Hard Red Winter ordinary protein Kansas City USDmetric ton May 1 20193 Authorsrsquo computation based on UN COMTRADE retrieved from WITS May 1 2019
The graph compares the evolution of world price with farm gate prices The two world prices show similar dynamics but diverge during specific years when US market dynamics differ from other main exporters (The International Monetary Fundrsquos [IMFrsquos] global wheat price uses Kansas prices as their proxy while we use Comtrade to derive a composite of different market prices to create an average price) The two farm gate prices show the difference between agent and market prices over time As a country shifts from tariff protection to subsidies the market price comes closer to the world price but the gap between the producer (agent) and market prices persists Current USD means the current year of the data point
14 AGRICULTURAL BIAS IN FOCUS
World PricesThere are several ways to derive a world price such as by dividing the value of trade flows of a commodity by the quantity traded The result is a unit value or nominal price per given unit Examples of such units include bushels or tonnes No specific transaction in the world is made at this price but it provides an average price that can serve as a reference such as when measuring agricultural distortions in domestic markets Another common way to identify a world price for heavily traded commodities is to use the spot price or a futures price on a given exchange such as Chicago or London or at a large export or delivery facility such as New Orleans or Rotterdam For commodities like rice that are not heavily traded or are traded in more dispersed markets the price at a central trading place might not be relevant Some commodities such as dairy products are particularly distorted by national policies in major markets and trading places In this case New Zealandrsquos export price provides the world price reference since it is a relatively undistorted producer and major exporter
Photo Courtesy of Jonathan TorgovnikGetty Images Reportage
AGRICULTURAL BIAS IN FOCUS 15
5 Country Case Studies
The country case studies revisit the findings of Transforming Agriculture in Africa and Asia What Are the Policy Priorities to identify key policy sources of anti-agricultural bias for 12 countries that have yet to realize inclusive agricultural transformation These countries are Burkina Faso Ethiopia India Kenya Malawi Mali Mozambique Rwanda Tanzania Uganda Zambia and Zimbabwe We limit the list to countries where data availability allows us to provide a more granular assessmentmdashqualitatively and quantitativelymdashof the drivers of anti-agricultural bias
As noted previously while indicators and methods exist to measure the degree of anti-agricultural bias these indicators themselves do not pinpoint the causes of the problem4 Indeed a contributing factor toward a negative relative rate of assistance measurement could be the result of the presence of a detrimental policy or the absencemdashby design or oversightmdashof a basic policy that is a foundation of a well-functioning market To diagnose the cause of a positive or negative agricultural bias requires answering the following questions
1 Does the negative relative rate of assistance in agriculture mainly originate from policies tied to the agricultural sector or the non-agricultural sector This question is answered by comparing the nominal rate of assistance in agriculture to that in industry5
2 When focusing on agricultural policies especially when the nominal rate of assistance is negative are the main distortions andor incentives homogenously distributed across commodities or are they concentrated in a few products Since the main source of a negative rate of assistance in agriculture tends to be a negative rate of protection we check to see if this indicator points us to a particular agricultural commodity If distortions appear to be homogenous rather than concentrated on a few products what are the systemic market or policy failures faced by the agricultural sector overall
3 After having identified the most positively or negatively distorted commodities which actual policies targeting these commodities best explain the results
4 If these policies are changing over time to what extent are they contingent measures rather than long-term choices
4 For more on measurements of anti-agricultural bias including relative rate of assistance and nominal rate of assistance please see the introductory materials in this series5 For non-agricultural goods it is standard practice to focus on trade policies and mainly import tariffs for industrial goods when assessing the nominal rate of assistance for these sectors
The work in this section is based on various quantitative and qualitative sources including press releases documenting policy reforms The main quantitative source involves a dataset published by the Ag-Incentives Consortium (wwwag-incentivesorg) and primarily collected by the Monitoring and Analysing Food and Agricultural Policies (MAFAP) program of the Food and Agriculture Organization of the United Nations (FAO) MAFAP collects agricultural policy data and the program also has various monitoring and analytical pieces at the country level This data has allowed us to review and track how policies change across countries over time In particular the report Agricultural Policy Incentives in Sub-Saharan Africa in the Last Decade (2005ndash2016) has been a very valuable resource for our work
MAFAP also focuses on working with countries as they develop their own approaches to tracking and assessing policies in these areas and developing them further in the future
Additional information is available at httpwwwfaoorgin-actionmafaphomeen
16 AGRICULTURAL BIAS IN FOCUS
In the first section we provide a cross country review of question 2 which shows how policies vary from one country to another and from one crop to another The analysis shows some interesting patterns and also some important challenges for setting a consistent agricultural transformation agenda at the country level Next we revisit all four questions in relation to each focus country While this exercise is not an exhaustive review of policies it provides important insights to explain existing policies and identify the main policy drivers
51 Anti-Agricultural Bias by ProductFigure 7 provides a snapshot of the market price distortions faced by farmers in 10 of our 12 countries of interest over the last four years of available data based on the Ag-Incentives project We use the nominal rate of protection6 as our indicator which as described previously compares the farm gate price7 for a commodity to a reference price which is usually a world price
For each country in Figure 7 the nominal rate of protection (NRP) for the agricultural sector is indicated by a black dot The coloured bars indicate the relative contribution to the NRP by product with bars to the right of the vertical axis indicating that the product has a positive NRP while bars to the left indicate a negative NRP The size of the contribution of a given product to the NRP depends on the product-level NRP and the size of each product in the value nation-wide of all agricultural production This measurement approach cannot count products that face such high taxes that they are simply not grown or only in marginal quantities If a product is taxed at 100 per centmdashan
6 See Measuring the anti-agricultural bias information sheet of a discussion of indicators7 See Information sheet on prices for definition
Figure 7 A heterogenous pattern of distortions for the agricultural sector of the focus countries 2011ndash2015 averageSource Authorsrsquo computations based on the Ag-Incentives database Togo Zambia and Zimbabwe are excluded due to missing data
AGRICULTURAL BIAS IN FOCUS 17
NRP of -100 per centmdashno producer will ever try to produce it it will thus contribute nothing to the national value of production
Figure 7 teaches three valuable lessons
bull In most countries three or four products capture most of the distortions helping identify where policy reform will have the most effect
bull Most countries have a mix of both positive and negative product-level NRPs
bull At the product-level the following trends appear cash crops such as cashew nuts groundnuts and tea are taxed in many countries Meanwhile maize production continues to be highly distorted though this distortion can be positive or negative depending on the country Rice is never discriminated against and often benefits from a highly positive NRPmdashit benefits from the protection of regional Common External Tariffs (see further discussion on this in the next section at the country level)
This variation in product-level NRP is important A highly positive NRP for maize as seen in Kenya means that more maize will be produced by Kenyan farmers than if NRP were the same for all products Policy incentives and disincentives to farmers may distort their production patterns and affect their choice of crops to produce beyond just their decisions on quantities of production
Farmers specialize by product meaning that changing the balance of product-level NRP does not affect all farmers equally Farmersrsquo product specialization will often overlap with demographic variables meaning that changes to the NRP for one product can cause differential distributional and political economy effects Differential effects can occur at the following levels and forms
bull Region different agroecological zones grow different crops (InterAcademy Council 2004)
bull Gender men and women have different patterns of specialization by crop (Laborde amp Lallemant 2018)
bull Ethnic groups in many areas ethnic groups tend to specialize in either livestock or crops (Michalopoulos 2012)
bull Small and large farmers some crops are mainly the specialization of larger plantations while other are mainly produced by smallholders and sold to local markets (Smalley 2013)
52 Country-Level DiagnosticsThis section reviews the 12 focus countries Burkina Faso Ethiopia India Kenya Malawi Mali Mozambique Rwanda Tanzania Uganda Zambia and Zimbabwe
Table 2 provides a set of key indicators used in our assessment of the anti-agricultural bias measured using the relative rate of assistance Our focus is on the recent past centered around 2015 but we also provide value for 2010 to check the trend over the last five years This assessment of bias also incorporates the rate of protection in agriculture and non-agricultural sectors with a specific focus on import trade policies We also indicate recent evolutions in the relative rate of assistance
Reviewing individual country experiences we need to check first if the bias is coming from a difference in tariffs (if agriculture is less nominally protected than non-agricultural products) before digging into other measures We follow this analytical process for each country
18 AGRICULTURAL BIAS IN FOCUS
Table 2 Contributions to anti-agricultural bias selected indicators
Country Rem
ove
anti
-ag
ricu
ltur
e bi
as p
rior
ity
(lab
ord
e et
al
20
18)
Rel
ativ
e ra
te o
f as
sist
ance
(20
09
-20
11)
Rel
ativ
e ra
te o
f as
sist
ance
(20
14-2
016
)
Evol
utio
n rr
a
(ove
r 5
yea
rs)
Nom
inal
rat
e of
pro
tect
ion
(nrp
)
(20
14-2
016
)
Rol
e of
impo
rt t
arif
fs in
nrp
Mfn
tar
iff
- no
n-ag
ricu
ltur
e
(sim
ple
avg
20
15)
Mfn
- a
gri
cult
ure
(sim
ple
avg
20
15)
Pub
lic a
g e
xpen
ditu
res
(as
sha
re o
f g
dp
20
12)
Ethiopia -42 -67 -61 low 17 22
India -21 -25 -18 low 10 33
Kenya -16 13 20 high 12 20 6
Rwanda 23 -16 -11 low 12 20 6
Burkina Faso -9 5 9 high 12 15 9
Malawi -29 -26 -21 low 12 18 4
Tanzania 2 21 36 high 12 20
Togo -13 -7 12 15 5
Uganda -19 -5 35 high 12 20 3
Zambia -42 -12 13 19
Mali -28 -34 -26 low 12 15
Mozambique -13 1 9 high 10 14 2
Source Authorsrsquo compilation from various sources Ag-incentivesorg SPEED (IFPRI) TRAINS (UNCTAD) Laborde et al 2017
Note ldquoRemove of anti-agricultural biasrdquo priority is based on the agricultural transformation project Higher number of dots indicates a higher
level of priority
AGRICULTURAL BIAS IN FOCUS 19
EthiopiaAnti-agricultural bias in Ethiopia is driven by very low output prices for farmers which equates to a large negative NRP while the rest of the economy enjoys significant protection The average most-favoured nation (MFN) tariff rate is 17 per cent
This negative NRP is not due to a lack of import tariffs on agricultural products which average about 22 per cent
The negative rate of protection on farm products is driven by teff and maize at three-quarters of the overall cost of distortions with farm gate prices at about 70 per cent on average lower than world prices These negative prices largely overwhelm other policies linked to government support for agriculture
Key Sources of Anti-Agricultural Bias
bull Imposition of an export ban for maize intermittently throughout the period reviewed (2010ndash2015) which penalized domestic producersrsquo prices by reducing total demand for the commodity
bull Market distortionsmdashincluding asymmetry of information between producers and wholesalers along with unbalanced market powermdashcontributed to a lack of integration of domestic markets with international ones alongside poor price transmission between international and local markets
IndiaAnti-agricultural bias is moderate in India Although agriculture is highly protected compared to other sectors in terms of tariffsmdashaveraging 33 per cent versus 10 per centmdashdomestic prices are still far below world prices In 72 per cent of observations (15 commodities considered over 10 years) commodity prices were below export parity prices with the main commodities being rice groundnuts and cotton This is due to the use of export restrictions meant to protect domestic consumers by keeping these domestic commodity prices low
Key Sources of Anti-Agricultural Bias
bull Export restrictions especially in the form of export bans on rice and wheat in the 2000s kept domestic prices low Temporary export prohibitions and quotas were also put in place for milk powder edible oil peas and pulses
bull Beyond staples export commodities such as bananas and mangoes receive low producers prices due to policies and institutions that result in a high level of domestic market fragmentation and limited competition
bull Facing low domestic prices the government initiated a policy of minimum support prices for 23 commodities and subsidies for inputs These subsidies were mainly for fertilizers but government support was also provided for irrigation and credit The government also provided high-yielding seed varieties at a subsidized price These support measures did not offset the negative effect of the export restrictions
20 AGRICULTURAL BIAS IN FOCUS
KenyaAnti-agricultural bias is present in Kenya but to lesser degree than neighbouring Ethiopia On average agricultural tariffs are much higher than the economy-wide average at 20 per cent compared to 13 per cent Thus anti-agricultural bias is not caused by differentiated tariffs
Importantly Kenya has a notable mix of active policies contributing to both pro- and anti-agricultural biases For instance a price-setting mechanism for tea creates significant positive support that stabilizes income for producers when world prices fall
Key Sources of Anti-Agricultural Bias
bull Excessive market access costs within the country such as poor road networks in rural areas along with high margins8 lead to lower prices for producers
bull During the 2000s good organization of the tea value chain with monitoring of all stages by the Tea Development Agency contributed to positive price incentives for tea production
RwandaRwanda has no anti-agricultural bias Average protection for agricultural products is 20 per cent versus 12 per cent for all products
Key Sources of Agricultural Bias
bull Rice producers are protected by a particularly high tariffmdash the East African Community Common External Tariff (EAC CET) of 75 per cent for the considered period9mdashand minimum farm gate prices This allows them to enjoy an NRP of more than 100 per cent
bull Inputs particularly fertilizers are heavily subsidized
bull For exported products an inefficient government price-setting mechanism and high marketing costs reduce producersrsquo price for tea
Burkina FasoAnti-agricultural bias is present in Burkina Faso though it is declining Average economy-wide product protection is at 12 per cent compared to agricultural product protection at 15 per cent so the anti-agricultural bias is the result of other factors
Key Sources of Anti-Agricultural Bias
bull The temporary suspension of import tariffs in the wake of the 2008 food price crisis reduced price incentives for rice producers
bull Subsidized sales of rice by state agencies lowered market prices and thus reduced price incentives
bull Farmersrsquo bargaining power was low at the wholesale level due to the oligopolistic structure of markets
bull Privatization of the public cotton company coupled with a price stabilization fund benefited cotton producers providing stable prices and moderate incentives
8 For the Kenya Tea Development Agency (KTDA) for instance9 The EAC CET on rice has been reduced recently to 35 per cent in 2018 However partner states use numerous exemptions approved on a year-by-year basis EAC Gazette Notice No 8 of 2018
AGRICULTURAL BIAS IN FOCUS 21
MalawiThe level of anti-agricultural bias in Malawi is high Trade policy is not biased against agriculture the average agricultural tariff rate is 18 per cent compared to the economy-wide average of 12 per cent
Key Sources of Anti-Agricultural Bias
bull Intermittent import bans have caused large variations in maize prices Since 2010 the NRP for this commodity has oscillated between -38 per cent to +42 per cent
bull Minimum support prices for maize for farmers were not effective maize was subject to -23 per cent of the NRP on average in the recent years
bull Poor rural infrastructure and high trader margins created disincentives for maize producers
bull A significant input subsidy program supports maize production but does not offset the disincentives
bull On the export side tea producers have suffered from an overvalued exchange rate and a price-setting mechanism that systematically sets prices lower than world equivalents There is an NRP of -52 per cent
TanzaniaThere is currently no anti-agricultural bias in Tanzania a strong shift compared to 10 years ago Agriculture is more protected than other sectors with an average tariff for agricultural products of 20 per cent compared to 12 per cent for all products
Key Sources of Anti-Agricultural Bias
bull The implementation of EAC CET at 75 per cent contributed to price incentives for the rice sector10
bull On the export side intermittent export bans and limited competition reduced farmersrsquo bargaining power penalizing the maize sector However this was partly offset by a government price support program The NRP has averaged 53 per cent in recent years but has fluctuated by more than 50 points on a year-to-year basis
UgandaThe level of anti-agricultural bias in Uganda is moderate Tariffs protect agriculture more than the other sectors at 20 per cent for agricultural products versus 12 per cent for all products and the structure of border protection is not the driver of the anti-agricultural bias
A fall in external demand has negatively affected the price of some export products like maize
Key Sources of Anti-Agricultural Bias
bull As in Tanzania implementation of EAC CET at 75 per cent for rice largely protected rice production Rice has an NRP of 70 per cent
bull Restrictions on cross-border trade for animal products has hurt livestock producers creating a negative rate of protection in contrast to the removal of such restrictions for most crops
bull Liberalization (dismantling of parastatals) of maize and coffee markets in the 1990s yielded volatile prices but contributed to shifting incentives from negative to positive
bull High market access costs such as transportation are still penalizing maize exports
10 See also Footnote 19
22 AGRICULTURAL BIAS IN FOCUS
ZambiaThe level of anti-agricultural bias in Zambia is high yet agricultural tariffs are higher than the economy-wide average at 19 per cent versus 13 per cent respectively Disincentives were particularly high for cotton groundnuts tobacco and maize Export bans on maize are recurring even if their imposition is temporary Maize accounts for the largest portion of Zambiarsquos agricultural production value Its domestic prices are at 68 per cent below the world price creating most of the anti-agricultural bias
Key Sources of Anti-Agricultural Bias
bull Producers faced prices below world average prices in the 1990s and the 2000s mainly due to the monopsonistic nature of agricultural markets and the overvaluation of the exchange rate Liberalization of the maize market started in the 1990s but was not effective the market remained concentrated with low competition in addition the government continued to intervene in the form of a food reserve agency that manages buffer stocks and is the largest distributor of fertilizers
bull Large input subsidy programs and minimum price systems did not offset the negative effects of other policies A uniform pricing system has hurt poor farmers in non-border areas by failing to allow geography and domestic market access to be reflected in price
MaliAnti-agricultural bias in Mali is high and has been increasing since 2000 There is no bias from tariffs The average tariff rate for agricultural products is 15 per cent compared to 12 per cent for all products
Key Sources of Anti-Agricultural Bias
bull For rice the introduction of the West African Economic and Monetary Union (WAEMU) CET in the 2000s contributed to incentives for producers but this was offset by tariff removals in the wake of the 2008 food price crisis along with price ceilings in 2008ndash2009 to protect consumer access to food
bull Large input subsidies for both rice and maize contributed to lower production costs however poor infrastructure high transportation costs and illicit taxes (illegal payments linked to road harassment) contributed to lower net output prices for producers
bull The mix of policies lead to varied outcomes depending on the crop with a positive NRP of 21 per cent on rice and a negative rate of protection of 71 per cent for maize
AGRICULTURAL BIAS IN FOCUS 23
MozambiqueAnti-agricultural bias is moderate in Mozambique Agriculture is protected with tariffs averaging 14 per cent compared to 10 per cent for all products
Key Sources of Anti-Agricultural Bias
bull For rice the depreciation of the local currency vis-agrave-vis the USD benefited local producers making imports more expensive This effect was dampened and even offset by ineffective application of import tariffs (with various import flows avoiding taxation) and input subsidies combined with low levels of price transmission between international and local markets
bull For cotton which is mainly exported a price floor system was set up to protect producers from price drops However it also prevented from producers from benefiting from high prices thus disincentivizing production A cotton development tax initiated on cotton trade also disincentivized cotton production Cotton producers lost bargaining power with the reform of the domestic market which resulted in lower competition among buyers
ZimbabweAnti-agricultural bias is high in Zimbabwe Agriculture is more protected than other sectorsmdashaverage tariffs are 14 per cent for agricultural products versus 10 per cent for other products
Anti-agricultural bias is driven by distortions on groundnuts tobacco cotton soybean and maize
Key Sources of Anti-Agricultural Bias
bull Marketing boards with monopsonistic practices and low minimum prices drove down producer prices particularly for maize and cotton until the mid 2000s
bull A persistently overvalued exchange rate during the 1976ndash2004 period also contributed to price disincentives
bull Direct assistance through input subsidies could not offset disincentives from the market power and exchange rate
bull Liberalization of agriculture in the late 1990s did not bring the expected benefits in terms of price incentives Furthermore the parastatal company that had controlled the maize sector continued to enjoy a monopoly over international maize trading
24 AGRICULTURAL BIAS IN FOCUS
ReferencesAgIncentives (nd) Retrieved from httpwwwag-incentivesorg
Anderson K amp Valdes A (Eds) (2008) Distortions to agricultural incentives in Latin America Washington DC World Bank Retrieved from httpsiteresourcesworldbankorgINTTRADERESEARCHResources544824-1146153362267LAC_overview_0708pdf
Anderson K amp Martin W (Eds) (2009) Distortions to agricultural incentives in Asia Washington DC World Bank Retrieved from httpsiteresourcesworldbankorgINTTRADERESEARCHResources544824-1146153362267Asia_e-book_0209pdf
Anderson K (Ed) (2009) Distortions to agricultural incentives A global perspective 1955 to 2007 London Palgrave Macmillan and Washington DC World Bank Retrieved from httpssiteresourcesworldbankorgINTTRADERESEARCHResources544824-1272467194981DAI_Global_Perspectivepdf
Balassa B (1965) Tariff protection in industrial countries An evaluation Journal of Political Economy 73 573ndash594
Balieacute J Ghins L amp Pernechel V (2018) Agricultural policy incentives in sub-Saharan Africa in the last decade (2005-2016) (Monitoring and Analysing Food and Agricultural Policies [MAFAP] synthesis study) Rome FAO Retrieved from httpwwwfaoorg3i8997enI8997ENpdf
Corden W M (1966) The structure of a tariff system and the effective protective rate Journal of Political Economy 74(3) 221ndash237
InterAcademy Council (2004) African agricultural production systems and productivity in perspective In Realizing the promise and potential of African agriculture Washington DC
Laborde D amp Lallemant T (2017) Agricultural price incentives Towards gender-differentiated indicators (IFPRI-PIM working paper)
Laborde D Lallemant T McDougal K Smaller C amp Traore F (2018) Transforming agriculture in Africa and Asia What are the policy priorities Washington DC IFPRI and Winnipeg IISD
Michalopoulos S (2012) The origins of ethnolinguistic diversity American Economic Review 102(4) 1508ndash1539
Smalley R (2013) Plantations contract farming and commercial farming in Africa A comparative review (Future Agriculture Land and Agricultural Commercialization in Africa (LACA) Project Working Paper 055) Retrieved from httpwwwfaoorguploadsmediaFAC_Working_Paper_055pdf
Tsakok I (2011) Success in agricultural transformation What it means and what makes it happen Cambridge Cambridge University Press
AGRICULTURAL BIAS IN FOCUS 25
This work was undertaken as part of Economic Law and Policy program of the International Institute for Sustainable Development (IISD) and the CGIAR Research Program on Policies Institutions and Markets (PIM) led by the International Food Policy Research Institute (IFPRI)
Funding support for this study was provided by the Bill and Melinda Gates Foundation
This publication has gone through the standard quality assurance procedure of IISD
The opinions expressed here belong to the authors and do not necessarily reflect those of IISD PIM IFPRI or CGIAR
copy 2019 The International Institute for Sustainable Development Published by the International Institute for Sustainable Development
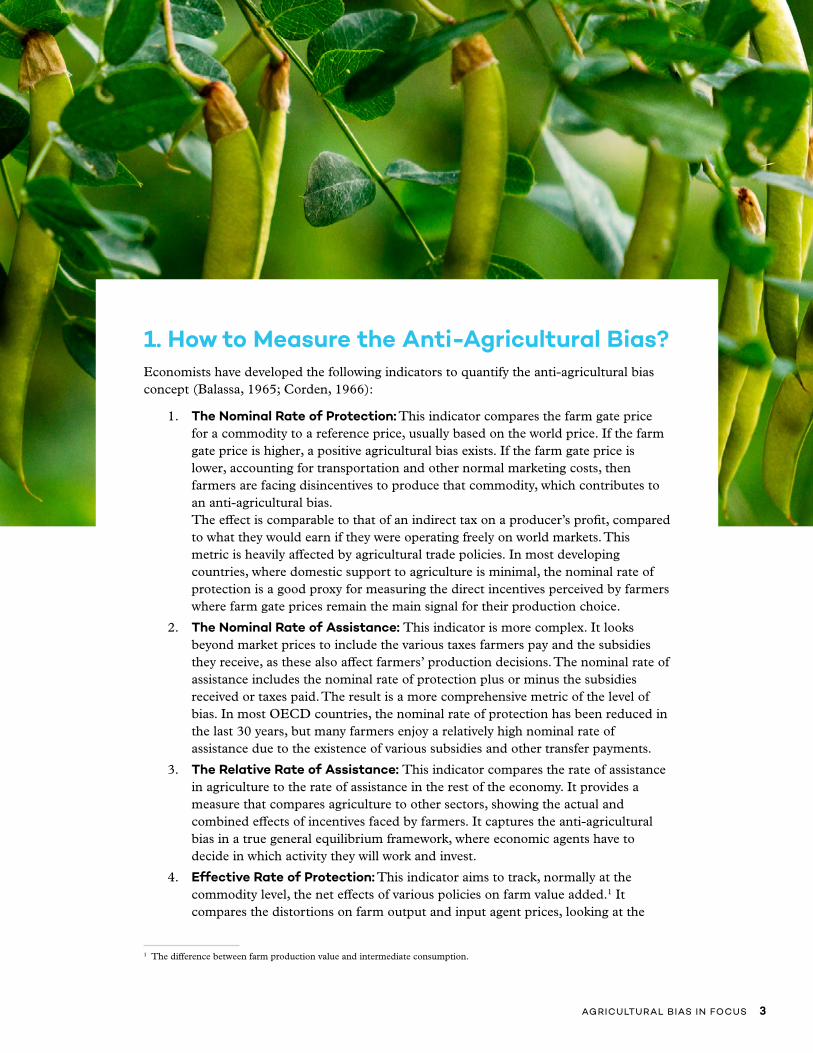
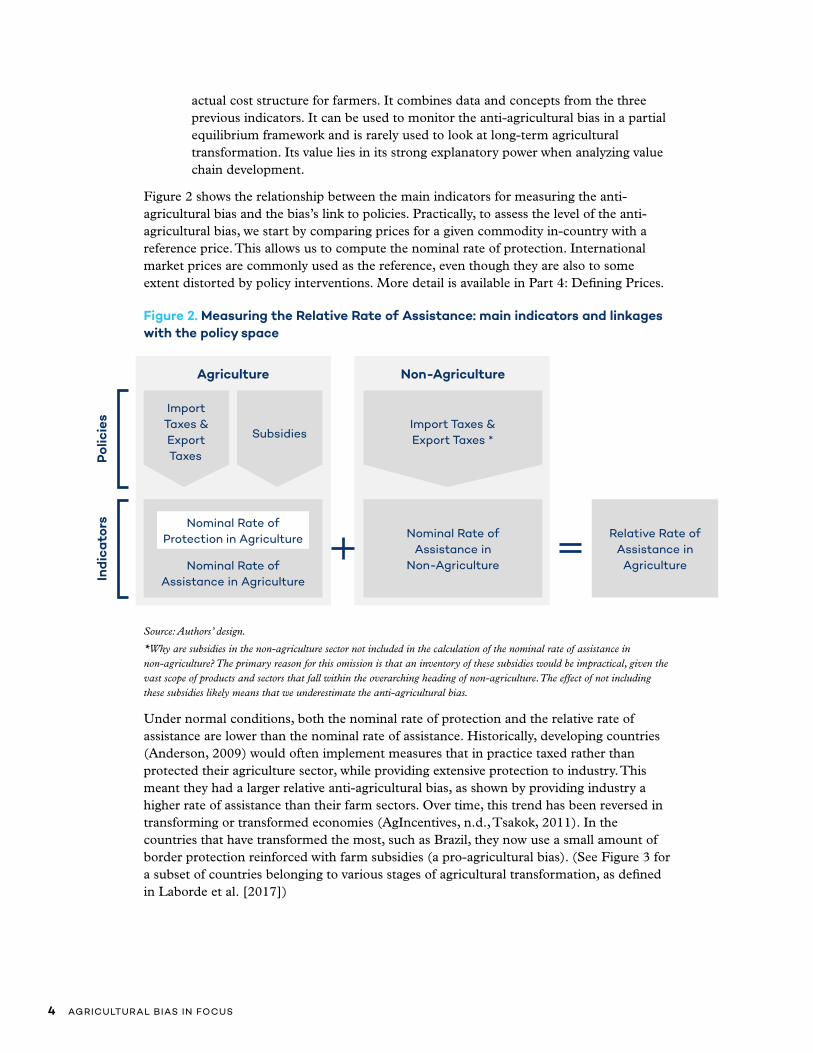
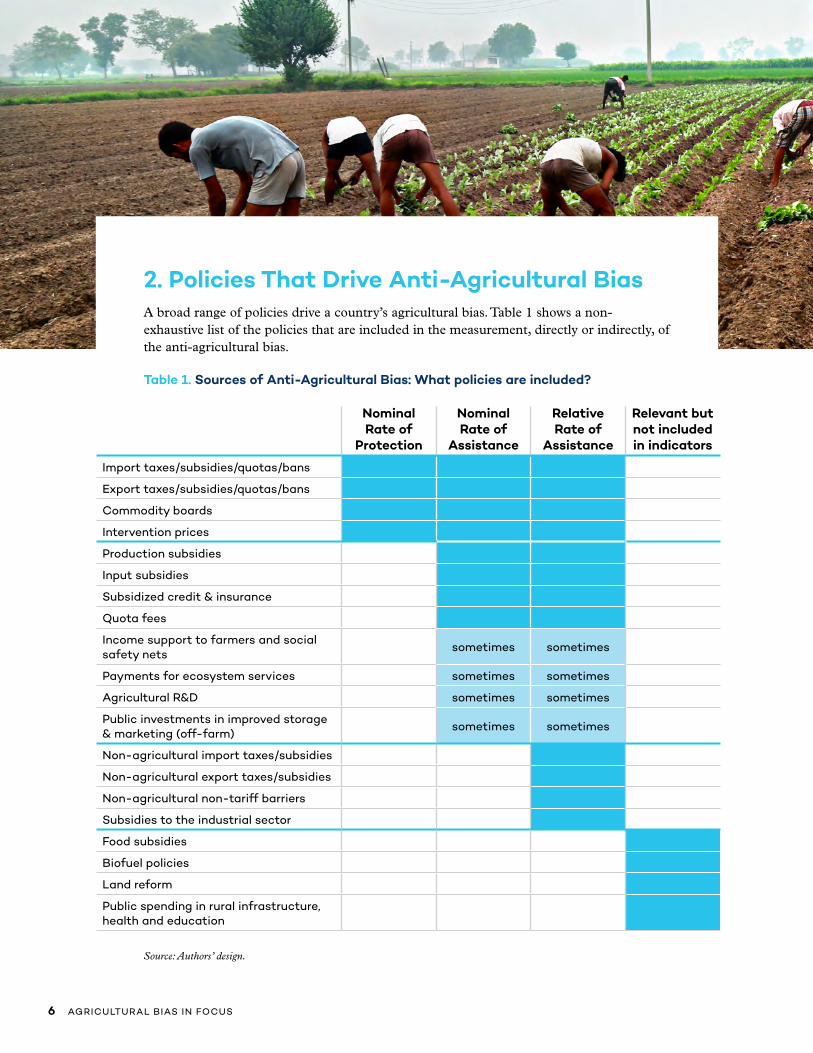
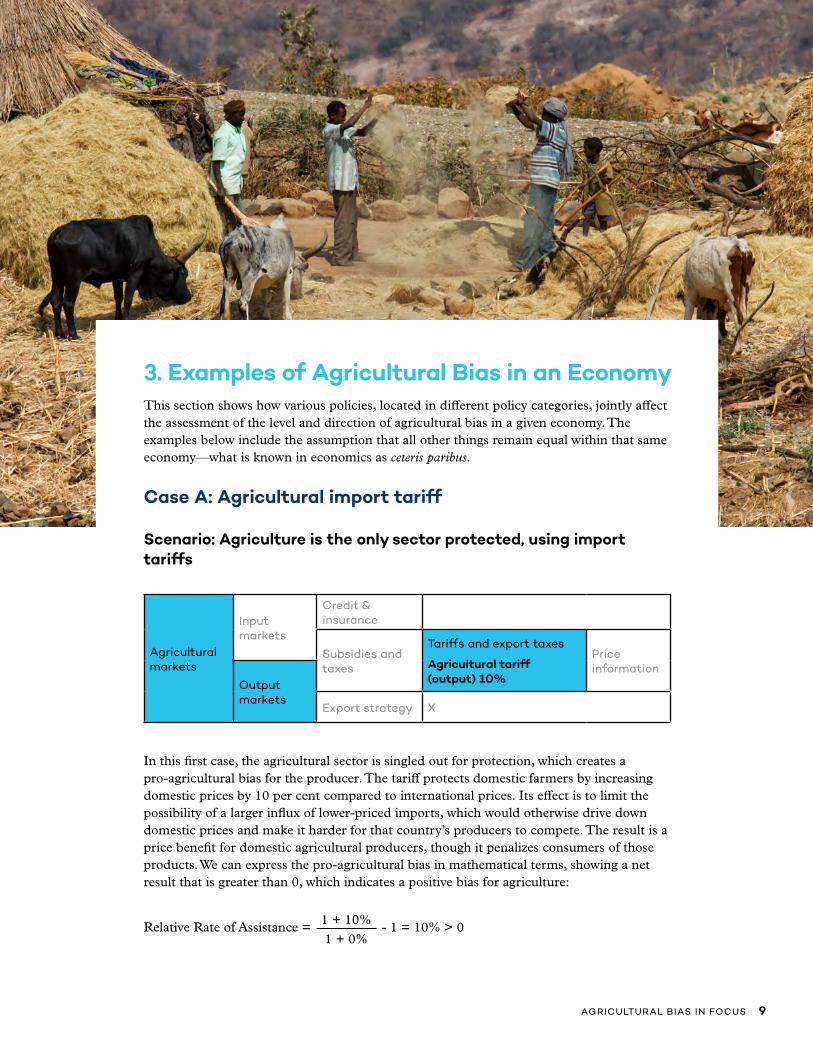
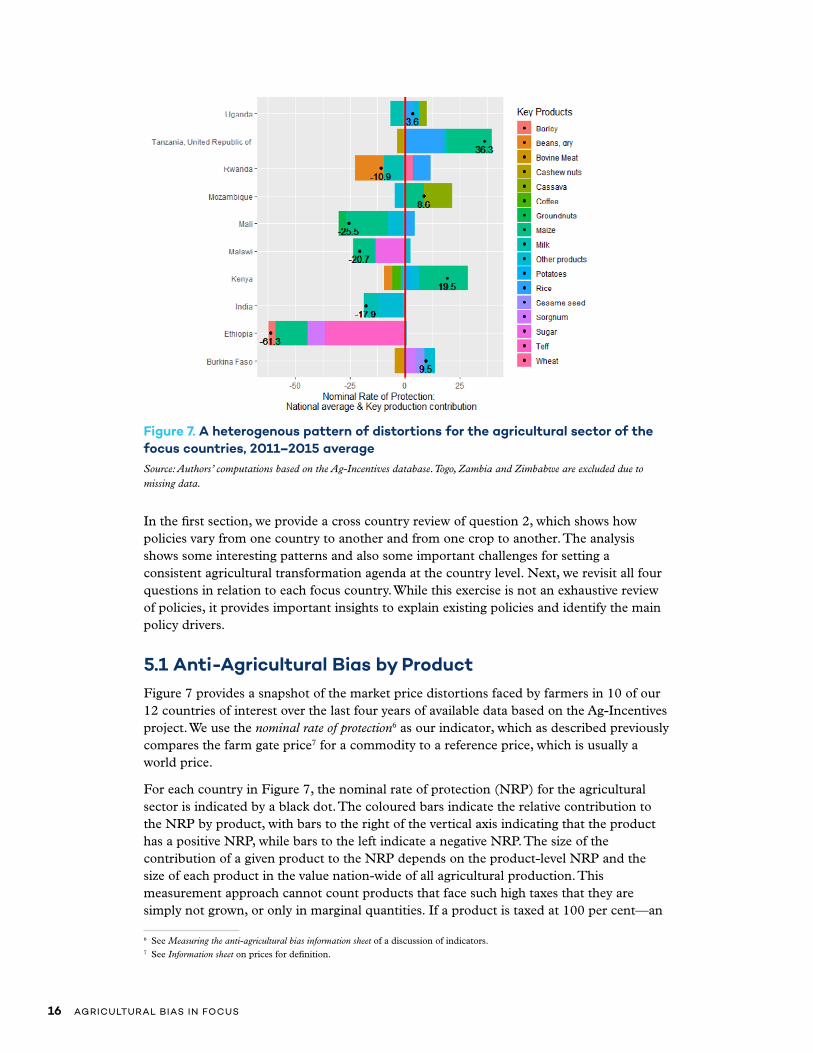
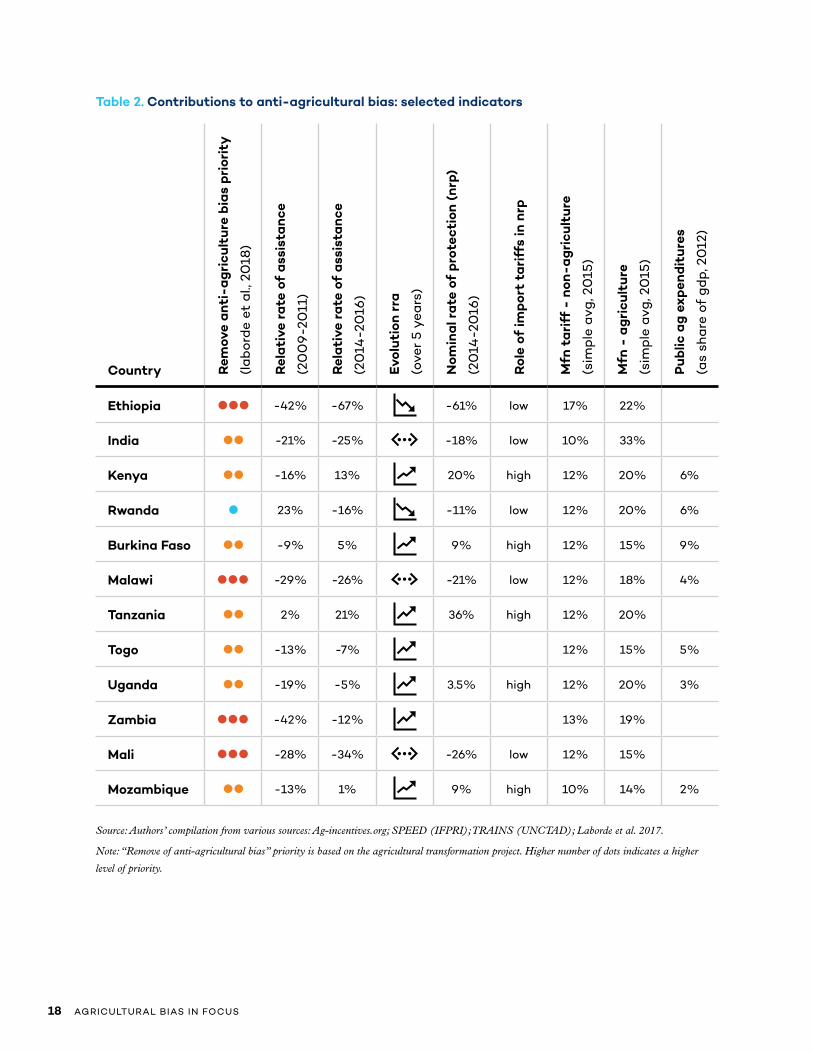

copy 2019 The International Institute for Sustainable Development Published by the International Institute for Sustainable Development