Agribusiness Supply Chain Risk Management: A … · challenges associated with seasonality, ... and...
57
Accepted Manuscript Agribusiness Supply Chain Risk Management: A Review of Quantitative Decision Models Golnar Behzadi, Michael Justin O’Sullivan, Tava Lennon Olsen, Abraham Zhang PII: S0305-0483(16)30274-2 DOI: 10.1016/j.omega.2017.07.005 Reference: OME 1804 To appear in: Omega Received date: 2 June 2016 Revised date: 25 June 2017 Accepted date: 8 July 2017 Please cite this article as: Golnar Behzadi, Michael Justin O’Sullivan, Tava Lennon Olsen, Abraham Zhang, Agribusiness Supply Chain Risk Management: A Review of Quantitative Decision Models, Omega (2017), doi: 10.1016/j.omega.2017.07.005 This is a PDF file of an unedited manuscript that has been accepted for publication. As a service to our customers we are providing this early version of the manuscript. The manuscript will undergo copyediting, typesetting, and review of the resulting proof before it is published in its final form. Please note that during the production process errors may be discovered which could affect the content, and all legal disclaimers that apply to the journal pertain.
-
Upload
truongthuan -
Category
Documents
-
view
216 -
download
0
Transcript of Agribusiness Supply Chain Risk Management: A … · challenges associated with seasonality, ... and...

Accepted Manuscript
Agribusiness Supply Chain Risk Management: A Review ofQuantitative Decision Models
Golnar Behzadi, Michael Justin O’Sullivan, Tava Lennon Olsen,Abraham Zhang
PII: S0305-0483(16)30274-2DOI: 10.1016/j.omega.2017.07.005Reference: OME 1804
To appear in: Omega
Received date: 2 June 2016Revised date: 25 June 2017Accepted date: 8 July 2017
Please cite this article as: Golnar Behzadi, Michael Justin O’Sullivan, Tava Lennon Olsen,Abraham Zhang, Agribusiness Supply Chain Risk Management: A Review of Quantitative DecisionModels, Omega (2017), doi: 10.1016/j.omega.2017.07.005
This is a PDF file of an unedited manuscript that has been accepted for publication. As a serviceto our customers we are providing this early version of the manuscript. The manuscript will undergocopyediting, typesetting, and review of the resulting proof before it is published in its final form. Pleasenote that during the production process errors may be discovered which could affect the content, andall legal disclaimers that apply to the journal pertain.

ACCEPTED MANUSCRIPT
ACCEPTED MANUSCRIP
T
Highlights
• Providing the first literature review of risk management models specifically for agribusiness
supply chains.
• Focusing on specific sources of uncertainty in agribusiness industries.
• Providing new implications and further directions for developing the research in the context of
agribusiness supply chain risk management.
• Providing the first literature review of risk management models specifically for agribusiness
supply chains.
1

ACCEPTED MANUSCRIPT
ACCEPTED MANUSCRIP
T
Agribusiness Supply Chain Risk Management: A Review ofQuantitative Decision Models
Golnar Behzadi*a, Michael Justin O’Sullivana, Tava Lennon Olsenb, Abraham Zhangc,d
aDepartment of Engineering Science, Faculty of Engineering, The University of Auckland, Auckland 1010, NewZealand
bInformation Systems and Operations Management, Business School, The University of Auckland, Auckland 1010,New Zealand
cAuckland University of Technology (AUT) Business School, AUT, Auckland 1010 New ZealanddDepartment of Management Systems, University of Waikato Management School, Hamilton 3240, New Zealand
Abstract
Supply chain risk management is a large and growing field of research. However, within this field,
mathematical models for agricultural products have received relatively little attention. This is some-
what surprising as risk management is even more important for agricultural supply chains due to
challenges associated with seasonality, supply spikes, long supply lead-times, and perishability. This
paper carries out a thorough review of the relatively limited literature on quantitative risk manage-
ment models for agricultural supply chains. Specifically, we identify robustness and resilience as two
key techniques for managing risk. Since these terms are not used consistently in the literature, we
propose clear definitions and metrics for these terms; we then use these definitions to classify the
agricultural supply chain risk management literature. Implications are given for both practice and
future research on agricultural supply chain risk management.
Keywords: Agribusiness supply chain, risk management, robust, resilient
1. Introduction
In the past two decades, supply chain risk management (SCRM) has emerged as an important re-
search topic [1]. Several reasons are behind this development: 1) globalization has made supply chains
longer and more complex; consequently, supply chains are now exposed to more risks and have be-
come more vulnerable; 2) the lean management philosophy has become widely implemented in many
industries; this philosophy advocates waste elimination/minimization and embraces just-in-time pro-
duction/logistic; although it improves supply chain efficiency, the removal/reduction of redundancies
has resulted in greater supply chain vulnerability under adverse events; and 3) the world has paid
increasing attention to the many supply chain disruptions that have been caused by catastrophic
events (e.g., [2, 3, 4, 5]).
Preprint submitted to Elsevier 27th July 2017

ACCEPTED MANUSCRIPT
ACCEPTED MANUSCRIP
T
Agribusiness plays an indispensable role in the world’s economy as a key source of food supplies.
Agribusiness products have three specific characteristics that make risk management for agribusiness
supply chains (ASCs) more complicated when compared to risk management for typical manufac-
turing supply chains. These characteristics are seasonality, supply spikes (sometimes referred to as
“bulkiness”), and perishability. Dealing with seasonality requires planning as growth is seasonal
whereas consumption is throughout the year. Further, most agricultural products have long supply
lead times that cannot be easily altered against nature. Harvesting and post-harvest activities, in-
cluding packing, processing, storage, and transportation, can be very demanding because of supply
spikes. Furthermore, there is often significant time pressure on post-harvest activities as most agricul-
tural products are perishable. Also, because of the perishability, there is a need for specific handling,
storage, and inventory management. If not properly managed, a delay in transportation may cause
substantial loss of product value.
In addition to product specific characteristics, risk management is important for ASCs because they
often involve more sources of uncertainties than manufacturing supply chains [6]. In an ASC, the
supply process is related to biological production (food crops, meat, etc.), which is affected by weather
variability (e.g., droughts), disease (e.g., Psa kiwifruit disease), and pests (e.g., locusts). Such factors
imply that both harvest levels and harvest times are subject to uncertainties. In addition, these
factors can impact on the quality of the produce. In particular, in the processing stage, there are
special risks associated with food quality and food safety (e.g., botulism risks). These uncertainties
make ASCs more vulnerable than typical manufacturing supply chains. Furthermore, recent practices
in agribusiness have added to the complexity of ASCs, thus making the application of risk manage-
ment strategies more critical [7]. Such practices include the use of new marketing strategies (e.g., in
product differentiation/proliferation) and the interlinked design of global supply chains [7].
This paper fills a gap in the literature by providing a review of quantitative models for ASC risk
management. Our focus is on risks at the supply chain level, and related risk management method-
ologies for ASCs that foster resilience and robustness, terms that we will carefully define. We review
different quantitative risk management (RM) approaches that provide resilience and robustness for
a variety of agricultural products. As pointed out by [3] and [1], there are a lot of inconsistencies in
the meanings of SCRM terms. One contribution of this review is to suggest metrics for resilience and
robustness.
3

ACCEPTED MANUSCRIPT
ACCEPTED MANUSCRIP
T
The remainder of this paper is organized as follows. Section 2 outlines the scope of our review
in Agribusiness Supply Chain Risk Management (ASCRM) and reviews related survey papers. The
key concepts and terms in this review are defined in Section 3. Section 4 classifies the available
modeling studies in ASCRM according to different aspects of product type, risk types, risk measures,
and RM strategies (i.e., robustness and resilience). In this section, modeling approaches are further
analyzed for different types of agricultural products. At the end of Section 4, a specific overall sum-
mary of the section is provided that identifies gaps in the research literature. The paper is concluded
in Section 5 by proposing directions for future research.
2. Literature
Applications of quantitative models in agricultural problems date back to the 1950s and have been
addressed widely in the literature [8, 7]. Modeling approaches in agribusiness have been predomin-
antly used for problems related to transportation, distribution, harvesting, facility location, and farm
planning (e.g., [9, 10, 11, 12]), with a specific focus on farm planning problems. Key considerations
in agricultural problems (i.e., yield, harvest time, demand, etc.) are influenced by different sources
of uncertainty such as weather conditions, animal or crop diseases, and price variability. Although,
as described in the following, there are separate and extensive review studies on both quantitative
risk management and agribusiness models, we are not aware of any review paper thus far on SCRM
models in agribusiness, which is the topic of our review.
Articles [13], [14], [15], [16], [5], [1], and [17] reviewed the bulk of the quantitative SCRM liter-
ature, mostly in the context of manufacturing industries. Agribusiness decision models have been
reviewed in the areas of production, harvesting, and distribution [8, 7, 18, 19], facility locations [11],
supply-side resource utilization [20], ASC planning challenges [21], and operational issues that res-
ult in post-harvest waste [22]. Further, [23] reviewed quantitative ASC models in the contexts of:
planting, harvesting, production, distribution, and inventory; [24] extended the review of agribusiness
problems (in the context of supply chains) in considering factors of uncertainty. However, neither of
the review papers discuss risk management strategies, so cannot be considered as reviews of SCRM.
Thus, as depicted in Figure 1, to the best of our knowledge, there is no review specific to quantitative
models in the joint area of SCRM and agribusiness. As mentioned above, this overlap will be covered
by our review paper.
4

ACCEPTED MANUSCRIPT
ACCEPTED MANUSCRIP
T
Figure 1: Venn diagram on the research gap in literature reviews/survey papers
[8][25][11] [7][20][18][21][19]
[22][23] [24]1
Agribusiness
The scope ofthis review paper
[13] [14] [15][16][5] [1][17]SCRM
Note that risk management is not new to agribusiness planning. For instance, [26, 27] introduced the
basic concepts of risk management in agriculture. Further, [25] reviewed farm decision-making under
risk from several aspects such as utility functions, farmer risk preferences, and response approaches
to both short-term and long-term uncertainty. However, the main concern of these aforementioned
studies was farm level risks and uncertainties, whereas we have focused on risks at the supply chain
level.
We reviewed papers from different journals in Operations Management (OM), Operations Research
(OR), Supply Chain Management (SCM), and agriculture. We searched the Scopus database using
combinations of keywords including “risk management,” “quantitative risk management,” “supply
chain,” “operations research,” and “agribusiness”. In addition, we went through all the papers sur-
veyed in the review papers from Figure 1 for SCRM papers with an agribusiness application (left hand
side survey papers) and agribusiness papers that focused on SCRM (right-hand-side survey papers).
We defined supply chain broadly as any paper that modeled multiple locations or firms.
We believe [28], published in 1993, is the first quantitative study in the field of agribusiness that
considered risks in supply chains, although without directly referring to the term “supply chain.”
1 Article [24] reviews agribusiness problems in supply chain structures and includes uncertainty attributes; however,as risk management strategies have not been clearly discussed in this review, the review has not been categorized underthe SCRM section.
5

ACCEPTED MANUSCRIPT
ACCEPTED MANUSCRIP
T
Before that, risks in agribusiness had only been discussed at the farm level (see [26]). Article [28]
studied a vegetable processing supply chain problem with two echelons that consider production,
trimming, and processing decisions under uncertain climatic factors. In contrast with [28], most of
the reviewed papers after 2000 have explicitly referred to the term supply chain in their studies.
As 1993 appeared to us to be a late date for a first study, we carried out further research on the timing
of the field. The term “supply chain management” appears to have first been used in an interview
in the Financial Times in 1982 [29]. However, the concept of multi-echelon inventory control was
addressed well before the introduction of “supply chain management (SCM)” [29]. Our search on
“multi-echelon” and “agribusiness” yielded no RM papers earlier than [28]. It appears that when a
flurry of articles and books came out on the subject of SCM in the mid-1990s, the concept began to be
used in other fields of study, such as agribusiness. However, a recent review on SCRM indicates that
the concept of risk management has still received noticeably less attention in the field of agribusiness
and biological sciences compared to fields such as engineering, decision sciences, and business [1].
The latter statement has been supported by the findings of our review that particularly focused on
agribusiness supply chain risk management studies. Table 1 lists the main issues addressed in the
literature of quantitative SCRM modeling in agribusiness from 1993 until the present, ordered by
decreasing publication date.
6

ACCEPTED MANUSCRIPT
ACCEPTED MANUSCRIP
T
Table 1: Summary review of the literature in quantitative ASC risk management
Reference Issue addressed
[30] Single-period, multi-product food production planning model (with applications incocoa/wheat/palm oil/corn/soybean supply chains) that maximizes the expectedprofit of the processing firm by determining the procurement policy under fixed pro-portional production.
[31, 32] Handling model for an export-oriented Canadian wheat supply chain that providessafety and quality assurance under minimum farmers’ total cost including cost of: lossat test point, contamination penalty, and risk control effort.
[33] Supermarket-farmer coordination model in an agricultural commodity supply chainthat distributes the profit and improves its effectiveness.
[34] Supply planning model for linseed oil processor in a polymers production supply chainthat maximizes the expected profit under raw material quantity/quality and marketdemand uncertainty.
[35] Buyer-backup supplier coordination model that maximizes the expected profit bydetermining the buyer firm’s reserve quantity and the backup supplier’s installedcapacity in a single-period (short-life) food supply chain.
[36] Multi-period capacity management model that maximizes the expected revenue ofan agri-food processor (the palm oil mill) by determining processing/storage capacityinvestments for the first period and periodic inventory decisions for the followingperiods.
[37] Production, transportation, and marketing model that minimizes the expected totalcost of production by determining the delivery waiting time for the final product andthe processing time of production in a perishable fresh-crop supply chain.
[38] Post-harvest logistics management model for respiring, deteriorating fresh crops thatmaximizes the total expected inventory and shortage costs, by determining proper lot-sizes for finished products in RTIs (return transport items) and selling price duringthe deterioration process, under a stochastic lead-time of receiving RTI from buyer,in a closed-loop supply chain.
[39] Aggregate production planning for a frozen orange juice supply chain that minimizesthe total cost of supply, inventory, and shortage under uncertainty in citrus juiceacidity specification.
[40] Production planning model for a biofuel supply chain that maximizes expected profitby determining purchasing, processing, and production decisions.
[41] Robust supply chain design model applied in an agricultural (rice) supply chain thatmaximizes expected profit and minimizes the ratio of performance deviation to avariation of uncertain parameters by determining supply chain flow and location de-cisions.
[42] Single-period farming, procurement, and process planning model that maximizes ex-pected profit in the processing firm by determining proper ordering quantities of allsources and their corresponding processing rates in a cocoa production supply chain.
[43], [44] Multi-period operational production and distribution planning model in a crop (i.e.,tomato and bell pepper) supply chain that maximizes the growers’ expected profitsduring harvest under uncertainty by making a trade-off between freshness and cost.[43]extends [44] by considering various sources of uncertainty, particularly on a crop’sprice and yield.
[45] Multi-objective stochastic model for a hydrocarbon bio-refinery supply chain thatminimizes the annual cost and financial risk by determining network design, techno-logy selection, production investment, and planning decisions.
[46] Closed-loop supply chain design model with applications in both food and high-techmanufacturing industries that minimizes the total supply chain cost under uncertaintyassociated with purchase costs and demand.
[47] Fuzzy network design in a consumable vegetable oil supply chain that minimizes thetotal transportation cost and labor sources under probabilistic warehousing or refinerycapacities and market demand.
[48] Tactical planning model for an olive oil supply chain that maximizes expected profitby determining farm areas and best seeding times.
7

ACCEPTED MANUSCRIPT
ACCEPTED MANUSCRIP
T
Summary review of the literature in quantitative ASC risk management continued
Reference Issue addressed
[49] Single-period multi-product meat supply chain design model that maximizes thepacker’s expected profit, plant utilization, and animal non-uniformity given procure-ment, processing, and production decisions.
[50] Production planning model for multi-period, multi-product (perishable/powder) dairysupply chain that maximizes the expected profit by determining the optimal salespolicy.
[51] Single-period production planning model that maximizes the expected return by de-termining the optimal amount of space to be leased for production and the quantityof olives to be provided from external sources under yield and yield-dependent costuncertainties in a Turkish olive oil supply chain.
[52] Investment and production planning model in a single-period biofuel supply chain thatmaximizes the expected profit by determining investment decisions in a processingplant and flow decisions along the supply chain.
[53] Robust aggregate production planning model that minimizes the total cost of produc-tion, staffing, inventory, transportation, and shortage and maximizes the customers’satisfaction in a wood and paper production supply chain under uncertainty associ-ated with cost parameters and demand.
[54] Inventory model under supplier-retailer collaboration on demand forecasting in a per-ishable agri-food supply chain that maximizes the expected profit by determining anoptimal replenishment policy.
[55] Robust optimization model for harvest planning in a grape (wine) supply chain un-der yield (harvest productivity) uncertainty that maximizes the expected profit bydetermining the optimal labor assignments at different harvest-blocks and times.
[56] Enterprise decision model (i.e., to join to or form a co-op) in a dairy supply chainthat maximizes the expected income of farmers by determining co-op decisions (aboutsize, conditions, and product quantity), production, and shipment planning.
[57] Winery allocation model in a wine supply chain that maximizes the expected profitcomposed of sales and salvage value minus total production, packaging, and storagecosts under demand uncertainty.
[58] Contract model between a large seed supplier and multiple retailers in a seeds supplychain that maximizes the expected total channel of profit by determining contractparameters that result in supply chain coordination.
[59] Inventory model for perishables in a fresh vegetable supply chain that maximizesexpected profit by determining the optimal planting batch in each harvest period.
[60] Robust multi-site, medium-term production planning model that minimizes the ex-pected total cost for the producer including costs of production, labor, workforcechange, shipment, and inventory by determining shipment, inventory, sale, and labordecisions in a cotton/silk (lingerie) supply chain.
[61] Production planning model for a premium-brand tomato supply chain that maximizesthe expected profit and meets the minimum service level by balancing overage cost,especially related to perishability, and underage cost of lost customers.
[62] Capacity management and logistic network design model for an export fruit supplychain that maximizes throughput by determining the optimal flow between nodes andinvestigating the possibility of a capacity extension.
[63] Production planning and scheduling model in a multi-commodity fruits/juices (applesand pears) supply chain that maximizes the expected sales’ income by determiningstorage, process, and sales policies.
[64] Investment management in a concord grape and juice production supply chain thatminimizes the expected total cost of underage and overage through a trade-off betweenoverinvestment and lack of capacity by determining the optimal pressing rates.
[65] Single long-period (two-year) production planning model that maximizes expectedsales in an olive oil supply chain by determining optimal leased farms and the pro-duction policy.
8

ACCEPTED MANUSCRIPT
ACCEPTED MANUSCRIP
T
Summary review of the literature in quantitative ASC risk management-further continued
Reference Issue addressed
[66, 67] Sequential two-period newsvendor harvest/inventory planning model in a hybrid seed-corn supply chain that maximizes the margin by determining the number of acresin each period (in the 2003 version the model has been extended to multi-productproduction planning).
[68] Production planning model in an Ilium flower supply chain that maximizes the expec-ted total revenue by determining quantities of varieties of bulbs and flowers in eachstage of the supply chain.
[69] Facility location/allocation model that minimizes the expected production and trans-portation costs under a green production scheme, uncertain daily demand, and scen-arios of supply failures in a dairy (raw milk) supply chain.
[70] Medium-range horizon multi-period production planning model in a tomato supplychain that minimizes the total packing cost for the packing plant and the penalty costfor the delayed harvest.
[28] Multi-period production model in a vegetable processing supply chain that minimizesthe total harvest and production cost and meets capacity and market limitations bydetermining harvesting, flow, processing, and logistics decisions.
As demonstrated in Table 1, quantitative agricultural risk models have been discussed in various
contexts of farm management, production management, scheduling, and pest/disease management
for supply chains in different crops/livestock. The following characterizes this work further and
highlights gaps for future research.
3. Agribusiness SCRM Classification Terms
In this section, we identify the key concepts of our review in agribusiness supply chain risk manage-
ment (ASCRM). In particular, we describe different aspects that have been discussed in the reviewed
papers, which include: product types, risk types, and approaches to the modeling and management
of risk. In Section 4, we use these aspects to classify the papers in Table 1.
3.1. Agribusiness Supply Chain Product Types
An agribusiness supply chain encompasses all components of a “farm-to-fork” process for a given food
product; these include various stages related to supply, production, post-harvest, storage, processing,
distribution, and linkages between components. Thus, the basic concepts are similar to manufacturing
supply chains. However, the additional characteristics of ASCs (as described in Section 1, especially
perishability) can make ASCs relatively more complex.
ASCs can be classified into different classes by the types of products produced. Some agricultural food
products are referred to as crops (and sometimes agri-food crops) and include products obtained dir-
ectly from plants. Other agricultural products such as cattle, meat, or seafood are known as livestock.
9

ACCEPTED MANUSCRIPT
ACCEPTED MANUSCRIP
T
The livestock category also includes dairy products (e.g., milk, cheese) and non-food products (e.g.,
wool, hair, silk). Importantly, both livestock products and crops are either perishable or long-life.
For example, fruits, fresh vegetables, and meat products are perishable. However, wheat and wool
are considered to be long-life. Perishable crops can be further classified into respiring or non-respiring
products and perishable livestock is divided into three classes of fresh, chilled, and frozen products.
Within agri-foods, respiring crops and fresh livestock products are extremely prone to risk because
of their particular biological characteristics. In Figure 2, we illustrate the classification of different
products within ASCs.
Perishable Long-life
Crops
Perishable Long-life
Respiring
Livestock
Fresh Chilled Frozen
Agribusiness Products
Non-respiring
Figure 2: Product classification of ASCs
Although crops and livestock are common product classifications for ASCs (e.g., in [6]), from a
modeling standpoint, agricultural products can be classified as perishable or long-life because models
that include perishability are often quite different from those that do not. Within the perishable
category, there are second-order characteristics, such as respiring versus non-respiring (for crops) and
fresh versus chilled/frozen (for livestock, e.g. meat), that can also be considered when modeling
perishability. In Section 4, we will divide the literature into long-life and perishable products. First,
in the following subsections, we highlight the modeling differences between these two categories.
3.1.1. Long-life Agricultural Products
The basic modeling difference between long-life and perishable agricultural products is that models
in the category of long-life agriculture products are usually considered in multiple periods over a
10

ACCEPTED MANUSCRIPT
ACCEPTED MANUSCRIP
T
long time horizon. Studies in the context of risk management for long-life agricultural products are
aimed at a variety of decisions such as crop planning, harvest and cultivation scheduling, capacity
investment, production planning of processed foods, food handling, and facility location. Two recent
representative examples of such work include [32] and [30].
Article [32] studied a handling problem for an export-oriented Canadian wheat supply chain that
considers safety and quality issues. They developed a supply chain model to determine appropriate
testing strategies by minimizing the farmer’s total costs including the cost of loss at a test point, a
contamination penalty, and a risk control effort under risks of a farmers’ misrepresentation of data
and technological failure. They proposed a simulation approach in the context of ASC with detailed
assumptions including assumptions on an individual farmer’s behavior.
A second example of an ASC risk model in the context of long-life agriculture is provided by [30].
They investigate a capacity management problem in a palm oil supply chain. The model is developed
as a multi-period supply chain that maximizes the expected revenue of an agri-food processor (the
palm oil mill) through a dynamic stochastic programming approach with a series of two-stage models.
The optimal solution is found by determining processing/storage capacity investment decisions in the
first period, and making inventory decisions under yield and price uncertainties in the remaining
periods. Their model compares three capacity portfolios that address processing dominated, storage
dominated, and mixed processing policies.
3.1.2. Perishable Agricultural Products
Risk management approaches for perishable agriculture products require particular consideration be-
cause of the additional level of vulnerability associated with perishability. A simple approach to deal
with perishability and short lifecycles is newsvendor modeling (i.e., through a single-period invent-
ory management model). One recent representative example of such modeling is [49], who discuss
procurement strategies in a beef supply chain in order to minimize the packer’s expected cost under
yield and demand uncertainty. They studied mixed spot and contract strategies under single period
planning. The newsvendor model is used to reflect the perishability of beef products. Under the op-
timal solution, the expected total cost of the beef packer is minimized by determining procurement,
processing, and production decisions.
Perishability can also be modeled over multiple periods by considering estimation approaches on
11

ACCEPTED MANUSCRIPT
ACCEPTED MANUSCRIP
T
the remaining shelf-life/freshness of the agricultural products at risk. Such models are capable of
tracing the impact of a disruptive event or risk from one planning period to another. However,
shelf-life/perishability modeling considerations increase the complexity of the proposed mathemat-
ical models.
A recent example of a multi-period model is [37]’s study of a fresh fruit producer that sells to
local and international markets under known (Make-To-Order: MTO) or uncertain (Make-To-Stock:
MTS) demands and transportation disruptions. In this problem, the international market is more
profitable but has the risk of transportation failures. Such failures affect both unfinished (ordered,
not yet processed), and finished (processed, not yet delivered) products. Indeed, the waiting time
until delivery is an important threat for perishable products. Thus, the key decision is whether to
wait or to sell the finished product in the local market at a discounted price. However, for unfinished
products, the decision is made on whether to slow down or change the process to adjust to a suitable
delivery time. These decisions are made to prevent perishability and loss, and ultimately, minimize
the expected total cost of the production system.
3.2. Supply Chain Vulnerability and Risk
Supply chain vulnerability is “the propensity of risk sources and risk drivers to outweigh risk mitiga-
tion strategies, thus causing losses and adverse supply chain consequences” [71]. Hence, vulnerability
is a “function of certain supply chain characteristics such as supply chain density, complexity, and
node criticality” that affects both the probability and the severity of supply chain risks [72]. The
latter definition highlights varying origins of vulnerability and risk. Vulnerability is a concept that
depends on the characteristics of the underlying supply chain, and risk is an external threat [5]. Thus,
vulnerability management could result in both reducing the probabilities of being affected by various
risks and the levels of their impact.
In ASC problems, risks and vulnerabilities have been discussed in various contexts such as yield,
cost (supply-side), and price (demand-side) variability for different agricultural products. Perishab-
ility, as a key ASC characteristic, can impact on all these uncertainties; for instance, price can be
affected by changes in perishability. Generally speaking, there are two categories of risk events: high
probability low consequence (HPLC) events versus low probability high consequence (LPHC) events
[73]. HPLC events are often referred to as business-as-usual risks. LPHC events are risks that stem
from severe disruptions to normal practices. Many types of agribusiness risks (e.g., pests) can be
12
ACCEPTED MANUSCRIPT
ACCEPTED MANUSCRIP
T
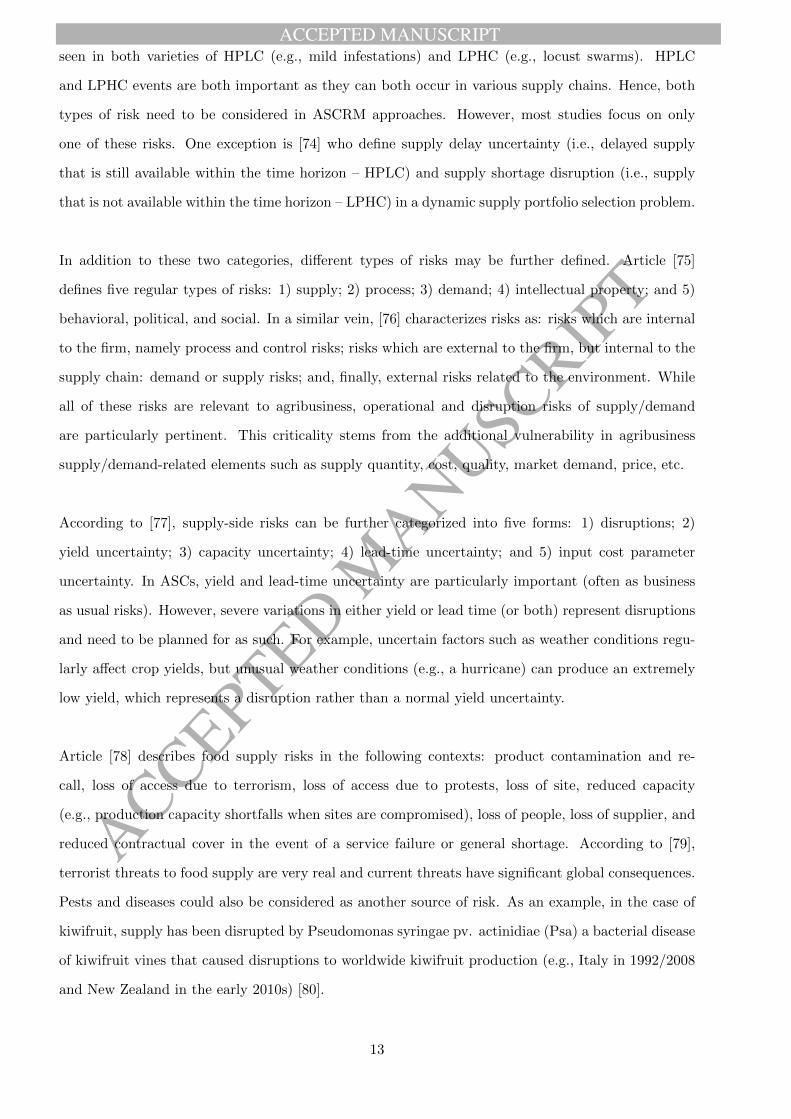
seen in both varieties of HPLC (e.g., mild infestations) and LPHC (e.g., locust swarms). HPLC
and LPHC events are both important as they can both occur in various supply chains. Hence, both
types of risk need to be considered in ASCRM approaches. However, most studies focus on only
one of these risks. One exception is [74] who define supply delay uncertainty (i.e., delayed supply
that is still available within the time horizon – HPLC) and supply shortage disruption (i.e., supply
that is not available within the time horizon – LPHC) in a dynamic supply portfolio selection problem.
In addition to these two categories, different types of risks may be further defined. Article [75]
defines five regular types of risks: 1) supply; 2) process; 3) demand; 4) intellectual property; and 5)
behavioral, political, and social. In a similar vein, [76] characterizes risks as: risks which are internal
to the firm, namely process and control risks; risks which are external to the firm, but internal to the
supply chain: demand or supply risks; and, finally, external risks related to the environment. While
all of these risks are relevant to agribusiness, operational and disruption risks of supply/demand
are particularly pertinent. This criticality stems from the additional vulnerability in agribusiness
supply/demand-related elements such as supply quantity, cost, quality, market demand, price, etc.
According to [77], supply-side risks can be further categorized into five forms: 1) disruptions; 2)
yield uncertainty; 3) capacity uncertainty; 4) lead-time uncertainty; and 5) input cost parameter
uncertainty. In ASCs, yield and lead-time uncertainty are particularly important (often as business
as usual risks). However, severe variations in either yield or lead time (or both) represent disruptions
and need to be planned for as such. For example, uncertain factors such as weather conditions regu-
larly affect crop yields, but unusual weather conditions (e.g., a hurricane) can produce an extremely
low yield, which represents a disruption rather than a normal yield uncertainty.
Article [78] describes food supply risks in the following contexts: product contamination and re-
call, loss of access due to terrorism, loss of access due to protests, loss of site, reduced capacity
(e.g., production capacity shortfalls when sites are compromised), loss of people, loss of supplier, and
reduced contractual cover in the event of a service failure or general shortage. According to [79],
terrorist threats to food supply are very real and current threats have significant global consequences.
Pests and diseases could also be considered as another source of risk. As an example, in the case of
kiwifruit, supply has been disrupted by Pseudomonas syringae pv. actinidiae (Psa) a bacterial disease
of kiwifruit vines that caused disruptions to worldwide kiwifruit production (e.g., Italy in 1992/2008
and New Zealand in the early 2010s) [80].
13
ACCEPTED MANUSCRIPT
ACCEPTED MANUSCRIP
T
Further supply risks can stem from the failure or unavailability of some inexpensive items. For
instance, shortage of a cheap tool in a manufacturing industry may damage production and results
in a significant loss in supply chains. These kinds of risks are referred to as hidden risks [81]. In
agribusiness, the massive use of industrial agriculture (i.e., large, highly specialized farms with large
inputs of fossil fuels, pesticides, and other chemicals derived from oil) can be considered a hidden risk.
In fact, most of the costs from industrial agriculture have been ignored in short-term calculations
of performance, but serious long-term consequences for the agribusiness system as a whole include
damage to natural systems and increasing health risks [82].
In contrast to supply risks, agricultural demand risks can be viewed in terms of market and price
uncertainty, e.g., in processed agricultural foods [49, 42]. Demand risks stem fundamentally from the
variable and unpredictable expectations in markets as highlighted in the review by [83]. In addition,
demand uncertainty may relate to major disruptions (e.g., by LPHC events). For instance, demand
risks such as market/brand failure may result in demand disruptions. Moreover, demand-side risks
could stem from supply-side risks, especially when supply risks are related to safety issues that may
significantly impact the perceptions of the public and their associated demand (e.g., recently, con-
cerns for the safety of milk powder produced by Fonterra in the botulism scare of 2014 led to massive
product recalls and cast a shadow on the reputation of the entire NZ dairy industry) [84].
In summary, both supply-side and demand-side risks are crucial in agribusiness. Given the natural
uncertainty in ASCs and the severe impacts of disruptions on ASCs, demand and supply disruptions
need a particular focus. Section 4 classifies the risks considered in the reviewed papers as supply and
demand side risks.
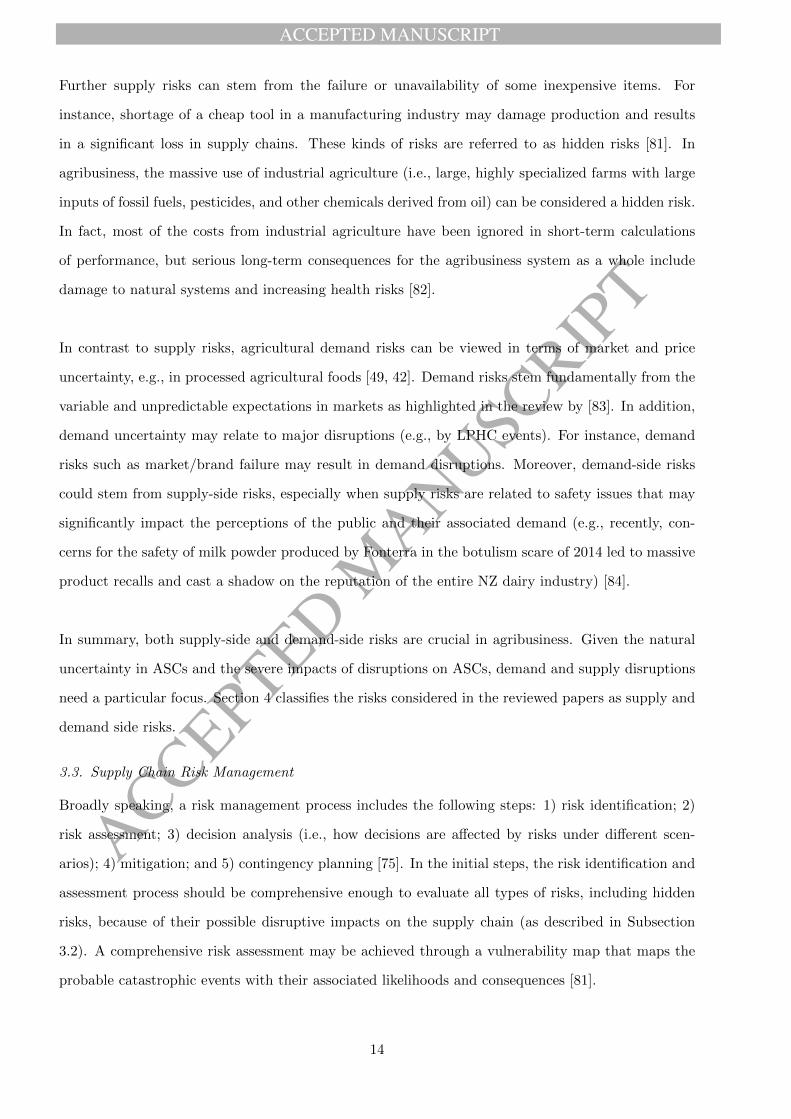
3.3. Supply Chain Risk Management
Broadly speaking, a risk management process includes the following steps: 1) risk identification; 2)
risk assessment; 3) decision analysis (i.e., how decisions are affected by risks under different scen-
arios); 4) mitigation; and 5) contingency planning [75]. In the initial steps, the risk identification and
assessment process should be comprehensive enough to evaluate all types of risks, including hidden
risks, because of their possible disruptive impacts on the supply chain (as described in Subsection
3.2). A comprehensive risk assessment may be achieved through a vulnerability map that maps the
probable catastrophic events with their associated likelihoods and consequences [81].
14

ACCEPTED MANUSCRIPT
ACCEPTED MANUSCRIP
T
In [75]’s definition of a structured evaluation process for implementing a risk-related strategy, the
final two steps of the risk management process (i.e., Steps 4 and 5) recognize two main groups of
SCRM strategies; these are mitigation (i.e., proactive/ pre-disruption strategies) and contingency
strategies (i.e., reactive/ post-disruption strategies). Article [4] suggests that both preparation (i.e.,
mitigation) and first response (i.e., contingency strategies) are critical in minimizing the total impacts
of risk in supply chains.
Article [85] divides risk mitigation strategies into three categories: inventory control (e.g., order-
ing and stocking decisions); sourcing (e.g., dual sourcing, product substitution); and acceptance. The
acceptance strategy, i.e., not protecting against disruption, is considered when the cost of dealing
with a disruption outweighs losses from the disruption (assuming cost is the main objective). Article
[86] investigates optimal mitigation strategies for perishable products, i.e., when inventory control is
not a possible option for mitigation because of the perishability concerns. In this case, one of the
possible mitigation strategies is supplier diversification (i.e., routinely sourcing from multiple sup-
pliers). Article [49] proposes a mitigation strategy for diversifying procurement from both contract
and spot markets in a beef supply chain under optimal portfolio management decisions (i.e., procure-
ment, processing, and production decisions). Although diversifying the supply sources is a common
mitigation strategy under supply risks, it may not be effective when other objectives rather than cost
or profit are considered. In particular, [87] considers an integrated supply and scheduling problem
with a mixed integer bi-objective model and shows that, given a service-oriented model (i.e., when
service level maximization is prioritized), a diversified supply strategy is less attractive than in the
cost-oriented model given local and regional supply disruptions.
In contrast with what has been explained so far about mitigation strategies, the default strategy
after risk materializes is reactive (i.e., contingency planning). This is particularly necessary when a
supply chain operates without any concern about risks on a daily basis, but utilizes contingency plans
(e.g., “fall back” suppliers or routes) when a disruption occurs. Reactive and contingency planning
have been claimed to be critical in minimizing the crossover from risk management to crisis and event
management [88, 89]. Article [86] discusses two approaches in contingency risk management: contin-
gency sourcing (i.e., switching to backup suppliers) and demand switching (i.e., rerouting between
demand markets or encouraging customers to buy an alternative product–product substitution) after
a disruption takes place. Article [89] provides a qualitative framework for contingency risk man-
15

ACCEPTED MANUSCRIPT
ACCEPTED MANUSCRIP
T
agement in the case of food supply chains. In doing so, they focus on six measures: the speed of
response, communication, escalation, resource and fund availability, multi-partner collaboration, and
leadership. In their study, speed of response (i.e., a measure of flexibility) varies according to the
degree of risk impact on food safety.
In total, from a practical standpoint, sometimes reactive strategies are preferred. Although many
researchers support proactive approaches in SCRM (see [90, 91, 92, 93, 78, 94]), there are notable
gaps in the preparedness of organizations in practice as there is little investment into mitigation
strategies [89]. One underlying reason for this lack of investment is related to justifying the cost
of fixing problems that may never happen. In addition, proactive (mitigation) approaches focus on
identifying and minimizing the impacts of the expected risks. Hence, these approaches require the
use of predictive tools to identify risks, calculate probabilities of risks, and implement mechanisms
for risk mitigation. In ASCs, due to their nature-based uncertainty, such predictions could be even
harder to achieve [89].
Although studies in the context of SCRM often either address mitigation- or recovery-based strategies,
in some studies both types of RM strategies have been considered; hence the optimal strategy could
be varied given different problem settings [95]. For instance, a backup supplier strategy as a reactive
strategy is addressed in [95] under supply capacity risks in an automotive supply chain problem. In
[95], an alternative transportation capacity is also introduced as a recovery-based strategy. Article
[95] studies mitigation strategies such as inventory holding (i.e., an increase in order-quantity) and
additional warehouse or transportation capacity. As another example, [96] selects the primary sup-
plier portfolio to mitigate possible suppliers’ failures in advance; it also determines the selection of
recovery suppliers (after disruption) to improve the service level, which is measured by both time and
cost of recovery.
Mitigation and contingency risk management strategies are applied in supply chain problems through
two modeling approaches, referred to as robust and resilient strategies. To define robust and resilient
approaches in supply chains, we start by comparing these concepts to the well-known concept of
leanness in a supply chain. As discussed in Section 1, lean supply chains provide great cost efficiency
with minimum redundancy, except in cases of disruption. By definition, lean supply chains are also
vulnerable. This is exactly in contrast to robust and resilient risk management strategies, which focus
on decreasing the vulnerability of the network.
16

ACCEPTED MANUSCRIPT
ACCEPTED MANUSCRIP
T
While not always used consistently in the literature, here we define robustness as an ability to with-
stand disruption with an acceptable loss of performance, whereas resilience is the potential to recover
quickly from disruption. The key advantage of these definitions, as used here, is that robustness and
resilience fit within the common overarching theme of risk management as described in [78]. In par-
ticular, robustness is a suitable capacity for managing business-as-usual risks (i.e., high probability,
low impact risks), while resilience is suitable for disruption risks (i.e., low probability, high impact
risks).
Robust strategies in the supply chain are considered as proactive and upfront RM options that
mitigate risks and provide minimum variation in performance under disruption (e.g., [97, 98, 99, 14,
100, 101, 102]) that could be provided through approaches such as stochastic programming (e.g.,
[103, 104]) and robust optimization (e.g., [105, 106, 60]). In comparison, resilience is referred to as
a post-disruption recovering capacity [107, 21, 108, 109], and stems from characteristics including
flexibility, availability, velocity, and visibility [110]. Flexibility is a key measure in providing resi-
lience that provides quick reactions to unforeseen circumstances [77]. Thus, time is an important
component in the resilience concept. However, time-based resilience has received limited attention
in the existing supply chain management literature (see [111] and [112] for examples). More details
about robustness and resilience metrics will be discussed in Subsection 4.2.3.
3.4. Modeling Approaches for ASC Risk Management
In this section, we classify different mathematical modeling approaches for ASCRM. These model-
ing approaches have been selected according to their application in different agricultural problems.
Our classification starts in Subsection 3.4.1 with the classical risk programming approach, called
minimization of total absolute deviation, that has been used the most in farm planning problems.
Other approaches to risk include game theory in Subsection 3.4.2, linear programming-based (LP)
approaches (mixed-integer linear programming, multi-objective optimization, goal programming) in
Subsection 3.4.3, stochastic programming, stochastic dynamic programming, and fuzzy optimization
in Subsection 3.4.4, simulation in Subsection 3.4.5, robust optimization in Subsection 3.4.6, and other
less common approaches in Subsection 3.4.7.
These modeling approaches are applied in ASC problems to adapt RM strategies including robustness
and resilience under different types of operational and disruption risks as described in Subsection 3.3.
17

ACCEPTED MANUSCRIPT
ACCEPTED MANUSCRIP
T
Most of the reviewed models in this section focus on business-as-usual uncertainty that is mitigated
through robust strategies. The types of risks and the related RM strategies referred to through these
models will be discussed further in Section 4.
3.4.1. MOTAD
Minimization of the total absolute deviation (MOTAD) provides an efficient frontier between expec-
ted profit and variance of the profit, under a quadratic programming (QP) model [113]. MOTAD is
the most common approach in classical agriculture risk modeling, especially in problems such as crop
planning. MOTAD minimizes the sum of negative deviations from a prefixed income target and was
first introduced by [114] for the farm investment portfolio problem under return variability. Later,
[115] suggested an extension to the [114] model in the form of either LP or QP instead of just QP.
Article [116] has developed a short-run crop planning model with MOTAD under cost, price, and yield
uncertainty. The problem is formulated as a linear approximation to the original formulation. The
risk programming portfolio model in the context of farm management has also been developed under
some alternative distributional assumptions in the portfolio programming. This approach suggests
a direct solution to the expected utility function of cropping activities under an average estimation
of the farm-level situation [117]. Surprisingly, this old and common approach does not seem to have
been applied to ASCs.
3.4.2. Game Theory
Game theory (GT) approaches address risk in two ways: 1) explicitly defining risk metrics and
including these metrics in the game; and 2) creating coordination between players in a game, hence
sharing and reducing risk for each player. According to [118]’s survey, game theory models were
initially considered in agricultural problems as games that incorporate uncertainty in nature through a
parametric game approach: one goal is optimized while the other is treated as a parametric constraint
(e.g., minimizing the variance of the cropping pattern when the expected return is addressed as a
parametric constraint). However, this classical GT approach to risk in agriculture was later criticized,
for the reason that the applied decision criteria were incompatible with the principle of rational
choice in their concerned case-studies [20]. Recently, game theory was applied in advanced food and
agriculture studies, such as [33], which considers different coordination approaches between farmers
and supermarkets under yield and demand uncertainties.
18

ACCEPTED MANUSCRIPT
ACCEPTED MANUSCRIP
T
3.4.3. LP-based Approaches
There are different LP-based optimization methods used in modeling risk in agribusiness: goal
programming (GP), multi-objective optimization (MOO), and mixed-integer linear programming
(MILP). Before describing these methods, we give a brief, general description of LP models that
are used in agribusiness studies.
LP is a method for the optimization of a linear objective function, subject to linear constraints
[119]. LP is widely utilized in agribusiness models, mainly for the purpose of profit maximization
under certainty in problems such as: land allocation, selecting cultivation techniques, labor or ma-
chinery allocation, production planning, cropping pattern selection, crop scheduling, and integrated
production-distribution for seeding (e.g., [70, 69, 44]).
MILP is a generalization of an LP model where some of the variables are restricted to be integers
[119]. In ASC problems in order to consider integer variables and capture failure scenarios (e.g., plant
closure status via a binary variable), LP models have been extended to MILP models [69].
MOO is another optimization method that is used when more than one linear function needs to be
optimized simultaneously [120]. GP is a branch of MOO that handles multiple, normally conflicting
objectives (goals); then, each of these goals is given a pre-described target value and deviations from
this set of target values are minimized [120]. While in LP and MILP methods the objective function
is measured in one dimension, in GP goals with different priorities and weights that can be combined
with each other in the objective function. There are a number of studies in the context of agriculture
where LP models were extended to GP/MOO models to encompass risk attributes. In these models,
performance (e.g., profit) maximization is not the only concern and risk minimization is considered as
another objective, which is especially important in agricultural models. For instance, [121] develops
crop planning as a GP model, with multiple objectives including risk avoidance, maintaining the
minimum level of required food, and maximizing the farmer’s profit.
3.4.4. Stochastic Programming/Stochastic Dynamic Programming
Uncertainty and risk can be captured by a stochastic programming (SP) approach, where right-hand-
sides or coefficients related to the objective function/constraints, are uncertain. SP is a common
approach in ASC models that seeks to model risks mainly in the category of business-as-usual uncer-
tainty in parameters such as price, resource availability, and rainfall.
19

ACCEPTED MANUSCRIPT
ACCEPTED MANUSCRIP
T
SP has various applications in agricultural problems that are described by the following representative
examples. Article [122] develops an SP model for a cropping problem that considers a set of fresh
vegetables with alternative harvesting schedules. In this model, variable weather (hence, indirectly
yields), and prices are used to construct the random scenarios. Article [123] analyzes the capital
structure and investment decisions in a farm problem by measuring liquidity risk, collateral risk, and
credit-reserve risks via an SP formulation. Article [64] provides an SP model for a strategic harvest
decision under uncertain crop size and harvest rates when both crop size and harvest rates are af-
fected by weather volatility. Further, to support sequential decisions under realizations of supply and
demand uncertainties, two-stage SP models have been applied in some recent studies in the context
of agribusiness (e.g., [36] and [49] in the context of multi-product food production planning).
Considering uncertainty and risk parameters with decisions across different time periods has res-
ulted in stochastic dynamic programming (SDP) approaches being used. Initially, SDP has been
considered in agribusiness problems with possible periodic or repeated failures, e.g., a farm ma-
chinery replacement problem when machine failure is stochastic [124]. The earliest model of dynamic
programming (DP) in the context of agriculture (crop planning) appears to be [125], which discussed
periodic decisions on growing versus fallowing to determine sufficient levels of moisture in the soil
during each growing period.
Some of the SDP applications in agricultural problems include: irrigation planning (under scarce wa-
ter situations), cropping, and production planning. For example, [126] and [127] discuss the optimal
water and capacity allocation model over time periods under uncertainty of different soil moisture
level scenarios. In another example, SDP is applied in a periodic pest control problem when infected
fractions of the plant are used to construct stochastic scenarios [128]. Recently, [36] discusses SDP
models in a multi-period palm oil supply chain to provide optimal capacity management and suggest
a periodic production plan.
In some other examples, the uncertainty incorporated in the optimization model relates to fuzzy
parameters, e.g., frequently imprecise environmental uncertainties. Information about fuzzy para-
meters is often incomplete and/or unavailable over the problem horizon. In these circumstances,
fuzzy set theory can be useful and has been used to incorporate uncertainty into RM models. The
triangular function is one of the most common membership functions for describing fuzzy parameters
20

ACCEPTED MANUSCRIPT
ACCEPTED MANUSCRIP
T
and defines three possibilities for each fuzzy parameter. Article [47] defines a triangular membership
function to capture fuzzy parameters for both supply-side and demand-side capacities in a vegetable
oil supply chain problem.
3.4.5. Simulation
Simulation (SIM) has been mainly applied to scheduling/estimation problems in agriculture, e.g.,
harvest-time planning and transplant scheduling under uncertain ecological factors. Simulation ap-
proaches can be categorized as either multi-agent or system dynamics models.
In multi-agent models, the behavior of individuals (i.e., agents) is dictated by their schemata. Ac-
cording to [129], a schema is “a cognitive structure that determines what action the agent takes at
time t, given its perception of the environment.” System dynamics is another simulation-based ap-
proach to address the nonlinear behavior of complex systems over time using stocks, flows, internal
feedback loops, and time delays. The key difference of system dynamics, when compared with agent-
based approaches, relates to the inclusion of structure in system dynamics versus the agents’ rules in
agent-based simulation [130]. In a recent study by [95], a system dynamics model is adopted for a
multi-stage supply chain problem under network disruptions. Here, disruption scenarios are modeled
through a continuous time function in the system dynamics model. Within the disruption scenarios,
elements in the multi-stage supply chain are disrupted at different times and to varying extents. In
fact, the network structure is dynamic where nodes and arcs may become unavailable for different
durations. The model provides recovery policies by redirecting the material flow during the disrup-
tion. The optimal reconfiguration policies are determined by taking into account the performance
impact of the disruption and the recovery costs.
Nevertheless, multi-agent simulation models are increasingly being used in agricultural resource prob-
lems, e.g., in socio-economic, environmental, and land-use problems as reviewed by [131]. Similarly,
[132] and [133] studied planting problems by using a multi-agent simulation approach to provide
biophysical estimation models under uncertainty.
Another application of simulation in the context of agriculture relates to food safety analysis. Articles
[31, 32] discuss a multi-agent simulation model for a handling problem in a Canadian wheat supply
chain under risk of farmer or technology failures to provide safety and quality assurance. Article [32]
extended the static agent-based simulation model in [31] by proposing a corresponding dynamic ap-
21

ACCEPTED MANUSCRIPT
ACCEPTED MANUSCRIP
T
proach that characterizes the wheat supply as a dynamic complex system. In such a dynamic wheat
supply chain model, both farmers and handlers interact and respond to the unpredictable system
changes over time. SIM is particularly useful in such a problem because the complex behavioral
assumptions could not be inserted in a corresponding analytic model. Hence, the complexity of ag-
ribusiness problems encourages the use of simulation models to address the complex characteristics of
ASCs more precisely. Article [32] compared solutions and policies generated using the SIM approach
versus those generated by the alternative analytic model under restrictive assumptions about indi-
vidual behavior. This study recognizes that although analytic and SIM approaches result in different
solutions, in many respects, they reach similar conclusions on the proposed policy for test and quality
control in the described case-study.
3.4.6. Robust Optimization
Article [105] used GP to perform robust optimization (RO), which involves two types of robustness:
solution robustness and model robustness. In this approach, robustness is addressed proactively, i.e.,
“close” to optimal and “almost” feasible for all input scenarios. The RO model provided by [105]
has been mainly applied to LP models. However, there is another type of RO introduced later by
[134] that includes non-linear applications. Further, [135] provides a flexible adjustment in RO that
reduces the level of conservatism related to suboptimal solutions for the nominal value in previous
RO models (i.e., to ensure that the solution remains feasible and near optimal under all scenarios).
The flexible adjustment in [135] is provided by considering ellipsoidal uncertainties, which involve
solving the robust counterparts of the nominal problem in the form of conic quadratic problems (i.e.,
as a reasonable approximation to the complicated uncertainty set). This modified RO approach is
called distributionally robust optimization. The distributional RO model sets up the first and second
moments of the distribution as an uncertain parameter. One of the key factors in distributional RO
is called the budget of uncertainty, which is the maximum number of parameters that can deviate
from their nominal values and is especially used to mitigate demand uncertainty (e.g., in different
customer zones).
RO has been applied to ASC problems recently in a limited context such as production planning,
harvest planning, and facility location problems, mainly for long-life agricultural products [60, 55, 41].
In general, the key benefit of RO is to deal with uncertainty even if the actual information about
uncertain parameters is limited, i.e., when SP could not be applied effectively (see [55]). Hence, it is
expected to receive more attention in ASC modeling problems under examples of rare disruptions in
22

ACCEPTED MANUSCRIPT
ACCEPTED MANUSCRIP
T
this context.
3.4.7. Other Modeling Approaches
Safety-first models and chance constraints are among the other modeling approaches that have been
applied in agricultural risk models, particularly in farm planning models under uncertainty, as de-
scribed by [26, 27]. In safety-first models, the preference for safety as a measure of risk is satisfied
first, and then decisions are made to maximize the profit. In the chance constraint formulation, the
probability of the available resources is given by known distributions and the risk measure is forced
to be above a satisfactory lower bound via the corresponding (chance) constraint.
3.5. Summary
In this section, we described the key concepts of the review related to both ASC and RM. We focused
on ASCs by differentiating between the types of products and their different requirements in applying
RM strategies. Under RM, attributes such as types of risks, strategies, and modeling approaches with
particular applications in agribusiness have been discussed. The key aspects studied in this section
form the basis for our classification approach to categorize the reviewed papers in Section 4.
4. ASCRM Paper Classification and Findings
In this section, we categorize the papers presented in Table 1 (in Section 2) using the concepts
from Section 3. First, Subsection 4.1 describes the classification approach used in reviewing and
categorizing these papers. Then, Subsection 4.2 presents the findings of the review by summarizing
the results and providing specific implications/suggestions for future studies in the field of ASCRM.
4.1. Classification
In this section, we classify the papers that were initially identified in Table 1 according to the criteria
depicted in Figure 3. These criteria were formally defined in Section 3. Figure 3 summarizes these
criteria with the associated subsections from Section 3.
23

ACCEPTED MANUSCRIPT
ACCEPTED MANUSCRIP
T
Risk Models (3.4)
Product Types (3.1)
MILP, MOO, GPGT SIM SP/SDP, Fuzzy
Reviewed Papers
Long‐life
Perishab
le
Risk Types (3.2)
Supply‐side Demand‐side
Risk M
anagem
ent Strategies (3
.3)
Robust
Resilien
t
RO
Figure 3: Classification of the reviewed papers
Figure 3 depicts a combination of aspects that we will use to classify the literature. According
to the first criterion (i.e., 3.1 product type: long-life vs. perishable products), each paper is placed
either in Table 2a or Table 2b. If the paper has been placed in Table 2b, the modeling/considerations
towards perishability have also been briefly discussed in one column. Within Tables 2a and 2b the
papers are categorized, through the associated columns, by other aspects (beyond perishability) of
risk types (i.e., 3.2), modeling approach towards risk (i.e., 3.4), and an interpretation of whether the
paper represents robust or resilient RM strategies (i.e., 3.3). Note that the concepts of robustness
and resilience are interpreted for the reviewed papers based on the attributes and potential of their
models and our given definitions for these terms, whether or not the terms are exactly used in the
papers.
24

ACCEPTED MANUSCRIPT
ACCEPTED MANUSCRIP
T
Table
2a:
Det
ailed
lite
ratu
rere
vie
won
quanti
tati
ve
SC
RM
model
sfo
rlo
ng-l
ife
agri
-pro
duct
s
Au
thor
Ris
kR
isk
mod
eli
ng
RM
stra
tegy
(in
terpretatio
n)
Rem
ark
s
Su
pp
ly-s
ide
Dem
an
d-s
ide
Res
ilie
nt
Rob
ust
[31]
•F
arm
er’s
mis
rep
rese
nta
-ti
on
of
qu
ality
inte
stin
g
•H
an
dle
rs’
tech
nolo
gy
failu
res
SIM
(sta
tic
agen
t-b
ase
dm
od
el)
3•
Com
pari
ng
resu
lts
from
sim
ula
tion
an
dan
aly
tic
mod
els
[32]
•F
arm
er’s
mis
rep
rese
nta
-ti
on
of
qu
ality
inte
stin
g
•H
an
dle
rs’
tech
nolo
gy
failu
res
SIM
(dyn
am
icagen
t-b
ase
dm
od
el)
3•
Com
pari
ng
resu
lts
from
sim
ula
tion
an
dan
aly
tic
mod
els
•[3
2]
exte
nd
sth
est
ud
yea
rlie
rp
rovid
edin
[31]
by
pro
vid
ing
ad
yn
am
icagen
t-b
ase
dm
od
elan
dad
dre
ssin
ga
com
pari
son
bet
wee
nth
eso
luti
on
ap
pro
ach
esin
the
an
aly
t-ic
al
mod
elw
ith
the
corr
esp
on
din
gsi
mu
lati
on
mod
el
[33]
•Y
ield
un
cert
ain
tyG
am
eT
heo
ry3
•P
rovid
ing
an
inves
tmen
tm
od
elu
sin
gth
eS
hap
ley
valu
em
eth
od
[30]
•Y
ield
of
fres
hfr
uit
palm
bu
nch
(un
der
vari
ab
lew
eath
er/
pes
tco
nd
i-ti
on
s)
•S
pot
pri
ceu
nce
rtain
ty
SD
P3
•C
on
sid
erin
gth
ree
cap
aci
typ
ort
folio
op
tion
s:p
roce
ssin
gd
om
inati
ng,
stora
ge
dom
-in
ati
ng,
an
dm
ixed
•U
sin
gS
DP
ina
seri
esof
ind
epen
den
ttw
o-s
tage
pro
ble
ms
[34]
•R
aw
mate
rial
qu
anti
ty
•R
aw
mate
rial
qu
ality
•E
nd
-pro
du
ctp
rice
Tw
o-s
tage
SP
3•
Sel
ecti
on
of
the
are
afo
rco
ntr
act
farm
ing
an
dre
serv
edm
axim
um
am
ou
nt
for
op
-ti
on
al
sup
ply
(sta
ge
1)
•C
hoosi
ng
wh
ether
tob
uy
or
not
from
the
op
tion
al
sup
ply
(sta
ge
2)
•C
on
sid
erin
gn
on
-food
ap
plica
tion
of
ren
ewab
lere
sou
rces
(in
stea
dof
foss
ilre
sou
rces
)in
poly
mer
sp
rod
uct
ion
[40]
•E
nd
-pro
du
ctd
eman
d
•P
rice
of
the
end
-p
rod
uct
(geo
met
-ri
cB
row
nia
nm
o-
tion
)
SP
(Lin
ear)
3
[41]
•P
ath
base
dsu
pp
lyd
is-
rup
tion
s•
Dem
an
dsi
zeR
O(M
ILP
)3
•C
on
sid
erin
gp
ath
-base
dvari
ab
le
•C
on
sid
erin
gd
iffer
ent
att
itu
des
tow
ard
sri
sk(i
.e.,
risk
neu
tral
or
risk
-aver
sed
ecis
ion
maker
s)
•E
valu
ati
ng
the
rati
oof
chan
ge
inth
en
orm
alize
dp
erfo
rman
ceto
the
chan
ge
inan
un
cert
ain
para
met
eras
aro
bu
stn
ess
mea
sure
•C
on
sid
erin
gro
bu
stop
tim
izati
on
in[1
05]
wit
hth
ep
iece
-wis
elin
ear
met
hod
25

ACCEPTED MANUSCRIPT
ACCEPTED MANUSCRIP
T
Table
2a
-C
onti
nued
Au
thor
Ris
kR
isk
mod
eli
ng
RM
stra
tegy
(in
terpretatio
n)
Rem
ark
s
Su
pp
ly-s
ide
Dem
an
d-s
ide
Res
ilie
nt
Rob
ust
[45]
•F
eed
stock
Su
pp
ly•
Bio
fuel
dem
an
dT
wo-s
tage
SP
3•
Pro
vid
ing
am
ult
i-ob
ject
ive
stoch
ast
icm
od
elco
nsi
der
ing
diff
eren
tatt
itu
des
tow
ard
sri
sk(i
.e.,
risk
neu
tral
or
risk
-aver
sed
ecis
ion
maker
s)
•C
om
pari
ng
risk
mea
sure
sof
dow
nsi
de
risk
an
dCVaR
•P
rovid
ing
atr
ad
e-off
bet
wee
nri
skand
per
form
an
cem
easu
res
[47]
•F
uzz
ysu
pp
ly-s
ide
cap
a-
citi
es(i
nre
fin
ery
an
dst
ora
ge
faci
liti
es)
•F
uzz
yd
eman
d-
sid
eca
paci
ties
(in
refi
ner
yan
dst
ora
ge
faci
liti
es)
•F
uzz
yd
eman
d
Fu
zzy
mu
lti-
ob
ject
ive
LP
3
[48]
•M
atu
rati
on
tim
e
•H
arv
est
tim
e
•Y
ield
•D
eman
dsi
zeT
wo-s
tage
SP
3•
Con
sid
erin
gb
oth
stra
tegic
an
dta
ctic
al
dec
isio
ns
[50]
•M
ilk
sup
ply
Mu
lti-
stage
SP
3•
Pro
vid
ing
lin
ear
pri
ce-d
eman
dcu
rve
wit
hd
yn
am
icou
ter
ap
pro
xim
ati
on
sam
pli
ng
•S
elec
tin
gth
ep
lan
nin
gh
ori
zon
acc
ord
ing
toth
em
axim
um
fixed
stora
ge
tim
ean
dig
nori
ng
det
erio
rati
on
du
rin
gth
isti
me
•A
dd
ress
ing
un
cert
ain
tyu
sin
gan
au
tore
gre
ssiv
em
od
elw
ith
ran
dom
erro
rs
[52]
•B
iom
ass
sup
ply
•B
iom
ass
cost
•B
iom
ass
dem
an
d
•B
iom
ass
pri
ce
MIL
P3
•C
om
pari
ng
mu
ltip
led
esig
nsc
enari
os
wit
ha
nom
inald
esig
nsc
enari
oas
aro
bu
stn
ess
mea
sure
[56]
•D
eman
d(s
toch
ast
icd
eman
dfo
rea
chin
div
idu
al
farm
er)
SP
3•
Com
pari
ng
B2B
an
dB
2C
stra
tegie
sin
ad
air
ysu
pp
lych
ain
[53]
•S
up
ply
-sid
eco
stp
ara
-m
eter
s•
Dem
an
d-s
ide
cost
para
met
ers
•D
eman
dsi
ze
Rob
ust
Op
tim
-iz
ati
on
3•
Con
sid
erin
ga
mu
lti-
ob
ject
ive
that
min
imiz
esto
tal
pro
du
ctio
nco
sts
an
dm
axim
izes
the
cust
om
ers’
sati
sfact
ion
by
min
imiz
ing
the
sum
of
the
maxim
um
short
age
inm
ark
ets
an
dp
erio
ds
•S
olv
ing
MIL
Pas
asi
ngle
ob
ject
ive
by
usi
ng
the
LP
-met
ric
met
hod
[57]
•D
eman
d(s
cen
ari
o-b
ase
d)
Tw
o-s
tage
SP
3•
Ad
dre
ssin
gse
aso
nality
of
pro
du
ctio
nin
win
ery
farm
s
•A
pp
lyin
ga
post
ponem
ent
stra
tegy
inth
efi
nis
hin
gp
roce
ss(i
.e.,
lab
elin
gan
dp
ack
-agin
g)
tom
itig
ate
risk
of
cust
om
ized
dem
an
du
nce
rtain
ty
26

ACCEPTED MANUSCRIPT
ACCEPTED MANUSCRIP
T
Table
2a
-C
onti
nued
Au
thor
Ris
kR
isk
mod
eli
ng
RM
stra
tegy
(in
terpretatio
n)
Rem
ark
s
Su
pp
ly-s
ide
Dem
an
d-s
ide
Res
ilie
nt
Rob
ust
[58]
•D
eman
d(u
nif
orm
)S
P3
•C
om
pari
ng
bet
wee
ntw
oin
centi
ve
syst
ems
for
the
seed
sup
plier
•R
ecogn
izin
gd
iffer
ent
beh
avio
rof
the
pro
ble
min
the
seed
sin
du
stry
[60]
•D
eman
du
nce
r-ta
inty
(mark
etsc
enari
os)
RO
([105]
ap
-p
roach
)3
•A
naly
zin
gso
luti
on
rob
ust
nes
svs.
mod
elro
bu
stn
ess
as
aro
bu
stn
ess
mea
sure
[62]
•S
up
ply
scen
ari
os
SP
3•
Com
pari
ng
bet
wee
nn
etw
ork
alg
ori
thm
ssu
chas
au
gm
enti
ng
path
,p
re-fl
ow
pu
sh,
an
dsu
cces
sive
short
est
path
•P
riori
tizi
ng
exp
ort
inca
seof
con
ges
tion
[68]
•H
arv
est
•P
rice
SP
(Lin
ear)
3•
Sel
lin
gin
both
daily
au
ctio
ns
an
dfu
ture
mark
ets
[69]
•S
cen
ari
os
of
pla
nt
clos-
ure
•S
cen
ari
os
of
ad
dit
ion
al
rest
rict
ion
on
gre
enp
oli
cy
•D
eman
dsi
zeM
ILP
3•
Con
sid
erin
gst
ock
just
for
lon
gsh
elf-
life
pro
du
cts
•D
ecid
ing
on
the
nu
mb
erof
pla
nts
,lo
cati
on
s,an
dalloca
tion
polici
es
•E
valu
ati
ng
the
imp
act
of
diff
eren
tsu
pp
lych
ain
des
ign
stra
tegie
ssu
chas
regio
naliz-
ati
on
,co
nso
lid
ati
on
,p
rod
uct
spec
ializa
tion
,an
dp
roce
sssp
ecia
liza
tion
inm
anu
fac-
turi
ng
pla
nts
toim
pro
ve
risk
mit
igati
on
an
dp
erfo
rman
ce
[70]
•H
arv
est
tim
e
•P
ack
ing
rate
•S
hort
age
cost
LP
/F
uzz
y3
•C
on
sid
erin
gfu
zzy
typ
eu
nce
rtain
tyre
late
dto
the
per
cep
tion
of
the
lin
esu
per
vis
or;
pack
ing
rate
isse
taft
ervis
ual
insp
ecti
on
of
the
qu
ality
of
arr
ived
pro
du
cts
[28]
•U
nce
rtain
harv
est
(cli-
mati
cfa
ctors
)
Lin
ear
GP
3•
Dev
elop
ing
am
ult
i-ob
ject
ive
fun
ctio
nto
min
imiz
eco
st,m
eet
gro
win
gan
dp
roce
ssin
gca
paci
ties
as
wel
las
mark
etd
eman
du
nd
erd
iffer
ent
scen
ari
os
of
harv
est
27

ACCEPTED MANUSCRIPT
ACCEPTED MANUSCRIP
T
Table
2b:
Det
ailed
lite
ratu
rere
vie
won
quanti
tati
ve
SC
RM
model
sfo
rp
eris
hable
agri
-pro
duct
s
Au
thor
Ris
kP
eri
shab
ilit
ym
od
eli
ng
Ris
km
od
eli
ng
RM
stra
tegy
(inte
rpre
ta-
tion
)
Rem
ark
s
Su
pp
ly-s
ide
Dem
and
-sid
eR
esil
ient
Rob
ust
[36]
•In
pu
tsp
ot
pri
ce•
Ou
tpu
tsp
ot
pri
ce
•D
eman
dsi
zeu
n-
cert
ain
ty
New
sven
dor
mod
elT
wo-s
tage
SP
3•
Com
pari
son
bet
wee
nfi
xed
pro
port
ion
al(c
ost
-poolin
g),
flex
ible
(cap
aci
ty-p
oolin
g),
an
dd
edic
ate
dp
rod
uct
ion
polici
es
•C
ost
-poolin
gvalu
eof
pro
port
ion
al
pro
du
ctio
nin
crea
ses
as
corr
elate
dw
ith
the
dem
an
dra
te(w
hen
dem
an
dof
on
ep
rod
uct
ish
igh
an
dth
eoth
eris
low
)
•C
on
sid
erin
gin
pu
tp
roce
ssin
gand
ou
tpu
tp
rod
uct
ion
cap
aci
ty(s
tage
1),
inp
ut
pro
cess
ing
level
sw
ith
inca
paci
ty(s
tage
2)
[35]
•C
hea
pu
nre
liab
lesu
p-
plier
(Ber
nou
lli
dis
-ru
pti
on
)
•D
eman
dsi
zeu
n-
cert
ain
ty
New
sven
dor
mod
elT
wo-s
tage
SP
3•
Con
sid
erin
gsu
pp
lyfr
om
an
exp
ensi
ve
emer
gen
cysu
pp
lier
for
any
dem
an
ds
ab
ove
tota
lca
paci
tyof
pri
mary
an
db
ack
up
sup
plier
s
•P
rovid
ing
win
-win
coord
inati
on
•U
tilizi
ng
back
up
sup
plier
as
are
sili
ence
mea
sure
[37]
•E
xp
ort
pu
blic
tran
s-p
ort
fail
ure
Sh
elf-
life
exte
n-
sion
;ex
pon
enti
al
dec
ayin
gco
st
SP
/S
DP
3•
Mod
elin
gp
eris
hab
ilit
yan
dd
isru
pti
on
featu
res
sim
ult
an
eou
sly
•C
on
sid
erin
gb
oth
stati
can
dd
yn
am
icm
od
els
un
der
MT
Oan
dM
TS
dem
an
ds
•C
on
sid
erin
gre
silien
tb
ack
up
stra
tegy
un
der
hars
hd
isru
pti
on
scen
ari
os
[38]
•D
elay
inre
turn
ing
tran
sport
ati
on
equ
ip-
men
t(e
.g.
conta
iner
)re
sult
sin
stock
-ou
tor
det
erio
rati
on
Imp
act
on
rip
e-n
ess
(lot-
sizi
ng
mod
el)
SD
P3
•C
on
sid
erin
gb
ack
ord
ersh
ort
ages
•M
od
elin
gth
eim
pact
of
lot-
size
on
det
erio
rati
on
of
fres
hp
rod
uce
un
der
ari
pen
ing
pro
cess
wit
hex
pon
enti
al
RT
Ile
ad
-tim
ein
an
SD
P
[39]
•O
ran
ge
juic
eaci
dit
ysp
ecifi
cati
on
•Ju
ice
dem
an
dA
ccep
ted
bou
nd
sfo
rqu
ality
spe-
cifi
cati
on
(aci
dit
y)
of
juic
e
RO
wit
hu
n-
cert
ain
aci
d-
ity
spec
.
3•
Fore
cast
ing
fru
itm
atu
rati
on
curv
eby
solu
ble
solid
sin
ora
nge
juic
ed
epen
din
gon
envir
on
men
tal
an
dorc
hard
main
ten
an
ceco
nd
itio
ns
•M
itig
ati
ng
sup
ply
-sid
eu
nce
rtain
tyby
con
sider
ing
two
sou
rcin
gst
rate
gie
sin
clu
din
gco
ntr
act
-base
dan
dsp
ot-
base
d(o
rsh
ort
-ter
mco
ntr
act
ed)
fru
it
•P
roce
ssin
gof
inte
rmed
iary
pro
du
ct(b
ase
-ju
ice)
inst
age
1an
db
len
din
gof
the
fin
al
juic
ein
stage
2aft
eru
nce
rtain
tyre
aliza
tion
[42]
•Y
ield
•Q
uality
of
the
crop
(im
pact
son
pro
du
c-ti
on
rate
of
the
pro
-ce
ssin
gfi
rm)
•O
pen
mark
etsu
pp
lyco
st
New
sven
dor
mod
elT
wo-s
tage
SP
3•
Con
cern
ing
the
imp
act
of
vari
ab
lequ
ality
of
the
crop
on
the
pro
du
ctio
nra
te
28

ACCEPTED MANUSCRIPT
ACCEPTED MANUSCRIP
T
Table
2b
-C
onti
nued
Au
thor
Ris
kP
eri
shab
ilit
ym
od
eli
ng
Ris
km
od
eli
ng
RM
stra
tegy
(inte
rpre
ta-
tion
)
Rem
ark
s
Su
pp
ly-s
ide
Dem
an
d-s
ide
Res
ilie
nt
Rob
ust
[46]
•S
up
ply
cost
•D
eman
dsi
zeP
rod
uct
ware
-h
ou
sin
glim
ited
life
-tim
e
Inte
rval
RO
([136])
3•
Con
sid
erin
gcl
ose
d-l
oop
(eco
-fri
end
ly)
sup
ply
chain
•C
ust
om
izin
gtw
o-s
ide
ap
plica
tion
s(i
.e.,
both
info
od
an
dh
igh
-tec
hel
ectr
on
ics
ind
ust
ry)
[49]
•Y
ield
(qu
anti
ty)
un
cert
ain
ty•
Dem
an
dsi
zeu
nce
rtain
tyfo
rst
an
dard
/p
rem
ium
pro
du
cts
New
sven
dor
mod
elT
wo-s
tage
SP
3•
Pro
posi
ng
ap
rice
-base
dcl
eara
nce
•S
ugges
tin
gth
eco
mp
lem
enta
ryu
seof
both
sup
ply
contr
act
an
dsp
ot
mark
ets
toh
edge
mark
et
•C
on
sid
erin
gth
efi
xed
cap
aci
tyin
short
/m
ediu
mh
ori
zon
s
[51]
•Y
ield
un
cert
ain
ty
•Y
ield
-dep
end
ent
trad
ing
cost
•Y
ield
dep
end
-en
ttr
ad
ing
sellin
gp
rice
New
sven
dor
mod
elT
wo-s
tage
SP
3•
Con
sid
erin
gim
pact
sof
end
ogen
ou
sco
stan
dfr
uit
futu
res
for
ari
sk-a
ver
sed
ecis
ion
maker
•D
ecid
ing
on
the
space
tole
ase
(bef
ore
harv
est)
•S
elec
tion
bet
wee
non
eof
the
follow
ing
(aft
erh
arv
est)
:
–C
onvert
ing
the
cro
pto
the
final
pro
duct
–B
uyin
gm
ore
from
exte
rnal
gro
wers
–Sellin
gso
me
(or
all)
of
the
cro
pin
the
op
en
mark
et
befo
repro
cess
ing
[44]
•H
arv
est
matu
rity
(qu
ality
)id
enti
fied
by
colo
ran
dfi
rm-
nes
s
•O
pen
mark
etp
rice
-sen
siti
ve
dem
an
d
Yie
ldco
lor
esti
m-
ati
on
inan
ac-
cep
tan
cein
terv
alof
firm
nes
s,sh
elf-
life
,an
dqu
ality
MIL
P3
•M
od
elin
gco
stof
reje
cted
/d
isco
unte
dsh
ipm
ents
for
pro
du
ceth
at
firs
tp
ass
edth
equ
ality
thre
shold
bu
th
ave
then
bee
naff
ecte
dby
qu
ality
chan
ge
du
rin
gsu
pp
lych
ain
stages
•A
pp
lyin
ga
bio
logic
al
form
ula
tion
toth
eex
pec
ted
qu
ality
[43]
•C
rop
yie
ld•
Cro
pp
rice
See
[44]
Tw
o-s
tage
SP
3•
Con
sid
erin
gb
oth
risk
neu
tralan
dri
skaver
sion
ob
ject
ives
,i.e.
,ex
pec
ted
pro
fit
an
dex
pec
ted
loss
es
[54]
•D
eman
dsi
ze(n
orm
al)
Inven
tory
det
erio
r-ati
on
(cer
tain
de-
cayin
gra
te)
SP
3•
Con
sid
erin
gsu
pp
lier
-ret
ailer
collab
ora
tion
info
reca
stin
gd
eman
d
[55]
•Y
ield
(harv
est
pro
du
ctiv
ity)
Qu
ality
cost
RO
(MIL
Pm
od
elu
sin
g[1
35])
3•
Pro
posi
ng
two
new
rob
ust
ap
pro
ach
esin
clu
din
gaggre
gate
dm
od
ified
rob
ust
an
dad
ver
sari
al
robu
stm
od
els
[59]
•D
eman
dsi
ze
•D
eman
darr
ival
•F
ixed
shel
f-life
-ti
me
(equ
al
toth
ese
llin
gh
ori
-zo
n)
•P
rod
uct
s’qu
al-
ity
det
erio
rati
on
rate
QP
(solv
edw
ith
heu
rist
ic)
3•
Diff
eren
tiati
ng
bet
wee
nfr
esh
an
du
nsp
oiled
pro
du
cts
•C
on
sid
erin
gcu
stom
erch
oic
ein
bu
yin
gor
not
bu
yin
gu
nsp
oiled
pro
du
cts
29

ACCEPTED MANUSCRIPT
ACCEPTED MANUSCRIP
T
Table
2b
-C
onti
nued
Au
thor
Ris
kP
eri
shab
ilit
ym
od
eli
ng
Ris
km
od
eli
ng
RM
stra
tegy
(inte
rpre
ta-
tion
)
Rem
ark
s
Su
pp
ly-s
ide
Dem
an
d-s
ide
Res
ilie
nt
Rob
ust
[61]
•Y
ield
(bio
logic
al
an
den
vir
on
-m
enta
l)
•H
arv
est
failu
re(b
iolo
gic
al
an
den
vir
on
men
tal)
Dem
an
dsi
zeN
ewsv
end
or
mod
elT
wo-s
tage
SP
3•
Bala
nci
ng
cust
om
erse
rvic
eth
at
reta
iler
isw
illin
gto
acc
ept
un
der
pro
du
ctio
nin
ves
tmen
t
•P
rovid
ing
rob
ust
mod
elw
ith
serv
ice
level
con
stra
int
[63]
•Y
ield
•Q
uality
Qu
ality
loss
cost
:tr
ad
e-off
cost
vs.
tim
efo
rop
tim
al
ass
ign
men
tof
per
-is
hab
les
tost
ora
ge
SP
3•
Con
sid
erin
gqu
ality
com
pon
ents
inth
eob
ject
ive
fun
ctio
nco
mp
ose
dof
pro
du
ctsa
le,
wast
efr
uit
sale
,ou
t-of-
spec
pro
du
ctsa
les,
pu
rch
asi
ng
cost
,fr
uit
coolin
gco
st,
cold
main
ten
an
ceco
st,
an
dla
bor
cost
[65]
•Y
ield
un
cert
ain
ty(b
ecau
seof
wea
ther
,d
isea
se,
etc.
)
•Y
ield
-dep
end
ent
cost
un
cert
ain
ty
•D
eman
dsi
ze
•Y
ield
-d
epen
den
tp
rice
un
-ce
rtain
ty
New
sven
dor
mod
elT
wo-s
tage
SP
3•
Pro
vid
ing
con
cave
ob
ject
ive
fun
ctio
nfo
rth
eam
ou
nt
of
farm
space
lease
din
stage
1p
rob
lem
•D
ecid
ing
on
op
tim
al
am
ou
nts
of
olive
oil
tob
ep
rod
uce
dfr
om
inte
rnally
gro
wn
olives
an
dfr
om
olives
that
have
bee
np
urc
hase
dfr
om
spot
mark
et,aft
erre
aliza
tion
of
the
yie
ld’s
pri
cein
the
stage
2p
rob
lem
•D
ivid
ing
tim
e-st
ages
as
tim
e-to
-gro
wan
dti
me-
to-s
ell
aft
ergro
win
g
[64]
•L
ength
of
harv
est
seaso
n
•C
rop
size
un
der
clim
ati
cvari
ati
ons
New
sven
dor
mod
elS
P(N
ews-
ven
dor
mod
elw
ith
risk
cost
pen
alt
ies
tofi
nd
op
tim
um
harv
est
rate
)
3•
Ass
um
ing
lon
gle
ad
-tim
efo
rp
urc
hasi
ng
harv
est
equ
ipm
ent
[66]
•H
arv
est
yie
ld•
Dem
an
dsi
zeN
ewsv
end
or
mod
elT
wo-s
tage
SP
3•
Mit
igati
on
pla
nn
ing
by
con
sid
erin
gtw
op
oss
ible
sup
ply
loca
tion
sin
two
sequ
enti
al
gro
win
gse
aso
ns,
wh
end
eman
dis
availab
leat
the
end
of
the
seco
nd
seaso
n
[67]
•H
arv
est
yie
ld•
Dem
an
dsi
zeN
ewsv
end
or
mod
elT
wo-s
tage
SP
3•
Mit
igati
on
pla
nn
ing
by
con
sid
erin
gtw
op
oss
ible
sup
ply
loca
tion
sin
two
sequ
enti
al
gro
win
gse
aso
ns,
wh
end
eman
dis
availab
leat
the
end
of
the
seco
nd
seaso
n
•C
on
sid
erin
gd
eman
dco
rrel
ati
on
bet
wee
nvari
etie
sof
pro
du
cts
30

ACCEPTED MANUSCRIPT
ACCEPTED MANUSCRIP
T
4.2. Findings
In the past couple of decades, the scope of agribusiness research has been expanded from farm planning
to include more stages and connections, i.e., a supply chain (see [137, 49]). However, Table 1 shows
the number of quantitative studies is still limited in the subject of Agriculture Supply Chain (ASC)
under uncertainty, i.e., we only found 42 quantitative studies on ASCRM that have been published
to date. These papers have been described with further details in Table 2a (for long-life agricultural
products) and Table 2b (for perishable agricultural products). Interestingly, the number of papers
are about the same in Tables 2a and 2b (i.e., 22 papers in Table 2a and 20 papers in Table 2b).
Initially, we expected fewer perishable models in the literature due to the additional complexity and
because perishability is only a small proportion of the general SCRM literature. The similar number
of studies in long-life and perishable agricultural products highlights the importance of perishability
to the ASCRM literature.
Food & Agriculture
15%
OR 10%
OM 75%
ASCRM research for perishable agricultural products
Food & Agriculture
27%
OR 46%
OM 27%
ASCRM research for long-life agricultural products
Figure 4: Contributing journal areas to the development of ASCRM research for long-life and perishable agriculturalproducts
When we classified the reviewed papers with respect to the scope of the journal they were published
in, we found different trends for contributions of the journals in the development of ASCRM that
related to long-life compared with perishable agricultural products. This comparison is provided in
Figure 4 by considering the three journal scopes of: Food and Agriculture, OR, and OM. As depic-
ted in Figure 4, OM journals have the main contribution in research development in the context of
quantitative risk management for perishable agricultural products. However, OR journals have the
highest contribution in the literature with respect to the long-life agricultural products. In contrast
to our expectation, agricultural and food-based journals do not provide a large contribution in terms
of volume of papers, especially for perishable agricultural products. This is perhaps because of the
technical expertise involved in mathematically modeling risk.
Further, from a detailed content-wise classification standpoint, we reviewed the papers by focus-
31
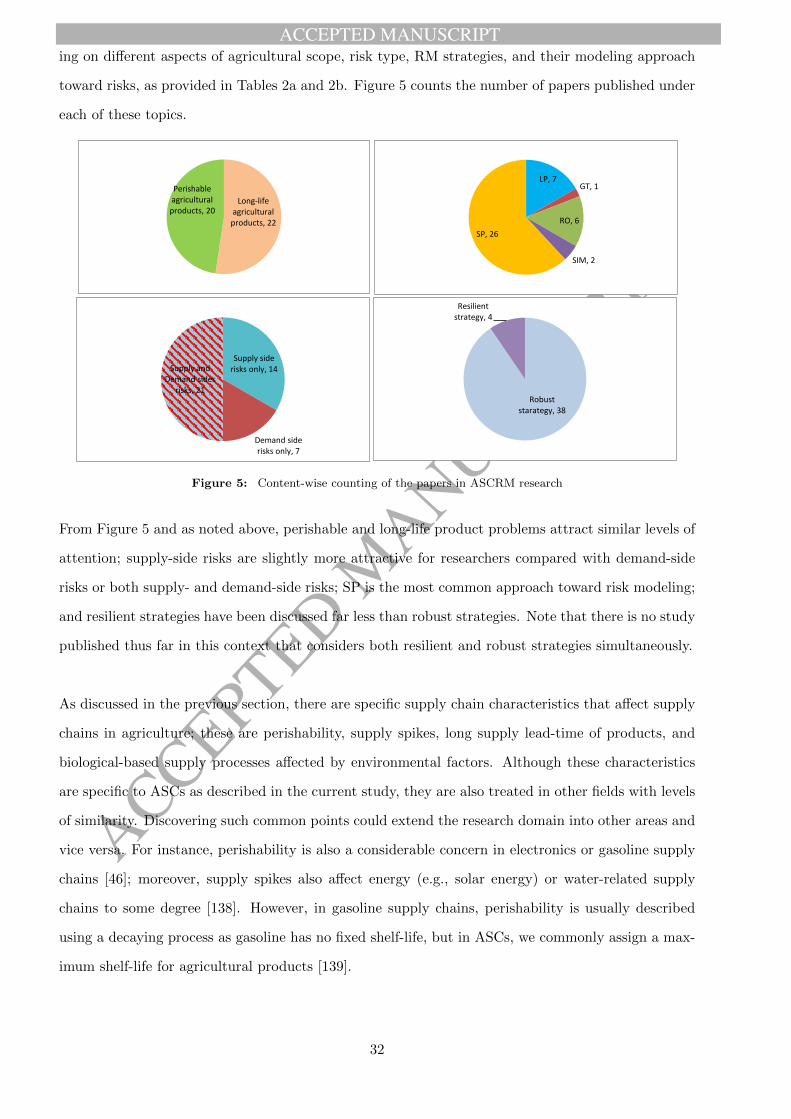
ACCEPTED MANUSCRIPT
ACCEPTED MANUSCRIP
T
ing on different aspects of agricultural scope, risk type, RM strategies, and their modeling approach
toward risks, as provided in Tables 2a and 2b. Figure 5 counts the number of papers published under
each of these topics.
Supply side risks only, 14
Demand side risks only, 7
Supply and Demand sides
risks, 21Robust
starategy, 38
Resilient strategy, 4
LP, 7GT, 1
RO, 6
SIM, 2
SP, 26
Long-life agricultural
products, 22
Perishable agricultural
products, 20
Figure 5: Content-wise counting of the papers in ASCRM research
From Figure 5 and as noted above, perishable and long-life product problems attract similar levels of
attention; supply-side risks are slightly more attractive for researchers compared with demand-side
risks or both supply- and demand-side risks; SP is the most common approach toward risk modeling;
and resilient strategies have been discussed far less than robust strategies. Note that there is no study
published thus far in this context that considers both resilient and robust strategies simultaneously.
As discussed in the previous section, there are specific supply chain characteristics that affect supply
chains in agriculture; these are perishability, supply spikes, long supply lead-time of products, and
biological-based supply processes affected by environmental factors. Although these characteristics
are specific to ASCs as described in the current study, they are also treated in other fields with levels
of similarity. Discovering such common points could extend the research domain into other areas and
vice versa. For instance, perishability is also a considerable concern in electronics or gasoline supply
chains [46]; moreover, supply spikes also affect energy (e.g., solar energy) or water-related supply
chains to some degree [138]. However, in gasoline supply chains, perishability is usually described
using a decaying process as gasoline has no fixed shelf-life, but in ASCs, we commonly assign a max-
imum shelf-life for agricultural products [139].
32

ACCEPTED MANUSCRIPT
ACCEPTED MANUSCRIP
T
A long lead-time is considered another key characteristic of ASCs but is still an area of concern
in supply chains of other sectors, such as semi-conductors and petroleum [140]. However, the long
supply lead-time in ASCs (e.g., related to the cultivation process) is basically biologically-based and
can be affected by further uncertain challenges, e.g., related to soil or weather situations. The specific
ASC characteristics described in this section influence the focus of the ASCRM studies as described
in the following subsections. More findings with respect to the aspects of agricultural scope, risk
type, RM strategy, and risk modeling are described in Subsections 4.2.1 to 4.2.4, respectively.
4.2.1. Product Type
Product type is a key criterion in the classification of the papers by differentiating between perish-
able and long-life products. In fact, perishability provides a life-time limitation which is considerably
important in modeling. Therefore, perishability is considered as a first-order classification criterion
in our review and has been used to section the papers into Tables 2a and 2b.
Table 2a summarizes different models on SCRM for long-life agricultural products. The models
mainly consider multiple-period settings because there is no limitation on freshness of products over
time. The ASC models that are applied to long-life agricultural product problems are mainly stud-
ied in the context of supply chain handling, investment, or capacity extension under uncertainty for
agricultural products such as seeds or palm bunches (see [31, 32] and [36]).
In Table 2b, we can divide the studies into newsvendor and non-newsvendor models for perishable
agricultural products. Non-newsvendor models are models under multi-period settings with different
approaches towards perishability. Table 2b shows that the number of papers is similar in both groups
(i.e., 10 in each group among the years). Given the additional modeling complexity in multi-period
models, this shows the particular importance of these models to researchers. Furthermore, the second
group of studies is quite recent (all published after 2010, except one in 2005), which perhaps implies
an increasing trend. Such a trend may also occur in the general SCRM literature, where newsvendor
models are still very widely used.
The newsvendor studies in Table 2a consider a basic approach in dealing with perishable and short
life-cycle products (through a single-period inventory management model, see [49], [65], [51], and
[35]). In fact, most of these papers studied the ASC problems under a long single-period (equivalent
with the time the products can stay fresh) for perishable agricultural products. For instance, in [51]’s
33

ACCEPTED MANUSCRIPT
ACCEPTED MANUSCRIP
T
case of olive oil production, to prevent the acidic taste in olive oil or perishing after long-term storage,
a long, fixed shelf-life of two years has been incorporated into the model.
Although newsvendor models have been used commonly to handle perishability as described, there
are some aspects that might be neglected after viewing a single-period model when looking at disrup-
tion. In fact, as [141] states, single-period models underestimate the time-correlation of disruption
risks. In saying that, single-period models in agriculture could be justified in some cases (e.g., highly
perishable products that can be used for just one period or a period that is very long, such as an
entire selling season). However, as most agricultural products under current sophisticated agribusi-
ness systems are stored for multiple periods, there is a need to plan accordingly for modeling in a
multi-horizon setting, e.g., by analyzing the best trade-off between cost and quality under disrup-
tions. Taking this into consideration, the correlating impact of disruptions could be captured among
different time periods.
In the non-newsvendor group of the reviewed papers in Table 2b, perishability is considered with
some basic measures that evaluate the freshness (e.g., remaining fixed shelf-life) while discussing
multiple period settings. Such considerations make modeling of RM strategies more challenging, and
perhaps, for this reason, both the number of studies and the scope of the studies are limited. For
instance, consideration of a variable shelf-life has just been found in one study ([37]). In addition,
as shown in Table 2b and noted above, most of the studies that are classified in this category have
recently been published (see [37], [44], and [38]). In these papers, various considerations toward per-
ishability have been made. For instance, in [44]’s study, the estimated fruit color has been treated as a
measure of firmness/freshness when considering a fixed shelf-life. In [38]’s study, the delay in receiving
returning transportation items (RTIs) has been considered as a critical factor in the ripening process.
In fact, under consideration of delay in receiving RTIs, bigger lot-sizes should be considered, which in
turn affect the ripening process by generating heat in non-central areas and ultimately accelerating
deterioration.
Figure 6 depicts the comparative number of papers in the context of ASCRM for each category
of long-life products, perishable products under newsvendor settings, and perishable products under
non-newsvendor settings over the years.
34

ACCEPTED MANUSCRIPT
ACCEPTED MANUSCRIP
T
0
1
2
3
4
5
6
7
8
1993 1997 2001 2002 2003 2004 2005 2006 2007 2008 2009 2010 2011 2012 2013 2014 2015
Nu
mb
er
of
Pu
blis
he
d P
ape
rs
Year
Long-life Perishable Newsvendor Perishable Non-newsvendor
Figure 6: Publishing trends in the area of ASCRM for long-life products and perishable products under newsvendoror non-newsvendor models
We end this subsection by noting that, although perishability is a key attribute in ASCs, it is also
a concern in some other supply chains. For instance, as described in [46], perishability and life-time
issues are considerable in both agricultural and high-tech supply chains; perishability is related to
a biological process in agriculture, while it is competition-based within high-tech industries. Thus,
the time-based perishability function should be defined differently. In addition, possible approaches
against perishability may also differ, e.g., disassembly is used as a common approach under quality
defects in the high-tech industry, but is not applicable in ASCs, as defective products cannot be
reused. Saying this, there are some similar considerations in the two industries, e.g., the value of
depreciation of products over time, or FIFO (first in first out) warehousing.
4.2.2. Risk Types
As discussed in Section 3, and from the aspect of risk-type, the reviewed papers are divided into
two main groups of studies, namely supply-side and demand-side risks. Under supply-side risks, the
seasonality of supply and weather-related biological process of supply makes the decision making
challenging in ASCs. It is worthwhile to note that the weather-related and seasonal supply also im-
pacts other supply chains such as water or solar-energy supply chains. However, as briefly mentioned
in the beginning of the section, in those supply chains there are no additional concerns about the
biological process of supply. Under demand-side risks, although commonly presented in most supply
chain problems (as variability in market price or capacity), it is noticeable that most markets for ag-
35

ACCEPTED MANUSCRIPT
ACCEPTED MANUSCRIP
T
ricultural products are less standardized (e.g., compared with electricity markets). This may require
approaches with non-standardized instruments [34], thus RM is more challenging in ASC problems
with these demand uncertainties.
The second column in Tables 2a and 2b summarizes different risks under the two categories of supply
and demand risks for the papers reviewed. From this part of the table, we can see that the main focus
of the studies is on supply-side risks (or in some cases demand-side risks) that stem from weather
conditions, although in different ways. For instance, an uncertain length of a harvest season and crop
size is considered in [64]; uncertainty in yield and crop quality is considered in [63]; yield, cost, and
price uncertainties are considered in [44]; yield and yield dependent trading cost and selling prices are
considered in [51]; and yield, crop quality (under different production rate), and open market supply
cost variabilities are considered in [42]. In a few other cases, supply-side risks have been studied in
other contexts such as: unreliable sourcing [35], supply-side transportation [37], or risk of delay in
receiving a returning transportation item (RTI) [38]. Quality-related supply risk is discussed from a
different angle in [31, 32] when addressed as random or opportunistic misrepresentation by the farmer
during the testing stage of a grain production supply chain.
In comparison to supply-side risks in general, demand-side risks have received less attention among
studies related to both long-life and perishable products. In particular, there are 8 versus 5 studies
in long-life products (where 9 papers considered both) and 6 versus 2 in perishables (where 12 papers
considered both). The main demand side risks considered in these studies first relate to the demand
size and then to market price uncertainty. These uncertainties are mostly studied separately, except
in some cases such as [40, 44, 43, 65] that consider both of these uncertainties simultaneously. By
differentiating between types of risks from the standpoint of probability and intensity (i.e., high prob-
ability and low intensity in business-as-usual uncertainty versus low probability and high intensity in
disruption risks), we notice that the focus of most of the studies in the field of ASCRM is on oper-
ational (= business as usual) uncertainty rather than rare disruption scenarios. Particularly, among
the reviewed papers in Tables 2a and 2b in just three papers ([61, 35, 37]), has supply disruption
been discussed in a preliminary way. In addition, demand-side disruption (e.g., a market brand fail-
ure) has thus far been completely ignored in ASC problems under uncertainty. Under connectivity
of supply-side and demand-side risks in many supply chains, this simplified assumption may not be
realistic.
36
ACCEPTED MANUSCRIPT
ACCEPTED MANUSCRIP
T
Overall, in ASCRM problems studied thus far, the uncertainty has been addressed as either dis-
ruptions, i.e., LPHC events, or business-as-usual uncertainty, i.e., HPLC events (mainly as business-
as-usual uncertainties). A non-agricultural SC paper that considers both types is [74], which considers
both a complete shortage that results in no supply (i.e., a disruption) and a possible delay in supply
(i.e., an operational uncertainty).
In regards with the type of risk, supply-side risks are the main focus of ASC models, especially when
they relate to environmental/meteorological impacts. However, compared with the vast literature of
supply disruption in manufacturing supply chains (see [1]), applications of supply disruption are fairly
limited in ASCs. Demand disruption has not been studied at all for ASCs (although business-as-usual
uncertainty has); even for manufacturing supply chains it has been studied in a very limited scope,
where [142] and [143] are among the few studies that consider demand disruption in non-agricultural
supply chains in a preliminary way (i.e., through some coordination strategies under harsh demand
uncertainties in the operations stage of production).
4.2.3. Risk Management Strategies
As mentioned earlier, in this review, we categorize RM strategies as providing robustness or resili-
ence. In Tables 2a and 2b the papers are categorized by focusing on the type of RM strategy utilized
(whether they are robust and/or resilient). Most of the papers reviewed in the context of ASC did not
specifically refer to the terms robustness and resilience and only considered a subset of the associated
elements (diversification-related strategies have been mainly used under this category). Diversifica-
tion is traditionally considered as the main response to risk in agriculture and is normally achieved by
adding new resources or diversifying the resource locations [25]. Diversification can also be obtained
through using multiple suppliers, which increases robustness and mitigates risk. The latter definition
has been utilized in most of the reviewed papers in Tables 2a and 2b. For instance, in [49], a beef
supply chain model was studied under business-as-usual risks which aimed at sustaining performance
under both supply-side and demand-side uncertainties through supply diversification (using both con-
tract and open-market sources); hence, implying robustness.
In general, supplier diversification or the dual sourcing strategy has a long history in supply chain
problems under uncertainty. Many analytical studies support the advantages of using this strategy
compared with single-sourcing, given particular uncertainties that relate to supply price, delivery
lead-times, yield, as well as a risk-averse buyer (see [144, 145, 146]). Supplier diversification is also
37

ACCEPTED MANUSCRIPT
ACCEPTED MANUSCRIP
T
effective for ASCRM, e.g., see [49]. However, because of the plausible correlation between the supply
sources in one agricultural region, supplier diversification may need to extend across different regions,
especially under supply-side uncertainties. The concept of diversification across different regions is
also applicable in oil supply chains, as long as the regions have a comparable quality of crude oil [147].
Except for supplier diversification, other robust strategies discussed in Section 3.3 have relatively
fewer applications in the ASC problems reviewed here. We believe there are some reasons for this
tendency. For instance, use of inventory-based strategies may not be very effective due to concern
about product perishability and freshness.
In total, resilient strategies have been studied far less than robust strategies (1 compared with 21
in Table 2a, and 3 compared with 17 in Table 2b). In addition, the resilient strategy that was con-
sidered in those studies was provided in a fairly preliminary way (key resilience attributes of agility
and recovery capacity have not been addressed). For instance, in [37], rescheduling plans for sales
under a transportation disruption could be interpreted as resilience in a limited scope.
Product substitution is one of the commonly used resilient RM strategies in the context of SCRM.
In a supply chain model with N different products and N corresponding demand classes (i.e., when
products are graded into N classes according to some quality), by considering product substitution,
we can use a product class to satisfy demand for the same product class as well as for certain other
product classes. Product substitution provides flexibility for decision making under risk when the
decision maker can allocate the product to different demand classes only after realization of demand
or supply uncertainty. Thus, product substitution is mainly referred to as a reactive RM strategy
[148]. Occasionally, product substitution is also referred to as a mitigation strategy that supports
diversification in some ways, e.g., in sourcing decisions when diversifying by products rather than
suppliers (see [85]). Generally speaking, product substitution is a reactive strategy and has a wide
application in SCRM problems.
Product substitution can be offered under different structures. One of the popular structures in
product substitution is known as downward substitution, when unmet demand of a low quality
product is replaced by an alternative high-quality product (downbinning) or a conversion of that
high-quality product (downconversion [148]). In manufacturing supply chains under co-production
systems when multiple products are produced simultaneously, there are often random quantities of
38

ACCEPTED MANUSCRIPT
ACCEPTED MANUSCRIP
T
vertically differentiated products that provide the potential for product substitution [149]. As a spe-
cific example, in semiconductor manufacturing, demand for a low-speed device is often filled with a
reconfigured high-speed device when the low-speed device is unavailable [140]. For ASC problems, in
comparison with manufacturing (especially semiconductor) supply chains, it is plausible that higher
quality agricultural products are substituted for a conversion of lower quality products, e.g., use high-
quality fruit for fruit juice (a strategy referred to as “downconversion” in [149]).
Product substitution can also play an important role in planning under demand uncertainty. Such
product substitution is often offered through a demand-switching RM strategy as discussed in [86].
In this situation, the firm motivates the customers to buy an alternative product when their preferred
product is not available. According to [150, 151], when demand correlation increases, the expected
value of substitution is increased. We believe this is also a sensible conclusion under the scope of
ASC problems, although we are not aware of any research that studies this.
Thus far in this subsection, we discussed different examples of robust and resilient RM strategies
used in supply chain problems with a particular focus on ASCs. However, a key question still remains
as to how these strategies or concepts are quantified. Measuring the resilience concept is a crucial
question as studies considering resilient strategies are limited so far (particularly in the context of
ASCRM). First, we summarize a number of methods for measuring robustness found in the literature
that are consistent with the conceptual definition of robustness provided in the current review.
1. Comparing the expected value of the performance under uncertain scenarios with the expected
value in the base case. There are several means of doing this.
(a) One can consider the difference between these two quantities (base performance and performance
under disruption). Although this approach has been initially used in some supply chain models
to evaluate robustness (in [152]), there was no specific study in the context of ASC that used it.
(b) Rather than a difference, we could also consider the ratio of change in the performance, i.e., the
ratio of the difference between the two performances to the base performance, e.g., see [28] in
the category of studies for long-life agricultural products.
(c) Alternatively, we can identify the ratio of change in the performance to the base performance
over the ratio of change in the associated uncertain parameter to the corresponding base case
parameter, e.g., see [32, 52] in the category of studies for long-life agricultural products and
[42, 49, 44] in the category of studies for perishable agricultural products.
39

ACCEPTED MANUSCRIPT
ACCEPTED MANUSCRIP
T
2. Combining the expected performance and risk measures, such as with a weighted average or a
ratio between the risk measure and the expected performance, or including the risk measure through
a model constraint. In particular, see [41, 45, 56, 53, 60, 70] in the category of studies for long-life
agricultural products and [36, 39, 46, 51, 43, 55, 64, 61] in the category of studies for perishable
agricultural products. In [61], the risk measure has been addressed using a constraint that indicates
the desired degree of robustness by ensuring that the deviation of the solution from optimality under
each uncertain scenario does not exceed some positive value p (this approach is called p-robustness).
However, in the rest of the papers, the risk measure is combined into the objective function. For
instance, in [153], the robustness measure is combined into the objective function and presented as a
weighted combination of the expected performance and the worst-case performance (i.e., conditional
value-at-risk of the performance).
3. Considering network structure related metrics, such as network connectivity or accessibility, e.g., in
[62] the robust network structure design aims at providing the shortest path from each node to the rest
of the nodes in the supply chain network. Although this is the only study in the context of ASCRM
that used a network-based approach to address robustness, this approach has been applied widely
in other supply chains, such as manufacturing supply chains. For instance, [97] defines a robustness
measure using network connectivity methods, i.e., as a probability of the availability of a minimum
of one walk between source and sink. This is considered similarly in other works, such as [154], but
under different performance measures. Article [155] defines metrics in the way that measures the
total number of nodes and arcs such that their removal does not separate the source and sink (i.e.,
there is still a minimum of one walk remaining between them). In [155], the described metric was
evaluated for different network structures (i.e., block-diagonal, scale-free/power-law, centralized, and
diagonal) through a simulation approach.
In the rest of the papers summarized in Tables 2a and 2b, there were no specific discussions regarding
robustness measures; indeed, even the term “robust” has not been used in most of the studies and
was instead implied by the authors according to the realized concepts. In these studies, the uncer-
tainty has been considered in a risk-neutral manner (i.e., through consideration of expected value
of the performance measure), or in some cases, by discussing particular mitigation strategies (see
[30, 57, 69]).
In contrast with robustness in the literature considered (see §2), there is no research in the con-
text of ASCRM, nor indeed SCRM, that thoroughly addresses resilience metrics. Therefore, in this
40

ACCEPTED MANUSCRIPT
ACCEPTED MANUSCRIP
T
review, a number of suggestions can be provided for future studies.
In accordance with the conceptual definition of resilience from Section 3.3, the time to recovery
is appropriate as a quantitative resilience measure (see [3, 81]). In other words, resilience can be
quantified by the time that a supply chain network requires to return to normal operation after dis-
ruption. In addition to time to recovery, we suggest two other recovery-based metrics for resilience
that measure supply chain performance during the recovery period. We suggest the following metrics
for measuring resilience:
1. Time to recovery (i.e., time between the beginning of a disruption until the disrupted supply chain
has recovered);
2. Lost profit during the recovery period; and
3. Recovery level (i.e., the performance level that the supply chain recovers to after disruption).
The resilience metrics suggested here are important for supply chain problems that contain uncer-
tainty, however they are particularly critical for ASC problems. Agricultural products are generally
highly sensitive to both the time to recovery and the recovery process due to their perishability and
limited shelf-life. Thus, the choice of resilience metric(s), as suggested here, will influence the recovery
process and consequently affect both the probability of survival and the quality of surviving products
in ASCs after facing disruption. From a modeling standpoint, it is crucial that the resilience metric
accounts for the time until a disrupted supply chain returns to normal operation, particularly as a
proportion of the fresh product’s lifetime, i.e., if the time to recovery is longer than a product’s life-
time, then recovery will not save those products. Hence, when deciding on a resilient strategy, there
is a trade-off between the cost of the strategy and lost profit, where the strategy is only appropriate
if recovery can occur within the fresh product’s lifetime.
Nevertheless, even though the recovery measures suggested here are core resilience concepts, none
of the literature referenced in our review precisely addresses these measures of recovery. According
to [95], the time component of resilience has not been well studied by researchers in the context of
supply chain management so far. Without consideration of time, the suggested resilience metrics
cannot be fully addressed, so there is a dearth of previous work that addresses these quantitative resi-
lience metrics. However, some studies imply the resilience concept through time-related performance
measures or post-disruption risk management strategies. In the following studies, the improvement
in a time-related performance measure or the application of some reactive RM strategies can improve
41
ACCEPTED MANUSCRIPT
ACCEPTED MANUSCRIP
T
one of the suggested resilience metrics, even though the metric itself has not been clearly addressed.
First, [111] defines the resilience measure as a supply chain lead-time ratio, which is a ratio between
the promised (expected) and the actual lead-time of the delivery of a component to an automaker.
The lead-time ratio is defined over the supply chain nodes for the period under analysis. To overcome
the disruption caused by a delay in receiving the components and in determining a lead-time ratio
close to one, they suggest using an alternative transportation route as a flexible (resilient) approach.
In their study, by targeting the lead-time ratio close to one under transportation disruption, the
recovery lead-time under disruption will be reduced. Hence, their proposed measure for resilience
may imply a short time to recovery to some extent.
Similarly, [112] discusses resilience in the context of a two-stage reconfigurable network design by
selecting a delivery lead-time as the performance measure under disruption scenarios defined by
node/arc failures. The underlying concept is that a higher level of arc/node availability results in a
shorter delivery time, therefore, less inventory is needed throughout the supply chain network, which
means less overall cost. Thus, their definition may imply less recovery time because of the associated
shorter response time to a disruption, but this implication was not discussed. In a similar manner,
consideration of response time as the performance measure in [156] results in some level of resilience
as shorter response times can enable faster recovery.
Alternatively, some studies consider reactive RM strategies that affect the resilience measures, es-
pecially those related to lost profit during the recovery and the recovery level after recovery. For
instance, [34] considers a backup supply strategy with an optional contingent contract as a resilient
strategy for an ASC with long-life agricultural products. The backup strategy has been discussed for
ASC problems with perishable agricultural products, e.g., see [35, 65]. In [37] a rerouting strategy
has been used as a reactive RM strategy by allowing the possibility of switching between demand
markets. As described in these studies, use of RM can assist in improving the performance measures
(i.e., total cost or profit) during and after recovery. As another example, the recovery process could be
sped up by the use of emergency facilities that are protected and can hold emergency inventory (e.g.,
by constructing flood walls to prevent flooding for facilities that are capable of supplying parts in the
face of disruption events) [157, 158]. To select the best subsets of supply facilities to be protected,
[157] considers a trade-off between the cost of a suppliers’ protection and the losses caused by supply
disruptions (this concept is referred to as a “protection index”). Articles [157] and [158] highlight the
42

ACCEPTED MANUSCRIPT
ACCEPTED MANUSCRIP
T
importance of using more emergency sources but fewer suppliers in total. In other words, in these
studies, rather than diversification of suppliers (by selecting more suppliers), investment is mainly
focused on emergency sources.
To sum up, in this section, we summarized a number of metrics to describe the concepts of ro-
bustness and resilience in ASCRM problems. Although robustness metrics are discussed to some
extent, we have not found any literature that fully addresses resilience metrics. This is a crucial lack
of research under the context of ASCRM because of the higher level of inherent uncertainty in ASCs
(e.g., related to the climate, the economic environment, and the social environment) and the perishab-
ility of agricultural products. In fact, the inherent uncertainty in ASCs promotes the use of reactive
solutions (resilient strategies) rather than proactive solutions (robust strategies), which require less
prediction about risks [89]. In addition, perishability of products can be controlled by the use of a
resilience measure, such as minimizing the time to recovery. In saying this, resilience measures have
been partially discussed in some quantitative studies. e.g., when a time-based performance measure
is used or when a reactive RM strategy is applied. In such studies, the improvement of resilience
measures is a beneficial outcome rather than the focus of the research.
4.2.4. Risk Modeling Approaches
Thus far, different mathematical modeling approaches toward risk have been applied in the context
of ASCs. As described earlier in Section 3.4, these are: minimization of the total, absolute devi-
ation (MOTAD), game theory (GT), linear programming (LP)-based approaches (mixed-integer lin-
ear programming – MILP, multi-objective optimization – MOO, goal programming – GP), stochastic
programming (SP)/stochastic dynamic programming (SDP), fuzzy optimization, simulation (SIM),
and robust optimization (RO). We should note that MOTAD has only been used in agricultural risk
modeling studies in farm levels and not in ASCs. In addition, as mentioned above, although the
properties of RM models are different in ASC problems compared with other types of supply chain
models, the core mathematical approaches toward risk modeling are similar.
Among risk modeling approaches in the context of ASC, SP is by far the most popular approach,
especially for recently published papers. Although MOTAD was the most common approach in clas-
sical agricultural risk modeling, especially in crop and farm planning (see [116], [113], and [117]),
according to our review, it is no longer attractive in the context of ASCRM (see the risk modeling
columns in Tables 2a and 2b). Other than SP, LP-based approaches have also received considerable
43

ACCEPTED MANUSCRIPT
ACCEPTED MANUSCRIP
T
attention in the literature followed by RO approaches (see Figure 5) but we expect that RO will
attract more attention under higher levels of unexpected uncertainty, as discussed in Section 3.4.
In SP, particularly, two-stage models have been considered for many of the recent problems in ASCs
that partition the decisions before and after realization of uncertainty (i.e., stages 1 and 2). Perhaps
this is because, in reality, for most ASC problems, decisions are partitioned by uncertain parameters,
e.g., transportation decisions before and after realization of yield. For instance, [30] studied a palm
bunch supply chain under harvest uncertainty through a two-stage SP model that decides on input
processing and output production capacities in stage 1, and also input processing levels within the
assigned capacity in stage 2. In another example, [65] developed a two-stage SP model to determine
growing and sales policies in an olive oil supply chain under uncertainty; here the stage 1 problem
concerns the amount of farm space leased, and the stage 2 problem decides on the optimal amount of
olive oil to be produced from internally grown olives and from olives that have been purchased from
the spot market after realizing price uncertainty in the open market.
Although we did not find many studies that used SIM models in the context of ASCRM, when
considering the higher levels of complexity in the real structure of ASCs, the implementation of
simulation-based approaches should be both sensible and effective. For instance, agent-based simula-
tion models can be applied when one side of the supply chain faces incomplete information [159]. In
[31, 32], for a Canadian grain supply chain, such interaction is defined between a farmer and a grain
handler where the handler aims to design proper testing strategies to minimize the risk of misrep-
resentation of variety (i.e., a part of the quality assurance process) by an individual farmer. As the
grain handler has just limited information about the farmer’s misrepresentation risk, this problem is
classified as an agent-based model with incomplete information about the supplier. Although this is
a well-known problem in supply chain management (see [160] and [161]), it has rarely been used in
ASCs, perhaps because of the additional complexities in ASC models as discussed in Subsection 4.2.1.
Further, use of other types of SIM-based models such as system dynamics could extend the ap-
proach toward uncertainty in ASC problems; e.g., [95] used a hybrid LP system dynamics model to
capture the time-related characteristic of resilience measures and provided a re-planning model under
disruption in an automotive supply chain problem. Finally, GT models could also be applied further
in ASC problems to improve the design of efficient coordination policies between the two sides of the
ASC network, e.g., under behavioral risk as discussed in [31, 32].
44

ACCEPTED MANUSCRIPT
ACCEPTED MANUSCRIP
T
In summary, among the applied methods for risk modeling in ASC problems, two-stage stochastic
models received considerable attention because they matched the decision-making process with many
real-life agricultural supply chain problems. Besides the LP-based approaches, RO has been used to
some extent, which can be applied when less information is available about uncertain scenarios. By
considering more rare high impact disruptive scenarios and complexities in the problems, RO and
SIM may well receive higher attention in the future.
4.2.5. Summary
In this section, we aimed to map and evaluate the literature in the context of agribusiness supply
chain risk management in order to suggest the potential research paths and boundaries of knowledge
for future research. In summary, and according to our findings, the following areas are suggested for
future research in Agribusiness Supply Chain Risk Management (ASCRM):
• To consider perishability under variable shelf-life time measures
• To consider other supply-side risks beyond weather changeability
• To incorporate demand-side disruptions
• To model supply chain resilience in ASCs through measures such as time to recovery (TTR) in the
objective function
• To compare the effectiveness of a robust versus a resilient supply chain design and establish when
the supply chain design should focus on robustness and when it should focus on resilience.
5. Conclusions
Although quantitative modeling approaches have been applied to agricultural problems for a long
time, adoption of these methods for improving planning decisions in agribusiness supply chains under
uncertainty is still limited. In the current study, quantitative models for risk management in ASCs
were reviewed, with a particular focus on categorizing SCRM strategies as robust or resilient.
According to our review, limitations in quantitative ASC studies are recognizable from both the
number of publications and the scope of existing studies. Thus, the literature on Agribusiness Supply
Chain Risk Management (ASCRM) is likely to extend over the next few years. In particular, we have
identified the following directions to be explored in future research in the field of ASCRM according
to both the academic research gap and the needs of industries:
45

ACCEPTED MANUSCRIPT
ACCEPTED MANUSCRIP
T
1. Perishability modeling. In this topic, the consideration of perishability in fresh products under
variable shelf-life is a significant omission that needs to be incorporated in models related to disruption
management in the context of ASCs. For instance, the price of technology to keep the products fresh
for a longer time can be traded off with the additional profit generated by selling the produce when
it is fresh. This consideration needs to be combined with the adoption of risk management strategies.
2. Multi-period planning. This is another area that lacks sufficient attention in the current ASCRM
literature, even though, it is particularly important in the context of agribusiness because of time-
dependent characteristics of agricultural products (relating to their freshness). Multi-period ASC
planning under disruption is needed to handle quality management for agricultural products over
time and concurrently consider time-correlation of disruption risks.
3. Rare high-impact disruption and the combination of them with operational uncertainty. Currently,
most ASCRM models only considered robustness under business as usual risks; hence, the impact of
low probability of high-impact disruption is rarely addressed. In addition, in many real-world ASC
problems, both types of uncertainties (operational and disruption) can be viewed together, which
requires incorporating them simultaneously in the corresponding model.
4. Robust and resilient strategies (especially resilient). One of the key missing areas in quantitative
ASC studies relates to mitigation and contingency planning approaches. These methods are especially
significant for ASCs given their additional inherent vulnerability. While robust models have recently
been studied to some extent for ASCs, resilient strategies (i.e., contingency plans that reduce time-
to-recovery) are highly neglected under rare disruptions.
5. Demand-side disruptions. No study can be found in ASC modeling that addressed demand-side
disruptions (harsh rare demand-side uncertainty). Demand-side disruption is not only significant
itself in ASCs (e.g., massive changes in open market prices and demand due to a harsh seasonal
harvest), but could also stem from supply-side disruptions (i.e., according to the correlation between
these uncertainties).
6. Highly integrated information-driven supply chains. Due to the complexity of agribusiness systems
and the high level of uncertainty in their information (e.g., because of using predictive analytics on
key parameters), highly integrated information-driven supply chain management systems should be
considered. Such systems are key to incorporating diversity of uncertainty information in a complex
adaptive ASC, which is especially important from industry stand-point.
7. Approaches that are endorsed by high-level management. Finally, to ensure practicability of the
46

ACCEPTED MANUSCRIPT
ACCEPTED MANUSCRIP
T
proposed research methods, a further research consideration is to ensure that solutions/output from
new risk management approaches can be applied in practice, hence, providing cost-efficient approaches
toward risk, which are especially important from an industrial standpoint.
In this review, we not only summarized key research findings in ASCRM problems, but also provided
a comparison with other supply chain problems, consequently, links the findings when there were
attributes in common. Furthermore, we proposed a number of research gaps in the context of ASCRM
to be explored that should increase the practicability of models for real-world agricultural supply
chain problems. Although adding the proposed elements could extend the research to better model
real-world problems in the agribusiness industry, researchers need to investigate if the additional
complexity affects the solvability of the problems. Further, the benefits from the modeling-based
solutions may also be limited by the quality of data, the willingness of the enterprise ownership to
use this method, the culture of risk management, and the understanding of OR in the concerned
company. Hence, these limitations may also need to be considered when exploring extension of the
research in the proposed areas. We hope that the above gaps represent motivating opportunities for
future research and promise to provide benefits to the ASC sector with further exploration.
Acknowledgments
The authors thank the editors and anonymous reviewers for their valuable comments on this paper.
The first author acknowledges both the Research Assistant funding received from Waikato University’s
strategic investment fund for her work, which was awarded to the last author by the University of
Waikato in New Zealand, and that received from the Department of Engineering Science, University
of Auckland. The research of the third author was supported in part by Te Punaha Matatini Center
of Research Excellence.
References
References
[1] B. Fahimnia, C. S. Tang, H. Davarzani, and J. Sarkis, “Quantitative models for managing supply chain risks: A
review,” European Journal of Operational Research, vol. 247, no. 1, pp. 1–15, 2015.
[2] S. Chopra and M. S. Sodhi, “Managing risk to avoid supply-chain breakdown,” MIT Sloan management review,
vol. 46, no. 1, p. 53, 2004.
[3] M. S. Sodhi and C. S. Tang, “Managing supply chain disruptions via time-based risk management,” in Managing
supply chain risk and vulnerability, pp. 29–40, Springer, 2009.
[4] Y. Sheffi, “The resilient enterprise: overcoming vulnerability for competitive advantage,” MIT Press Books, vol. 1,
2005.
47

ACCEPTED MANUSCRIPT
ACCEPTED MANUSCRIP
T
[5] I. Heckmann, T. Comes, and S. Nickel, “A critical review on supply chain risk–definition, measure and modeling,”
Omega, vol. 52, pp. 119–132, 2015.
[6] N. Chandrasekaran and G. Raghuram, Agribusiness Supply Chain Management. CRC Press, 2014.
[7] T. J. Lowe and P. V. Preckel, “Decision technologies for agribusiness problems: A brief review of selected literature
and a call for research,” Manufacturing & Service Operations Management, vol. 6, no. 3, pp. 201–208, 2004.
[8] J. J. Glen, “Mathematical models in farm planning: A survey,” Operations Research, vol. 35, no. 5, pp. 641–666,
1987.
[9] I. Tatsiopoulos and A. Tolis, “Economic aspects of the cotton-stalk biomass logistics and comparison of supply
chain methods,” Biomass and Bioenergy, vol. 24, no. 3, pp. 199–214, 2003.
[10] A. Dooley, W. Parker, and H. Blair, “Modelling of transport costs and logistics for on-farm milk segregation in
new zealand dairying,” Computers and electronics in agriculture, vol. 48, no. 2, pp. 75–91, 2005.
[11] M. Lucas and D. Chhajed, “Applications of location analysis in agriculture: a survey,” Journal of the Operational
Research Society, vol. 55, no. 6, pp. 561–578, 2004.
[12] A. Gupta, R. Harboe, and M. Tabucanon, “Fuzzy multiple-criteria decision making for crop area planning in
narmada river basin,” Agricultural Systems, vol. 63, no. 1, pp. 1–18, 2000.
[13] C. S. Tang, “Perspectives in supply chain risk management,” International Journal of Production Economics,
vol. 103, no. 2, pp. 451–488, 2006.
[14] W. Klibi, A. Martel, and A. Guitouni, “The design of robust value-creating supply chain networks: a critical
review,” European Journal of Operational Research, vol. 203, no. 2, pp. 283–293, 2010.
[15] O. Tang and S. N. Musa, “Identifying risk issues and research advancements in supply chain risk management,”
International journal of production economics, vol. 133, no. 1, pp. 25–34, 2011.
[16] K. Scholten, P. Sharkey Scott, and B. Fynes, “Mitigation processes–antecedents for building supply chain resili-
ence,” Supply Chain Management: An International Journal, vol. 19, no. 2, pp. 211–228, 2014.
[17] L. V. Snyder, Z. Atan, P. Peng, Y. Rong, A. J. Schmitt, and B. Sinsoysal, “Or/ms models for supply chain
disruptions: A review,” IIE Transactions, vol. 48, no. 2, pp. 89–109, 2016.
[18] O. Ahumada and J. R. Villalobos, “Application of planning models in the agri-food supply chain: A review,”
European Journal of Operational Research, vol. 196, no. 1, pp. 1–20, 2009.
[19] W. Zhang and W. E. Wilhelm, “OR/MS decision support models for the specialty crops industry: a literature
review,” Annals of Operations Research, vol. 190, no. 1, pp. 131–148, 2011.
[20] A. Weintraub and C. Romero, “Operations research models and the management of agricultural and forestry
resources: a review and comparison,” Interfaces, vol. 36, no. 5, pp. 446–457, 2006.
[21] A. Higgins, C. Miller, A. Archer, T. Ton, C. Fletcher, and R. McAllister, “Challenges of operations research
practice in agricultural value chains,” Journal of the Operational Research Society, vol. 61, no. 6, pp. 964–973,
2010.
[22] M. Shukla and S. Jharkharia, “Agri-fresh produce supply chain management: a state-of-the-art literature review,”
International Journal of Operations & Production Management, vol. 33, no. 2, pp. 114–158, 2013.
[23] W. E. Soto-Silva, E. Nadal-Roig, M. C. Gonzalez-Araya, and L. M. Pla-Aragones, “Operational research models
applied to the fresh fruit supply chain,” European Journal of Operational Research, vol. 251, no. 2, pp. 345–355,
2016.
[24] V. Borodin, J. Bourtembourg, F. Hnaien, and N. Labadie, “Handling uncertainty in agricultural supply chain
48

ACCEPTED MANUSCRIPT
ACCEPTED MANUSCRIP
T
management: a state of the art,” European Journal of Operational Research, vol. 254, no. 2, pp. 348–359, 2016.
[25] G. Backus, V. Eidman, and A. Dijkhuizen, “Farm decision making under risk and uncertainty,” Netherlands
Journal of Agricultural Science, vol. 45, no. 2, pp. 307–328, 1997.
[26] J. B. Hardaker, S. Pandey, L. H. Patten, et al., “Farm planning under uncertainty: a review of alternative
programming models,” Review of Marketing and Agricultural Economics, vol. 59, no. 01, 1991.
[27] J. B. Hardaker, Coping with risk in agriculture. CA, 2004.
[28] J. M. van Berlo, “A decision support tool for the vegetable processing industry; an integrative approach of market,
industry and agriculture,” Agricultural Systems, vol. 43, no. 1, pp. 91–109, 1993.
[29] R. H. Sees, “Guide to supply chain management: How getting it right boosts corporate performance (the eco-
nomist) by david jacoby (review),” Transportation Journal, vol. 52, no. 4, pp. 522–524, 2013.
[30] O. Boyabatlı, “Supply management in multiproduct firms with fixed proportions technology,” Management Sci-
ence, vol. 61, no. 12, pp. 3013–3031, 2015.
[31] H. Ge, J. Nolan, and R. Gray, “Identifying strategies to mitigate handling risks in the canadian grain supply
chain,” Canadian Journal of Agricultural Economics/Revue Canadienne D’Agroeconomie, vol. 63, no. 1, pp. 101–
128, 2015.
[32] H. Ge, R. Gray, and J. Nolan, “Agricultural supply chain optimization and complexity: A comparison of analytic
vs simulated solutions and policies,” International Journal of Production Economics, vol. 159, pp. 208–220, 2015.
[33] X.-Y. Ren, Q.-Q. Feng, S. Wang, and X. Wen, “Profit distribution of agricultural supply chain based on shapley
value,” Advance Journal of Food Science and Technology, vol. 7, no. 7, pp. 479–483, 2015.
[34] S. Wiedenmann and J. Geldermann, “Supply planning for processors of agricultural raw materials,” European
Journal of Operational Research, vol. 242, no. 2, pp. 606–619, 2015.
[35] S. Asian and X. Nie, “Coordination in supply chains with uncertain demand and disruption risks: Existence,
analysis, and insights,” IEEE Transactions on Systems, Man, and Cybernetics: Systems, vol. 44, no. 9, pp. 1139–
1154, 2014.
[36] O. Boyabatli, Q. J. D. Nguyen, and T. Wang, Capacity management in agricultural commodity processing and
application in the palm industry. Research Collection Lee Kong Chian School Of Business, 2015.
[37] X. Cai and X. Zhou, “Optimal policies for perishable products when transportation to export market is disrupted,”
Production and Operations Management, vol. 23, no. 5, pp. 907–923, 2014.
[38] T. Kim, C. H. Glock, and Y. Kwon, “A closed-loop supply chain for deteriorating products under stochastic
container return times,” Omega, vol. 43, pp. 30–40, 2014.
[39] J. R. Munhoz and R. Morabito, “Optimization approaches to support decision making in the production planning
of a citrus company: a brazilian case study,” Computers and Electronics in Agriculture, vol. 107, pp. 45–57, 2014.
[40] I. Awudu and J. Zhang, “Stochastic production planning for a biofuel supply chain under demand and price
uncertainties,” Applied Energy, vol. 103, pp. 189–196, 2013.
[41] A. Baghalian, S. Rezapour, and R. Z. Farahani, “Robust supply chain network design with service level against
disruptions and demand uncertainties: A real-life case,” European Journal of Operational Research, vol. 227, no. 1,
pp. 199–215, 2013.
[42] O. Boyabatli and K. E. Wee, Farm-yield management when production rate is yield dependent. Research Collection
Lee Kong Chian School Of Business, 2013.
[43] O. Ahumada, J. R. Villalobos, and A. N. Mason, “Tactical planning of the production and distribution of fresh
49
ACCEPTED MANUSCRIPT
ACCEPTED MANUSCRIP
T
agricultural products under uncertainty,” Agricultural Systems, vol. 112, pp. 17–26, 2012.
[44] O. Ahumada and J. R. Villalobos, “A tactical model for planning the production and distribution of fresh produce,”
Annals of Operations Research, vol. 190, no. 1, pp. 339–358, 2011.
[45] B. H. Gebreslassie, Y. Yao, and F. You, “Design under uncertainty of hydrocarbon biorefinery supply chains:
multiobjective stochastic programming models, decomposition algorithm, and a comparison between cvar and
downside risk,” AICHE Journal, vol. 58, no. 7, pp. 2155–2179, 2012.
[46] A. Hasani, S. H. Zegordi, and E. Nikbakhsh, “Robust closed-loop supply chain network design for perishable
goods in agile manufacturing under uncertainty,” International Journal of Production Research, vol. 50, no. 16,
pp. 4649–4669, 2012.
[47] T. Paksoy, N. Y. Pehlivan, and E. Ozceylan, “Application of fuzzy optimization to a supply chain network
design: a case study of an edible vegetable oils manufacturer,” Applied Mathematical Modelling, vol. 36, no. 6,
pp. 2762–2776, 2012.
[48] B. Tan and N. Comden, “Agricultural planning of annual plants under demand, maturation, harvest, and yield
risk,” European Journal of Operational Research, vol. 220, no. 2, pp. 539–549, 2012.
[49] O. Boyabatli, P. Kleindorfer, and S. Koontz, “Procurement risk management in beef supply chains,” 2011.
[50] Z. Guan and A. B. Philpott, “A multistage stochastic programming model for the new zealand dairy industry,”
International Journal of Production Economics, vol. 134, no. 2, pp. 289–299, 2011.
[51] B. Kazaz and S. Webster, “The impact of yield-dependent trading costs on pricing and production planning under
supply uncertainty,” Manufacturing & Service Operations Management, vol. 13, no. 3, pp. 404–417, 2011.
[52] J. Kim, M. J. Realff, and J. H. Lee, “Optimal design and global sensitivity analysis of biomass supply chain
networks for biofuels under uncertainty,” Computers & Chemical Engineering, vol. 35, no. 9, pp. 1738–1751, 2011.
[53] S. Mirzapour Al-E-Hashem, H. Malekly, and M. Aryanezhad, “A multi-objective robust optimization model
for multi-product multi-site aggregate production planning in a supply chain under uncertainty,” International
Journal of Production Economics, vol. 134, no. 1, pp. 28–42, 2011.
[54] D. Shen, K. K. Lai, S. C. Leung, and L. Liang, “Modelling and analysis of inventory replenishment for perishable
agricultural products with buyer–seller collaboration,” International Journal of Systems Science, vol. 42, no. 7,
pp. 1207–1217, 2011.
[55] C. Bohle, S. Maturana, and J. Vera, “A robust optimization approach to wine grape harvesting scheduling,”
European Journal of Operational Research, vol. 200, no. 1, pp. 245–252, 2010.
[56] W. Jang and C. M. Klein, “Supply chain models for small agricultural enterprises,” Annals of Operations Research,
vol. 190, no. 1, pp. 359–374, 2011.
[57] S. Cholette, “Mitigating demand uncertainty across a winery’s sales channels through postponement,” Interna-
tional Journal of Production Research, vol. 47, no. 13, pp. 3587–3609, 2009.
[58] S. Burer, P. C. Jones, and T. J. Lowe, “Coordinating the supply chain in the agricultural seed industry,” European
Journal of Operational Research, vol. 185, no. 1, pp. 354–377, 2008.
[59] E. J. Lodree and B. M. Uzochukwu, “Production planning for a deteriorating item with stochastic demand and
consumer choice,” International Journal of Production Economics, vol. 116, no. 2, pp. 219–232, 2008.
[60] S. C. Leung, S. O. Tsang, W. L. Ng, and Y. Wu, “A robust optimization model for multi-site production planning
problem in an uncertain environment,” European Journal of Operational Research, vol. 181, no. 1, pp. 224–238,
2007.
50
ACCEPTED MANUSCRIPT
ACCEPTED MANUSCRIP
T
[61] J. M. Merrill, Managing risk in premium fruit and vegetable supply chains. PhD thesis, Massachusetts Institute
of Technology, 2007.
[62] F. G. Ortmann, Modelling the South African fresh fruit export supply chain. PhD thesis, Stellenbosch: University
of Stellenbosch, 2005.
[63] A. Blanco, G. Masini, N. Petracci, and J. Bandoni, “Operations management of a packaging plant in the fruit
industry,” Journal of Food Engineering, vol. 70, no. 3, pp. 299–307, 2005.
[64] S. J. Allen and E. W. Schuster, “Controlling the risk for an agricultural harvest,” Manufacturing & Service
Operations Management, vol. 6, no. 3, pp. 225–236, 2004.
[65] B. Kazaz, “Production planning under yield and demand uncertainty with yield-dependent cost and price,”
Manufacturing & Service Operations Management, vol. 6, no. 3, pp. 209–224, 2004.
[66] P. C. Jones, G. Kegler, T. J. Lowe, and R. D. Traub, “Managing the seed-corn supply chain at syngenta,”
Interfaces, vol. 33, no. 1, pp. 80–90, 2003.
[67] P. C. Jones, T. J. Lowe, R. D. Traub, and G. Kegler, “Matching supply and demand: The value of a second chance
in producing hybrid seed corn,” Manufacturing & Service Operations Management, vol. 3, no. 2, pp. 122–137,
2001.
[68] J. V. Caixeta-Filho, J. M. van Swaay-Neto, and A. d. P. Wagemaker, “Optimization of the production planning
and trade of lily flowers at jan de wit company,” Interfaces, vol. 32, no. 1, pp. 35–46, 2002.
[69] F. H. Wouda, P. van Beek, J. G. van der Vorst, and H. Tacke, “An application of mixed-integer linear programming
models on the redesign of the supply network of nutricia dairy & drinks group in hungary,” OR Spectrum, vol. 24,
no. 4, pp. 449–465, 2002.
[70] W. Miller, L. Leung, T. Azhar, and S. Sargent, “Fuzzy production planning model for fresh tomato packing,”
International Journal of Production Economics, vol. 53, no. 3, pp. 227–238, 1997.
[71] U. Juttner, H. Peck, and M. Christopher, “Supply chain risk management: outlining an agenda for future re-
search,” International Journal of Logistics: Research and Applications, vol. 6, no. 4, pp. 197–210, 2003.
[72] S. M. Wagner and C. Bode, “Dominant risks and risk management practices in supply chains,” in Supply Chain
Risk, pp. 271–290, Springer, 2009.
[73] P. R. Kleindorfer and G. H. Saad, “Managing disruption risks in supply chains,” Production and Operations
Management, vol. 14, no. 1, pp. 53–68, 2005.
[74] T. Sawik, “Selection of a dynamic supply portfolio in make-to-order environment withrisks,” Computers & Oper-
ations Research, vol. 38, no. 4, pp. 782–796, 2011.
[75] C. Tang and B. Tomlin, “The power of flexibility for mitigating supply chain risks,” International Journal of
Production Economics, vol. 116, no. 1, pp. 12–27, 2008.
[76] M. Christopher and H. Peck, “Building the resilient supply chain,” The International Journal of Logistics Man-
agement, vol. 15, no. 2, pp. 1–14, 2004.
[77] A. J. Schmitt and L. V. Snyder, “Infinite-horizon models for inventory control under yield uncertainty and
disruptions,” Computers & Operations Research, vol. 39, no. 4, pp. 850–862, 2012.
[78] H. Peck, “Resilience in the food chain: A study of business continuity management in the food and drink industry,”
Final Report to the Dep. for Environment, Food and Rural Affairs, Dep. of Defence Management & Security
Analysis, Cranfield University, Shrivenham, pp. 1–193, 2006.
[79] W. H. O. F. S. Dept, Terrorist threats to food: guidance for establishing and strengthening prevention and response
51
ACCEPTED MANUSCRIPT
ACCEPTED MANUSCRIP
T
systems. World Health Organization, 2002.
[80] K. R. Everett, R. K. Taylor, M. K. Romberg, J. Rees-George, R. A. Fullerton, J. L. Vanneste, and M. A.
Manning, “First report of pseudomonas syringae pv. actinidiae causing kiwifruit bacterial canker in new zealand,”
Australasian Plant Disease Notes, vol. 6, no. 1, pp. 67–71, 2011.
[81] D. Simchi-Levi, W. Schmidt, and Y. Wei, “From superstorms to factory fires managing unpredictable supply-chain
disruptions,” Harvard Business Review, vol. 92, no. 1-2, pp. 96–+, 2014.
[82] S. Smith et al., “” farming”-it’s declining in the us,” Choices, vol. 7, no. 1, 1992.
[83] J. Vlajic, E. Hendrix, and J. van der Vorst, Food supply chain network robustness: a literature review and research
agenda. Wageningen University, 2008.
[84] M. of Primary Industries (MPI), “Situation and Outlook for Primary Industries (SOPI).” https://www.mpi.
govt.nz/about-mpi/corporate-publications/, 2013.
[85] B. Tomlin, “On the value of mitigation and contingency strategies for managing supply chain disruption risks,”
Management Science, vol. 52, no. 5, pp. 639–657, 2006.
[86] B. Tomlin, “Disruption-management strategies for short life-cycle products,” Naval Research Logistics (NRL),
vol. 56, no. 4, pp. 318–347, 2009.
[87] T. Sawik, “Integrated supply, production and distribution scheduling under disruption risks,” Omega, vol. 62,
pp. 131–144, 2016.
[88] D. Leonard, “’the only lifeline was the wal-mart’,” Fortune, vol. 152, no. 7, pp. 74–+, 2005.
[89] S. Dani and A. Deep, “Fragile food supply chains: reacting to risks,” International Journal of Logistics: Research
and Applications, vol. 13, no. 5, pp. 395–410, 2010.
[90] A. Norrman and U. Jansson, “Ericsson’s proactive supply chain risk management approach after a serious sub-
supplier accident,” International Journal of Physical Distribution & Logistics Management, vol. 34, no. 5, pp. 434–
456, 2004.
[91] G. A. Zsidisin, “Managerial perceptions of supply risk,” Journal of Supply Chain Management, vol. 39, no. 4,
pp. 14–26, 2003.
[92] M. Nishat Faisal, D. Banwet, and R. Shankar, “Mapping supply chains on risk and customer sensitivity dimen-
sions,” Industrial Management & Data Systems, vol. 106, no. 6, pp. 878–895, 2006.
[93] B. Gaudenzi and A. Borghesi, “Managing risks in the supply chain using the ahp method,” The International
Journal of Logistics Management, vol. 17, no. 1, pp. 114–136, 2006.
[94] S. Agiwal, H. Mohtadi, et al., “Risk mitigating strategies in the food supply chain,” in American Agricultural
Economics Assocation (Annual Meeting), 2008.
[95] D. Ivanov, A. Pavlov, A. Dolgui, D. Pavlov, and B. Sokolov, “Disruption-driven supply chain (re)-planning and
performance impact assessment with consideration of pro-active and recovery policies,” Transportation Research
Part E: Logistics and Transportation Review, vol. 90, pp. 7–24, 2016.
[96] T. Sawik, “A portfolio approach to supply chain disruption management,” International Journal of Production
Research, pp. 1–22, 2016.
[97] M. Dong and F. F. Chen, “Quantitative robustness index design for supply chain networks,” in Trends in Supply
Chain Design and Management, pp. 369–391, Springer, 2007.
[98] K. A. Foster, “A case study approachto understanding regional resilience,” Institute of Urban & Regional Devel-
opment, 2007.
52

ACCEPTED MANUSCRIPT
ACCEPTED MANUSCRIP
T
[99] D. Waters, Supply chain risk management: vulnerability and resilience in logistics. Kogan Page Publishers, 2011.
[100] S. R. Yadav, N. Mishra, V. Kumar, and M. Tiwari, “A framework for designing robust supply chains considering
product development issues,” International Journal of Production Research, vol. 49, no. 20, pp. 6065–6088, 2011.
[101] J. V. Vlajic, J. G. Van der Vorst, and R. Haijema, “A framework for designing robust food supply chains,”
International Journal of Production Economics, vol. 137, no. 1, pp. 176–189, 2012.
[102] V. Gabrel, C. Murat, and A. Thiele, “Recent advances in robust optimization: An overview,” European Journal
of Operational Research, vol. 235, no. 3, pp. 471–483, 2014.
[103] M. Goetschalckx and B. Fleischmann, “Strategic network planning,” in Supply Chain Management and Advanced
Planning, pp. 117–137, Springer, 2005.
[104] Y. Mo and T. P. Harrison, “A conceptual framework for robust supply chain design under demand uncertainty,”
in Supply Chain Optimization, pp. 243–263, Springer, 2005.
[105] J. M. Mulvey, R. J. Vanderbei, and S. A. Zenios, “Robust optimization of large-scale systems,” Operations
Research, vol. 43, no. 2, pp. 264–281, 1995.
[106] L. V. Snyder, Supply chain robustness and reliability: Models and algorithms. PhD thesis, Northwestern University,
2003.
[107] T. J. Pettit, Supply chain resilience: development of a conceptual framework, an assessment tool and an imple-
mentation process. PhD thesis, The Ohio State University, 2008.
[108] J. Fiksel, “Sustainability and resilience: toward a systems approach,” Sustainability: Science, Practice, & Policy,
vol. 2, no. 2, 2006.
[109] W. Klibi and A. Martel, “Modeling approaches for the design of resilient supply networks under disruptions,”
International Journal of Production Economics, vol. 135, no. 2, pp. 882–898, 2012.
[110] M. Christopher and H. Peck, “The five principles of supply chain resilience,” Logistics Europe, vol. 12, no. 1,
pp. 16–21, 2004.
[111] H. Carvalho, A. P. Barroso, V. H. Machado, S. Azevedo, and V. Cruz-Machado, “Supply chain redesign for
resilience using simulation,” Computers & Industrial Engineering, vol. 62, no. 1, pp. 329–341, 2012.
[112] Y. Kristianto, A. Gunasekaran, P. Helo, and Y. Hao, “A model of resilient supply chain network design: A
two-stage programming with fuzzy shortest path,” Expert Systems with Applications, vol. 41, no. 1, pp. 39–49,
2014.
[113] J. T. Scott and C. B. Baker, “A practical way to select an optimum farm plan under risk,” American Journal of
Agricultural Economics, vol. 54, no. 4 Part 1, pp. 657–660, 1972.
[114] H. Markowitz, “Portfolio selection,” The Journal of Finance, vol. 7, no. 1, pp. 77–91, 1952.
[115] R. J. Freund, “The introduction of risk into a programming model,” Econometrica: Journal of the Econometric
Society, pp. 253–263, 1956.
[116] P. B. Hazell, “A linear alternative to quadratic and semivariance programming for farm planning under uncer-
tainty,” American Journal of Agricultural Economics, vol. 53, no. 1, pp. 53–62, 1971.
[117] T. O. Randhir and J. G. Lee, “Effect of water quality standards on farm income, risk, and nps pollution1,” 2000.
[118] J. R. Anderson, J. L. Dillon, and J. Hardaker, Agricultural Decision Analysis. Information Systems Division,
National Agricultural Library, 1977.
[119] G. B. Dantzig, Linear programming and extensions. Princeton University Press, 1998.
[120] G. W. Evans, “An overview of techniques for solving multiobjective mathematical programs,” Management Sci-
53
ACCEPTED MANUSCRIPT
ACCEPTED MANUSCRIP
T
ence, vol. 30, no. 11, pp. 1268–1282, 1984.
[121] D. Barnett, B. Blake, and B. A. McCarl, “Goal programming via multidimensional scaling applied to senegalese
subsistence farms,” American Journal of Agricultural Economics, vol. 64, no. 4, pp. 720–727, 1982.
[122] A. N. Rae, “An empirical application and evaluation of discrete stochastic programming in farm management,”
American Journal of Agricultural Economics, vol. 53, no. 4, pp. 625–638, 1971.
[123] A. M. Featherstone, P. V. Preckel, T. G. Baker, et al., “Modeling farm financial decisions in a dynamic and
stochastic environment.,” Agricultural Finance Review, vol. 50, pp. 80–99, 1990.
[124] C. R. Taylor et al., Applications of dynamic programming to agricultural decision problems. Westview Press, Inc.,
1993.
[125] O. R. Burt, “Optimal replacement under risk,” Journal of Farm Economics, vol. 47, no. 2, pp. 324–346, 1965.
[126] D. Yaron and A. Dinar, “Optimal allocation of farm irrigation water during peak seasons,” American Journal of
Agricultural Economics, vol. 64, no. 4, pp. 681–689, 1982.
[127] A. Stoecker, A. Seidmann, and G. Lloyd, “A linear dynamic programming approach to irrigation system manage-
ment with depleting groundwater,” Management Science, vol. 31, no. 4, pp. 422–434, 1985.
[128] J. Danielson and C. Taylor, Optimal Crop Rotation to control Cephalosporium Stripe in Winter Wheat. Boulder,
CO: Westview Press, 1993.
[129] P. Anderson, “Perspective: Complexity theory and organization science,” Organization Science, vol. 10, no. 3,
pp. 216–232, 1999.
[130] N. Schieritz, “Integrating system dynamics and agent-based modeling,” in Proceedings of the XX International
Conference of the System Dynamics society, 2002.
[131] D. T. Robinson, D. G. Brown, D. C. Parker, P. Schreinemachers, M. A. Janssen, M. Huigen, H. Wittmer, N. Gotts,
P. Promburom, E. Irwin, et al., “Comparison of empirical methods for building agent-based models in land use
science,” Journal of Land Use Science, vol. 2, no. 1, pp. 31–55, 2007.
[132] S. A. Saseendran, K. G. Hubbard, K. K. Singh, N. Mendiratta, L. S. Rathore, and S. V. Singh, “Optimum
transplanting dates for rice in kerala, india, determined using both ceres v3. 0 and climprob,” Agronomy Journal,
vol. 90, no. 2, pp. 185–190, 1998.
[133] M. Delfieh, M. Meskarbashi, B. Andarzian, and R. Farhoudi, “Simulating the effects of planting date and nitrogen
fertilizer on yield and phenological stages of maize cultivar sc-604 under climatic conditions of south-western iran
using ceres-maize model,” Research on Crops, vol. 12, no. 2, pp. 326–335, 2011.
[134] A. Ben-Tal and A. Nemirovski, “Robust convex optimization,” Mathematics of Operations Research, vol. 23, no. 4,
pp. 769–805, 1998.
[135] D. Bertsimas and M. Sim, “The price of robustness,” Operations Research, vol. 52, no. 1, pp. 35–53, 2004.
[136] A. Ben-Tal, B. Golany, A. Nemirovski, and J.-P. Vial, “Retailer-supplier flexible commitments contracts: a robust
optimization approach,” Manufacturing & Service Operations Management, vol. 7, no. 3, pp. 248–271, 2005.
[137] A. Higgins, P. Thorburn, A. Archer, and E. Jakku, “Opportunities for value chain research in sugar industries,”
Agricultural Systems, vol. 94, no. 3, pp. 611–621, 2007.
[138] M. Dawande, S. Gavirneni, M. Mehrotra, and V. Mookerjee, “Efficient distribution of water between head-reach
and tail-end farms in developing countries,” Manufacturing & Service Operations Management, vol. 15, no. 2,
pp. 221–238, 2013.
[139] S. Goyal and B. C. Giri, “Recent trends in modeling of deteriorating inventory,” European Journal of Operational
54

ACCEPTED MANUSCRIPT
ACCEPTED MANUSCRIP
T
Research, vol. 134, no. 1, pp. 1–16, 2001.
[140] J. D. Johnson, Managing variability in the semiconductor supply chain. PhD thesis, Massachusetts Institute of
Technology, 2005.
[141] A. J. Schmitt and M. Singh, “A quantitative analysis of disruption risk in a multi-echelon supply chain,” Inter-
national Journal of Production Economics, vol. 139, no. 1, pp. 22–32, 2012.
[142] X. Qi, J. F. Bard, and G. Yu, “Supply chain coordination with demand disruptions,” Omega, vol. 32, no. 4,
pp. 301–312, 2004.
[143] J. Li, X. Liu, J. Wu, and F. Yang, “Coordination of supply chain with a dominant retailer under demand
disruptions,” Mathematical Problems in Engineering, vol. 2014, 2014.
[144] I. Horowitz, “On two-source factor purchasing,” Decision Sciences, vol. 17, no. 2, pp. 274–279, 1986.
[145] P. Kelle and E. Silver, “Decreasing expected shortages through order splitting,” Engineering Costs and Production
Economics, vol. 19, no. 1-3, pp. 351–357, 1990.
[146] R. V. Ramasesh, J. K. Ord, J. C. Hayya, and A. Pan, “Sole versus dual sourcing in stochastic lead-time (s, q)
inventory models,” Management Science, vol. 37, no. 4, pp. 428–443, 1991.
[147] S. G. Gulen, “Regionalization in the world crude oil market,” The Energy Journal, pp. 109–126, 1997.
[148] A. Hsu and Y. Bassok, “Random yield and random demand in a production system with downward substitution,”
Operations Research, vol. 47, no. 2, pp. 277–290, 1999.
[149] B. Tomlin and Y. Wang, “Pricing and operational recourse in coproduction systems,” Management Science,
vol. 54, no. 3, pp. 522–537, 2008.
[150] M. Goyal and S. Netessine, “Volume flexibility, product flexibility, or both: The role of demand correlation and
product substitution,” Manufacturing & service operations management, vol. 13, no. 2, pp. 180–193, 2011.
[151] M. Ganesh, S. Raghunathan, and C. Rajendran, “The value of information sharing in a multi-product supply
chain with product substitution,” Lie Transactions, vol. 40, no. 12, pp. 1124–1140, 2008.
[152] Q. Qiang, A. Nagurney, and J. Dong, “Modeling of supply chain risk under disruptions with performance meas-
urement and robustness analysis,” in Managing Supply Chain Risk and Vulnerability, pp. 91–111, Springer, 2009.
[153] T. Sawik, “On the robust decision-making in a supply chain under disruption risks,” International Journal of
Production Research, vol. 52, no. 22, pp. 6760–6781, 2014.
[154] K. Zhao, A. Kumar, T. P. Harrison, and J. Yen, “Analyzing the resilience of complex supply network topologies
against random and targeted disruptions,” IEEE Systems Journal, vol. 5, no. 1, pp. 28–39, 2011.
[155] Y. Kim, Y.-S. Chen, and K. Linderman, “Supply network disruption and resilience: A network structural per-
spective,” Journal of Operations Management, vol. 33, pp. 43–59, 2015.
[156] A. E. Nejad, I. Niroomand, and O. Kuzgunkaya, “Responsive contingency planning in supply risk management
by considering congestion effects,” Omega, vol. 48, pp. 19–35, 2014.
[157] T. Sawik, “Selection of resilient supply portfolio under disruption risks,” Omega, vol. 41, no. 2, pp. 259–269, 2013.
[158] L. V. Snyder, M. P. Scaparra, M. S. Daskin, and R. L. Church, “Planning for disruptions in supply chain networks,”
in Models, Methods, and Applications for Innovative Decision Making, pp. 234–257, INFORMS, 2006.
[159] G. N. Gilbert, Agent-based models. No. 153, SAGE, 2008.
[160] H. V. D. Parunak, R. Savit, R. L. Riolo, and S. J. Clark, DASCh: Dynamic analysis of supply chains. DASCh
Final Report, Part 0, Executive Summary, 1997.
[161] W. S. Lim, “Producer-supplier contracts with incomplete information,” Management Science, vol. 47, no. 5,
55

ACCEPTED MANUSCRIPT
ACCEPTED MANUSCRIP
T
pp. 709–715, 2001.
56