Aging Behaviour and Mechanical Properties of a Solution Treated … · 2013-03-05 · Aging...
57
Aging Behaviour and Mechanical Properties of a Solution Treated and Asymmetrically Rolled 6082 Aluminium alloy Tutor and Supervisor Prof. Maurizio Vedani Master Thesis of Burcu Dursunkaya April 2012
Transcript of Aging Behaviour and Mechanical Properties of a Solution Treated … · 2013-03-05 · Aging...
Aging Behaviour and Mechanical Properties of a Solution
Treated and Asymmetrically Rolled 6082 Aluminium alloy
Tutor and Supervisor
Prof. Maurizio Vedani
Master Thesis of
Burcu Dursunkaya
April 2012

i
Acknowledgement I have to thank all the people that have supported me while I was performing the experiments and
writing the thesis. I am grateful to my supervisor Prof. Vedani because of his support and
understanding. While I had been performing the experiments, I lost my mother. After that period I
was not feeling well to continue to my study. But life goes on so I have to catch it up again from
somewhere. So the firstly special thanks to my mother that had always supported me all my life
and even she was the first person who wanted me to come to study at Politecnico di Milano.
Secondly I want to thank you Fatma Abla who always believes and supports me.
I have to thank to Doc. Stefano Fare who had been helping me while performing the experiments
and had shared his ideas suggestions with me.
Finally special thanks to my friends Esra, Erdem, Dilek, Tugce, Oznur who really help for my thesis
a lot.
ii
Abstract
A study was carried out on aging behaviour of a 6082 alloy processed by severe plastic
deformation technique of asymmetric rolling. This technique was able to generate an
ultrafine-grained structure in samples processed at room temperature. It was stated that
severe straining promotes marked changes in the post deformation aging kinetics. The peaks
of β’’ / β’ transition phases were anticipated and of progressively reduced intensity over the
coarse grained alloy. A further peak accounting for onset of re-crystallization also appeared in
the severely deformed samples. Isothermal aging treatments performed at 180◦C revealed
that in the severely deformed samples, aging became so fast that the hardness curves
continuously decreased due to overwhelming effects of structure restoration. On the contrary,
aging at 130˚C offers good opportunities for fully exploiting the precipitate hardening effects
in the ultrafine-grained alloy.

iii
Contents
Acknowledgement ...................................................................................... i
Abstract ...................................................................................................... ii
1 Introduction ............................................................................................1
1.1 Review of Aluminium Alloys ...............................................................1
1.2 Heat Treatment ..................................................................................2
2 Severe Plastic Deformation .....................................................................4
2.1 The Deformed State ...........................................................................4
2.2 Recrystallization and Formation of Ultrafine Grained Structure ........ 9
2.3 Severe Plastic Deformation Techniques ........................................... 15
2.3.1 Asymmetric & Symmetric Rolling ............................................... 17
3 Experimental Equipments ..................................................................... 25
3.1 Heat Flux Differential Scanning Calorimetry..................................... 21
3.2 Vickers Hardness Test ...................................................................... 22
4 Experimental Procedures ...................................................................... 24
4.1 Starting Material .............................................................................. 24
4.2 Rolling Process ................................................................................. 25
4.3 Aging Behaviour ............................................................................... 29
5 Results and Discussion .......................................................................... 33
5.1 Optical Micrographs ......................................................................... 33
5.2 DSC Analyses .................................................................................... 36
5.3 Aging Maps ...................................................................................... 44
6 Conclusion ............................................................................................. 49
References ................................................................................................ 51
1
CHAPTER 1
Introduction
1.1 Review of Aluminium alloys
The low density combined with high strength have made aluminum alloys the primary material of
choice for applications such as in aircraft and automobiles where specific strength (strength-to-
weight ratio) is a major design consideration [1]. For instance according to Coalition of Automotive
Lightweighting Materials (CALM), lightweight materials are needed to produce more fuel efficient
cars for the 21stcentury [2]. For this purpose, aluminum can replace iron and steel components in
motor vehicles for a weight savings of 45 to 50 percent while increasing performance and fuel
efficiency without compromising safety [3].
The Aluminum Association, based in Arlington, Virginia, works globally to promote aluminum as
the most sustainable and recyclable automotive, packaging and construction material in today’s
market. Today, aluminum is the most commonly recycled material in the world. Nearly 90 percent
of auto aluminum is recovered and recycled [3].
New demanding applications are developing continuously to make aluminum alloys competitive in
future applications, so it is essential to access to powerful tools for material development.
To a large extent the mechanical properties and behavior of a metal depend on the dislocation
content and structure, the size of the grains and the orientation or texture of the grains.
The significant contribution to the high strength of heat-treatable aluminum alloys is due to the
precipitation of excess alloying elements from supersaturated solid solution to form fine second
phase particles that will act as obstacles to moving dislocations. Composition, manufacture
technology, and heat treatment all affect precipitation evolution therefore determine the
strengthening response. Understanding well, especially in a quantitative manner, how these
controlling factors exert their influences on microstructures further on engineering mechanical
behaviors is very rewarding because the ability to predict and control the desired microstructures
is central for developing advanced aluminum alloys that could achieve the progressively desired
level of performance [4].
2
1.2 Heat Treatment
In general, the solution heat treatment adopted for Al alloys consists of heating the material to a
known temperature, holding this temperature for a definite time, then quenching the part to
room temperature or below. During the heating process, a greater number of the constituents of
the metal are put into solid solution [21].
This thermal treatment consists of three main processes: (1) Solution heat treatment
(SHT): this is where the material is held at an elevated temperature for a sufficient time, so that
all the constituents are taken into solid solution, giving one single phase.
(2) Quenching: this is when the material is rapidly quenched in cold water. It is cooled from the
SHT temperature to give a microstructure condition known as ‘Super Saturated Solid Solution’
(SSSS).
(3) Aging: age-hardening is the final stage in the development of the properties of heat treatable
alloys, it is the controlled decomposition of the SSSS to form finely dispersed precipitates.
When observing the aluminium alloy, it is known that the ductility of the material is obtained from
the SHT stage of the T4 treatment, and the strength is obtained from the aging process of the T6
treatment.
At the start of SHT the alloying elements of the aluminum alloys are in ‘clusters’ usually known as
precipitates. For 6xxx series aluminum alloys, these precipitates are made up mainly of Mg2 Si
and/or Si. Such precipitates are present in the alloy due to equilibrium phase stability.
SHT process is split into three stages as it was mentioned before. During the third stage (age
hardening), precipitates (secondary phases) are allowed to grow at an increased rate due to the
elevated temperature of the artificial aging process which consists of heating aluminum alloy to a
specific temperature and holding for a specified length of time. The presence of these precipitates
increases the strength of the material, but reduces the ductility.
At the start of the treatment the solutes are in patches of highly concentrated alloying elements
(precipitates) of different size that provide barriers to the flow of the material during deformation
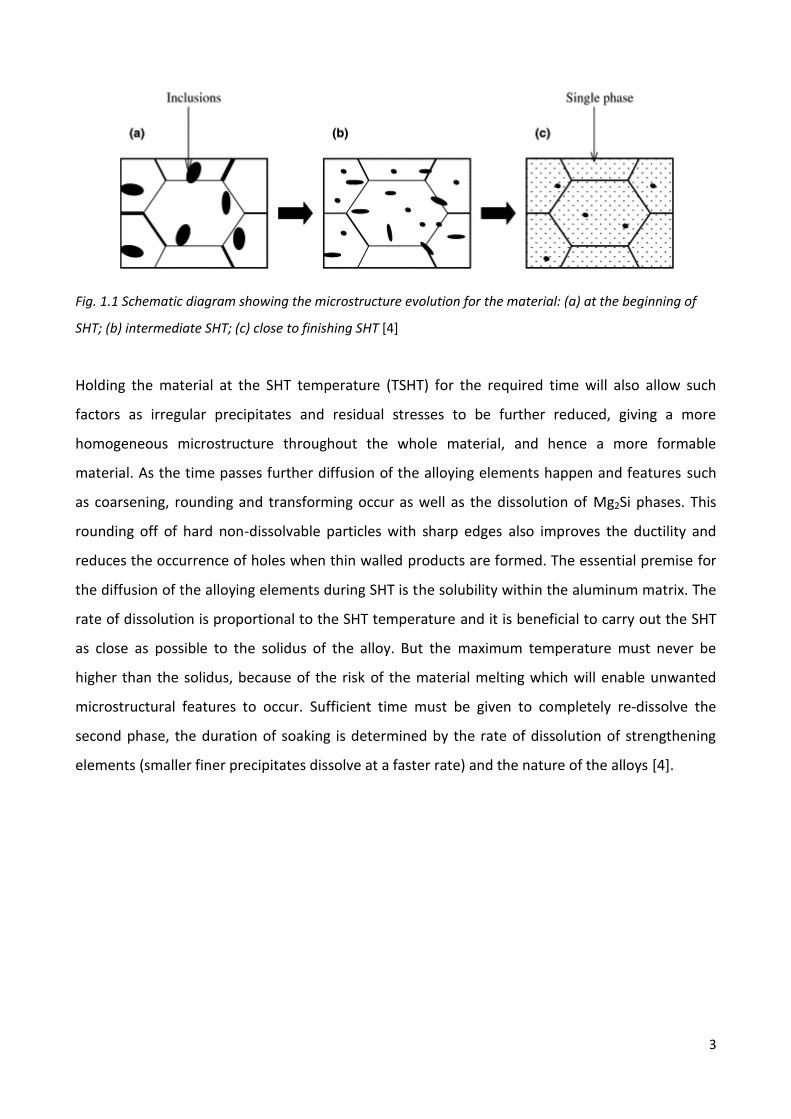
(see Fig. 1.1a). With time these precipitates dissolve into the material, diffusing throughout the
whole structure (see Fig. 1.1b-c). This diffusion results in the ‘flow barrier’ being reduced and
eliminates the chance of forming micro-voids around second phases in plastic deformation. This
results in the ductility being increased and the flow stress being reduced when hot tensile tested.
3
Fig. 1.1 Schematic diagram showing the microstructure evolution for the material: (a) at the beginning of
SHT; (b) intermediate SHT; (c) close to finishing SHT [4]
Holding the material at the SHT temperature (TSHT) for the required time will also allow such
factors as irregular precipitates and residual stresses to be further reduced, giving a more
homogeneous microstructure throughout the whole material, and hence a more formable
material. As the time passes further diffusion of the alloying elements happen and features such
as coarsening, rounding and transforming occur as well as the dissolution of Mg2Si phases. This
rounding off of hard non-dissolvable particles with sharp edges also improves the ductility and
reduces the occurrence of holes when thin walled products are formed. The essential premise for
the diffusion of the alloying elements during SHT is the solubility within the aluminum matrix. The
rate of dissolution is proportional to the SHT temperature and it is beneficial to carry out the SHT
as close as possible to the solidus of the alloy. But the maximum temperature must never be
higher than the solidus, because of the risk of the material melting which will enable unwanted
microstructural features to occur. Sufficient time must be given to completely re-dissolve the
second phase, the duration of soaking is determined by the rate of dissolution of strengthening
elements (smaller finer precipitates dissolve at a faster rate) and the nature of the alloys [4].
4
CHAPTER 2
Severe Plastic Deformation
With the increasing emphasis on high-performance structures, metals and their alloys represent
one of the most economically significant engineered materials class now and into the foreseeable
future. The nanocrystalline (NC) and ultrafine-grained (UFG) materials are one of those materials
which currently receive a particular attention due to their advanced properties. These materials
have average grain sizes varying between sub-micrometer (100–1000 nm) and nanometer (less
than 100 nm). The impressive mechanical behaviors make such a branch of science appealing and
thereby research has developed, in this topic, so rapidly in recent years [5, 22].
Along with their inherent high strength, another reported potential of this class of materials is the
possibility for high strain rate superplasticity at medium and elevated temperatures [23].
Economically, the pertinence of their mechanical properties can be also justified behind the use of
minimum additional alloying elements, the exclusion of complicated additional heat treatments
and the least compositional modification for easy end-of-life scrap recycling, etc. Hence, relevant
developments indicate the increase in industrial interests [8].
Several methods have been developed for grain refinement and severe plastic deformation (SPD)
is currently one of the most promising methods. For the UFG materials, reasonably homogeneous
and equiaxed microstructures need some additional conditions with the majority of grain
boundaries having high angles of misorientation. The existence of a large fraction of high-angle
grain boundaries is essential in order to get advanced and exceptional properties. In addition, the
grain boundaries sliding mechanisms become important especially during plastic strain, contrary
to coarse- grained polycrystals [5, 24].
These mechanisms to observe the mechanical behaviours and the techniques of severe plastic
deformation are the topics of this chapter.
2.1 The Deformed State
Metals that have high or moderate stacking fault energy, deform by slip like aluminium alloys,
α-iron, nickel and copper. Mostly the deformation is heterogeneous, and regions of different
orientations develop within the grains leading to grain subdivision or fragmentation. It is known
that during the deformation the microstructure evolves and it is subdivided at length scales from

5
nanometers to millimeters. This scale-based hierarchy classifies the microstructure as shown in
Fig. 2.1.
Fig. 2.1 The hierarchy of microstructure in a polycrystalline metal deforming by slip. The various features are
shown at increasing scale: (a) Dislocations, (b) Dislocation boundaries, (c) Deformation and transition bands
within a grain, (d) Specimen and grain-scale shear bands [20]
Starting from the smallest scale, dislocations can be examined that may exist as tangles or random
structures. The dislocations that are produced on deformation form the boundaries of cells or
subgrains, which are the smallest volume elements in the deformed microstructure. As it is shown
in Fig. 2.1b they are small (0,5-1µm), approximately equiaxed and separated by small (~1˚)
misorientations. During deformation, the size, shape and misorientation of these cells do not
change very much and therefore, these cell boundaries are the transient features of the
microstructure as the result of a dynamic balance between dislocation annihilation and trapping.
However, as it was examined the cell size in aluminium is found to initially decrease with
increasing strain (ε) to ~ 0,5µm, but remain almost constant at ε > 0,5. These boundaries are called
incidential dislocation boundaries (IDBs).
The cells may occur in blocks as shown in Fig. 2.1b. In the deformed aluminium, the cell blocks are
elongated and a little more than one cell in width. They can described as cell bands as shown in
Fig. 2.2.

6
Fig. 2.2 TEM micrograph (a) of cell block structure in 10% cold rolled aluminium (ND-RD plane) and sketch
(b) of the area showing the misorientations across the cell block boundaries (heavy lines) [20]
The slip activity is similar within individual blocks, but differs between the blocks. In this way, each
cell block can deform relatively homogeneously on less than five slip systems required by plasticity
theory [20], and the overall strain is then accomplished by the variation of slip activity between
the blocks. The cell blocks or bands are bounded by longer, aligned boundaries, which are termed
dense dislocation walls (DDWs), microbands, or cell-band walls. They have higher misorientation
angle than the boundaries within the cell blocks. The misorientations across alternate cell-band
walls tend to oscillate about a mean, with no substantial long range orientation gradient.
Cell-band boundaries are distinguished from the cell boundaries, the cell-band boundary
misorientations increase with increasing strain. At larger strains, the aligned cell band structures
are intersected by thin microshear bands with the grains. The microshear bands are typically
1 - 2µm thick and contain cells of a similar size and misorientation to the cell-bands. With
increasing strain, the misorientation within the microshear band also increases and differs from
the cell-bands. In addition, when it is continued to increase the strain, the microshear bands and
7
the cell-bands become more closely aligned with the rolling plane and at ε > 2 the various bands
cannot be clearly identified, and at this stage, the microshear band walls have become high angle
boundaries. The rolled microstructures then consist of long lamellar boundaries, and many of
them high angle, and aligned parallel to the rolling plane. These structures can be seen in
aluminium, nickel, copper and iron.
Particularly in coarse-grained materials, it is often found that individual grains within the sample
subdivide on a large scale during deformation (see Fig. 2.1c) into regions of different orientation,
as a consequence of either inhomogeneous stresses transmitted by neighboring grains or the
instrinsic instability of the grain during plastic deformation. The resulting deformation bands
deform on different slip systems and may develop widely divergent orientations. Barrett [41]
described the term deformation band a volume of approximately constant orientation, which
significantly differs from the orientation(s), present elsewhere in that grain. The regions between
the deformation bands which may be either diffuse or sharp are called transition bands. A
transition band develops when neighboring volumes of a grain deform on a different slip system
and rotate to different end orientations. The transition band consists of a cluster of long narrow
cells or subgrains with a cumulative misorientation from one side of the cluster to the other.
In Fig. 2.1c it is seen that a region B has a different orientation than a region A in the grain. The
region at the edge of the deformation band where the orientation changes from B to A may
have a finite width, which it is the transition band. However, in some cases the orientation change
is sharp, and this is then a deformation-induced grain boundary.
It is sometimes found, particularly in aluminium alloys, that the width of the transition band is
reduced to only one or two units but the large orientation change across the band is retained.
The details of transition band formation depend strongly on the grain orientation. However, the
occurrence of deformation bands is dependent on the microstructure and deformation conditions.
The nature and formation of deformation bands have been studied extensively and two types of
deformation bands are identified. One of these originates in the ambiguity associated with the
selection of the operative slip systems. In many cases the imposed strain can be accommodated by
more than one set of slip systems and the different sets lead to rotations in different senses. In the
second type, different regions of a grain may experience different strains if the work done within
the bands is less than that required for homogeneous deformation.
The grain orientation is an important factor in determining whether or not a grain will deform
relatively homogeneously or fragment by deformation banding. For example, the {110} <001>

8
Goss orientation in fcc materials is very stable under condition of plane strain deformation, and
single crystals, and coarse-grained polycrystals can undergo extensive deformation without the
development of large-scale heterogeneities.
The initial grain size is of particular importance, and deformation banding occurs much more
readily in coarse grained metals, and in aluminium, deformation banding did not occur in material
with a grain size less than 20µm. By using an energy criterion, it is predicted that the number of
deformation bands per grain should be proportional to the square root of the grain size [20].
Moreover, there is extensive evidence that deformation banding decreases at higher
temperatures [20].
In Fig. 2.1d it is also seen that the formation of shear bands that correspond to narrow regions of
intense shear that occur independently of the grain structure and independently also of normal
crystallographic considerations. In rolled material they occur at ~ 35˚ to the rolling plane and
parallel to the transverse direction. The number of shear bands increases rapidly with strain. And
in the case of high stacking fault energy of materials, further deformation leads to the formation
of large through thickness shear bands and eventually fracture occurs along these.
To summarize the conditions for shear banding, it can be said that grain size, orientation, solute
atoms and deformation temperature have an effect on shear banding. It can be assumed that the
tendency for shear banding increased with increasing grain size. For instance, the addition of
magnesium in aluminium promotes shear banding. For the deformation temperature, several
authors have demonstrated that shear banding becomes less common at high temperatures.
Fig. 2.3 The tendency for shear band formation in Al–1%Mg as a function of strain and deformation
temperature, (Duckham et al. 2001) [20]

9
2.2 Recrystallization and Formation of Ultrafine Grained
Structure
The as-cast grain size of most industrial alloys is generally large (greater than 100µm), and further
grain refinement is achieved by conventional thermomechanical processing. For instance; for
aluminium alloys, fine-grained microstructures are often produced by the recrystallization of a
cold worked material, the smallest grain sizes (ca.10µm) being achieved in alloys containing large
second- phase particles that promote recrystallization during the anneling of highly strained
material. In addition to the example, only with the conventional process it is not possible to have a
significant grain refinement; in other words the process parameters must be under control in
order to activate and control phenomena like recrystallization which can refine the structure
[25].
Starting with the review of recrystallization, a deformed metal has a large stored energy and,
when it is subsequently annealed at an elevated temperature, it usually recrystallizes, and will
normally revert to a lower energy by the formation of new defect-free grains that grow to
consume the deformed microstructure. This is a process of discontinuous recrystallization [25].
During a discontinuous recrystallization process, the microstructure is heterogeneous and can
clearly be divided into regions which have recrystallized and regions which are unrecrystallized [6].
Furthermore; conventional thermomechanical processing of alloys generally results in grain sizes
of the order of 30–250 µm and by conventional thermomechanical processing routes such as
deformation followed by discontinuous recrystallization, small grain sizes can not be achieved but
they can be produced following plastic deformation to very large strains [26,42]. By the application
of very large plastic strains, sub-micron grain (SMG) structures may be produced in many metallic
materials. It is found that with increasing plastic deformation, the microstructural instability
increases and the metal recrystallizes more readily [25]. Consequently, materials deformed to very
large strains may be stable against conventional discontinuous recrystallization because a large
fraction of the boundaries are of high angle, but may, on subsequent annealing, evolve entirely
equixed fine-grained microstructure [26, 27]. Such a process is reasonably homogeneous and
distinct ‘‘recrystallized’’ and ‘‘unrecrystallized’’ regions cannot be distinguished during the
transformation. This type of process can be referred as continuous recrystallization [6]. An
example of a continuous recrystallization process in a compressed metal is shown schematically in
Fig. 2.4. During hot deformation of a polycrystalline metal, subgrains develop within the grains and
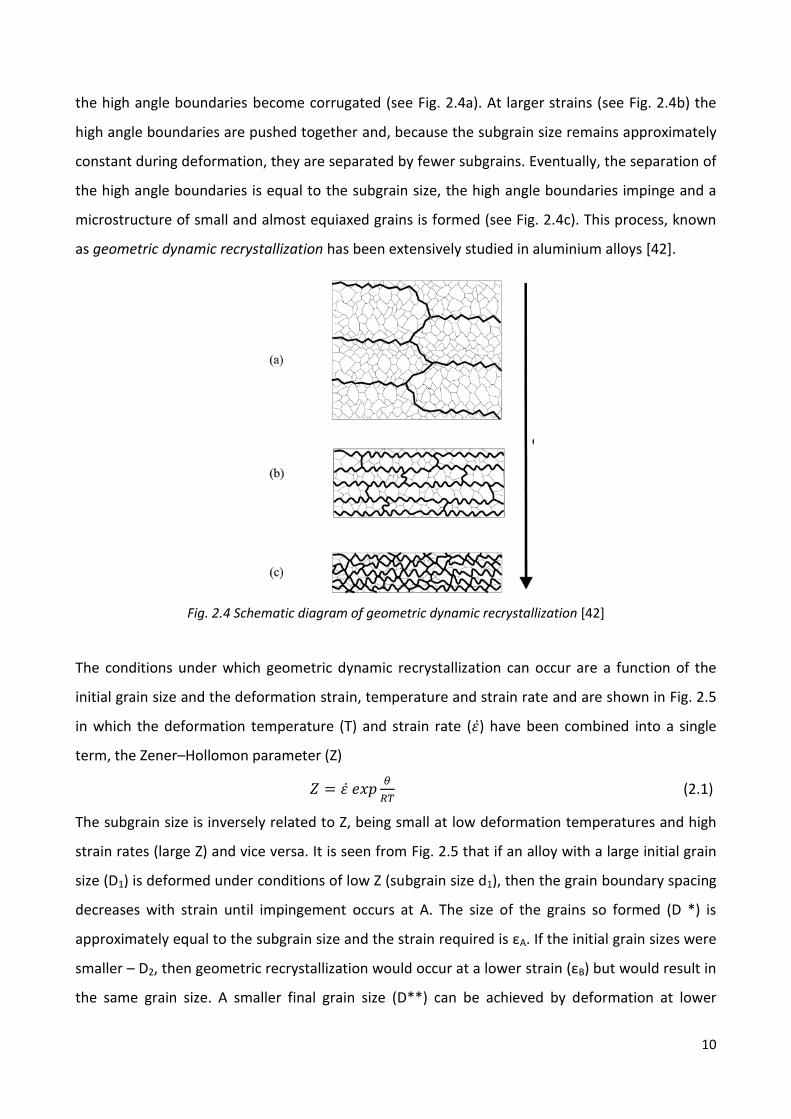
10
the high angle boundaries become corrugated (see Fig. 2.4a). At larger strains (see Fig. 2.4b) the
high angle boundaries are pushed together and, because the subgrain size remains approximately
constant during deformation, they are separated by fewer subgrains. Eventually, the separation of
the high angle boundaries is equal to the subgrain size, the high angle boundaries impinge and a
microstructure of small and almost equiaxed grains is formed (see Fig. 2.4c). This process, known
as geometric dynamic recrystallization has been extensively studied in aluminium alloys [42].
Fig. 2.4 Schematic diagram of geometric dynamic recrystallization [42]
The conditions under which geometric dynamic recrystallization can occur are a function of the
initial grain size and the deformation strain, temperature and strain rate and are shown in Fig. 2.5
in which the deformation temperature (T) and strain rate ( ) have been combined into a single
term, the Zener–Hollomon parameter (Z)
(2.1)
The subgrain size is inversely related to Z, being small at low deformation temperatures and high
strain rates (large Z) and vice versa. It is seen from Fig. 2.5 that if an alloy with a large initial grain
size (D1) is deformed under conditions of low Z (subgrain size d1), then the grain boundary spacing
decreases with strain until impingement occurs at A. The size of the grains so formed (D *) is
approximately equal to the subgrain size and the strain required is εA. If the initial grain sizes were
smaller – D2, then geometric recrystallization would occur at a lower strain (εB) but would result in
the same grain size. A smaller final grain size (D**) can be achieved by deformation at lower
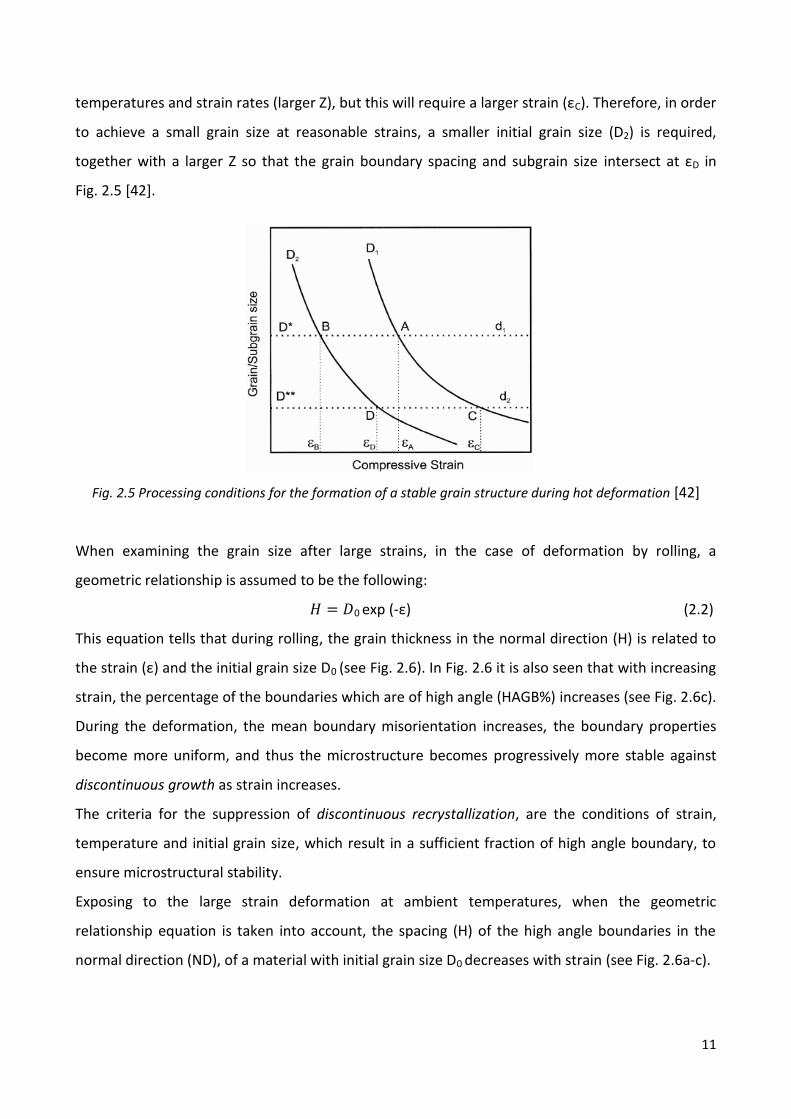
11
temperatures and strain rates (larger Z), but this will require a larger strain (εC). Therefore, in order
to achieve a small grain size at reasonable strains, a smaller initial grain size (D2) is required,
together with a larger Z so that the grain boundary spacing and subgrain size intersect at εD in
Fig. 2.5 [42].
Fig. 2.5 Processing conditions for the formation of a stable grain structure during hot deformation [42]
When examining the grain size after large strains, in the case of deformation by rolling, a
geometric relationship is assumed to be the following:
0 exp (-ε) (2.2)
This equation tells that during rolling, the grain thickness in the normal direction (H) is related to
the strain (ε) and the initial grain size D0 (see Fig. 2.6). In Fig. 2.6 it is also seen that with increasing
strain, the percentage of the boundaries which are of high angle (HAGB%) increases (see Fig. 2.6c).
During the deformation, the mean boundary misorientation increases, the boundary properties
become more uniform, and thus the microstructure becomes progressively more stable against
discontinuous growth as strain increases.
The criteria for the suppression of discontinuous recrystallization, are the conditions of strain,
temperature and initial grain size, which result in a sufficient fraction of high angle boundary, to
ensure microstructural stability.
Exposing to the large strain deformation at ambient temperatures, when the geometric
relationship equation is taken into account, the spacing (H) of the high angle boundaries in the
normal direction (ND), of a material with initial grain size D0 decreases with strain (see Fig. 2.6a-c).

12
Fig. 2.6 Schematic diagram of the development of microstructure with increasing strain; (a) initial grain
structure, (b) moderate deformation, (c) large deformation, (d) effect of large second-phase particles on
deformation [25]
Consequently, the HAGB spacing decreases more rapidly than the subgrain size with strain, and
the fraction of high angle boundaries, increases with strain. At a sufficient large strain (εcr), the
fraction of high angle boundary becomes sufficient to make the microstructure stable against
discontinuous growth (i.e. recrystallization) [20].
According to the geometric relationship equation above, a small initial grain size (D0) will reduce
the boundary spacing (H) to the critical value at a lower strain than will a longer initial grain size.
If the initial grain size is reduced, it may be seen that the HAGB% at high strains is larger, and the
HAGB spacing (H) at a given strain, is smaller.
For the consideration of second phase particles, they will increase the rate of formation of high
angle boundaries by breaking up the planarity of the boundary structure as shown in Fig. 2.6d, and
also by creating high angle boundaries associated with the large local lattice rotations close to the
particles. Such particles therefore reduce εcr.
The transition between discontinuous and continuous recrystallization is best measured by
monitoring the changes in HAGB content on annealing. When discontinuous recrystallization
occurs, there is a relatively sharp change in the HAGB% as the deformed substructure is consumed
by the recrystallizing grains. However, when continuous recrystallization occurs, there is little
change in the HAGB%. During annealing the grains/subgrains gradually become more equiaxed
and larger [20].
A further difference is that on discontinuous recrystallization, the strong deformation texture is
generally replaced by a different texture, such as a strong cube texture. However, when

13
continuous recrystallization occurs, the rolling texture is retained with little change, because there
is little microstructural change on annealing following the deformation.
During the high deformation, subgrains are formed within grains because of high angle boundaries
in a polycrystalline metal. By increasing strain, the high angle grain boundaries get closer and,
subgrain size remains nearly constant, so they are separated by fewer subgrains and elongated.
In the end, the deformed microstructure is similar to that shown in Fig. 2.6c.
It comprises lamellar high angle boundaries aligned parallel to the rolling plane, together with
intersecting boundaries which are mainly of low angle. On annealing such a microstructure, it is
thought that the energy is lowered by localised boundary migration as shown in Fig. 2.7.
The lamellar structure will tend to collapse due to the surface tension at the node points such as
A, where the boundaries (of energy γR) aligned in the rolling plane, are pulled by the boundaries
(of energy γN) aligned in the normal direction as shown in Fig. 2.7b.
The critical condition for collapse of the structure is when the nodes A and A’ touch. This depends
on the grain length in the rolling direction (L) and the normal direction (N) and on the relative
boundary energies. The boundaries in the normal direction are usually of lower angle.
A convincing vertex simulation of this process due to Bate, is seen in Fig. 2.8, and this has been
shown to give good agreement with the annealing behavior of a highly deformed Al–3%Mg alloy.
Additional break-up of the lamellar grain microstructure and production of high angle boundaries
during the deformation by large second-phase particles (see Fig. 2.6d) will increase γN, and lower
the critical grain aspect ratio (L/N) required for continuous recrystallization.

14
Fig. 2.7 Schematic diagram showing the continuous recrystallization of a highly deformed lamellar
microstructure; (a) Initial structure, (b) collapse of the lamellar boundaries, (c) spheroidisation begins by Y-
junction migration, (d) further spheroidisation and growth [20]
When the nodes A and A’ touch, node switching (see Fig. 2.7) will occur, and two new nodes A1
and A2 will form and be pulled apart by the boundary tensions as shown in Fig. 2.7c. Further
spheroidisation and growth will occur due to boundary tensions, as shown in Fig. 2.7d, leading to a
more equiaxed grain structure. Such a fine-grained microstructure will be unstable with respect to
normal and perhaps abnormal grain growth. This fine microstructure has a large stored energy,
due to the large area of grain boundary, and during annealing they are very susceptible to grain
growth.
Fig. 2.8 Vertex simulation of continuous recrystallization of a highly deformed metal with a lamellar grain
structure. Grey levels correspond to orientation, and only high angle boundaries are delineated. The times
are indicated in arbitrary units [20]
In two phase alloys, the dispersion of second-phase particles prevents normal or abnormal grain
growth of a fine-grained microstructure. Fig. 2.9 shows the predicted influence of the pinning
particles (volume fraction of second phase particle FV divided by particle diameter) and the grain
size (D) on the stability of fine-grained structures. Fig. 2.9 explains the three types of grain growth
behaviour. If there are no or few second-phase particles, it is seen that normal grain growth is
predicted to occur during high temperature annealing. However, as FV/d increases, normal grain

15
growth will be prevented, but abnormal grain growth is increasingly likely for smaller grain sizes. In
order to maintain a very small grain structure at high temperatures, sufficient particles must be
present to prevent abnormal grain growth, and this requires FV/d > 1.5 µm-1 for 0.5 mm diameter
grains [25]. This represents very significant amounts of second-phase particles, e.g. a volume
fraction of 0.1 of 60 nm particles, which may be compared with the level of FV/d ≈ 0.1 µm-1 which
is typically required to prevent discontinuous recrystallization during conventional processing, and
is rarely achievable in conventional industrial alloys. However, interest in the superplastic
deformation of micron-grained alloys has stimulated the development of special alloys containing
sufficiently large quantities of stable intermetallic particles to maintain microstructural stability at
elevated temperatures [20].
Fig. 2.9 Regimes of normal and abnormal grain growth for particle-containing alloys [25]
2.3 Severe Plastic Deformation Techniques
Extensive efforts and widespread discussions have been recently started around the deformation
processes and refining mechanisms for developing the UFG materials. In general, the methods
based on severe plastic deformation (SPD) have attracted the growing interest of specialists in
materials science for the purpose of producing bulk solids with sub-micrometer or nanometer
grain sizes [5, 8]. This interest is conditioned not only by unique physical and mechanical
properties inherent to various nanostructured materials, but also because SPD methods overcame
a number of difficulties connected with residual porosity in compacted samples, impurities from
ball milling, processing of large scale billets and practical application of the given materials. The
16
processing of bulk nanostructured materials using SPD methods is an alternative to the existing
methods of nanopowder compacting.
It is known that heavy deformations by conventional metal-working processes can result in
significant refinement of microstructure at low temperatures. However, the structures formed are
usually substructures of a cellular type having boundaries with low-angle misorientations [8]. The
strains imposed in conventional processing are insufficient to introduce UFG structures because of
the generally low workability of metallic alloys at ambient and relatively low temperatures [7]. At
the same time, the nanostructures formed from SPD are ultra fine-grained structures of a granular
type containing mainly high-angle grain boundaries. Formation of such nanostructures could be
realized by SPD methods providing very large deformations at relatively low temperatures under
the high pressures imposed [8, 28].
The first developments and investigations of nanostructured materials processed using SPD
methods were fulfilled by Valiev and his co-workers more than 20 years ago [29]. They have
mentioned about a number of requirements which are to be taken into account for formation of
nanostructures in bulk samples and billets. These requirements are as follows. Firstly, it is essential
to obtain ultra fine-grained structures with prevailing high-angle grain boundaries since only in this
case can a qualitative change in properties of materials occur. Secondly, the formation of
nanostructures uniform within the whole volume of a sample is necessary for providing stable
properties of the processed materials. Lastly, though samples are exposed to large plastic
deformations they should not have any mechanical damage or cracks. Traditional methods of
severe plastic deformation, such as rolling, drawing or extrusion cannot meet these requirements
[8].
Furthermore, fabricating UFG materials are achieved by various SPD processing methods. These
methods are as follows: high-pressure torsion (HPT), twist extrusion (TE), multidirectional forging
(MDF), equalchannel angular pressing (ECAP), accumulative rollbonding (ABR) and cyclic extrusion
and compression (CEC), etc. However, UFG materials prepared by SPD processes also have some
drawbacks, notably the small dimensions this approach yields, which limit their practical
applications [9]. In this chapter it would be described a plastic deformation technique, asymmetric
rolling (ASR), which is suitable for producing larger structural materials. Unlike symmetric rolling,
ASR involves different circumferential velocities of the two working rolls due to their different
diameters or rotation speeds, which greatly enhance the total strain applied to the materials [9].

17
2.3.1 Asymmetric & Symmetric Rolling
Asymmetric rolling (ASR) has been utilized to investigate many metals and alloys, such as Al, FeAl
and Al alloys. These studies were carried out experimentally or theoretically with the emphasis on
texture and/or ASR technique, but only a few of these investigations have focused on the grain
refinement of the materials [9]. Using an ASR process, Cui et. al. obtained in high purity aluminium
an average grain size of ~2μm after 90% reduction [10]. In addition, the experiments that have
been achieved by Jin and Lloyd show that ASR AA5754, followed by relatively low-temperature
annealing, generates grain sizes approaching 1µm [11]. These results have agreed that in
asymmetric rolling the shear component on the surface is enhanced as much as possible [10].
Shear deformation plays a critical role in the grain refinement of materials especially to get the
equiaxed grains [30]. The evolution of the structure during asymmetric rolling was attributed to
the simultaneous action of compression and shear [10], and so high-angle boundaries develop
with increasing strain. In addition, ultra fine grains can be formed by continuous recrystallization
on annealing [11].
Asymmetric rolling is known to take place due to differences in the circumferential velocities of
working rolls caused by lubrication mismatch, different angular speeds or different roll diameters
[12] as shown in Fig. 2.10.
The research that was done for symmetrically and asymmetrically rolled pure aluminium blocks,
respectively to final reduction of 10%, 20%, up to 90% in one pass or 10% reduction per pass and
this work was done with three mismatch ratios, 1.27, 1.5, and 2.1. After rolling, the figure below
was obtained by using a steel pen to scratch perpendicular lines on the side face of the block.
Fig. 2.10 Schematic drawings of asymmetric rolling due to (a) non-unity roll radius ratio, (b) non-unity roll
speed ratio, and (c) single roll drive rolling [12]
18
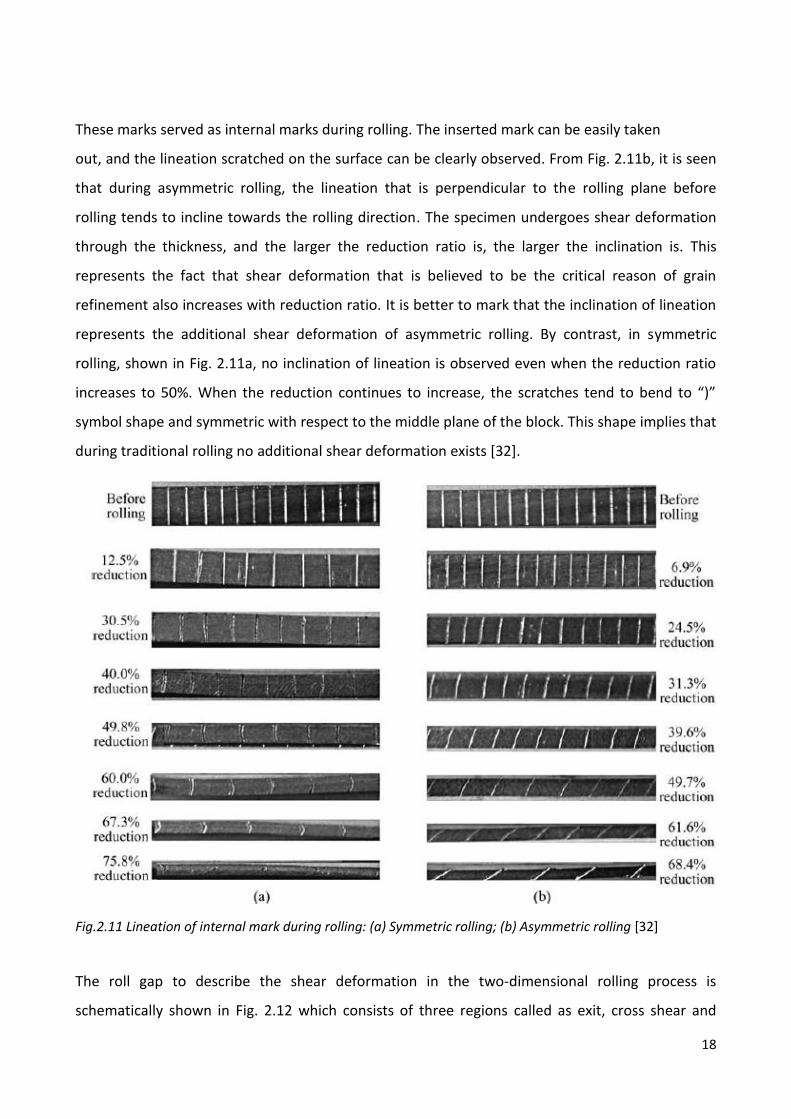
These marks served as internal marks during rolling. The inserted mark can be easily taken
out, and the lineation scratched on the surface can be clearly observed. From Fig. 2.11b, it is seen
that during asymmetric rolling, the lineation that is perpendicular to the rolling plane before
rolling tends to incline towards the rolling direction. The specimen undergoes shear deformation
through the thickness, and the larger the reduction ratio is, the larger the inclination is. This
represents the fact that shear deformation that is believed to be the critical reason of grain
refinement also increases with reduction ratio. It is better to mark that the inclination of lineation
represents the additional shear deformation of asymmetric rolling. By contrast, in symmetric
rolling, shown in Fig. 2.11a, no inclination of lineation is observed even when the reduction ratio
increases to 50%. When the reduction continues to increase, the scratches tend to bend to “)”
symbol shape and symmetric with respect to the middle plane of the block. This shape implies that
during traditional rolling no additional shear deformation exists [32].
Fig.2.11 Lineation of internal mark during rolling: (a) Symmetric rolling; (b) Asymmetric rolling [32]
The roll gap to describe the shear deformation in the two-dimensional rolling process is
schematically shown in Fig. 2.12 which consists of three regions called as exit, cross shear and

19
entrance region. It may be noted that frictional forces along the upper and lower surfaces of the
plate reverse in direction at different locations indicated as ‘neutral points,’ largely due to the
different velocities of the two rollers [33].
For symmetric rolling, the normal stress starts to increase from the entrance of roll gap and
reaches the peak at the neutral point. The sign of friction stress changes at the neutral point
because the speed of sheet is slower than the circumferential velocity of roll between the
entrance and neutral point and faster than that of roll between the neutral point and exit. On the
other hand, in case of rolling with lubricated rolls, its extension by the friction can be neglected.
For asymmetric rolling, the neutral point of the upper roll moves to the exit, while that of the
lower roll moves to the entrance in according to the distribution of shear stress. The region
between the neutral point of upper roll and that of lower roll is called the cross shear region. The
material is deformed by unidirectional shear in the cross shear region that develops through the
thickness, which in turn gives rise to uniform shear deformation through the thickness [12].
Fig.2.12 Scheme of the roll gap in the two-dimensional rolling process and the coordinate system, y-z, is
fixed in space such that its origin always lies in the exit plane of the roll gap [33]
The enhanced deformation is ascribed to additional shear stress in the ASR process, which was
confirmed by calculating the equivalent strain in the ASR process. The equivalent strain ε in ASR is
given by [9, 31]:
(2.3)
=
1/2 (2.4)
where θ is the shear angle at a given position of the element perpendicular to the surface of the
billet before rolling, and r is the reduction ratio of the rolling processing and given by:

20
(2.5)
where t0 and t1 are the thicknesses of the sample before and after rolling, respectively [31].
21
CHAPTER 3
Experimental Equipments
3.1 Heat-Flux Differential Scanning Calorimetry
The working principle of DSC is relied on the heat flow difference between the sample and the
standard reference during a controlled heating and/or cooling cycle. By observing the difference in
heat flow between the sample and the reference, DSC is able to measure the amount of heat
absorbed or released during a thermally activated phenomena. The reference and the specimens
are placed in an inert atmosphere (N2 or Ar).
The structure of a heat-flux DSC system is shown in Fig. 3.1. The main assembly of the DSC cell is
enclosed in a cylindrical, silver heating block, which dissipates heat to the specimens via a
constantan disc which is attached to the silver block. The disc has two raised platforms on which
the sample and reference pans are placed. A chromel disc and connecting wire are attached to the
underside of each platform, and the resulting chromel-constantan thermocouples are used to
determine the differential temperatures of interest. Alumel wires attached to the chromel discs
provide the chromel-alumel junctions for independently measuring the sample and reference
temperature.
A second series of thermocouples measures the temperature of the furnace and of the heat-
sensitive plate. During a phase change heat is absorbed or emitted by the sample, altering the
heat flux through the heat-sensitive plate. The variation in heat flux causes an incremental
temperature difference to be measured between the heat-sensitive plate and the furnace. The
heat capacity of the heat-sensitive plate as a function of temperature is measured by adiabatic
calorimetry during the manufacturing process, allowing an estimate of the enthalpy of transition
to be made from the incremental temperature fluctuation [13].

22
Fig. 3.1 Schematic diagram of heat-flux DSC apparatus [13]
The result of a DSC experiment is a curve of heat flux versus temperature. An exothermic reaction
in the sample shown with a positive peak that the sample temperature is higher than the
reference’s one. An endothermic process will produce a negative peak, the decrease of the sample
temperature, so that the reference’s temperature will be higher.
3.2 Vickers Hardness Test
In general, hardness usually implies a resistance to deformation, and for metals the property is a
measure of their resistance to permanent or plastic deformation. Hardness is most likely to mean
the resistance to identation, and to the design engineer it often means an easily measured and
specified quantity which indicates something about the strength and heat treatment of the metal.
There are three general types of hardness measurements depending on the manner in which the
test is conducted. These are scratch hardness, identation hardness, and rebound, or dynamic
hardness. Only identation hardness is of major engineering interest for metals.
In this thesis, Vickers hardness test is considered which uses a square-base diamond pyramid as
the indenter. The included angle between opposite faces of the pyramid is 136˚. This angle was
chosen because it approximates the most desirable ratio of identation diameter to ball diameter in
the Brinell hardness test. Because of the shape of the indenter, this is frequently called the
diamond-pyramid hardness test. The diamond-pyramid hardness number (DPH), or Vickers
23
hardness number (VHN, or VPN), is defined as the load divided by the surface area of the
identation. In practise, this area is calculated from microscopic measurements of the lengths of
the diagonals of the impression. The DPH may be determined from the following equation
(3.1)
Where P = applied load, kg
L= average length of diagonals,mm
Θ = angle between opposite faces of diamond = 136˚
The Vickers hardness test has received fairly wide acceptance for research work because it
provides a continuous scale of hardness, for a given load, from very soft metals with a DPH of 5 to
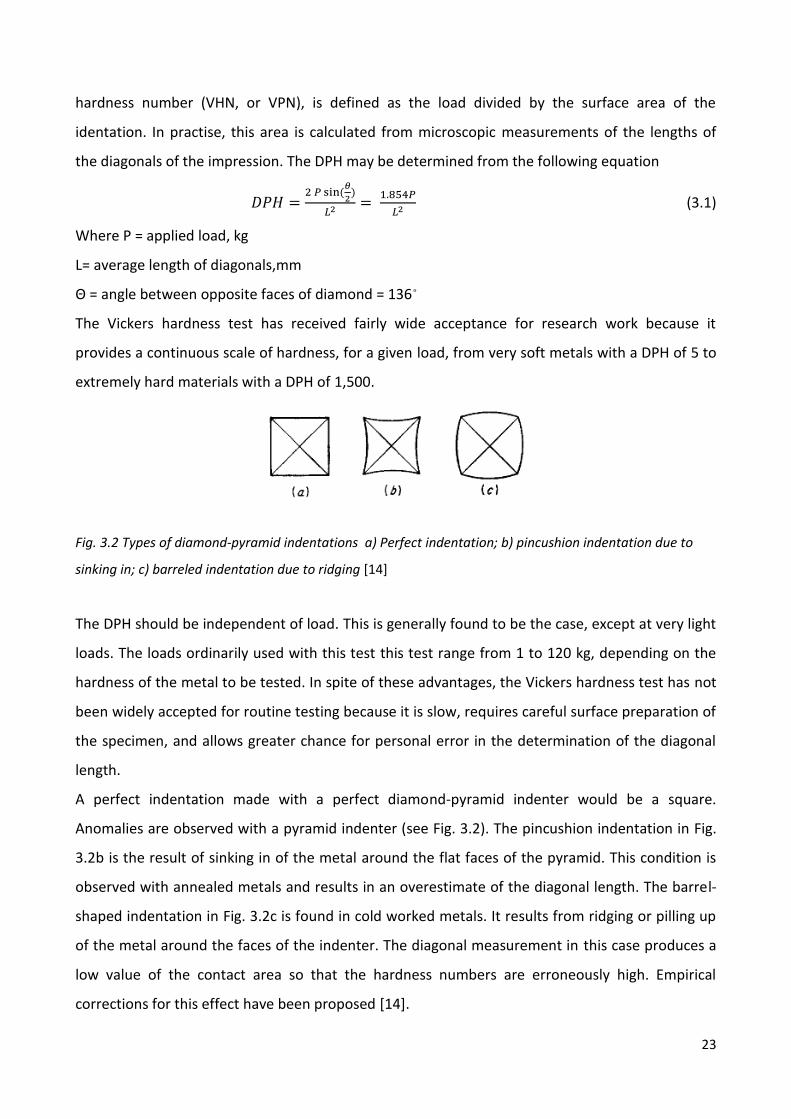
extremely hard materials with a DPH of 1,500.
Fig. 3.2 Types of diamond-pyramid indentations a) Perfect indentation; b) pincushion indentation due to
sinking in; c) barreled indentation due to ridging [14]
The DPH should be independent of load. This is generally found to be the case, except at very light
loads. The loads ordinarily used with this test this test range from 1 to 120 kg, depending on the
hardness of the metal to be tested. In spite of these advantages, the Vickers hardness test has not
been widely accepted for routine testing because it is slow, requires careful surface preparation of
the specimen, and allows greater chance for personal error in the determination of the diagonal
length.
A perfect indentation made with a perfect diamond-pyramid indenter would be a square.
Anomalies are observed with a pyramid indenter (see Fig. 3.2). The pincushion indentation in Fig.
3.2b is the result of sinking in of the metal around the flat faces of the pyramid. This condition is
observed with annealed metals and results in an overestimate of the diagonal length. The barrel-
shaped indentation in Fig. 3.2c is found in cold worked metals. It results from ridging or pilling up
of the metal around the faces of the indenter. The diagonal measurement in this case produces a
low value of the contact area so that the hardness numbers are erroneously high. Empirical
corrections for this effect have been proposed [14].
24
CHAPTER 4
Experimental Procedures
In this chapter the description of the materials, preparation of the specimen and the experimental
procedures are explained. Then the mechanical properties and the evolution of the structure are
investigated in the aim of obtaining an ultra fine grain structure.
Firstly, 6082 aluminium alloy is used for the preparation of the specimens then some of these
specimens are subjected to asymmetric and conventional rolling to accomplish the severe plastic
deformation, after solution treatment. Besides, the remaining specimens are first solution treated
then subjected to the heat treatment of aging. In the final part, the mechanical properties and
microstructure evolution of these specimens are observed through Vickers hardness test and
differential scanning calorimety.
4.1 Starting Material
In this research 6082 aluminium alloy, which comes from the commercial 6xxx aluminium series, is
taken into account to investigate. The 6xxx-group contains magnesium and silicon as major
addition elements (Al-Mg-Si alloy heat-treatable alloy). A heat treatable alloy means that it is
possible to produce a significant additional strengthening by subjecting the 6082 alloy to an
elevated thermal treatment, quenching, and precipitation heat-treatment. Aluminium alloy
6082 is a medium strength alloy with excellent corrosion resistance, and it is known as a structural
alloy [15, 16, 17]. The composition of the 6082 alloy is given in Table 4.1.
The material has been supplied in the form of an extruded bar with a width, thickness and length
of 40, 20, 100 mm respectively.
Bars have been solution treated at 520 ˚C for 2 hours then water quenched.
Mg Si Mn Fe Cu Cr Ti Al
1,193 1,019 0,650 0,267 0,005 0,010 0,015 balance
Table 4.1 The chemical (mass %) composition of the 6082 alloy investigated
A supersaturated solid solution of α-Al is formed with small amounts of second-phase particles to
be processed by severe plastic deformation (SPD) of asymmetric rolling.

25
After the bars have been solution treated and water quenched some of these bars were separated
to perform the heat treatment of precipitation hardening without performing the SPD.
4.2 Rolling Process
Fig. 4.1 The rolling mill
The asymmetric rolling is a non conventional process which can impart asymmetry to the material.
The asymmetry ratio defines the amount of asymmetry, and it is the ratio between the rotational
speed of upper and lower rolls (see cap 2.3.1).
The bars were now ready to perform the SPD of asymmetric rolling. The rolling mill that was used
in this experiment is shown in Fig. 4.1. The rolls can run independently due to the different
controlled motors with a total power of 3kW. This enables to set the asymmetry ratio, and the
steel rolls have a surface hardness of about 65 HRC and the diameter is 135 mm.
The very first experimental activity was aimed of measuring the actual shear strain experienced by
the asymmetrically rolled samples with the asymmetry ratio (R) values of 1.4 and 1 (known as
conventional rolling). For this purpose, reference vertical marks have been produced on the
sample sides of the 6082 alloy before rolling.

26
Fig. 4.2 View of the scratched lines produced by asymmetric rolling (reduction of thickness 20%, asymmetry
ratio R=1.4)
It is shown that the lateral surface has been scratched twice, one before rolling that has been
scratched vertical along normal direction and one after rolling perpendicular to the billet surface.
From Fig. 4.2 it is apparent that during asymmetric rolling the scratched lines that are
perpendicular to rolling direction before rolling tend to incline towards the rolling direction.
Then the effective shear strain has been calculated due to the angle (θ) between the scratched
lines before and after rolling for every position. The mean θ value was calculated later.
Fig. 4.3 Scheme of dimensions used for the calculation of equivalent strain
The set of dimensions that have been used to calculate the effective shear strain are shown in Fig.
4.3.
(θ) was measured by an image analysis method and the effective shear strain has been calculated
for every (θ) through the equation below:
(4.1)
ε, for conventional rolling as follows:
(4.2)
, which accounts for the shear action imposed by asymmetric rolling, is
(4.3)
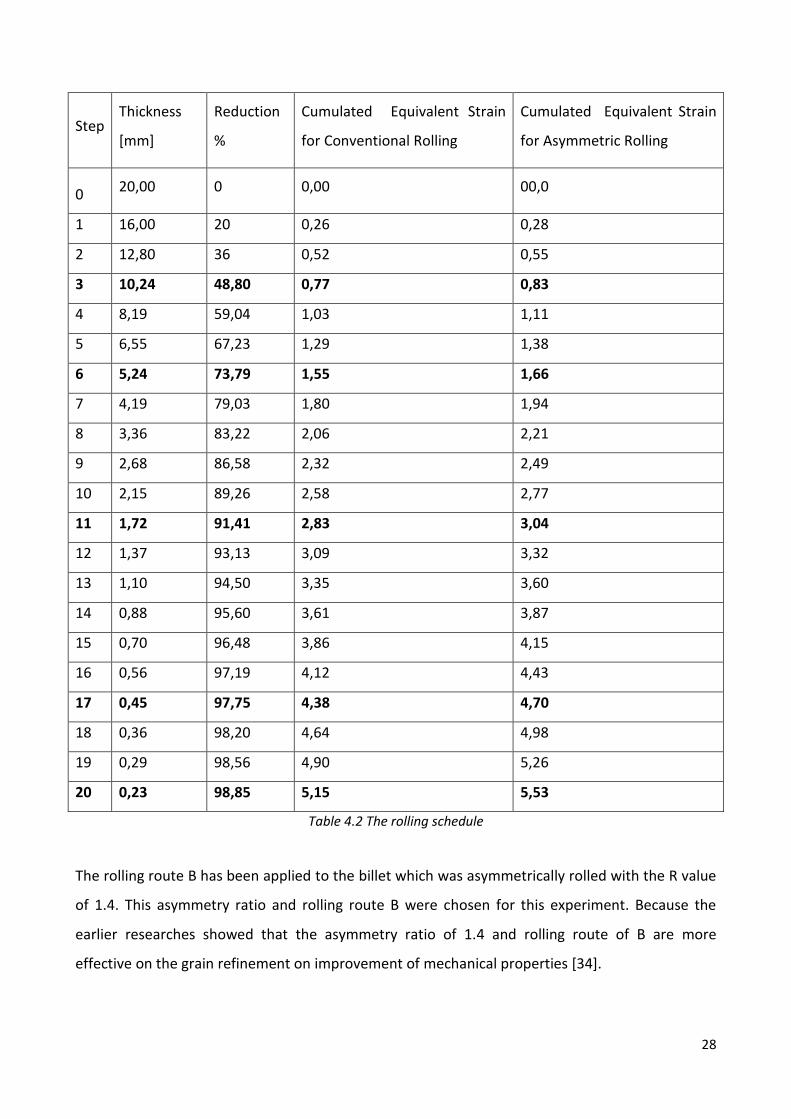
Later by collecting all the data, a specific schedule for rolling which is a SPD at room temperature
has been designed as shown in Table 4.2. The schedule has showed a total reduction of thickness
27
of 98.85% through 20 steps without any intermediate heat treatment. The initial billet thickness
was 20 mm. The cumulated equivalent strain resulted as 515.3%.
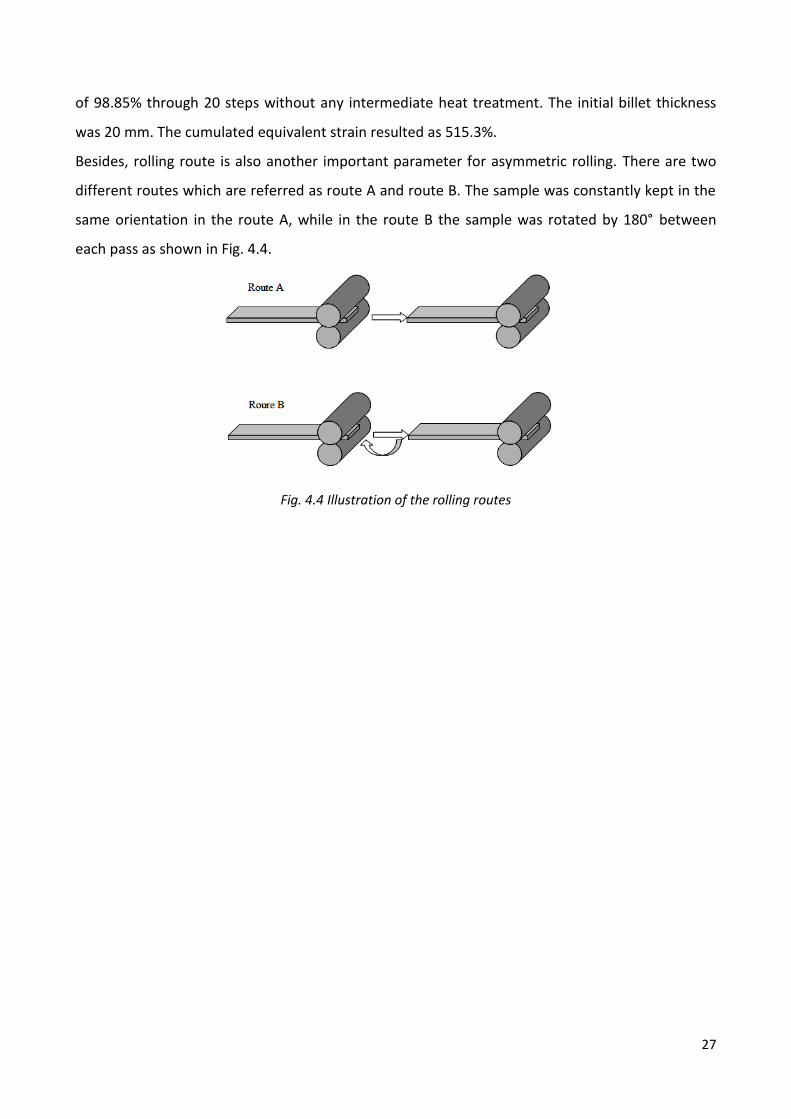
Besides, rolling route is also another important parameter for asymmetric rolling. There are two
different routes which are referred as route A and route B. The sample was constantly kept in the
same orientation in the route A, while in the route B the sample was rotated by 180° between
each pass as shown in Fig. 4.4.
Fig. 4.4 Illustration of the rolling routes
28
Step Thickness
[mm]
Reduction
%
Cumulated Equivalent Strain
for Conventional Rolling
Cumulated Equivalent Strain
for Asymmetric Rolling
0 20,00 0 0,00 00,0
1 16,00 20 0,26 0,28
2 12,80 36 0,52 0,55
3 10,24 48,80 0,77 0,83
4 8,19 59,04 1,03 1,11
5 6,55 67,23 1,29 1,38
6 5,24 73,79 1,55 1,66
7 4,19 79,03 1,80 1,94
8 3,36 83,22 2,06 2,21
9 2,68 86,58 2,32 2,49
10 2,15 89,26 2,58 2,77
11 1,72 91,41 2,83 3,04
12 1,37 93,13 3,09 3,32
13 1,10 94,50 3,35 3,60
14 0,88 95,60 3,61 3,87
15 0,70 96,48 3,86 4,15
16 0,56 97,19 4,12 4,43
17 0,45 97,75 4,38 4,70
18 0,36 98,20 4,64 4,98
19 0,29 98,56 4,90 5,26
20 0,23 98,85 5,15 5,53
Table 4.2 The rolling schedule
The rolling route B has been applied to the billet which was asymmetrically rolled with the R value
of 1.4. This asymmetry ratio and rolling route B were chosen for this experiment. Because the
earlier researches showed that the asymmetry ratio of 1.4 and rolling route of B are more
effective on the grain refinement on improvement of mechanical properties [34].
29
To summarize first bars have been solution treated at 520 ˚C for 2 hours and water quenched.
Then the rolling process has been performed on the bars at room temperature and during the SPD
no intermediate heat annealing has been performed.
The evolution of microstructure has been firstly characterized by microscopy technique. Optical
microscopy has been exploited. This technique requires an adequate surface preparation before
the observation. In particular, it is important to grind and polish the material surface to reduce the
surface roughness until a mirror-like surface is assumed.
The last step of preparation consists of etching the surface. For Al-Mg-Si aluminium alloys, the
conventional etching solution is Barker, which is composed by 2% HBFO4 and pure water. Etching
process has been conducted for 90 seconds on cross section (RD x ND) of the billet, with an
applied voltage of 5 V.
After etching, samples have been cleaned in a solution of pure alcohol. Samples were ready for
observations in a conventional optical microscope, with polarized light. The optical microscopy
can highlight the evolution of grains with respect to process parameters, such as equivalent strain.
The main drawback of this technique is the limited magnification, which hinders the assessment of
microstructure evolution especially at high level of strain.
4.3 Aging Behaviour
The thermal stability of the ultra fine grained material has been examined by using differential
scanning calorimetry (DSC). The thermal stability means the resistance to the microstructural
changes due to the temperature variations. By DSC analyses the variations in precipitation kinetics
and temperature and recrystallization kinetics have been observed.
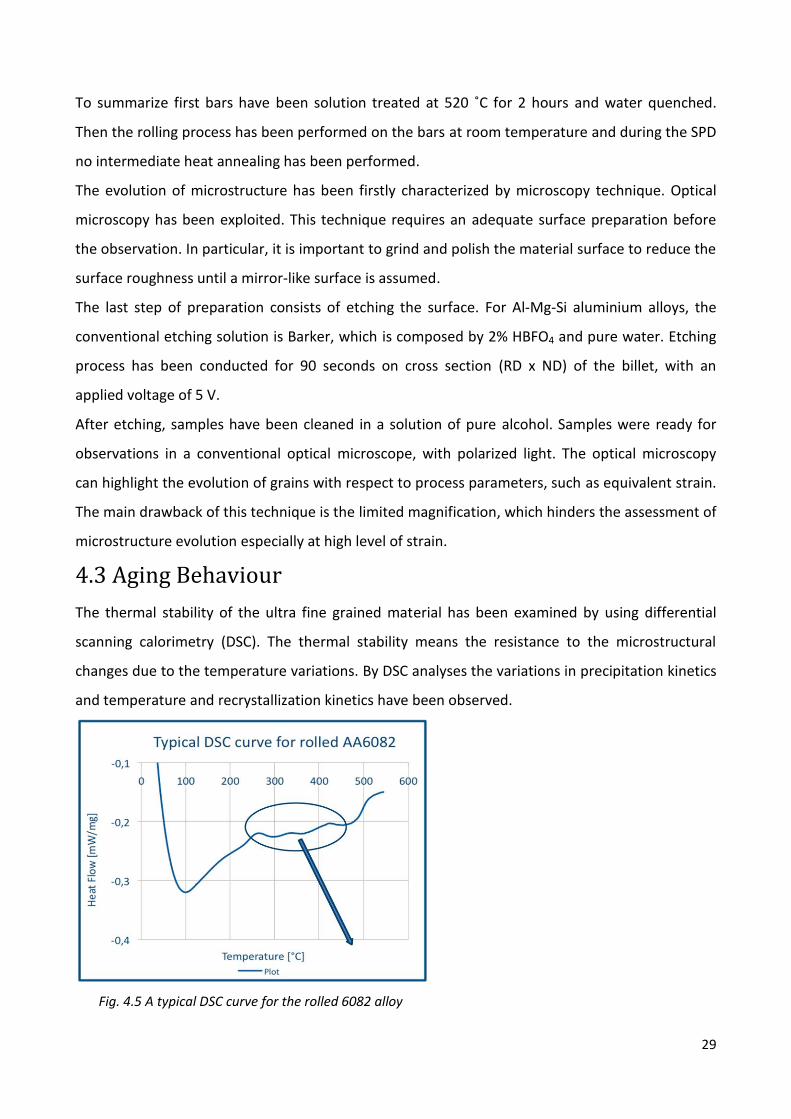
Fig. 4.5 A typical DSC curve for the rolled 6082 alloy

30
Fig. 4.6 The peak analysis of a typical DSC curve for the rolled 6082 alloy
The general peak profile for the 6082 aluminium alloy is illustrated in Fig. 4.5 and Fig. 4.6, and as
it can be seen there are many peaks to have to be determined. In the plot, the positive peaks
within the circle (see Fig. 4.5) are shown in details in Fig. 4.6 which are related to the precipitation
of transition phases (around 250˚C) and solution of β phase (around 500˚C).
The accepted precipitation sequence for the 6082 alloy starting from a supersaturated solid
solution is separate clusters of Si and Mg atoms, co-clusters containing Mg and Si atoms, spherical
GP zones, needle-like metastable β” phase, rod-like metastable β’ phase, Si precipitates, and
platelets of equilibrium β phase. In correspondence in Fig. 4.6 the first exothermic peak shows
the precipitation of β”/ β’, the second exothermic peak is related to the recrystallization and the
last one depends on the solution of β” and β’. Among these, the β” precipitates are considered to
give the main contribution to strength [35].
The experiments have been conducted on a sample with a mass inferior to 100 mg. The heating
rate has been fixed to 20 K/min, up to a temperature of 550 °C. At this temperature, it is assumed
that all the second phase particles are dissolved in solid solution again. A plateau of 60 seconds at
this temperature enables the complete solution treatment before cooling. The effects associated
to transformation reactions were isolated by subtracting a baseline recorded form high-purity Al
runs.
From the results of DSC measurements, the aging behavior of an asymmetrically rolled material as
a function of the strain has been considered in terms of kinetics of second phase particle
precipitation and possible recrystallization. Samples indicated in Table 4.2 have been taken
31
and kept at low temperature before measuring in order to prevent room temperature aging to
occur.
The samples after the SPD process and those put apart that had not been rolled, then have been
subjected to the artificial aging at the two temperatures of 130 and 180 ˚C for 8 time steps, then
water quenched.
Microstructural stability of ultra-fine grained materials prepared by SPD is an important issue.
Grain boundaries in ultrafine grained (UFG) materials processed by SPD are often called non-
equilibrium grain boundaries. Such boundaries are characterized by excess grain boundary energy.
The grain boundary structure is sensitive to elevated temperature and the grain coarsening of UFG
structures generally occurs. Changes in grain size and formation of bimodal structures, as well as
changes of amount of low angle boundary (LAB) and the high angle boundaries (HAB) were
reported. Evolution of bimodal structure results in changes of mechanical properties like tensile
characteristics, microhardness properties. Susceptibility to temperature activated processes
leading to grain coarsening (normal or abnormal) depends on the level of strain introduced during
SPD process [36, 37].
Due to the facts as mentioned above the microhardness test has been carried out on the samples
that has been processed by post-deformation annealing at temperatures of 130 and 180˚C with a
specific microhardness indenter (see Fig. 4.7) to understand the evolution of mechanical
properties. Before the microhardness test the specimen preparation has been performed in order
to eliminate the surface roughness and make a flat surface.
The material has been subjected to a load of 100 gf for an application time of 15 seconds,
according to ASTM Specification E384. The load has been maintained constant for all the tests, and
the length of diagonals of the indentation has been measured with the optical microscope
mounted on the machine.
Microhardness data have been plotted as a function of 8 time steps for the two different
temperatures of 130˚C and 180˚C (Aging curves). With this plot it has been possible to identify the
peak hardness time, at which the material has the highest hardness value.

32
Fig. 4.7 Vickers-Hardness Measuring Equipment
33
CHAPTER 5
Results and Discussion
In this final chapter the results obtained from the experimental part have been illustrated. First
the optical micrographs of asymmetrically rolled samples for the selected steps have been shown,
and then DSC analysis has been presented to investigate the precipitation kinectics and
recrystallization phenomena according to the equivalent strain imparted. In the final part the
hardness test has been accomplished to examine the mechanical evolution of the post-SPD
annealed samples.
5.1 Optical Micrographs
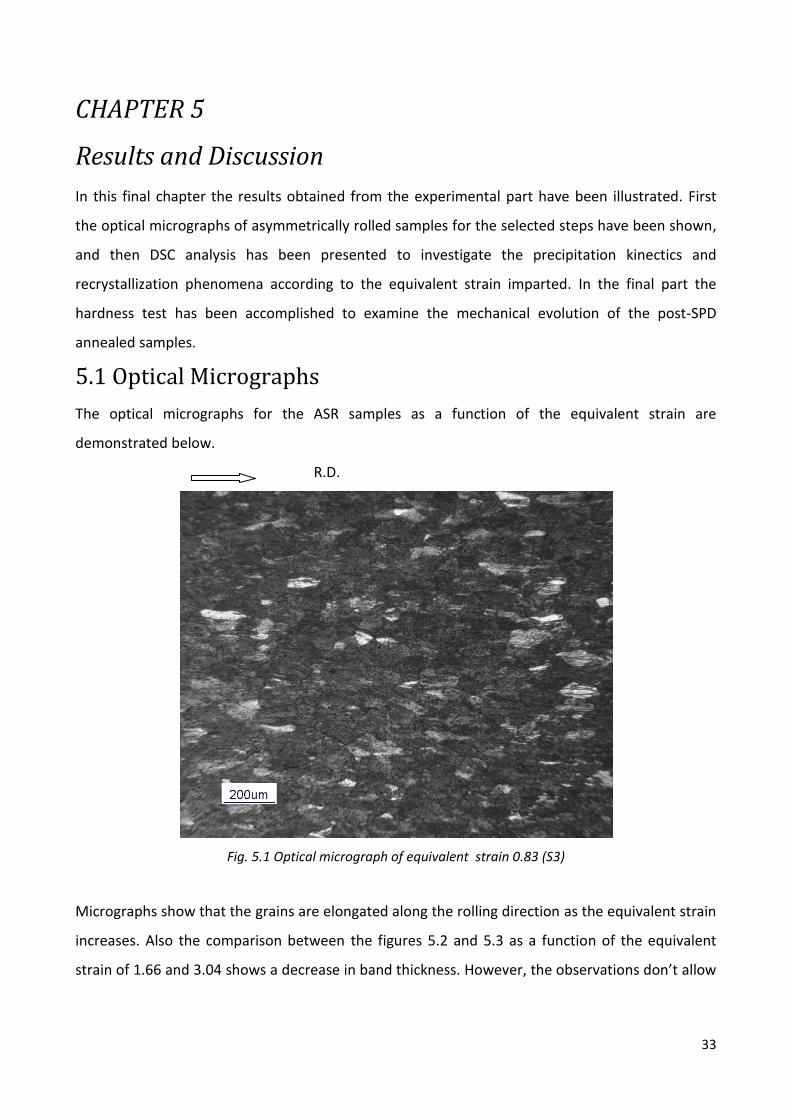
The optical micrographs for the ASR samples as a function of the equivalent strain are
demonstrated below.
R.D.
Fig. 5.1 Optical micrograph of equivalent strain 0.83 (S3)
Micrographs show that the grains are elongated along the rolling direction as the equivalent strain
increases. Also the comparison between the figures 5.2 and 5.3 as a function of the equivalent
strain of 1.66 and 3.04 shows a decrease in band thickness. However, the observations don’t allow

34
to draw further conclusions because of the low magnification and resolution of the optical
microscope [43].
Fig. 5.2 Optical micrograph of equivalent strain 1.66 (S6)
Fig. 5.3 Optical micrograph of equivalent strain 3.04 (S11)

35
Fig. 5.4 Optical micrograph of equivalent strain 4.70 (S17)
Fig. 5.5 Optical micrograph of equivalent strain 5.53 (S20)

36
5.2 DSC Analyses
Later, the influence of SPD on precipitation kinetics is investigated by DSC analyses. Material has
been asymmetrically and conventionally rolled according to schedule in Table 4.2, and
incorrespondence of steps 3, 6, 11, 17 and 20, samples have been extracted and named as S3, S6,
S11, S17 and S20. Results are shown below.
In the first set of graphs (see Fig. 5.6, Fig. 5.7, Fig 5.8, Fig. 5.9, Fig. 5.10), the normalized heat
flow/mg versus temperature for the each rolling step as mentioned above is shown. The curves
are arbitrarly shifted along y-axis to avoid superposition.
The curve of the unprocessed solution treated alloy shows a broad exothermic peak (upward
peak) in the plots at about 305°C, and often it is interpreted as two partially superimposed sub-
peaks, corresponds to the formation of β”and β’ metastable precipitates at about 270°C and
330°C, respectively [38]. A dissolution endothermic trough (downward peak in the plot) of the
above phases follows at about 400°C, while the second marked exothermic peak at about 460°C
and the corresponding endothermic trough at 520°C are related to the formation and dissolution
of the equilibrium β -Mg2Si [35].
Fig. 5.6 DSC curves of S3 ASR & Conv ( equivalent strain of 0.83 for ASR and 0,77 for Conv. )
37
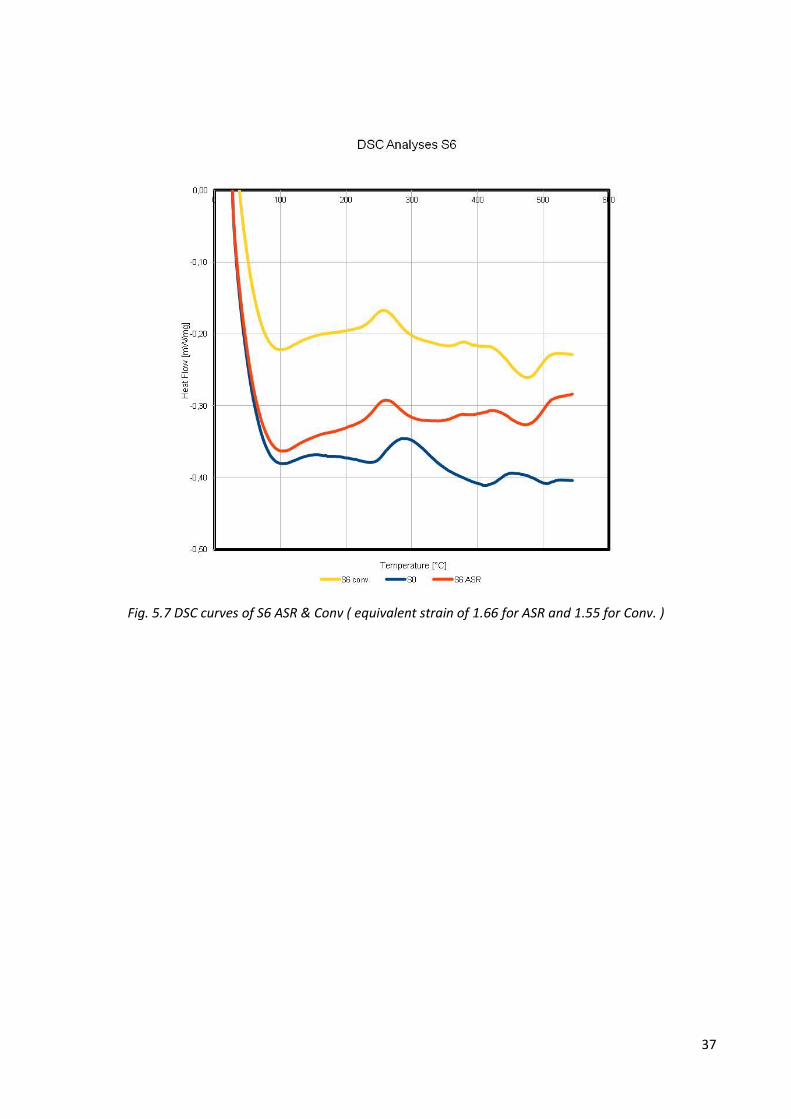
Fig. 5.7 DSC curves of S6 ASR & Conv ( equivalent strain of 1.66 for ASR and 1.55 for Conv. )
38
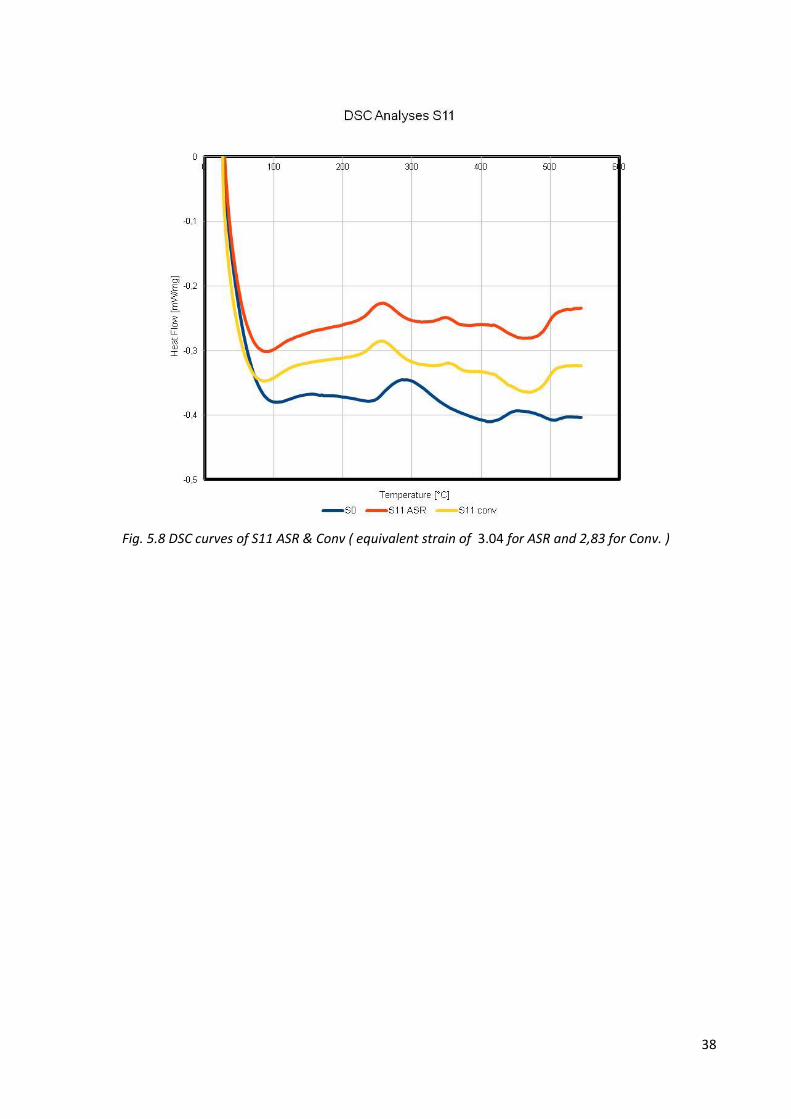
Fig. 5.8 DSC curves of S11 ASR & Conv ( equivalent strain of 3.04 for ASR and 2,83 for Conv. )

39
Fig. 5.9 DSC curves of S17 ASR & Conv ( equivalent strain of 4.70 for ASR and 4,38 for Conv. )

40
-
Fig. 5.10 DSC curves of S20 ASR & Conv ( equivalent strain of 5.53 for ASR and 5,15 for Conv. )
The asymmetrically and conventionally rolled samples display a marked difference from the
unprocessed solution treated alloy as it can be seen from the plots for the each rolling step. Firstly,
the broad peak as mentioned above related to the formation of β’’ and β’ phases now appears as a
more narrow peak centered at around 250 . The formation of the stable β precipitates in the
severely deformed alloy revealed to be markedly anticipated (around 410–420°C) and it shows a
reduced intensity with respect to the unprocessed solution treated alloy. Furthermore, a new peak
appears after the rolling steps of 6 for both asymmetric and conventional rolling at around 370˚C.
Later this new peak is shifting to lower temperatures as the equivalent strain increases. After the
rolling steps of 11 it appears at around 350˚C. Although, the determination of this peak needs
further TEM analysis, from the literature it was supposed that this unexpected hump detected in
the most strain-hardened samples could be related to recrystallization phenomena that became
more evident and developed at decreasing temperatures as the equivalent strain increased [35].
41
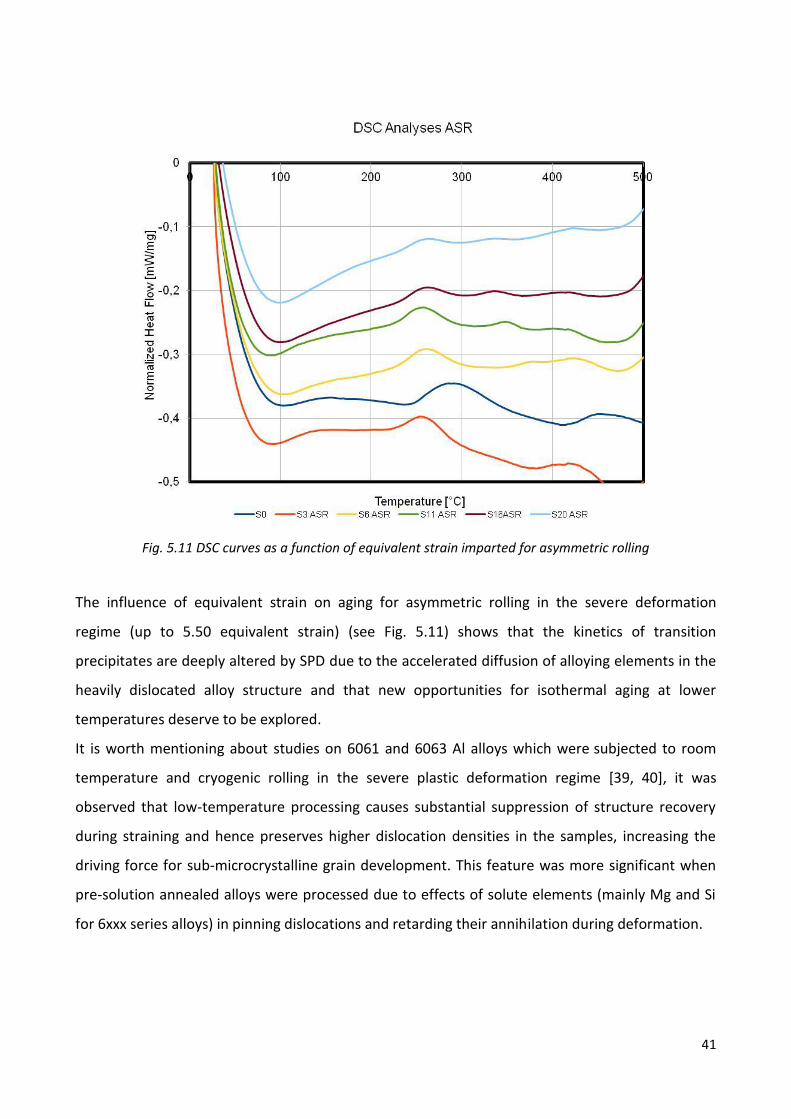
Fig. 5.11 DSC curves as a function of equivalent strain imparted for asymmetric rolling
The influence of equivalent strain on aging for asymmetric rolling in the severe deformation
regime (up to 5.50 equivalent strain) (see Fig. 5.11) shows that the kinetics of transition
precipitates are deeply altered by SPD due to the accelerated diffusion of alloying elements in the
heavily dislocated alloy structure and that new opportunities for isothermal aging at lower
temperatures deserve to be explored.
It is worth mentioning about studies on 6061 and 6063 Al alloys which were subjected to room
temperature and cryogenic rolling in the severe plastic deformation regime [39, 40], it was
observed that low-temperature processing causes substantial suppression of structure recovery
during straining and hence preserves higher dislocation densities in the samples, increasing the
driving force for sub-microcrystalline grain development. This feature was more significant when
pre-solution annealed alloys were processed due to effects of solute elements (mainly Mg and Si
for 6xxx series alloys) in pinning dislocations and retarding their annihilation during deformation.

42
Fig. 5.12 DSC curves as a function of equivalent strain imparted for conventional rolling
Finally, the effect of equivalent strain on aging for conventional rolling is illustrated in Fig. 5.12. The
precipitation kinetics is altered also in conventional rolling as it can bee seen from the plot. As the
equivalent strain increases the precipitation temperature decreases. Also the peak for recrystallization as
mentioned above appears in conventional rolling as the equivalent strain increases but the temperatures
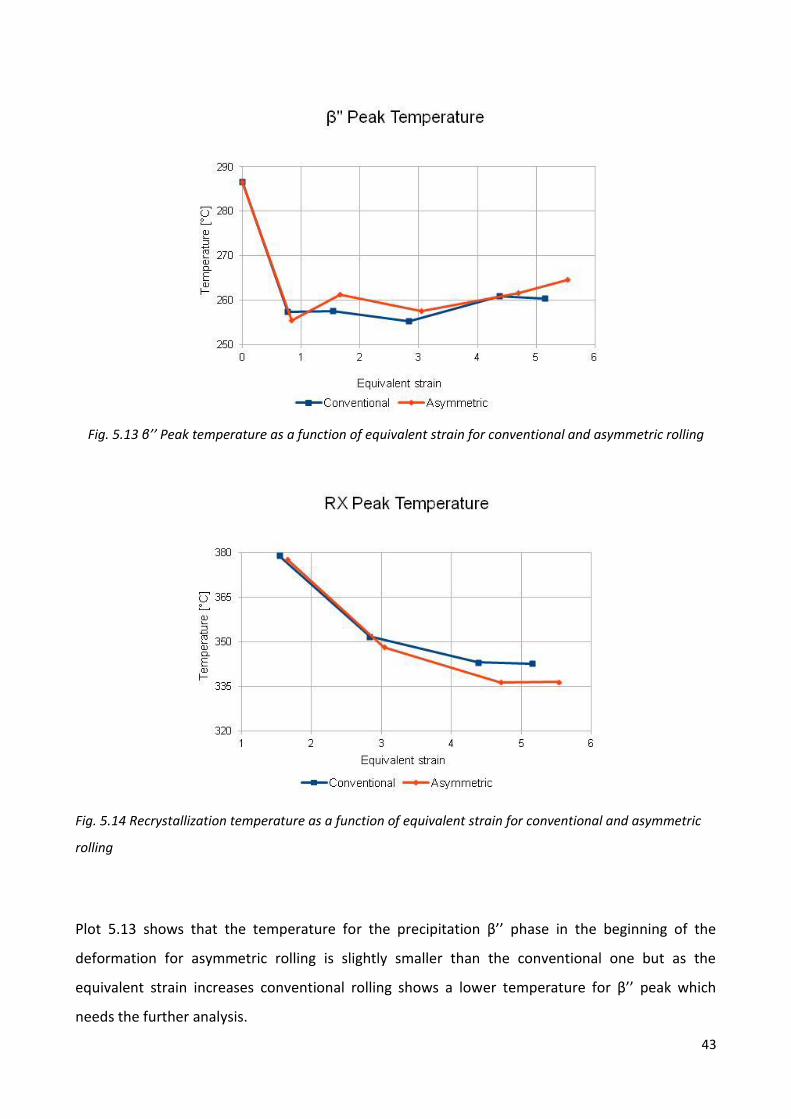
for recrystallization in conventional rolling are slightly higher than the asymmetric rolling (see Fig. 5.14).
43
Fig. 5.13 β’’ Peak temperature as a function of equivalent strain for conventional and asymmetric rolling
Fig. 5.14 Recrystallization temperature as a function of equivalent strain for conventional and asymmetric
rolling
Plot 5.13 shows that the temperature for the precipitation β’’ phase in the beginning of the
deformation for asymmetric rolling is slightly smaller than the conventional one but as the
equivalent strain increases conventional rolling shows a lower temperature for β’’ peak which
needs the further analysis.
44
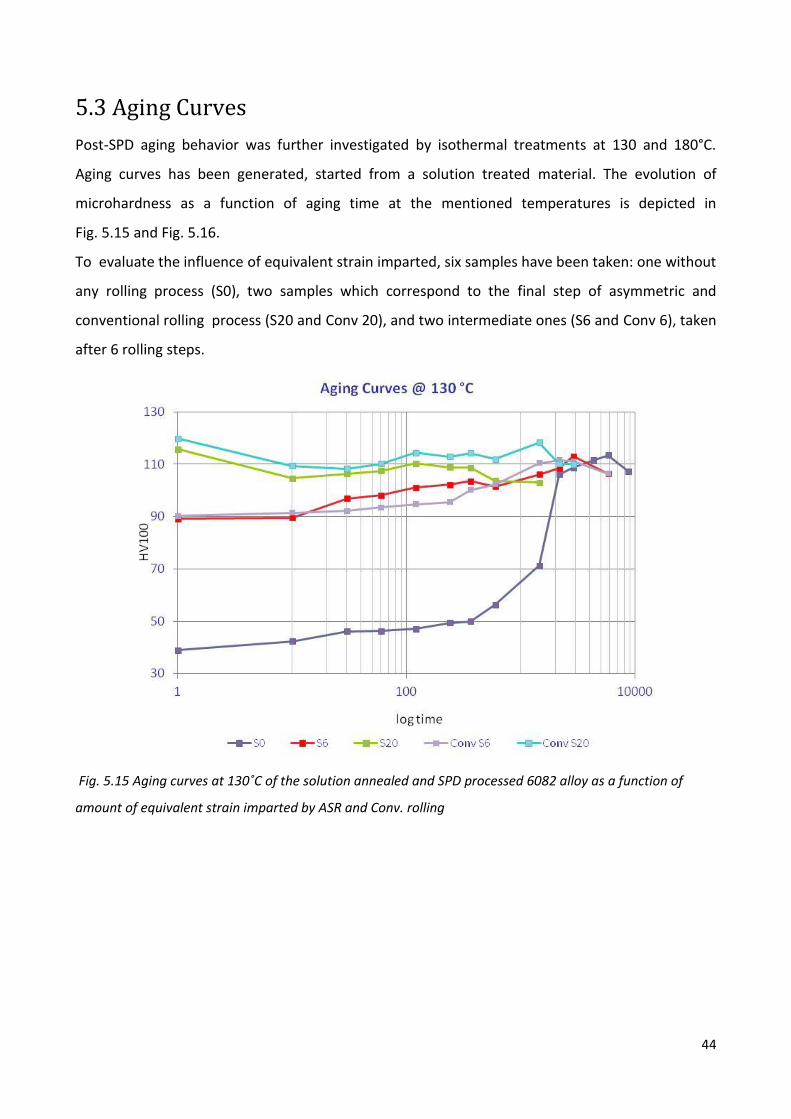
5.3 Aging Curves
Post-SPD aging behavior was further investigated by isothermal treatments at 130 and 180°C.
Aging curves has been generated, started from a solution treated material. The evolution of
microhardness as a function of aging time at the mentioned temperatures is depicted in
Fig. 5.15 and Fig. 5.16.
To evaluate the influence of equivalent strain imparted, six samples have been taken: one without
any rolling process (S0), two samples which correspond to the final step of asymmetric and
conventional rolling process (S20 and Conv 20), and two intermediate ones (S6 and Conv 6), taken
after 6 rolling steps.
Fig. 5.15 Aging curves at 130 C of the solution annealed and SPD processed 6082 alloy as a function of
amount of equivalent strain imparted by ASR and Conv. rolling
45
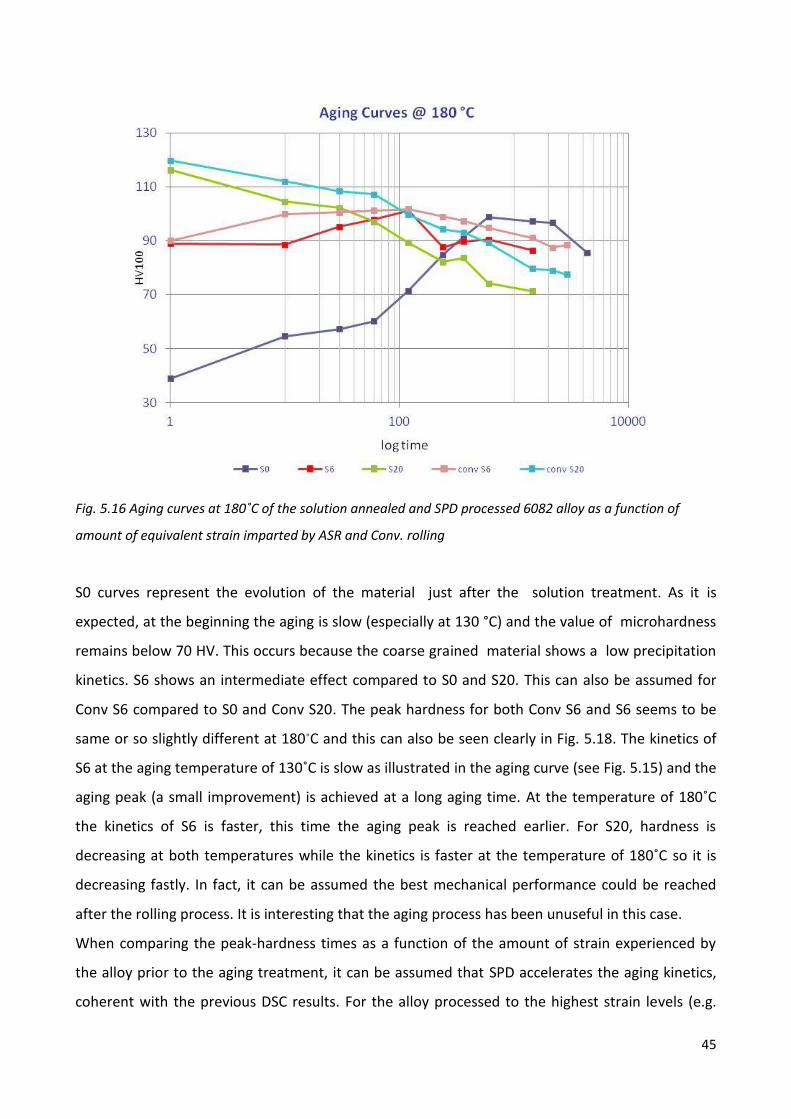
Fig. 5.16 Aging curves at 180 C of the solution annealed and SPD processed 6082 alloy as a function of
amount of equivalent strain imparted by ASR and Conv. rolling
S0 curves represent the evolution of the material just after the solution treatment. As it is
expected, at the beginning the aging is slow (especially at 130 °C) and the value of microhardness
remains below 70 HV. This occurs because the coarse grained material shows a low precipitation
kinetics. S6 shows an intermediate effect compared to S0 and S20. This can also be assumed for
Conv S6 compared to S0 and Conv S20. The peak hardness for both Conv S6 and S6 seems to be
same or so slightly different at 180˚C and this can also be seen clearly in Fig. 5.18. The kinetics of
S6 at the aging temperature of 130˚C is slow as illustrated in the aging curve (see Fig. 5.15) and the
aging peak (a small improvement) is achieved at a long aging time. At the temperature of 180˚C
the kinetics of S6 is faster, this time the aging peak is reached earlier. For S20, hardness is
decreasing at both temperatures while the kinetics is faster at the temperature of 180˚C so it is
decreasing fastly. In fact, it can be assumed the best mechanical performance could be reached
after the rolling process. It is interesting that the aging process has been unuseful in this case.
When comparing the peak-hardness times as a function of the amount of strain experienced by
the alloy prior to the aging treatment, it can be assumed that SPD accelerates the aging kinetics,
coherent with the previous DSC results. For the alloy processed to the highest strain levels (e.g.

46
(S20) 5.50 equivalent strain by ASR), aging at 180°C becomes so fast that the hardness curves
continuously decrease, starting from beginning of the aging treatment (see Fig. 5.16) this is even
more obvious for the conventional rolling. It must be taken into account that during aging,
recovery of the heavily deformed structure and precipitation from the supersaturated solution can
simultaneously occur. The former mechanism lowers defect density, which results in a lower
strength, the latter contributes to increased density of dispersoids, and hence improves the
strengthening effect. The reason of the continuous loss of hardness detected during aging at
180°C can be supposed to be related to the fact that overwhelming restoration mechanisms of the
deformed structure over the precipitation hardening potential.
On the other hand, the isothermal aging carried out at 130°C on pre-solution annealed and SPD
processed materials could supply interesting opportunities for fully exploiting the precipitate
hardening effects while controlling the stored energy in the structure.
From all of these results, it can be suggested that a proper combination of grain-refinement
strengthening and age-hardening can be fully exploited in solution annealed UFG alloys only when
isothermal aging is performed at temperatures significantly lower than conventional values and
for shorter periods that have to be tailored to specific amount of strain imparted during SPD and
material composition. Stability of UFG structure would also be preserved by the addition of
dispersoid-forming elements that could retard restoration during aging.
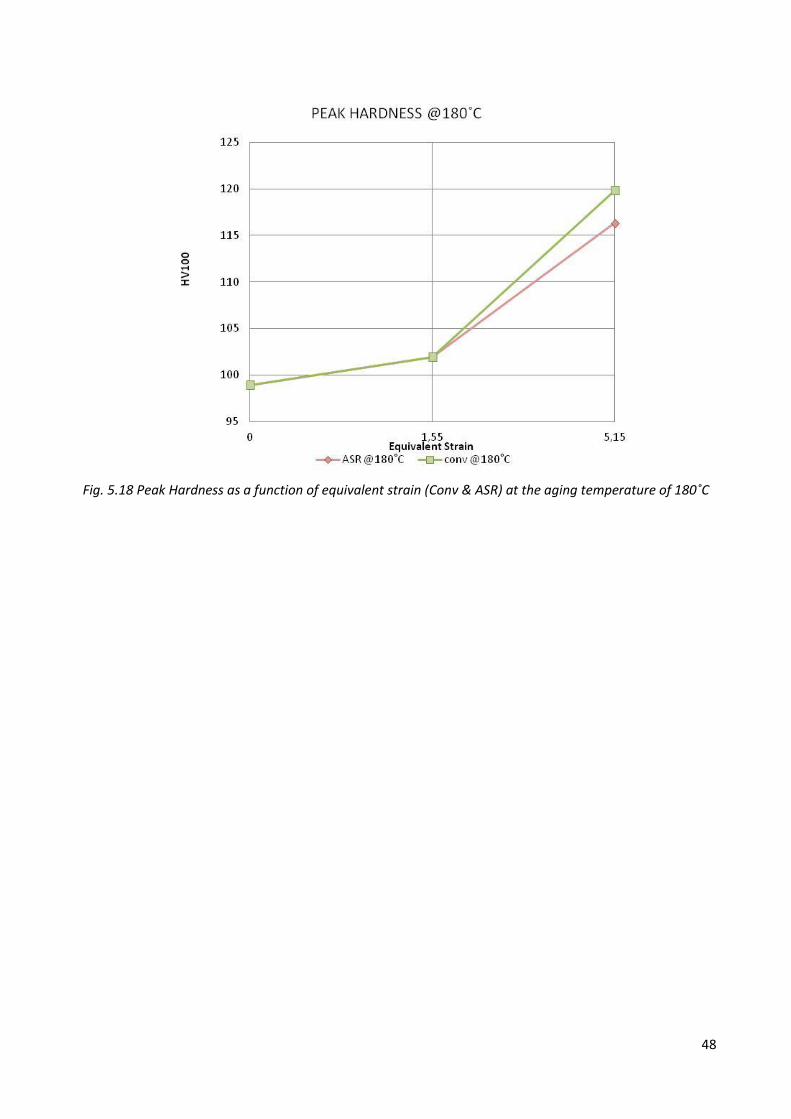
According to the aging curves it is also possible to determine the peak hardness of S0, S6, Conv S6,
S20 and Conv S20. The graphs represent the peak hardness for the each aging temperature as a
function of the equivalent strain of the conventionally and symmetrically rolled samples.

47
Fig. 5.17 Peak Hardness as a function of equivalent strain (Conv & ASR) at the aging temperature of 130 C
It is shown that until the equivalent strain of 1.55 as it was expected the asymmetrically rolled
sample S6 shows a higher peak than the Conv S6. But after the equivalent strain 1.55, as the
equivalent strain increases the hardness of Conv S20 also starts to increase fastly and it is
interesting that S20 shows a lower peak than Conv S20 at the end of the process.
Besides, in Fig. 5.18 until the equivalent strain of 1.55 the curves seem to be overlapping.
Moreover, in Fig. 5.17 Conv S20 shows a higher hardness peak than S20 at the end of the process.
These analyses as mentioned above need further examinations related to the restoration
mechanisms, and for the asymmetric rolling step of 20 the aging process seems to have no further
improvement on the mechanical performance of the material.
48
Fig. 5.18 Peak Hardness as a function of equivalent strain (Conv & ASR) at the aging temperature of 180 C
49
CHAPTER 6
Conclusion
In this thesis the possibility of refining the grain structure of commercial 6082 Al-Mg-Si alloy was evaluated
using the asymmetric rolling in the severe plastic deformation regime. The rolling parameters that have
been applied in this study were the asymmetry ratio of 1.4 and the rolling route of B. The influence on the
microstructure and microhardness evoulution has been analysed.
Optical microscope has been taken into account to asses the evolution of microstructure.
Micrographs have been shown the formation of bands at low equivalent strain, which reduce the
thickness by increasing deformation.
Calorimetric analyses have been performed on the solution treated and asymetrically and
conventionally rolled samples. The effects of SPD on the precipitation kinetics and aging times
have been examined. The results showed that by imparting higher and higher values of equivalent
strain, temperature of precipitation of metastable phases (β’’) progressively decreases. A new
peak also appeared in samples rolled by ASR at equivalent strains exceeding 1.66.
Materials that have been subjected to solution treatment (at 520˚C for 2 hours) and asymmetric
and conventional rolling have been isothermally aged at two temperatures (130 and 180 °C), for
different time steps to establish optimal aging times and to evaluate the achievable strength by
microhardness. All the combinations of times and temperatures have been investigated. After
aging treatment, microhardness has been measured. It has been observed that the SPD
remarkebly accelerates the aging kinetics. Although, the samples that have been processed to the
high strain levels and aged at 180˚C have showed a decreasing hardness curve due to the
overwhelming effects of structure restoration, the aging curve at 130˚C has offered good
opportunities. It is possible to see that the highest mechanical properties are achieved only by
rolling when performed in SPD regime.
Some important issues still remain undiscovered and deserve further investigations. First, It is
important to assess the thermal stability of the ultrafine grained structure and in other words, it is
necessary to establish a temperature at which structural changes become detrimental. Secondly,
after heating the samples that have been processed at high strain levels, a significant reduction in
microhardness occurred. However, microhardness increases at intermediate level of strains. In
other words, aging process might be exploited (on previously solution treated materials) but it can
be achieved more deeply on the samples that have been processed at intermediate strain levels.

50
Finally, by the addition of dispersoid-forming elements to retard restoration during aging might be
achieved for the stability of UFG structure.

51
References
[1] G. Liu, G. J. Zhang, X. D. Ding, J. Sun and K. H. Chen, Materials Science and Engineering A344
(2003) 113-124
[2] TorqueNews
http://www.torquenews.com/119/calm-support-down-weighting-automobiles-improve-fuel-
economy (13.01.212)
[3] Aluminum in Transportation
http://aluminumintransportation.org/main/did-you-know/did-you-know (20.12.2011)
[4] R.P. Garrett, J. Lin, T.A. Dean, International Journal of Plasticity 21 (2003) 1640–1657
[5] A. Abdul-Latif, G.F. Dirras, S. Ramtani, A. Hocini, International Journal of Mechanical Sciences
51 (2009) 797–798
[6] H. Jazaeri, F.J. Humphreys Acta Materialia 52 (2004) 3251–3262
[7] E. El-Danaf, M. Soliman, M. El-Rayes, Design, Manufacturing and Preliminary Experimentation
with an Equal Channel Angle Pressing Die, Final Research Report No.3/426 5
[8] Valiev, R.Z. Islamgaliev, R.K. Alexandrov, Progress in Materials Science 45 (2000) 103-189
[9] J. Jiang, Y. Ding, F. Zuo, A. Shan, Scripta Materialia 60 (2009) 905–908.
[10] B. Verlinden, Association of Metallurgical Engineers Serbia and Montenegro 20
(2007) 165-182
[11] H. Jin, D.J. Lloyd, Metallurgical and Materials Transaction A35 (2004) 997-1005
[12] S. H. Lee, D. N. Lee, International Journal of Mechanical Sciences 43 (2001) 1997-2015
[13] V. Cecen, Thermal Properties and Mechanical Anisotrophy in Polymer Composites, 9 Eylul
University, 2006 Graduate School of Natural and Applied Sciences, Thesis 6
[14] Dieter, George E. (George Ellwood) 1928 Mechanical Metallurgy. Boston: McGraw-Hill 2000
3rd ed.
[15] ESAB Welding & Cutting United States
http://www.esabna.com/us/en/index.cfm (14.02.2012)
[16] G. Mrówka-Nowotnik, J. Sieniawski, M. Wierzbiñska, Materials Science and Engineering 28
(2007) 69-76
[17] Azom.com, The A to Z of Materials
http://www.azom.com/article.aspx?ArticleID=2813 (14.02.2012)
52
[20] F. J. Humphreys, M. Hatherly 2004 Recrystallization and Related Annealing Phenomena.
Elsevier
[21] Integrated Publishing, Aviation
http://navyaviation.tpub.com/14018/css/14018_666.htm (10.03.2012)
[22] H. J. Gleiter, Progress in Materials Science 33 (1989) 223-315
[23] S. C. Tjong, H. Chen, Mater Sci Eng R Rep 45 (2004) 1
[24] Billard S, Fondere JP, Bacroix B, Dirras GF. Acta Mater 54 (2006) 411
[25] F. J. Humphreys, P. B. Prangnell, J. R. Bowen, A. Gholinia, C. Harris , Philos Trans
Royal Society A357 (1999) 1663–1681
[26] H. Jazaeri, F.J. Humphreys, Acta Materialia 52 (2004) 3239–3250
[27] F. J. Humphreys, Acta Materialia 45 (1997) 4231
[28] R. Z. Valiev, A. V. Korznikov, R. R. Mulyukov, Materials Science and Engineering A168 (1993)
141-148
[29] R. Z. Valiev, N. A. Krasilnikov, N. K. Tsenev, Materials Science and Engineering A137 (1991) 35-
40
[30] W.J. Kim, J.B. Lee, W.Y. Kim, H.T. Jeong, H.G. Jeong, Scripta Materialia 56 (2007) 309–312
[31] Y. Ding, J. Jiang, A. Shan, Materials Science and Engineering A509 (2009) 76–80
[32] F. Zuo, J. Jiang, A. Shan, J. Fang, X. Zhang, Transactions of Nonferrous Metals Society of China
18 (2008) 774-777
[33] J.G. Shin, Y.R. Choi, Journal of Manufacturing Science and Engineering 125 (2003) 787-793
[34] F. A. T. Goma, Master Thesis of Intermetallic Particles Evolution in 6082 Aluminium Alloy
Subjected to Severe Plastic Deformation, 2008 Mechanical Department, Politecnico di Milano, Italy
[35] S. Farè, N. Lecis, M. Vedani, Journal of Metallurgy 2011 (2011) 8
[36] L. Pantělejev, O. Man, L. Kunz, Acta Metallurgica Slovaca 17 (2011) 158-162
53
[37] J. Zrnik, T. Kovarik, M. Cieslar, L. Kraus, Olomouc, Czech Republic, EU 12 (2010) 6
[38] M. Vedani, G. Angella, P. Bassani, D. Ripamonti, A. Tuissi, Journal of Thermal Analysis and
Calorimetry 87 (2007) 277–284
[39] W. J. Kim, J. Y. Wang, S. O. Choi, H. J. Choi, H. T. Sohn, Materials Science and Engineering A520
(2009) 23-28
[40] S. K. Panigrahi, R. Jayaganthan, V. Pancholi, Materials and Design 30 (2009) 1894–1901
[41] Barrett, C.S. (1939), Trans. Metall. Soc. A.I.M.E.135, 296
[42] F. J. Humphreys, P. B. Prangnell, R. Priestner, Current Opinion in Solid State Materials Science
5 (2001) 15-21
[43] S. Farè, M.Vedani, G. Angella, Materials Science Forum 604-605 (2009) 77-85