Agilent PSA Series Spectrum Analyzers Flexible Digital...
20
Agilent PSA Series Spectrum Analyzers Flexible Digital Modulation Analysis Measurement Personality Technical Overview with Self-Guided Demonstration, Option 241 The PSA Series is Agilent Technologies’ highest performing spectrum analyzer family. From millimeter wave and phase noise measurements to spur searches and cellular communications con- formance tests - the PSA Series offers a leading-edge combination of speed, accuracy and dynamic range. R&D and manufacturing engineers in cellular, commercial and emerging wireless communi- cations, aerospace or defense can now easily, quickly and accurately perform flexible modulation analy- sis on digitally modulated signals with Agilent’s new measurement personality.
Transcript of Agilent PSA Series Spectrum Analyzers Flexible Digital...

Agilent PSA Series Spectrum Analyzers Flexible DigitalModulation Analysis Measurement Personality
Technical Overview with Self-Guided Demonstration, Option 241
The PSA Series is AgilentTechnologies’ highest performingspectrum analyzer family. Frommillimeter wave and phase noisemeasurements to spur searchesand cellular communications con-formance tests - the PSA Seriesoffers a leading-edge combinationof speed, accuracy and dynamicrange. R&D and manufacturingengineers in cellular, commercialand emerging wireless communi-cations, aerospace or defense cannow easily, quickly and accuratelyperform flexible modulation analy-sis on digitally modulated signalswith Agilent’s new measurementpersonality.

A single analyzer for spectrumand modulation analysis
The Agilent PSA Series spectrumanalyzers with the flexible digitalmodulation analysis measurementpersonality (Option 241), providethe flexibility of general-purposespectrum analysis combined withthe ability to analyze signal modulation quality. This powerfultroubleshooting combination enablesyou to quickly identify and quantifyimpairments on digitally modulatedsignals for all major modulation formats. Now you can perform spectrum and vector measurementsusing one comprehensive measurement tool. By adding thisoption you can reduce the need foradditional equipment, help increasemeasurement accuracy, and minimizedevelopment time.
Flexible modulation formats
Option 241 supports a wide varietyof digital modulation formatsincluding industry standard formatssuch as: IS-95 (cdmaOne), cdma2000,W-CDMA, EDGE/GSM, NADC, PDC,PHS, TETRA, Bluetooth™, ZigBee,APCO25 (phase1) and VDL mode3.If customized formats from existingcellular standards are developed,you can easily configure the digitalformat, filter, symbol rate and meas-urement interval to meet your needs.Otherwise you can set up your owncustom modulation formats (MSK,PSK, FSK, QAM, DVBQAM, etc.) andparameters to suit your application.
Available measurement results
The flexible digital modulationanalysis measurement personalityallows you to measure error vectormagnitude (EVM), the most widelyused modulation quality metric indigital communications systems.EVM related metrics includes: I/Qmagnitude, I/Q phase, I/Q frequencyand I/Q offset (carrier feed-through).
Various traces include: I/Q polar vector and constellation, I and Q eyediagrams, magnitude error versussymbol, phase error versus symbol,and EVM versus symbol. For more in-depth analysis, use the followingnew PSA capabilities: demodulatedbits, error vector spectrum, andEQ channel response (frequency and phase).
For an even more extensive andflexible set of digital modulationanalysis measurements, considercombining a PSA Series spectrumanalyzer with the Agilent 89600 Seriesvector signal analysis software.
2
Flexible Digital Modulation Analysis Inside Agilent PSA Series Spectrum Analyzers
Key features
• Analyze and visualize I/Q modulationwith confidence and simplicity.
• Detect the most common errors with the help of intuitive measurementdisplays and symbol dot feature.
• Expedite troubleshooting and easily define errors with the various quantitative RMS and peak measurements available in the comprehensive results table.
• Increase productivity and reduce user error with one-button setups.
• Minimize training with easy-to-use display tools (eye, constellation, andvector diagrams).
• Distinguish between linear and non-linear sources of error by using the built-in adaptive equalizer function.
• Increase measurement confidence with guaranteed specifications below 3 GHz.
• Perform flexible digital modulation analysis on millimeter-wave signals up to 50 GHz by adding Option 241 to the PSA E4448A.
• Select from three modulation bandwidths: 10 MHz standard PSA, 40 MHz (PSA E4440A/43A/45Awith Option 140), or 80 MHz (PSA E4440A/43A/45A with Option 122).Option 123 preselector bypass is recommended to add to Option 140and 122 for higher performance over 3 GHz.
This technical overview includes:• Measurement capabilities• Demonstrations and explanations• Key specifications• Ordering information• Related literature
EVMpage 4
Symbol rate errorspage 5
In-channel phase modulation (PM)
interferencepage 6
Baseband filteringerrorspage 8
Using equalizationfilter
page 11
More usefuldisplayspage 14

MeasurementCapabilities
Demonstrations andExplanations
Demonstration preparation
The following options are requiredfor the ESG and the PSA Series inorder to perform this demonstration.
All demonstrations use the PSASeries and the E4438C ESG vectorsignal generator. Key strokes surrounded by [ ] indicate hard keyslocated on the front panel, while keynames surrounded by indicatesoft keys on the right edge of thedisplay.
To configure these instruments, connect the ESG’s 50 Ω RF output tothe PSA Series' 50 Ω RF input with a50 Ω RF cable. Turn on the power inboth instruments.
Now set up the ESG to generate a QPSK signal.
3
Product type Model number Required options
ESG vector E4438C 503, 504, or 506 – frequency range signal generator up to at least 3 GHz
601 or 602 – baseband generator
PSA Series E4440A/E4443A/E4445A/ 122 or 140 wide bandwidth digitizer spectrum analyzer E4446A/E4447A/E4448A (Not mandatory for this demo. If these
options are installed on the PSA, use Option 123 as well.) 241 – flexible digital modulation analysismeasurement personality
Modulation formats Predefined standards Results, displays and analysis tools
MSK GSM I/Q vector & constellationEDGE EDGE EVM (RMS/peak)BPSK, QPSK, OQPSK, DQPSK W-CDMA Magnitude error RMSπ/4 DQPSK cdma2000 Phase error RMS8PSK, D8PSK, 3π/8 8PSK Bluetooth Frequency errorFSK (2, 4, 8) NADC I/Q origin offsetQAM (16, 32, 64, 128, 256) PDC RhoDVBQAM (16, 32, 64, 128, 256) PHS Mean power
IS-95 Eye diagramTETRA Mag error vs. timeZigBee 2450 MHz Phase error vs. timeAPCO25 phase 1 EVM vs. timeVDL mode3 Equalization filter ON/OFF
EQ channel response (frequency and phase)Error vector spectrumRF spectrumDemodulated bits
Instructions Keystrokes
On the ESG:
Set the carrier frequency to 1 GHz. [Preset] [Frequency] [1] GHz
Set amplitude to –20 dBm. [Amplitude] [–20] dBm
Select custom mode. [Mode] Custom Real Time I/Q Baseband
Set modulation parameters. Data PN Sequence PN23
Filter Select Root Nyquist Filter Alpha [0.22]
Enter Return
Symbol Rate [3.84] Msps [Return]
Modulation Type Select PSK QPSK [Return]
Turn on the signal. Custom On
Turn on RF output. [RF On]
Instructions Keystrokes
On the PSA Series:
Enter digital modulation analysis [Preset] [Mode] Digital Modulationmode in the analyzer.
Set center frequency to 1 GHz. [FREQUENCY] [1] GHz
Change the span to see the [Span] [10] MHzmeasured spectrum.

Demonstration start
Error vector magnitude (EVM)
An effective way to quantify modulation accuracy is to comparethe signal being measured to anideal signal. Figure 1 defines theerror vector, a measure of the amplitude and phase differencesbetween the ideal modulated signaland the actual modulated signal.EVM can be calculated and reportedas RMS and peak values, and can bemeasured at multiple points duringeach symbol time, or at symboltimes only. This is the error vectormagnitude (EVM). EVM is a commonmodulation quality metric widelyused in digital communications.
CDMA-based formats, which rely on correlation as part of their operation, use another parametercalled rho (ρ). Rho is a measure ofthe correlated power to the totalpower. The correlated power is computed by removing frequency,phase, and time offsets and perform-ing a cross correlation between thecorrected measured signal and theideal reference. Rho is importantbecause uncorrelated power appearsas interference to a receiver.
Measurement
When an EVM measurement is performed, the analyzer samples thetransmitter output to capture theactual signal trajectory. This operation can be performed usingthe instructions below. The signal isdemodulated and, given knowledgeof such functions as symbol clocktiming, and baseband filteringparameters, a corresponding idealor reference signal is derived mathe-matically. The error vector is thevector difference at a given timebetween the ideal reference signaland the measured signal. It is a complex quantity that contains amagnitude and phase component.
Reported EVM is the root-mean-square(rms) value of the error vector overtime at the instants of the symbolclock transitions. It is an acutely sensitive measure of quality.
Instructions Keystrokes
On the PSA Series:
Access to EVM measurement (Figure 2). [Measure] Modulation Analysis
4
Q
I
Magnitude error(I/Q error magnitude)
Measuredsignal
Ideal signal(reference)
Phase error(I/Q error phase)
Error vector
ø
Figure 1. The error vector
Figure 2. Polar vector view of EVM measurement
An I/Q polar vector display of the signal should appear on the analyzer screen, similar to thatshown in Figure 2. This is one of themany views of the modulation analysis personality. Importantrelated metrics are listed in a tableto the left of the vector display.

Digital modulation analysis troubleshooting I/Qimpairments
The following radio signal errors areinvestigated in this section:• Symbol rate errors• In-channel phase modulation (PM)
interference• Baseband filter errors
Symbol rate errors
Small deviations in the symbol clockcan result in significant modulationerrors. Even these small errorscause a significant spread of theconstellation points and a largeincrease in peak EVM. This gives youan idea of what a typical receiverwill have to deal with in its attemptto demodulate the incoming signal.
The effect of symbol rate errors onthe different measurements dependson the size of the error. If the symbol rate error is too large, theinstrument cannot demodulate thesignal, let alone make an EVM measurement. Consequently, themodulation analysis option is mostuseful in troubleshooting small symbol rate errors. To troubleshootcircuits with a large symbol rateerror, look at the signal’s channelbandwidth.
To perform this operation, use theinstructions on this page to set theESG-C for a QPSK signal with a symbol rate of 3.8415 Msps. This is asymbol rate error of 0.0015 Mspsover the predefined symbol rate.
This exercise demonstrates the symbol error impact on EVM of signal modulated in QPSK withchanging display.
5
The power of the flexible digital modulation analysis measurement personal-ity is its ability to characterize the radio signal for transmitter troubleshoot-ing. This section illustrates how to interpret the data to identify symptomsof problems in radio signals with the Agilent PSA Series with Option 241.
Instructions Keystrokes
On the ESG:
Change the symbol rate Symbol Rate [3.8415] Mspsfrom 3.84 to 3.8415 Msps.
Instructions Keystrokes
On the PSA Series:
Change the view menu from vector & [Display] I/Q Polar Type Constellationconstellation to the constellation only (Figure 3).
Figure 3. Polar constellation view of QPSK signal with a symbol rate error
Notice the spreading of symbol decision points and the large value of EVM for a symbol rate error of only 0.0015 Msps (.04%).

In-channel phase modulation(PM) interference
When integrating a communicationssystem, many signals (digital, baseband, IF, and RF) are present.The close proximity of the compo-nents is an invitation to cross talkand can lead to unwanted signals inthe signal output. These spurioussignals are usually too small to beseen in the frequency domain.However, the modulation analysispersonality has the capability to easily highlight the presence of suchinterference. The interfering signalcauses the amplitude or phase of thetransmitted signal to be differenteach time the signal passes throughthe same state. PM interferencecauses a variation of the phasearound the ideal symbol referencepoint.
In this section, set the ESG to generate a phase modulating inter-fering signal at 45 kHz and deviationof 0.03 π radians or 5.5 degrees asshown:
This exercise demonstrates the PMinterference on EVM of QPSK signalwith changing view/trace.
The I/Q polar constellation should be the first step in identifying the in-channel PM problem. To view this on the PSA Series spectrum analyzer,as shown in Figure 4, follow these steps:
Instructions Keystrokes
On the ESG:
Change the symbol rate Symbol Rate [3.84] Mspsfrom 3.8415 to 3.84 Msps.
Go to frequency and phase modulation [FM/φM], toggle φM highlightedmenu and select phase modulation.
Set frequency of the internally generated φM Rate [45] kHzphase modulation signal to 45 kHz.
Set phase modulation deviation to φM Dev [0.03] pi rad0.03 π radians or approximately 5.5 degrees.
Turn on the phase modulation. Select φM On
Instructions Keystrokes
On the PSA Series:
Check the signal with constellation [Display] I/Q Polar Type Constellation
only display (Figure 4).
Figure 4. Polar constellation view of QPSK signal with a phase modulation interference of 45 kHz at 0.03 π radians
Note the variation of the phase around the ideal symbol reference point.This variation is due to the measured symbols preserving the right amplitude but varying in phase. Also note that the average phase error islarger than the magnitude error. With the interference identified as a PMinterference, the next step is to identify the frequency and peak deviation ofthis PM signal.
6

In-channel phase modulation(PM) interference (cont’d)
To identify the frequency of thephase-modulating signal, turn on thephase error versus time display onthe PSA Series spectrum analyzer.
If the number of cycles can be accurately determined, the frequencyof the phase modulating signal canbe determined. (Refer to Table 1.) Todo this, it could be useful to adjustthe scaling using the span andamplitude keys if necessary. It may also be helpful to pause themeasurement to easier determinethe number of cycles. Use the Meas Control key to pause the measurement.
Instructions Keystrokes
On the PSA Series:
Change the measurement view menu. [View/Trace] I/Q Error (Quad View)
Note the “regular” modulating waveform of the interfering PM signal in the phase error versus time plot. If the plot is random it indicates phase noise.
Move selected windows in quad view. [Next window] below PSA display
Select phase error versus symbol window and zoom on. [Zoom]
Change the Y scale to see the detail on phase [Y Scale Amplitude] Scale/Div [3] error trace (Figure 5). Symbols
Figure 5. Zoomed phase error trace with phase modulation interference of 45 kHz at 0.03 π radians
Table 1. Calculating the PM interference
Frequency of PM interference = (cycles/second)
In this casefrequency of PM interference =
= 45 kHz
The peak deviation is easily determined by looking at the amplitude scale.There are about five divisions of peak phase modulation at one degree perdivision. These both correspond to the interference generated with the ESGsignal generator.
7
(No. of Cycles)(No. of Symbols)symbol second
( 3 cycles )(3.84 x 10⁶ symbols)256 symbol 1 second

Baseband filtering errors
Filtering errors are among the most common problems in digitalcommunication design. Typical filtering errors can be due to errorsin filter alpha, wrong filter shape, orproblems such as incorrect filter coefficients and incorrect window-ing. In all cases, these errors resultin increased inter-symbol interfer-ence and overshoot or undershoot ofthe baseband signal.
Alpha defines the sharpness of thefilter. In fact, the lower the alpha,the sharper the filter is in the frequency domain and the higherthe overshoot in the time domain.Conversely, the larger the alpha, thesmaller the overshoot is in the timedomain.
In many communication systems,when using Nyquist baseband filtering, the filter response isshared between the transmitter andthe receiver. The filters must becompatible and correctly implement-ed in each.
The constellation diagram providesthe first indication of baseband filtering errors. The smaller overshoots due to an increasedalpha is shown by the trajectoriesbetween the symbol points. Thisreduces the required peak powerand reduces the power requirementsof the transmitter.
Note: A lower peak overshoot can also be caused by signal com-pression like that in an overdrivenamplifier stage.
To illustrate this error, set the PSASeries spectrum analyzer with anincorrect filter alpha as follows. Theanalyzer will display the screenshown in Figure 6.
Another useful way to identify baseband filtering errors is by looking at the EVM versus symbol(time) display. Set the filter alphavalue to a larger value to demon-strate what baseband filtering errorslook like in the EVM versus symbol(time) display.
8
Instructions Keystrokes
On the PSA:
Change view to EVM versus symbol window [View/Trace] I/Q Error (Quad View) [Nextand zoom in. window] [Zoom]
To see the wrong filter alpha impact on EVM [Span] Scale/Div [1] Symbolbetween symbols, zoom in on the X-axis scale.
Increase the Y-axis scaling to see the peaks of [Amplitude] Scale/Div [5] %the EVM signal going off the vertical scale with incorrect filter alpha (Figure 7).
Figure 7. EVM versus time (symbols) of a QPSK signal with incorrect filter alpha
Incorrect alphas also show up markedly in CCDF curves.
Instructions Keystrokes
On the ESG:
Turn off phase modulation of the current signal. [FM/φM], select φM Off
On the PSA Series:
Change the measurement view to I/Q [View/Trace] I/Q Measured Polar Graphmeasured polar graph.
Change from constellation only to polar vector [Display] I/Q Polar Type Vec & Constellationdisplay.
Enter the wrong filter alpha to lower the overshoot [Meas Setup] Demod Alpha/BT [1] [Enter](Figure 6).
Figure 6. Polar vector diagram of a QPSK signal with incorrect filter alpha

Baseband filtering errors (cont’d)
Another way to visually identifybaseband filtering errors is with theeye diagram view. Eye diagrams arecommonly used in troubleshootingdigital communication systems andcan help identify problems such asISI (inter-symbol interference) andjitter.
An eye diagram is the display of theI (real) or Q (imaginary) signal magnitude versus time that is trig-gered by the symbol clock. To buildthe eye diagram, the analyzer drawsthe first trace, then overlays the second trace, the third trace, and soon until the number of symbolsspecified by Measure Interval isdisplayed. The second trace is a continuation of the first trace; thethird trace is a continuation of thesecond trace, and so forth.
In other words, the analyzer drawsone trace to the end of the display,and then wraps it back to the begin-ning of the display to start the nexttrace. To create a complete eye dia-gram, the I or Q signal must alter-nate between all states.
9
Instructions Keystrokes
On the PSA:
Switch view to eye diagram and zoom out [View/Trace] Eye [Zoom]
(Figure 8).
Change the filter alpha back to 0.22. [Meas Setup] Demod Alpha/BT [0.22] [Enter]
Restart measurements and compare the [Restart]differences on eye diagram (Figure 9).
Figure 8. EVM versus time (symbols) of a QPSK signal with incorrect filter alpha
Figure 9. EVM versus time (symbols) of a QPSK signal with correct filter alpha
The eye diagram illustrated in Figure 9 has a full opening at the midpoint of the eye. Since the midpoint of the eye represents the sampling instants ofeach pulse, where the pulse amplitude is a maximum without interferencefrom any other pulse, ISI is at a minimum. ISI and channel noise will causedeviation of the pulse amplitude values from their full-scale by differingamounts during each trace. This causes blurring at the decision points sincethe traces are superimposed. The decision threshold as to which symbol, 1 or 0, is transmitted is the midpoint of the eye.1 This means that for zero ISI,the system can tolerate noise up to one-half the vertical opening of the eye.Because the ISI reduces the eye opening, it reduces noise tolerance. This is a useful tool, not only for determining the presence of noise, but also fordetermining the robustness of the system.
1. This is true for two-level decision. For a three-level decision, there will be two thresholds.

Configuring modulation analysis parameters
We’ve already seen the importanceof modulation parameters for correctmodulation analysis. To configureand check the complicated parame-ters the PSA Series provides userfriendly “form” for easier setup.
This exercise shows how to configureparameters in the setup “form”.
10
Instructions Keystrokes
On the PSA Series:
Select “form” to check the current signal [Meas Setup] Meas Setup…
configurations (Figure 10).
Move selected item from “modulation format” Use [<=] and [=>] keys below PSA displayto other parameters.
Figure 10. Convenient format to configure modulation parameters for the target signals

Using the equalization filter
This exercise shows how to eliminate linear error component in baseband filter with equalizationfilter function. Switching the equalization function on and offallows post-equalization and pre-equalization error measurements tobe compared.
11
Instructions Keystrokes
On the ESG:
Change the signal frequency from 1 GHz to 200 kHz. [Frequency] [200] kHz
Modify the symbol rate from 3.84 Msps to 50 ksps. [Mode] Custom Real Time I/Q Baseband
Symbol Rate [50] ksps [Return]
Instructions Keystrokes
On the PSA Series:
Change the symbol rate to the captured signal. [Meas Setup] Demod Symbol Rate [50] kHz
Adjust the center frequency to 200 kHz. [Frequency] [200] kHz
Switch view to I/Q polar vector to check the [View/Trace] I/Q Measured Polar GraphEVM. (Figure 11). [Display] I/Q Polar Type Vec & Constellation
Change screen view to I/Q error quad view for [View/Trace] I/Q Error (Quad View)more detail information.
Move selected window from mag error vs. time [Next Window] [Zoom]
to EVM vs. time to zoom in.
Change X scale to see EVM trace of 20 symbols [Span X Scale] Scale/Div [2] [Enter]
in detail (Figure 12).
Figure 11. I/Q polar vector at center frequency 200 kHz
Figure 12. EVM versus time (symbols) trace of 20 symbols

Using the equalization filter(cont'd)
Adaptive equalizationAdaptive equalization identifies and removes linear errors from I/Qmodulated signals by dynamicallycreating and applying a compensat-ing filter. These errors include groupdelay distortion, frequency responseerrors, and reflections or multipathdistortion. You can also uncoverDSP errors such as miscoded bits, or incorrect filter coefficients.
Equalization is a tool that designerscan use to identify and correct linear errors. Pre-distorting a signalto correct linear errors can be simpler, faster, and cheaper thanmodifying hardware to make corrections. Furthermore, somewideband signals are almost impossible to measure withoutadaptive equalization.
12
Instructions Keystrokes
On the PSA Series:
Turn equalization on (Figure 13). [Meas Setup] More Equalization EQ Filter On
Check the EVM result improvement with [Next Window]
EQ filter in numeric result table.
Switch view to eye diagram. [View/Trace] Eye
Turn EQ filter off and on to find the differences [Meas Setup] More Equalization EQ Filter Off
of eye diagram shape (Figure 14). and On
Figure 13. EVM versus time (symbols) trace of 20 symbols with EQ filter ON
Figure 14. Eye diagram with EQ filter ON
Note:The cause of the poor EVM at 200 kHz is the low frequency cut-off filter in the ESG signal generator. This filter removes low frequency signals and noise, and thus the ESG is not specified below 250 kHz. The adaptive equalization filter is able to compensate for the tilt (low-frequency rolloff) of this filter and dramatically improve the modulation quality.

Using the equalization filter(cont'd)
Instructions Keystrokes
On the PSA:
Switch the view from eye diagram to EQ filter [Trace/View] Equalizer (quad view)(Figure 15). Note: When the EQ filter is turned Off, the tracecannot be seen in the equalizer quad.
Go to error vector spectrum view with EQ filter ON. [Trace/View] Error Vector Spectrum (quad view)
Turn off the EQ filter to see the difference between [Meas Setup] Equalizer EQ Filter OffIQ measured polar vector and IQ reference polar vector trace (Figure 16).
Figure 15. Equalizer view with channel frequency response, channel phase response, and impulse response with EQ filter ON
Figure 16. Error vector spectrum view with EQ filter OFF
13

More Useful Displays Instructions Keystrokes
On the PSA:
Find the statistic result table in Result Metrics [Trace/View] Numeric Results(Figure 17).
Access to the demodulated bits stream (Figure 18). [Trace/View] Demod Bits
Figure 17. Numeric result table calculated for maximum and averaged values
Figure 18. Demodulated bits stream with EVM versus time trace and
IQ measured polar vector
14

15
PSA Series KeySpecifications1
Flexible digital modulation analysis measurement personality
Description Specifications Supplemental information
Signal acquisitionFrequency range2
Specified range 10 MHz to 3 GHz
Operational range 3 Hz to 50 GHz Maximum frequency for each PSA
model
Analysis bandwidth
Without E444xA-122/1233
Range (IFBW) 1 kHz to 10 MHz Flat top
IF frequency response, ±0.12 dB (nominal)
IFBW = 10 MHz
Phase linearity, 1º peak-to-peak (nominal)
IFBW = 6.4 MHz
With E444xA-140/1233
Range (IFBW) 1 kHz to 40 MHz Flat top
IF frequency response Supplemental information: Please refer
to the IF frequency response specifica-
tions in the 80/40 MHz BW digitizer
chapter of PSA the Specification Guide
Data block length 10 to 20000 symbols Variable, based on samples per
symbol
Samples per symbol 1, 2, 4, 5 or 104
Symbol clock Internally generated
Carrier lock Internally generated
Lock range (wide)5 ± (Symbol rate or 1.5MHz smaller
of) (nominal) for BPSK, QPSK, OQPSK,
DQPSK, 16QAM, 64QAM, 256QAM
± (Symbol rate/2 or 750 kHz
smaller of) (nominal) for 8PSK, D8PSK
Lock range (narrow)6 ± (Symbol rate/7) (nominal) for BPSK
± (Symbol rate/12.5) (nominal) for
QPSK, DQPSK, π/4 DQPSK
± (Symbol rate/200) (nominal) for OQPSK
± (Symbol rate/25) (nominal) for 8PSK
± (Symbol rate/46) (nominal) for D8PSK
± (Symbol rate/40) (nominal) for
16QAM, 32QAM
± (Symbol rate/56) (nominal) for 64QAM
± (Symbol rate/125) (nominal) for
128QAM
± (Symbol rate/360) (nominal) for 256QAM
1. See PSA Series spectrum analyzer data sheet for more details (literature number 5980-1284E).2. Specified range is the frequency range of all specifications applying. Operational range is the frequency range of
the personality being operated on each PSA model.3. For wideband modulation analysis up to 80 MHz, E444xA-123 is necessary to get maximum performance out of
Option 122 at frequencies above 3.05 GHz.4. 2, 4 or 10 when modulation format is set to OQPSK.5. Clean signal with random data sequence, carrier lock is set to wide. When the EVM of the signal is not good,
the automatic carrier lock may find the false spectrum for the carrier frequency. In that case, the automatic carrier lock works better with the carrier lock set to normal with narrower locking range. The entire spectrum including the frequency offset must fit inside of instrument analysis bandwidth (center frequency ± (res BW/2)). The automatic carrier lock does not adjust the center frequency.
6. Clean signal with random data sequence, carrier lock is set to normal. The entire spectrum including the frequency offset must fit inside of instrument analysis bandwidth (center frequency ± (Res BW/2)).
16
Description Specifications Supplemental information
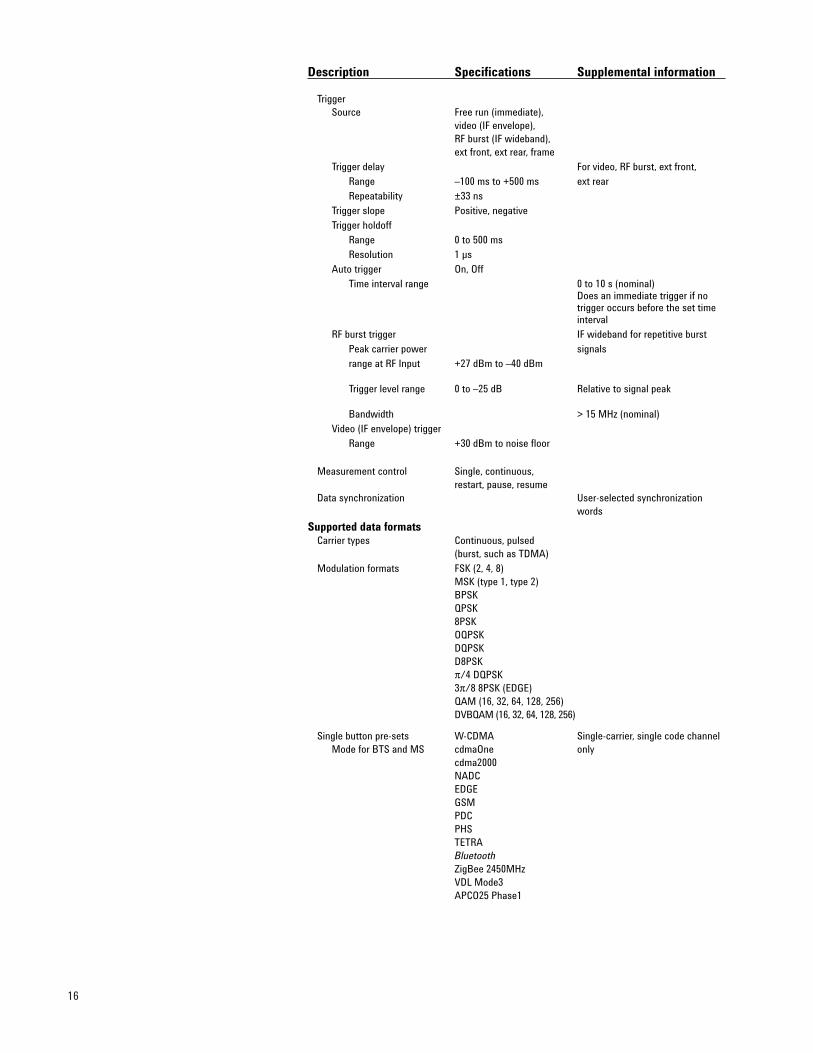
TriggerSource Free run (immediate),
video (IF envelope), RF burst (IF wideband), ext front, ext rear, frame
Trigger delay For video, RF burst, ext front,
Range –100 ms to +500 ms ext rear
Repeatability ±33 ns
Trigger slope Positive, negative
Trigger holdoff
Range 0 to 500 ms
Resolution 1 µs
Auto trigger On, Off
Time interval range 0 to 10 s (nominal)Does an immediate trigger if no trigger occurs before the set time interval
RF burst trigger IF wideband for repetitive burst
Peak carrier power signals
range at RF Input +27 dBm to –40 dBm
Trigger level range 0 to –25 dB Relative to signal peak
Bandwidth > 15 MHz (nominal)
Video (IF envelope) trigger
Range +30 dBm to noise floor
Measurement control Single, continuous, restart, pause, resume
Data synchronization User-selected synchronization words
Supported data formats Carrier types Continuous, pulsed
(burst, such as TDMA)
Modulation formats FSK (2, 4, 8)MSK (type 1, type 2)BPSKQPSK8PSKOQPSKDQPSKD8PSKπ/4 DQPSK3π/8 8PSK (EDGE)QAM (16, 32, 64, 128, 256)DVBQAM (16, 32, 64, 128, 256)
Single button pre-sets W-CDMA Single-carrier, single code channel Mode for BTS and MS cdmaOne only
cdma2000NADCEDGEGSMPDCPHSTETRABluetoothZigBee 2450MHzVDL Mode3APCO25 Phase1

17
Description Specifications Supplemental information
FilteringMeasurement filter types Nyquist (raised cosine),
root nyquist (square-root
raised cosine), IS-95
compatible, gaussian,
EMF (EDGE) rectangle, none
Reference filter types Nyquist (raised cosine),
root nyquist (square-root
raised cosine), IS-95
compatible, gaussian, EDGE
rectangle, half sine
User-selectable alpha/BT
Range 0.01 to 1.0
Resolution 0.01
Symbol rateRange
IFBW = Narrow 1 kHz to 10 MHz1 (nominal)
IFBW = Wide, with E444xA-122/123 10 kHz to 80 MHz1 (nominal)
IFBW = Wide, with E444xA-140/123 10 kHz to 40 MHz1 (nominal)
Maximum symbol rate IFBW / (1 + α)2
Accuracy3
BPSK, QPSK, 8PSK, DQPSK, D8PSK, π/4 DQPSK4
Symbol rate ≥ 1kHz
Residual errors α ≥ 0.3 0.2 ≤ α < 0.3 α ≥ 0.3 0.2 ≤ α < 0.3(typical) (typical)
Error vector magnitude (EVM)Symbol rate < 10 kHz 0.8% rms 0.9% rms 0.7% rms 0.7% rmsSymbol rate < 100 kHz 0.7% rms 0.7% rms 0.6% rms 0.6% rmsSymbol rate < 1 MHz 0.9% rms 0.9% rms 0.6% rms 0.7% rmsSymbol rate < 6 MHz 2.1% rms 2.1% rms 1.2% rms 1.2% rms
Magnitude errorSymbol rate < 10 kHz 0.4% rms 0.5% rms 0.4% rms 0.5% rmsSymbol rate < 100 kHz 0.4% rms 0.5% rms 0.4% rms 0.5% rmsSymbol rate < 1 MHz 0.5% rms 0.6% rms 0.4% rms 0.5% rmsSymbol rate < 6 MHz 1.5% rms 1.5% rms 0.8% rms 0.8% rms
Phase error5
Symbol rate < 10 kHz 0.5° rms 0.5° rms 0.4° rms 0.4° rmsSymbol rate < 100 kHz 0.4° rms 0.4° rms 0.3° rms 0.3° rmsSymbol rate < 1 MHz 0.5° rms 0.5° rms 0.3° rms 0.3° rmsSymbol rate < 6 MHz 1.2° rms 1.2° rms 0.7° rms 0.7° rms
Frequency error ± Symbol rate / 500,000 +
tfa6 (nominal)
I-Q origin offset –60 dB (nominal)
16QAM, 32QAM, 64QAM,
128QAM, 256QAM7
Symbol rate ≥ 10 kHz
Residual errors 0.2 ≤ α ≤ 0.3 0.1 ≤ α < 0.2 0.2 ≤ α ≤ 0.3 0.1 ≤ α < 0.2(typical) (typical)
1. Meaningful operational range is limited by the maximum symbol rate. For best EVM results, the spectrum must be inside of the instrument analysis bandwidth (venter frequency ± (Res BW/2)).
2. Determined by the IFBW and the excess bandwidth factor (a) of the input signal. The entire signal must fit within the selected IFBW.
3. These specifications apply to the signal without an input overload message, (RF input power – input atten) ≥ –25 dBm, random data sequence, and temperature 20 to 30 °C.
4. Meas filter = root nyquist, ref filter = nyquist, results length = 150 symbols.5. For modulation formats with equal symbol amplitudes.6. tfa = transmitter frequency x frequency reference accuracy7. Meas filter = root nyquist, ref filter = nyquist, results length = 800 symbols.

18
Description Specifications Supplemental information
Error vector magnitude (EVM)Symbol rate < 100 kHz 0.7% rms 0.9% rms 0.6% rms 0.8% rmsSymbol rate < 1 MHz 0.8% rms 1.0% rms 0.6% rms 0.9% rmsSymbol rate < 6 MHz 2.1% rms 2.7% rms 1.2% rms 1.3% rms
Magnitude errorSymbol rate < 100 kHz 0.3% rms 0.5% rms 0.2% rms 0.5% rmsSymbol rate < 1 MHz 0.5% rms 0.7% rms 0.4% rms 0.6% rmsSymbol rate < 6 MHz 1.5% rms 2.0% rms 0.9% rms 0.9% rms
Phase errorSymbol rate < 100 kHz 0.4° rms 0.6° rms 0.3° rms 0.6° rmsSymbol rate < 1 MHz 0.6° rms 0.7° rms 0.4° rms 0.6° rmsSymbol rate < 6 MHz 1.5° rms 1.8° rms 0.9° rms 0.9° rms
Frequency error ± Symbol rate / 500,000 +
tfa1 (nominal)
I-Q origin offset –60 dB (nominal)
MSK2
Symbol rate = 200 to 300 kHzBT = 0.3
Residual errors
Phase error 0.3° rms
Frequency error ±5 Hz + tfa1
I-Q origin offset –60 dB (nominal)
16, 32, 64, 128, 256DVBQAM
Symbol rate = 6.9 MHz
Alpha = 0.15
Residual errors
Error vector magnitude (EVM) 0.7 % rms (nominal)
Frequency = 1.0 GHz
QPSK3 Operated with E4440A-122 or 140Symbol rate = 5 MHz (IF path = wide) and 123
(preselector = OFF)Residual errors α = 0.22 (nominal)
Error vector magnitude (EVM)Frequency = 5.0 GHz 0.4% rmsFrequency = 10.0 GHz 0.4% rmsFrequency = 15.0 GHz 0.6% rmsFrequency = 20.0 GHz 0.8% rms
QPSK3 Operated with E4440A-122 or 140Symbol rate = 15 MHz (IF path = wide) and 123
(preselector = OFF)Residual errors α = 0.22 (nominal)
Error vector magnitude (EVM)Frequency = 5.0 GHz 0.6% rmsFrequency = 10.0 GHz 0.7% rmsFrequency = 15.0 GHz 0.8% rmsFrequency = 20.0 GHz 1.2% rms
QPSK3 Operated with E4440A-122 or 140Symbol rate = 30 MHz (IF path = wide) and 123
(preselector = OFF)Residual errors α = 0.22 (nominal)
Error vector magnitude (EVM)Frequency = 5.0 GHz 1.4% rmsFrequency = 10.0 GHz 1.3% rmsFrequency = 15.0 GHz 1.6% rmsFrequency = 20.0 GHz 1.9% rms
1. tfa = transmitter frequency x frequency reference accuracy2. Meas filter = none, ref filter = Gaussian, results length = 148 symbols.3. Meas filter = root Nyquist, ref filter = Nyquist, results length = 150 symbols.

19
General purpose measurements
E444xA-226 Phase noise measurement
personality
E444xA-219 Noise figure measurement
personality (requires 1DS)
E444xA-241 Flexible digital modulation
analysis measurement
personality
E444xA-266 Programming code
compatibility suite
E444xA-215 External source control
Hardware
E444xA-1DS 100 kHz to 3 GHz built-in
preamplifier
E444xA-B7J Digital demodulation hardware
E4440A-122 80 MHz bandwidth digitizer
(E4440A only, excludes H70)
E444xA-140 40 MHz bandwidth digitizer
(E4440A/43A/45A only,
excludes 122, H70)
E444xA-123 Switchable MW preselector
bypass (E4440A/43A/45A
only, excludes AYZ)
E444xA-124 Y-axis video output
E444xA-AYZ External mixing
(E4440A/46A/47A/48A only,
excludes 123)
E4440A-BAB Replaces type-N input
connector APC 3.5 connector
Amplifiers
E444xA-1DS 100 kHz to 3 GHz built-in
preamplifier
Inputs and outputs
E444xA-H70 70 MHz IF output
(excludes 122, 140)
E444xA-H26 Highband preamplifier
(requires 1DS)
Connectivity software
E444xA-230 BenchLink Web remote
control software
E444xA-233 N5530S measuring receiver
software and license
E4440A-235 Wide bandwidth digitizer
calibration wizard
Accessories
E444xA-1CM Rack mount kit
E444xA-1CN Front handle kit
E444xA-1CP Rack mount with handles
E444xA-1CR Rack slide kit
E444xA-015 6 GHz return loss measurement
accessory kit
E444xA-045 Millimeter wave accessory kit
E444xA-0B1 Extra manual set including
CD ROM
E444xA-0B0 Delete manual set
Warranty and service
Standard warranty is 36 months.
R-51B Return-to-Agilent warranty
and service plan
Calibration1
R-50C-011-3 Inclusive calibration plan,
3-year coverage
R-50C-013-3 Inclusive calibration plan and
cal data, 3-year coverage
E444xA-0BW Service manual, assembly level
E444xA-UK6 Commercial calibration
certificate with test data
N7810A PSA Series calibration
application software
Ordering Information
PSA Series spectrum analyzer
E4443A 3 Hz to 6.7 GHzE4445A 3 Hz to 13.2 GHzE4440A 3 Hz to 26.5 GHzE4447A 3 Hz to 42.98 GHzE4446A 3 Hz to 44 GHzE4448A 3 Hz to 50 GHz
Options
To add options to a product, use the following
ordering scheme:
Model E444xA (x = 0, 3, 5, 6 or 8)
Example options E4440A-B7J
E4448A-1DS
Digital demodulation hardware
E444xA-B7J Digital demodulation hardware
(required for cellular
communication measurement
personalities)
Wireless communication measurements
E444xA-BAF W-CDMA measurement
personality (requires B7J)
E444xA-210 HSDPA measurement
personality (requires B7J and
BAF)
E444xA-202 GSM w/ EDGE measurement
personality (requires B7J)
E444xA-B78 cdma2000 measurement
personality (requires B7J)
E444xA-214 1xEV-DV measurement
personality (requires B7J and
B78)
E444xA-204 1xEV-DO measurement
personality (requires B7J)
E444xA-BAC cdmaOne measurement
personality (requires B7J)
E444xA-BAE NADC, PDC measurement
personality (requires B7J)
E444xA-211 TD-SCDMA measurement
personality
E444xA-217 WLAN measurement personality
(requires 140 or 122, 123)
1. Options not available in all countries.

• WLAN Measurement Personality,Technical Overview,literature number 5989-2781EN
• NADC/PDC Measurement Personality, Technical Overview,literature number 5988-3697EN
• TD-SDCMA Measurement Personality, Technical Overview,literature number 5989-0056EN
• Agilent N5530S Measuring Receiver System, Technical Overview, literature number 5989-1113EN
• BenchLink Web Remote Control Software, Product Overview,literature number 5988-2610EN
• IntuiLink Software, Data Sheet,literature number 5980-3115EN
• Programming Code Compatibility Suite, Technical Overviewliterature number 5989-1111EN
Options• PSA Series Spectrum Analyzers Video
Output (Option 124), Technical Overview,literature number 5989-1118EN
• PSA Series Spectrum Analyzers, Option H70, 70 MHz IF Output, Product Overview,literature number 5988-5261EN
Back to basics• Optimizing Dynamic Range for Distortion
Measurements, Product Note,literature number 5980-3079EN
• PSA Series Amplitude Accuracy,Product Note,literature number 5980-3080EN
• PSA Series Swept and FFT Analysis, Product Note,literature number 5980-3081EN
• PSA Series Measurement Innovations and Benefits, Product Note, literature number 5980-3082EN
• Spectrum Analysis Basics,Application Note 150,literature number 5952-0292
• 8 Hints for Millimeter Wave Spectrum Measurements, Application Note,literature number 5988-5680EN
• Spectrum Analyzer Measurementsto 325 GHz with the Use of External Mixers, Application Note 1453,literature number 5988-9414EN
• EMI, Application Note 150-10,literature number 5968-3661E
Product LiteraturePSA in general• Selecting the Right Signal Analyzer
for Your Needs, Selection Guide,literature number 5968-3413E
• PSA Series, Brochure,literature number 5980-1283E
• PSA Series, Data Sheet,literature number 5980-1284E
• PSA Series, Configuration Guide,literature number 5989-2773EN
• Self-Guided Demonstration forSpectrum Analysis, Product Note,literature number 5988-0735EN
Wide bandwidth and vector signal analysis• 40/80 MHz Bandwidth Digitizer,
Technical Overview,literature number 5989-1115EN
• Vector Signal Analysis Basics, Application Note 150-15,literature number 5989-1121EN
• Using Extended Calibration Software for Wide Bandwidth Measurements, PSA Option 122 & 89600 VSA, Application Note 1443,literature number 5988-7814EN
• PSA Series Spectrum Analyzer Performance Guide Using 89601A Vector Signal Analysis Software, Product Note,literature number 5988-5015EN
• 89650S Wideband VSA System with High Performance Spectrum Analysis, Technical Overview,literature number 5989-0871EN
Measurement personalities and applications• Phase Noise Measurement Personality,
Technical Overview,literature number 5988-3698EN
• Noise Figure Measurement Personality, Technical Overview,literature number 5988-7884EN
• External Source Measurement Personality, Technical Overview,literature number 5989-2240EN
• Flexible Modulation Analysis Measurement Personality, Technical Overview,literature number 5989-1119EN
• W-CDMA and HSDPA Measurement Personalities, Technical Overview,literature number 5988-2388EN
• GSM with EDGE Measurement Personality, Technical Overview,literature number 5988-2389EN
• cdma2000 and 1xEV-DV Measurement Personalities, Technical Overview,literature number 5988-3694EN
• 1xEV-DO Measurement Personality, Technical Overview,literature number 5988-4828EN
• cdmaOne Measurement Personality, Technical Overview,literature number 5988-3695EN
www.agilent.com/find/emailupdatesGet the latest information on the products and applications you select.
Agilent Email Updates
Bluetooth is a trademark owned by the Bluetooth SIG, Inc.
cdma2000 is a registered certification mark of the
Telecommunications Industry Association. Used under license.
Remove all doubt
Our repair and calibration services will get
your equipment back to you, performing
like new, when promised. You will get
full value out of your Agilent equipment
throughout its lifetime. Your equipment
will be serviced by Agilent-trained techni-
cians using the latest factory calibration
procedures, automated repair diagnostics
and genuine parts. You will always have the
utmost confidence in your measurements.
Agilent offers a wide range of additional
expert test and measurement services for
your equipment, including initial start-up
assistance onsite education and training,
as well as design, system integration, and
project management.
For more information on repair and
calibration services, go to
www.agilent.com/find/removealldoubt
For more information on Agilent
Technologies’ products, applications
or services, please contact your local
Agilent office. The complete list is
available at:
www.agilent.com/find/contactus
Product specifications and descriptions
in this document subject to change
without notice.
© Agilent Technologies, Inc. 2007 - 2004
Printed in USA, January 9, 20075989-1119EN