Agilent MassHunter VistaFlux Software€¦ · INTRODUCING MASSHUNTER VISTAFLUX ... NICOLA ZAMBONI,...
8
Agilent MassHunter VistaFlux Software TRACK METABOLIC FLUX
-
Upload
duongquynh -
Category
Documents
-
view
233 -
download
0
Transcript of Agilent MassHunter VistaFlux Software€¦ · INTRODUCING MASSHUNTER VISTAFLUX ... NICOLA ZAMBONI,...

Agilent MassHunter VistaFlux Software
TRACK METABOLIC FLUX

2
Metabolic flux analysisUsing different experimental conditions, flux analysis estimates the rates of metabolic change and can highlight affected pathways. Changes in flux are the result of either differences in the amount of enzyme present or activity of the enzyme. In addition, flux analysis can expose unexpected shunts between metabolites in well-studied pathways.
Qualitative flux analysisWhile there are many approaches for quantitative metabolic flux analysis, they all require hours of expert work (through many experiments and iterations) to refine the model and return a result. Qualitative flux analysis, on the other hand, allows you to quickly obtain information about selected pathways and fluxes without the challenging task of constructing quantitative models.
Qualitative flux analysis traces isotopologues and targets specific pathways of interest by acquiring data on a mass spectrometer. By mining the data for pathway-targeted metabolites and incorporating stable isotope labeling, you’ll be able to follow metabolic fluxes—then use graphical tools to visualize the results.
However, the state of the art in qualitative flux analysis still requires practitioners to deal with several challenges:
ACQUIRE generating LC/MS data with high mass-accuracy and isotopic fidelity
EXTRACT mining target metabolites ions, including stable isotope labeled ions (isotopologues)
VISUALIZE viewing and sharing results on pathways to accelerate biological interpretation

3
INTRODUCING MASSHUNTER VISTAFLUX
MassHunter VistaFlux software is designed to meet the challenges of qualitative flux analysis. Using both static and animated pathway visualizations, it enables you to easily interpret and explain the results of the experiments you conduct using Agilent time-of-flight and quadrupole time-of-flight LC/MS systems.
VistaFlux easily finds targeted metabolites containing stable isotope labeled data, and displays results using advanced pathway visualization software. In addition, it exports figures for presentations and generates reports, making the complete workflow easy and fast.
VistaFlux workflow
“Qualitative flux analysis elevates metabolic studies to a different level. While metabolomics reports on the molecular composition of a cell, flux analysis reveals in vivo pathway activity. Fluxes are not readily predictable from proteome and metabolome data. Assessing fluxes by stable isotopic tracers is a powerful approach to study the metabolic network in motion.”
NICOLA ZAMBONI, PhD, INSTITUTE FOR MOLECULAR SYSTEMS BIOLOGY, ETH ZURICH
Extract Isotopologues
Visualize on Pathways
Acquire Data
Create Target Result Results
4
DATA MINING DESIGNED FOR QUALITATIVE FLUX ANALYSIS
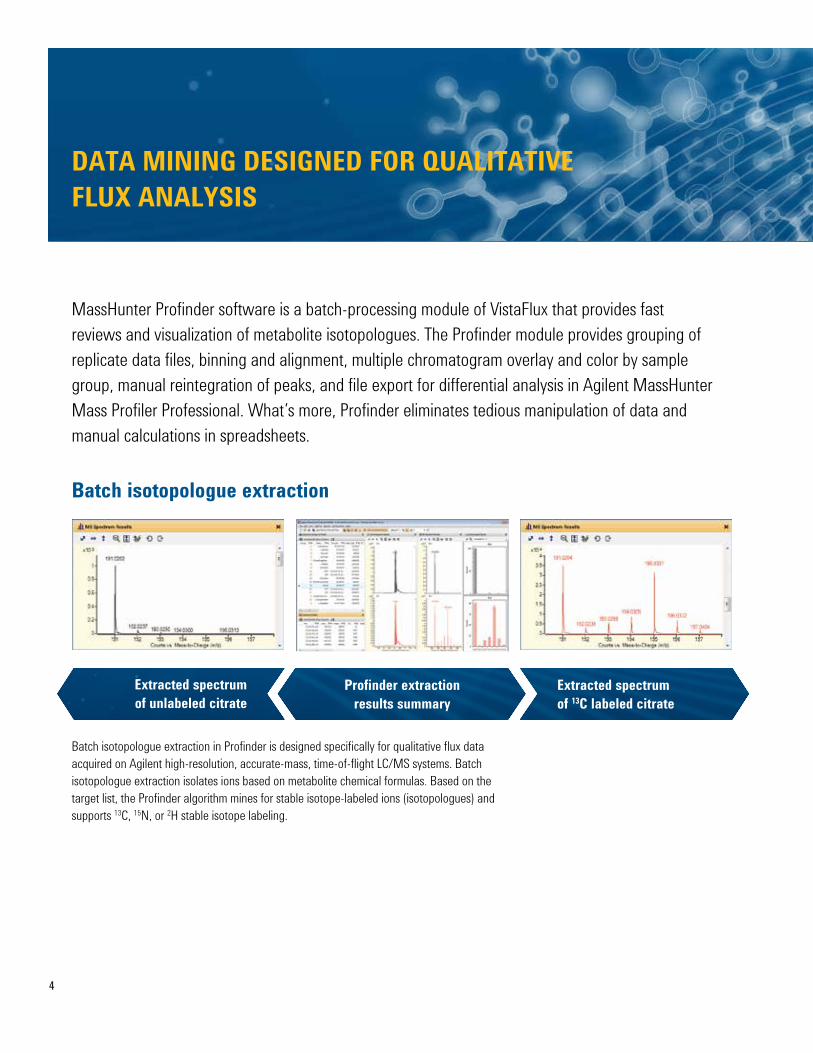
MassHunter Profinder software is a batch-processing module of VistaFlux that provides fast reviews and visualization of metabolite isotopologues. The Profinder module provides grouping of replicate data files, binning and alignment, multiple chromatogram overlay and color by sample group, manual reintegration of peaks, and file export for differential analysis in Agilent MassHunter Mass Profiler Professional. What’s more, Profinder eliminates tedious manipulation of data and manual calculations in spreadsheets.
Batch isotopologue extraction in Profinder is designed specifically for qualitative flux data acquired on Agilent high-resolution, accurate-mass, time-of-flight LC/MS systems. Batch isotopologue extraction isolates ions based on metabolite chemical formulas. Based on the target list, the Profinder algorithm mines for stable isotope-labeled ions (isotopologues) and supports 13C, 15N, or 2H stable isotope labeling.
Batch isotopologue extraction
Extracted spectrum of 13C labeled citrate
Profinder extraction results summary
Extracted spectrum of unlabeled citrate

5
Effortless Visualization
Omix PremiumMassHunter Profinder
PATHWAY VISUALIZATION FOR FLUX ANALYSIS
Results from Profinder flow into Omix Premium, another module of VistaFlux, for effortless visualization of metabolic fluxes. Omix Premium enables you to:
• Interactively visualize flux data on pathway maps.
• Animate metabolic flux through pathways for time-course studies.
• Easily leverage publicly available pathway databases such as KEGG and BioCyc.
• Customize and connect metabolic pathways.
• Tailor the visualization to display different information on pathway diagrams.
• Export figures and animations for publication and presentations.
“Flux analysis and visualization give researchers the opportunity to mine protein activity. This is what metabolomics is all about. Qualitative flux is a huge leap forward to discover protein activity.”
ANDERS NORDSTRÖM, PhD, DEPARTMENT OF MOLECULAR BIOLOGY, UMEÅ UNIVERSITY
6
Labeling Incorporation2-oxoglutarate
Labeling IncorporationTotal Abundance
0% 30% 60% 100% O-
O O
O
O-
+0 +1 +2 +3 +4 +5
0 hr0.5 hr
1 hr3 hr8 hr
0 hr0.5 hr
1 hr3 hr8 hr
****
****2-oxoglutarate
2-oxoglutarate
Labeling Incorporation2-oxoglutarate
Labeling IncorporationTotal Abundance
0% 30% 60% 100% O-
O O
O
O-
+0 +1 +2 +3 +4 +5
0 hr0.5 hr
1 hr3 hr8 hr
0 hr0.5 hr
1 hr3 hr8 hr
****
****2-oxoglutarate
2-oxoglutarate
Labeling Incorporation2-oxoglutarate
Labeling IncorporationTotal Abundance
0% 30% 60% 100% O-
O O
O
O-
+0 +1 +2 +3 +4 +5
0 hr0.5 hr
1 hr3 hr8 hr
0 hr0.5 hr
1 hr3 hr8 hr
****
****2-oxoglutarate
2-oxoglutarate
Labeling Incorporation2-oxoglutarate
Labeling IncorporationTotal Abundance
0% 30% 60% 100% O-
O O
O
O-
+0 +1 +2 +3 +4 +5
0 hr0.5 hr
1 hr3 hr8 hr
0 hr0.5 hr
1 hr3 hr8 hr
****
****2-oxoglutarate
2-oxoglutarate
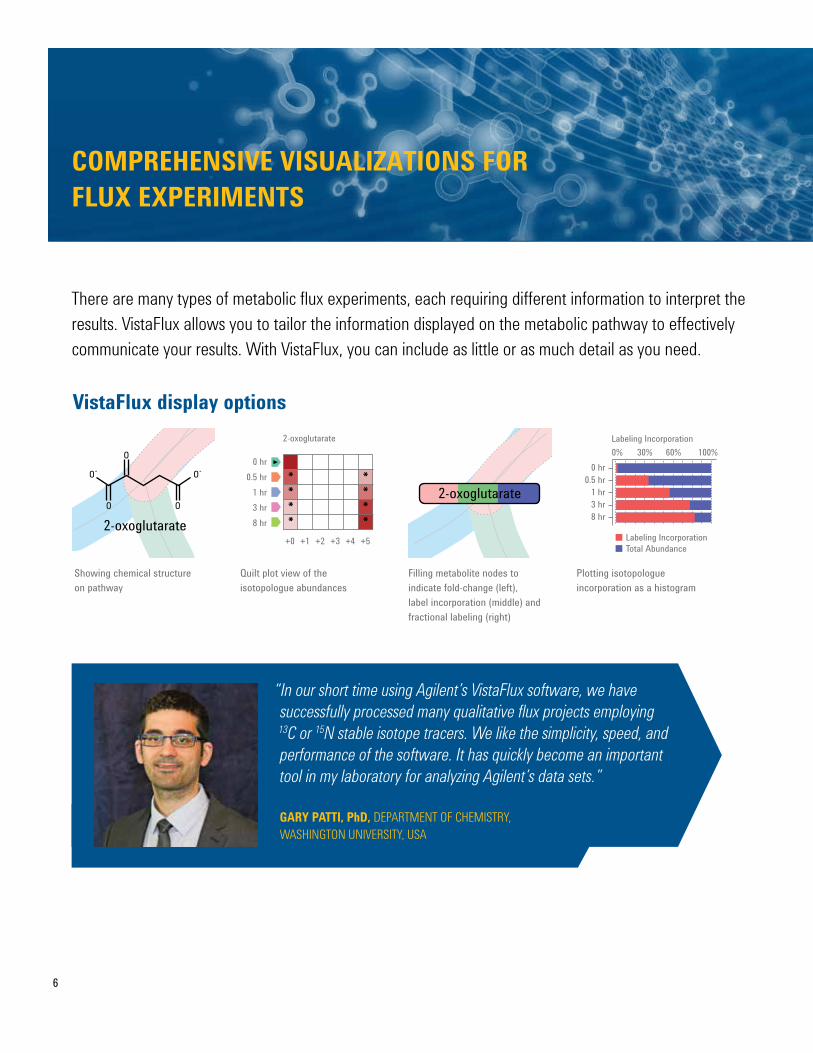
VistaFlux display options
COMPREHENSIVE VISUALIZATIONS FOR FLUX EXPERIMENTS
There are many types of metabolic flux experiments, each requiring different information to interpret the results. VistaFlux allows you to tailor the information displayed on the metabolic pathway to effectively communicate your results. With VistaFlux, you can include as little or as much detail as you need.
“In our short time using Agilent’s VistaFlux software, we have successfully processed many qualitative flux projects employing 13C or 15N stable isotope tracers. We like the simplicity, speed, and performance of the software. It has quickly become an important tool in my laboratory for analyzing Agilent’s data sets.”
GARY PATTI, PhD, DEPARTMENT OF CHEMISTRY, WASHINGTON UNIVERSITY, USA
Quilt plot view of the isotopologue abundances
Filling metabolite nodes to indicate fold-change (left), label incorporation (middle) and fractional labeling (right)
Plotting isotopologue incorporation as a histogram
Showing chemical structure on pathway

7
VISUALIZATIONS AS VIBRANT AS YOUR DATA
Dynamic visualizations
Metabolism is in constant flux, and time-course studies attempt to capture this fluidity. In addition to static images, the Omix Premium module provides dynamic visualizations that make time-course results easier to interpret. You can share these animations as movie files or embed them into presentations.
VistaFlux transforms your metabolomics research by reducing the difficulty of stable isotope labeling. The software converts a time-consuming, labor-intensive process into a powerful qualitative flux workflow, including metabolite isotopologue extraction and pathway visualization.
In short, VistaFlux lowers the barriers to doing qualitative metabolic flux experiments to increase your biological understanding.
0.5 hour
3 hour
1 hour
8 hour
Omix Premium supports easy visualization of time-course studies with step, play or record modes. The figure above shows the flux at 0.5, 1, 3, and 8-hour time points (from upper left to bottom right) for 2-oxoglutarate and 2-hydroxyglutarate.

Learn morewww.agilent.com/chem/vistaflux
Find an Agilent customer center in your country www.agilent.com/chem/contactus
U.S. and Canada 1-800-227-9770 [email protected]
Europe [email protected]
Asia Pacific [email protected]
India [email protected]
For Research Use Only. Not for use in diagnostic procedures.This information is subject to change without notice.
© Agilent Technologies, Inc., 2016Published in the USA, September 9, 2016 5991-7341EN