NOMA for Energy-Efficient LiFi-Enabled Bidirectional IoT ...

IADIS International Journal on WWW/Internet
Vol. 16, No. 1, pp. 1-25 ISSN: 1645-7641
1
AGILE USER-CENTERED DESIGN
OF AN IOT-ENABLED GAMIFIED
INTERVENTION FOR ENERGY CONSERVATION
AT THE WORKPLACE
Dimosthenis Kotsopoulos1, Cleopatra Bardaki
1, Thanasis G. Papaioannou
2,
Stavros Lounis1 and Katerina Pramatari
1
1ELTRUN e-Business Research Center, Department of Management Science and Technology, Athens University of Economics and Business, Athens, Greece 2Services, Technologies and Economics (STEcon) Laboratory, Department of Computer Science, Athens
University of Economics and Business, Athens, Greece
ABSTRACT
Energy conservation in workplace environments is recognized as both important and impactful towards reducing worldwide CO2 emissions and protecting the environment. However, the focus of existing research has not primarily been on the employees’ energy consumption behavior, albeit its potential impact on workplace energy efficiency. Aiming to affect employee energy behavior change towards
more conscious consumption patterns, we have adopted gamification, a contemporary instrument that, when carefully utilized can lead to employee behavior change. Furthermore, we have followed an Iterative & Incremental Agile User Centered Design (UCD) approach towards designing a gamified IoT-enabled mobile app that provides energy consumption-related feedback to employees at their workplace. We present the characteristics of the designed app, as well as explain the rationale behind their choice. Usability results derived from employees in 3 workplaces at 3 different EU countries indicate that through our approach we designed a prototype gamified solution very well perceived and engaging to our target audience, scoring high in both usability, as well as user experience aspects. We further enhanced the app with additional functionality, according to the test users’ feedback, towards
producing the first integrated version. Initial results from testing this revised first integrated version of the app, revealed even more enhanced usability and user experience results, compared to the previous version. Overall, our derived evidence suggests that, by following an Iterative & Incremental Agile UCD approach within our field of application, we have derived a gamified app for energy-saving at the workplace that is conceived of as highly usable and provides for a positive user experience.
KEYWORDS
Gamification, Energy Conservation, Employee Motivation, Workplace, UCD, Agile, Incentives

IADIS International Journal on WWW/Internet
2
1. INTRODUCTION
Energy production has more than doubled worldwide since the early 1970s, along with CO2
emissions (IEA, 2017). At the same time, buildings consume 20% of the total delivered energy
worldwide (Lülfs & Hahn, 2013) and are responsible for 40% of the energy consumption, as
well as 36% of CO2 emissions in the EU, 1/3 of which attributable to non-residential buildings
(European Commission, 2017). Consequently, the need to boost energy efficiency in buildings
has been stressed through the Paris Agreement on climate change and the Montreal Protocol
on ozone depletion, as a means to achieve broader environmental protection goals (UN News Centre, 2016; IEA EEfD, 2017). Electricity is the preferred energy source in the commercial
sector, estimated to account for 62% of the global energy demand by 2040 (Conti et al., 2016).
Moreover, energy efficiency in companies can also lead to improvements in worker comfort,
product quality and productivity, as well as reductions in maintenance cost, risk, production
time and waste (IEA EEfD, 2017). The largest potential savings are in heating, cooling and
lighting, which together represented more than 60% of the energy demand in buildings in
2015 (IEA Digitalization & Energy Working Group, 2017; Conti et al., 2016).
With digital technologies rapidly changing, questions arise about how technology,
behavior and policy will evolve over time and how they will impact energy systems in the
future (IEA Digitalization & Energy Working Group, 2017). The growing application of ICT
in energy systems enable real-time data provision that could lead to up to 10% energy savings
in buildings by 2040 (IEA Digitalization & Energy Working Group, 2017). Furthermore, with technological innovation creating new opportunities for energy efficiency and digitalization
increasingly becoming impactful on the energy sector (IEA EEfD, 2017), the total public
energy R&D budget in IEA countries has more than quadrupled, from 4% to 21% since the
1970s (IEA Energy Data Centre, 2017).
Further to technological means, the behavior of buildings’ occupants has been studied
from a wide range of disciplinary perspectives since the oil shocks of the 1970s (Stephenson et
al., 2010). It is an important factor in the consumption of energy that should be considered
alongside the deployment of technological improvements to reduce energy consumption
(Delmas et al., 2013), as it can add – or save – a third to a building’s designed energy
performance (Nguyen & Aiello, 2013). Employee behavior in specific can significantly affect
the successfulness of technology-based energy efficiency interventions (Lutzenhiser, 1993; Lo et al., 2012). Moreover, each employee consumed more than 5.600 kWh on average, in 2015,
in the EU (ODYSSEE, 2015). However, limited literature exists on the role of occupant
behavior, the behavioral aspects of energy conservation at work (Scherbaum et al., 2008),
employee energy use at an individual behavioral level of analysis (Bansal & Gao, 2006), as
well as how organizational context affects employee energy-saving behavior (Lo et al., 2012).
Overall, a limited number of studies on energy conservation in workplaces are available,
compared to households, with few examining energy consumption behavior at the individual
employee level, none of which including inter-organisational comparisons (Lo et al., 2012).
Altruistic motives (supporting the organisation in energy & monetary savings, contributing to
environmental protection, complying with peer expectations, etc.) have been found to be more
salient towards engaging employees to conserve energy at the workplace, since no personal monetary gains are normally expected (Matthies et al., 2011). Therefore, promising means
include educating employees in energy conservation, altering organisational procedures and
norms, and utilising feedback to increase employees’ awareness of their own behaviour and

AGILE USER-CENTERED DESIGN OF AN IOT-ENABLED GAMIFIED INTERVENTION FOR
ENERGY CONSERVATION AT THE WORKPLACE
3
its consequences (Lo et al., 2012). Behavioural interventions employing feedback have led to
5-15% in energy savings via direct and 0-10% via indirect feedback (Darby, 2006) with
tailored feedback more effective towards energy behaviour change (Matthies et al., 2011). At
the same time, according to a meta-analysis of energy conservation experiments conducted between 1975-2012, revealed that the use of feedback led to 7.4% reductions on average,
while, in contrast, monetary incentives to an increase in energy usage (Delmas et al., 2013).
Gamification is defined as “the use of game design elements in non-game contexts”
(Deterding et al., 2011). It is “a relatively new instrument in the orchestra of motivation”
(Kotsopoulos et al., 2016) that can lead to behavioural change, break existing habits and
update them with new ones by utilising positive emotional feedback and continuously setting
appropriate stimuli (Blohm & Leimeister, 2013). Moreover, it can be used to increase
employee participation, improve performance and compliance in specific goals (Seaborn &
Fels, 2015), enhance employee satisfaction (Robson et al., 2015), as well as turn traditional
organizational processes into fun, game-like, experiences (Robson et al., 2014), leading to
behavioural change, increased and sustained employee motivation, engagement and productivity within an enterprise (Webb, 2013; Pickard, 2015). Examples of organizations
using gamification at the workplace include the U.K.’s Department for Work and Pensions
(Burke, 2014), Deloitte (Huang & Soman, 2013) and IBM (Erenli, 2013). More importantly,
gamification has been employed to increase occupants’ motivation for energy conservation
and promote real-world energy saving behaviours (Reeves et al., 2012; Knol & De Vries,
2011; Brewer et al., 2013; Geelen et al., 2012; Orland et al., 2014; Bourazeri & Pitt, 2013),
with energy savings in the range of 3-6% recorded and more than 10% achievable, as reported
in a comprehensive review of relevant published studies (Grossberg et al., 2015). Furthermore,
examples of energy efficiency games deployed in workplace environments include “Cool
Choices”, “WeSpire”, “Ecoinomy” and “Carbon4Square” (Grossberg et al., 2015) – WeSpire
has led to >5 million positive actions in 45 countries (WeSpire, 2017), while Cool Choices has
helped over seven thousand employees, in organizations across multiple industries, to increase their energy savings through almost 260.000 energy saving actions (Cool Choices, 2017).
Inspired by the above mentioned facts, we decided to design an IoT-enabled gamified
mobile application that will motivate employees towards energy conservation at the
workplace. We adopted an agile user centered design (UCD) approach to ensure that the app
will be appealing to its potential users and, thus, increase the possibilities of using it as part of
their daily routine. We elicited users’ requirements from three different workplaces in
different EU countries: a museum in Luxembourg, a public agency in Spain and a municipal
service in Greece, utilizing physical observation of their work life and energy usage habits, as
well as interviews to gather more detailed information on their energy and game requirements.
We also performed a survey to select the game’s theme - “persona”. Finally, after designing
the first game prototype, we performed a validation study with potential users. The collected feedback guided the choice of game alterations needed, in order to build an improved game
that more closely fits the users’ needs and desires. In brief, this paper can support future
designers of gamified apps for energy conservation in their efforts to explore their potential
users’ requirements and translate them to proper game characteristics and functionalities.
Next, we present related literature, briefly discuss our findings from the user requirements
analysis we conducted and present the design characteristics of our gamified approach towards
conserving energy at the workplace through IoT-enabled gamification. Ultimately, we
illustrate design guidelines for a personalised gamified application that dynamically provides
feedback to employees towards saving energy at work, based on informed design choices.

IADIS International Journal on WWW/Internet
4
2. BACKGROUND
The effectiveness of gamification relies on leveraging the psychology of motivation to
encourage players to play (Ashridge, 2014). Furthermore, in a utilitarian setting, engagement
by gamification can depend on the motivations of users and the nature of the gamified system
(Hamari et al., 2014). Therefore, understanding the individuals that are involved in a gamified
experience is fundamental (Robson et al., 2015) and gamification must be designed to match
its target users’ individual characteristics and preferences, towards increasing motivation for
specific behaviours (Uskov & Sekar, 2015; Werbach & Hunter, 2012). Towards that end, a user-centered approach should be followed in the design of gamified systems, focusing on the
end-users’ needs and desires (Seaborn & Fels, 2015).
2.1 User Centered Design in Games
A number of design frameworks have been proposed to guide the introduction of gamification in various non-game contexts. 18 different design processes across different categories were
described in a recent literature review on gamification design frameworks (Mora et al., 2015).
Existing frameworks include (a) high-level industry-proposed, that describe the process, such
as “Six Steps to Gamification” (Werbach & Hunter, 2012), “Meaningful Gamification”
(Nicholson, 2012), “GAME” (Marczewski, 2012), and “Octalysis” (Chou, 2012), as well as
(b) academy-proposed for the design and research of gamified information systems (Liu et al.,
2017) and, more recently, (c) detailed methods for engineering gamified software
(Morschheuser et al., 2018). However, each framework bears both benefits and shortcomings,
and no general consensus on their specific and contextually dependent suitability.
Creating a game that establishes immediate and continued motivation to continue playing
over long periods of time is admittedly a very complex issue. The practice of creating
engaging, efficient user experiences is called User-Centered Design (UCD) and it entails taking the user into account during product development (Garrett, 2011). Furthermore, it is a
design approach, widely considered the key to product usefulness and usability, based on the
active involvement of users towards improving the understanding of user and task
requirements (Mao et al., 2005). More importantly, UCD methods have been employed by
commercial game companies, such as Ubisoft Entertainment, Electronic Arts and Microsoft, to
make their products more pleasurable and enjoyable (Pagulayan et al., 2002). Employing UCD
in gamification has been noted as so important that, “meaningful gamification” is defined as
“the integration of user-centered game design elements into non-game contexts” (Nicholson,
2012). In organizational settings it entails putting the needs and goals of the users over the
needs of the organization, and is expected to result in longer-term and deeper engagement
between participants, non-game activities, and supporting organizations (Nicholson, 2012). User Centered Design as an iterative process on how to design gamified systems has been
proposed as a way to obtain a thorough understanding of the potential users and their
requirements in gamification. Player-centered design (Kumar & Herger, 2013) reflects UCD
in the design of games. It has been introduced in the context analysis phase
(Marache-Francisco & Brangier, 2013), as well as an approach to design gamified services
(Kumar & Herger, 2013; Werbach & Hunter, 2012). Furthermore, elements of the UCD
approach have been utilized towards eliciting users’ needs, to design gamified systems in
non-game contexts such as e-Government (Dargan & Evequoz, 2015) and e-banking
AGILE USER-CENTERED DESIGN OF AN IOT-ENABLED GAMIFIED INTERVENTION FOR
ENERGY CONSERVATION AT THE WORKPLACE
5
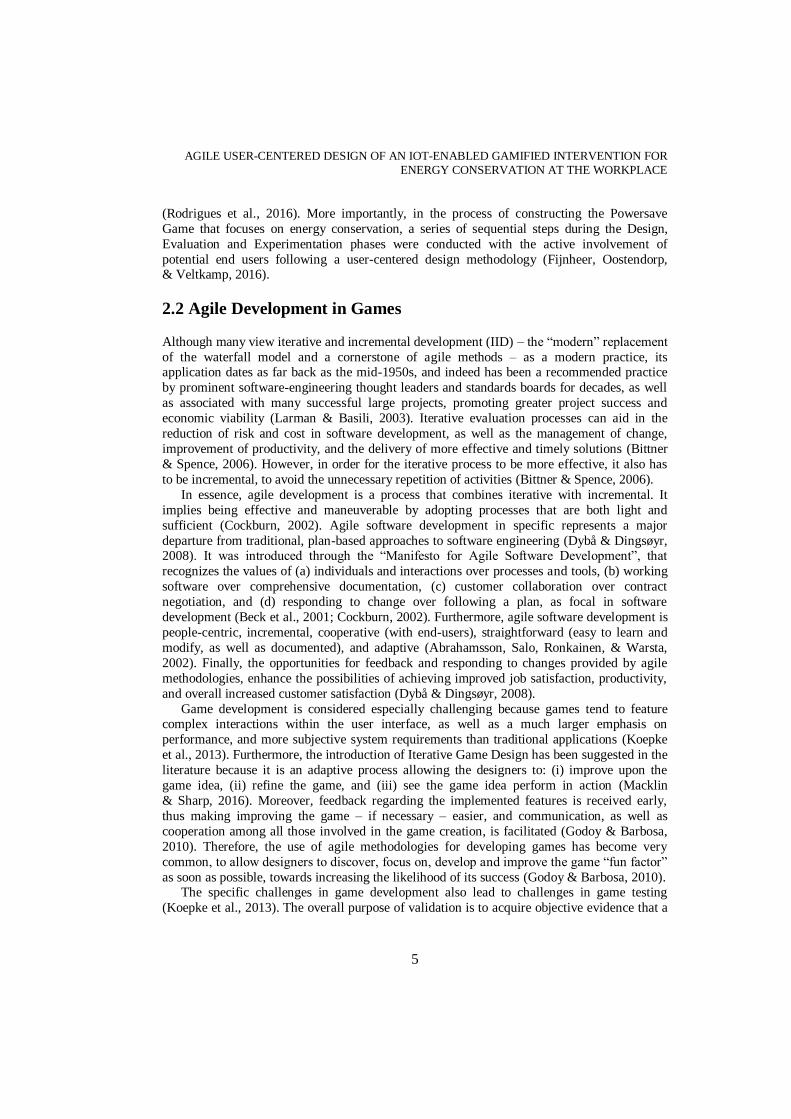
(Rodrigues et al., 2016). More importantly, in the process of constructing the Powersave
Game that focuses on energy conservation, a series of sequential steps during the Design,
Evaluation and Experimentation phases were conducted with the active involvement of
potential end users following a user-centered design methodology (Fijnheer, Oostendorp, & Veltkamp, 2016).
2.2 Agile Development in Games
Although many view iterative and incremental development (IID) – the “modern” replacement
of the waterfall model and a cornerstone of agile methods – as a modern practice, its application dates as far back as the mid-1950s, and indeed has been a recommended practice
by prominent software-engineering thought leaders and standards boards for decades, as well
as associated with many successful large projects, promoting greater project success and
economic viability (Larman & Basili, 2003). Iterative evaluation processes can aid in the
reduction of risk and cost in software development, as well as the management of change,
improvement of productivity, and the delivery of more effective and timely solutions (Bittner
& Spence, 2006). However, in order for the iterative process to be more effective, it also has
to be incremental, to avoid the unnecessary repetition of activities (Bittner & Spence, 2006).
In essence, agile development is a process that combines iterative with incremental. It
implies being effective and maneuverable by adopting processes that are both light and
sufficient (Cockburn, 2002). Agile software development in specific represents a major
departure from traditional, plan-based approaches to software engineering (Dybå & Dingsøyr, 2008). It was introduced through the “Manifesto for Agile Software Development”, that
recognizes the values of (a) individuals and interactions over processes and tools, (b) working
software over comprehensive documentation, (c) customer collaboration over contract
negotiation, and (d) responding to change over following a plan, as focal in software
development (Beck et al., 2001; Cockburn, 2002). Furthermore, agile software development is
people-centric, incremental, cooperative (with end-users), straightforward (easy to learn and
modify, as well as documented), and adaptive (Abrahamsson, Salo, Ronkainen, & Warsta,
2002). Finally, the opportunities for feedback and responding to changes provided by agile
methodologies, enhance the possibilities of achieving improved job satisfaction, productivity,
and overall increased customer satisfaction (Dybå & Dingsøyr, 2008).
Game development is considered especially challenging because games tend to feature complex interactions within the user interface, as well as a much larger emphasis on
performance, and more subjective system requirements than traditional applications (Koepke
et al., 2013). Furthermore, the introduction of Iterative Game Design has been suggested in the
literature because it is an adaptive process allowing the designers to: (i) improve upon the
game idea, (ii) refine the game, and (iii) see the game idea perform in action (Macklin
& Sharp, 2016). Moreover, feedback regarding the implemented features is received early,
thus making improving the game – if necessary – easier, and communication, as well as
cooperation among all those involved in the game creation, is facilitated (Godoy & Barbosa,
2010). Therefore, the use of agile methodologies for developing games has become very
common, to allow designers to discover, focus on, develop and improve the game “fun factor”
as soon as possible, towards increasing the likelihood of its success (Godoy & Barbosa, 2010). The specific challenges in game development also lead to challenges in game testing
(Koepke et al., 2013). The overall purpose of validation is to acquire objective evidence that a

IADIS International Journal on WWW/Internet
6
system fulfills its business or mission objectives, according to its stakeholders’ requirements,
and achieves its intended use in its intended operational environment (ISO, 2015). At the same
time, the role of iterative usability evaluation during agile game development in specific has
been identified and analyzed in the literature (Ma, Lu, & Saparova, 2014). Based on the abovementioned facts, we follow an iterative design and evaluation process
that allows us to design and improve our game through successive iterative loops and includes
the following iterative steps (Macklin & Sharp, 2016): (i) Conceptualize – develop an idea for
the game and its play experience, (ii) Prototype - produce a playable form of the game,
(iii) Playtest - allow real participants to engage with the game and record their experience,
(iv) Evaluate - Review the results of the playtest to better understand and strengthen the
game’s design. The main focus of the evaluation has been on functionality and usability
during the pre-release phase, whilst in contrast the main focus in the post-release phase shall
be on the participants’ energy behavior change, as well as actual energy savings observed.
Our practical approach is presented in the following sections. Overall, to design an
energy-behavior change solution that focuses on our end-users’ needs at the workplace, we followed an incremental and an iterative and agile UCD design and evaluation approach to
develop our solution. The first steps of the process were followed sequentially, to derive the
initial insight we needed to formulate the basic design and use-case scenarios: (a) on-site visits
to the pilot sites (where we assessed e.g. the energy consumption behavior, existing
energy-saving opportunities), (b) on-site interviews (e.g. basic needs and preferences of
employees), and (c) game concept selection survey (the game theme - “persona”). During the
development phase, we follow an iterative agile approach, in order to develop sequential,
continuously enhanced versions of the product, according to end-user feedback. Our approach
is explained further and in more detail in the following sections and summarized in the
discussion of the paper.
3. ENERGY AND GAME REQUIREMENTS ANALYSIS
3.1 Approach
We adopted a multi step process to elicit the requirements of employees, adhering to an Agile
UCD approach to design our solution:
(i) As a first step, we visited our prospective users’ work environments, to observe their
everyday work routines and the extant opportunities for energy-saving therein. We examined
the electrical infrastructure and devices, as well as their impact on energy consumption, and
parameters that may affect future gameplay scenarios. Additionally, the daily work schedule
and work characteristics (i.e. sedentary / on the move / in front of PC) of the employees were
recorded. The working hours in each facility were noted, so as to derive when the gamified app should be providing content to the end users. Furthermore, we surveyed building
characteristics that are relevant to our application, such as the orientation of each office space
relative to the sun (to derive lighting conditions throughout the day and prepare appropriate
lighting feedback). We also noted shared electrical equipment (printers, coffee makers, etc.)
and shared spaces vs. individually used offices. As per the electrical infrastructure, a thorough
survey was conducted, to record the characteristics of the facility, in order to prepare the
deployment of IoT infrastructure to monitor energy consumption on a near-personal basis.

AGILE USER-CENTERED DESIGN OF AN IOT-ENABLED GAMIFIED INTERVENTION FOR
ENERGY CONSERVATION AT THE WORKPLACE
7
(ii) Having concluded our survey of the premises, we proceeded to interview a
representative sample (>10% of the employees at each workspace), towards eliciting personal
needs and preferences in a game that would be designed to motivate them to conserve energy
at work. We kept notes during the interview process, covering aspects of the employees’ preferences and preconditions for participating in our energy saving initiative. Furthermore,
we explored their personal conception of their daily schedule, how they conducted their work,
as well as energy-saving opportunities that existed within their work environment. We
delineate our findings from steps (i) and (ii) briefly in section 3.2., while a more detailed
account can be found in (Kotsopoulos et al., 2017; Lounis et al., 2017).
(iii) Finally, we conducted a survey to select the theme / “persona” of the designed app.
The survey process and results are presented in more detail in section 3.3.
3.2 Energy-Saving Opportunities and Gameplay Insight
Consistent with existing literature (Nguyen & Aiello, 2013), the main opportunities for energy
saving in our pilot sites, as identified both through interviews, as well as on-site visits, were
turning a number of different personal and collectively used devices off when leaving or away
from the office, using the stairs instead of the elevator, and operating A/Cs, as well as kitchen
equipment optimally. A more detailed account of our findings can be found in Table 1(I). We
translated these opportunities into corresponding in-game challenges and packaged them into
fixed timeframe bundles, as described in the next sections, to further support long-term game
use and engagement, as well as increase energy-saving motivation. As per the app design itself, we found that a team-based game scenario featuring both personal and collective
actions, as well as a fair distribution of in-game incentives is desirable. A more detailed
account of the collected insight on Gameplay can also be found in Table 1 (II).
Table 1. Energy-Saving Opportunities & Gameplay Insight – recorded via on-site visits and interviews
I. Energy-Saving Opportunities
Personal a. Turn PC off when leaving work, or away (e.g. lunch, meetings, on-site technical visits) b. Use the stairs instead of the elevator when ascending / descending floors at work
Collective
c. Operate thermostat efficiently, to keep indoor temperature within suggested optimal levels d. Make sure that windows are kept closed while rooms are heated or cooled/air-conditioned e. Turn lights off when leaving room or ambient light suffices (near windows on sunny day) f. Turn printer off while not in use
g. Turning lights off in commonly used areas, when they are vacant or during afterhours h. Operating kitchen area equipment in an energy efficient way (e.g. kettle, coffee maker)
II. Gameplay Insight
General i. Few of the employees play games – a basic game play should be preferred
Teamplay a. The majority (61.5%) opted for a team-based game scenario
b. Both personal and collective actions, individual and team play should be available
Incentives j. The majority (65%) believed that rewards are not necessary for being energy efficient c. Incentives should be allocated on – and be proportionate to – actions that can be validated d. In team game, incentives should be allocated according to individual players’ contribution

IADIS International Journal on WWW/Internet
8
3.3 Game Concept and Persona
In order to make the appearance and theme of the designed gamified app appealing to its target
audience, we conducted a survey with selected participants from our pilot sites, as well as
additional employees from other workplaces. The survey participants were presented with a
welcome message that explained the aim of the questionnaire and the project as a whole.
Afterwards, they were asked to provide an account of their feelings towards three different
game concepts: (a) a Tree, (b) an Iceberg and (c) a Plain Informative Graph app. The three
concepts were illustrated by different wireframes of the mobile app screen. Additionally, a scenario to have in mind while assessing the different concepts was described, followed by a
short passage explaining that the personas grew and/or were enriched with appropriate vivid
elements when the energy efficient action of “remembering to turn off the lights when leaving
the office to go home for Thursday” was performed and the related challenge was won.
Attitude & Intention: After reviewing each of the three versions’ “personas” wireframes
with this usage scenario in mind, the participants were asked to provide their feedback on
7-point Likert questions covering two axes: (i) Attitude was assessed by answering on three
facets of the question “In the concept described how would you describe your feelings towards
participating in the game?” {(Good Bad), (Pleasant Unpleasant),
(Favorable Unfavorable)}. These items were in line with the Theory of Planned Behavior
(TPB), according to existing guidelines (Ajzen, 2010) and as implemented in literature
covering attitude toward the ad (MacKenzie, Lutz, & Belch, 1986), consumer products (Spears & Singh, 2004), collaborative consumption (Roos & Hahn, 2017), and self-assessed
experience (Diener et al., 2010). An average score for the three items was calculated. Scores
between 1 to 3 were considered as a positive, 4 neutral and 5 to 7 as a negative indication of
attitude towards the three different game designs. (ii) Intention was assessed by answering on
two facets of the question “In the concept described, would you intend to participate in the
game?” {(Likely Unlikely), (Possible Impossible)}. These items were also in line with
the Theory of Planned Behavior (TPB), according to existing guidelines (Ajzen, 2010) and as
implemented in literature covering intention to consume based on advertisement (MacKenzie
et al., 1986), purchase intentions (Spears & Singh, 2004), and collaborative consumption
intention (Roos & Hahn, 2017). An average score for the two items was calculated. Scores
between 1 to 3 were considered as a positive, 4 neutral and 5 to 7 as a negative indication of intention to participate in a game that would feature the three different game designs.
Overall Favorite Concept – Persona: Having reviewed all three concepts, namely the
Tree, Iceberg and Graph, the participants were also provided with a screen that offered a recap
of the three personas and, consequently, were asked to state their overall favorite out of the
three game concepts / personas. We collected a total of 141 completed questionnaires (38 from
within our pilot sites and 103 from other workplaces). The results from the analysis of the
survey for the two groups of participants can be found on Table 2.
AGILE USER-CENTERED DESIGN OF AN IOT-ENABLED GAMIFIED INTERVENTION FOR
ENERGY CONSERVATION AT THE WORKPLACE
9
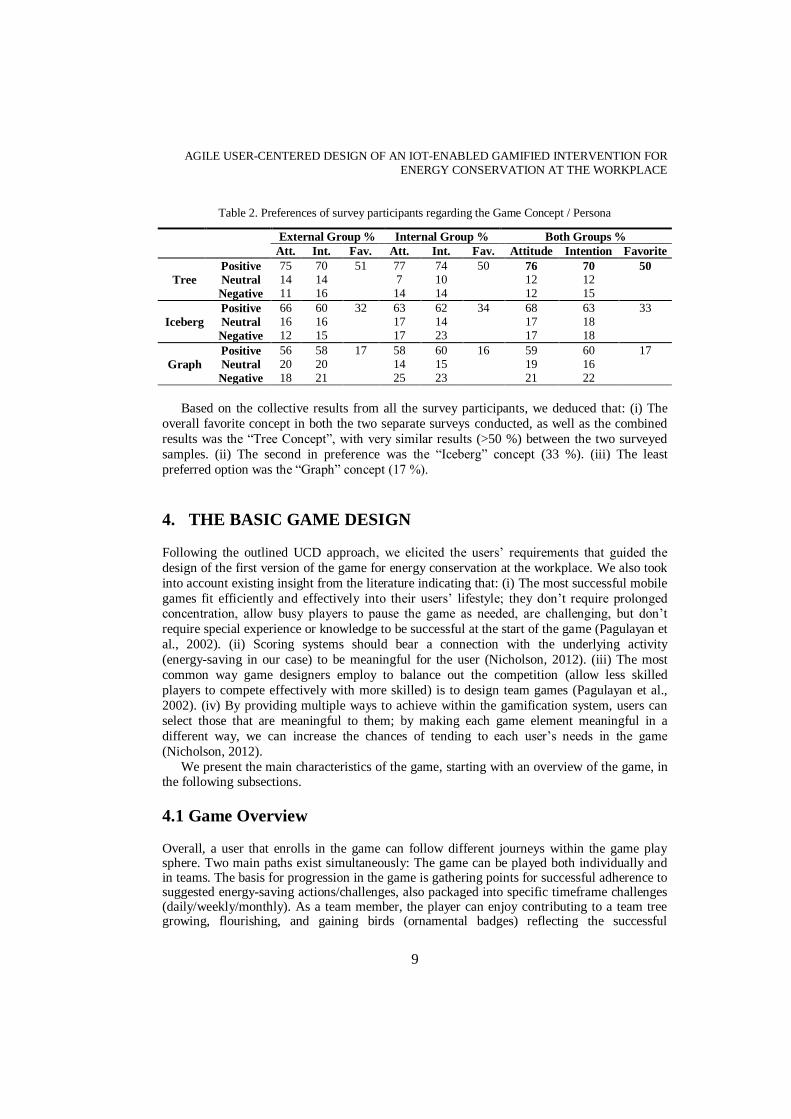
Table 2. Preferences of survey participants regarding the Game Concept / Persona
External Group % Internal Group % Both Groups %
Att. Int. Fav. Att. Int. Fav. Attitude Intention Favorite
Tree
Positive 75 70 51 77 74 50 76 70 50
Neutral 14 14 7 10 12 12
Negative 11 16 14 14 12 15
Iceberg
Positive 66 60 32 63 62 34 68 63 33
Neutral 16 16 17 14 17 18
Negative 12 15 17 23 17 18
Graph
Positive 56 58 17 58 60 16 59 60 17
Neutral 20 20 14 15 19 16
Negative 18 21 25 23 21 22
Based on the collective results from all the survey participants, we deduced that: (i) The
overall favorite concept in both the two separate surveys conducted, as well as the combined
results was the “Tree Concept”, with very similar results (>50 %) between the two surveyed
samples. (ii) The second in preference was the “Iceberg” concept (33 %). (iii) The least
preferred option was the “Graph” concept (17 %).
4. THE BASIC GAME DESIGN
Following the outlined UCD approach, we elicited the users’ requirements that guided the
design of the first version of the game for energy conservation at the workplace. We also took
into account existing insight from the literature indicating that: (i) The most successful mobile
games fit efficiently and effectively into their users’ lifestyle; they don’t require prolonged concentration, allow busy players to pause the game as needed, are challenging, but don’t
require special experience or knowledge to be successful at the start of the game (Pagulayan et
al., 2002). (ii) Scoring systems should bear a connection with the underlying activity
(energy-saving in our case) to be meaningful for the user (Nicholson, 2012). (iii) The most
common way game designers employ to balance out the competition (allow less skilled
players to compete effectively with more skilled) is to design team games (Pagulayan et al.,
2002). (iv) By providing multiple ways to achieve within the gamification system, users can
select those that are meaningful to them; by making each game element meaningful in a
different way, we can increase the chances of tending to each user’s needs in the game
(Nicholson, 2012).
We present the main characteristics of the game, starting with an overview of the game, in the following subsections.
4.1 Game Overview
Overall, a user that enrolls in the game can follow different journeys within the game play sphere. Two main paths exist simultaneously: The game can be played both individually and in teams. The basis for progression in the game is gathering points for successful adherence to suggested energy-saving actions/challenges, also packaged into specific timeframe challenges (daily/weekly/monthly). As a team member, the player can enjoy contributing to a team tree growing, flourishing, and gaining birds (ornamental badges) reflecting the successful

IADIS International Journal on WWW/Internet
10
completion of challenges by the respective team members. Furthermore, as both a single player and a team member, the player can experience empowerment by gaining a good position in the respective personal and team leaderboards, as well as earning personal roles within the team and experiencing a feeling of relatedness when gaining team roles.
The gamified app is informed in real-time about the players’ energy consumption actions through an IoT-enabled platform, explained in more detail in (Papaioannou et al., 2018), that orchestrates a set of sensing devices (e.g. smart plugs, multi-channel power meters, Bluetooth Low Energy (BLE) beaconing devices, temperature and humidity sensors etc.), which monitor the energy consumption of personal (e.g., PC, office lamp, etc.) or shared devices (e.g., printer, air conditioner, coffee machine, etc.) in the workplaces/ offices. We employ energy-disaggregation techniques, based on the device power signatures and common non-intrusive load monitoring techniques, to derive the power load at the device level. Moreover, we utilize beacons and NFC stickers (attached on the devices) to be able to associate the energy consumed on each device with the individual employees. BLE beaconing devices detect the employees’ presence in a specific room or area, provided that they carry their smartphone with them. Finally, the users swipe their phone over NFC stickers placed on the devices, in order to signal the IoT platform that they have performed each energy-saving action on the “swiped” devices. Figure 1 summarizes the game logic structure diagram, delineating the available different player journeys within the game.
Figure 1. The Player Journey in the Game - Individual and Team Play Scenarios
According to the player journey depicted above, the players / employees receive and can accept energy-saving challenges, such as “Close your PC when you leave the office”, during the game. When they turn-off their PC, they must also swipe the NFC sticker placed on it, to self-report / claim the energy-saving action performed. The IoT platform then validates each action claimed, against energy consumption data recorded by smart metering infrastructure. Only when the player’s claim is confirmed in this way, the energy-saving action is rewarded and both the individual player and their team are awarded corresponding points in the game.

AGILE USER-CENTERED DESIGN OF AN IOT-ENABLED GAMIFIED INTERVENTION FOR
ENERGY CONSERVATION AT THE WORKPLACE
11
4.2 Tree Persona
Guided by and in line with the survey results about the game persona, the core concept of the
gamified app we designed revolves around a virtual living and evolving main “persona” in the
form of a tree that reflects the energy consumption behaviour of employees while using the
energy consuming devices at their workplace. This visualization scheme aims to motivate the
user to actively and continuously participate in the challenges provided by the app towards
energy conservation. Furthermore, in accordance to the users’ preferences, the gamified app
facilitates team play. A growing tree with vivid elements represents the user’s teams’ activity, as well as achievements within the gamified app, growing according to each team’s
performance. Apart from growing, the features of the tree also become more detailed and
enriched, and vivid elements in the form of birds occasionally reside on the tree according to a
team’s performance. The use of animations makes the concept more vivid, attractive and
motivating for the end users. The tree grows and is enriched with vivid elements as a result of
challenges taken up and completed by users and their teams. The higher the score, the more
the tree grows, while the more challenges completed, the more the vivid elements (birds) that
reside on it. To preserve the scalability of the concept, more advanced vivid elements (birds)
replace less advanced, thus preventing cluttering. Screenshots of the app, illustrating tree
growth according to players’ performance in the game can be found in Figure 2.
Figure 2. Screenshots of the gamified app illustrating the tree “persona” growing in stages
The time horizon for the tree persona is four to six months, in order to enable users and
their teams to reflect on their own behaviour, and form the basis for long-term energy
behaviour change. By the end of this period, a fully grown blooming tree, enriched with birds
(badges), can be achieved by systematically completing in-game challenges.
4.3 Gameplay Characteristics
In-Game Team Formation: Based on the insight we gathered, we derived that the gamified
app should facilitate team play. Employees may concurrently belong to different categories of
teams in the game (e.g. a geographical team, as well as a device-oriented team). However, all

IADIS International Journal on WWW/Internet
12
points accrued will be reflected on both the main team scheme that has been selected in the
specific game, as well as their individual scoreboard, available for viewing interchangeably in
the app from the users. A comparison between teams is made based on their position in the
team leaderboard (Figure 4), while more details on the team formation criteria within the game can be found in Table 3 (I).
Types of In-Game Challenges: Whenever an energy saving challenge is available, a
visual notification informs the users of its availability. Each time the action is in turn
performed by a player, points are credited both to their personal, as well as their teams’
profile. Two main categories of in-game challenges can be accepted in the app. Personal
challenges, like turning ones’ PC off when leaving from work and Team challenges, like
turning the workspace lights off when leaving for the afternoon. Team challenges, although
taken-up by individual participants, are enacted on behalf of all the team and their outcome is
mirrored both on the personal, as well as their team’s progress in the game, with the points
accrued by individual actions also perpetually added to the teams’ scores. Furthermore,
individual challenges are grouped into time-bundles that run each day over the course of the game – the morning, daily and evening challenge. The “morning challenge” includes
sub-challenges through which the workplace’s energy consumption is initialized each
morning. The “daily challenge” prompts employees to perform energy saving actions,
depending on environmental variables (e.g. temperature, luminosity), occupancy (e.g. leaving
the office), IoT-sensed events (e.g. opening windows) and/or their work schedules and
division routine. Finally, as part of the “evening challenge”, the employees are prompted to
minimize the workplace’s energy consumption for the night, when it is presumably vacant.
The sub-challenges included within each challenge are explained in Table 3 (II).
The forementioned challenges are also bundled into larger timeframe challenges – weekly and
monthly challenge versions of the different challenges and sub-challenges – to increase user
engagement. For example, the employees try to adhere to the same daily energy saving
challenges on all days of a week, to attain the corresponding “weekly challenge” and, similarly throughout the month to attain “monthly challenges”. Finally, challenges can be accepted,
abandoned, and/or completed. A screenshot of the app illustrating the list of challenges can be
seen on Figure 3.
Figure 3. Screenshots featuring Challenges (accepted, abandoned and/or completed) and Badges
AGILE USER-CENTERED DESIGN OF AN IOT-ENABLED GAMIFIED INTERVENTION FOR
ENERGY CONSERVATION AT THE WORKPLACE
13
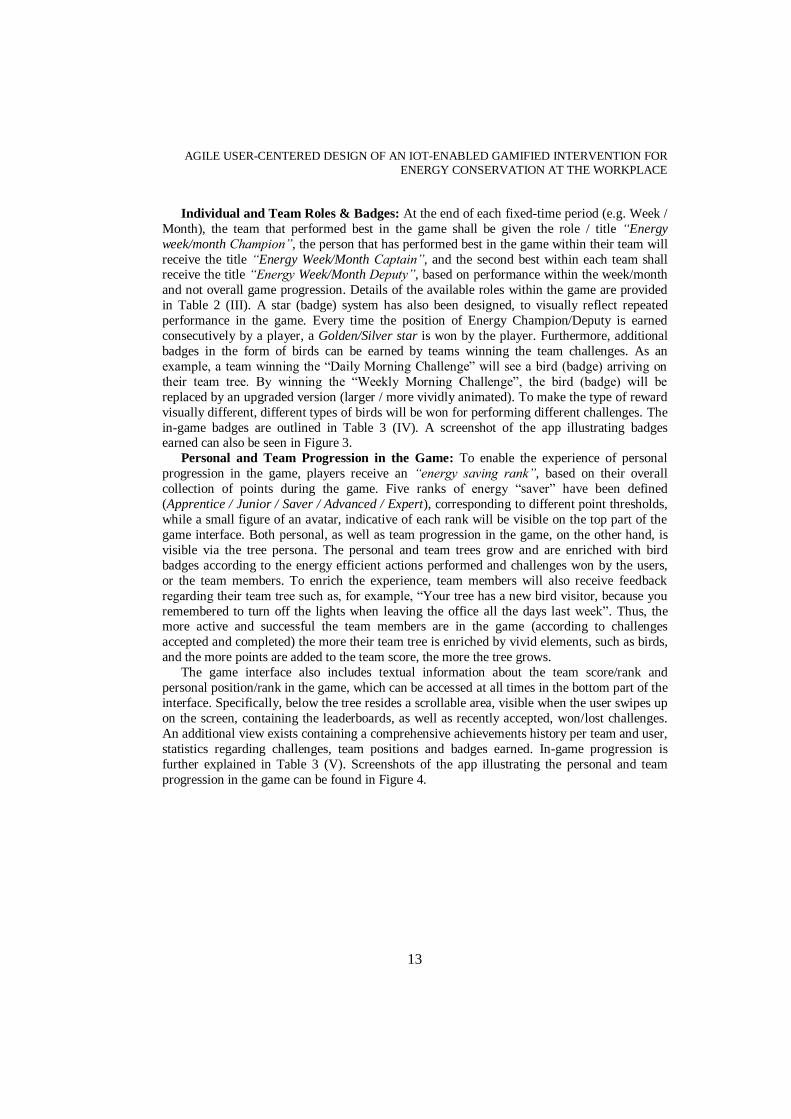
Individual and Team Roles & Badges: At the end of each fixed-time period (e.g. Week /
Month), the team that performed best in the game shall be given the role / title “Energy
week/month Champion”, the person that has performed best in the game within their team will
receive the title “Energy Week/Month Captain”, and the second best within each team shall receive the title “Energy Week/Month Deputy”, based on performance within the week/month
and not overall game progression. Details of the available roles within the game are provided
in Table 2 (III). A star (badge) system has also been designed, to visually reflect repeated
performance in the game. Every time the position of Energy Champion/Deputy is earned
consecutively by a player, a Golden/Silver star is won by the player. Furthermore, additional
badges in the form of birds can be earned by teams winning the team challenges. As an
example, a team winning the “Daily Morning Challenge” will see a bird (badge) arriving on
their team tree. By winning the “Weekly Morning Challenge”, the bird (badge) will be
replaced by an upgraded version (larger / more vividly animated). To make the type of reward
visually different, different types of birds will be won for performing different challenges. The
in-game badges are outlined in Table 3 (IV). A screenshot of the app illustrating badges earned can also be seen in Figure 3.
Personal and Team Progression in the Game: To enable the experience of personal
progression in the game, players receive an “energy saving rank”, based on their overall
collection of points during the game. Five ranks of energy “saver” have been defined
(Apprentice / Junior / Saver / Advanced / Expert), corresponding to different point thresholds,
while a small figure of an avatar, indicative of each rank will be visible on the top part of the
game interface. Both personal, as well as team progression in the game, on the other hand, is
visible via the tree persona. The personal and team trees grow and are enriched with bird
badges according to the energy efficient actions performed and challenges won by the users,
or the team members. To enrich the experience, team members will also receive feedback
regarding their team tree such as, for example, “Your tree has a new bird visitor, because you
remembered to turn off the lights when leaving the office all the days last week”. Thus, the more active and successful the team members are in the game (according to challenges
accepted and completed) the more their team tree is enriched by vivid elements, such as birds,
and the more points are added to the team score, the more the tree grows.
The game interface also includes textual information about the team score/rank and
personal position/rank in the game, which can be accessed at all times in the bottom part of the
interface. Specifically, below the tree resides a scrollable area, visible when the user swipes up
on the screen, containing the leaderboards, as well as recently accepted, won/lost challenges.
An additional view exists containing a comprehensive achievements history per team and user,
statistics regarding challenges, team positions and badges earned. In-game progression is
further explained in Table 3 (V). Screenshots of the app illustrating the personal and team
progression in the game can be found in Figure 4.

IADIS International Journal on WWW/Internet
14
Figure 4. Screenshots of the app interface. The user can review their earned badges, personal and team status, position in the team and personal leaderboards, as well as status of the tree “personas”
Table 3. Overview of Gameplay Characteristics
III. Team Formation Criteria
Geographical
e. Employees working in the same shared office space f. Employees in adjacent individual office spaces g. Employees in different rooms with similar functions h. Employees in a workplace competing vs other workplaces/buildings
Role-oriented i. Employees working in the same department j. Employees with similar duties at work
Device-oriented k. Employees who share devices (printers / air-conditioners, lights, windows, etc.)
IV. In-Game Challenges
Cat. Name Description of Challenge
Morning
a. “Check-in” b. “Elevator up” c. “Lights on” d. “Coffee on” e. “Kettle” f. “Equipment on”
Declare that you have arrived and want to start playing Use the stairs, instead of the elevator, to reach your office Turn on the minimum necessary lights in your (teams’) office Prepare a unique (team) load of coffee to share in the morning Use the kettle once to boil water for (teams’) tea in the morning Switch only the necessary office equipment needed for the day on
Daily
g. “Temperature” h. “Illumination” i. “Windows” j. “Away”
Adjust thermostat when temp. is too high in winter, or low in summer Turn the lights off whenever ambient light suffices Keep windows closed when air conditioners are on Switch off any unnecessary devices whenever away from office
Evening
k. “Elevator down” l. “Lights off” m. “Coffee off” n. “Equipment off”
Use the stairs, instead of the elevator, to leave the office. The last (team) member leaving the office, switch off all the lights Turn off (team) coffee maker before leaving the office in the evening Turn off any equipment that isn’t needed afterhours before leaving
V. Roles / Titles
Cat. Title (Week/Month) Description of Role / Title
Team a. Energy Champion The team that performed best in the game within a fixed time period
Personal
b. Energy Captain The team member that performed best within a fixed time period
c. Energy Deputy The team member that performed second best within fixed period
AGILE USER-CENTERED DESIGN OF AN IOT-ENABLED GAMIFIED INTERVENTION FOR
ENERGY CONSERVATION AT THE WORKPLACE
15
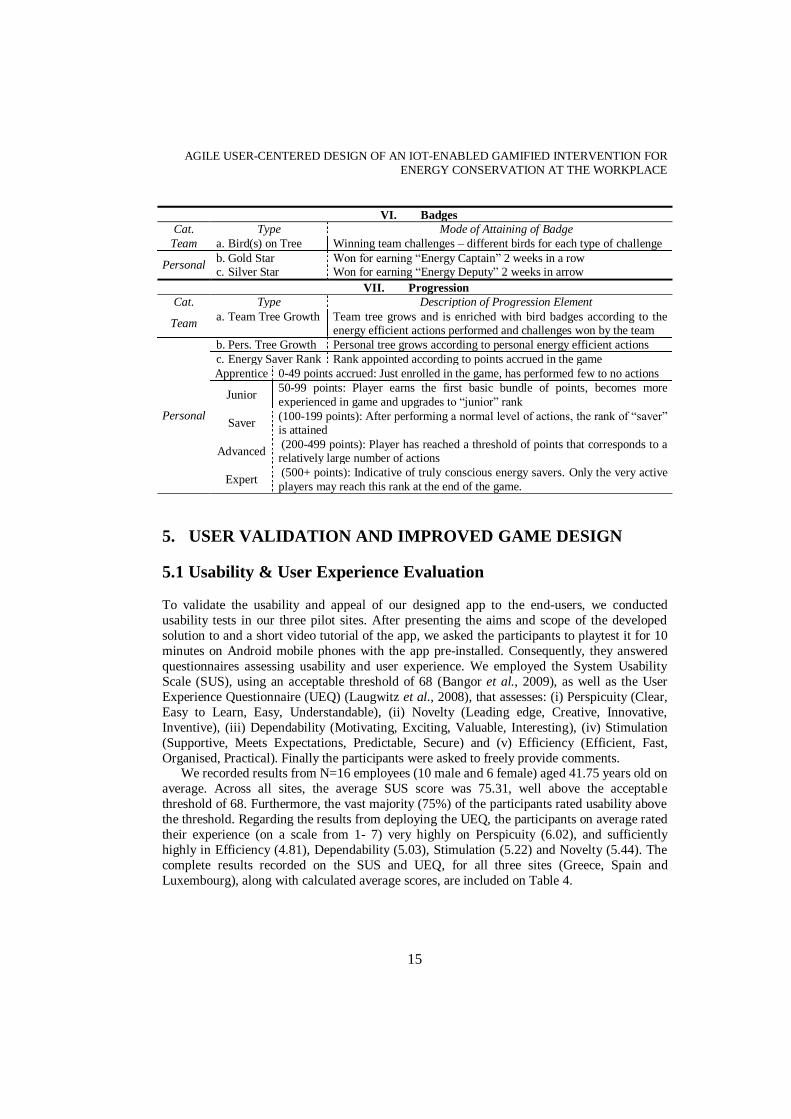
VI. Badges
Cat. Type Mode of Attaining of Badge
Team a. Bird(s) on Tree Winning team challenges – different birds for each type of challenge
Personal b. Gold Star c. Silver Star
Won for earning “Energy Captain” 2 weeks in a row Won for earning “Energy Deputy” 2 weeks in arrow
VII. Progression
Cat. Type Description of Progression Element
Team a. Team Tree Growth Team tree grows and is enriched with bird badges according to the
energy efficient actions performed and challenges won by the team
Personal
b. Pers. Tree Growth Personal tree grows according to personal energy efficient actions
c. Energy Saver Rank Rank appointed according to points accrued in the game
Apprentice 0-49 points accrued: Just enrolled in the game, has performed few to no actions
Junior 50-99 points: Player earns the first basic bundle of points, becomes more
experienced in game and upgrades to “junior” rank
Saver (100-199 points): After performing a normal level of actions, the rank of “saver” is attained
Advanced (200-499 points): Player has reached a threshold of points that corresponds to a relatively large number of actions
Expert (500+ points): Indicative of truly conscious energy savers. Only the very active
players may reach this rank at the end of the game.
5. USER VALIDATION AND IMPROVED GAME DESIGN
5.1 Usability & User Experience Evaluation
To validate the usability and appeal of our designed app to the end-users, we conducted
usability tests in our three pilot sites. After presenting the aims and scope of the developed
solution to and a short video tutorial of the app, we asked the participants to playtest it for 10
minutes on Android mobile phones with the app pre-installed. Consequently, they answered
questionnaires assessing usability and user experience. We employed the System Usability
Scale (SUS), using an acceptable threshold of 68 (Bangor et al., 2009), as well as the User
Experience Questionnaire (UEQ) (Laugwitz et al., 2008), that assesses: (i) Perspicuity (Clear,
Easy to Learn, Easy, Understandable), (ii) Novelty (Leading edge, Creative, Innovative,
Inventive), (iii) Dependability (Motivating, Exciting, Valuable, Interesting), (iv) Stimulation
(Supportive, Meets Expectations, Predictable, Secure) and (v) Efficiency (Efficient, Fast,
Organised, Practical). Finally the participants were asked to freely provide comments. We recorded results from N=16 employees (10 male and 6 female) aged 41.75 years old on
average. Across all sites, the average SUS score was 75.31, well above the acceptable
threshold of 68. Furthermore, the vast majority (75%) of the participants rated usability above
the threshold. Regarding the results from deploying the UEQ, the participants on average rated
their experience (on a scale from 1- 7) very highly on Perspicuity (6.02), and sufficiently
highly in Efficiency (4.81), Dependability (5.03), Stimulation (5.22) and Novelty (5.44). The
complete results recorded on the SUS and UEQ, for all three sites (Greece, Spain and
Luxembourg), along with calculated average scores, are included on Table 4.

IADIS International Journal on WWW/Internet
16
Table 4. System Usability Scale (SUS) and User Experience Questionnaire (UEQ) scores (1st validation)
Site Age Gender SUS UEQ
M F Perspicuity Efficiency Dependability Stimulation Novelty
Greece
47 + 75.0 7.00 2.25 3.50 5.25 5.25 34 + 85.0 7.00 6.50 6.50 5.50 6.50 40 + 87.5 7.00 4.50 6.25 6.25 6.50 43 + 95.0 7.00 6.75 6.50 6.50 6.75 34 + 60.0 5.50 3.50 5.75 4.75 5.75
Avg. 39.6 2 3 80.5 6.70 4.70 5.70 5.65 6.15
Spain
44 + 77.5 6.00 5.25 4.75 4.75 5.25 37 + 75.0 7.00 4.75 5.00 4.75 5.25 55 + 57.5 5.25 4.50 4.50 4.50 4.25 44 + 75.0 6.25 3.75 5.00 5.50 5.50 29 + 80.0 6.00 6.00 5.00 5.75 5.50
Avg. 41.8 4 1 73.0 6.1 4.85 4.85 5.05 5.15
Luxem-
bourg
53 + 87.5 5.75 5.25 5.00 5.75 5.25
35 + 97.5 7.00 6.25 6.25 6.50 6.75 55 + 35.0 4.50 5.25 4.00 3.25 3.00 45 + 47.5 4.00 4.25 3.25 4.50 3.75 31 + 72.5 5.50 4.25 3.25 4.50 5.00 42 + 97.5 5.50 4.00 6.00 5.50 6.75
Avg. 43.5 4 2 72.9 5.38 4.88 4.63 5.00 5.08
Total Avg.
(All Sites) 41.8 10 6 75.3 6.02 4.81 5.03 5.22 5.44
Based on our sample size (N=16), and the total population of office employees in our pilot
sites (N=144), as well as the fact that 81.25% recorded acceptable SUS scores (>68), we
deduce that the confidence interval of our results is 20.07% (Creative Research Systems,
2018). Hence, the avg. SUS score for (N=144), is expected to vary between 60.19 and 90.43 (+/- 15.12 from the recorded score of 75.31 for our sample), with a 95% confidence level.
5.2 End-User Feedback
After playtesting the app and answering the questionnaires on usability and user experience,
we also asked the participants to provide their comments, based on preset themes. The collected insight is presented in Table 5.
Based on this insight, we deduce that, first of all, the vast majority of the participants
(14/16) would be willing to use the designed application in an upcoming test phase, as they
enjoyed using it (15/16) and found it potentially easy to include in their daily schedule (14/16)
at work (see Figure 5). The participants’ motives for using the app were various, such as for
the mere fun in competing (4/16), out of curiosity (3/16), based on their environmental
awareness (2/16), sense of duty (1/16), and/or towards socializing with their colleagues at
work (1/16). All these motives need to be taken into account during the testing phase, in order
to make the game scenarios appealing to the end-users. On the other hand, the minority that
was unwilling to use the app, suggested reasons such as a lack of motivation/need (1/16) and
time scarcity/busy schedule (1/16). Therefore, to convince them to use the app, we would need to further enhance its functionality in line with their needs, as well as further respect
employees’ time limitations, by making it as least intrusive and time-consuming as possible.

AGILE USER-CENTERED DESIGN OF AN IOT-ENABLED GAMIFIED INTERVENTION FOR
ENERGY CONSERVATION AT THE WORKPLACE
17
Figure 5. Willingness to use the app in an upcoming test phase
As per the app’s strong points, the best feature was found to be team play (6/16), followed
by the tree persona concept (5/16), as well as its scope and potential (5/16), design (4/16) and
gameplay (3/16). These are the points that can be leveraged during the pilot testing, in order to
attract our audience. The most important perceived worst features of the app on the other hand
were that there was no indication of the actual energy saved within the game (6/16), followed by the lack of in-game tips functionality (3/16). Furthermore, the participants directly suggest
ed adding notifications / alarms functionality (4/16), projecting info on energy consumption
(3/16), allowing continuous in-game progression (3/16), providing energy-saving tips (2/16),
limiting the attention needed to participate in the game (2/16), and further enhancing the
visualization (2/16) as ways in which the app and overall energy-saving solution we designed
could be improved.
To further enhance our understanding of the participants’ experience with the app, upon
answering the pre-set questions, we asked them to also note down their additional comments
in a free-form manner. Furthermore, as soon as the questionnaire was completed by all the
participants, we conducted a free-form discussion with them, to collect any feedback not
already provided by them in writing. A basic comment noted by the participants was that they
wanted to view information regarding the energy usage at their workplace, as well as the energy-savings achieved through their actions. More specifically, they noted that they wanted
to know / view (6/15) the energy impact of each single action, the actual impact of the app on
energy savings / consumption (the energy saved through the users’ actions in the game, as
well as the progress made in energy savings), and a comparison of energy savings effected
through the app between the participating buildings (in a building competition setting).
Additional insight was provided regarding the gameplay scenarios. More specifically, the
participants suggested that they want to be engaged in daily actions in a hassle-free manner
and that it may become boring to have to activate the same daily challenges in the game each
day (e.g. a user who is always taking the stairs instead of the elevator, should not have to
select the challenge every day, but once for many days in advance). Therefore, for actions that
a user already performs as part of their daily routine, there should be the capability to accept / activate the relative challenges i.e. on a weekly basis with one click in the game. However, to
ensure that players login to the app every day, daily logins should be encouraged, or rewarded

IADIS International Journal on WWW/Internet
18
in the app. Furthermore, the points awarding mechanism should be designed bearing into
account that not all users have access to the complete set of challenges and the game should be
fair for all based on what actions they can perform. Additionally, the participants stressed that
the game should provide feedback on their actions (e.g. an on-screen message verifying successful completion of an action) in the case that the conducted action is not enough to
immediately lead to growth in the tree persona. Moreover, a user should be able to clearly see
the open / participating challenges within the game interface.
Apart from the game design insight, a number of issues were also raised by the participants
regarding the technical IoT infrastructure utilized in the game. This insight was not directly
relevant to the game design itself but, however, the hardware settings suggested were taken
into account in order to be able to optimally set-up the IoT infrastructure for the upcoming
trials, and increase the users’ engagement in the overall solution designed. More specifically,
the users noted that doors may also be left open in rooms with the air conditioning on, leading
to energy wastage. Therefore IoT sensors should also be placed on the doors, and the windows
challenge may be extended to include doors. Furthermore, the NFC stickers that the users are expected to swipe should be put in a position to be visible and easily accessible by them, while
respecting technical limitations for optimal use. Towards that end, the pilot site managers
should be given a step-by-step manual of how to position NFC stickers in their premises and
(re-) allocate users to equipment. Finally, as some users may feel that their privacy is invaded
and they are being tracked by the infrastructure, all the steps taken to ensure their privacy
when storing sensitive data should be clearly and thoroughly presented to them upfront.
Table 5. Comments and answers from the participants, based on the interview guide questions
Did you enjoy using the app?
YES: 15/16 / NO: 1/16
Would you find it easy to include in your daily schedule at work?
YES: 10/16 / NO: 2/16 / Maybe: 4/16
Would you be willing to regularly use the app in the upcoming test phase?
YES: (14/16) - Why? 1. Fun in Competing (4/16): It's fun / it will be a pleasing experience / as I start winning points I will
get even more challenged / I'm quite competitive
2. Curiosity (3/16): To see if we, as employees, can really have some significant influence in the buildings’ energy consumption / I'm curious / I'm interested in trying - using the app
3. Environmental awareness (2/16): I am very interested in different ways to increase people’s awareness about energy saving / to stimulate environmental conscience
4. Sense of Duty (1/16): I have been committed to it 5. Socializing (1/16): to create team building among the colleagues at work
NO: (2/16) – Why? 1. Lack of motivation (1/16): I don't need it – I'm already very aware of how to save energy 2. Time scarcity (1/16): My schedule is very tight already
What did you find to be the BEST feature of the solution?
1. Team play (6/16): team challenges / competition / comparison with other members and groups 2. Evolving tree persona (5/16): corresponds to the ecological conscience / team tree enhances group
participation / sympathetic character of the app 3. App scope and potential (5/16): includes my daily energy consumption routine / we respect the
environment / provides a positive message 4. App design (4/16): very interesting and innovative / easy to use / well-designed / specifies the
concepts clearly 5. Gameplay (3/16): challenge-based / played on a voluntary basis / no negative scoring

AGILE USER-CENTERED DESIGN OF AN IOT-ENABLED GAMIFIED INTERVENTION FOR
ENERGY CONSERVATION AT THE WORKPLACE
19
What did you find to be the WORST feature of the solution?
1. No indication of actual energy saving in game (6/16): need to view the real impact of actions on energy consumption
2. No help – tips available (3/16): badges and corresponding challenges should be further clarified / not all have access to all the types of challenges / challenges surrounding PC usage need clarification
3. No obvious real (tangible) personal gain for the participants (1/16) 4. Small screen size in mobile apps (1/16)
Do you have any suggestions on how the app could be improved?
1. Add notifications / alarms (4/16): to remind pending actions / challenges to the users 2. Project info on energy consumption (3/16) : game should reflect real conditions as best as possible,
users should understand what and how they are winning 3. Continuous in-game progression (3/16): a change depicted in the tree, or a new bird for each
completed action (continuous tree growth) / new rewards each day / more challenges 4. Limit attention needed (2/16): not too many challenges per day / capability of playing without
constantly using phone 5. Enhance visualization (2/16): more animations and videos / use of flowers as badges / intra-team
progress visible in a a “forest” of team trees
Do you have any suggestions on improving the solution in general?
1. Provide energy-saving information and advice (2/16): capability to view tips and actual energy saved in the game
2. Support users to motivate peers (1/16) - provide ways to engage users in the real world 3. Add capability to hide progress in the game (1/16) – play incognito
5.3 Additional Functionality & Improvements on the App
We utilized the collected findings and insight through the user evaluation process outlined above, to enhance the app that will be used during the pilot testing phase. Therefore, to fit the users’ needs and preferences recorded, we extended the game functionality to include: (i) pop-up messages that inform the user on the acceptance / abandonment / completion of a challenge (Fig. 3), (ii) energy-saving tips that educate users into how they can conserve energy at work while playing the game (Fig. 6), and (iii) energy-savings reports accessible within the app, through which the user can view the savings effected from their in-game actions, as well as a comparison of energy savings achieved between different participating workplaces (Figure 6).
Figure 6. Additional functionality in the game added after user evaluation (tips & energy savings)

IADIS International Journal on WWW/Internet
20
To verify the utility, as well as acceptance of the new functionality introduced in this
revised version of the app, we conducted a second validation with a smaller sample of
employees. We followed the same process and utilized the same measures we used in the first
validation phase delineated in section 5.2. The results can be seen in Table 6.
Table 6. System Usability Scale (SUS) & User Experience Questionnaire (UEQ) scores (2nd validation)
Site Age Gender SUS UEQ
M F Perspicuity Efficiency Dependability Stimulation Novelty
Greece
41 + 72.5 5.50 4.75 5.25 5.00 5.50 45 + 85.0 5.25 3.75 3.75 5.50 5.75
35 + 85.0 6.50 4.50 5.75 5.00 6.00 35 + 77.5 6.50 6.75 6.50 5.25 7.00 35 + 85.0 6.50 6.75 6.75 6.25 6.00 35 + 100 7.00 7.00 7.00 6.75 7.00 41 + 92.5 7.00 6.50 6.50 5.75 7.00
Avg. 2nd
Val. 37.3 3 4 85.4 6.32 5.71 5.93 5.64 6.32
1st Val. 41.8 10 6 75.3 6.02 4.81 5.03 5.22 5.44
Change (Δ) -4.5 +10.1 +0.30 +0.90 +0.90 +0.42 +0.88
“ % -12.1 +13.4 +4.98 +18.71 +17.89 +8.05 +16.18
We recorded results from N=7 employees on one of the sites (3 male and 4 female) with an
average age of 37.3 years old. The average SUS recorded by the 7 participants (3 male and 4
female) was 85.4, well above the acceptable threshold of 68.0 and 13.4% higher than the 75.3
average usability score recorded in the validation of the previous version of the app. All of the
users also rated the usability of the app above the threshold of 68 (min 72.5, max 100.0).
Furthermore, regarding the users’ experience, the scores for the revised version of the app on
the UEQ were very high on Novelty and Perspicuity, as well as high on Efficiency, Dependability and Stimulation, indicating that there may still be some room in improving the
app by focusing on making it more Efficient, Dependable and Stimulating in the future.
6. DISCUSSION
To design an energy-behavior change solution that focuses on our end-users’ needs at the workplace, we are following an iterative and incremental agile UCD approach during the
design, release and testing phases (Figure 7). We analyzed the collected feedback on user
interface and system design for a first version of the app and acted upon the resulting insight,
to guide the incremental development of our solution by focusing on the specific requirements
derived, while developing the second complete integrated version. Comparing the SUS and
UEQ results attained for the two versions, we found that all the users rated usability above the
threshold of 68 (min answer 72.5, max 100.0) in the revised version, as well as 13.4% higher
on average. This shows an improvement to the first version, where 25% of the users had rated
usability below the (60) threshold. Furthermore, regarding user experience, the revised version
of the app was rated high on all UEQ pillars, also featuring an improvement compared to the
results from the 1st version of the app. On average, the scores were very high on Novelty and
Perspicuity, as well as high on Efficiency, Dependability and Stimulation, and the improvement was 4.98% for Perspicuity, 18.71% for Efficiency, 17.89% for Dependability,

AGILE USER-CENTERED DESIGN OF AN IOT-ENABLED GAMIFIED INTERVENTION FOR
ENERGY CONSERVATION AT THE WORKPLACE
21
8.05% for Stimulation, and 16.8% for Novelty (see Table 6). To summarize, based on the
above, by comparing the results from the user evaluation of these two successive versions of
the designed solution, we found that we achieved improved results in the second version, both
in application usability and user engagement, towards attaining the desired user behavioral change – energy conservation.
Figure 7. The Iterative & Incremental Agile UCD Game Development Process we followed
7. CONCLUSION
We designed a gamified app to be employed towards motivating employees to conserve
energy at the workplace, following a UCD approach. After examining our prospective
end-users’ requirements, as well as observing the contextual characteristics of their workplace
environments, and inherent opportunities for energy saving therein, we proceeded to select the
energy-wasting behaviours that should be targeted, in order to effectively reduce energy
consumption. Furthermore, following an agile process, we derived a game design to fit our
samples’ characteristics and context. A challenge-based, primarily team-game scenario, with fixed-timeframe bundled actions, was adopted according to the collected insight. Usability and
user experience results were well within acceptable ranges for the first app prototype,
indicating that the approach we followed led to a potentially successful app. Following our
test-users’ suggestions for improvements, we extended the app functionality and re-evaluated
the revised version. Preliminary scores for both usability and user experience were
significantly higher in the revised version of the app, indicating that by following the users’
suggestions from the first validation phase, we derived an application with enhanced
possibilities for engaging its target audience into conserving energy at the workplace.
However, since the sample size we consulted was significantly smaller compared to the
previous test phase, we would need to involve additional participants towards gaining in
generalization of the recorded results in the future. Moreover, our research would be better
grounded through practical experimentation, to further verify and fortify the effectiveness of the process followed, as well as of the resulting app, in effecting employee energy behavior
change. We aim to proceed towards this direction, by conducting experiments, featuring the
designed gamified app, in workplaces situated in three different EU countries, in the future.

IADIS International Journal on WWW/Internet
22
ACKNOWLEDGEMENTS
This research study is partially funded by the project ChArGED (CleAnweb Gamified
Energy Disaggregation), that receives funding from the EU Horizon 2020 research and
innovation programme, under grant agreement No 696170.
The graphic design of the user interfaces of the game app and their software
implementation, according to the game design presented in this paper, have been performed
by Evi Ioannidou and Kostas Vasilakis & Themis Apostologlou respectively, for European
Dynamics S.A. - (http://www.eurodyn.com).
REFERENCES
Abrahamsson, P., Salo, O., Ronkainen, J., & Warsta, J. (2002). Agile software development methods: Review and analysis. Espoo, Finland: Technical Research Centre of Finland, VTT Publications.
Ajzen, I. (2010). Constructing a theory of planned behavior questionnaire. Biofeedback and selfregulation, 17, 1–7.
Ashridge. (2014). Connecting Gamification and Motivation Theory. Virtual Ashridge @ The HR director.
Bangor, A., Kortum, P., & Miller, J. (2009). Determining what individual SUS scores mean: Adding an adjective rating scale. Journal of usability studies, 4(3), 114–123.
Bansal, P., & Gao, J. (2006). Building the Future by Looking to the Past: Examining Research Published on Organizations and Environment. Organization & Environment, 19(4), 458–478.
Beck, K., Beedle, M., Van Bennekum, A., Cockburn, A., Cunningham, W., Fowler, M., Thomas, D. (2001). Manifesto for Agile Software Development. Agile Alliance.
Bittner, K., & Spence, I. (2006). Managing Iterative Software Development Projects. Pearson Canada.
Blohm, I., & Leimeister, J. M. (2013). Gamification: Design of IT-based enhancing services for
motivational support and behavioral change. Business and Information Systems Engineering, 5(4), 275–278.
Bourazeri, A., & Pitt, J. (2013). Serious Game Design for Inclusivity and Empowerment in SmartGrids. In First International Workshop on Intelligent Digital Games for Empowerment and Inclusion.
Brewer, R., Xu, Y., & Lee, G. (2013). Energy feedback for smart grid consumers: Lessons learned from
the Kukui Cup. … on Smart Grids, Green …, (c), 120–126.
Burke, B. (2014). How Gamification Motivates the Masses. Forbes.
Chou, Y. (2012). Octalysis : Complete Gamification Framework.
Cockburn, A. (2002). Agile Software Development (Vol. 177). Boston, MA: Addison - Wesley.
Conti, J., Holtberg, P., Diefenderfer, J., LaRose, A., Turnure, J. T., & Westfall, L. (2016). International Energy Outlook 2016, With Projections to 2040 (May 2016.). Washington, DC, U.S.A.: U.S. Energy Information Administration (EIA).
Cool Choices. (2017). Employee Engagement Sustainability Game.
Creative Research Systems. (2018). Sample Size Calculator.
Darby, S. (2006). The Effectiveness of Feedback on Energy Consumption: a Review for Defra of the Literature on Metering , Billing and Direct Displays. Environmental Change Institute, University of Oxford, 22(April), 1–21.
Dargan, T., & Evequoz, F. (2015). Designing Engaging e-Government Services by Combining User-Centered Design and Gamification: A Use Case. In Proceedings of the 15th European
Conference on e-Government (ECEG 2015) (Vol. 2015–Jan, pp. 70–78).
Delmas, M. A., Fischlein, M., & Asensio, O. I. (2013). Information strategies and energy conservation

AGILE USER-CENTERED DESIGN OF AN IOT-ENABLED GAMIFIED INTERVENTION FOR
ENERGY CONSERVATION AT THE WORKPLACE
23
behavior: A meta-analysis of experimental studies from 1975 to 2012. Energy Policy, 61, 729–739.
Deterding, S., Sicart, M., Nacke, L., O’Hara, K., & Dixon, D. (2011). Gamification. using game-design elements in non-gaming contexts. Proceedings of the 2011 annual conference extended abstracts on Human factors in computing systems - CHI EA ’11, 2425.
Diener, E., Wirtz, D., Tov, W., Kim-Prieto, C., Choi, D. won, Oishi, S., & Biswas-Diener, R. (2010). New well-being measures: Short scales to assess flourishing and positive and negative feelings. Social Indicators Research, 97(2), 143–156.
Dybå, T., & Dingsøyr, T. (2008). Empirical studies of agile software development: A systematic review. Information and Software Technology, 50(9–10), 833–859.
Erenli, K. (2013). The Impact of Gamification. Recomending Education Scenarios. International Journal of Emerging Technologies in Learning, 8(Special Issue 1: “ICL2012”), 15–21.
European Commission. (2017). Buildings. https://ec.europa.eu.
Fijnheer, J. D., Oostendorp, H. Van, & Veltkamp, R. C. (2016). Gamification in a Prototype Household Energy Game. In Proceedings of the 10th European Conference on Games Based Learning (pp. 192–201).
Garrett, J. J. (2011). The Elements of User Experience: User-Centered Design for the Web and Beyond (Second.). Berkeley, CA.
Geelen, D., Keyson, D., Stella, B., & Brezet, H. (2012). Exploring the use of a game to stimulate energy saving in households - Journal of Design Research - Volume 10, Number 1–2/2012 - Inderscience Publishers. Journal of Design Research, 10, 102–120.
Godoy, A., & Barbosa, E. F. (2010). Game-Scrum: An Approach to Agile Game Development. IX SBGames.
Grossberg, F., Wolfson, M., Mazur-Stommen, S., Farley, K., & Nadel, S. (2015). Gamified Energy Efficiency Programs. Washington, DC, U.S.A.
Hamari, J., Koivisto, J., & Sarsa, H. (2014). Does gamification work? - A literature review of empirical studies on gamification. Proceedings of the Annual Hawaii International Conference on System Sciences, 3025–3034.
Huang, W. H., & Soman, D. (2013). A Practitioner’s Guide To Gamification Of Education. University of Toronto - Rotman School of Management. Toronto.
IEA. (2017). Key World Energy Statistics.
IEA Digitalization & Energy Working Group. (2017). Digitalization & Energy.
IEA EEfD. (2017). Energy Efficiency 2017.
IEA Energy Data Centre. (2017). Energy Technology RD&D Budgets: Overview.
ISO. (2015). ISO/IEC 15288, Systems and software engineering-System life cycle processes.
Knol, E., & De Vries, P. (2011). EnerCities-A Serious Game to Stimulate Sustainability and Energy Conservation: Preliminary Results. eLearning Papers, (45), 1–10.
Koepke, B., Pelletier, B., Adair, D., Jhawar, R., Macaulay, I., & Bielecki, T. (2013). Agile Game Development. Game Developer, (1), 1–8.
Kotsopoulos, D., Bardaki, C., Lounis, S., Papaioannou, T., & Pramatari, K. (2017). Designing an IoT-enabled Gamification Application for Energy Conservation at the Workplace: Exploring Personal and Contextual Characteristics. In 30th Bled eConference (pp. 369–384). Bled, Slovenia.
Kotsopoulos, D., Bardaki, C., & Pramatari, K. (2016). Gamification , Geolocation and Sensors for Employee Motivation Towards Energy Conservation at the Workplace. In Tenth Mediterranean
Conference on Information Systems (MCIS) 2016 (pp. 1–11). Paphos, Cyprus.
Kumar, J. M., & Herger, M. (2013). Gamification at Work: Designing Engaging Business Software. Electric Perspectives (1st Ed.). Interaction Design Foundation.
Larman, C., & Basili, V. R. (2003). Iterative and incremental developments. a brief history. Computer, 36(6), 47–56.
Laugwitz, B., Held, T., & Schrepp, M. (2008). Construction and Evaluation of a User Experience Questionnaire. HCI and Usability for Education and Work, 63–76.

IADIS International Journal on WWW/Internet
24
Liu, D., Santhanam, R., & Webster, J. (2017). Toward Meaningful Engagement: A Framework for Design and Research of Gamified Information Systems. MIS Quarterly, 41(4), 1011–1034.
Lo, S. H., Peters, G. J. Y., & Kok, G. (2012). Energy-Related Behaviors in Office Buildings: A Qualitative Study on Individual and Organisational Determinants. Applied Psychology, 61(2), 227–249.
Lounis, S., Kotsopoulos, D., Bardaki, C., Papaioannou, T. G., & Pramatari, K. (2017). Waste No More : Gamification for Energy Efficient Behaviour at the Workplace. In Proceedings of the 1st International GamiFIN Conference, Pori, Finland, May 9-10, 2017. (pp. 129–134). Pori, Finland.
Lülfs, R., & Hahn, R. (2013). Corporate greening beyond formal programs, initiatives, and systems: A conceptual model for voluntary pro-environmental behavior of employees. European Management
Review, 10(2), 83–98.
Lutzenhiser, L. (1993). Social and Behavioral Aspects of Energy Use. Annual Review of Energy Environment, 18, 247–289.
Ma, Y., Lu, Y., & Saparova, D. (2014). The Role of Iterative Usability Evaluation in Agile Development : A Case Study. UXMatters, (August 18).
MacKenzie, S. B., Lutz, R. J., & Belch, G. E. (1986). The Role of Attitude toward the Ad as a Mediator of Advertising Effectiveness: A Test of Competing Explanations. Journal of Marketing Research, 23(2), 130.
Macklin, C., & Sharp, J. (2016). Games, Design and Play - A Detailed approach to Iterative Game Design. (Addison-Wesley, Ed.).
Mao, B. J., Vredenburg, K., Smith, P. W., & Carey, T. (2005). User-centered design practice. Communications of the ACM, 48(3), 105–109.
Marache-Francisco, C., & Brangier, E. (2013). Process of Gamification. From the Consideration of Gamification to its Practical Implementation. In CENTRIC 2013, The Sixth International Conference on Advances in Human oriented and Personalized Mechanisms, Technologies, and Services (pp. 126–131).
Marczewski, A. (2012). Gamification: A simple introduction & a bit more: Tips, Advice and Thoughts on Gamification (2nd ed.).
Matthies, E., Kastner, I., Klesse, A., & Wagner, H.-J. (2011). High reduction potentials for energy user behavior in public buildings: how much can psychology-based interventions achieve? Journal of Environmental Studies and Sciences, 1(3), 241–255.
Mora, A., Riera, D., Gonzalez, C., & Arnedo-Moreno, J. (2015). A Literature Review of Gamification Design Frameworks. In VS-Games 2015 - 7th International Conference on Games and Virtual Worlds for Serious Applications (pp. 1–8).
Morschheuser, B., Hassan, L., Werder, K., & Hamari, J. (2018). How to design gamification? A method for engineering gamified software. Information and Software Technology, 95, 219–237.
Nguyen, T. A., & Aiello, M. (2013). Energy intelligent buildings based on user activity: A survey.
Energy and Buildings, 56, 244–257.
Nicholson, S. (2012). A User-Centered Theoretical Framework for Meaningful Gamification. In C. Martin, A. Ochsner, & K. Squire (Eds.), Proceedings GlLS 8.0 Games + Learning + Society Conference (pp. 223–230). Madison, WI: ETC Press.
ODYSSEE. (2015). Free Energy Indicators. ODYSSEE Database.
Orland, B., Ram, N., Lang, D., Houser, K., Kling, N., & Coccia, M. (2014). Saving energy in an office environment: A serious game intervention. Energy & Buildings, 74, 43–52.
Pagulayan, R. J., Keeker, K., Wixon, D., Romero, R. L., & Fuller, T. (2002). User-centered Design in Games. Boca Raton, FL: CRC Press.
Papaioannou, T., Dimitriou, N., Vasilakis, K., Schoofs, A., Nikiforakis, M., Pursche, F., Garbi, A. (2018). An IoT-Based Gamified Approach for Reducing Occupants’ Energy Wastage in Public Buildings. Sensors, 18(2), 537.

AGILE USER-CENTERED DESIGN OF AN IOT-ENABLED GAMIFIED INTERVENTION FOR
ENERGY CONSERVATION AT THE WORKPLACE
25
Pickard, T. (2015). 5 Statistics That Prove Gamification is the Future of the Workplace. business.com.
Reeves, B., Cummings, J. J., Scarborough, J. K., Flora, J., & Anderson, D. (2012). Leveraging the engagement of games to change energy behavior. Proceedings of the 2012 International Conference on Collaboration Technologies and Systems, CTS 2012, 354–358.
Robson, K., Plangger, K., Kietzmann, J. H., McCarthy, I., & Pitt, L. (2015). Is it all a game? Understanding the principles of gamification. Business Horizons.
Robson, K., Plangger, K., Kietzmann, J., Mccarthy, I., & Pitt, L. (2014). Understanding Gamification of Consumer Experiences. Advances in Consumer Research, 42, 352–357.
Rodrigues, L. F., Costa, C. J., & Oliveira, A. (2016). Gamification: A framework for designing software
in e-banking. Computers in Human Behavior, 62, 620–634.
Roos, D., & Hahn, R. (2017). Understanding Collaborative Consumption: An Extension of the Theory of Planned Behavior with Value-Based Personal Norms. Journal of Business Ethics.
Scherbaum, C., Popovich, P., & Finlinson, S. (2008). Exploring individual-level factors related to employee energy conservation behaviours at work. Journal of Applied Social Psychology, 38(3), 818–835.
Seaborn, K., & Fels, D. I. (2015). Gamification in theory and action: A survey. International Journal of Human Computer Studies, 74, 14–31.
Spears, N., & Singh, S. N. (2004). Measuring Attitude Toward the Brand and Purchase Intentions. Journal of Current Issues and Research in Advertising, 26(2), 53–66.
Stephenson, J., Barton, B., Carrington, G., Gnoth, D., Lawson, R., & Thorsnes, P. (2010). Energy cultures: A framework for understanding energy behaviours. Energy Policy, 38(10), 6120–6129.
UN News Centre. (2016). ‘ Today is an historic day ,’ says Ban , as 175 countries sign Paris climate accord. www.un.org.
Uskov, A., & Sekar, B. (2015). Smart Gamification and Smart Serious Games. In Fusion of Smart,
Multimedia and Computer Gaming Technology: Research, Systems and Perspectives (Vol. 84, pp. 7–36). Springer International Publishing.
Webb, E. N. (2013). Gamification : When It Works , When It Doesn ’ t. Lecture Notes in Computer Science (including subseries Lecture Notes in Artificial Intelligence and Lecture Notes in Bioinformatics), 8013 LNCS(PART 2), 608–614.
Werbach, K., & Hunter, D. (2012). For The Win: How Game Thinking can revolutionize your business.
Philadelphia, PA: Wharton Digital Press, The Wharton School, University of Pensylvania.
WeSpire. (2017). WeSpire - Employee Engagement Platform Powered by Behavioral Science.