Aggregation of euphausiids along a coastal shelf in … of euphausiids along a coastal shelf in an...
13
Vol. 32: 203-215, 1986 MARINE ECOLOGY - PROGRESS SERIES Mar. Ecol. h o g . Ser. Published September 18 Aggregation of euphausiids along a coastal shelf in an upwelling environment Yvan Simard*, Rejean de Ladurantaye & Jean-Claude Therriault Centre Champlain des Sciences de la mer, Ministere des PIches et des Oceans. C.P. 15500,901 Cap Diamant. Quebec, Quebec GIK 7Y7. Canada ABSTRACT: Spatial distribubon of biomass of euphausiids in the St. Lawrence estuary was investi- gated using high frequency (104 kHz) echo integration. Most of the euphausiids were aggregated in a long (>l00 km) narrow (1 to 7 km) patch along the northern edge of the Laurentian Channel. Biomass in the patch was higher than 1 g dry wt m-2 and showed well-defined zones of a few km2 with higher biomasses (up to 22.2 g dry wt m-'). Mean density in the patch was - 60 mg dry wt m-3. Euphausiids were found at depths varying between 50 and 175 m, often with large concentrations just above the bottom. The vertical distribution was characterized by 2 principal modes, at 75 and 150 m. In the first mode, Thysanoessa raschi was the dominant organism while in the second mode, Meganyctiphanes norvegica was dominant. Vertical and horizontal distribution patterns of temperature and salinity indicated that upwelling was occurring during the survey. It is suggested that the aggregation of euphausiids along one edge of the channel resulted from the interaction of the negative phototaxis of the animals with the upwehng and mean circulation in the area. The euphausiids were passively transported towards the north shore by the circulation, up to a boundary corresponding to a barrier imposed by underwater daylight penetration, where they accumulated. Thls resulted in the formation of a long narrow patch along bathymetric contours on the upwelling side of the Laurentian Channel in the St. Lawrence estuary. INTRODUCTION It has long been known that zooplankton is not evenly or randomly distributed in the sea, but rather aggregated in patches varying in size over a wide range of scales (see review by Haury et al. 197 8). These aggregations are controlled by various environmental and biological processes acting on different time and space scales (Haury et al. 1978, Longhurst 1981, Owen 1981, Mackas et al. 1985). Since aggregation of food is necessary for efficient feedlng at all trophic levels, identification of aggregation mechanisms is of major importance for our understanding of energy flow in the marine food web, as well as of factors regulating the stability of marine ecosystems (Steele 1976, 1978). The study of spatial organization of zooplankton at sea requires well-defined sampling strategies and ade- quate instruments to control the high level of variabil- ity inherent to plankton distribution (Denman & Mac- kas 1978, Haury et al. 1978, Herman & Platt 1980, Present address: Institute of Ocean Sciences. P.O. Box 6000, Sidney. British Columbia V8L 4B2, Canada O Inter-Research/Printed in F. R. Germany Ortner et al. 1983). One of the methods recently developed to study the spatial distribution of macro- zooplankton is the use of high frequency echosounding to locate aggregations and estimate their biomass. Pieper (1979) and Sameoto (1980) have shown that this technique gives good estimates of euphausiid biomass. It has the main advantages of estimating zooplankton concentrations easily and rapidly in large volumes, and continuously in 2 dimensions (Denman & Mackas 1978, Pieper 1983). In this paper we use such a techni- que to study the distribution of euphausiids in the Lower St. Lawrence estuary. Our aim was (1) to esti- mate euphausiid biomass in the scattering layers, (2) to study distribution and aggregation in both horizontal and vertical dimensions, and (3) to investigate the mechanisms responsible for patch formation and maintenance. In agreement with Mauchline (1980), we use the term 'aggregation' as designating a grouping together of the animals; it does not, however, qualify the structure or the mechanism of formation. A 'patch' is an aggregation in a defined area, generated and maintained by environmental factors. An 'accumula- tion' is an aggregation where the animals are gradu-
Transcript of Aggregation of euphausiids along a coastal shelf in … of euphausiids along a coastal shelf in an...

Vol. 32: 203-215, 1986 MARINE ECOLOGY - PROGRESS SERIES Mar. Ecol. h o g . Ser. Published September 18
Aggregation of euphausiids along a coastal shelf in an upwelling environment
Yvan Simard*, Rejean de Ladurantaye & Jean-Claude Therriault
Centre Champlain des Sciences de la mer, Ministere des PIches et des Oceans. C.P. 15500,901 Cap Diamant. Quebec, Quebec GIK 7Y7. Canada
ABSTRACT: Spatial distribubon of biomass of euphausiids in the St. Lawrence estuary was investi- gated using high frequency (104 kHz) echo integration. Most of the euphausiids were aggregated in a long (>l00 km) narrow (1 to 7 km) patch along the northern edge of the Laurentian Channel. Biomass in the patch was higher than 1 g dry wt m-2 and showed well-defined zones of a few km2 with higher biomasses (up to 22.2 g dry wt m-'). Mean density in the patch was - 60 mg dry wt m-3. Euphausiids were found at depths varying between 50 and 175 m, often with large concentrations just above the bottom. The vertical distribution was characterized by 2 principal modes, at 75 and 150 m. In the first mode, Thysanoessa raschi was the dominant organism while in the second mode, Meganyctiphanes norvegica was dominant. Vertical and horizontal distribution patterns of temperature and salinity indicated that upwelling was occurring during the survey. It is suggested that the aggregation of euphausiids along one edge of the channel resulted from the interaction of the negative phototaxis of the animals with the upwehng and mean circulation in the area. The euphausiids were passively transported towards the north shore by the circulation, up to a boundary corresponding to a barrier imposed by underwater daylight penetration, where they accumulated. Thls resulted in the formation of a long narrow patch along bathymetric contours on the upwelling side of the Laurentian Channel in the St. Lawrence estuary.
INTRODUCTION
It has long been known that zooplankton is not evenly or randomly distributed in the sea, but rather aggregated in patches varying in size over a wide range of scales (see review by Haury et al. 197 8). These aggregations are controlled by various environmental and biological processes acting on different time and space scales (Haury et al. 1978, Longhurst 1981, Owen 1981, Mackas et al. 1985). Since aggregation of food is necessary for efficient feedlng at all trophic levels, identification of aggregation mechanisms is of major importance for our understanding of energy flow in the marine food web, as well as of factors regulating the stability of marine ecosystems (Steele 1976, 1978).
The study of spatial organization of zooplankton at sea requires well-defined sampling strategies and ade- quate instruments to control the high level of variabil- ity inherent to plankton distribution (Denman & Mac- kas 1978, Haury et al. 1978, Herman & Platt 1980,
Present address: Institute of Ocean Sciences. P.O. Box 6000, Sidney. British Columbia V8L 4B2, Canada
O Inter-Research/Printed in F. R. Germany
Ortner et al. 1983). One of the methods recently developed to study the spatial distribution of macro- zooplankton is the use of high frequency echosounding to locate aggregations and estimate their biomass. Pieper (1979) and Sameoto (1980) have shown that this technique gives good estimates of euphausiid biomass. It has the main advantages of estimating zooplankton concentrations easily and rapidly in large volumes, and continuously in 2 dimensions (Denman & Mackas 1978, Pieper 1983). In this paper we use such a techni- que to study the distribution of euphausiids in the Lower St. Lawrence estuary. Our aim was (1) to esti- mate euphausiid biomass in the scattering layers, (2) to study distribution and aggregation in both horizontal and vertical dimensions, and (3) to investigate the mechanisms responsible for patch formation and maintenance. In agreement with Mauchline (1980), we use the term 'aggregation' a s designating a grouping together of the animals; it does not, however, qualify the structure or the mechanism of formation. A 'patch' is an aggregation in a defined area, generated and maintained by environmental factors. An 'accumula- tion' is an aggregation where the animals are gradu-

204 Mar. Ecol. Prog. Ser. 32: 203-2151, 1986
ally concentrated in response to mechanisms other than behavioral reactions between individuals.
METHODS
The sampling area was the upstream 110 km of the lower St. Lawrence estuary (Fig. 1). The bathymetry in this area is characterized by the presence of a 300 m deep depression, the Laurentian Channel, w h c h com- municates directly with the Gulf of St. Lawrence and the Atlantic ocean. This channel is bordered on both sites by coastal shelves < 100 m deep, except in the region upstream of Les Escournins where the north coast falls directly into the channel. Sampling was done along 5 transects between 22 and 26 July 1982, during the transition period from spring (4.5 m) to neap (3 m) tides. The positioning of transects (Fig. 1) gave emphasis to measurements along the channel slopes, where a preliminary survey in May 1982 had shown higher zooplankton concentrations.
The scattering layers were continuously monitored with a Ross-805 echosounder, equipped with a 104 kHz transducer of 3.5" half-power beam width mounted into a towed fish. Towing speed was about 5 knots. Acous- tic signals were digitized on board with a 12 bit analogldigital interface connected to an Apple I1 micro-computer, and the average of 112 signals (1 min) was recorded at 2 min intervals. All transect measure- ments started on the north shore and were carried out during daytime (from 0730 h EDT to 1830 h EDT), when the vertically migrating zooplankton was at its
day depth. The recorded acoustic data series were regularly interrupted for CTD profiling (CTD Guild- line-8750) and zooplankton sampling in the scattering layers. Additional CTD profiles were also made along the transects during the night, on the way back to the north shore. The positions of the 87 CTD profiles made during the survey are indicated in Fig. 1. The zoo- plankton samples were collected using a modified opening/closing Tucker Trawl (Sameoto & Jarozynski 1976) with a 1 m2 mouth opening, a 570 ym mesh blue net and a flowmeter. Fishing depth was monitored with a Sea-Trace (Communications Associates Inc., Huntington, New York) acoustic depth monitoring sys- tem (a pressure sensitive transducer h k e d to a deck unit through a surface hydrophone). Towing speed was - 3 to 4 knots, and the volume of water filtered aver- aged 300 m3 (range: 180 to 460 m3). The zooplankton samples were frozen (-20 "C) for later analysis in the laboratory. A total of 29 tows were made (Fig. 1).
Euphausiids in the zooplankton samples were sorted, identified, counted and weighed (dry weight). The acoustic data were used to compute the relative zooplankton biomass m-3 within the water column (p) according to the standard echo integration model (Burczynski 1979):
where I, = echo intensity; I, = source intensity; r =
range from the transducer (depth); a. = absorption coefficient of sound; p = relative zooplankton biomass - m-3; a = mean equivalent backscattering cross-sec-
Fig. 1. Map of study area showing isobath contours (m), positions of the 5 echosounding transects and positions of CTD profiles (.) and net tows (0)

S~mard et al. Aggregalon of euphausiids along a coastal shelf 205
tion of a zooplankter. Since I, V', for I. and U R
E constant, we get: m m u
p V2 r2 1ozm (2)
where V = recorded raw voltage corrected for system noise.
According to this model, the relative zooplankton biomass m-3 (p) is proportional to the squared voltage (V2) corrected for the decrease in sound intensity due to spreading (r4) and attenuation ( 1 0 ' ~ ) and for the insonified volume (r-2). T h s relative zooplankton biomass could then be transformed in an absolute estimate (mg dry weight m-3) by mean of a Linear regression on euphausiid biomass from net tows (Fig. 2). The biomass of euphausiids m-2 was obtained by integrating over depth, from 30 m to the bottom. a BIOMASS OF EUPHAUSllDS
( mg d r y we~ght m-')
RESULTS
The horizontal dstribution of the biomass of euphausiids in the study area shows that they were m a d y concentrated in a long narrow patch along the northern side of the Laurentian Channel (Fig. 3). Its length extended beyond the 100 km surveyed and its width varied between 1 and 7 km. The biomass within the patch was higher than 1 g dry wt m-? and showed well-defined zones of higher values at various loca- tions, up to -22.2 g dry wt m-'. The densest zones (> 15 g dry wt m-2) were located off Les Escoumins and in the downstream section of the sampling area. The biomass outside of this elongated northern patch was distributed in very small patches of values higher than 1 g dry wt m-', which were enveloped in a narrow low-biomass (0.25 to 1 g dry wt m-') area along the
Fig. 2. Relation between the acoustic estimates of zooplank- ton biomass (p) and euphauslld biomass (dry weight) from net catches. Regression equation and Pearson r2 when forced
through the ongin
southern side of the channel. In the middle of the channel, the background biomass gradually decreased from 0.5 g dry wt m-2 in the upstream region to negligible values < 0.25 g dry wt m-' downstream. No significant biomass was recorded in areas shallower than 40 m on both sides of the Laurentian Channel. In brief, the overall distribution of euphausiid biomass in the study area was U-shaped along the edges of the Laurentian Channel, with the northern branch of the U much denser than the southern branch and an upstream enlargement of the base of the U at the head of the channel.
BIOMASS OF EUPHAUSIIDS ( g d ry w e ~ g h t m ," FORESTVILL
Fig. 3. Honzontal distribution of euphausiid biornass from acoustic esti- mation. Biomass contours are: 0.25, 0.5, 1 (light stippling), 2 (heavy stippling) and
> 4 (black) g dry weight
0 10 2 0 k m
TROIS-PI STOLES

206 Mar. Ecol. Prog. Ser. 32: 203-215, 1986
Typical representations of the vertical and horizontal structure of the aggregation along the transects are shown in Fig. 4. Most of the euphausiids were found between 50 and 175 m and, usually, they were horizon- tally and vertically distributed in more than one scat- tering layer. The largest and densest scattering layer was located off Les Escoumins (Fig. 4: D- l ) . On the north shelf, significant biomasses were found close to
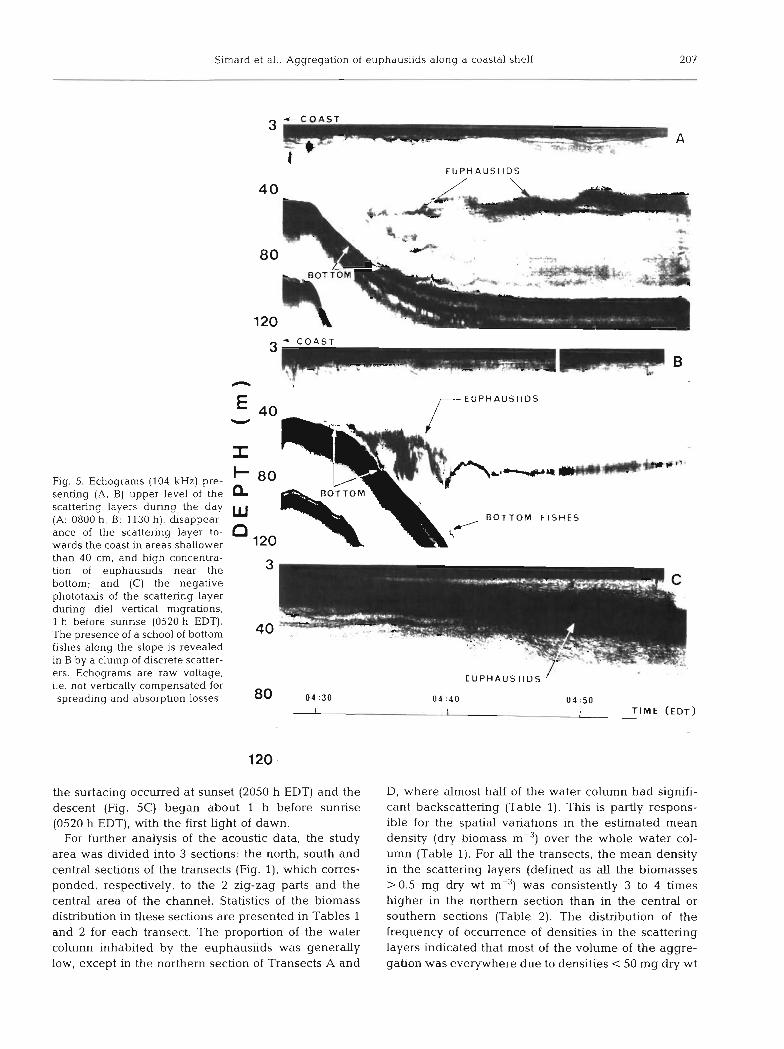
the bottom in areas shallower than 200 m (e.g. Fig. 4: A - l . B - l , B-2, D-l) . The maximum upper level of the scattering layers during the day was 40 to 50 m (e.g. Fig. 5 A , B & 6), which restricted the euphausiids to areas deeper than 40 m on both sides of the channel (e.g. Fig. 4: C-4, Fig. 5A, B). The euphausiid scattering layers exhibited typical die1 vertical migrations. The ascent to the surface began at the end of the afternoon,
Fig. 4. Computer visualization of vertical &stribution of euphausiids along transects from acoustic estimates. Increasing biornass from white to black (0 to > 13 rng dry weight m-'). Bars below letters A - l to E-2 represent
3 km
Slrnard et al.- Aggregation of euphausiids along a coastal shelf 207
Fig. 5. Echograms (104 kHz) pre- senting (A, B) upper level of the scattering layers during the day (A: 0800 h, B: 1130 h), disappear- ance of the scattering layer to- wards the coast in areas shallower
EUPHAUSllDS
3 C O A S T
than 40 cm, and h ~ g h concentra- tlon of euphaus~~ds near the bottom: and (C) the negatlve phototaus of the scattenng layer during die1 verbcal nugratlons 1 h before sunnse (0520 h EDT). The presence of a school of bottom flshes along the slope IS revealed in B by a clump of d~screte scatter-
, -. ?-
ers. Echograms are raw voltage, / EUPHAUSl lDS i.e. not vertically compensated for spreading and absorption losses 80 04 :30 04 :40 0 4 : 5 0
I I I T IME (EDT)
the surfacing occurred at sunset (2050 h EDT) and the descent (Fig. 5C) began about 1 h before sunrise (0520 h EDT), with the first Light of dawn.
For further analysis of the acoustic data, the study area was divided into 3 sections: the north, south and central sections of the transects (Fig. l), which corres- ponded, respectively, to the 2 zig-zag parts and the central area of the channel. Statistics of the biomass distribution in these sections are presented in Tables 1 and 2 for each transect. The proportion of the water column inhabited by the euphausiids was generally low, except in the northern section of Transects A and
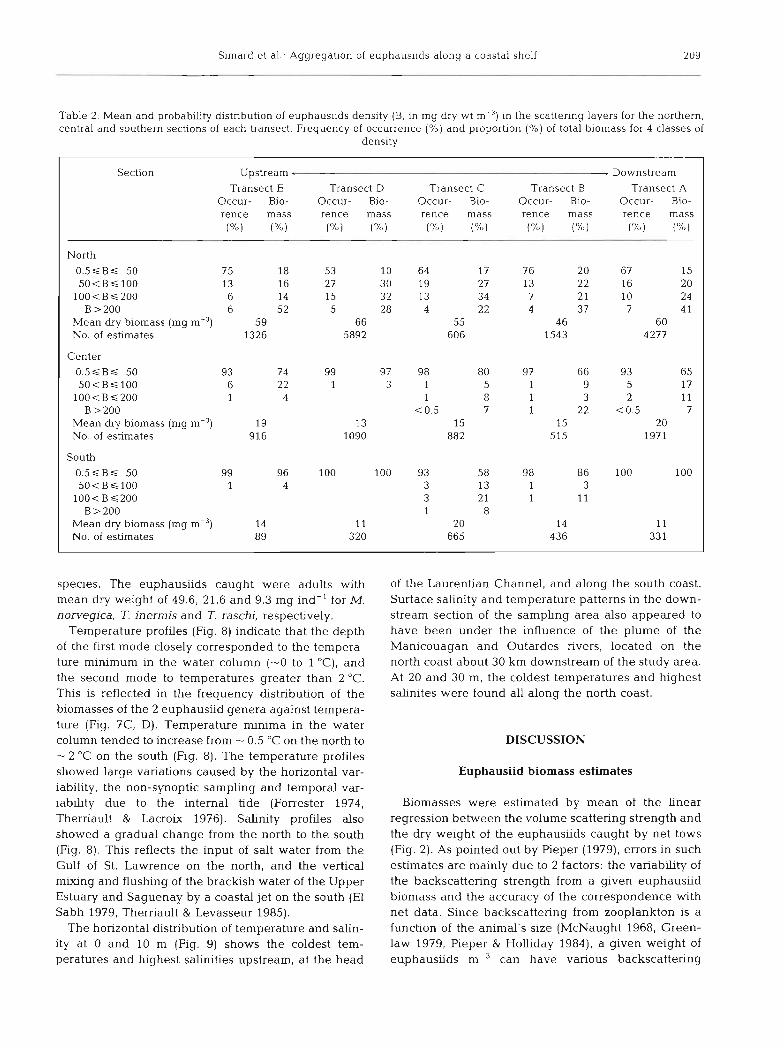
D, where almost half of the water column had signifi- cant backscattering (Table 1). This is partly respons- ible for the spatial variations in the estimated mean density (dry biornass m-3) over the whole water col- umn (Table 1). For all the transects, the mean density in the scattering layers (defined as all the biornasses >0.5 rng dry wt m-3) was consistently 3 to 4 times higher in the northern section than in the central or southern sections (Table 2). The distribution of the frequency of occurrence of densities in the scattering layers indicated that most of the volume of the aggre- gation was everywhere due to densities < 50 mg dry wt
208 Mar. Ecol. Prog. Ser. 32: 203-215, 1986
P U P S T R E A M DOWNSTREAM W
E U P H A U S I I D B IOMASS ( % )
T R A N S E C T E T R A N S E C T D T R A N S E C T C T R A N S E C T 8 TRANSECT A
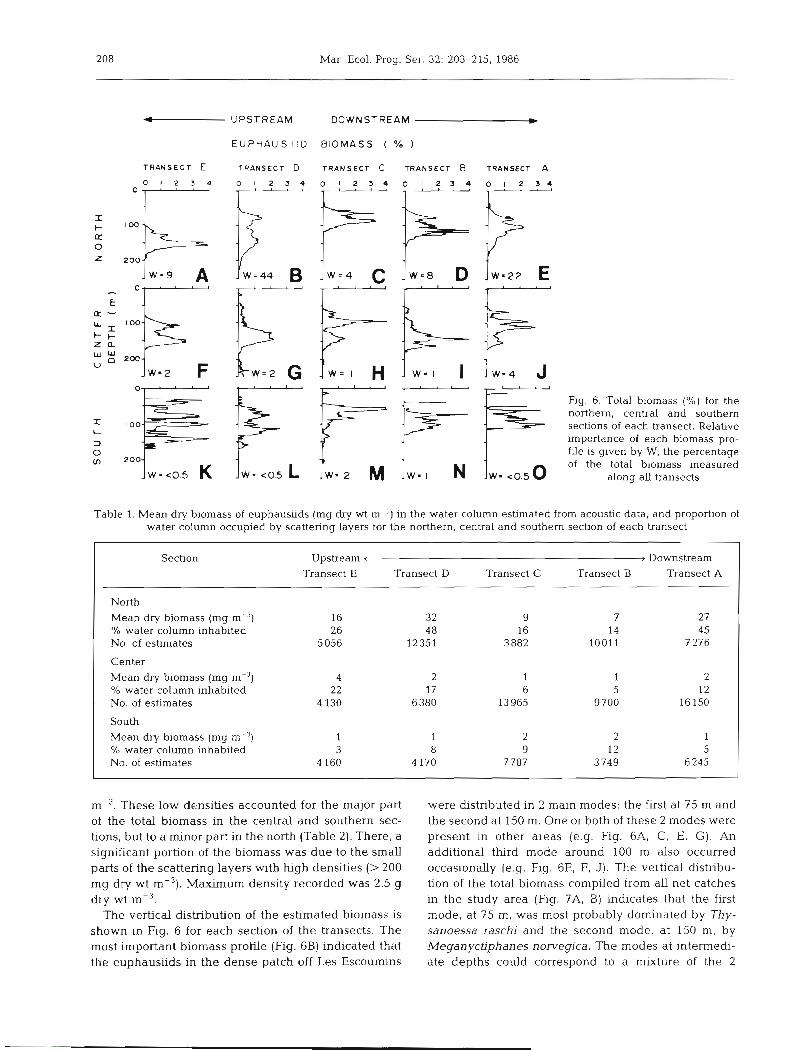
Fig. 6. Total biomass (%) for the northern, central and southern sections of each transect. Relative importance of each biomass pro- file is given by W, the percentage of the total blomass measured
along all transects
Table 1. Mean dry biomass of euphausiids (mg dry wt m-3) in the water column estimated from acoustic data, and proportion of water column occupied by scattering layers for the northern, central and southern section of each transect
Section Upstream < , Downstream Transect E Transect D Transect C Transect B Transect A
North Mean dry biomass (mg m-3) 32 9 7 27 % water column inhabited 48 16 14 4 5 No, of estimates 12351 3 882 l0011 7 276
Center Mean dry biornass (mg m-3) 4 2 1 1 2 O/O water column inhabited 22 17 6 5 12 No. of estimates 4 130 6380 13965 9 700 16 150
South Mean dry biomass (mg m - < ) 1 1 2 2 l % water column inhabited 3 8 9 12 5 No. of estimates 4 160 4 170 7 787 3 749 6245
m-3. These low densities accounted for the major part of the total biomass in the central and southern sec- tions, but to a minor part in the north (Table 2). There, a significant portion of the biomass was due to the small parts of the scattering layers with high densities (> 200 mg dry wt m-3). Maximum density recorded was 2.5 g dry wt m-3.
The vertical distribution of the estimated biomass is shown in Fig. 6 for each section of the transects. The most important biomass profile (Fig. 6B) indicated that the euphausiids in the dense patch off Les Escoumins
were dstributed in 2 maln modes: the first at 75 m and the second a t 150 m. One or both of these 2 modes were present in other areas (e.g. Fig. 6A, C, E, G). An additional third mode around 100 m also occurred occasionally (e.g. Fig. 6E, F, J). The vertical distribu- tion of the total biomass compiled from all net catches in the study area (Fig. ?A, B) indicates that the first mode, at 75 m, was most probably dominated by Thy- sanoessa raschi and the second mode, at 150 m, by Meganyctiphanes norvegica. The modes at intermedi- ate depths could correspond to a mixture of the 2
Simard et a1 : Aggregation of euphausiids along a coastal shelf 209
Table 2. Mean and probabdity distnbution of euphausiids density (B, in nlg dry wt m-') in the scattering layers for the northern, central and southern sections of each transect. Frequency of occurrence (%) and proporbon (%) of total biomass for 4 classes of
density
Section Upstream , Downstream
Transect E Transect D Transect C Transect B Transect A Occur- Bio- Occur- Bio- Occur- Bio- Occur- Bio- Occur- Bio- rence mass rence mass rence mass rence mass rence mass (%) (?o) (%) ("h) (%) ("6) (%) ("10) (S) ("h)
North
0 . 5 S B S 50 75 18 53 10 64 17 7 6 20 67 15 50<BS100 13 16 27 30 19 27 13 22 16 20
100<BS200 6 14 15 32 13 34 7 2 1 10 24 B > 200 6 5 2 5 28 4 22 4 37 7 4 1
Mean dry biomass (mg m-3) 59 66 55 4 6 60 No. of estimates 1326 5892 606 1543 4277
Center
0 . 5 S B S 50 93 74 99 97 98 80 97 66 93 65 50<BS100 6 2 2 1 3 1 5 1 9 5 17
100<BS200 1 4 1 8 1 3 2 11 B > 200 < 0.5 7 1 22 <0.5 7
Mean dry biomass (mg m?) 19 13 15 15 20 No. of esbmates 916 1090 882 515 1971
South 0 . 5 S B S 50 99 96 100 100 93 58 98 86 100 100 5 0 < B s 1 0 0 1 4 3 13 1 3
100<BS200 3 2 1 1 11 B > 200 1 8
Mean dry biomass (mg 14 11 20 14 11 No. of estimates 89 320 665 436 33 1
species. The euphausiids caught were adults with mean dry weight of 49.6, 21.6 and 9.3 mg ind-' for M. norvegica, T. inerrnis and T. raschi, respectively.
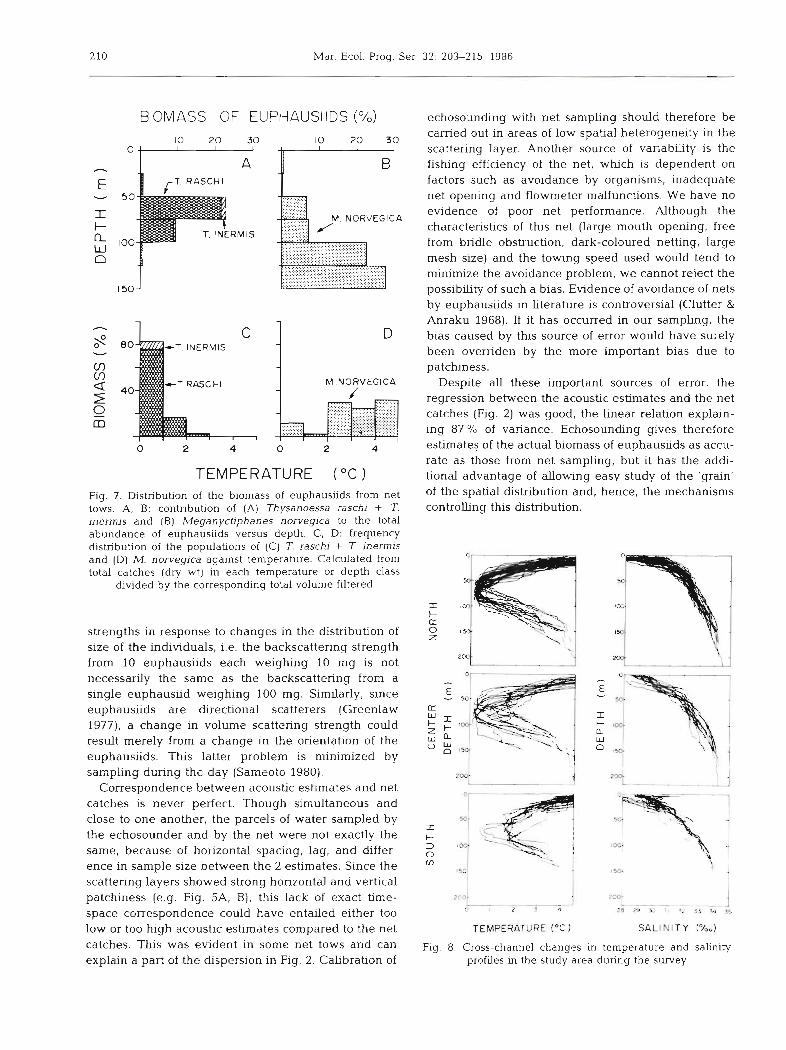
Temperature profiles (Fig. 8) indicate that the depth of the first mode closely corresponded to the tempera- ture minimum in the water column (-0 to 1 "C), and the second mode to temperatures greater than 2 "C. This is reflected in the frequency distribution of the biomasses of the 2 euphausiid genera against tempera- ture (Fig. 7C, D). Temperature minima in the water column tended to increase from - 0.5 "C on the north to - 2 "C on the south (Fig. 8) . The temperature profiles showed large variations caused by the horizontal var- iabihty, the non-synoptic sampling and temporal var- iability due to the internal tide (Forrester 1974, Therriault & Lacroix 1976). Sahnity profiles also showed a gradual change from the north to the south (Fig. 8). This reflects the input of salt water from the Gulf of St. Lawrence on the north, and the vertical mixing and flushing of the brackish water of the Upper Estuary and Saguenay by a coastal jet on the south (El Sabh 1979, Therriault & Levasseur 1985).
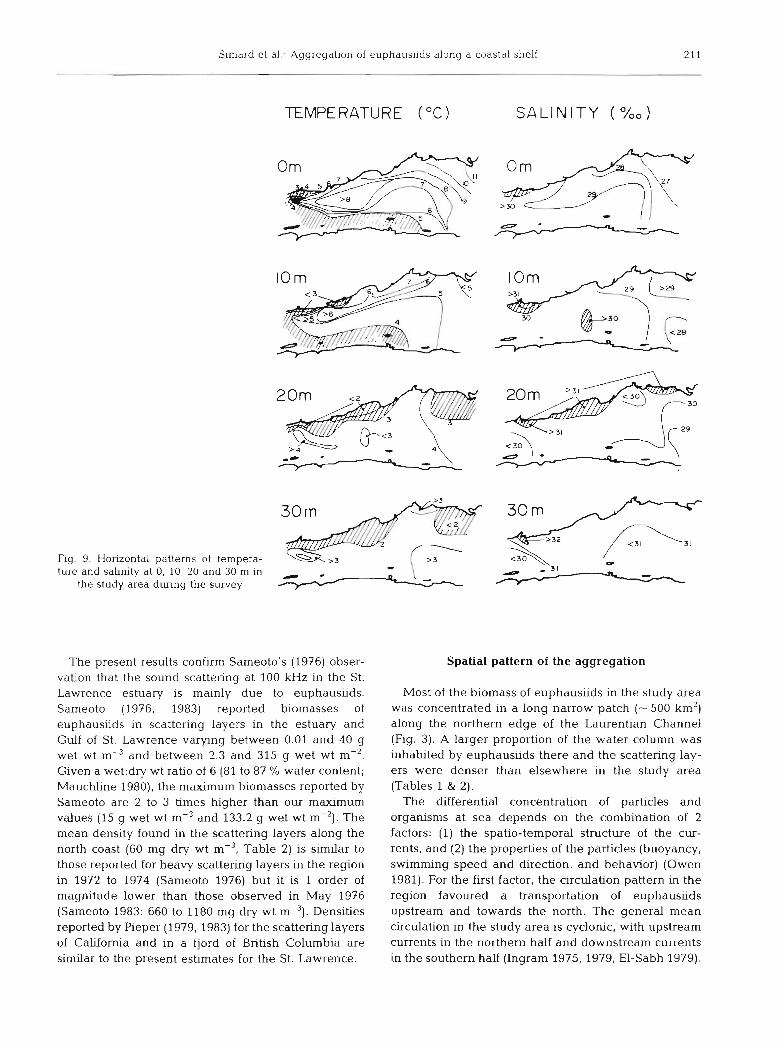
The horizontal distribution of temperature and salin- ity at 0 and 10 m (Fig. 9) shows the coldest tem- peratures and highest salinities upstream, at the head
of the Laurentian Channel, and along the south coast. Surface salinity and temperature patterns in the down- stream section of the sampling area also appeared to have been under the influence of the plume of the Manicouagan and Outardes rivers, located on the north coast about 30 km downstream of the study area. At 20 and 30 m, the coldest temperatures and hghes t sahnites were found all along the north coast.
DISCUSSION
Euphausiid biomass estimates
Biomasses were estimated by mean of the linear regression between the volume scattering strength and the dry weight of the euphausiids caught by net tows (Fig. 2). As pointed out by Pieper (1979), errors in such estimates are mainly due to 2 factors: the vanabhty of the backscattering strength from a given euphausiid biomass and the accuracy of the correspondence with net data. Since backscattering from zooplankton is a function of the animal's size (McNaught 1968, Green- law 1979, Pleper & Holliday 1984), a given weight of euphausiids nY3 can have various backscattering
210 Mar. Ecol. Prog. Ser 32: 203-215, 1986
TEMPERATURE ( "C ) Fig. 7. Distribution of the biomass of euphausiids from net tows. A, B: contribution of (A) Thysanoessa raschj + T. inermis and ( B ) Meganyctiphanes norvegica to the total abundance of euphausiids versus depth. C, D: frequency distribution of the populations of (C) T. raschi + T inermis and ( D ) M. norvegica against temperature. Calculated from total catches (dry wt) in each temperature or depth class
divided by the corresponding total volume filtered
strengths in response to changes in the distribution of size of the individuals, i.e. the backscattering strength from 10 euphausiids each weighing 10 mg is not necessarily the same as the backscattering from a single euphausiid weighing 100 mg. Similarly, since euphausiids are directional scatterers (Greenlaw 1977), a change in volume scattering strength could result merely from a change in the orientation of the euphausiids. This latter problem is minimized by sampling during the day (Sameoto 1980).
Correspondence between acoustic estimates and net catches is never perfect. Though simultaneous and close to one another, the parcels of water sampled by the echosounder and by the net were not exactly the same, because of horizontal spacing, lag, and differ- ence in sample size between the 2 estimates. Since the scattering layers showed strong horizontal and vertical patchiness (e.g. Fig. 5A, B) , this lack of exact time- space correspondence could have entailed either too low or too high acoustic estimates compared to the net catches. This was evident in some net tows and can explain a part of the dispersion in Fig. 2. Calibration of
echosounding with net sampling should therefore be carried out in areas of low spahal heterogeneity in the scattering layer. Another source of variability is the fishing efficiency of the net, which is dependent on factors such as avoidance by organisms, inadequate net opening and flowmeter malfunctions. We have no evidence of poor net performance. Although the characteristics of this net (large mouth opening, free from bridle obstruction, dark-coloured netting, large mesh size) and the towing speed used would tend to minimize the avoidance problem, we cannot reject the possibility of such a bias. Evidence of avoidance of nets by euphausiids in literature is controversial (Clutter &
Anraku 1968). If it has occurred in our sampling, the bias caused by this source of error would have surely been overriden by the more important bias due to patchiness.
Despite all these important sources of error, the regression between the acoustic estimates and the net catches (Fig. 2) was good, the linear relation explain- ing 87 % of variance. Echosounding gives therefore estimates of the actual biomass of euphausiids as accu- rate as those from net sampling, but it has the addi- tional advantage of allowing easy study of the 'grain' of the spatial distribution and, hence, the mechanisms controlling this distribution.
z i > i I ZOO; -p- -. L _- _ . _ - . U I Z S ~ :B w 3, r, 33 Y 35
TEMPERATURE ("C S A L I N I T Y W.)
Fig. 8. Cross-channel changes In temperature and salin~ty profiles in the study area during the survey
Sirnard et al.: Aggregation of euphausiids along a coastal shelf 21 1
TEMPERATURE ("C) S A L I N I T Y (%o)
Fig 9 Honzontal patterns of tempera- ture and sahn~ty at 0, 10. 20 and 30 m In
the study area dunng the survey
The present results confirm Sameoto's (1976) obser- vation that the sound scattering at 100 kHz in the St. Lawrence estuary is mainly due to euphausiids. Sameoto (1976, 1983) reported biomasses of euphausiids in scattering layers in the estuary and Gulf of St. Lawrence varying between 0.01 and 40 g wet wt m-3 and between 2.3 and 315 g wet wt m-2. Given a wet:dry wt ratio of 6 (81 to 87 O/O water content; Mauchline 1980), the maximum biomasses reported by Sameoto are 2 to 3 times higher than our maximum values (15 g wet wt m-3 and 133.2 g wet wt m-2). The mean density found in the scattering layers along the north coast (60 mg dry wt m-3, Table 2) is similar to those reported for heavy scattering layers in the region in 1972 to 1974 (Sameoto 1976) but it is 1 order of magnitude lower than those observed in May 1976 (Sameoto 1983: 660 to 1180 mg dry wt m-3). Densities reported by Pieper (1979, 1983) for the scattering layers of California and in a fjord of British Columbia are similar to the present estimates for the St. Lawrence.
Spatial pattern of the aggregation
Most of the biomass of euphausiids in the study area was concentrated in a long narrow patch (-500 km2) along the northern edge of the Laurentian Channel (Fig. 3). A larger proportion of the water column was inhabited by euphausiids there and the scattering lay- ers were denser than elsewhere in the study area (Tables 1 & 2).
The differential concentration of particles and organisms at sea depends on the combination of 2 factors: (1) the spatio-temporal structure of the cur- rents, and (2) the properties of the particles (buoyancy, swimming speed and direction, and behavior) (Owen 1981). For the first factor, the circulation pattern in the region favoured a transportation of euphausiids upstream and towards the north. The general mean circulation in the study area is cyclonic, with upstream currents in the northern half and downstream currents in the southern half (Ingram 1975, 1979, El-Sabh 1979).
212 Mar. Ecol. Prog. Ser.
At the head of the Laurentian Channel, a large amplitude internal tide (vertical range up to 120 m, Therriault & Lacroix 1976) is generated (Forrester 1974) and causes upwelling of deep water and inten- sive vertical mixing (Ingram 1975, 1979, 1983, Therriault & Lacroix 1976). The actual circulation at a given time can also be influenced by important semi- diurnal, semi-monthly and other lower frequency fluc- tuations, and by cross-channel currents (Forrester 1974, El-Sabh 1979, Ingram 1979, El-Sabh et al. 1982). During the sampling period, deep water was upwelled at the head of the Laurentian Channel (Fig. 9; 0 and 10 m) and along the north coast (Fig. 9; 10 to 30 m). This implies a mean flow in deep waters directed upstream accompanied by a cross-channel flow directed towards the north coast. This deep-water cir- culation pattern favoured transport of euphausiids upstream and towards the north shore.
In the surface waters, the temperature and salinity patterns (Fig. 9) were consistent with the above cy- clonic circulation. The upwelled waters at the head of Laurentian Channel were then directed towards the south shore by the general surface cross-channel flow (Ingram 1979) and mixed with the brackish waters from the Saguenay and the Upper estuary (Ingram 1983, Lebel et al. 1983), before being flushed down along the south shore of the Estuary (El-Sabh 1979, Therriault & Levasseur 1985). This is supported by the horizontal and vertical distributions of temperature and salinity (Fig. 8, 9). A surface cross-channel flow directed toward the north coast was also probably present in the downstream half of the study area as suggested by the curvatures of the 7 "C and 29 "A iso- lines (Fig. 9).
Following this general circulation pattern, the euphausiids in deep waters were transported upstream and towards the north coast in the northern half of the area during the day (16 h duration, from 0500 to 2100 h). At night, when a significant proportion of the euphausiid population was in the upper water column (see Simard et al. 1986), the euphausiids were also transported upstream along the north coast and down- stream along the south shore, with a possible northern cross-channel transport in the downstream section of the study area.
The second factor which may have contributed to the accumulation of euphausiids in a dense patch along the north shore is the avoidance of underwater day- Light by the organisms. It is well known that diel verbcal migrations of scattenng layers in the sea are controlled by underwater light (e.g. Clarke & Backus 1956, 1964, Boden & Kampa 1958, 1967, Kampa 1975). According to the model proposed by Forward et al. (1984), animals swim upward in the dark, up to a particular isolume which stimulates a sinking response
and, thus, acts as a barrier for vertical displacements. A similar hypothesis had been suggested by Pearre (1973) for chaetognaths. In support of this light-banier hypothesis are the observations of (1) a close corres- pondence between the depth of a particular isolume and the top of the scattering layer during diel vertical migrations (Boden & Kampa 1967), (2) the verbcal movements of scattering layers during a total solar eclipse (Kampa 1975), and (3) the observations of the negative phototaxis of the scattenng layers in the St. Lawrence in response to the first light of dawn (e.g. Fig. 5C; see also Simard et al. 1985, 1986).
The present observations (Fig. 4, 5 & 6) and those of Simard et al. (1986) in the same area immehately after the present survey suggest that one of the light- Limiting barriers was located at about the 40 to 50 m depth in the Estuary. The euphausiids would have accumulated upstream and along the north shore below the Light barrier, under upwelling conditions. Meganyctiphanes norvegica is known to inhabit greater depths (> 100 m) than Thysarioessa raschi (> 50 m) (Mauchline 1980), as observed in this study (Fig. 6 & 7) and thus, the light limitation level might not be the same for the 2 species. Both species swim sufficiently fast (- 1 to 5 cm S - ' ; Hardy & Bainbridge 1954) to compensate for the vertical mean flow due to upwelling.
In addition to this mechanism, special hydrodynamic conditions associated with the channel slope could also have contributed to the accumulation of euphausiids (closed circulation, internal waves, pulsed intrusions of channel waters on the shelf and their interaction with the euphausiid behavior). Moreover, the association of Thysanoessa raschi with the coldest waters (Fig. 7A, also reported by Sameoto 1976, 1980, Simard et al. 1986) could be a coincidence with an isolume but equally a real temperature preference. With the present data, it is not possible to discriminate between the 2 hypotheses but, if cold waters are actively sought by the organisms, the seasonal upstream advection of the cold intermediate layer from the Gulf of St. Lawrence (Ingram 1979) would also have led to higher concentrations of euphausiids in the Lower Estuary during the summer.
The light-scattering layers observed along the south shore of the channel (Fig. 3, Table 1) could result from the dispersion of the north patch at the head of the Laurentian Channel. Cross-channel currents (Ingram 1979) would drive parts of the patch to the south, where the organisms would be transported downstream by the rapid flushing circulation of the estuary. This turn- ing circulation from the north to the south at the head of the channel is probably marked by important tidal fluctuations. These might cause periodicity in the evacuation pattern of small parts of the north patch,
Simard et al.. Aggregation of euphauslids along a coastal shelf 213
which could explain the presence of dispersed small patches of euphausiids on the south (Fig. 3).
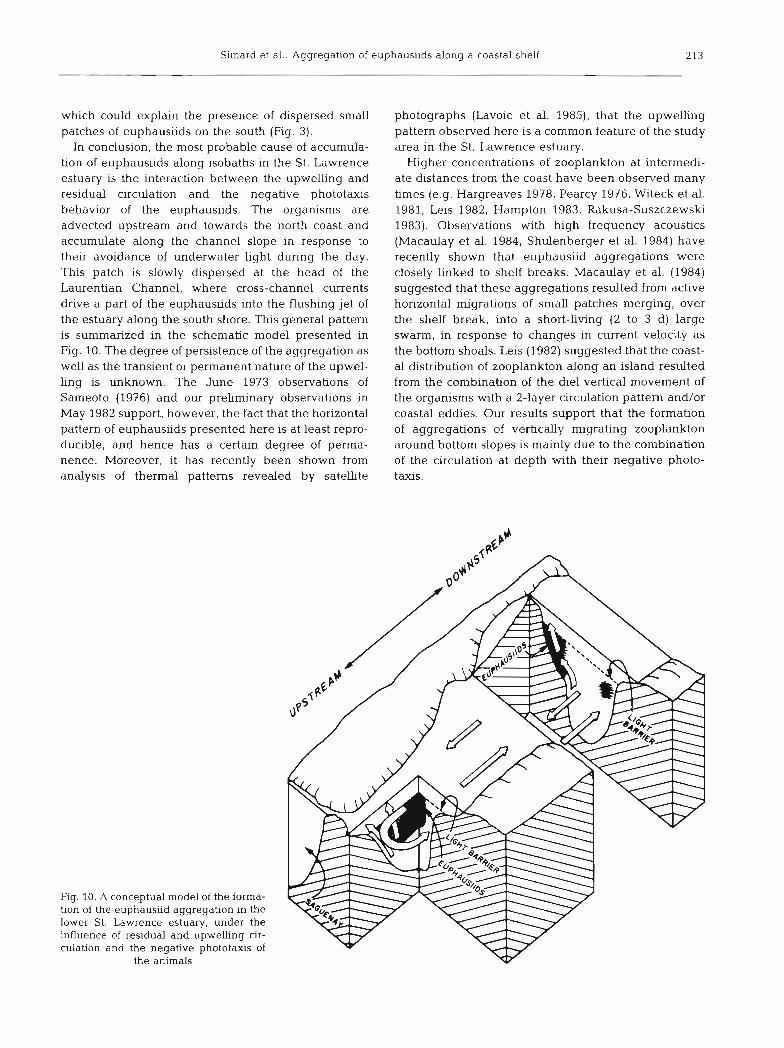
In conclusion, the most probable cause of accumula- tion of euphausiids along isobaths in the St. Lawrence estuary is the interaction between the upwelling and residual circulation and the negative phototaxis behavior of the euphausiids. The organisms are advected upstream and towards the north coast and accumulate along the channel slope in response to their avoidance of underwater light during the day. This patch is slowly dispersed at the head of the Laurentian Channel, where cross-channel currents drive a part of the euphausiids into the flushing jet of the estuary along the south shore. This general pattern is summarized in the schematic model presented in Fig. 10. The degree of persistence of the aggregation as well as the transient or permanent nature of the upwel- ling is unknown. The June 1973 observations of Sameoto (1976) and our preliminary observations in May 1982 support, however, the fact that the horizontal pattern of euphausiids presented here is at least repro- ducible, and hence has a certain degree of perma- nence. Moreover, it has recently been shown from analysis of thermal patterns revealed by satelhte
photographs (Lavoie et al. 1985), that the upwelling pattern observed here is a common feature of the study area in the St. Lawrence estuary.
Higher concentrations of zooplankton at intermedi- ate distances from the coast have been observed many times (e.g. Hargreaves 1978, Pearcy 1976, Witeck e t al. 1981, Leis 1982, Hampton 1983, Rakusa-Suszczewski 1983). Observations with high frequency acoustics (Macaulay et al. 1984, Shulenberger et al. 1984) have recently shown that euphausiid aggregations were closely linked to shelf breaks. Macaulay et al. (1984) suggested that these aggregations resulted from active horizontal migrations of small patches merging, over the shelf break, into a short-living (2 to 3 d) large swarm, in response to changes in current velocity as the bottom shoals. Leis (1982) suggested that the coast- al distribution of zooplankton along an island resulted from the combination of the die1 vertical movement of the organisms with a 2-layer circulation pattern and/or coastal eddies. Our results support that the formation of aggregations of vertically migrating zooplankton around bottom slopes is mainly due to the combination of the circulation at depth with their negative photo- taxis.
Fig. 10. A conceptual model of the forma- tion of the euphausiid aggregation in the lower St. Lawrence estuary, under the influence of residual and u p w e h g cir- culation and the negative phototaxis of
the animals

214 Mar Ecol. Prog. Ser
Since euphausiids are an important link in the marine food web these coastal aggregations are of major importance for higher trophic levels. Large con- centrations of food are available for coastal pelagic fishes, and benthic fishes can take advantage of the high densities of euphausiids near the bottom during the day (see Isaacs & Schwartzlose 1965, Pearcy et al. 1979, Omon & Ohta 1981). This could be an important factor in fish aggregation (see Isaacs & Schwartzlose 1965, Pereyra et al. 1969) as suggested by our observa- tions of numerous bottom fishes near the channel slope (Fig. 5B). Also, the traditional habit of local fishermen to fish around the 100 m isobath in the area, and the summer aggregation of fin and blue whales off Les Escoumins are probably not fortuitous and may depend on this coastal aggregation of euphausiids in the St. Lawrence estuary.
Acknowledgements. S a m p h g was carried out in collabora- tion with the Groupe Interuniversitaire de Recherche Oceanographique du Quebec and Lava1 University to which Y.S. was affiliated at the time. We thank all the research assistants, technicians and colleagues who helped in the work at sea or in the laboratory. The manuscript was com- pleted while Y.S. was attached to the Institute of Ocean Sciences, Department of Fisheries and Oceans, Sidney, Bri- tish Columbia, whch provlded support in the final steps of this research.
LITERATURE CITED
Boden, B. P., Kampa, E. M. (1958). Lumiere, bioluminescence et migrations de la couche diffusante profonde en Mediterranee occidentale. Vie et Milieu 9: 1-10
Boden, B. P., Kampa, E. M. (1967). The influence of natural light on the vertical migrations of an animal community in the sea. Symp. zool. Soc. Lond. 19: 15-26
Burczynsh, J. (1979). Introduction to the use of sonar systems for estimating fish biomass. FAO Fish. Tech. Pap, no. 191, p. 1-89
Clarke, G. L., Backus, R. H. (1956). Measurement of light penetration in relation to vertical migration and record of luminescence of deep-sea animals. Deep Sea Res. 4: 1-14
Clarke, G. L., Backus, R. H. (1964). Interrelahons between the vertical migration of deep scattenng layers, biolurnines- cence, and changes In daylight in the sea. Bull. Inst. oceanogr. Monaco Vol. 64, no 1318, p. 1-36
Clutter. R. I., Anraku, M. (1968). Avoidance of samplers. In: Zooplankton sampling. Unesco, Paris, p. 57-76
Denman, K. L., Mackas, D. L. (1978). Collection and analysis of undenvay data and related physical measurements. In: Steele, J . H. (ed.) Spatial pattern in plankton communities. Plenum Press, New York, p. 85-109
El-Sabh. M. (1979). The lower St. Lawrence Estuary as a physical oceanographic system. Naturaliste can. 106: 5 5 7 3
El-Sabh, M. I . , h e , H.-J., Koutitonsky, V. G. (1982). Variabil- ity of the near-surface residual current in the lower St. Lawrence estuary. J. geophys. Res. 87. 9589-9600
Forrester, W. D. (1974). Internal tides in the St. Lawrence estuary. J. mar Res. 32: 55-66
Forward, R. B., Cronin, T W., Steams, D. E. (1984). Control of die1 vertical migration: photoresponse of a larval crusta- cean. Limnol. Oceanogr 29: 146154
Greenlaw, C. F (1977). Backscattering spectra of preserved zooplankton J . acoust. Soc. Am. 62: 44-52
Greenlaw, C F. (1979). Acoustical estimation of zooplankton populations. Limnol. Oceanogr. 24: 226-242
Hampton, I. (1983). Preliminary report on the Fibex acoustic work to estimate the abundance of Euphausia superba. Proc. of the Biomass CoUoquium in 1982. Memoirs of the National Institute of Polar Research, Tokyo, Special issue no 27: 165-175
Hardy, A. C., Bainbridge, R. (1954). Expenmental observa- tions on the vertical migrations of plankton animals. J. mar. biol. Ass. U.K. 33: 40-48
Hargreaves, P. M. (1978). Relative abundance of zooplankton groups in the northwest African upwelling region during 1968 and 1972. In: Boje, R., Tomczak, M. (ed.) Upwelling ecosystems. Springer-Verlag, New York, p. 62-72
Haury, L. R., McGowan, J . A., Wiebe, P. H. (1978). Patterns and processes in the time-space scales of plankton dis- tributions. In: Steele, J. H. (ed.) Spatial pattern in plankton communities. Plenum Press, New York, p. 277-327
Herman, A W., Platt, T. (1980). Meso-scale spatial distribu- tion of plankton: CO-evolution of concepts and instrumen- tation. In: Sears, M., Merriman, D. (ed.) Oceanography: the past. Springer-Verlag, New York, p. 204-225.
Ingram, R. G. (1975). Influence of tidal induced mixing on primary productivity in the St. Lawrence estuary. Mem. Soc. r. Liege 7: 59-74
Ingram, R. G. (1979). Water mass modification in the St. Lawrence Estuary. Naturaliste can. 106: 45-54
Ingram, R. G. (1983). Verhcal mixing at the head of the Laurentian Channel. Estuar. coast. Shelf Science 16: 33S338
Isaacs, J. D, Schwartzlose, R. A. (1965). Migrant sound scatter- ers. Interaction with the sea floor. Science 150: 1810-1813
Kampa, E. M (1975). Observations of a sonic-scattering layer during the total solar ecllpse, 30 June, 1973. Deep Sea Res. 22: 417423
Lavoie, A., Bonn, F., Dubois, J. M. M,, El-Sabh, M. I. (1985). Structure thermique et variabilite du courant de surface de l'estuaire maritime du Saint-Laurent a I'aide d'images du satelhte HCMM. Can. J. Remote Sensing 11: 7&84.
Lebel, J. , Pelletier, E., Bergeron, M,, Belzile, N., Marquis, G. (1983). Le panache du Saguenay. Can. J . Fish. Aquat. Sci. 40: 52-60
Leis, J. M. (1982). Nearshore distributional gradients of larval fish (15 taxa) and planktonic crustaceans (6 taxa) in Hawaii. Mar. Biol. 72: 8 S 9 7
Longhurst, A. R. (1981). Slgnlficance of spatial variability. In: Longhurst, A. R. (ed.) Analysis of marine ecosystems. Academic Press, London, p. 415-441
Macaulay, M. C., English, T. S., Mathisen, D. A. (1984). Acoustic characterization of swarms of Antarctic krill (Euphausiia superba) from Elephant Island and Bramfield Strait. J. crustac. Biol. 4: 1 W 4
Mackas, D. L., Denman, K. L., Abbott, M. R. (1985). Plankton patchiness: biology in the physical vernacular. Bull. mar. Sci. 37: 652-674
Mauchline, J. (1980). The biology of mysids and euphausiids. Adv. mar. Biol. 18: 1-681
McNaught, D. C. (1968). Acoustical determination of zoo- plankton distributions. International association for Great Lakes Research, Ann. Arbor, Mich~gan, Proc. 11th Conf. Great Lakes Res., p. 7&84
Omori. M.. Ohta, S. (1981). The use of underwater camera in

Simard et al.: Aggregation of euphausiids along a coastal shelf 215
studies of vertical distribution and swimming behaviour ot a sergestes shrimp. Sergia lucens. J. Plankton Res. 3: 107-121
Ortner, P. B., Pieper, R. E., Mackas, D. L. (1983). Advances in zooplankton sampling. In: Rothschild, B., Rooth, C. (ed.) Report on fish ecology 111 - A foundation for recruitment experiment. University of Miami Press, p. 355-380
Owen, R. W. (1981) Fronts and eddies in the sea: mechanisms, interactions and biological effects. In: Longhurst, A. R. (ed.) Analysis of manne ecosysten~s. Academic Press, Lon- don, p. 197-233
Pearcy, W. G. (1976). Seasonal and inshore-offshore varia- tions in the standing stocks of micronekton and rnacrozoo- plankton off Oregon. Fish. Bull. U.S. 74: 7 6 8 0
Pearcy, W. G., Hopkins, C. C. E., Gronvlk, S., Evans, R. A. (1979). Feeding habits of cod, capelin and herring in Balsfjorden, northern Noway, July-August 1978: the importance of euphausiids. Sarsia 64: 26%277
Pearre, S. (1973). Vertical migration and feeding in Sagitta elegans Verrill. Ecology 54: 300-314
Pereyra, W. T., Pearcy, W. G., Carvey, F. E. (1969). Sebastodes flavidus, a shelf rockfish feeding on mesopelagic fauna, with consideration of the ecological implications. J. Fish. Res. Bd Can. 26: 2211-2215
Pieper. R. E. (1979). Euphausiid distribution and biomass determined acoustically at 102 kHz. Deep Sea Res. 26: 687-702
Pieper, R. E. (1983). Quantitative eshrnates of euphausiid biomass determined by high-frequency acoustics. Biol. Oceanogr. 2: 113-149
Pieper. R. E.. Holliday. D. V. (1984). Acoustic measurements of zooplankton distributions in the sea. J. Cons. int. Explor. Mer 41: 22&238
Rakusa-Suszczewsh, S. (1983). The relationship between the distribution of plankton biomass and plankton com- munities in the Drake Passage and the Bransfield Strait (Biomass-Fibex, February-March 1981). Proc. of the Biornass Colloquiurn in 1982. Memoirs of the National Institute of Polar Research, Tokyo, Special issue no 27: 77-83
Sameoto, D. D. (1976). Distribution of sound scattering layers caused by euphausiids and their relationship to chlorophyll a concentrations In the Gulf of St. Lawrence estuary. J. Fish. Res. Bd Can. 33: 681-687
Sarneoto, D. D. (1980). Quantitative measurements of euphausiids using a 120 kHz sounder and their in situ orientation. Can. J. Fish. Aquat. Sci. 37: 69S702
Sameoto, D. D. (1983). Euphausiid distribution in acoustic scattering layers and its significance to surface swarms. J . Plankton Res. 5: 129-143
Sameoto, D. D., Jarozynski, L. 0. (1976). Some zooplankton net modifications and development. Can. Tech. Rep. Fish. Res. Bd 679. p. 1-35
Shulenberger, E., Wormuth, J. H., Loeb, V. J. (1984). A large swarm of Euphausia superba: overview of patch structure and composition. J. crustac. Biol. 4: 75-95
Simard, Y., Lacroix, G., Legendre, L. (1985). In situ twilight grazing rhythm during die1 vertical migrations of a scat- tering layer of Calanus finmarclucus. Lirnnol. Oceanogr. 30: 5 9 ~ 6 0 6
Simard, Y., Lacroix, G., Legendre, L. (1986). Die1 vertical migrations and nocturnal feeding of a dense coastal knll scattering layer ( Thysanoessa raschi and Meganyctipha- nes norvegica) in stratified surface waters. Mar. Biol. 91: 93-105
Steele, J. J . (1976). Patchiness. In: Cushing, D. H., Walsh, .l. J. (ed.) The ecology of the seas. Blackwell Scientific Pubhca- tions, London, p. 98-115
Steele, J. H. (1978). Some comments on plankton patches. In: Steele, J. H. (ed.) Spatial pattern in plankton communities. Plenum Press. New York, p. 1-20
Themault, J.-C., Lacroix, G. (1976). Nutnents, chlorophyll, and internal tides in the St. Lawrence estuary. J. Fish. Res. Bd Can. 33: 2747-2757
Therriault, J.-C., Levasseur. M. (1985). Control of phytoplank- ton production in the lower St. Lawrence estuary: light and freshwater runoff. Naturaliste can. 112: 77-96
Witek, Z., Kalinowski, J. , Grelowski, A., Wolnomiejslu, N. (1981). Studies of aggregation of krill (Euphausia superba). Meeresforschung 28: 22a243
This article was submitted to the editor; it was accepted for printing on July 7, 1986