
AGGREGATE UNCERTAINTY, FORWARD LOOKING BEHAVIOUR AND THE DEMAND FOR MANUFACTURING LABOUR IN THE UK
17
OXFORD BULLETIN OF ECONOMICS AND STATISTICS, 56,3(1994) 0305-9049 AGGREGATE UNCERTAINTY, FORWARD LOOKING BEHAVIOUR AND THE DEMAND FOR MANUFACTURING LABOUR IN THE UK Simon Price This paper is concerned with two issues related to the determination of employment in aggregate UK manufacturing employment. The first is the treatment of uncertainty; the second is the dynamic specification, and in particular whether firms' behaviour may be characterized as forward or backward looking. It is a commonplace to observe that the introduction of uncertainty into economics has profound implications. Much of economic inquiry over the last three decades has been devoted to the exploration of these. However, there is a related area that has been largely neglected. We know that with the exception of some special cases (with quadratic technology and maximands), changes in the level of uncertainty will alter behaviour; but the empirical implications of this have been largely ignored. Previous research on the effect of changing levels of uncertainty has tended to concentrate on consumers' expenditure decisions. The seminal works spelling out the theory are Dreze and Modigliani (1972), Leland (1968) and Sandmo (1970). Blanchard and Mankiw (1988) offer a recent account reviewing recent results; there is also an extended discussion in Deaton (1992). Empirical studies relating consumers' expenditure to uncertainty include Flacco and Parker (1992) and Price (1993), while Rosen, Rosen and Holtz-Eakin (1984) and Meen and Price (1992) model (respectively US and UK) house prices. Firms' decisions have also been analysed. Early papers include Sandmo (1971, 1971), Batra and Ullah (1974) and Hartman (1975, 1976): Aiginger (1987) surveys this literature and related topics. The basic insight is that if the marginal profit function is convex with respect to the uncertain variable, an increase in uncertainty will tend to lead to a higher level of the capital stock, and therefore output and employment. The other, more recent, strand to this literature emphasizes the irreversibility of investment. As there is a gain to t I am grateful to the helpful comments of a referee, and also the Editors. 267 O Basil Blackwcll Ltd. 1994. Published by Blackwcll Publishers, 108 Cowley Road, Oxford 0X4 UF, UK & 238 Main Street, Cambridge, MA 02142, USA.
-
Upload
simon-price -
Category
Documents
-
view
213 -
download
0
Transcript of AGGREGATE UNCERTAINTY, FORWARD LOOKING BEHAVIOUR AND THE DEMAND FOR MANUFACTURING LABOUR IN THE UK

OXFORD BULLETIN OF ECONOMICS AND STATISTICS, 56,3(1994)0305-9049
AGGREGATE UNCERTAINTY, FORWARDLOOKING BEHAVIOUR AND THE DEMAND
FOR MANUFACTURING LABOUR IN THE UK
Simon Price
This paper is concerned with two issues related to the determination ofemployment in aggregate UK manufacturing employment. The first is thetreatment of uncertainty; the second is the dynamic specification, and inparticular whether firms' behaviour may be characterized as forward orbackward looking.
It is a commonplace to observe that the introduction of uncertainty intoeconomics has profound implications. Much of economic inquiry over thelast three decades has been devoted to the exploration of these. However,there is a related area that has been largely neglected. We know that with theexception of some special cases (with quadratic technology and maximands),changes in the level of uncertainty will alter behaviour; but the empiricalimplications of this have been largely ignored.
Previous research on the effect of changing levels of uncertainty has tendedto concentrate on consumers' expenditure decisions. The seminal worksspelling out the theory are Dreze and Modigliani (1972), Leland (1968) andSandmo (1970). Blanchard and Mankiw (1988) offer a recent accountreviewing recent results; there is also an extended discussion in Deaton(1992). Empirical studies relating consumers' expenditure to uncertaintyinclude Flacco and Parker (1992) and Price (1993), while Rosen, Rosen andHoltz-Eakin (1984) and Meen and Price (1992) model (respectively US andUK) house prices.
Firms' decisions have also been analysed. Early papers include Sandmo(1971, 1971), Batra and Ullah (1974) and Hartman (1975, 1976): Aiginger(1987) surveys this literature and related topics. The basic insight is that if themarginal profit function is convex with respect to the uncertain variable, anincrease in uncertainty will tend to lead to a higher level of the capital stock,and therefore output and employment. The other, more recent, strand to thisliterature emphasizes the irreversibility of investment. As there is a gain to
t I am grateful to the helpful comments of a referee, and also the Editors.267
O Basil Blackwcll Ltd. 1994. Published by Blackwcll Publishers, 108 Cowley Road, Oxford 0X4 UF,UK & 238 Main Street, Cambridge, MA 02142, USA.

268 BULLETIN
waiting in an uncertain environment, this tends to reduce the size of theoptimal capital stock. Nevertheless, despite this theoretical analysis, there arevery few empirical studies that allow for the effects of changing uncertainty.Exceptions include Driver and Moreton (1991, 1992) who model the effectof firm-level uncertainty on investment; Callen et al. (1990) who introduceuncertainty into the stock investment decision of firms; and Levi and Makin(1980) who introduce uncertainty into the Phillips Curve.
The natural measure of uncertainty is the variance of output. However, inorder to operationalize this, we need to specify the information set uponwhich the variance is conditional. It is far from obvious what this set shouldbe. Price (1993) reported the results of introducing uncertainty into the Eulerequation and consumption function explaining UK consumers' expenditure.The approach taken there was to model the conditional variance of GDPusing a set of exogenous variables - an extension of the rational expectationsmethodology to higher moments than the mean. This may be seen as astructural version of the pure time series approach to modelling conditionalvariance. These include the linear moments model developed by Antle(1983), and the family of ARCH estimators (Engle, 1982, 1983; Bollerslev,1986; Engle et al., 1987). Although this approach met with some success -the level of expected uncertainty seems to affect consumers' expenditure inthe predicted manner - the measure of uncertainty showed relatively littlevariation over time, and, while the effects were significant, they contributedonly a small amount of explanatory power. It is possible that the estimatedvariance was conditioned on too rich an information set. As there isuncertainty about the values of the conditioning variables at any point in time,the procedure essentially side-steps the fundamental problem. In this paperwe return to a more restricted measure - the GARCH-M estimator' -which is used to model the demand for manufacturing labour.
The other issue we address is the dynamic specification. Until recently, itwas common practice to concentrate on the long-run properties of time seriesmodels. The claim was often made (as in the seminal paper by Davidson et al.(1978)) that theory can tell us nothing about the short-run dynamics, whichshould be estimated in an unrestricted manner. However, this view has nowbecome less widespread. Sargent (1978), following Tinsley (1971), set out amodel of dynamic employment demand in which theory provides a set oftight restrictions on the dynamic functional form. Subsequently, a frequentempirical strategy was to specify the dynamics as the optimal path minimizinga multiperiod forward-looking quadratic loss function, where there are costsassociated with diverging from the equilibrium path, and of adjustment. Papersadopting this approach in a variety of empirical contexts include Cuthbertson(1990), Cuthbertson and Taylor (1985), Callen et al. (1989) and Price (1982).Pesaran (1992) sets out the most complete description of the theory (with an
'The GARCH-M acronym is for Generalized Autoregressive Conditional Hetero-scedasticity in Mean (Engle et aI., 1987).
© Basil Blackwell Ltd. 1994.

THE DEMAND FOR MANUFACTURING LABOUR IN THE UK 269
application to employment determination in the UK coal industry) for thespecification we test in this paper. Given the success of the model withmodels of manufacturing stock investment and price determination, weexplicitly test this dynamic specification against an unrestricted error correc-tion specification.
The plan of the paper is as follows. Section I sets out some theory. SectionII reports the estimated conditional variance. Section III uses this variance inthe two competing models, which are tested against each other. Some conclu-sions are drawn in the final section.
I. THEORY
Static Specification
In general, the effect of higher levels of uncertainty may be to either decreaseor increase labour demand or output. Uncertainty will potentially matterwhenever firms make fixed commitments - about either investment, employ-ment or other factors - before the state of an uncertain world is realized.Even though expected profit maximizing firms are risk neutral with respect toprofits, concavity in the production technology implies that a rise in un-certainty raises marginal profits, and therefore the size of the optimal capitalstock (see e.g. Hartman, 1976).2 By contrast, the irreversible investmentliterature (see e.g. Bernanke, 1983; Caballero, 1987 and Pindyck, 1991)emphasizes the gain to waiting in an uncertain environment. Not investingbrings a cost in reduced profit streams, but also brings a benefit in the form ofan option to commit at a future date when the currently uncertain future stateof the world is realized.
Despite the emphasis in the literature on investment, in this paper we focuson the employment decision conditional on the capital stock, which may bejustified by considering employment as a quasi-fixed factor. The aim is todetermine whether there are uncertainty effects operating beyond the invest-ment decision - in other words, whether uncertainty affects the utilization ofcapital. In estimation we concentrate on long-run properties. As we will see,labour demand is an 1(1) variable, but the conditional variance is meanreverting. This means that although uncertainty may affect firms' decisions,the level cannot be cointegrated with labour demand. We proceed byexamining a simple static model, based on Cobb Douglas technology, whichwill act as a guide to the empirical specification.
A monopolistically competitive firm faces uncertain factor prices.
2 Only quadratic technology (with linear first order conditions) will deliver certainty equiva-lence.
© Basil Blackwcll Ltd. 1994.
I1=PYWLVM (1)
Y=KaMßLea; a,ß, y, ó>O (2)
P=QY';bO (3)

270 BULLETIN
The level of a variable is indicated by upper case letters; the log by lowercase. The firm aims to maximize profits Il subject to a constant returnsproduction function, with a given capital stock K. Production Y also requiresraw materials M and labour L. W and V are the wage and price of rawmaterials respectively. ô measures the state of technical progress. Firms facean iso-elastic demand curve (3), so that the price P is negatively related tooutput, and positively related to foreign prices, Q. In the limiting case ofperfect competition we have b O (perfectly elastic demand), which amountsto purchasing power parity. After taking logs and imposing constant returnsto scale, the reduced form of the demand for labour that follows from thisproblem is given by the following expression:
a(1b) (1ß(1b))¡ = constant + k (w - q)a+b(1a) a+b(1a)
ß(1b) (1b)(vq)+ ôa+b(1a) a+b(1a)Note that the coefficient on k is less than unity. If b =0 then the equationsimplifies and k takes a unit coefficient. In estimation we add a term proxyinguncertainty, discussed below.
Dynamic Specification
The model we describe here is now familiar enough to require only a briefexposition: see Pesaran (1992) for a rigorous treatment and Price (1992) foran application using similar methodology.
The discussion above led to an expression for the static equilibrium facingthe firm which, given the time series of the explanatory variables, we interpretas the equilibrium path of employment. However, unless all variables aredeterministically fixed at constant values, firms will be off their optimal pathat the beginning of each period. Thus the actual level of employment willdiffer from the equilibrium path at any moment in time. In the presence ofconvex adjustment costs, firms will not jump straight to the long-run equili-brium. We make the particular assumption that firms aim to minimize thefollowing multiperiod quadratic loss function:
C=E(d'[ci(l _i*2+c2(l,_/,i)2+c3(A1,_1,j)2j; c>0 (5)t I'I
where E is the expectations operator, d is the firms' subjective rate of dis-count and 1* is the equilibrium value of 1. The latter is defined by the function¡ Ø(z,), where z, summarizes the arguments of the function at time t. Theinclusion of the parameter c3 generalizes the loss function beyond the
C Basil Blackwcll Ltd. 1994.
(4)

C Basil Blackwcll Ltd. 1994.
THE DEMAND FOR MANUFACTURING LABOUR IN THE UK 271
standard case. There are costs associated with being away from equilibrium(c,), with changing the level of employment (c2), and with changing the rate ofchange of employment (c3). The latter effect may be justified in a number ofways. One plausible story is that firms set up machinery for changing the levelof employment over time, and that changes in the rate of change involveincreasing costs at the margin. Whatever the mechanism, the significance ofthese costs is ultimately an empirical question.
The Euler condition following from this problem is symmetric (disregard-ing terms in d) in two leads and lags:
ß(L)1,=c,l (6)
where
ß(L)=(c3d2L2(c,+2c3(1+d))dL+ (c1 + c2(1 + d) +c3(1 + 4d+d2)) (c, +2c3(1 + d)) L+ c3L2) (7)
and where L is the lag operator. There is a unique stable solution if thecharacteristic equation has two roots outside the unit circle and two within.Pesaran shows that this is satisfied for positive values of c, and c3 wherec 4c3; d must lie in the range [0, 1). The Euler condition may either beestimated directly or expanded by factorizing into backward and forwardlooking components, yielding a set of restrictions on the lags and leads. Ineither case, the dynamics can be expressed in terms of only three parameters.These are the coefficients on the first and second lags of the dependentvariable (A, and A, respectively), and the discount factor, d. Stability requiresthat A, > 1 and A2 <0. It is the parameterization corresponding to theexpanded forward solution that we test below. In particular,
1,(1 _A1L_A2L2)= wL'l (8)
where the weights w are given by
w,=ØA,d
and
+
0= 1A1d4A+d2A2(A1A2-1)+d(Af+A,(A2-1))
Thus we find that labour demand at time t is determined by an expressioncontaining two lags and an infinite lead on the equilibrium path, where theweights on the leads are particular functions of the discount rate and the twocoefficients on the lagged terms.

272 BULLETIN
At first sight there is no relation between the forward solution to the modelset out above and the backward looking error correction specification (theecm). However, it is possible to interpret any backward looking model as thereduced form of the structural model, comprising a forward looking equationand a set of equations describing the formation of the future expectations ofthe exogenous variables. This is, of course, the notion that underlies theLucas critique. Hendry (1988) and others have observed that it may bedifficult to distinguish backward and forward looking specifications, if themarginal processes determining expectations are stable over the relevantsample period. Furthermore, if this is the case, the backward lookingspecification will provide perfectly adequate forecasts, contra Lucas. But thepolicy implications do differ; forward looking agents allow regime changes -such as entry to and exit from the ERM - to be incorporated into behavi-oural responses more rapidly than when responses are adaptive and back-ward looking. So there are issues of real interest at question here, from both atheoretical and policy perspective.
II. GARCH ESTIMATES OF THE CONDITIONAL VARIANCE OF GDP
In this section we develop an estimate of the conditional variance of GDPusing the GARCH-M estimator.3 The rationale for employing GDP is that itserves as an index for aggregate demand, which may affect the demand forthe manufacturing sector as well as the wage and other prices. So uncertaintyin GDP may induce uncertainty in the determinants of labour demand.
The GARCH-M model may be written as follows:
That is, the variable y is a function of a set of variables x and h with asso-ciated error e. (10) defines h as the variance of the error term in (9). (11)states that h is in turn a function of lagged values of h and lagged squaredresiduals. This general model may be described as a GARCH-M(p, n)model. An ARCH-M model is a restricted version of this, where the y areall zero; the GARCH or ARCH models restrict 6 to be zero. The GARCHand GARCH-M specifications allow a smoother path for the variance thanthe ARCH or ARCH-M models. In view of our underlying view that un-certainty may have significant effects, it is appropriate to allow ô to be non-
3i specification turns out to be more general than is required by the DGP.
© Basil Blackwell Ltd. 1994.
e=yf(x,ß)ôh (9)
eN(0,h) (10)
h=y0+ y11h_1+ y,1(e_1)2 (11)

THE DEMAND FOR MANUFACTURING LABOUR IN THE UK 273
zero. Estimation of (9) to (li) may be performed by maximizing thelikelihood function, which is proportional to the following expression,
L=-ln(h)-e2/h (12)
where h and e are defined by (9) and(12).In our case the dependent variable was either the log level or the propor-
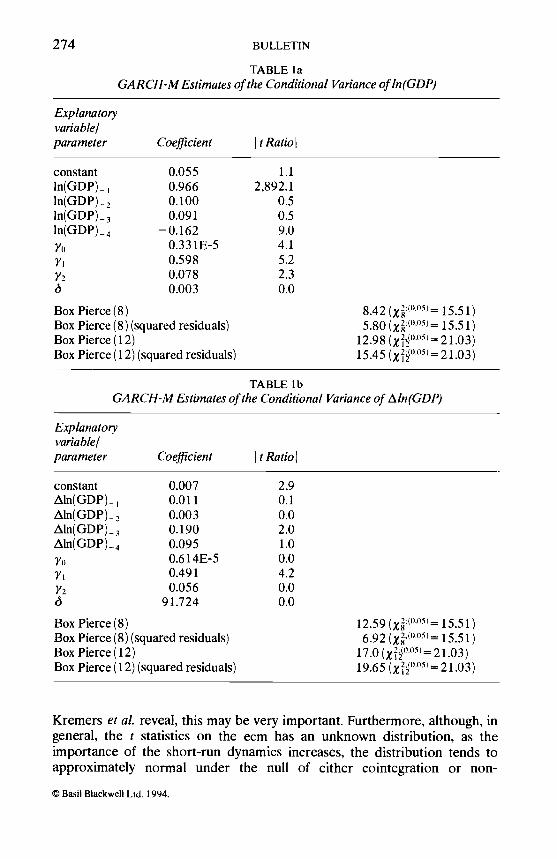
tionate growth rate of GDP. The explanatory variables (x) were restricted tolags in the dependent variable. Table la and lb report the results of estimat-ing two GARCH-M( 1,1) models.
Both models are satisfactory in the sense that at least some of the hyper-parameters (ô and the y) are significant, and the diagnostics are acceptable.The Box Pierce test on the (scaled) squared residuals is a test for a residualARCH process. The 'in mean' specification turns out to be redundant, as 6 isinsignificant at any level in both cases. The hyperparameter on the term ine. (y) is insignificant in the differenced specification. The sum of the coef-ficients on the lagged terms in Table la is 0.996, so there is strong evidence ofa unit root in the log of GDP.4 The differenced specification was thereforeadopted, although the residual diagnostics were closer to the critical values(compared to those from the specification in levels). However, the estimatedseries for the conditional variance was very similar in both cases.5
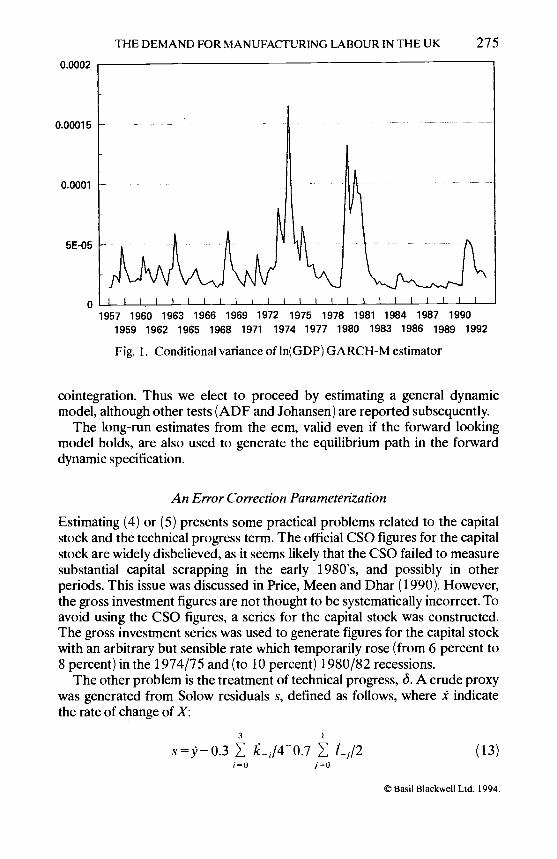
Figure 1 shows the conditional variance over the sample period. The serieshas a natural interpretation in terms of UK economic history, peaking in the1973/75 and 1979/82 periods. The estimated variance is also relatively lowand flat during the mid 1980's, which is again consistent with informal priorexpectations.
Ill. RESULTS
Regardless of the true structural model, if an equilibrium relationship existsbetween at set of 1(1) variables, then there is a valid error correction para-meterization of the data. The long-run component may be estimated by avariety of means, including the Engle-Granger two step method. However,some tests are more powerful than others. In particular, a test based on thecoefficient on the error correction term in a fully parameterized dynamicmodel tends to be considerably more powerful than Engle-Granger DF andADF tests (Kremers et al., 1992). The reason is that the structural dynamicsestimated with the ecm provide information that is lost in levels based regres-sions. In theory, the ecm based test has relatively greater power than levelsbased tests in cases where the contribution to the sample variance from theshort-run dynamics is large. In practice, as Monte Carlo experiments in
4i is, of course, no surprise. An ADF(4) test is reported below.An alternative specification adds an error term to (8) - the SGARCH-M model, where Sis
for stochastic. This generated results that were numerically extremely close to the standardGARCH-M model. The estimated variance relating to the error in (8) was insignificant.
C Basil Blackwell Ltd. 1994.
274 BULLETIN
TABLE laGARCH-M Estimates of the Conditional Variance of ln(GDP)
Explanatoryvariable!parameter Coefficient t Ratio
constantln(GDP)_ln(GDP)_2ln(GDP)_3In(GDP).4yo
y'Y2
6
0.0550.9660.1000.09 1
0.1620.331E-50.5980.0780.003
Box Pierce (8)Box Pierce (8) (squared residuals)Box Pierce (12)Box Pierce (12) (squared residuals)
1.12,892.1
0.50.59.04.15.22.30.0
842 205)= 15.51)5.80 (°°5= 15.51)
12.98 (xf°°52 1.03)15 45 / 2(0.05) -21.03)
Kremers et aL reveal, this may be very important. Furthermore, although, ingeneral, the t statistics on the ecm has an unknown distribution, as theimportance of the short-run dynamics increases, the distribution tends toapproximately normal under the null of either cointegration or non-
© Basil BlackweH Ltd. 1994.
TABLE lbGARCH-M Estimates of the Conditional Variance of ¿ln (GD!')
Explanatoryvariable!parameter Coefficient It Ratio
constant 0.007 2.9¿\ln(GDP)., 0.011 0.1¿Mn(GDP).,
ln(GDP)30.0030.190
0.02.0
Aln(GDP)_4 0.095 1.00.614E-5 0.0
y, 0.4910.056
4.20.0
6 91.724 0.0
Box Pierce (8) 12.59 (X°°5= 15.51)Box Pierce (8) (squared residuals) 6.92 (ZOÁS 15.51)Box Pierce(12) 17.0 (XoÄ 5)= 21.03)Box Pierce (12) (squared residuals) 19.65 ("°5=21.O3)
0.0002
0.00015
0.0001
5E-05
THE DEMAND FOR MANUFACTURING LABOUR IN THE UK 275
o1957 1960 1963 1966 1969 1972 1975 1978 1981 1984 1987 1990
1959 1962 1965 1968 1971 1974 1977 1980 1983 1986 1989 1992
Fig. 1. Conditional variance of ln(GDP) GARCH-M estimator
cointegration. Thus we elect to proceed by estimating a general dynamicmodel, although other tests (ADF and Johansen) are reported subsequently.
The long-run estimates from the ecm, valid even if the forward lookingmodel holds, are also used to generate the equilibrium path in the forwarddynamic specification.
An Error Correction Parameterization
Estimating (4) or (5) presents some practical problems related to the capitalstock and the technical progress term. The official CSO figures for the capitalstock are widely disbelieved, as it seems likely that the CSO failed to measuresubstantial capital scrapping in the early 1980's, and possibly in otherperiods. This issue was discussed in Price, Meen and Dhar (1990). However,the gross investment figures are not thought to be systematically incorrect. Toavoid using the CSO figures, a series for the capital stock was constructed.The gross investment series was used to generate figures for the capital stockwith an arbitrary but sensible rate which temporarily rose (from 6 percent to8 percent) in the 1974/75 and (to 10 percent) 1980/82 recessions.
The other problem is the treatment of technical progress, 6. A crude proxywas generated from Solow residuals s, defined as follows, where f indicatethe rate of change of X:
s9-0.3 L/40.7 L1/2 (13)i0 jO
© Basil Blackwell Ltd. 1994.
276 BULLETIN
The residual is constructed from a weighted average of the recnet past growthrates of the capital stock and employment, using arbitrary weights approxi-mating to the shares of capital and labour in output. The output figure is themanufacturing production series published by CSO, which measures thevalue added in the sector. Thus it is appropriate to restrict attention to labourand capital inputs. The Solow residuals were then smoothed further byregressing them on three dummies, allowing for a change in the rate of growthof total factor productivity in 1973 and again in 1979. The smoothedresiduals were then cumulated to yield an index of technical progress, tech.
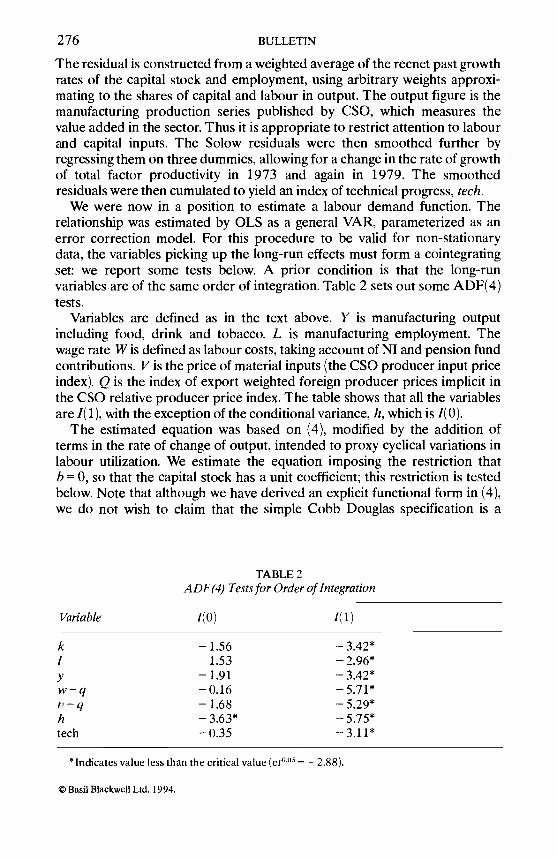
We were now in a position to estimate a labour demand function. Therelationship was estimated by OLS as a general VAR, parameterized as anerror correction model. For this procedure to be valid for non-stationarydata, the variables picking up the long-run effects must form a cointegratingset: we report some tests below. A prior condition is that the long-runvariables are of the same order of integration. Table 2 sets out some ADF(4)tests.
Variables are defined as in the text above. Y is manufacturing outputincluding food, drink and tobacco. L is manufacturing employment. Thewage rate W is defined as labour costs, taking account of NI and pension fundcontributions. V is the price of material inputs (the CSO producer input priceindex). Q is the index of export weighted foreign producer prices implicit inthe CSO relative producer price index. The table shows that all the variablesare 1(1), with the exception of the conditional variance, h, which is 1(0).
The estimated equation was based on (4), modified by the addition ofterms in the rate of change of output, intended to proxy cyclical variations inlabour utilization. We estimate the equation imposing the restriction thatb = O, so that the capital stock has a unit coefficient; this restriction is testedbelow. Note that although we have derived an explicit functional form in (4),we do not wish to claim that the simple Cobb Douglas specification is a
* Indicates value less than the critical value (cr°°5 = - 2.88).
© Basil Blackwell Ltd. 1994.
TABLE 2ADF(4) Tests for Order of Integration
Variable ¡(0) ¡(1)
k 1.56 _3.42*¡ 1.53 _2.96*y 1.91 - 3.42*wq 0.16 _5.71*vq 1.68 _5.29*h - 3.63* 575*tech 0.35 _3.11*

THE DEMAND FOR MANUFACTURING LABOUR IN THE UK 277
sensible restriction on the data.6 During the estimation it became clear thatthere were residual outliers in 1971 q2 and 1 990q4 (the quarter after ERMentry) and the general equation was redefined to include two dummies.Starting from a general 4th order VAR, the restricted equation was as follows:
(2.8) (1.8) (4.7)
+ 0.016A(v -q)_3 -0.042(1- k)1 -0.023(w-q)_1(1.6) (5.3) (4.8)
- 0.022(v - q)_1 - 32.654h_1 - 0.O395tech + dummies(5.3) (2.4) (3.4)
Sample: 1964q2-1992q1t ratios in parentheses
J2O9OLM(4);F(4,93) = 1.60 (pr= 0.18)
LM(12); F(12,85)= 1.56 (pr= 0.12)
The relevant part of the long-run solution to the equation is
l constant + k - 0.55(w - q)- 0.52(v - q)- 775.64h - 0.94tech(5.9) (6.8) (2.0) (5.9)
h enters with a significant negative coefficient in both the dynamic and long-run equations. Both labour costs and input prices enter with very well definednegative long-run effects. The coefficient on the index of technical progress isnegative. While this result is in contradiction to the exact form of (4), whichembodies Cobb Douglas production technology, in general the coefficientmay take any sign. It is plausible that technical progress in the UK has tendedto be labour saving over the post-War period, and the evidence from previousresearch in this area tends to support this conclusion. For example, Layard andNickell (1986) find no evidence of productivity effects in their equation foremployment demand: Burgess and Dolado (1989) estimate a small negativecoefficient.7 When k_ is added to the equation (testing the unit coefficientimplied by long-run purchasing power parity) it has a small and insignificantcoefficient (0.00024; t= 0.014). A test of the complete set of joint restrictions
Similar log-linear specitïcations for the long run have been estimated by previous investi-gators, who, like us, have been agnostic about the underlying functional form: see Layard andNickell (1986) or Burgess and Dolado (1989).
proxy technical progress with a spline trend breaking at roughly the points we use inthe construction of our index. They also add terms in the rate of growth of the capital stock,intending to pick up vintage effects on productivity.
O Basil Blackwdll Ltd. 1994.
Ll= 0.247 0.145AL2 0.042Aq1 - 0.024iq_3(4.9) (5.6) (1.6) (2.4) (1.4)
-0.046q_4-0.017L(w-q)_1 +0.051A(v -q)_1

278 BULLETIN
from the general equation is comfortably accepted; F( 12,84) = 0.60. So therestrictions implicit in the equation are consistent with the data.
The other results are also in broad agreement with other research. Thepoint estimate of the long-run elasticity of wages is about half the figure of- 1.19 estimated on quarterly data (sample 1957q1-1983q4) by Layard andNickel!, but the results are not directly comparable as they employed valueadded prices and used total employment. The estimate is much closer tothose reported in Burgess and Dolado. The adjustment speed (the errorcorrection parameter) is very close to Layard and Nickell's estimate, althoughour coefficient is much better determined. Layard and Nickell argue that thedynamics are implausibly slow (page S161), but in our case this is less clear.When the other dynamic effects are taken fully into account, adjustment ismore rapid. An intercept innovation leads to more than 50 percent adjust-ment within 6 quarters, and 95 percent adjustment by 4 years. After aninnovation to wages, 50 percent of the full effect takes place within 11 quar-ters, and 95 percent by 5 years. The dynamics lead to some overshooting, butby less than 1 percent. The negative term on the longer lagged changes in out-put may be due to pro-cyclical productivity gains and overtime working,which is closely related to the rate of growth of output. The small positivelysigned dynamic material price terms may be capturing short-run demand andother productivity effects; each of the three variables are pro-cyclical to someextent.5
The results are also consistent with the existence of a long-run cointegrat-ing relationship. The t ratio on the error correction parameter is well abovethe standard critical values, and, as observed above, serves as a test statisticfor cointegration. The static OLS regression on the levels of the 1(1) variablesincluding the technical progress term (a less efficient technique than the fullyspecified dynamic model) is
/=constant+ k-0.36(wq)-0.28(v q) 1.24techThis fails the ADF test, but the trace version of the more powerful
maximum likelihood Johansen procedure cannot reject the existence of acointegrating vector at the 10 percent level. The Johansen parameterestimates are as follows:
l=constant+ k-0.39(w q)-0.38(v q) 1.24techFurthermore, when the unit restriction on coefficient on k is tested the
Johansen test statistic is x' = 0.67. So this lends further support to thespecification.
Other diagnostics for functional form, heteroscedasticity and normality arealso acceptable. Finally, the equation passes a within-sample test forpredictive failure. The number of observations is restricted to 5 quarters bythe outlier dummy, but the test statistic is F(5,93)= 1.29, which is comfort-ably below the critical value.
Layard and Nickell (1 986) also report positively signed effects in the change in real wages.
© Basil Blackwcll Ltd. 1994.

THE DEMAND FOR MANUFACTURING LABOUR IN THE UK 279
A Forward Looking Model
We now move on to a test of the forward dynamic model. The equationestimation is (8), a restricted non-linear function of lags in ¡ and leads in theequilibrium values of ¡9 (taken from the long-run solution to the ecm reportedabove). As future realizations are used directly, we have an errors in variablesproblem, to which McCallum (1976) and Wickens (1982) propose an instru-mental variable solution. One advantage of this approach is that the estimatesare robust to an incorrectly specified instrument set. Estimation is by non-linear instrumental variables.
We began by estimating an unrestricted forward specification including aconstant, two lags, six leads and the outlier dummy identified above. Detailedresults are not reported. The parameters were very badly determined; noneof the forward terms had absolute t ratios higher than 0.9. The standard errorof the equation was 0.010, which compares unfavourably to 0.0028 in theecm. When the restricted model was estimated, we found the results given inTable 3.
The restricted equation has a standard error that is actually less than theunrestricted iii0 indicating how well the specification performs. Itis, however, larger than that for the ecm. A formal Gallant-Jorgensen quasi-likelihood ratio test is x=0325 which is clearly well below the criticalvalue. So there is no doubt that the restrictions are consistent with the data.Given the highly restricted nature of the model, this is compelling evidence infavour of the theory. Furthermore, all the coefficients are very well deter-mined. At first sight the t ratio on the discount rate appears to be extraordi-
TABLE 3Forward Looking Parameterization
Although the theoretical model specifies an infinite lead, we adopted the standard approachin the literature and restricted the lead. Similar results were obtained with a longer, eight periodlead.
'° This is perfectly possible, as the IV minimand is not the residual sum of squares.
© Basil Blackwell Ltd. 1994.
ItRatio( ItRatiol¡'aranieter Coefficient Standard error H: ß O H(,: ß = 1
A, 1.750 0.056 31,4 n/aA2 -0.787 0.052 15.1 n/ad 1.0003 0.00012 8,188.0 2.4
equation standard error 0.00385autocorrelation: x 20.5
25.6X2 27.1
Sargan 1V validity x 0.57

280 BULLETIN
narily high, but the appropriate null in this case is H0: d < 1, and this statisticis far smaller. We may reject the stability condition that d < 1. However, theestimate is numerically very close to unity. For the ith lead, d takes the valueof 1.0018 for i =6. The Sargan test for instrument validity is comfortablyaccepted.
Despite these encouraging results, there are problems. Primarily, there isstrong evidence of autocorrelation. Nevertheless, theory predicts that theresiduals should exhibit a P- 1 MA process where P is the forecast horizon(Hayashi and Sims, 1983), as the forecast error between 1 and P periods willin general be correlated. So autocorrelation is a prediction of the model,rather than a problem. Under these circumstances, the estimation method isconsistent, but the standard errors are biased. One way of circumventing thisis to model the MA process directly using a forward (to avoid violating ortho-gonality) GLS transform. However, the Newey-West adjustment to thevariance-covariance matrix also enables inference to proceed, and this is theapproach we adopted. The results are not reported, but the effect is to lowerthe estimated standard errors, so none of our conclusions are altered. On thebasis of these results, we cannot reject the hypothesis that forward lookingfirms set employment in a manner consistent with the theory.
Non-nested Tests
Despite the fact that the forward looking model cannot be rejected against thegeneral forward alternative, it has not yet been tested against the backwardlooking alternative. It is possible that the autocorrelation observed in theforward looking model stems from misspecification, rather than forecasterror. We therefore proceed to test the two models against each other, usingthe J test of McKinnon et al. (1983). If the reduced form interpretation of theecm were correct, then we would expect that the test would be unable todiscriminate between the two models: neither model would be rejectedagainst the other. This was the outcome of the similar test on manufacturingprice setting in Price (1992). In fact, as the results in Table 4 reveal, this wasnot the case.
Thus although we cannot reject the quadratic forward looking modelagainst a general forward specification, we are able to reject it against abackward looking specification.
IV. CONCLUSIONS
In Price (1993) a measure of conditional uncertainty was used to help explainUK consumers' expenditure. The measure was conditional on a broad in-formation set. In this paper, a more restricted information set was employedin the context of a GARCH-M model of UK GDP. This may be a preferableapproach, as the values of the variables in any given information set arethemselves forecast or measured with uncertainty. The paper shows that
© Basil Blackwell Ltd. 1994.

THE DEMAND FOR MANUFACTURING LABOUR IN THE UK 281
TABLE 4Non-Nested Tests
aggregate uncertainty, as measured by the conditional variance of GDP, didaffect manufacturing employment over the period 1964 to 1991. However,while there are significant effects, they are small, and manufacturing firmsseem to be operating close to certainty equivalence with respect to employ-ment. This may imply that we are employing the wrong measure of un-certainty, and that the aggregate variance of output is not primarily relevant;instead, it may be turbulence at firm level that matters. This latter may onlybe loosely related to aggregate variations. This implies that the issue is notimportant in terms of macroeconomic relationships. Hoever, there is also thepoint that we are conditioning on the capital stock. It may be that the maineffects of uncertainty operate via investment. We know from Callen et aL(1990) that uncertainty can be shown to affect investment in stocks. Driverand Moreton (1991, 1992) report that a higher level of uncertainty leads tolower fixed investment. These both seem useful avenues to explore in sub-sequent research.
The paper also shed light on the popular model which assumes rationalforward looking firms aim to minimizes a multiperiod quadratic loss function.Previous work on UK manufacturing using a similar specification has notalways tested the model against alternative hypotheses. The model doesappear to offer an adequate explanation of the adjustment process thatcannot be rejected against a general forward model. However, the specifica-tion is not robust. In particular, the model may be rejected against a backwardlooking error correction model. So despite the convincing evidence that firmsare forward looking with respect to price setting (Cuthbertson, 1990 andPrice, 1992), this does not seem to be the case for employment.
University of Essex
Date of Receipt of Final Manuscript: December /993
REFERENCES
Aiginger, K. (1987). Production Decisions under Uncertainty. Basil Blackwell, Oxford.Antle, J. M. (1983). 'Testing the Stochastic Structure of Production: A Flexible
Moment Based Approach', Journal of Business and Economic Statistics, Vol. 1, pp.192-20 1.
O Basil Blackwcll Ltd. 1994.
Foward model Ecm 4.49Ecm Forward model 0.26
H, H tRatiol

282 BULLETIN
Barsky, R. B., Mankiw, N. G. and Zeldes, S. P. (1986). 'Ricardian Consumers withKeynesian Propensities', American Economic Review, Vol. 76, PP. 676-91.
Batra, R. N. and Ullah, V. (1974). 'Competitive Firms and the Theory of InputDemand under Price Uncertainty', Journal of Political Economy, Vol. 82, pp.537-48.
Bernanke, B. S. (1983). 'Irreversibility, Uncertainty and Cyclical Investment',Southern Economic Journal, pp. 85-106.
Blanchard, O. and Mankiw, N. G. (1988). 'Consumption: Beyond Certainty Equiva-lence', American Economic Review, Vol. 78, pp. 173-77.
Bollerslev, T. (1986). 'Generalised Autoregressive Conditional Heteroscedasticity',Journal of Econometrics, Vol. 31, pp.307-27.
Burgess, S. and Dolado, J. (1989). 'intertemporal Rules with Variable Speed ofAdjustment: An Application to UK Manufacturing Employment', EconomicJournal, Vol. 99, pp. 347-65.
Caballero, R. J. (1991). 'On the Sign of the Investment-Uncertainty Relationship',American Economic Review, Vol. 81, pp. 279-88.
Callen, T. S., Hall, S. G. and Henry, S. G. B. (1990). 'Manufacturing Stocks: Expecta-tions, Risk and Co-integration', Economic Journal, Vol. 100, Pp. 756-72.
Cuthbertson, K. (1990). Rational Expectations and Export Price Movements in theUK', European Economic Review, Vol. 34, pp. 5 3-69.
Cuthbertson, K. and Taylor, M. P. (1985). 'A Forward Looking Buffer Stock Model ofthe Demand for Ml: Results for the UK using the Kalman Filter', NIESR Discus-sion Paper.
Davidson, J. E., Hendry, D. F., Srba, F. and Yeo, S. (1978). 'Econometric Modelling ofthe Aggregate Time Series Relationship Between Consumers' Expenditure andIncome in the United Kingdom', Economic Journal, Vol. 88, pp. 661-92.
Deaton, A. (0000). Understanding Consumption. Oxford University Press, Oxford.Dreze, J. H. and Modigliani, F. (1972). 'Consumption Decisions Under Uncertainty',
Journal of Economic Theory, Vol.5, pp.308-35.Driver, C. and Moreton, D. (1991). 'Consumption Decisions Under Uncertainty',
Journal of Economic Theory, Vol.5, pp. 308-35.Driver, C. and Moreton, D. (1991). 'The Influence of Uncertainty on UK Investment',
Economic Journal, Vol. 101, pp. 1452-59.Driver, C. and Moreton, D. (1992). Investment, Expectations and Uncertainly. Basil
Blackwell, Oxford.Drobny, A. and Hall, S. G. (1989). An investigation of the Long-Run Properties of
Aggregate Non-Durable Consumers' Expenditure in the United Kingdom',Economic Journal, Vol. 99, pp. 454-60.
Engle, R. F. (1982). 'Autoregressive Conditional Heteroskedasticity with Estimates ofthe Variance of UK Inflation', Econometrica, Vol. 50, pp. 987-1007.
Eagle, R. E (1983). 'Estimates of the Variance of US Inflation Based on the ARCHModel', Journal of Money, Credit and Banking, Vol. 15, Pp. 286-301.
Engle, R. F., Lilien, D. M. and Robins, R. P. (1987). 'Estimating Time Varying RiskPremia in the Term Structure: The ARCH-M Model', Econometrica, Vol. 55, pp.39 1-407.
Flacco, P. R. and Parker, R. E. (1992). 'A Comparison of Two Methods for EstimatingIncome Uncertainty with an Application to Aggregate Consumption Behaviour',Applied Economics, Vol. 24, pp. 70 1-7.
© Basil Blackwcll Ltd. 1994.
TI-lE DEMAND FOR MANUFACTURING LABOUR IN THE UK 283
Hartman, R. (1975). 'Competitive Firms and the Theory of Input Demand UnderPrice Uncertainty: Comment', Journal of Political Economy, Vol. 83, PP. 1289-90.
Hartman, R. (1976). 'Factor Demand with Output Price Uncertainty', AmericanEconomic Review, Vol.66, pp.675-81.
Hayashi, F. and Sims, C. (1983). 'Nearly Efficient Estimation of Time Series Modelswith Predetermined but not Exogenous Instruments', Econometrica, Vol. 151, pp.783-98.
Kremers, J. J. M., Ericsson, N. R. and Dolado, J. J. (1992). 'The Power of Cointegra-tion Tests', BULLETIN, Vol. 54, pp. 325-46.
Layard, P. R. G. and Nickel!, S. J. (1986). 'Unemployment in Britain', EconomicaSpecial Issue, Vol. 53, pp. S121-S170.
Le!and, H. E. (1969). 'Saving and Uncertainty: The Precautionary Demand forSaving', Quarterly Journal of Economics, Vol. 82, pp. 465-73.
Levi, M. D. and Makin, J. H. (1980). 'Inflation Uncertainty and the Phillips Curve:Some Empirical Evidence', American Economic Review, Vol. 7, pp. 1022-27.
Meen, G. and Price, S. (1992). 'The Housing Market: Uncertainty, Expectations andConsumer Confidence', Oxford Institute of Economics and Statistics: User FriendlyModels of the Housing Market Paper. No. 2.
Mackinnon, J. G., White, H. and Davidson, R. (1983). 'Tests for Mode! Specificationin the Presence of Alternative Hypotheses', Journal of Econometrics, Vol. 21, pp.53-70.
McCallum, B. (1976). 'Rational Expectations and the Natural Rate Hypothesis: SomeConsistent Estimates', Econometrica, pp. 43-52.
Pesaran, M. H. (1992). 'Costly Adjustment Under Rational Expectations: A General-isation', Review of Economics and Statistics, Vol. 74, pp. 353-5 8.
Price, S. (1992). 'Forward Looking Price Setting in UK Manufacturing', EconomicJournal, Vol. 102, pp. 497-505.
Price, S. (1993). 'Aggregate Uncertainty and Consumers' Expenditure', Essex Discus-sion Papers. No. 413.
Price, S., Meen, G. and Dhar, S. (1990). 'Employment, Capital Scrapping andCapacity Utilization', Essex Discussion Papers. No. 353.
Pindyck, R. (1988). 'Irreversible investment, Capacity Choice and the Value of theFirm', American Economic Review, Vol. 78, Pp. 969-85.
Rosen, H. S., Rosen, K. T. and Ho!tz-Eakin, D. (1984). 'Housing Tenure, Uncertaintyand Taxation', Review of Economics and Statistics, pp. 405-16.
Sandmo, A. (1970). 'The Effect of Uncertainty on Saving Decisions', Review ofEconomic Studies, Vol. 37, pp. 353-60.
Sandmo, A. (1971). 'Competitive Firms Under Price Uncertainty', AmericanEconomic Review, Vol. 61, pp. 65-73.
Sargent, T. J. (1978). 'Estimation of Dynamic Labor Demand Schedules UnderRational Expectations', Journal of Political Economy, Vo!. 86, pp. 1009-44.
Tinsley, P. A. (1971). 'A Variable Adjustment Model of labour Demand', InternationalEconomic Review, Vol. 12, pp.482-510.
Wickens, M. (1982). 'The Efficient Estimation of Econometric Models with RationalExpectations', Review of Economic Studies, Vol. 49, pp. 5 5-67.
© Basil Blackwcli Ltd. 1994.


![Uncertainty Shocks and Balance Sheet Recessions · I introduce an aggregate uncertainty shock that increases ... moral hazard problem would vanish.DeMarzo and Sannikov[2006] make](https://static.fdocuments.net/doc/165x107/5f7bed99e96d2b223e2db4bf/uncertainty-shocks-and-balance-sheet-recessions-i-introduce-an-aggregate-uncertainty.jpg)


