Agglomeration in the Retail Sector: Insights from a …€¦ · Agglomeration in the Retail Sector:...
20
Agglomeration in the Retail Sector: Insights from a Survey of Metro Manila Retail Establishments CBRD Center for Business Research & Development Working Paper 2013-04 Dr. Neriza M. Delfino August 2013
-
Upload
nguyenkhue -
Category
Documents
-
view
221 -
download
0
Transcript of Agglomeration in the Retail Sector: Insights from a …€¦ · Agglomeration in the Retail Sector:...

Agglomeration in the Retail Sector: Insights from a Survey of Metro Manila Retail Establishments
CBRD
Center for Business Research & Development
Working Paper 2013-04
Dr. Neriza M. Delfino August 2013

CBRD
Center for Business Research & Development
Agglomeration in the Retail Sector: Insights from a Survey of Metro Manila Retail Establishments Neriza M. Delfino De La Salle University August 2013
Working Paper 2013-04
The CBRD Working Paper Series constitutes studies that are preliminary and subject to further revisions. They are being circulated in a limited number of copies only for purposes of soliciting comments and suggestions for further refinements. The studies under the Series are unedited and unreviewed. The views and opinions expressed are those of the author and do not necessarily reflect those of the Center. Not for quotation without permission from the author(s) and the Center. © 2013 DLSU-CBRD

1
1.0 Introduction
Clustering or agglomeration is found common in the retail industry, particularly in areas where high foot traffic is encountered. The attraction of firms towards enclaves of commercial spaces or in the malls or wet markets as well as along shopping streets is usually guided by the capability of such areas to attract consumers intending to do one-stop-shopping and benefit from the wide array of items made available for their selection. Nelson (1958) provide the body of literature with his major contribution of the theory of cumulative attraction, based upon the widely held belief that consumers compare goods in a number of stores before purchase or availing of service, particularly when price, form, style, quality and fashion (and after sales service) are main considerations. He believes, therefore, that “given the number of stores dealing in the same merchandise, (retailers) will do more business if they are located adjacent or in proximity to each other than if they are widely scattered”. In addition, no more are the characteristics of the theory of monopolistic competition largely put into play than in the retail sector where the interplay between demand and supply in the market determines equilibrium price and quantity at an industry level and where every firm tries to determine the proper niche for its specific market, giving them leeway for control over of their products’ prices.
This study is an attempt to determine if such characteristics governing agglomeration within the market structure of monopolistic competition is evident in a survey conducted by FM Micro students of retail firms in the Metro Manila area. Are there inherently differences in these characteristics between and among some subsectors of the retail industry (food and beverage, on one hand, and non-food, non-beverage and mixed retailers in the other) and between and among grouped or clustered (agglomerated) firms and standalone (non-agglomerated) firms?
2.0 Frameworks
Industry dynamics on agglomeration abound in the literature. This study helps explain the following frameworks:
1. Unobserved heterogeneity and demand externalities are among those that typically explain retail clustering. Observed variables like location, product variety and spillover effects that explain clustering may be correlated with unobserved variables like consumer preference and convenience. A nearby mall or shopping enclave, recreation or cultural attraction sites, or major gas stations along toll roads attract complementing or rival retailers into the area while restrictive zoning provisions by local governments can be factors accounting for unobserved heterogeneity. Demand externalities, on the other hand, are experienced when co-locating different types of retail establishments in a mall or shopping district or within a larger department store that may guide mall developers in rent determination. The mix of retail establishments within a shopping area like a mall

2
can, likewise, be guided by inter-store demand externalities when assigning specific location to a type a retail establishment as when a couple of restaurants and specialty food stores are strategically placed in different areas of a mall to attract foot traffic when combined with stores selling clothing and apparel, furniture and wares, appliances, books and office supplies and video and audio materials. Anchor stores, the likes of well-known department stores, mainly attract the consumers that would benefit smaller retailers in the surrounding areas (Loweg, 2012).
2. Spatial location choice among retailers may be guided by an agglomeration-differentiation trade-off. This is essentially a trade-off between attracting increased volume sales when a retail firm co-locates with a competitor or creating distance between one retailer and its competitor to enable it to control price. In both situations, differentiation in product offerings and store formats perform critical roles in establishing a retailer’s uniqueness within an enclave. Market characteristics may be key to determining volume effect as when co-location with competing firms occurs in areas close to middle to high-income residential subdivisions or densely populated areas of even low income mixed with middle-income residential and commercial districts (Datta and Sudhir, 2011).
3. Shopping streets versus shopping malls as determinants of agglomeration format presents the ‘evolved retail agglomeration format’ where retail activities occur in central business districts, inner-city locations or main streets (Levy and Weitz, 2006) versus the ‘created retail agglomeration format’ typical of supermalls and commercial enclaves. The former considers the clustering of fragmented retailers that independently lease or own real estate in areas that ‘evolved’ to become commercial spaces from these being previously residential or agricultural in use. As population in the area increases opportunities arise to convert land for commercial use, which may slowly occur as the uncertainty of whether the location can earn commercially is reduced. The increasing presence of other establishments in the location creates information externalities as new entrants gain the incentive to ‘learn-from-others’ particularly when this proves profitable and cost-saving (Teller, n.d.).
All of these frameworks are best understood within the context of monopolistic competition. Case, Fair and Oster (2009) distinguishes monopolistic competition from other market structures, whereby entry cannot be restricted, the products sold are differentiated by way of product features or service delivery. None of the firms can have a large degree of influence over the price but can only do so within a limited range when it can differentiate the product or service from those of others within their vicinity. Competition in this type of market structure as applied to the retail industry is thereby large locational. Most establishments under the retail sector as micro, small and medium scale in size and can be established with relatively smaller amounts of capitalization. Upfront investments can start small. It can be built over the years, as the firm knows its market and the degree of competitiveness it could sustain. This also gives the
3
firm time to determine the sensitiveness of its market to strategies that can be taken to increase sales of the product, like advertising. Demand elasticity do vary over time as the retail establishment encounters competitors that sell substitute products or when other outlets get to be established around the vicinity that can complement the product and jointly boost sales.
3.0 Methodology
The approach taken for this study is highly descriptive due to the unavailability of accurate database on firm level retail activities. Surveys by FM Micro students in the process of conducting individual group studies on the nature of competition experienced by a retail firm within its specific industry, as a project requirement for the course, has generated a number of these surveys of various types of retail establishments over a span of two years. The questionnaire has evolved to include queries on some demographics (like store location, age, legal structure), pricing strategies, forms of price adjustments, main markets and their income categories, days of the week or months of peaks in sales, SWOT data, forms of dealing with cut-throat competition or rivalry, perceived barriers to entry, non-invasive information on financial performance, controls over operating expenditures and marketing elements determining consumer preferences. The questionnaire has been prepared by the proponent of this study based on her experience of being in the retail and franchise business and currently in business process outsourcing. Common questionnaires have been utilized while giving provisions for other questions that could be asked, which is subsector specific. This system enables compilations of data results presented by the proponent to the class for an empirical view of how monopolistic competition guides retailing. Considering that the students were given the choice of the retail outlet to survey, sampling then was purposive and have tended to include more food and beverage outlets, clothing, and apparel stores, which they themselves frequented on a periodic basis or are more familiar with.
To acquire insights into the data gathered, cross tabulations of results were conducted according to general location, i.e. whether the outlet is located on a standalone or group (clustered) basis and whether on a main street, secondary road, a mall or wet market with a provision for other locations that may not clearly fall into any of these. Retail establishments were divided according to two main groups, food and beverage retailing and the rest of the surveyed retailers of non-food or generally non-perishable product items. Although a few service retailers have likewise been surveyed like computer shops and auto-detailing, only those that do sell computer parts and software programs and car parts and accessories were selected for inclusion into this study. Representing shopping street retailers, on either a standalone or grouped basis, are retailers located along major roads and secondary streets while those representing shopping mall retailers are sellers located in malls or inside/periphery of wet markets. There are also retailers that are largely stand alone and are not grouped with similar stores around their location.

4
The breakdown of retail establishments considered for this study are as follows: food and beverage (27), jewelry (2), clothing (11), car accessories (3), general merchandise (10), construction materials (6), books and office supplies (2), printing materials (2), transportation equipment and supplies (2) and others (8).
The questionnaire has technically been pilot tested with the first batch of students that used the survey for their projects. More questions were added while others were reformatted over the succeeding terms. Most of the questions were formulated by this proponent based on research conducted on the economics of retailing.
4.0 Presentation and Evaluation of Results
4.1 The Sample Size
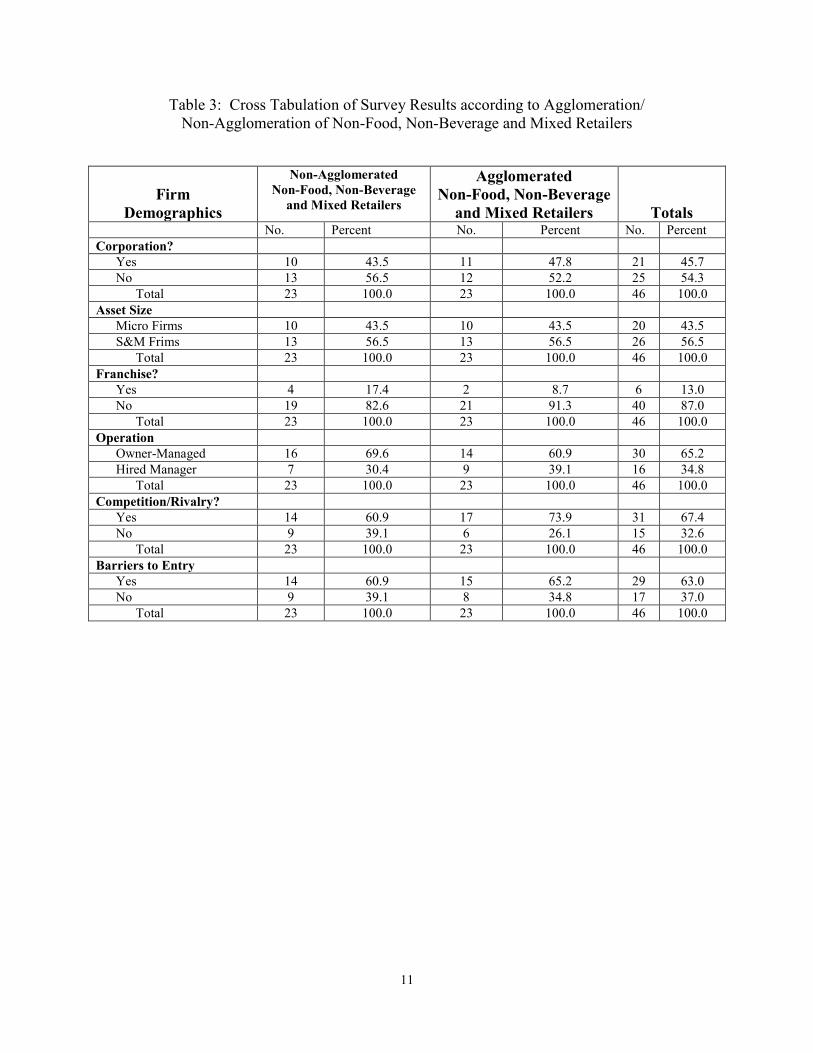
There were 27 food and beverage (F&B) retailers and 46 non-food, non-beverage and mixed (non-F&B) retailers surveyed by students that are included in this descriptive study. Nearly 41% of food and beverage retailers and 50% of the non-food, non-beverage and mixed retailers in the sample are agglomerated. Majority or about 67% of the food and beverage retailers are micro-firms while 57% of non-food, non-beverage and mixed retailers are small and medium sized establishments. In both types of retail establishments, about 66% are owner-managed and the rest are managed by hired managers. Majority of these establishments, whether food and beverage or non-food and non-beverage have experienced some level of cutthroat competition in their business and generally perceive that their industry is confronted with barriers to entry. Very few of the firms in both categories are franchised. Further breakdown on firm demographics are found in Tables 1 and 3 of the appendix.
Tables 5 and 7 of the appendix provide firm demographics on agglomerated firms disaggregated into those retailers that are located on main and secondary roads (also termed as shopping streets) and in malls or wet markets. Again, it is interesting to note that majority of both types of agglomerated retailers are non-franchised, owner-managed, have generally experienced cutthroat competition, and perceive that barriers to entry exists in the industry. Their type of legal identity and asset size vary with majority of retailers located on shopping streets being corporate in structure and are small and medium size firms, whereas those located in malls and wet markets are sole proprietorships with micro asset size. Tables 2, 4, 6 and 8 present the rankings of responses by retailers categorized as non-agglomerated or agglomerated food and beverage or non-food, non-beverage or mixed retailers to the survey questionnaire containing queries on different pricing, marketing and demographic variables.
5
4.2 Comparisons between Non-Agglomerated and Agglomerated Food and Beverage (B&F) Retailers
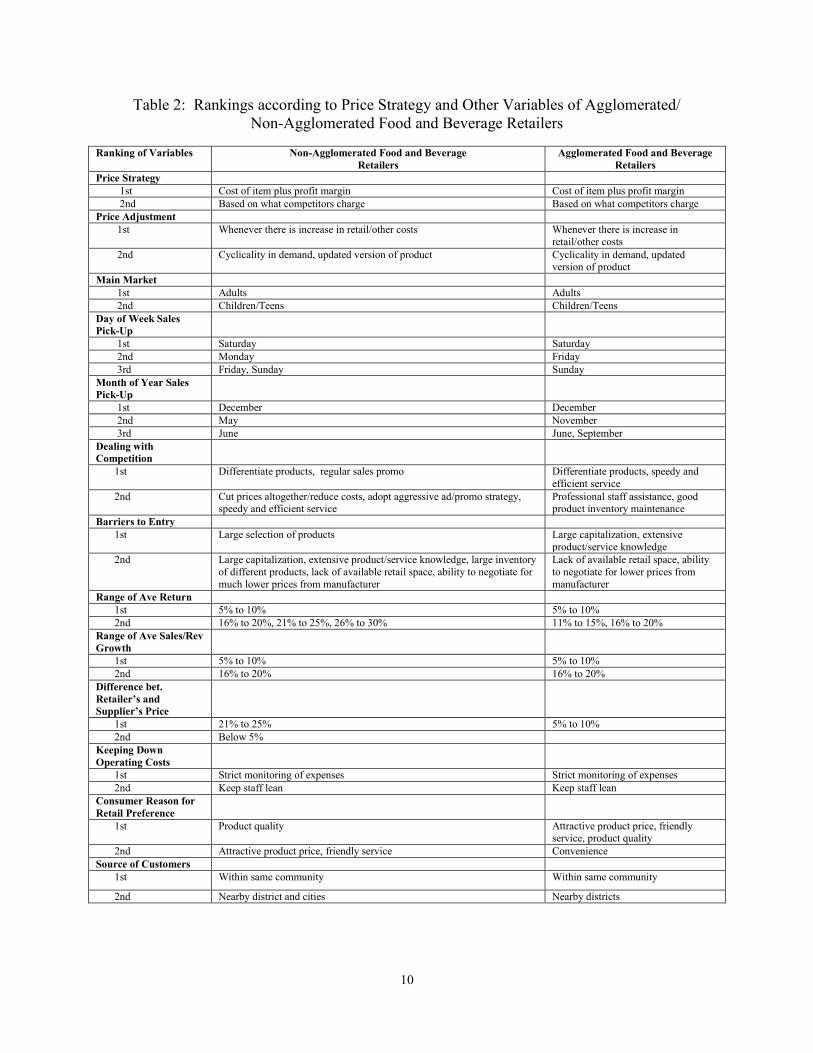
Both types of food and beverage retailers have the same rankings in pricing strategy and pricing adjustments. These retailers follow a strategy of monitoring the cost of the items sold and then incorporate a percentage for profit margin. They keenly keep an eye over how much their competitors charge the same product. Price adjustments occur whenever there is an increase in retail-related costs. They tend to change their prices for older product models and stocks whenever a newer or updated version of the product is introduced in the market. Cyclicality in demand (or what is deemed as business cycle) guides price adjustments as well. Differences in the rankings are observed for day of the week sales pick-up where Monday is ranked second by non-agglomerated firms and Friday for agglomerated firms. Third in rank are Friday and Sunday for non-agglomerated firms and only Sunday for agglomerated firms. Non-agglomerated food and beverage establishments are usually located in areas where foot traffic is high and serves as a convenient source of fast food, more likely when consumers are on their way to work as only non-agglomerated firms can cater to the market when most malls are still closed or late at night when they have closed. This explains why Mondays are the second highest peak day for non-agglomerated establishments. Fridays are third in the rank, very likely accounted for by workers/employees heading for the malls for end-of-workweek night outs.
December has been a peak month for all types of retailers, but for non-agglomerated food and beverage retailers, May is ranked second while November is second rank for agglomerated establishments. Christmas shopping tend to pick up in November when 13th month pays are released. May is a month of shopping for school clothes, which usually occurs in street shops more than in malls. However, June is ranked third by both categories of food and beverage retailers due to start of school where fast food outlets are frequented by students.
In dealing with competition, non-agglomerated retailers turn to regular sales promos, combined with price reductions, to attract sales, whereas agglomerated retailers may not have any option by way of cut-price strategies, especially if franchised, but rather bank more on speedy service, good staff assistance for clients and good product inventory maintenance as strategies to compete. Large capitalization and extensive product/service knowledge give agglomerated firms an edge over non-agglomerated firms and accounts for some level of monopoly control over certain aspects of pricing in the market. On the other hand, a larger selection as well as a large inventory of such products accords non-agglomerated retailers some advantage.
The rates of returns of non-agglomerated firms are generally higher and this is being consistent with the agglomeration-differentiation trade-off where standalone firms, that maintain distance from the next competitor, can have greater control over price charged. Notice a higher difference between a retailer’s prices from those of the suppliers for non-agglomerated retailers. These retailers can pass on the cost of supplies to their consumers, possibly because of a less

6
elastic demand for their goods. This could also account for a higher range of average returns. To keep costs down, both categories of retailers conduct strict monitoring of expenses as well as keeping their staff lean. Attractive product price is only second in rank in terms of reason for preference of a retailer’s products whereas this ranks first among agglomerated firms where competition is more prominent.
4.3 Comparisons between Non-Agglomerated and Agglomerated Non-Food, Non-Beverage and Mixed (non F & B) Retailers
Focusing this time on the differences of these categories of firms, non-agglomerated non-F & B retailers have greater leeway to conduct promos and discounts on paydays and special days whereas agglomerated firms have to closely observe actions taken by competitors while stocking well on fast moving items. When combined with inventory maintenance these combinations of strategies to compete could afford retailers greater sales than when the retailers were to individually run a promo. Mall wide promos/discounts are more common and one establishment does not distinctly distinguish itself from the rest regarding this strategy. The mall, in its entirety, becomes the attraction and serves to be a positive demand externality for agglomerated firms.
A larger selection of products can draw crowds to stand-alone firms while it would be to the advantage of an agglomerated non-F&B firm to maintain a fewer selection of items not found among its nearby competitors but maintain a larger inventory of such limited line of products. It is typical for retail stores with various branches to maintain limited stock in a branch but attend to quick replenishment (sourced from other branches) when stocks run low.
The range of average returns for standalone non-F&B retailers are largely at the extremes. Some retailers in this category realize returns of 30% or more or it could be down to only 5% to 10%. Average returns are more mid-range for agglomerated non-F&B establishments (around 16% to 20% and 11% to 15%). The same is roughly true for average sales growth. The difference, however, between the retailer and supplier’s price is lower at roughly 5% to 10%. Competition, even among suppliers, may be persistent giving the retail outlets greater opportunities at earning higher margins, especially among non-agglomerated firms.
Surprisingly, agglomerated retailers in this study find advertisements as an unnecessary added cost possibly because consumers already, by nature, frequent the malls and their mere presence in these malls is enough advertisement for greater visibility with consumers. If a retailer were a common tenant in malls, consumers would less likely expect them in shopping streets. Non-agglomerated firms are consumer preferred more for their after sales service. Service centers, especially for durable goods and other consumer items like appliance and other equipment, are likewise located where the retailer is. This is hardly the case with stores in malls where the service center is to be found elsewhere and not in malls.

7
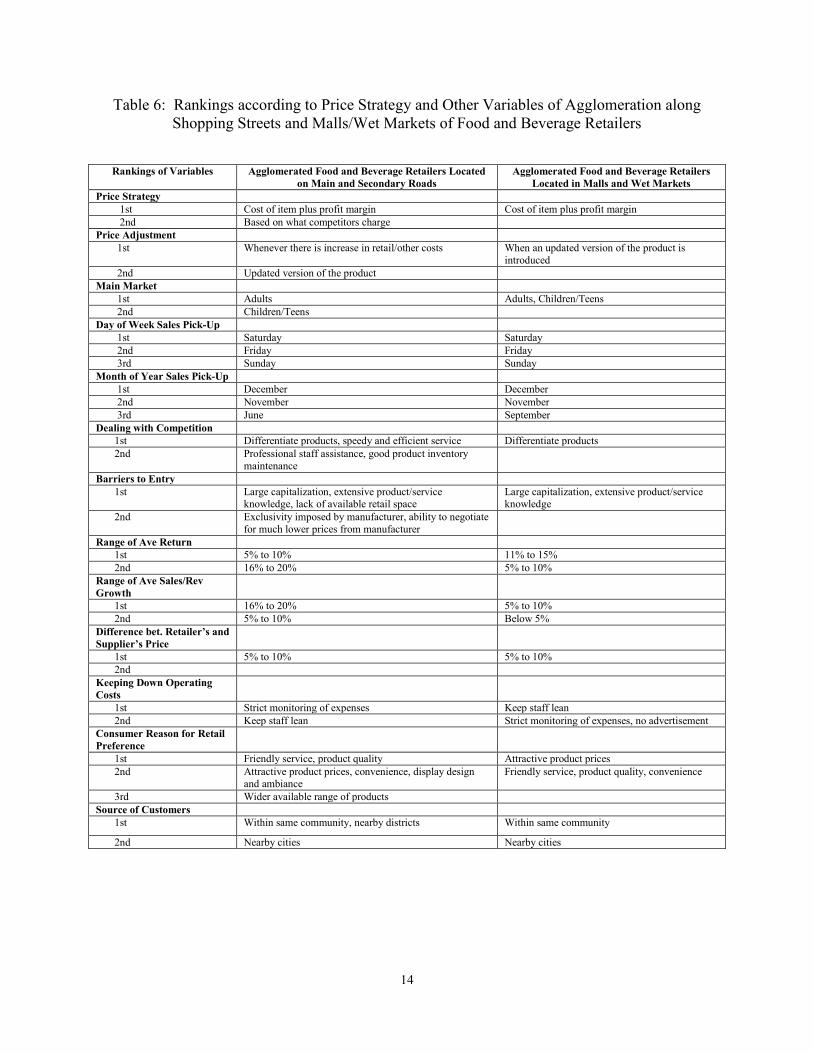
4.4 Comparisons between Agglomerated F&B retailers Located in Shopping Streets versus Shopping Malls/Wet Markets
Considering the small number of agglomerated F&B retailers in the sample, the results are not supported by the numbers. Nonetheless, insights can be drawn from the cross-tabulations. Those located in shopping streets are more conscious of competitor pricing and adjust prices based on increases in cost or when an updated product version hits the market. Sales pick us at about the same ranked days of Friday, Saturday and Sunday. Peak months are roughly the same (November and December) except for the June market pick-up for shopping street retailers versus September for mall retailers. Speedy and efficient service, professional staff assistance and inventory maintenance are ways shopping street retailers deal with competition. Among the barriers to entry perceived by non-F&B, for both street and mall retailers, is the lack of retail space, exclusivity and ability to price negotiate with supplier, which are all second in rank.
Average returns are, in both cases, at mid-level but wider for shopping street retailers. The same holds true for average sales/revenue growth. Seller-retailer price difference is at a lower 5% to 10% range for both agglomerated and non-agglomerated F&B firms. Consumer preferences also vary much less for both categories.
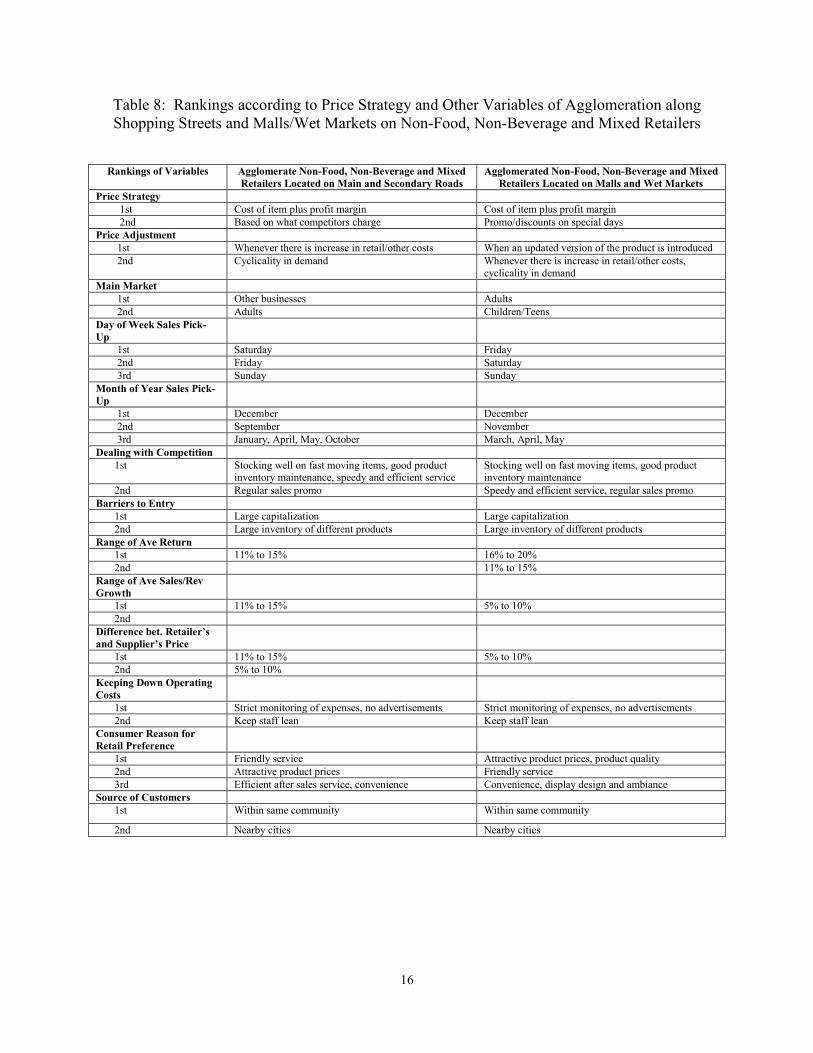
4.5 Comparisons between agglomerated non-F&B Retailers Located in Shopping Streets versus Shopping Malls/Wet Market
Some differences likewise can be observed in the actions taken by retailers based on where clustering occurs. Shopping street retailers of this study exhibit differences in pricing strategies while non-F&B retailers in malls conduct promos/discounts around special days as secondly ranked in their pricing strategy. This is opposed to a strategy of closely following pricing behaviors of competing firms among shopping street (or non-agglomerated) F&B retailers. These retailers are more conscious of the consumers’ tendency to compare prices among nearby stores before purchase. Furthermore, it seems that other businesses are the main market for shopping street retailers followed by adults. Other businesses would usually purchase supplies and other raw materials from street retailers who are in a better position to offer discounts on their goods as opposed to mall stores whose prices are fixed. This may also explain why September and October are peak months for business-to-business selling, possibly in preparation for the Christmas selling season for food and beverage commodities. Since other businesses are main clients, this likewise explains the narrower difference in retailer and supplier’s prices and the lower average returns and sales growth of this category of retailers.
Mall and wet market retailers, on the other hand, enjoy slightly higher average returns, as their main market are essentially household consumers who do not purchase commodities in bulk. The nature of their buying habits necessitates some consideration given to display, design and ambiance (third in the rank on consumer reason for retail preference), a big factor when
8
trying to attract consumers into an outlet and getting them to purchase an item. Purchase activity among household consumers build up in November, reaches a peak in December for the Christmas season, and in March and April for summer activities when most students are off from school and May for shopping in malls for the opening of classes. This latter benefit food and beverage stalls when shoppers take meal and snack breaks from window-shopping and buying activities from non-F&B retailers.
5.0 Conclusions and recommendations The study has been able to present differences in the actions and general activities of
retailers on selected variables surrounding pricing strategies, price adjustments, market, competition and returns based on the clustering or non-clustering of F&B and non-F&B firms and whether clustering occurs in shopping streets or in malls and wet markets. Although an increase in sample size can further strengthen the conclusions of this study, it has nevertheless provided valuable insights into the nature of pricing and competition among retailers that could lend support to all the empirical researches that have already been done on the Philippine retailing industry. These findings could likewise guide prospective retailers in their quest for the right location for their business, depending on their objectives, and regarding the variables considered in this study. Further in depth research can be done into the reasons why retailers do or do not agglomerate, both from the perspective of the retailer and consumers to test the validity of the different frameworks considered by this study.

9
Appendices
Table 1: Cross Tabulation of Survey Results according to Agglomeration/ Non-Agglomeration of Food and Beverage Retailers
Firm Demographics
Non-Agglomerated Food and Beverage
Retailers
Agglomerated Food and Beverage
Retailers
Totals
No. Percent No. Percent No. Percent Corporation? Yes 5 31.3 5 45.5 10 37.0 No 11 68.7 6 54.5 17 63.0 Total 16 100.0 11 100.0 27 100.0 Asset Size Micro Firms 10 62.5 8 72.7 18 66.7 S&M Frims 6 37.5 3 27.3 9 33.3 Total 16 100.0 11 100.0 27 100.0 Franchise? Yes 4 25.0 3 27.3 7 25.9 No 12 75.0 8 72.7 20 74.1 Total 16 100.0 11 100.0 27 100.0 Operation Owner-Managed 9 56.3 9 81.8 18 66.7 Hired Manager 7 43.7 2 18.2 9 33.3 Total 16 100.0 11 100.0 27 100.0 Competition/Rivalry? Yes 8 50.0 6 54.5 14 51.9 No 8 50.0 5 45.5 13 48.1 Total 16 100.0 11 100.0 27 100.0 Barriers to Entry Yes 6 37.5 7 63.6 13 48.1 No 10 62.5 4 36.4 14 51.9 Total 16 100.0 11 100.0 27 100.0
10
Table 2: Rankings according to Price Strategy and Other Variables of Agglomerated/ Non-Agglomerated Food and Beverage Retailers
Ranking of Variables Non-Agglomerated Food and Beverage
Retailers Agglomerated Food and Beverage
Retailers Price Strategy 1st Cost of item plus profit margin Cost of item plus profit margin 2nd Based on what competitors charge Based on what competitors charge Price Adjustment 1st Whenever there is increase in retail/other costs Whenever there is increase in
retail/other costs 2nd Cyclicality in demand, updated version of product Cyclicality in demand, updated
version of product Main Market 1st Adults Adults 2nd Children/Teens Children/Teens Day of Week Sales Pick-Up
1st Saturday Saturday 2nd Monday Friday 3rd Friday, Sunday Sunday Month of Year Sales Pick-Up
1st December December 2nd May November 3rd June June, September Dealing with Competition
1st Differentiate products, regular sales promo Differentiate products, speedy and efficient service
2nd Cut prices altogether/reduce costs, adopt aggressive ad/promo strategy, speedy and efficient service
Professional staff assistance, good product inventory maintenance
Barriers to Entry 1st Large selection of products Large capitalization, extensive
product/service knowledge 2nd Large capitalization, extensive product/service knowledge, large inventory
of different products, lack of available retail space, ability to negotiate for much lower prices from manufacturer
Lack of available retail space, ability to negotiate for lower prices from manufacturer
Range of Ave Return 1st 5% to 10% 5% to 10% 2nd 16% to 20%, 21% to 25%, 26% to 30% 11% to 15%, 16% to 20% Range of Ave Sales/Rev Growth
1st 5% to 10% 5% to 10% 2nd 16% to 20% 16% to 20% Difference bet. Retailer’s and Supplier’s Price
1st 21% to 25% 5% to 10% 2nd Below 5% Keeping Down Operating Costs
1st Strict monitoring of expenses Strict monitoring of expenses 2nd Keep staff lean Keep staff lean Consumer Reason for Retail Preference
1st Product quality Attractive product price, friendly service, product quality
2nd Attractive product price, friendly service Convenience Source of Customers 1st Within same community Within same community
2nd Nearby district and cities Nearby districts
11
Table 3: Cross Tabulation of Survey Results according to Agglomeration/ Non-Agglomeration of Non-Food, Non-Beverage and Mixed Retailers
Firm
Demographics
Non-Agglomerated Non-Food, Non-Beverage
and Mixed Retailers
Agglomerated Non-Food, Non-Beverage
and Mixed Retailers
Totals No. Percent No. Percent No. Percent Corporation? Yes 10 43.5 11 47.8 21 45.7 No 13 56.5 12 52.2 25 54.3 Total 23 100.0 23 100.0 46 100.0 Asset Size Micro Firms 10 43.5 10 43.5 20 43.5 S&M Frims 13 56.5 13 56.5 26 56.5 Total 23 100.0 23 100.0 46 100.0 Franchise? Yes 4 17.4 2 8.7 6 13.0 No 19 82.6 21 91.3 40 87.0 Total 23 100.0 23 100.0 46 100.0 Operation Owner-Managed 16 69.6 14 60.9 30 65.2 Hired Manager 7 30.4 9 39.1 16 34.8 Total 23 100.0 23 100.0 46 100.0 Competition/Rivalry? Yes 14 60.9 17 73.9 31 67.4 No 9 39.1 6 26.1 15 32.6 Total 23 100.0 23 100.0 46 100.0 Barriers to Entry Yes 14 60.9 15 65.2 29 63.0 No 9 39.1 8 34.8 17 37.0 Total 23 100.0 23 100.0 46 100.0

12
Table 4: Rankings according to Price Strategy and Other Variables of Agglomerated/ Non-Agglomerated Non-Food, Non-Beverage and Mixed Retailers
Rankings of Variables Non-Agglomerated Non-Food, Non-Beverage and Mixed Retailers
Agglomerated Non-Food, Non-Beverage and Mixed Retailers
Price Strategy 1st Cost of item plus profit margin Cost of item plus profit margin 2nd Promo/discounts around paydays and special days Based on what competitors charge Price Adjustment 1st Whenever there is increase in retail/other costs Whenever there is increase in retail/other costs 2nd When updated version of product is introduced When updated version of product is introduced Main Market 1st Adults Adults 2nd Other businesses Other businesses Day of Week Sales Pick-Up 1st Saturday Saturday 2nd Friday Friday 3rd Monday, Sunday Sunday Month of Year Sales Pick-Up 1st December December 2nd October November 3rd March May Dealing with Competition 1st Speedy and efficient service Stocking well on fast moving items 2nd Differentiate products Good product inventory maintenance Barriers to Entry 1st Large capitalization Large capitalization 2nd Large selection of products Large inventory of different products Range of Ave Return 1st Above 30% 16% to 20% 2nd 5% to 10% 11% to 15% Range of Ave Sales/Rev Growth 1st 5% to 10% 11% to 15% 2nd 21% to 25% Below 5%, 5% to 10%, 16% to 20% Difference bet. Retailer’s and Supplier’s Price
1st Below 5%, 5% to 10% 5% to 10% 2nd 11% to 15% Keeping Down Operating Costs 1st Strict monitoring of expenses No advertisements 2nd Keep staff lean Strict monitoring of expenses Consumer Reason for Retail Preference
1st Product quality Friendly service 2nd Efficient after sales service Attractive product prices 3rd Friendly service Product quality Source of Customers 1st Within same community Within same community
2nd Nearby cities Nearby cities

13
Table 5: Cross Tabulation of Survey Results according to Agglomeration along Shopping Streets or Malls/Wet Markets of Food and Beverage Retailers
Firm
Demographics
Agglomerated Food and Beverage Retailers
Located on Main and Secondary Roads
Agglomerated Food and Beverage Retailers
Located in Mall and Wet Markets
Totals
No. Percent No. Percent No. Percent Corporation? Yes 3 42.9 2 50.0 5 45.5 No 4 57.1 2 50.0 6 54.5 Total 7 100.0 4 100.0 11 100.0 Asset Size Micro Firms 3 42.9 4 100.0 7 63.6 S&M Frims 4 57.1 0 0 4 36.4 Total 7 100.0 4 100.0 11 100.0 Franchise? Yes 2 28.6 0 0 2 18.2 No 5 71.4 4 100.0 9 81.8 Total 7 100.0 4 100.0 11 100.0 Operation Owner-Managed 5 71.4 3 75.0 8 72.7 Hired Manager 2 28.6 1 25.0 3 27.3 Total 7 100.0 4 100.0 11 100.0 Competition/Rivalry? Yes 5 71.4 2 50.0 7 63.6 No 2 28.6 2 50.0 4 36.4 Total 7 100.0 4 100.0 11 100.0 Barriers to Entry Yes 4 57.1 3 75.0 7 63.6 No 3 42.9 1 25.0 4 36.4 Total 7 100.0 4 100.0 11 100.0
14
Table 6: Rankings according to Price Strategy and Other Variables of Agglomeration along Shopping Streets and Malls/Wet Markets of Food and Beverage Retailers
Rankings of Variables
Agglomerated Food and Beverage Retailers Located on Main and Secondary Roads
Agglomerated Food and Beverage Retailers Located in Malls and Wet Markets
Price Strategy 1st Cost of item plus profit margin Cost of item plus profit margin 2nd Based on what competitors charge Price Adjustment 1st Whenever there is increase in retail/other costs When an updated version of the product is
introduced 2nd Updated version of the product Main Market 1st Adults Adults, Children/Teens 2nd Children/Teens Day of Week Sales Pick-Up 1st Saturday Saturday 2nd Friday Friday 3rd Sunday Sunday Month of Year Sales Pick-Up 1st December December 2nd November November 3rd June September Dealing with Competition 1st Differentiate products, speedy and efficient service Differentiate products 2nd Professional staff assistance, good product inventory
maintenance
Barriers to Entry 1st Large capitalization, extensive product/service
knowledge, lack of available retail space Large capitalization, extensive product/service knowledge
2nd Exclusivity imposed by manufacturer, ability to negotiate for much lower prices from manufacturer
Range of Ave Return 1st 5% to 10% 11% to 15% 2nd 16% to 20% 5% to 10% Range of Ave Sales/Rev Growth
1st 16% to 20% 5% to 10% 2nd 5% to 10% Below 5% Difference bet. Retailer’s and Supplier’s Price
1st 5% to 10% 5% to 10% 2nd Keeping Down Operating Costs
1st Strict monitoring of expenses Keep staff lean 2nd Keep staff lean Strict monitoring of expenses, no advertisement Consumer Reason for Retail Preference
1st Friendly service, product quality Attractive product prices 2nd Attractive product prices, convenience, display design
and ambiance Friendly service, product quality, convenience
3rd Wider available range of products Source of Customers 1st Within same community, nearby districts Within same community
2nd Nearby cities Nearby cities

15
Table 7: Cross Tabulation of Survey Results according to Agglomeration along Shopping Streets or Malls/Wet Markets of Non-Food, Non-Beverage and Mixed Retailers
Firm Demographics
Agglomerated Non-Food, Non-Beverage and Mixed
Retailers Located on Main and Secondary
Roads
Agglomerated Non-Food, Non-Beverage and Mixed Retailers Located
in Malls and Wet Markets
Totals
No. Percent No. Percent No. Percent Corporation? Yes 7 63.6 4 33.3 11 47.8 No 4 36.4 8 66.7 12 52.2 Total 11 100.0 12 100.0 23 100.0 Asset Size Micro Firms 3 33.3 8 63.6 11 47.8 S&M Frims 8 66.7 4 36.4 12 52.2 Total 11 100.0 12 100.0 23 100.0 Franchise? Yes 1 9.1 2 16.7 3 13.0 No 10 90.9 10 83.3 20 87.0 Total 11 100.0 12 100.0 23 100.0 Operation Owner-Managed 6 54.5 7 58.3 13 56.5 Hired Manager 5 45.5 5 41.7 10 43.5 Total 11 100.0 12 100.0 23 100.0 Competition/Rivalry? Yes 9 81.8 8 66.7 17 73.9 No 2 18.2 4 33.3 6 26.1 Total 11 100.0 12 100.0 23 100.0 Barriers to Entry Yes 8 72.7 7 58.3 15 65.2 No 3 27.3 5 41.7 8 34.8 Total 11 100.0 12 100.0 23 100.0
16
Table 8: Rankings according to Price Strategy and Other Variables of Agglomeration along Shopping Streets and Malls/Wet Markets on Non-Food, Non-Beverage and Mixed Retailers
Rankings of Variables Agglomerate Non-Food, Non-Beverage and Mixed Retailers Located on Main and Secondary Roads
Agglomerated Non-Food, Non-Beverage and Mixed Retailers Located on Malls and Wet Markets
Price Strategy 1st Cost of item plus profit margin Cost of item plus profit margin 2nd Based on what competitors charge Promo/discounts on special days Price Adjustment 1st Whenever there is increase in retail/other costs When an updated version of the product is introduced 2nd Cyclicality in demand Whenever there is increase in retail/other costs,
cyclicality in demand Main Market 1st Other businesses Adults 2nd Adults Children/Teens Day of Week Sales Pick-Up
1st Saturday Friday 2nd Friday Saturday 3rd Sunday Sunday Month of Year Sales Pick-Up
1st December December 2nd September November 3rd January, April, May, October March, April, May Dealing with Competition 1st Stocking well on fast moving items, good product
inventory maintenance, speedy and efficient service Stocking well on fast moving items, good product inventory maintenance
2nd Regular sales promo Speedy and efficient service, regular sales promo Barriers to Entry 1st Large capitalization Large capitalization 2nd Large inventory of different products Large inventory of different products Range of Ave Return 1st 11% to 15% 16% to 20% 2nd 11% to 15% Range of Ave Sales/Rev Growth
1st 11% to 15% 5% to 10% 2nd Difference bet. Retailer’s and Supplier’s Price
1st 11% to 15% 5% to 10% 2nd 5% to 10% Keeping Down Operating Costs
1st Strict monitoring of expenses, no advertisements Strict monitoring of expenses, no advertisements 2nd Keep staff lean Keep staff lean Consumer Reason for Retail Preference
1st Friendly service Attractive product prices, product quality 2nd Attractive product prices Friendly service 3rd Efficient after sales service, convenience Convenience, display design and ambiance Source of Customers 1st Within same community Within same community
2nd Nearby cities Nearby cities

About the Author
Dr. Neriza Delfino is an Associate Professor at the Financial Management Department of Ramon V. del Rosario College of Business (RVR-COB) of De La Salle University (DLSU). She earned her Doctor of Business Administration from DLSU, and received special training for Japan Studies under Boeki Kenshu Center (Fujinomiya, Japan) and Studies in European Integration under College of Europe (Brugge, Belgium). Her research interests cover financial management and franchising. Her work had been published in the DLSU Business and Economics Review.
Delfino’s work is not limited to the academe, having had professional experience as a Consultant/Director for WorldScribe Asia, Inc. and Project Evaluator for Philippine Export and Foreign Loan Guarantee Corporation. She was a member as well of the Belgian Friendship Society and of the Philippine Economic Society.
Delfino also gives back to society via community service. She was the Conduit to the Joint Project of GAWAD Kalinga and College of Business and Economics for Livelihood Training of Some Members of the Napa Community in Severina Subdivision, Paranaque under DLSU – proof that one can do an impact to society regardless one’s profession.

Bridging faith and scholarship ~ Influencing policy and practice The Center for Business Research and Development (CBRD) envisions itself to be a leading research institution producing scholarly work and influencing business and policy in the Philippines and Asia-Pacific region. It is the research and advocacy arm of the Ramon V. del Rosario College of Business (RVRCOB) of De La Salle University (DLSU).
As a signatory of the United Nations – Principles for Responsible Management Education (UN-PRME), the RVRCOB promotes the UN-PRME principles, which encourage us, among others, to “engage in conceptual and empirical research that advances our understanding about the role, dynamics, and impact of corporations in the creation of sustainable social, environmental and economic value”, and to “facilitate and support dialogue and debate” among different stakeholders “on critical issues related to global social responsibility and sustainability.”
Research thrusts Keeping in mind DLSU’s mission “to be a leading learner-centered research university, bridging faith and scholarship in the service of society, especially the poor”, CBRD provides support to research programs and activities that address the following themes: responsible management education, multistream management approaches, humanistic management, ethical business practices, sustainable business practices, corporate social responsibility, corporate governance, social marketing, SME development, family business management, and social entrepreneurship.
DLSU Faculty Center. 2401 Taft Avenue. Manila 1004. Philippines +63-2-524-4611 loc. 149. +63-2-303-0869 (telefax) . http://www.dlsu.edu.ph/research/centers/cberd