Agenda – Day 1 & 2 Preliminary Reliability Assessment · PDF fileAgenda – Day 1 &...
289
Agenda – Day 1 & 2 Preliminary Reliability Assessment Results Kim Perez Stakeholder Engagement and Policy Specialist 2017-2018 Transmission Planning Process Stakeholder Meeting September 21-22, 2017
Transcript of Agenda – Day 1 & 2 Preliminary Reliability Assessment · PDF fileAgenda – Day 1 &...

Agenda – Day 1 & 2Preliminary Reliability Assessment Results
Kim PerezStakeholder Engagement and Policy Specialist
2017-2018 Transmission Planning Process Stakeholder MeetingSeptember 21-22, 2017

2017-2018 Transmission Planning Process Stakeholder Meeting - Agenda – Day 1
Topic Presenter
Introduction Kim Perez
Overview Jeff Billinton
Key Issues Neil Millar
Preliminary Reliability Results - North ISO Regional Transmission Engineers
Preliminary Reliability Results – South ISO Regional Transmission Engineers
Wrap-up & Next Steps Kim Perez
Page 2

2017-2018 Transmission Planning Process Stakeholder Meeting – Agenda – Day 2
Topic Presenter
Introduction Kim Perez
SDG&E Proposed Reliability Solutions SDG&E
VEA Proposed Reliability Solutions VEA
GridLiance Proposed Reliability Solutions GridLiance
PG&E Proposed Reliability Solutions PG&E
Economic Study Assumptions Yi Zhang
Special Studies updates Sushant Barave/ Yi Zhang Shucheng LiuIrina Green
Next Steps Kim Perez
Page 3
Introduction and OverviewPreliminary Reliability Assessment Results
Jeff BillintonManager, Regional Transmission - North
2017-2018 Transmission Planning Process Stakeholder MeetingSeptember 21-22, 2017
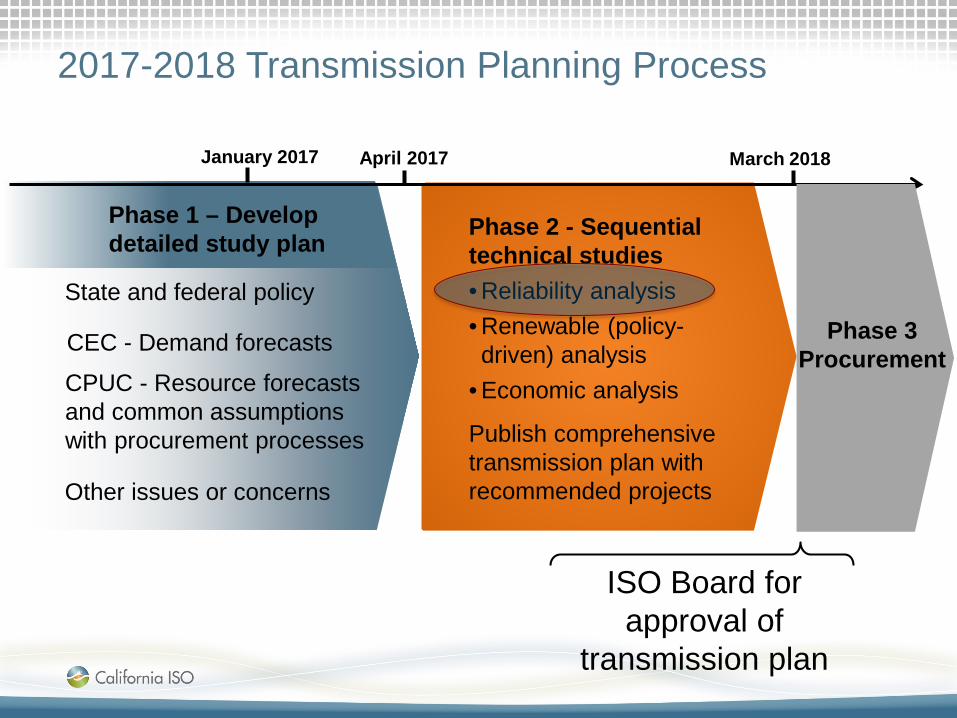
2017-2018 Transmission Planning Process
March 2018April 2017January 2017
State and federal policy
CEC - Demand forecasts
CPUC - Resource forecasts and common assumptions with procurement processes
Other issues or concerns
Phase 1 – Develop detailed study plan
Phase 2 - Sequential technical studies • Reliability analysis• Renewable (policy-driven) analysis
• Economic analysis
Publish comprehensive transmission plan with recommended projects
ISO Board for approval of
transmission plan
Phase 3 Procurement
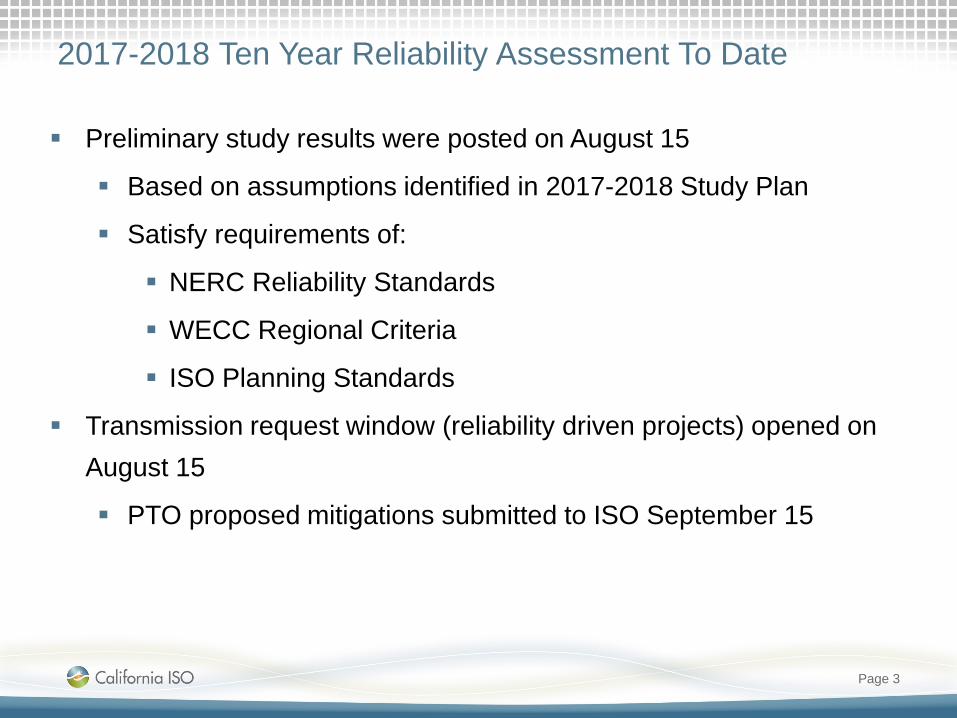
2017-2018 Ten Year Reliability Assessment To Date
Preliminary study results were posted on August 15
Based on assumptions identified in 2017-2018 Study Plan
Satisfy requirements of:
NERC Reliability Standards
WECC Regional Criteria
ISO Planning Standards
Transmission request window (reliability driven projects) opened on August 15
PTO proposed mitigations submitted to ISO September 15
Page 3
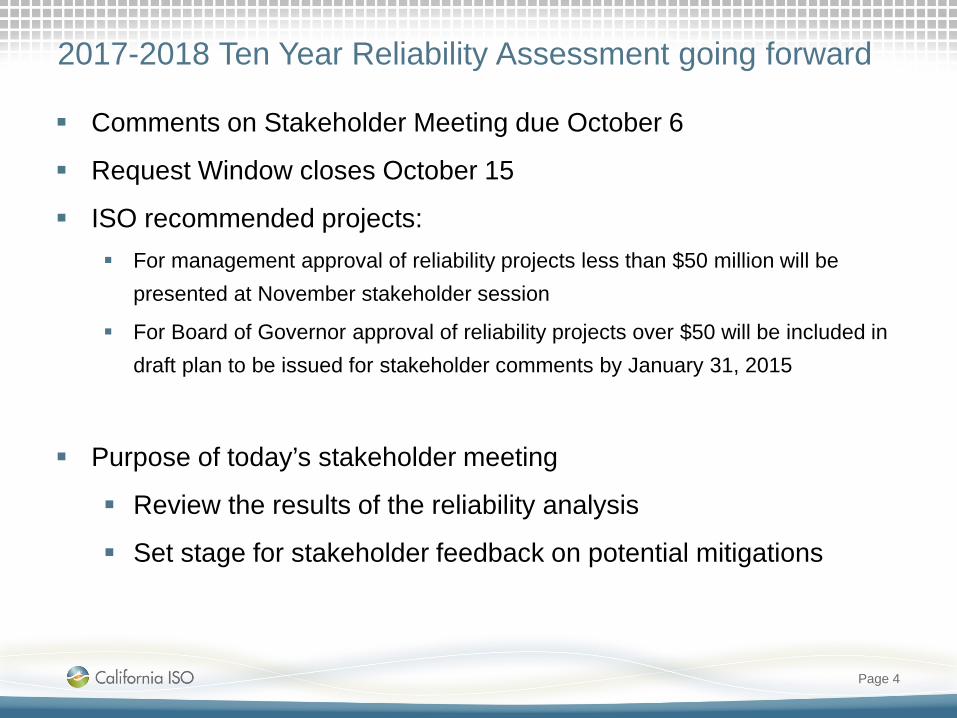
2017-2018 Ten Year Reliability Assessment going forward
Comments on Stakeholder Meeting due October 6
Request Window closes October 15
ISO recommended projects: For management approval of reliability projects less than $50 million will be
presented at November stakeholder session
For Board of Governor approval of reliability projects over $50 will be included in draft plan to be issued for stakeholder comments by January 31, 2015
Purpose of today’s stakeholder meeting
Review the results of the reliability analysis
Set stage for stakeholder feedback on potential mitigations
Page 4

Critical Energy Infrastructure Information
The ISO is constantly re-evaluating its CEII practices to ensure they remain sufficient going forward.
Continuing with steps established in previous years:
Continuing to not post category D contingency discussions in general - only shared on an exception basis where mitigations are being considered: Details on secure web site Summaries on public site
Continuing to migrate previous planning cycles material to the secure website.
One “bulk system” presentation has also been posted on the secure site.
Page 5
Key Issues influencing the 2017-2018 Study PlanTransmission Planning Process
Neil MillarExecutive Director, Infrastructure Development
2017-2018 Transmission Planning Process Stakeholder MeetingSeptember 21, 2017
California ISO Public
Coordination of input assumptions with California Energy Commission and Public Utilities Commission
• RPS portfolio direction for 2017-2018 transmission planning process was received from the CPUC/CEC
• As anticipated, the existing 33% RPS scenarios will continue to be used until direction is available on 50% RPS goals –likely 2018-2019
• Until then, no new policy-driven analysis is anticipated to be required
• Coordination on load forecasting and other modeling assumptions has continued as in the past
• The ISO is continuing to support the CPUC’s IRP process
Page 2

Selection of recommended reliability solutions, and consideration of non-conventional solutions• Stakeholders have expressed interest in more
discussion on the transmission plan on how reliability mitigations are selected and how preferred resources are assessed.
• More discussion will be included in the final plan• Currently, we rely on judgment balancing environmental
feasibility, cost, and technical performance in all selections
• Consideration of preferred resources takes into account previously established frameworks, but is evolving as we consider various applications
• Discussions of the Oakland area and the San Ysidro area will be particularly informative
Page 3
Special study efforts from 2016-2017 are continuing into this year:
• Four special studies from last year are being updated this year:– Complete validation of updated generation models (extension of 2016-
2017 efforts) and update analysis in 2017-2018 TPP– Complete the 50% RPS special study out of state analysis and
coordination with the other western planning regions on interregional transmission project studies (extension of 2016-2017 efforts)
– Complete large energy storage benefits analysis (extension of 2016-2017 efforts)
– Continue to assess the system risks to reliability of economically driven early retirement of gas fired generation (now also an extension of the 2016-2017 efforts focusing on the Plexos analysis)
• Two special studies last year have migrated into regulatory processes:– Support gas-electric coordination issues through CPUC proceedings
(regulatory process)– Further consideration of slow response resource characteristics for
providing local resource adequacy (regulatory process)Slide 4

The ISO Board has approved the proposal to remove the conceptual statewide plan requirement:• Since 2010, the ISO has prepared and published the statewide plan
as part of its annual planning process, initially developed to facilitate coordination with the California Transmission Planning Group (CTPG)
• Implementation of FERC Order No. 1000 has supplanted the need to develop the statewide plan– CTPG is no longer functioning and its members are focused on regional
planning through Order 1000– The statewide plan no longer facilitates the coordination function it was
intended to provide– ISO developing the plan on its own diverts resources away from Order
1000 activities• After an ISO stakeholder process in May and June, the ISO Board
approved the proposal on July 26.• The change was filed with FERC on August 26 and we are awaiting
a decision.Slide 5

Western Planning Region Interregional coordination of data obligation and Anchor Data Set (ADS)
• WECC Board approved the creation of the ADS development process– “The ADS will include data used by the Western Planning Regions (WPR) to create
regional plans that establish a common modeling foundation to be used by WECC, the WPRs and other stakeholders . . .”
• Western Planning Regions (WPR) and WECC collaborated on the development of the ADS Process Workflow
• WPRs coordinated their regional planning data to develop coordinated datasets for implementing the initial ADS
– Coordinated 2026 power flow case provided to WECC in early August– Coordinated 2026 production cost model dataset provided to WECC middle of
September
• Reliability Assessment Committee formed the ADS Task Force to provide guidance and recommendations on data process/protocols that will manage how WPR regional planning data is represented in the ADS
• Emerging concern will need to be managed that other non-WPR entities are seeking to “modify” the WPR data represented in the ADS
Slide 6

PG&E System - OverviewPreliminary Reliability Assessment Results
Binaya ShresthaRegional Transmission Engineer Lead
2017-2018 Transmission Planning Process Stakeholder MeetingSeptember 21-22, 2017
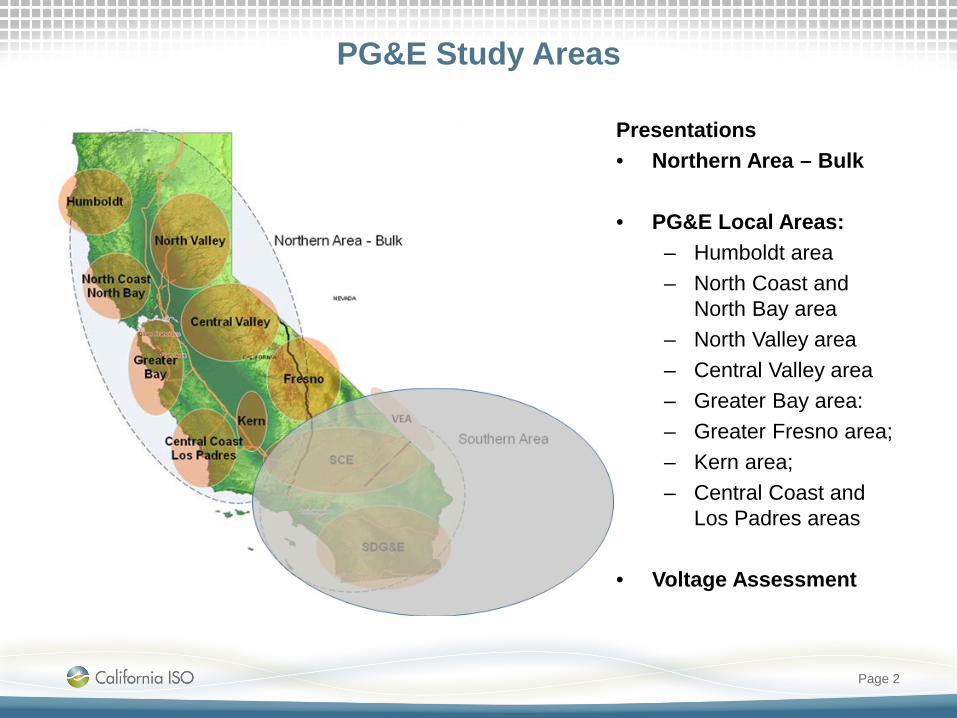
PG&E Study Areas
Page 2
Presentations• Northern Area – Bulk
• PG&E Local Areas:– Humboldt area– North Coast and
North Bay area– North Valley area– Central Valley area– Greater Bay area:– Greater Fresno area;– Kern area;– Central Coast and
Los Padres areas
• Voltage Assessment

Modeling of Projects in Base Cases
• Each local area presentation will identify which previously approved projects were modelled in the base cases
• Previously approved projects not modelled in base cases– Started with projects on hold in 2016-2017 Transmission Plan– Additional projects were not modeled based on review of
changes in assumptions and prior reliability assessment– Need and scope review conducted on not modelled projects
• Previously approved projects modelled in base cases– Projects modeled are still required to meet reliability needs
Slide 3
Local Area Presentation Layout
• Each local area presentation will have following layout:– Area introduction– Base case summary– Previously approved projects modeled in base cases– Previously approved projects not modeled in base cases– Summary of reliability needs identified in the area– Need and scope review of not modeled projects– Areas of additional mitigation requirement– Summary of sensitivity study assessment
Slide 4
Base case summary
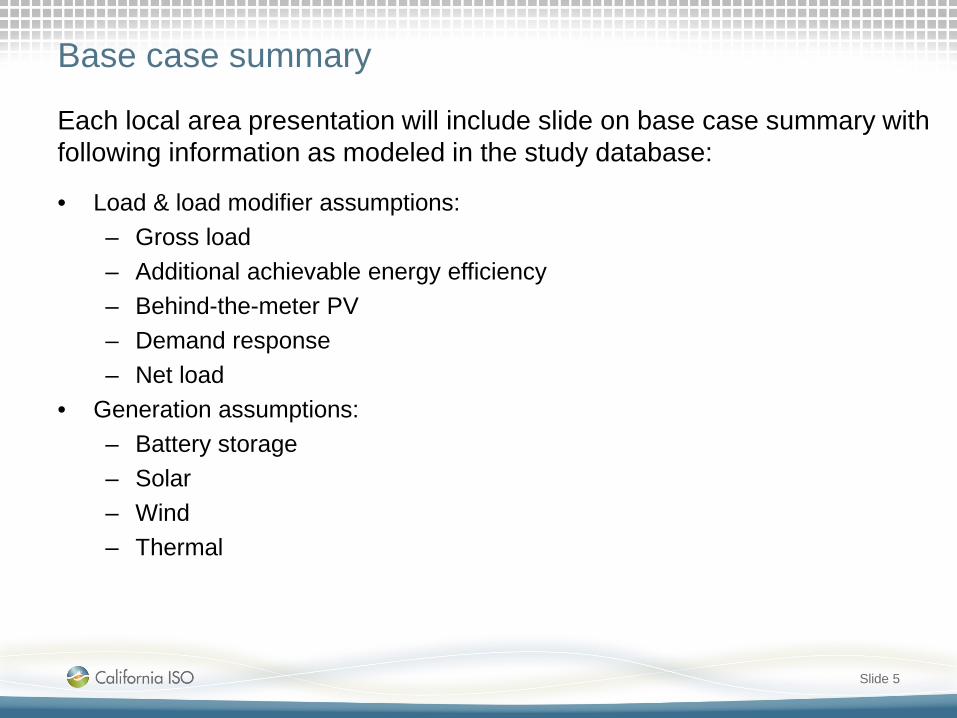
• Load & load modifier assumptions:– Gross load– Additional achievable energy efficiency– Behind-the-meter PV– Demand response– Net load
• Generation assumptions:– Battery storage– Solar– Wind– Thermal
Slide 5
Each local area presentation will include slide on base case summary with following information as modeled in the study database:

Voltage Assessment
• System wide voltage assessment conducted– Voltage assessment will be presented as a separate
presentation and not in local areas
• Review of voltage projects– Similar to the local area assessment the voltage project needs
were reviewed
Slide 6

Greater Bay AreaPreliminary Reliability Assessment Results
Binaya ShresthaRegional Transmission Engineer Lead
2017-2018 Transmission Planning Process Stakeholder MeetingSeptember 21-22, 2017

Greater Bay Area Service areas cover Alameda, Contra
Costa, Santa Clara, San Mateo and San Francisco counties.
Supply sources: Vaca Dixon, Tesla and Metcalf
Comprised of 60, 115 & 230 & 500 kV transmission facilities.
For ease of conducting the performance evaluation, the Greater Bay Area is divided into Seven sub-areas: San Francisco San Jose Peninsula Mission East Bay Diablo De Anza
Slide 2

Load and Load Modifier Assumptions - Greater Bay Area
Slide 3
Installed (MW)
Output (MW)
Total (MW)
D2 (MW)
GBA-2019-SP Baseline2019 summer peak load conditions. Peak load time - hours between 16:00 and 18:00.
8,583 239 1,011 336 8,008 161 73
GBA-2022-SP Baseline2022 summer peak load conditions. Peak load time - hours between 16:00 and 18:00.
8,809 389 1,303 441 7,980 161 73
GBA-2027-SP Baseline2027 summer peak load conditions. Peak load time - hours between 16:00 and 18:00.
9,251 669 2,145 734 7,848 161 73
GBA-2019-WP Baseline2019 winter peak load conditions. Peak load time - hours between 16:00 and 18:00.
8,128 245 1,011 0 7,883 161 73
GBA-2022-WP Baseline2022 winter peak load conditions. Peak load time - hours between 16:00 and 18:00.
8,335 402 1,303 0 7,933 161 73
GBA-2027-WP Baseline2027 winter peak load conditions. Peak load time - hours between 16:00 and 18:00.
8,748 708 2,145 0 8,040 161 73
GBA-2019-ML Baseline2019 spring light load conditions. Light load time - hours between 02:00 and 04:00.
4,644 164 1,011 0 4,480 161 73
GBA-2022-SOP Baseline2022 spring off-peak load conditions. Off-peak load time – weekend morning.
7,141 305 1,303 1,231 5,605 161 73
GBA-2022-SP-PS-AAEE Sensitivity2022 summer peak load conditions with peak-shift and AAEE sensitivity
8,902 0 1,303 169 8,732 161 73
GBA-2019-SP-PS Sensitivity2019 summer peak load conditions with peak-shift sensitivity
8,687 239 1,011 207 8,241 161 73
GBA-2027-SP-PS Sensitivity2027 summer peak load conditions with peak-shift sensitivity
9,290 669 2,145 197 8,424 161 73
GBA-2022-SP-HiRenew Sensitivity2022 summer peak load conditions with hi renewable dispatch sensitivity
8,759 339 1,303 441 7,980 161 73
GBA-2027-SP-QF Sensitivity2027 summer peak load conditions with QF retirement sensitivity
9,251 669 2,145 734 7,848 161 73
Note: DR and storage are modeled offline in starting base cases.
Base Case Scenario Type DescriptionGross Load
(MW)AAEE (MW)
BTM-PV Net Load (MW)
Demand Response

Generation Assumptions - Greater Bay Area
Slide 4
Installed (MW)
Dispatch (MW)
Installed (MW)
Dispatch (MW)
Installed (MW)
Dispatch (MW)
Installed (MW)
Dispatch (MW)
GBA-2019-SP Baseline2019 summer peak load conditions. Peak load time - hours between 16:00 and 18:00.
4 25 6 259 79 0 0 6,850 4,507
GBA-2022-SP Baseline2022 summer peak load conditions. Peak load time - hours between 16:00 and 18:00.
4 25 6 259 79 0 0 6,850 4,517
GBA-2027-SP Baseline2027 summer peak load conditions. Peak load time - hours between 16:00 and 18:00.
4 25 6 259 79 0 0 6,850 4,528
GBA-2019-WP Baseline2019 winter peak load conditions. Peak load time - hours between 16:00 and 18:00.
4 25 0 259 108 0 0 6,850 4,166
GBA-2022-WP Baseline2022 winter peak load conditions. Peak load time - hours between 16:00 and 18:00.
4 25 0 259 96 0 0 6,850 3,289
GBA-2027-WP Baseline2027 winter peak load conditions. Peak load time - hours between 16:00 and 18:00.
4 25 0 259 119 0 0 6,850 4,432
GBA-2019-ML Baseline2019 spring light load conditions. Light load time - hours between 02:00 and 04:00.
4 25 0 259 24 0 0 6,850 2,093
GBA-2022-SOP Baseline2022 spring off-peak load conditions. Off-peak load time – weekend morning.
4 25 25 259 238 0 0 6,850 1,189
GBA-2022-SP-PS-AAEE Sensitivity2022 summer peak load conditions with peak-shift and AAEE sensitivity
4 25 6 259 79 0 0 6,850 4,516
GBA-2019-SP-PS Sensitivity2019 summer peak load conditions with peak-shift sensitivity
4 25 6 259 79 0 0 6,850 4,401
GBA-2027-SP-PS Sensitivity2027 summer peak load conditions with peak-shift sensitivity
4 25 6 259 79 0 0 6,850 4,556
GBA-2022-SP-HiRenew Sensitivity2022 summer peak load conditions with hi renewable dispatch sensitivity
4 25 25 259 238 0 0 6,850 2,150
GBA-2027-SP-QF Sensitivity2027 summer peak load conditions with QF retirement sensitivity
4 25 6 259 79 0 0 6,850 4,530
Note: DR and storage are modeled offline in starting base cases.
Base Case Scenario Type DescriptionHydro ThermalBattery
Storage (MW)
Solar Wind

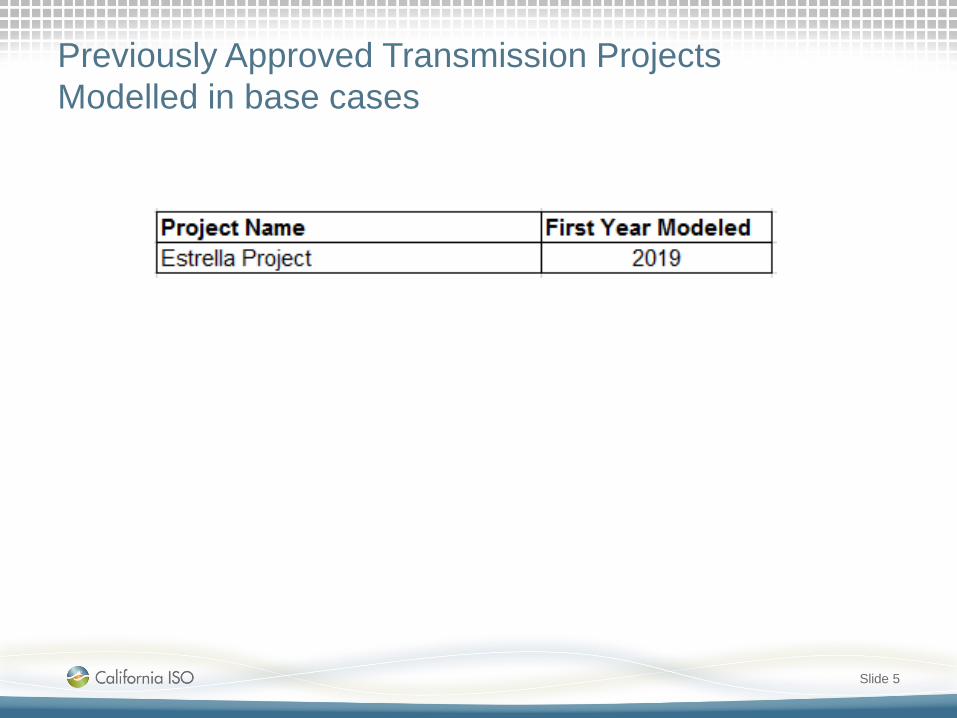
Previously Approved Transmission Projects Modelled in base cases
Slide 5
Project Name First Year Modeled
Christie 115/60 kV Transformer No. 2 2019
Contra Costa Sub 230 kV Switch Replacement 2019
Cooley Landing 115/60 kV Transformer Capacity Upgrade 2019
NRS-Scott No. 1 115 kV Line Reconductor 2019
East Shore-Oakland J 115 kV Reconductoring Project 2022
Metcalf-Piercy & Swift and Newark-Dixon Landing 115 kV Upgrade 2022
Monte Vista 230 kV Bus Upgrade 2022
North Tower 115 kV Looping Project 2022
Pittsburg 230/115 kV Transformer Capacity Increase 2022
Martin 230 kV Bus Extension 2027
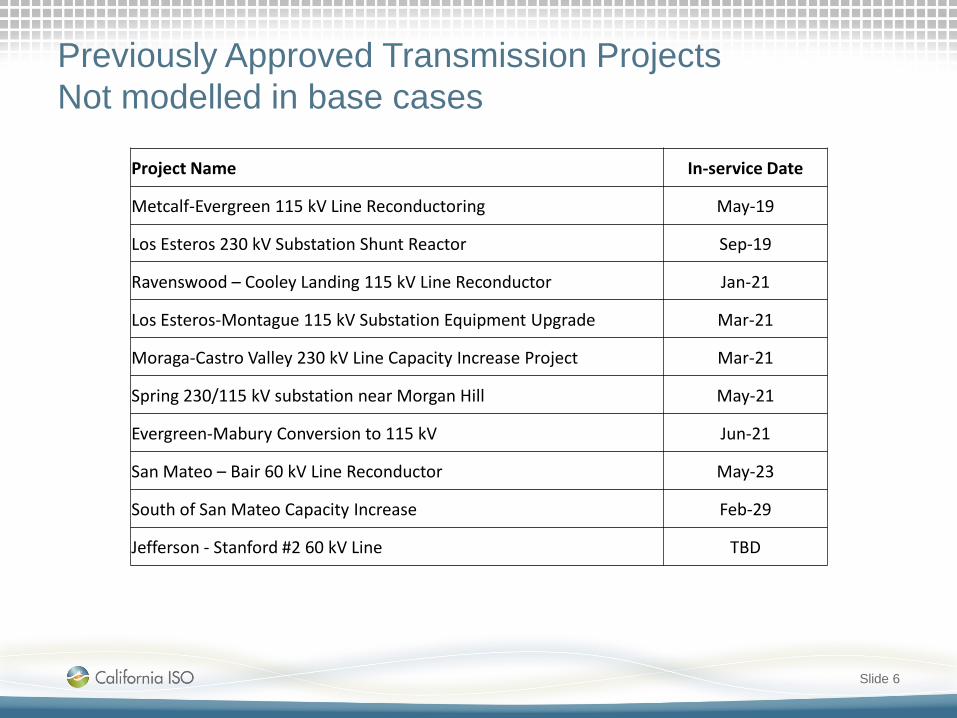
Previously Approved Transmission Projects Not modelled in base cases
Slide 6
Project Name In-service Date
Metcalf-Evergreen 115 kV Line Reconductoring May-19
Los Esteros 230 kV Substation Shunt Reactor Sep-19
Ravenswood – Cooley Landing 115 kV Line Reconductor Jan-21
Los Esteros-Montague 115 kV Substation Equipment Upgrade Mar-21
Moraga-Castro Valley 230 kV Line Capacity Increase Project Mar-21
Spring 230/115 kV substation near Morgan Hill May-21
Evergreen-Mabury Conversion to 115 kV Jun-21
San Mateo – Bair 60 kV Line Reconductor May-23
South of San Mateo Capacity Increase Feb-29
Jefferson - Stanford #2 60 kV Line TBD

Summary of Reliability Needs IdentifiedSF / Peninsula
Facility identified with thermal overload mitigated by previously approved project.
Facility identified with thermal overload not mitigated by previously approved project.
High voltages observed mainly in 60 kV system in 2019 minimum load. Low voltages also observed in 60 kV system for loss of 230 kV source at Jefferson.
Map source: PG&E solar photovoltaic and renewable auction mechanism (PV RAM) project map
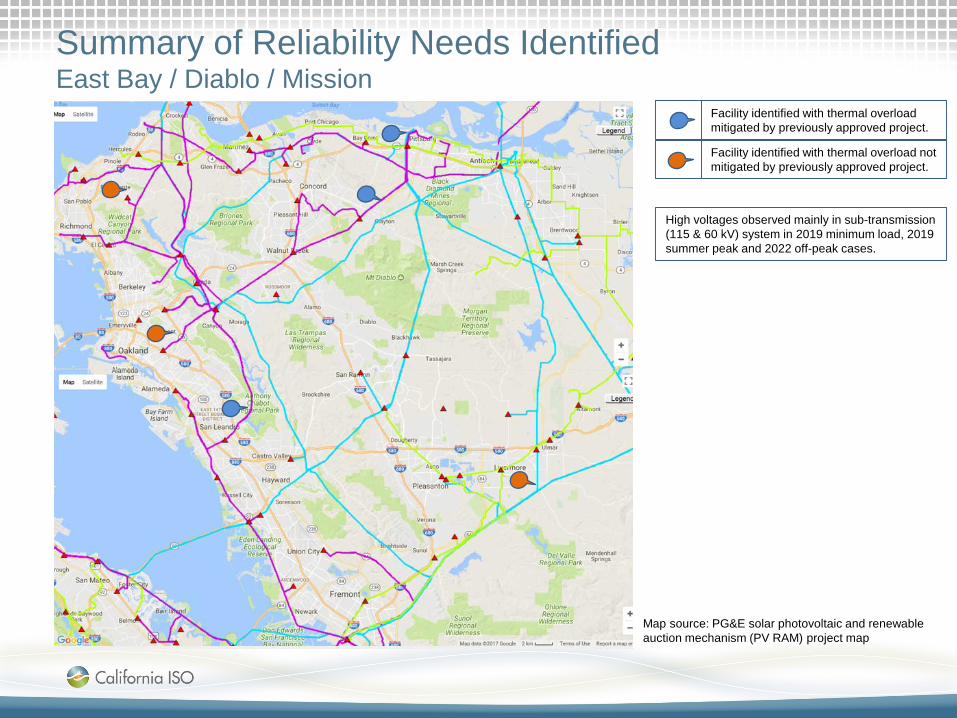
Summary of Reliability Needs IdentifiedEast Bay / Diablo / Mission
Facility identified with thermal overload mitigated by previously approved project.
Facility identified with thermal overload not mitigated by previously approved project.
High voltages observed mainly in sub-transmission (115 & 60 kV) system in 2019 minimum load, 2019 summer peak and 2022 off-peak cases.
Map source: PG&E solar photovoltaic and renewable auction mechanism (PV RAM) project map

Summary of Reliability Needs IdentifiedSan Jose / De Anza
Facility identified with thermal overload mitigated by previously approved project.
Facility identified with thermal overload not mitigated by previously approved project.
High voltages observed mainly in sub-transmission (115 & 60 kV) system in 2019 minimum load, 2019 summer peak and 2022 off-peak cases. Low voltage also observed in 60 kV system for MontaVista 230 kV bus and breaker outages.
Map source: PG&E solar photovoltaic and renewable auction mechanism (PV RAM) project map

Assessment of previously approved projects not modeled in base cases
Slide 10

Metcalf-Evergreen 115 kV Line Reconductoring
• Original need– 2001 TPP: NERC Category P1 thermal
overload.• Reliability Assessment Need
– NERC Categories P2 and P6 thermal overloads in multiple sensitivity scenarios including two peak-shift sensitivities.
• Mitigation still required {or not}– Mitigation required for reliability– Also needed in the Bay Area for LCR in San
Jose sub-area.• Review of current project to meet need
– Current scope of approved project mitigates identified thermal overloads. Under review for potential alternative solutions.
• Alternatives– Power flow control device
• Preliminary Conclusion– Original scope of reconductoring Metcalf-
Evergreen 115 kV lines.
Slide 11

Ravenswood – Cooley Landing 115 kV Line Reconductor• Original need
– 2009 TPP: NERC Category P3 thermal overload.
• Reliability Assessment Need– NERC Category P2, P6 and P7 thermal
overloads in baseline.– Overloads worsen in peak-shift and high CEC
forecast sensitivities.• Mitigation still required {or not}
– Mitigation required for reliability• Review of current project to meet need
– Current scope of approved project mitigates identified thermal overloads. Under review for potential alternative solutions due to potential interaction with south of San Mateo capacity increase project, San Mateo – Bair 60 kV line reconductor project and potential mitigation need for Palo Alto 115 kV lines.
• Alternatives– Cooley Landing 115 kV bus upgrade– New 115 kV source to Palo Alto– Normally close tie between Ames and Monta
Vista 115 kV systems.• Preliminary Conclusion
– Original scope of reconductoring Ravenswood-Cooley Landing 115 kV lines.
Slide 12

Moraga-Castro Valley 230 kV Line Capacity Increase Project
• Original need– 2010-2011 TPP: NERC Category P3 and P6
thermal overloads.• Reliability Assessment Need
– None.• Mitigation still required {or not}
– Mitigation not required for reliability– Mitigation not required for LCR– Needed for generation deliverability
• Review of current project to meet need– Not applicable
• Alternatives– Not applicable
• Preliminary Conclusion– Project needed for generation deliverability
Slide 13
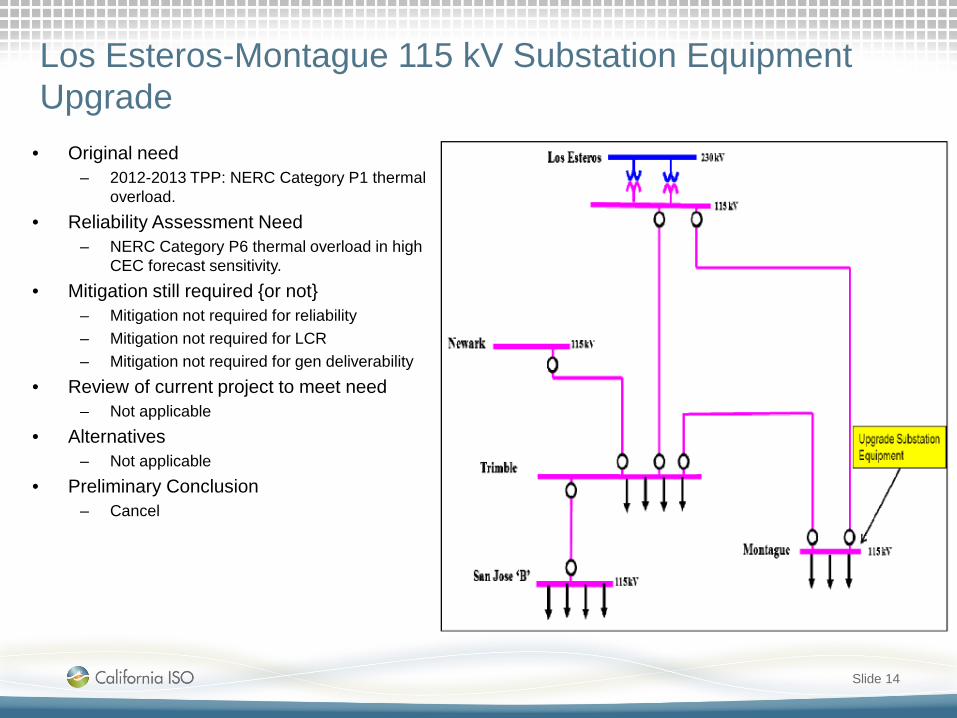
Los Esteros-Montague 115 kV Substation Equipment Upgrade
• Original need– 2012-2013 TPP: NERC Category P1 thermal
overload.• Reliability Assessment Need
– NERC Category P6 thermal overload in high CEC forecast sensitivity.
• Mitigation still required {or not}– Mitigation not required for reliability– Mitigation not required for LCR– Mitigation not required for gen deliverability
• Review of current project to meet need– Not applicable
• Alternatives– Not applicable
• Preliminary Conclusion– Cancel
Slide 14

Evergreen-Mabury Conversion to 115 kV
• Original need– 2009 TPP: Reliability to customers served from
Mabury Substation and NERC Category P1 thermal overload.
• Reliability Assessment Need– NERC Category P1, P2 and P7 thermal
overloads in baseline in 2019 only.– Overloads worsen in 2019 peak-shift
sensitivity.• Mitigation still required {or not}
– Mitigation not required for reliability with Metcalf - Piercy & Swift and Newark - Dixon Landing 115 kV Upgrade project
– Mitigation not required for LCR– Mitigation not required for gen deliverability
• Review of current project to meet need– Metcalf - Piercy & Swift and Newark - Dixon
Landing 115 kV Upgrade project mitigates identified needs.
• Alternatives– Replace 60 kV distribution bank with 115/60/12
kV distribution bank (reduced scope)• Preliminary Conclusion
– Reduced scope with BCR or cancel
Slide 15

Jefferson - Stanford #2 60 kV Line
• Original need– 2010-2011 TPP: NERC Category P3
thermal overload.• Reliability Assessment Need
– NERC Category P2, P5, P6 and P7 thermal overloads in baseline.
– Overloads worsen in peak-shift and high CEC forecast sensitivities..
• Mitigation still required {or not}– Mitigation required for reliability
• Review of current project to meet need– Current needs are driven by proposed
interim system reconfiguration.– Project scope does mitigate original need.
• Alternatives– Not applicable
• Preliminary Conclusion– Remain on hold for further review of load
uncertainty and interim system reconfiguration.
Slide 16

San Mateo – Bair 60 kV Line Reconductor
• Original need– 2009 TPP: NERC Category P1 thermal overload.
• Reliability Assessment Need– NERC Category P2 and P6 thermal overloads in
baseline.– Overloads worsen in peak-shift and high CEC
forecast sensitivities.• Mitigation still required {or not}
– Mitigation required for reliability• Review of current project to meet need
– Current scope of approved project mitigates identified thermal overloads. Under review for potential alternative solutions due to potential interaction with Ravenswood-Cooley Landing 115 kV Reconductor project.
• Alternatives– Cooley Landing 115 kV bus upgrade
• Preliminary Conclusion– Further review.
Slide 17

Morgan Hill Area Reinforcement (Spring)• Original need
– 2013-2014 TPP: NERC Category P6 thermal overload and low voltage.
– Loss of close to 200 MW load and 300 MW of generation for NERC category P7 (DCTL) outage.
• Reliability Assessment Need– Similar to original
• Mitigation still required {or not}– Mitigation required for reliability
• Review of current project to meet need– Current scope of approved project mitigates
identified thermal overloads. Under review for potential alternative solutions.
• Alternatives– Reconductor Green Valley-Llagas 115 kV line
and normally close ties with Green Valley 115 kV system.
– Restructure Metcalf-Green Valley 115 kV line into Green Valley-Morgan Hill 115 kV. Keep the tie normally open and automatic closing for contingency on either side.
– Morgan Hill-Gilroy-Coyote Reinforcement.• Preliminary Conclusion
– Further review
Slide 18

South of San Mateo Capacity Increase
• Original need– 2007 TPP: Bay Area LCR
• Reliability Assessment Need– NERC Categories P6 thermal
overloads in baseline winter scenario w/o SPS action and multiple sensitivity scenarios including two peak-shift sensitivities.
• Mitigation still required {or not}– Mitigation required for reliability
• Review of current project to meet need– Current scope of approved project
mitigates identified thermal overloads. Under review for potential alternative solutions due to feasibility and potential interaction with Ravenswood-Cooley Landing 115 kV Reconductor project.
• Alternatives– New 115 kV source to Palo Alto– Normally close tie between AMES and
Monta Vista 115 kV systems.• Preliminary Conclusion
– Further review of normally closing tie between AMES and Monta Vista 115 kV systems alternative
Slide 19

Areas of additional mitigation requirement
Slide 20
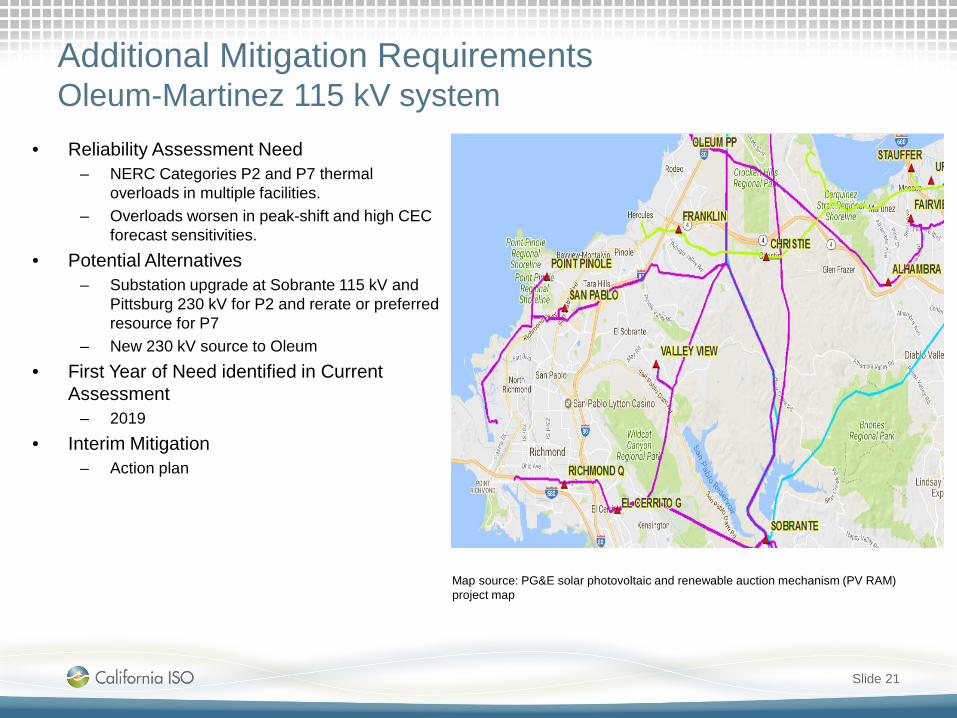
Additional Mitigation RequirementsOleum-Martinez 115 kV system
Slide 21
• Reliability Assessment Need– NERC Categories P2 and P7 thermal
overloads in multiple facilities.– Overloads worsen in peak-shift and high CEC
forecast sensitivities.• Potential Alternatives
– Substation upgrade at Sobrante 115 kV and Pittsburg 230 kV for P2 and rerate or preferred resource for P7
– New 230 kV source to Oleum• First Year of Need identified in Current
Assessment– 2019
• Interim Mitigation– Action plan
Map source: PG&E solar photovoltaic and renewable auction mechanism (PV RAM) project map

Additional Mitigation RequirementsMonta Vista – Newark 115 kV Lines
Slide 22
• Reliability Assessment Need– NERC Categories P6 and P7 thermal
overloads in multiple facilities.– Overloads worsen in peak-shift and high CEC
forecast sensitivities.• Potential Alternatives
– Preferred resource– Rerate– Reconductor
• First Year of Need identified in Current Assessment
– 2019• Interim Mitigation
– Action plan
Map source: PG&E solar photovoltaic and renewable auction mechanism (PV RAM) project map

Additional Mitigation RequirementsNewark-Milpitas & Trimble-San Jose 'B‘ 115 kV Lines
Slide 23
• Reliability Assessment Need– NERC Categories P2, P6 and P7 thermal
overloads in baseline.– Overloads worsen in peak-shift and high CEC
forecast sensitivities.• Potential Alternatives
– Preferred resource– Rerate– Reconductor
• First Year of Need identified in Current Assessment
– 2019• Interim Mitigation
– Action plan
Map source: PG&E solar photovoltaic and renewable auction mechanism (PV RAM) project map

Additional Mitigation RequirementsEast Bay Area Long-Term Need without Local Generation
Slide 24
• Reliability Assessment Need– NERC Categories P2 and P6 thermal
overloads in multiple facilities.– Overloads worsen in peak-shift and high
CEC forecast sensitivities.• Potential Alternatives
– Substation upgrade at Moraga 115 kV and Oakland X 115 kV for P2 and Alameda load transfer and preferred resource for P6
– New 115 kV line to Maritime, Oakland C or Oakland D
– New 230 kV source to vicinity of existing Oakland C
– Generation repower • First Year of Need identified in Current
Assessment without local generation– 2019
• Interim Mitigation– Local generation – Existing SPS
P2 contingencies resulting in thermal overloads
Facilities overloaded resulting from P6 contingencies

Sensitivity Study Assessment
Slide 25
Overloaded Facility Category2022 SP
High CEC Forecast
2019 SP Peak-Shift
2027 SP Peak-Shift
2022 SP Heavy Renewable & Min
Gas Gen
2027 Retirement of QF
GenerationsLos Esteros-Montague 115 kV Line P6 √Metcalf 230/115 kV Trans No. 3 P2 √ √ √Metcalf-El Patio No. 2 115 kV Line P2 √ √Metcalf-Evergreen No. 1 115 kV Line P2 √San Jose 'B'-Stone-Evergreen 115 kV Line P2 √ √Stone-Evergreen-Metcalf 115kV Line P2 √ √Stone-Evergreen-Metcalf 115kV Line P6 √ √ √Monta Vista 230/115 kV Trans No. 2 P6 √ √Monta Vista 230/115 kV Trans No. 3 P6 √Monta Vista 230/115 kV Trans No. 4 P6 √ √Whisman-Monta Vista 115 kV Line P6 √Las Positas-Newark 230kV Line P2 √ √ √
• Below is the list of facility overloads identified in sensitivity scenario(s) only.

Humboldt AreaPreliminary Reliability Assessment Results
Bryan FongSenior Regional Transmission Engineer
2017-2018 Transmission Planning Process Stakeholder MeetingSeptember 21-22, 2017

Humboldt Area
3000 sq. mile area located NW corner of PG&E service area
Cities include Eureka Arcata Garberville
Transmission facilities: 115 kV from Cottonwood and 60 kV – from Mendocino
Slide 2
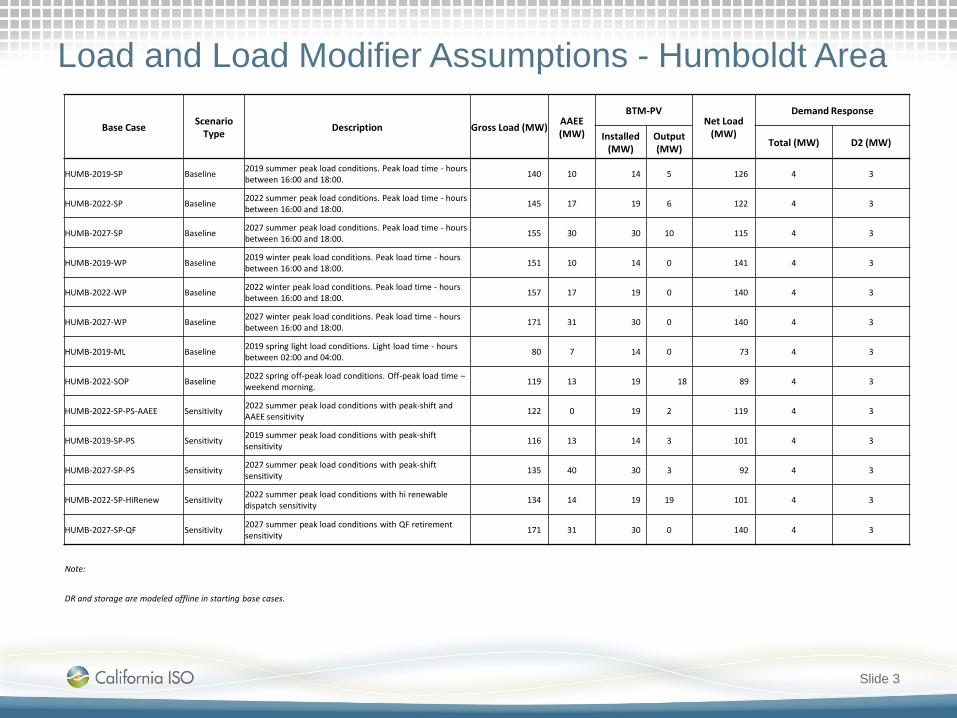
Load and Load Modifier Assumptions - Humboldt Area
Slide 3
Base Case Scenario Type Description Gross Load (MW) AAEE
(MW)
BTM-PVNet Load
(MW)
Demand Response
Installed (MW)
Output (MW) Total (MW) D2 (MW)
HUMB-2019-SP Baseline 2019 summer peak load conditions. Peak load time - hours between 16:00 and 18:00. 140 10 14 5 126 4 3
HUMB-2022-SP Baseline 2022 summer peak load conditions. Peak load time - hours between 16:00 and 18:00. 145 17 19 6 122 4 3
HUMB-2027-SP Baseline 2027 summer peak load conditions. Peak load time - hours between 16:00 and 18:00. 155 30 30 10 115 4 3
HUMB-2019-WP Baseline 2019 winter peak load conditions. Peak load time - hours between 16:00 and 18:00. 151 10 14 0 141 4 3
HUMB-2022-WP Baseline 2022 winter peak load conditions. Peak load time - hours between 16:00 and 18:00. 157 17 19 0 140 4 3
HUMB-2027-WP Baseline 2027 winter peak load conditions. Peak load time - hours between 16:00 and 18:00. 171 31 30 0 140 4 3
HUMB-2019-ML Baseline 2019 spring light load conditions. Light load time - hours between 02:00 and 04:00. 80 7 14 0 73 4 3
HUMB-2022-SOP Baseline 2022 spring off-peak load conditions. Off-peak load time –weekend morning. 119 13 19 18 89 4 3
HUMB-2022-SP-PS-AAEE Sensitivity 2022 summer peak load conditions with peak-shift and AAEE sensitivity 122 0 19 2 119 4 3
HUMB-2019-SP-PS Sensitivity 2019 summer peak load conditions with peak-shift sensitivity 116 13 14 3 101 4 3
HUMB-2027-SP-PS Sensitivity 2027 summer peak load conditions with peak-shift sensitivity 135 40 30 3 92 4 3
HUMB-2022-SP-HiRenew Sensitivity 2022 summer peak load conditions with hi renewable dispatch sensitivity 134 14 19 19 101 4 3
HUMB-2027-SP-QF Sensitivity 2027 summer peak load conditions with QF retirement sensitivity 171 31 30 0 140 4 3
Note:
DR and storage are modeled offline in starting base cases.

Generation Assumptions – Humboldt Area
Slide 4
Base Case Scenario Type Description
Battery Storage (MW)
Solar Wind Hydro Thermal
Installed (MW)
Dispatch (MW)
Installed (MW)
Dispatch (MW)
Installed (MW)
Dispatch (MW)
Installed (MW)
Dispatch (MW)
HUMB-2019-SP Baseline 2019 summer peak load conditions. Peak load time -hours between 16:00 and 18:00. 0 0 0 0 0 0 0 264 125
HUMB-2022-SP Baseline 2022 summer peak load conditions. Peak load time -hours between 16:00 and 18:00. 0 0 0 0 0 0 0 264 126
HUMB-2027-SP Baseline 2027 summer peak load conditions. Peak load time -hours between 16:00 and 18:00. 0 0 0 0 0 0 0 264 110
HUMB-2019-WP Baseline 2019 winter peak load conditions. Peak load time -hours between 16:00 and 18:00. 0 0 0 0 0 0 0 264 83
HUMB-2022-WP Baseline 2022 winter peak load conditions. Peak load time -hours between 16:00 and 18:00. 0 0 0 0 0 0 0 264 166
HUMB-2027-WP Baseline 2027 winter peak load conditions. Peak load time -hours between 16:00 and 18:00. 0 0 0 0 0 0 0 264 110
HUMB-2019-ML Baseline 2019 spring light load conditions. Light load time -hours between 02:00 and 04:00. 0 0 0 0 0 0 0 264 164
HUMB-2022-SOP Baseline 2022 spring off-peak load conditions. Off-peak load time – weekend morning. 0 0 0 0 0 0 0 264 154
HUMB-2022-SP-PS-AAEE Sensitivity 2022 summer peak load conditions with peak-shift and AAEE sensitivity 0 0 0 0 0 0 0 264 207
HUMB-2019-SP-PS Sensitivity 2019 summer peak load conditions with peak-shift sensitivity 0 0 0 0 0 0 0 264 207
HUMB-2027-SP-PS Sensitivity 2027 summer peak load conditions with peak-shift sensitivity 0 0 0 0 0 0 0 264 207
HUMB-2022-SP-HiRenew Sensitivity 2022 summer peak load conditions with hi renewable dispatch sensitivity 0 0 0 0 0 0 0 264 207
HUMB-2027-SP-QF Sensitivity 2027 summer peak load conditions with QF retirement sensitivity 0 0 0 0 0 0 0 264 110
Note:
DR and storage are modeled offline in starting base cases.
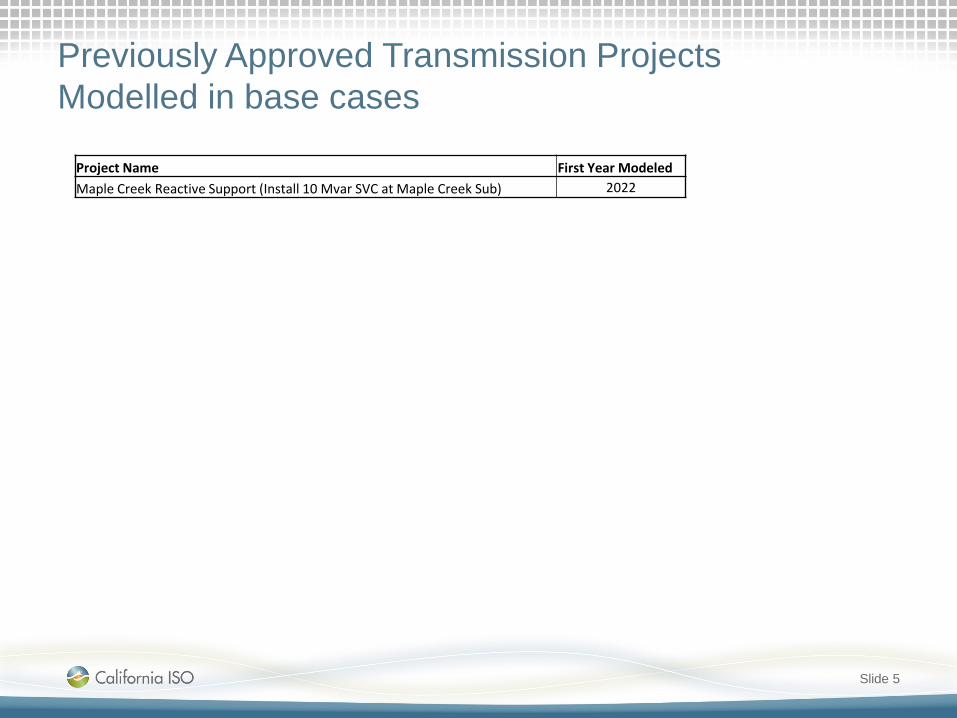
Previously Approved Transmission Projects Modelled in base cases
Slide 5
Project Name First Year ModeledMaple Creek Reactive Support (Install 10 Mvar SVC at Maple Creek Sub) 2022

Previously Approved Transmission Projects Not modelled in base cases
Slide 6
Project Name In-service DateNew Bridgeville – Garberville No. 2 115 kV Line Jan-24

Humboldt Area – Results
Slide 7
Facility identified with reliability issue mitigated by previously approved project.
Facility identified with reliability issue not mitigated by previously approved project.

Assessment of previously approved projects not modeled in base cases
Slide 8

New Bridgeville – Garberville No. 2 115 kV Line • Original need
– NERC Category P1 and P2 thermal overload.• Reliability Assessment Need
– NERC Categories P1, P2, P3 and P6 thermal overloads in summer and winter baseline scenarios
– Overloads worsen in two peak-shift sensitivities scenarios.
• Mitigation still required {or not}– Mitigation required for reliability
• Review of current project to meet need– Current scope of approved project mitigates identified
thermal overloads. Under review for potential alternative solutions.
• Alternatives– Re-dispatch generation at Humboldt Bay Power Plant.
Rerate the Humboldt Bay – Rio Dell 60 kV Line and update limiting equipment on the line. Install a shunt capacitor at Bridgeville 60 kV substation
– Re-dispatch generation at Humboldt Bay Power Plant. Re-conductor some sections of the Humboldt Bay – Rio Dell 60 kV Line and update limiting equipment on the line. Install a shunt capacitor at Bridgeville 60 kV substation
• Preliminary Conclusion– Further analysis required
Slide 9

Areas of additional mitigation requirement
Slide 10

Additional Mitigation RequirementsCarlotta – Rio Dell 60kV line
Slide 11
• Reliability Assessment Need– NERC Categories P2 and P6 voltage issues– Voltage issues worsen in peak-shift and high
CEC forecast sensitivities.• Potential Alternatives
– Address voltage issues, Voltage support, UVLS and/ or SPS
• First Year of Need identified in Current Assessment
– 2019• Interim Mitigation
– Action plan

Sensitivity Study Assessment
Slide 12
• There is no facility overloads identified in sensitivity scenario(s) only.

North Coast & North Bay AreasPreliminary Reliability Assessment Results
Bryan FongSenior Regional Transmission Engineer
2017-2018 Transmission Planning Process Stakeholder MeetingSeptember 21-22, 2017

North Coast and North Bay Areas
Slide 2
10,000 sq. mile area located north of the Bay Area and south of Humboldt
Counties include: Sonoma, Mendocino, Lake, Marin and part of
Napa and Sonoma counties – 10,000 sq. miles
Cities include: Laytonville, Petaluma, San Rafael, Novato,
Benicia, Vallejo
Transmission facilities: 60kV, 115kV and 230 kV

Load and Load Modifier Assumptions – NCNB Area
Slide 3
Base Case Scenario Type Description Gross Load (MW) AAEE (MW)
BTM-PV
Net Load (MW)
Demand Response
Installed (MW)
Output (MW) Total (MW) D2 (MW)
NCNB-2019-SP Baseline 2019 summer peak load conditions. Peak load time -hours between 16:00 and 18:00. 1,447 34 247 91 1,322 13 8
NCNB-2022-SP Baseline 2022 summer peak load conditions. Peak load time -hours between 16:00 and 18:00. 1,479 54 336 113 1,311 13 8
NCNB-2027-SP Baseline 2027 summer peak load conditions. Peak load time -hours between 16:00 and 18:00. 1,561 90 513 176 1,295 13 8
NCNB-2019-WP Baseline 2019 winter peak load conditions. Peak load time - hours between 16:00 and 18:00. 1,533 35 247 0 1,497 13 8
NCNB-2022-WP Baseline 2022 winter peak load conditions. Peak load time - hours between 16:00 and 18:00. 1,566 57 336 0 1,510 13 8
NCNB-2027-WP Baseline 2027 winter peak load conditions. Peak load time - hours between 16:00 and 18:00. 1,654 98 513 0 1,557 13 8
NCNB-2019-ML Baseline 2019 spring light load conditions. Light load time - hours between 02:00 and 04:00. 692 23 247 0 669 13 8
NCNB-2022-SOP Baseline 2022 spring off-peak load conditions. Off-peak load time –weekend morning. 1,074 43 336 318 714 13 8
NCNB-2022-SP-PS-AAEE Sensitivity 2022 summer peak load conditions with peak-shift and AAEE sensitivity 1,421 0 336 44 1,377 13 8
NCNB-2019-SP-PS Sensitivity 2019 summer peak load conditions with peak-shift sensitivity 1,418 45 247 57 1,316 13 8
NCNB-2027-SP-PS Sensitivity 2027 summer peak load conditions with peak-shift sensitivity 1,474 125 513 48 1,302 13 8
NCNB-2022-SP-HiRenew Sensitivity 2022 summer peak load conditions with hi renewable dispatch sensitivity 1,390 47 336 336 1,007 13 8
NCNB-2027-SP-QF Sensitivity 2027 summer peak load conditions with QF retirement sensitivity 1,561 90 513 176 1,295 13 8
Note:
DR and storage are modeled offline in starting base cases.
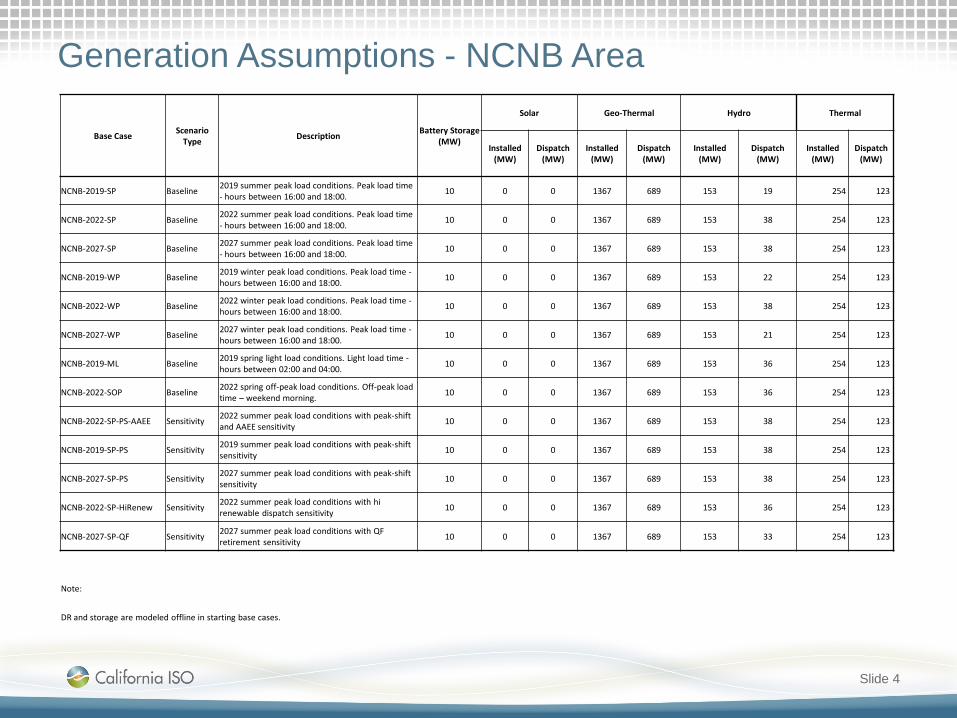
Generation Assumptions - NCNB Area
Slide 4
Base Case Scenario Type Description Battery Storage
(MW)
Solar Geo-Thermal Hydro Thermal
Installed (MW)
Dispatch (MW)
Installed (MW)
Dispatch (MW)
Installed (MW)
Dispatch (MW)
Installed (MW)
Dispatch (MW)
NCNB-2019-SP Baseline 2019 summer peak load conditions. Peak load time - hours between 16:00 and 18:00. 10 0 0 1367 689 153 19 254 123
NCNB-2022-SP Baseline 2022 summer peak load conditions. Peak load time - hours between 16:00 and 18:00. 10 0 0 1367 689 153 38 254 123
NCNB-2027-SP Baseline 2027 summer peak load conditions. Peak load time - hours between 16:00 and 18:00. 10 0 0 1367 689 153 38 254 123
NCNB-2019-WP Baseline 2019 winter peak load conditions. Peak load time -hours between 16:00 and 18:00. 10 0 0 1367 689 153 22 254 123
NCNB-2022-WP Baseline 2022 winter peak load conditions. Peak load time -hours between 16:00 and 18:00. 10 0 0 1367 689 153 38 254 123
NCNB-2027-WP Baseline 2027 winter peak load conditions. Peak load time -hours between 16:00 and 18:00. 10 0 0 1367 689 153 21 254 123
NCNB-2019-ML Baseline 2019 spring light load conditions. Light load time -hours between 02:00 and 04:00. 10 0 0 1367 689 153 36 254 123
NCNB-2022-SOP Baseline 2022 spring off-peak load conditions. Off-peak load time – weekend morning. 10 0 0 1367 689 153 36 254 123
NCNB-2022-SP-PS-AAEE Sensitivity 2022 summer peak load conditions with peak-shift and AAEE sensitivity 10 0 0 1367 689 153 38 254 123
NCNB-2019-SP-PS Sensitivity 2019 summer peak load conditions with peak-shift sensitivity 10 0 0 1367 689 153 38 254 123
NCNB-2027-SP-PS Sensitivity 2027 summer peak load conditions with peak-shift sensitivity 10 0 0 1367 689 153 38 254 123
NCNB-2022-SP-HiRenew Sensitivity 2022 summer peak load conditions with hi renewable dispatch sensitivity 10 0 0 1367 689 153 36 254 123
NCNB-2027-SP-QF Sensitivity 2027 summer peak load conditions with QF retirement sensitivity 10 0 0 1367 689 153 33 254 123
Note:
DR and storage are modeled offline in starting base cases.
Previously Approved Transmission Projects Modelled in base cases
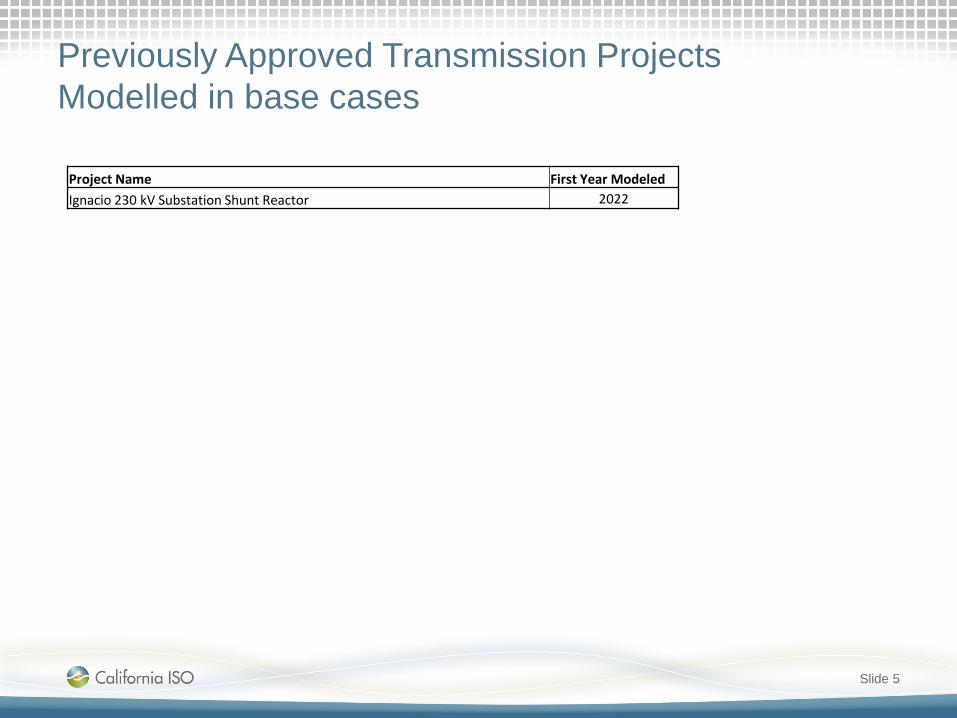
Slide 5
Project Name First Year ModeledIgnacio 230 kV Substation Shunt Reactor 2022

Previously Approved Transmission Projects Not modelled in base cases
Slide 6
Project Name In-service DateFulton-Fitch Mountain 60 kV Line Reconductor (Fulton-Hopland 60 kV Line) Aug-18Fulton 230/115 kV Transformer May-22Clear Lake 60 kV System Reinforcement Feb-23Ignacio – Alto 60 kV Line Voltage Conversion Mar-23Napa – Tulucay No. 1 60 kV Line Upgrades Jul-20

Summary of Reliability Needs Identified
Slide 7
St. Helna
Towards Middle town
Calistoga
Lakeville 115kV
Facility identified with reliability issue mitigated by previously approved project.
Facility identified with reliability issue not mitigated by previously approved project.

Assessment of previously approved projects not modeled in base cases
Slide 8
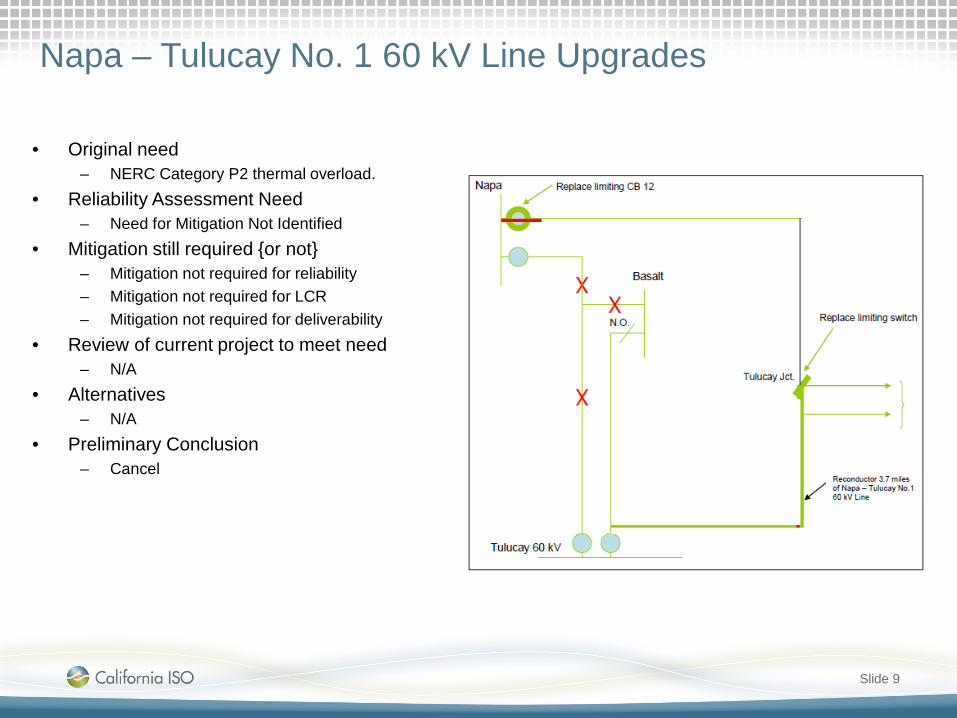
Napa – Tulucay No. 1 60 kV Line Upgrades
• Original need– NERC Category P2 thermal overload.
• Reliability Assessment Need– Need for Mitigation Not Identified
• Mitigation still required {or not}– Mitigation not required for reliability– Mitigation not required for LCR– Mitigation not required for deliverability
• Review of current project to meet need– N/A
• Alternatives– N/A
• Preliminary Conclusion– Cancel
Slide 9
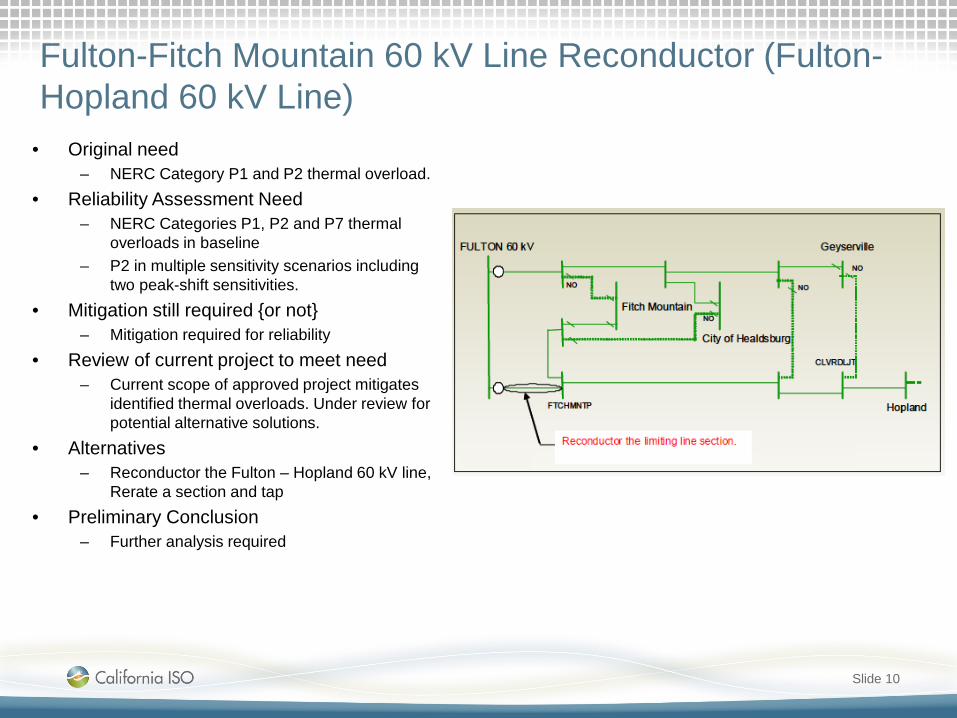
Fulton-Fitch Mountain 60 kV Line Reconductor (Fulton-Hopland 60 kV Line)
• Original need– NERC Category P1 and P2 thermal overload.
• Reliability Assessment Need– NERC Categories P1, P2 and P7 thermal
overloads in baseline– P2 in multiple sensitivity scenarios including
two peak-shift sensitivities.• Mitigation still required {or not}
– Mitigation required for reliability• Review of current project to meet need
– Current scope of approved project mitigates identified thermal overloads. Under review for potential alternative solutions.
• Alternatives– Reconductor the Fulton – Hopland 60 kV line,
Rerate a section and tap • Preliminary Conclusion
– Further analysis required
Slide 10
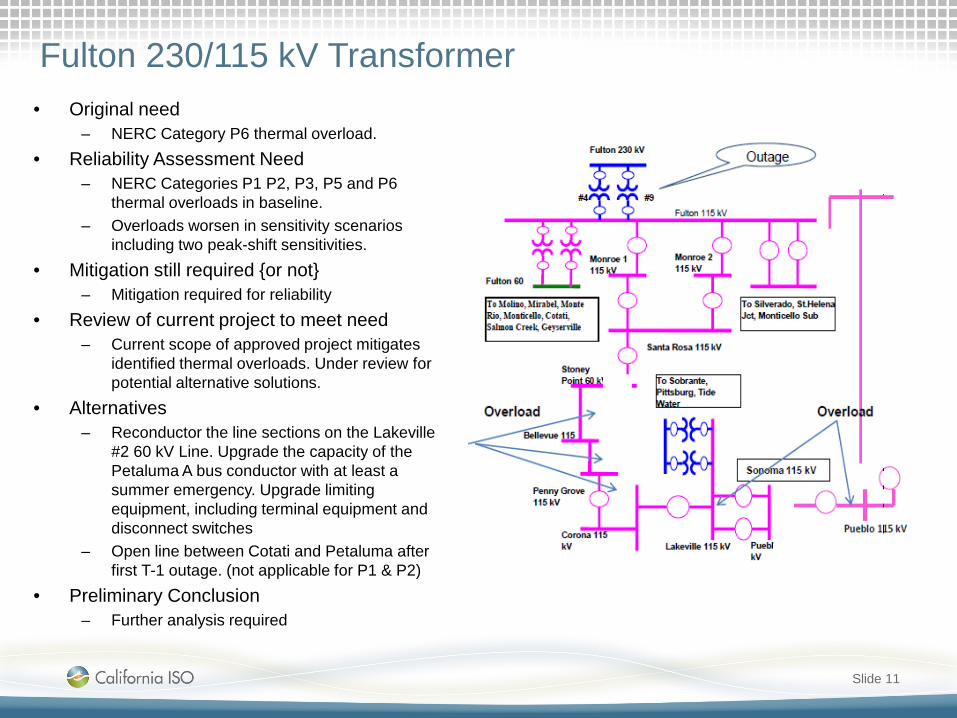
Fulton 230/115 kV Transformer• Original need
– NERC Category P6 thermal overload.• Reliability Assessment Need
– NERC Categories P1 P2, P3, P5 and P6 thermal overloads in baseline.
– Overloads worsen in sensitivity scenarios including two peak-shift sensitivities.
• Mitigation still required {or not}– Mitigation required for reliability
• Review of current project to meet need– Current scope of approved project mitigates
identified thermal overloads. Under review for potential alternative solutions.
• Alternatives– Reconductor the line sections on the Lakeville
#2 60 kV Line. Upgrade the capacity of the Petaluma A bus conductor with at least a summer emergency. Upgrade limiting equipment, including terminal equipment and disconnect switches
– Open line between Cotati and Petaluma after first T-1 outage. (not applicable for P1 & P2)
• Preliminary Conclusion– Further analysis required
Slide 11

Clear Lake 60 kV System Reinforcement• Original need
– NERC Category P1, P2, P3, P6 and P7 thermal overload.
• Reliability Assessment Need– NERC Categories P1 P2, P3 and P6 thermal
overloads in baseline.– Overloads worsen in sensitivity scenarios including
two peak-shift sensitivities.• Mitigation still required {or not}
– Mitigation required for reliability• Review of current project to meet need
– Current scope of approved project mitigates identified thermal overloads. Under review for potential alternative solutions.
• Alternatives– Reconductor Clear Lake – Hopland 60 kV line and
install a shunt capacitor at Middletown 60 kV substation along with the associated interconnecting equipment (i.e. circuit breaker).
– Construct a 60 kV bus at Lower Lake and install a new 115/ 60 kV Transformer at Lower Lake and construct a new 60 kV line from the new 60 kV Lower Lake bus tap onto the Konocti – Middletown 60 kV Line
– Add energy storage at Clear Lake 60 kV Substation– Add energy storage at Lower Lake 60 kV Substation
• Preliminary Conclusion– Further analysis required
Slide 12

Ignacio – Alto 60 kV Line Voltage Conversion• Original need
– NERC Category P2 thermal overload.• Reliability Assessment Need
– NERC Categories P1, P2, P3, P6 and P7 thermal overloads and P2, P3, P6 and P7 in multiple sensitivity scenarios including two peak-shift sensitivities.
• Mitigation still required {or not}– Mitigation required for reliability
• Review of current project to meet need– Current scope of approved project mitigates identified thermal
overloads. Under review for potential alternative solutions.• Alternatives
– Reconductor Ignacio- San Rafael #1 115 kV Line and San Rafael Jct – Greenbrae line section of Ignacio – Alto 60 kV line as well as upgrade limiting equipment. Construct a 60 kV bus at San Rafael, install a new 115/ 60 kV Transformer at San Rafael and loop into the Ignacio – Alto 60 kV line. Reconductor Ignacio- San Rafael #3 115 kV Line and upgrade limiting equipment.
– Reconductor Ignacio – Alto 60 kV Line and upgrade limiting equipment on line. Reconductor Ignacio- San Rafael #1 115 kV Line and upgrade limiting equipment on line. Add shunt capacitors at Greenbrae 60 kV Substation
– Rerate Ignacio – Alto 60 kV Line and upgrade limiting equipment on line. Reconductor Ignacio- San Rafael #1 115 kV Line and upgrade limiting equipment on line. Add shunt capacitors at Greenbrae 60 kV Substation
• Preliminary Conclusion– Further analysis required
Slide 13

Areas of additional mitigation requirement
Slide 14

Additional Mitigation RequirementsIgnacio 230/115kV bank
Slide 15
• Reliability Assessment Need– NERC Categories P1 (2027 Winter
Peak) thermal overload• Potential Alternatives
– Preferred resource– Rerate– Reconductor
• First Year of Need identified in Current Assessment
– 2027• Interim Mitigation
– None• Preliminary Conclusion
– Continue to monitor as overload in 2027 case only

Additional Mitigation RequirementsLakeville – Lakeville Junction 60 kV Line
Slide 16
• Reliability Assessment Need– NERC Categories P1, P2 , P3, P5
& P6 thermal overload in winter baseline
– Overloads worsen in Heavy Renewable & Min Gas Gen forecast sensitivities, peak-shift and high CEC forecast sensitivities
• Potential Alternatives– Preferred resource– Rerate– Reconductor
• First Year of Need identified in Current Assessment
– 2019• Interim Mitigation
– Action plan

Additional Mitigation RequirementsLakeville – Vaca Dixon and Tulucay – Vaca Dixon 230 kV Lines
Slide 17
• Reliability Assessment Need– NERC Categories P2 and P6
thermal overloads in winter baseline
– Overloads worsen in peak-shift and high CEC forecast sensitivities.
• Potential Alternatives– Substation upgrade
• First Year of Need identified in Current Assessment
– 2019• Interim Mitigation
– Action plan
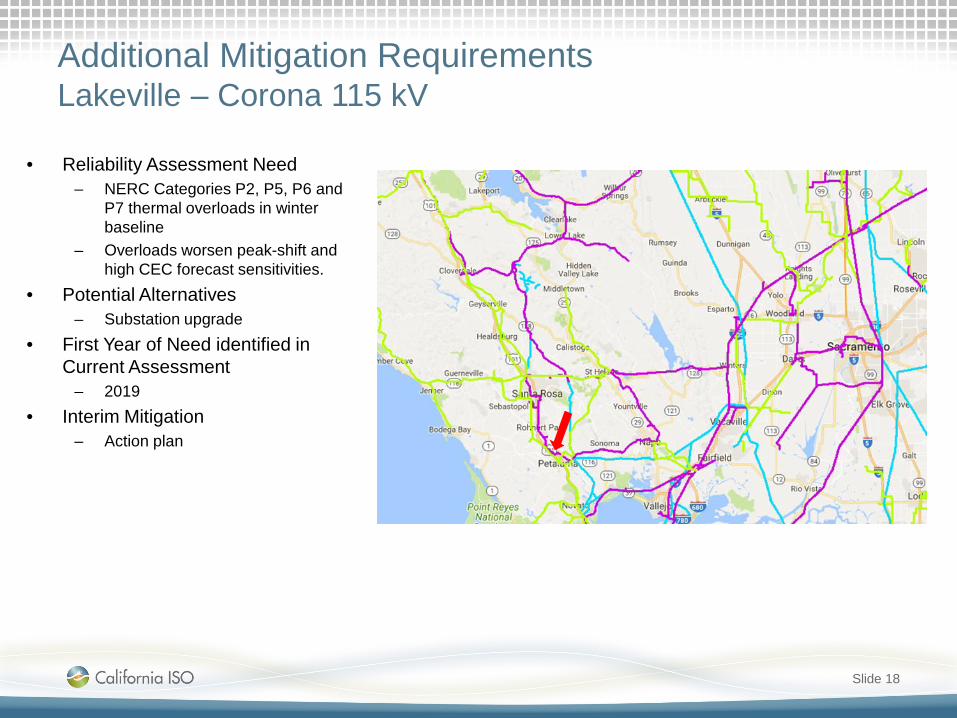
Additional Mitigation RequirementsLakeville – Corona 115 kV
Slide 18
• Reliability Assessment Need– NERC Categories P2, P5, P6 and
P7 thermal overloads in winter baseline
– Overloads worsen peak-shift and high CEC forecast sensitivities.
• Potential Alternatives– Substation upgrade
• First Year of Need identified in Current Assessment
– 2019• Interim Mitigation
– Action plan
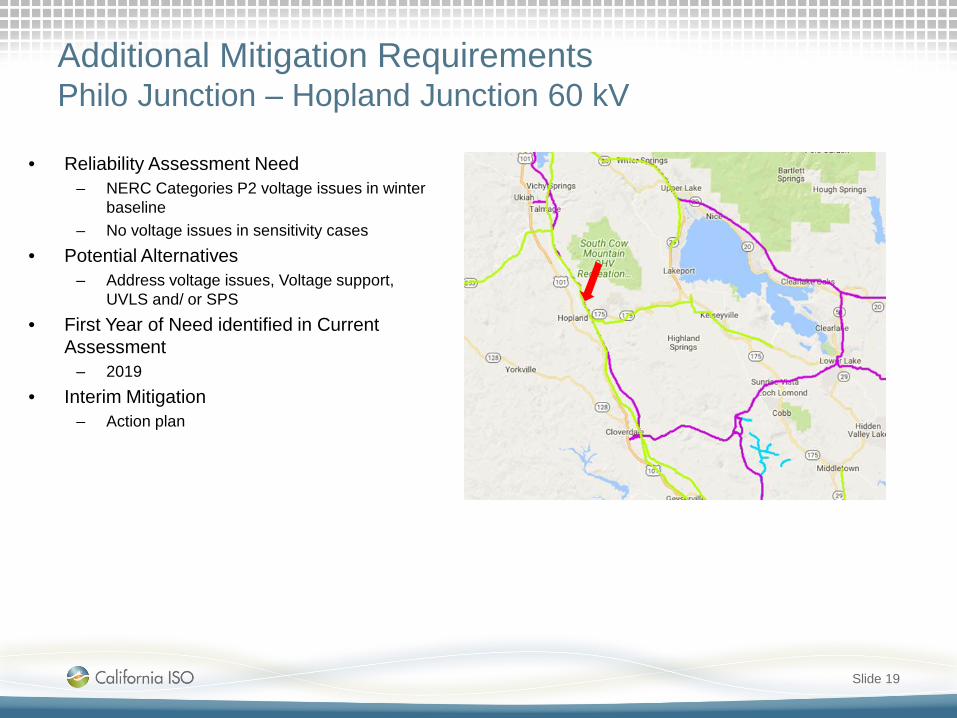
Additional Mitigation RequirementsPhilo Junction – Hopland Junction 60 kV
Slide 19
• Reliability Assessment Need– NERC Categories P2 voltage issues in winter
baseline– No voltage issues in sensitivity cases
• Potential Alternatives– Address voltage issues, Voltage support,
UVLS and/ or SPS• First Year of Need identified in Current
Assessment– 2019
• Interim Mitigation– Action plan

Sensitivity Study Assessment
Slide 20
• Below is the list of facility overloads identified in sensitivity scenario(s) only.
Overloaded Facility Category 2022 SP High CEC Forecast
2019 SP Peak-Shift
2027 SP Peak-Shift
2022 SP Heavy
Renewable & Min Gas Gen
2027 Retirement of
QF Generations
32669 STAF_JCT 60.0 32673 TOCA_JCT 60.0 1 1 P2 √
31362 TRNTN JT 60.0 31378 FULTON 60.0 1 1 P3 √
31364 MOLINO 60.0 31363 TRNTN_JC 60.0 1 1 P3 √
31384 COTATI 60.0 31389 PETC_JCT 60.0 1 1 P3 √
31397 WILLITSJ 60.0 31312 FRT BRGG 60.0 1 1 P3 √
31366 MLNO JCT 60.0 31385 LAGUNATP 60.0 1 1 P5 √ √
31378 FULTON 60.0 32650 ST.HELNA 60.0 1 1 P6 √

Fresno AreaPreliminary Reliability Assessment Results
Abhishek SinghRegional Transmission Engineer Lead
2017-2018 Transmission Planning Process Stakeholder MeetingSeptember 21-22, 2017
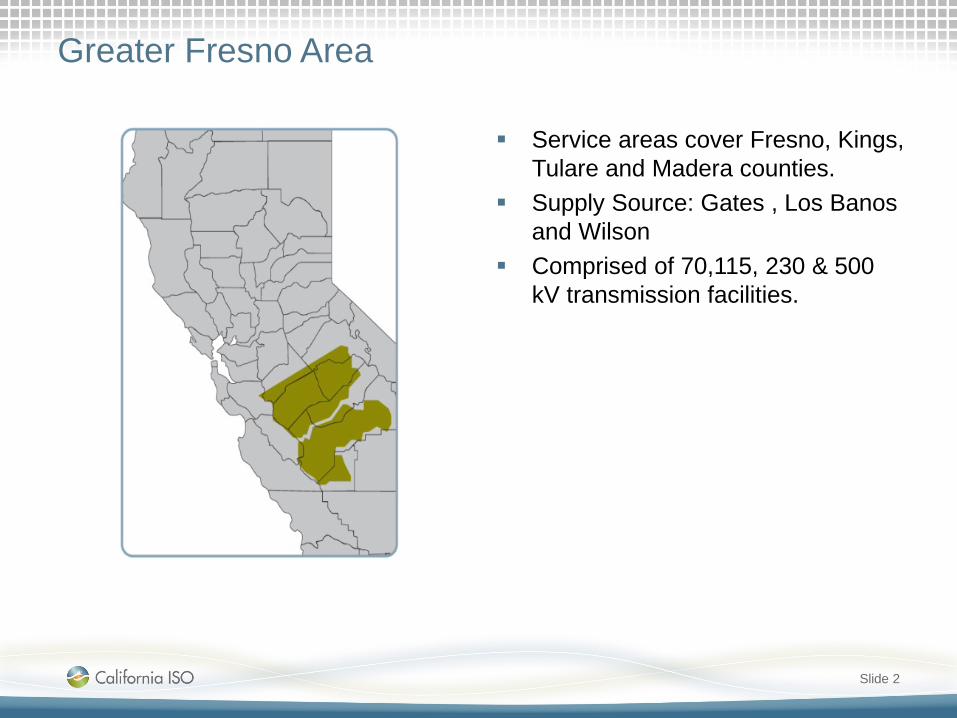
Greater Fresno Area
Service areas cover Fresno, Kings, Tulare and Madera counties.
Supply Source: Gates , Los Banos and Wilson
Comprised of 70,115, 230 & 500 kV transmission facilities.
Slide 2
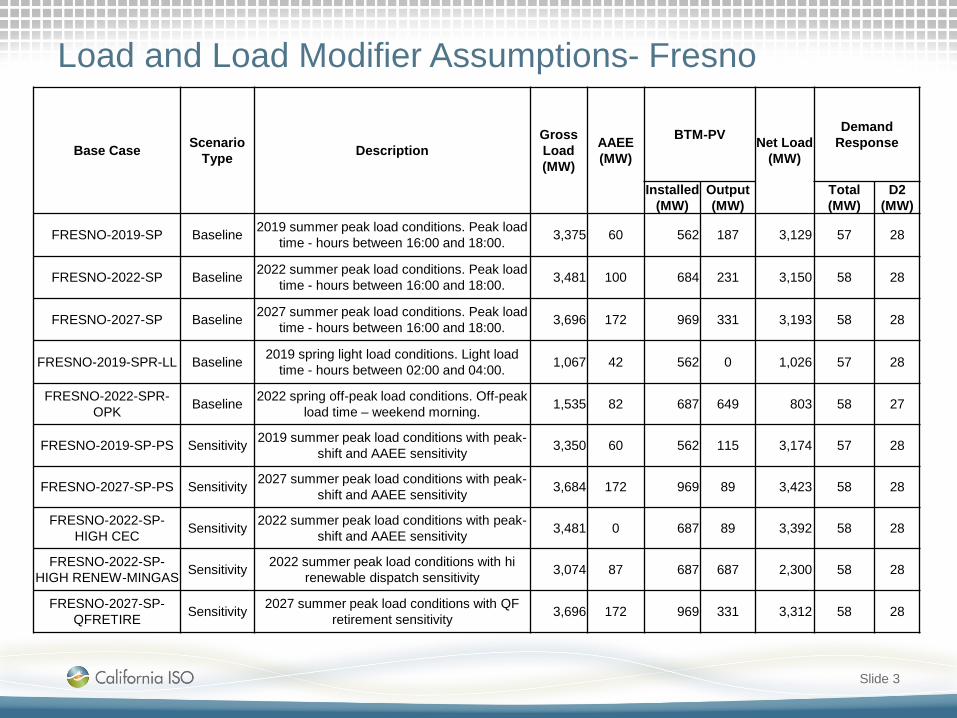
Load and Load Modifier Assumptions- Fresno
Slide 3
Base Case Scenario Type Description
Gross Load (MW)
AAEE (MW)
BTM-PV Net Load (MW)
Demand Response
Installed (MW)
Output (MW)
Total (MW)
D2 (MW)
FRESNO-2019-SP Baseline 2019 summer peak load conditions. Peak load time - hours between 16:00 and 18:00. 3,375 60 562 187 3,129 57 28
FRESNO-2022-SP Baseline 2022 summer peak load conditions. Peak load time - hours between 16:00 and 18:00. 3,481 100 684 231 3,150 58 28
FRESNO-2027-SP Baseline 2027 summer peak load conditions. Peak load time - hours between 16:00 and 18:00. 3,696 172 969 331 3,193 58 28
FRESNO-2019-SPR-LL Baseline 2019 spring light load conditions. Light load time - hours between 02:00 and 04:00. 1,067 42 562 0 1,026 57 28
FRESNO-2022-SPR-OPK Baseline 2022 spring off-peak load conditions. Off-peak
load time – weekend morning. 1,535 82 687 649 803 58 27
FRESNO-2019-SP-PS Sensitivity 2019 summer peak load conditions with peak-shift and AAEE sensitivity 3,350 60 562 115 3,174 57 28
FRESNO-2027-SP-PS Sensitivity 2027 summer peak load conditions with peak-shift and AAEE sensitivity 3,684 172 969 89 3,423 58 28
FRESNO-2022-SP-HIGH CEC Sensitivity 2022 summer peak load conditions with peak-
shift and AAEE sensitivity 3,481 0 687 89 3,392 58 28
FRESNO-2022-SP-HIGH RENEW-MINGAS Sensitivity 2022 summer peak load conditions with hi
renewable dispatch sensitivity 3,074 87 687 687 2,300 58 28
FRESNO-2027-SP-QFRETIRE Sensitivity 2027 summer peak load conditions with QF
retirement sensitivity 3,696 172 969 331 3,312 58 28

Generation Assumptions- Fresno
Slide 4
Base Case Scenario Type Description
Storage (Battery+Helms)(MW)
Solar Hydro( No Helms) Thermal
Installed (MW)
Dispatch (MW)
Installed(MW)
Dispatch (MW)
Installed (MW)
Dispatch (MW)
FRESNO-2019-SP Baseline
2019 summer peak load conditions. Peak load time - hours between 16:00 and 18:00.
1257 1442 361 806 773 2928 1,253
FRESNO-2022-SP Baseline
2022 summer peak load conditions. Peak load time - hours between 16:00 and 18:00.
1257 1618 404 806 773 2928 1,220
FRESNO-2027-SP Baseline
2027 summer peak load conditions. Peak load time - hours between 16:00 and 18:00.
1257 1618 404 806 773 2928 1,254
FRESNO-2019-SPR-LL Baseline
2019 spring light load conditions. Light load time - hours between 02:00 and 04:00.
45 1442 0 806 737 2928 399
FRESNO-2022-SPR-OPK Baseline 2022 spring off-peak load conditions. Off-
peak load time – weekend morning. -865 1618 1598 806 509 2928 1,311
FRESNO-2019-SP-PS Sensitivity 2019 summer peak load conditions with
peak-shift and AAEE sensitivity 1257 1442 361 806 773 2928 1,251
FRESNO-2027-SP-PS Sensitivity 2027 summer peak load conditions with
peak-shift and AAEE sensitivity 1257 1618 404 806 772 2928 1,221
FRESNO-2022-SP-HIGH CEC Sensitivity 2022 summer peak load conditions with
peak-shift and AAEE sensitivity 1257 1618 405 806 772 2928 1,220
FRESNO-2022-SP-HIGH
RENEW-MINGASSensitivity 2022 summer peak load conditions with
hi renewable dispatch sensitivity 1257 1618 1618 806 756 2928 356
FRESNO-2027-SP-QFRETIRE Sensitivity 2027 summer peak load conditions with
QF retirement sensitivity 1257 1618 404 806 773 2928 1,061

Previously Approved Transmission Projects Modelled in base cases
Slide 5
Project Name First Year Modeled
Gregg - Herndon #2 230 kV Line Circuit Breaker Upgrade 2019Los Banos - Livingston Jct - Canal 70 kV Switch Replacement 2019Panoche-Oro Loma 115 kV Reconductoring 2022Helm - Kerman 70 kV Line Reconductor 2019Warnerville - Bellota 230 kV line reconductoring 2027Wilson - Le Grand 115 kV line reconductoring 2022Lemoore 70 kV Disconnect Switches Replacement 2019Oakhurst/Coarsegold UVLS 2019Series Reactor on Warnerville-Wilson 230 kV Line 2019

Previously Approved Transmission Projects Not modelled in base cases
Slide 6
Project Name Current In-Service dateNorthern Fresno 115 kV Area Reinforcement December -2022Ashlan - Gregg and Ashlan - Herndon 230 kV Line Reconductor May-2020Caruthers - Kingsburg 70 kV Line Reconductor April-2019Kearney - Caruthers 70 kV Line Reconductor April-2019McCall - Reedley #2 115 kV Line May-2022Oro Loma - Mendota 115 kV Conversion Project May-2019Reedley 70 kV Reinforcement Feb-2020Reedley 115/70 kV Transformer No. 2Replacement Project May-2021Reedley-Orosi 70 kV Line Reconductor December-2018Reedley-Dinuba 70 kV Line Reconductor March-2019Wilson 115 kV Area Reinforcement March-2019Oro Loma 70 kV Area Reinforcement April-2023Borden 230 kV Voltage Support May-2019Wilson Voltage Support December-2019
Gates-Gregg 230 kV Line December-2022Gates No. 2 500/230 kV Transformer December-2022Kearney - Herndon 230kV Line Reconductor March-2019
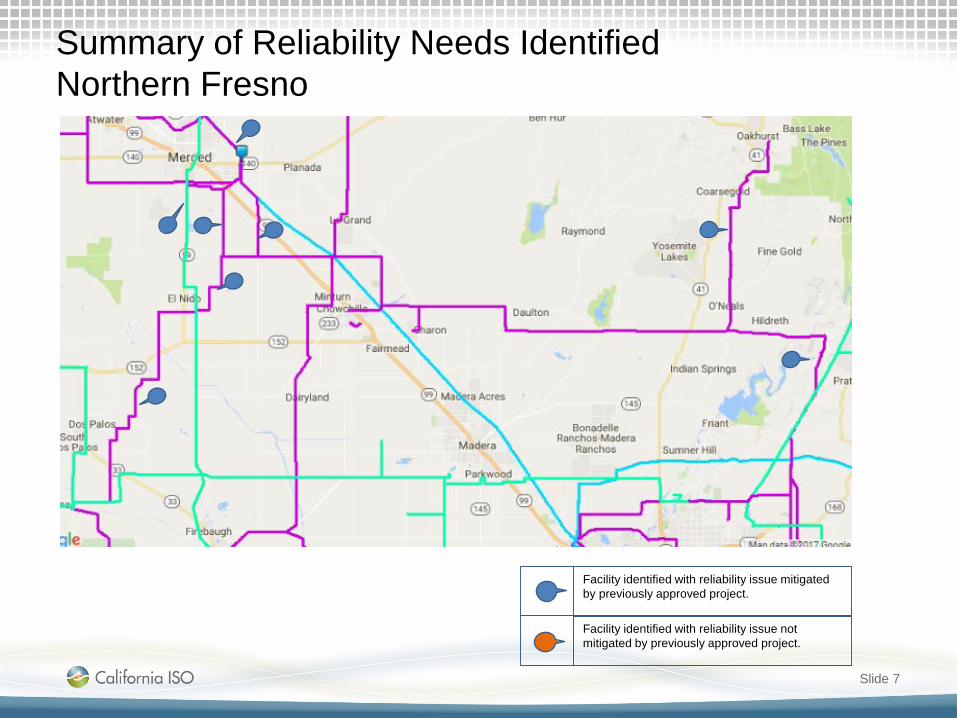
Summary of Reliability Needs IdentifiedNorthern Fresno
Slide 7
Facility identified with reliability issue mitigated by previously approved project.
Facility identified with reliability issue not mitigated by previously approved project.

Summary of Reliability Needs IdentifiedCentral Fresno
Slide 8
Facility identified with reliability issue mitigated by previously approved project.
Facility identified with reliability issue not mitigated by previously approved project.

Summary of Reliability Needs IdentifiedSouthern Fresno
Slide 9
Facility identified with reliability issue mitigated by previously approved project.
Facility identified with reliability issue not mitigated by previously approved project.

Assessment of previously approved projects not modeled in base cases
Slide 10

Caruthers - Kingsburg 70 kV Line Reconductor
• Original need – 2009 TPP: NERC Category P0
• Current Reliability Assessment Need– Not required
• Mitigation still required – Mitigation not required for reliability– Mitigation not required for generation
deliverability– Mitigation not required for LCR
• Review of current project to meet need– Not Applicable
• Alternatives– None
• Preliminary Conclusion– Cancel the Project
Slide 11

Ashlan - Gregg and Ashlan - Herndon 230 kV Line Reconductor
• Original need– NERC Category P7(Gregg-Herndon # 1 & # 2)
thermal overload.• Reliability Assessment Need
– NERC Categories P6 (Gregg-Herndon # 1 & # 2) thermal overloads in baseline and multiple sensitivity scenarios (AAEE and 2027 Peak Shift) that can be mitigated by system adjustment and planned load shed.
• Mitigation still required {or not}– Mitigation not required for reliability– Mitigation not required for generation
deliverability– Mitigation not required for LCR
• Review of current project to meet need– Not Applicable
• Alternatives– Not Applicable
• Preliminary Conclusion– Cancel the Project.
Slide 12

Reedley Area 70kV Reinforcement Projects
Slide 13
2. Reedley 70 kV reinforcement
Replace Limiting equipment on line section
Reconductor line
1.) Reedley 115/70 kV replacement project replaced bank # 2 and rerates bank # 4
4. Reedley Dinuba 70 kV line Reconductor Project
3. Reedley Orosi 70 kV line Reconductor • Install 20 MVARs of
shunt caps at Dinuba Sub.

Reedley 70 kV Area Reinforcement ProjectsProject # 1- Reedley 115/70 kV Transformer # 2 Replacement Project
Slide 14
• Original need – 2013-14 TPP : NERC Category P3
• Current Reliability Assessment Need– No Overloads seen on the T/F bank # 2
• Mitigation still required – Mitigation not required for reliability– Mitigation not required for generation deliverability– Mitigation not required for LCR
• Review of current project to meet need– Not Applicable
• Alternatives– Not Applicable
• Preliminary Conclusion– Cancel the project.

Reedley 70 kV Area Reinforcement ProjectsProject # 2,3 & 4- Reconductor Projects in the Area.
Slide 15
• Original need– NERC Category P1
• Current Reliability Assessment Need– No Overloads seen due to the existing summer setup in the system.
• Mitigation still required – Mitigation not required with the existing summer setup.
• Review of current project to meet need– Current scope of approved project would potentially alleviate the overload in the absence of the summer
setup.• Alternatives
– Extend summer setup for all the seasons.– Utilize Preferred Resources
• Preliminary Conclusion– Further Review Required.
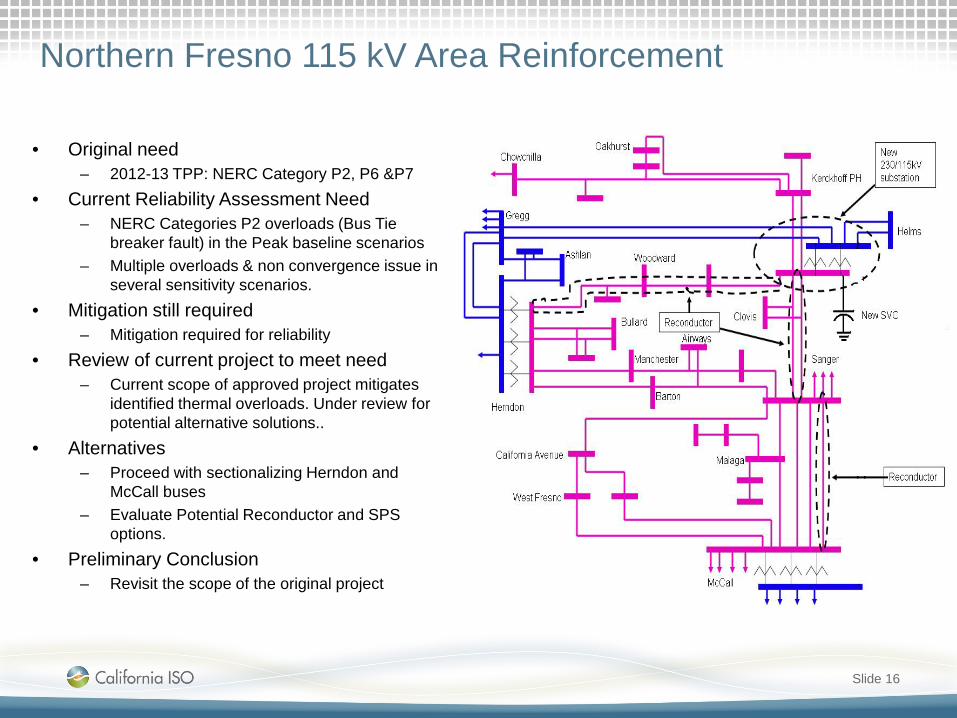
Northern Fresno 115 kV Area Reinforcement
• Original need– 2012-13 TPP: NERC Category P2, P6 &P7
• Current Reliability Assessment Need– NERC Categories P2 overloads (Bus Tie
breaker fault) in the Peak baseline scenarios – Multiple overloads & non convergence issue in
several sensitivity scenarios.• Mitigation still required
– Mitigation required for reliability• Review of current project to meet need
– Current scope of approved project mitigates identified thermal overloads. Under review for potential alternative solutions..
• Alternatives– Proceed with sectionalizing Herndon and
McCall buses – Evaluate Potential Reconductor and SPS
options.• Preliminary Conclusion
– Revisit the scope of the original project
Slide 16
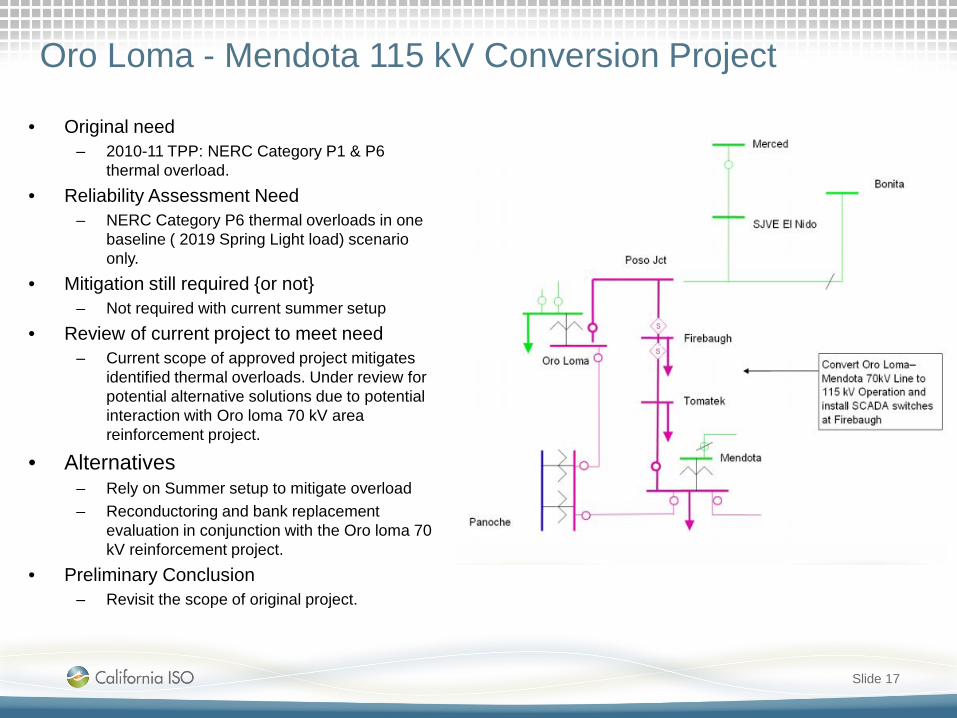
Oro Loma - Mendota 115 kV Conversion Project
• Original need– 2010-11 TPP: NERC Category P1 & P6
thermal overload. • Reliability Assessment Need
– NERC Category P6 thermal overloads in one baseline ( 2019 Spring Light load) scenario only.
• Mitigation still required {or not}– Not required with current summer setup
• Review of current project to meet need– Current scope of approved project mitigates
identified thermal overloads. Under review for potential alternative solutions due to potential interaction with Oro loma 70 kV area reinforcement project.
• Alternatives– Rely on Summer setup to mitigate overload– Reconductoring and bank replacement
evaluation in conjunction with the Oro loma 70 kV reinforcement project.
• Preliminary Conclusion– Revisit the scope of original project.
Slide 17

Oro Loma 70 kV Area Reinforcement • Original need
– 2010-11 TPP : NERC Category P6 thermal overloads.
• Reliability Assessment Need– NERC Categories P1,P2,P3 &P6 thermal
overloads in baseline – NERC Categories P1,P2,P3,P6 & P7 thermal
overloads in multiple sensitivity scenarios.• Mitigation still required {or not}
– Mitigation required for reliability• Review of current project to meet need
– Current scope of approved project mitigates identified thermal overloads. Under review for potential alternative solutions due to potential interaction with the Oroloma-Mendota 115 kV conversion project.
• Alternatives– Remove existing summer setup and reconductor
Los Banos-Canal and Mercy springs Canal 70 kV lines.
– Remove existing summer setup and reconductor Los Banos-Canal, Mercy springs Canal and replace limiting equipment on Oroloma bank
• Preliminary Conclusion– Further analysis required
Slide 18

McCall - Reedley #2 115 kV Line
• Original need– 2013-14 TPP: NERC Category P6 & P7
thermal overload.• Reliability Assessment Need
– NERC Categories P6 thermal overloads in baseline
– NERC Category P2 (QF sensitivity only) & P6 thermal overloads in multiple sensitivity scenarios.
• Mitigation still required {or not}– Mitigation required for reliability
• Review of current project to meet need– Current scope of approved project mitigates
identified thermal overloads. Under review for potential alternative solutions.
• Alternatives– SPS– Disable automatics and reconductor limiting
sections.• Preliminary Conclusion
– Further analysis required
Slide 19

Wilson 115 kV Area Reinforcement
• Original need– 2010-11TPP: NERC P6 & P7 thermal
overloads & voltage collapse.• Reliability Assessment Need
– NERC Categories P2 and P6 thermal overloads and voltage issues in baseline and multiple sensitivity scenarios.
• Mitigation still required {or not}– Mitigation required for reliability
• Review of current project to meet need– Under review for potential alternative solutions.
• Alternatives– Sectionalize Wilson 115 kV bus (P2) & rely on
radializing the system following the first contingency.
– Sectionalize Wilson 115 kV bus (P2) & install a third 230/115 kV transformer along with reconductor to mitigate P6 concerns.
• Preliminary Conclusion– Further analysis required
Slide 20

Areas of additional mitigation requirement
Slide 21

Additional Mitigation RequirementsHERNDON-BULLARD #2 115 kV – (From 7/38 To Bullard Sub)
Slide 22
• Reliability Assessment Need– NERC Categories P2-1 thermal overload
in baseline and sensitivity scenarios.– Overloads worsen in 2027 peak-shift and
high CEC forecast sensitivities.• Potential Alternatives
– SPS to drop load (~24 MW load drop in 2027 Peak shift scenario)
– Use Preferred Resources to mitigate thermal overloads
– Reconductoring the limiting sections.• First Year of Need identified in Current
Assessment– 2019
• Interim Mitigation– Action plan
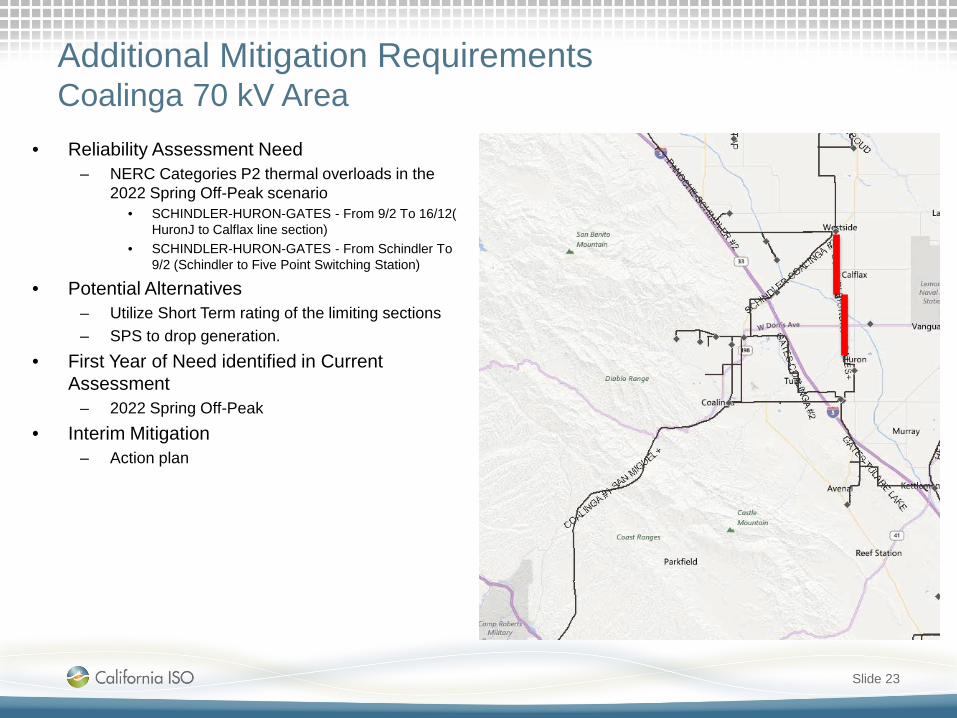
Additional Mitigation RequirementsCoalinga 70 kV Area
Slide 23
• Reliability Assessment Need– NERC Categories P2 thermal overloads in the
2022 Spring Off-Peak scenario• SCHINDLER-HURON-GATES - From 9/2 To 16/12(
HuronJ to Calflax line section)• SCHINDLER-HURON-GATES - From Schindler To
9/2 (Schindler to Five Point Switching Station)
• Potential Alternatives– Utilize Short Term rating of the limiting sections– SPS to drop generation.
• First Year of Need identified in Current Assessment
– 2022 Spring Off-Peak• Interim Mitigation
– Action plan

Sensitivity Study Assessment
Slide 24
• Below is the list of facility overloads identified in sensitivity scenario(s) only.
Overloaded Facility Category 2022 SP High CEC Forecast
2019 SP Peak-Shift
2027 SP Peak-Shift
2022 SP Heavy Renewable & Min Gas
Gen
2027 Retirement of QF Generations
34117 KETLMN T 70.0 34552 GATES 70.0 1 1 P0 √
34567 FIVEPOINTSSS 70.0 34560 CALFLAX 70.0 1 1 P2 √
30875 MC CALL 230 30878 MCCALL3M 115 3 1 P6 √
34105 CERTANJ1 115 34100 CHWCHLLA 115 1 1 P6
34107 CERTANJ2 115 34101 CERTAN T 115 1 1 P6 √
34107 CERTANJ2 115 34103 CHWCGNJT 115 1 1 P6 √
34155 PANOCHE1 115 34350 KAMM 115 1 1 P6 √
34240 GLASS 70.0 34256 BORDEN 70.0 1 1 P6 √ √
34252 MADERA 70.0 34256 BORDEN 70.0 2 1 P6 √ √
34256 BORDEN 70.0 34252 MADERA 70.0 1 1 P6 √ √
34350 KAMM 115 34352 CANTUA 115 1 1 P6 √ √
34352 CANTUA 115 34432 WESTLNDS 115 1 1 P6 √
34561 Q526TP 70.0 34566 PLSNTVLY 70.0 1 1 P6 √
34562 SCHLNDLR 70.0 34561 Q526TP 70.0 1 1 P6 √ √
34562 SCHLNDLR 70.0 34567 FIVEPOINTSSS 70.0 1 1 P6 √
36354 SAN MIGL 70.0 34574 COLNGA 1 70.0 1 1 P6 √ √ √
Kern AreaPreliminary Reliability Assessment Results
Abhishek SinghRegional Transmission Engineer Lead
2017-2018 Transmission Planning Process Stakeholder MeetingSeptember 21-22, 2017

Kern Area
Located south of the Yosemite-Fresno area and includes southern portion of the PG&E San Joaquin Division
Major stations include Midway and Kern Power Plant
Transmission system includes 60, 115 and 230 kV facilities.
Slide 2

Load and Load Modifier Assumptions- Kern
Slide 3
Base Case Scenario Type Description
Gross Load (MW)
AAEE (MW)
BTM-PV Net Load (MW)
Demand Response
Installed (MW)
Output (MW)
Total (MW) D2 (MW)
Kern-2019-SP Baseline 2019 summer peak load conditions. Peak load time - hours between 16:00 and 18:00. 1,948 30 255 85 1,833 76 56
Kern-2022-SP Baseline 2022 summer peak load conditions. Peak load time - hours between 16:00 and 18:00. 2,065 50 273 98 1,917 77 58
Kern-2027-SP Baseline 2027 summer peak load conditions. Peak load time - hours between 16:00 and 18:00. 2,190 85 401 137 1,967 77 58
Kern-2019-SPR-LL Baseline 2019 spring light load conditions. Light load time - hours between 02:00 and 04:00. 726 21 255 0 705 76 56
Kern-2022-SPR-OPK Baseline 2022 spring off-peak load conditions. Off-peak load time – weekend morning. 1,214 40 273 273 901 77 58
Kern-2019-SP-PS Sensitivity 2019 summer peak load conditions with peak-shift and AAEE sensitivity 1,939 30 255 52 1,857 76 58
Kern-2027-SP-PS Sensitivity 2022 summer peak load conditions with peak-shift and AAEE sensitivity 2,290 85 401 37 2,168 77 58
Kern-2022-SP-HIGH CEC Sensitivity 2022 summer peak load conditions with peak-
shift and AAEE sensitivity 2,095 0 273 38 2,058 77 58
Kern-2022-SP-HIGH RENEW-MINGAS Sensitivity 2022 summer peak load conditions with hi
renewable dispatch sensitivity 1,858 43 273 273 1,525 77 58
Kern-2027-SP-QFRETIRE Sensitivity 2027 summer peak load conditions with QF
retirement sensitivity 2,189 85 401 137 1,966 77 58

Generation Assumptions- Kern
Slide 4
Base Case Scenario Type Description
Battery Storage (MW)
Solar Wind Hydro Thermal
Installed (MW)
Dispatch (MW)
Installed (MW)
Dispatch (MW)
Installed (MW)
Dispatch (MW)
Installed (MW)
Dispatch (MW)
Kern-2019-SP Baseline2019 summer peak load conditions. Peak load time - hours between 16:00 and 18:00.
2 726 181 0 0 22 13 3,247 2,812
Kern-2022-SP Baseline2022 summer peak load conditions. Peak load time - hours between 16:00 and 18:00.
2 726 181 0 0 22 13 3,247 2,880
Kern-2027-SP Baseline2027 summer peak load conditions. Peak load time - hours between 16:00 and 18:00.
2 726 181 0 0 22 13 3,247 2,683
Kern-2019-SPR-LL Baseline2019 spring light load conditions. Light load time - hours between 02:00 and 04:00.
2 726 0 0 0 22 13 3,247 316
Kern-2022-SPR-OPK Baseline
2022 spring off-peak load conditions. Off-peak load time –weekend morning.
2 726 665 0 0 22 13 3,247 2,641
Kern-2019-SP-PS Sensitivity 2019 summer peak load conditions with peak-shift and AAEE sensitivity 2 726 181 0 0 22 13 3,247 2,715
Kern-2027-SP-PS Sensitivity 2027 summer peak load conditions with peak-shift and AAEE sensitivity 2 726 181 0 0 22 13 3,247 2,887
Kern-2022-SP-HIGH CEC Sensitivity 2022 summer peak load conditions
with peak-shift and AAEE sensitivity 2 726 181 0 0 22 13 3,247 2,888
Kern-2022-SP-HIGH RENEW-
MINGASSensitivity
2022 summer peak load conditions with hi renewable dispatch sensitivity
2 726 726 0 0 22 13 3,247 551
Kern-2027-SP-QFRETIRE Sensitivity 2027 summer peak load conditions
with QF retirement sensitivity 2 726 181 0 0 22 13 3,247 2,565
Previously Approved Transmission Projects Modelled in base cases
Slide 5
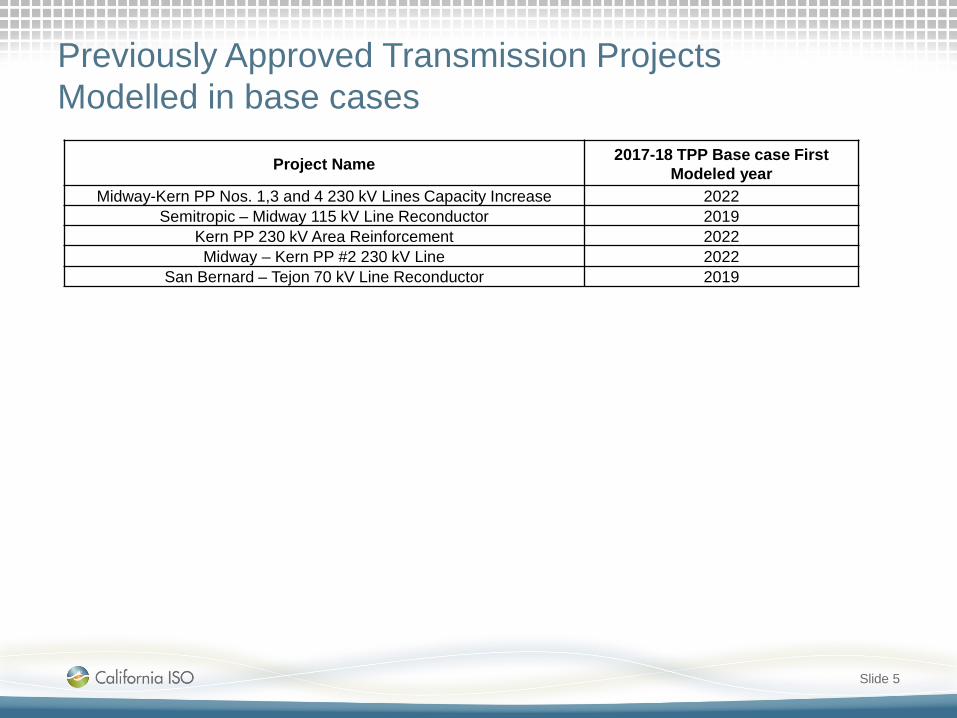
Project Name 2017-18 TPP Base case FirstModeled year
Midway-Kern PP Nos. 1,3 and 4 230 kV Lines Capacity Increase 2022Semitropic – Midway 115 kV Line Reconductor 2019
Kern PP 230 kV Area Reinforcement 2022Midway – Kern PP #2 230 kV Line 2022
San Bernard – Tejon 70 kV Line Reconductor 2019

Previously Approved Transmission Projects Not modelled in base cases
Slide 6
Project Name Current In-service dateWheeler Ridge-Weedpatch 70 kV Line Reconductor April-2019Kern PP 115 kV Area Reinforcement June-2020Wheeler Ridge Junction Substation May-2020North East Kern Voltage Conversion Project May-2025Midway-Temblor 115 kV Line Reconductor and Voltage Support April-2019
Wheeler Ridge Voltage Support December-2020

Summary of reliability needs identified
Slide 7
Facility identified with reliability issue mitigated by previously approved project.
Facility identified with reliability issue not mitigated by previously approved project.
Localized voltage issues observed around Wheeler ridge ( Multiple Baseline), Temblor (Light load baseline) and multiple 70 kV subs in 2019 case. Multiple 70 kV voltage issues go away in 2022 with the PF correction applied at the subs.
TAFT 70 kV Overloads

Assessment of previously approved projects not modeled in base cases
Slide 8

Wheeler Ridge-Weedpatch 70 kV Line Reconductor
• Original need – 2013-14 TPP: NERC Category P3
overloads• Current Reliability Assessment Need
– NERC Categories P3 overloads in baseline (2027 Peak) and several sensitivity scenarios.
• Mitigation still required – Mitigation required for reliability
• Review of current project to meet need– Current scope of approved project
mitigates identified thermal overloads.• Alternatives
– Not required.• Preliminary Conclusion
– Original scope of the project meets the reliability requirement. Monitor the overload as the need is seen in 2027
Slide 9
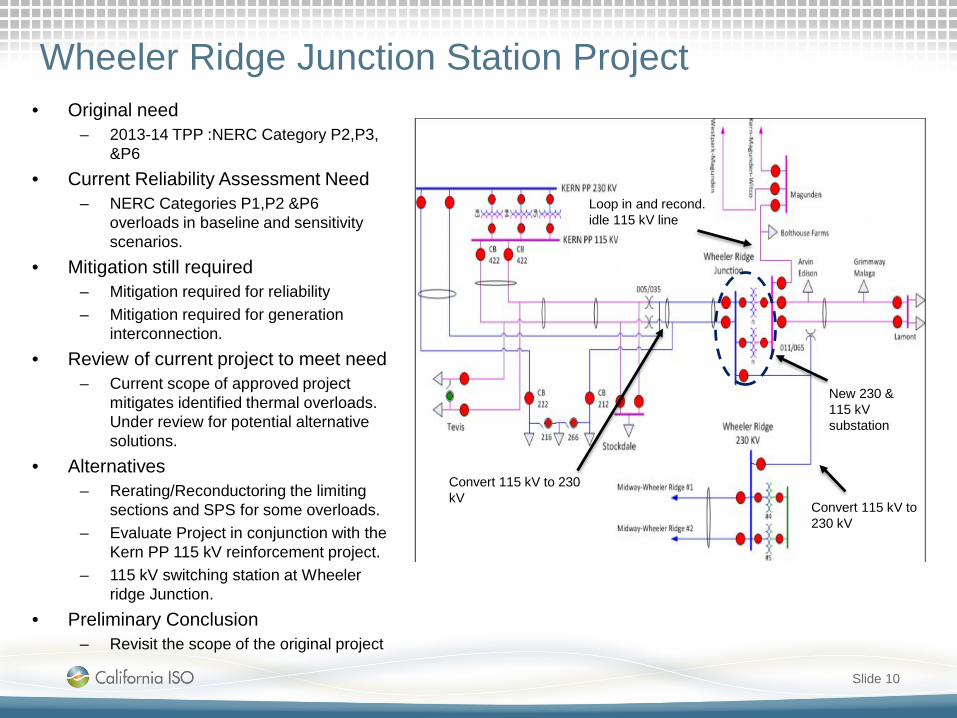
Wheeler Ridge Junction Station Project• Original need
– 2013-14 TPP :NERC Category P2,P3, &P6
• Current Reliability Assessment Need– NERC Categories P1,P2 &P6
overloads in baseline and sensitivity scenarios.
• Mitigation still required – Mitigation required for reliability– Mitigation required for generation
interconnection.• Review of current project to meet need
– Current scope of approved project mitigates identified thermal overloads. Under review for potential alternative solutions.
• Alternatives– Rerating/Reconductoring the limiting
sections and SPS for some overloads.– Evaluate Project in conjunction with the
Kern PP 115 kV reinforcement project.– 115 kV switching station at Wheeler
ridge Junction.• Preliminary Conclusion
– Revisit the scope of the original project
Slide 10
Convert 115 kV to 230 kV
New 230 & 115 kV substation
Convert 115 kV to 230 kV
Loop in and recond. idle 115 kV line
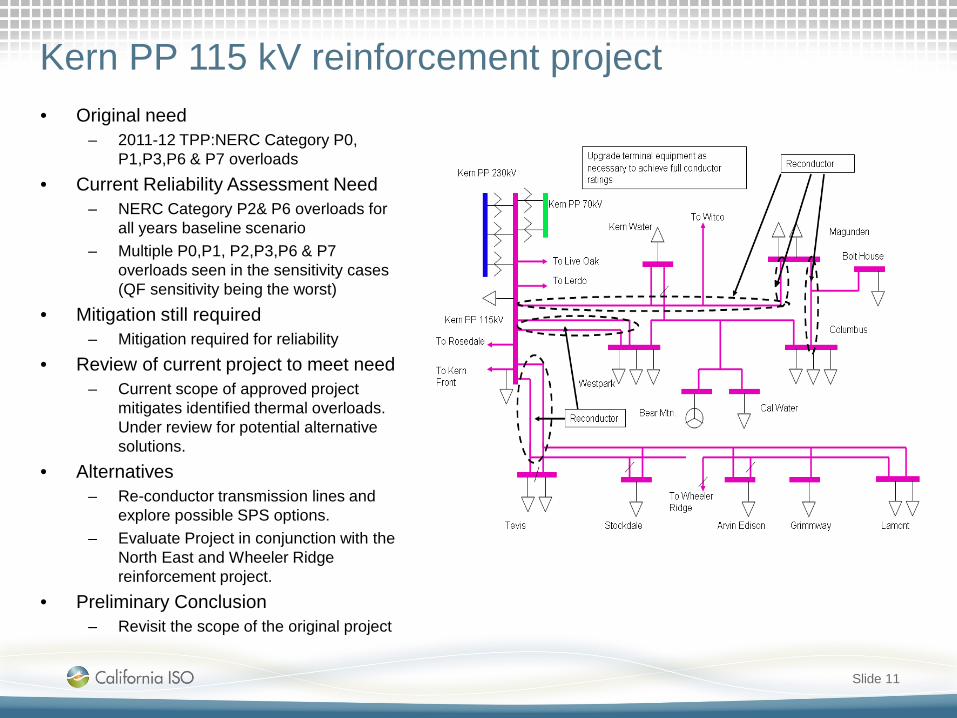
Kern PP 115 kV reinforcement project• Original need
– 2011-12 TPP:NERC Category P0, P1,P3,P6 & P7 overloads
• Current Reliability Assessment Need– NERC Category P2& P6 overloads for
all years baseline scenario– Multiple P0,P1, P2,P3,P6 & P7
overloads seen in the sensitivity cases (QF sensitivity being the worst)
• Mitigation still required – Mitigation required for reliability
• Review of current project to meet need– Current scope of approved project
mitigates identified thermal overloads. Under review for potential alternative solutions.
• Alternatives– Re-conductor transmission lines and
explore possible SPS options.– Evaluate Project in conjunction with the
North East and Wheeler Ridge reinforcement project.
• Preliminary Conclusion– Revisit the scope of the original project
Slide 11
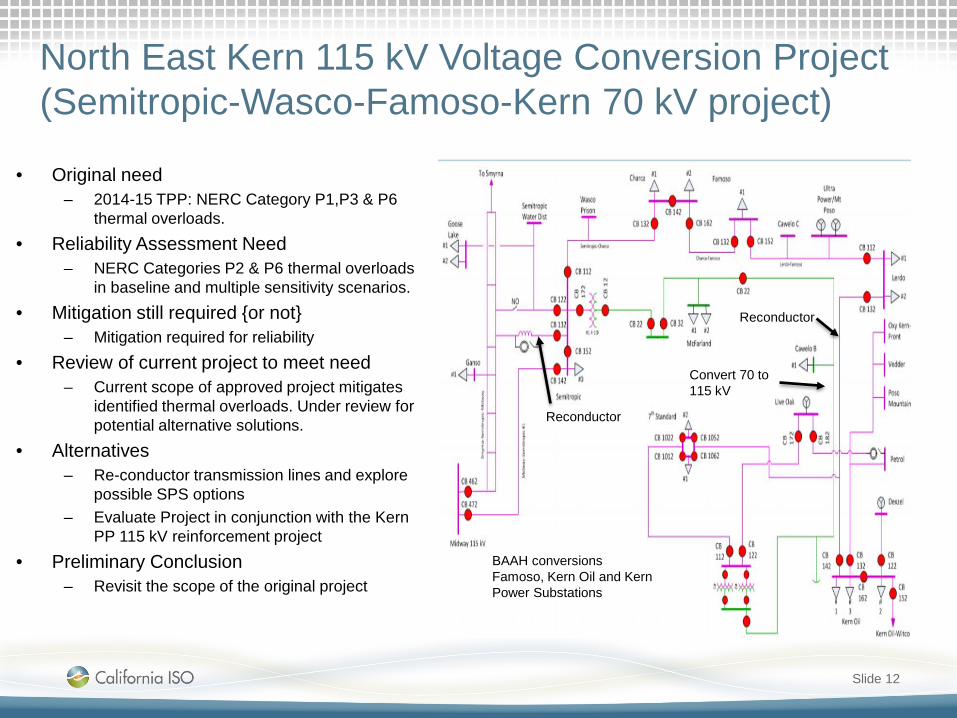
North East Kern 115 kV Voltage Conversion Project (Semitropic-Wasco-Famoso-Kern 70 kV project)
• Original need – 2014-15 TPP: NERC Category P1,P3 & P6
thermal overloads.• Reliability Assessment Need
– NERC Categories P2 & P6 thermal overloads in baseline and multiple sensitivity scenarios.
• Mitigation still required {or not}– Mitigation required for reliability
• Review of current project to meet need– Current scope of approved project mitigates
identified thermal overloads. Under review for potential alternative solutions.
• Alternatives– Re-conductor transmission lines and explore
possible SPS options – Evaluate Project in conjunction with the Kern
PP 115 kV reinforcement project• Preliminary Conclusion
– Revisit the scope of the original project
Slide 12
Convert 70 to 115 kV
Reconductor
Reconductor
BAAH conversionsFamoso, Kern Oil and Kern Power Substations

Midway-Temblor 115 kV line reconductor and voltage support
• Original need (2012-13 TPP)– NERC Category P1(Loss of generation)
thermal overload on Midway-Temblor Line.– Low Voltage issues for P3 contingency in the
area.• Reliability Assessment Need
– Original Overloads not seen in local studies.– Overloads seen in bulk Partial Peak 2027
analysis for P0, P1 & P6 500 kV contingencies.– Low Voltage observed in the 2019 Light load
baseline study only.• Mitigation still required {or not}
– Mitigation required for reliability• Review of current project to meet need
– Phase 1 completed. (Temblor-Mckittrick Jn)– Phase 2 reconductor scope & voltage support
under review for potential alternative solutions..• Alternatives
– Under Review• Preliminary Conclusion
– Revisit the scope of the original project
Slide 13
.
Completed

Areas of additional mitigation requirement
Slide 14

TAFT 70 kV Area Overloads
Slide 15
• Reliability Assessment Need– NERC Categories P6 thermal overloads – in one baseline scenario (2019 Spring Light
Load).• Potential Alternatives
– Extend the summer setup to all the seasons– SPS
• First Year of Need identified in Current Assessment
– 2019 Minimum Load Case• Interim Mitigation
– Extend the summer setup
X XSummer Setup Issue

Midway 115 kV Area Overloads
Slide 16
• Reliability Assessment Need– NERC Categories P2 thermal overloads on the
Tupman taps in the baseline and multiple sensitivity scenarios.
– NERC Categories P2 thermal overloads on multiple line sections between Taft and Fellows sub seen in the sensitivity scenarios only.
• Potential Alternatives– Sectionalizing Midway 115 kV bus section– Rerate/Reconductor the limiting sections.– SPS
• First Year of Need identified in Current Assessment
– 2019 • Interim Mitigation
– Action plan
Overloads seen on Tupman # 1 & # 2 taps For Midway 115 kV bus section and bus tie breaker faults.
Sensitivity study overloads for Midway115 kV bus section and bus tie breaker faults
Sensitivity Study Assessment
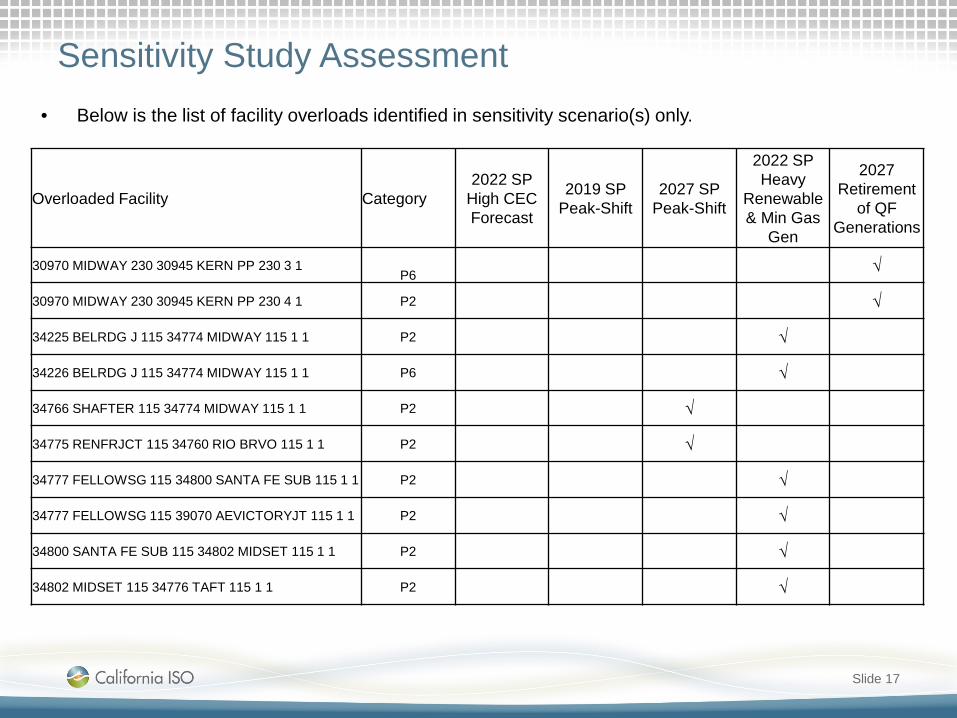
Slide 17
• Below is the list of facility overloads identified in sensitivity scenario(s) only.
Overloaded Facility Category2022 SP
High CEC Forecast
2019 SP Peak-Shift
2027 SP Peak-Shift
2022 SP Heavy
Renewable & Min Gas
Gen
2027 Retirement
of QF Generations
30970 MIDWAY 230 30945 KERN PP 230 3 1P6 √
30970 MIDWAY 230 30945 KERN PP 230 4 1 P2 √
34225 BELRDG J 115 34774 MIDWAY 115 1 1 P2 √
34226 BELRDG J 115 34774 MIDWAY 115 1 1 P6 √
34766 SHAFTER 115 34774 MIDWAY 115 1 1 P2 √
34775 RENFRJCT 115 34760 RIO BRVO 115 1 1 P2 √
34777 FELLOWSG 115 34800 SANTA FE SUB 115 1 1 P2 √
34777 FELLOWSG 115 39070 AEVICTORYJT 115 1 1 P2 √
34800 SANTA FE SUB 115 34802 MIDSET 115 1 1 P2 √
34802 MIDSET 115 34776 TAFT 115 1 1 P2 √

Central Coast and Los Padres AreasPreliminary Reliability Assessment Results
Ramesh Chakkapalli
2017-2018 Transmission Planning Process Stakeholder MeetingSeptember 21-22, 2017

Central Coast / Los Padres Area
Slide 2
Central Coast is located south of the Greater Bay Area, it extends along the central coast from Santa Cruz to King City
Major substations in Central Coast: Moss Landing, Green Valley, Paul Sweet, Salinas, Watsonville, Monterey, Soledad and Hollister
Central Coast supply sources: Moss Landing, Panoche, King City and Monta Vista
Central Coast transmission system includes 60, 115, 230 and 500 kV facilities
Los Padres is located south of the Central Coast Division
Major substations in Los Padres : Paso Robles, Atascadero, Morro Bay, San Luis Obispo, Mesa, Divide, Santa Maria and Sisquoc
Key supply sources in Los Padres include Gates, Midway and Morro Bay
Diablo Canyon nuclear power plant (2400 MW) is located in Los Padres but does not serve the area
Los Padres transmission system includes 70, 115, 230 and 500 kV facilities

Load and Load Modifier Assumptions – CCLP Areas
Slide 3

Slide 4
Generation Assumptions – CCLP Areas
Previously Approved Transmission Projects Modelled in base cases
Slide 5

Previously Approved Transmission Projects Not modelled in base cases
Slide 6

Summary of Reliability Needs Identified
Slide 7
Facility identified with reliability issue mitigated by previously approved project.
Facility identified with reliability issue not mitigated by previously approved project.
Assessment of previously approved projects not modeled in base cases
Slide 8
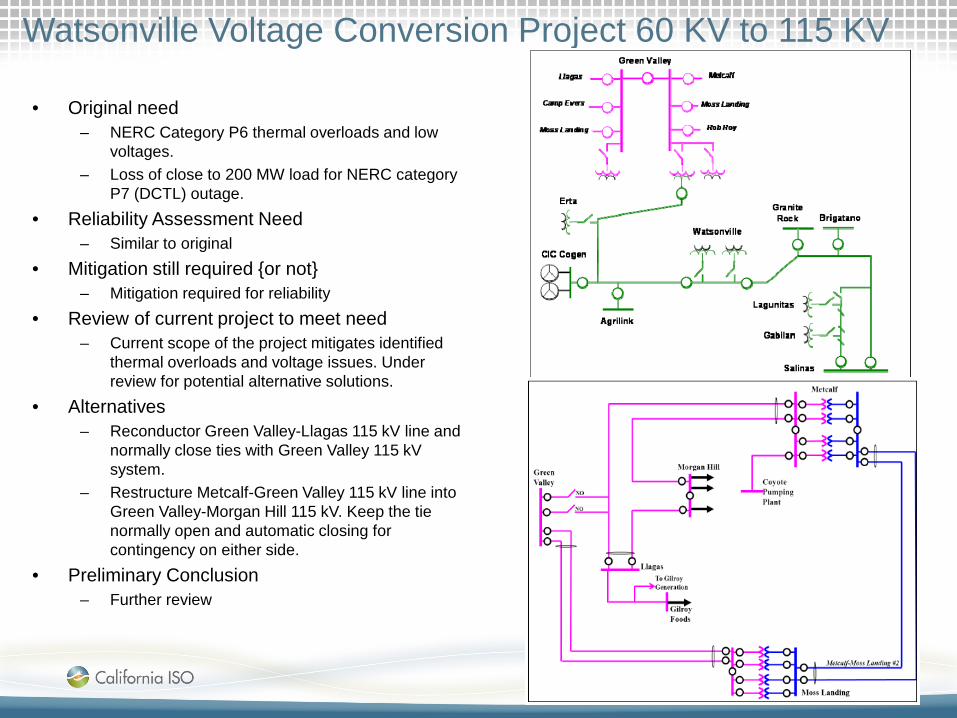
Watsonville Voltage Conversion Project 60 KV to 115 KV
• Original need– NERC Category P6 thermal overloads and low
voltages.– Loss of close to 200 MW load for NERC category
P7 (DCTL) outage. • Reliability Assessment Need
– Similar to original• Mitigation still required {or not}
– Mitigation required for reliability• Review of current project to meet need
– Current scope of the project mitigates identified thermal overloads and voltage issues. Under review for potential alternative solutions.
• Alternatives– Reconductor Green Valley-Llagas 115 kV line and
normally close ties with Green Valley 115 kV system.
– Restructure Metcalf-Green Valley 115 kV line into Green Valley-Morgan Hill 115 kV. Keep the tie normally open and automatic closing for contingency on either side.
• Preliminary Conclusion– Further review
Slide 9
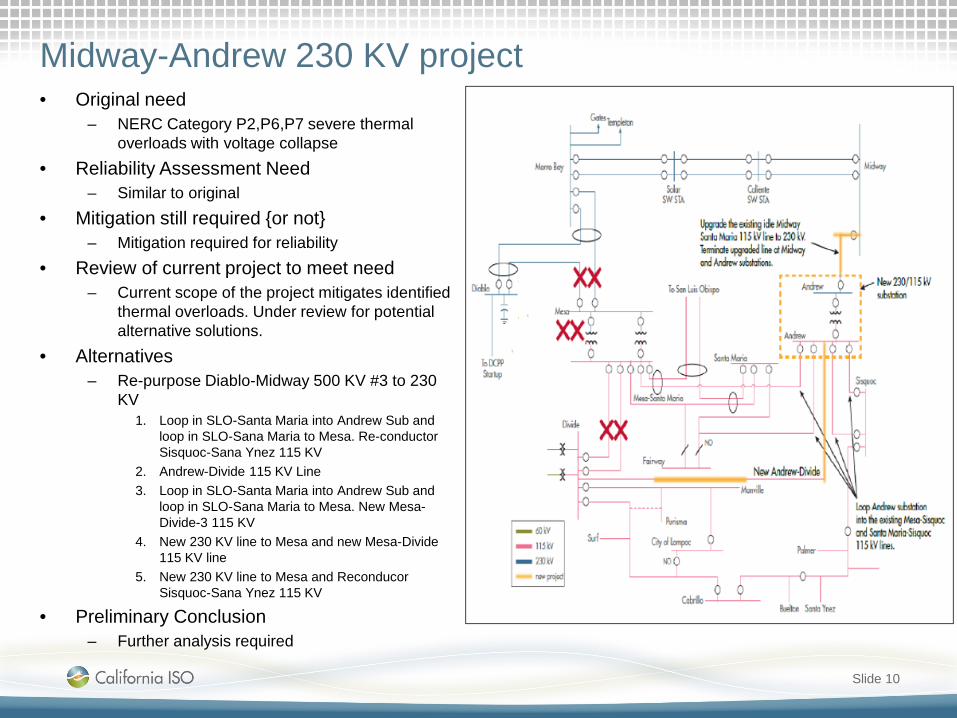
Midway-Andrew 230 KV project• Original need
– NERC Category P2,P6,P7 severe thermal overloads with voltage collapse
• Reliability Assessment Need– Similar to original
• Mitigation still required {or not}– Mitigation required for reliability
• Review of current project to meet need– Current scope of the project mitigates identified
thermal overloads. Under review for potential alternative solutions.
• Alternatives– Re-purpose Diablo-Midway 500 KV #3 to 230
KV1. Loop in SLO-Santa Maria into Andrew Sub and
loop in SLO-Sana Maria to Mesa. Re-conductor Sisquoc-Sana Ynez 115 KV
2. Andrew-Divide 115 KV Line3. Loop in SLO-Santa Maria into Andrew Sub and
loop in SLO-Sana Maria to Mesa. New Mesa-Divide-3 115 KV
4. New 230 KV line to Mesa and new Mesa-Divide 115 KV line
5. New 230 KV line to Mesa and ReconducorSisquoc-Sana Ynez 115 KV
• Preliminary Conclusion– Further analysis required
Slide 10
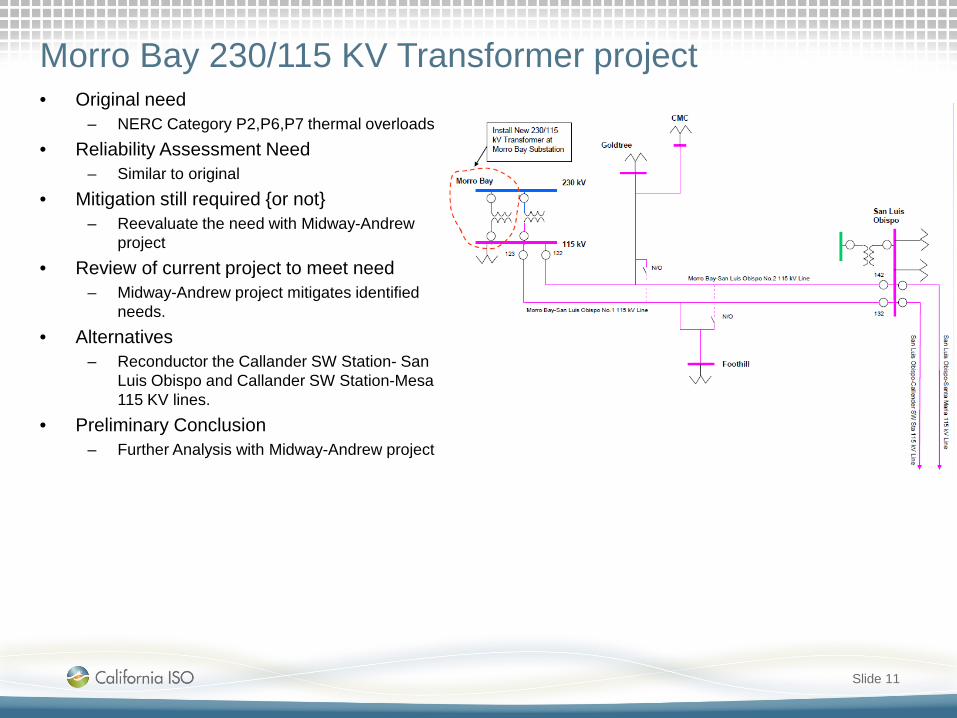
Morro Bay 230/115 KV Transformer project• Original need
– NERC Category P2,P6,P7 thermal overloads • Reliability Assessment Need
– Similar to original• Mitigation still required {or not}
– Reevaluate the need with Midway-Andrew project
• Review of current project to meet need– Midway-Andrew project mitigates identified
needs.• Alternatives
– Reconductor the Callander SW Station- San Luis Obispo and Callander SW Station-Mesa 115 KV lines.
• Preliminary Conclusion– Further Analysis with Midway-Andrew project
Slide 11
Areas of additional mitigation requirement
Slide 12

Additional Mitigation RequirementsCrazy Horse-Salinas 115 kV lines
Slide 13
• Reliability Assessment Need– NERC Category P5, P6, P7 thermal overloads.
• Potential Alternatives– Rerate– Reconductor– SPS
• First Year of Need identified in Current Assessment
– 2019• Interim Mitigation
– Action plan
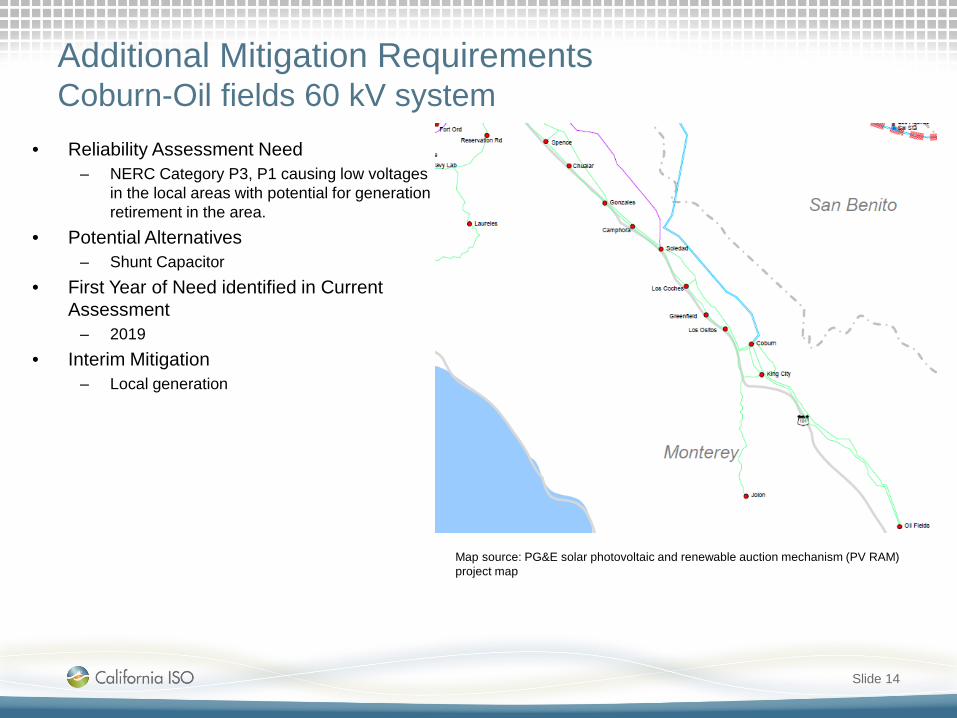
Additional Mitigation RequirementsCoburn-Oil fields 60 kV system
Slide 14
• Reliability Assessment Need– NERC Category P3, P1 causing low voltages
in the local areas with potential for generation retirement in the area.
• Potential Alternatives– Shunt Capacitor
• First Year of Need identified in Current Assessment
– 2019• Interim Mitigation
– Local generation
Map source: PG&E solar photovoltaic and renewable auction mechanism (PV RAM) project map

Sensitivity Study Assessment
Slide 15
• No additional facility overloads identified in sensitivity scenario(s) only that were not in Base case scenarios.

North Valley AreaPreliminary Reliability Assessment Results
Ebrahim RahimiLead Regional Transmission Engineer
2017-2018 Transmission Planning Process Stakeholder MeetingSeptember 21-22, 2017

North Valley Area
Slide 2
15,000 sq. miles NE corner of PG&E
Cities: Chico, Redding, Red Bluff, Paradise
Generation: Colusa is the largest generation facility (717 MW).
Comprised of 60, 115, 230 & 500 kV transmission facilities.

Load and Load Modifier Assumptions – North Valley Area
Slide 3
Installed (MW)
Output (MW)
Total (MW)
D2 (MW)
NVLY-2019-SP Baseline2019 summer peak load conditions. Peak load time - hours between 16:00 and 18:00.
892 14 163 54 824 36 28
NVLY-2022-SP Baseline2022 summer peak load conditions. Peak load time - hours between 16:00 and 18:00.
924 23 188 63 838 36 28
NVLY-2027-SP Baseline2027 summer peak load conditions. Peak load time - hours between 16:00 and 18:00.
991 39 272 93 859 36 28
NVLY-2019-ML Baseline2019 spring light load conditions. Light load time - hours between 02:00 and 04:00.
271 10 163 0 261 36 28
NVLY-2022-SOP Baseline2022 spring off-peak load conditions. Off-peak load time – weekend morning.
419 19 188 177 223 36 28
NVLY-2019-SP-PS Sensitivity2019 summer peak load conditions with peak-shift sensitivity
883 14 163 33 835 36 28
NVLY-2027-SP-PS Sensitivity2027 summer peak load conditions with peak-shift sensitivity
998 39 272 25 934 36 28
NVLY-2022-SP-PS-AAEE Sensitivity2022 summer peak load conditions with peak-shift and AAEE sensitivity
915 0 188 24 891 36 28
NVLY-2022-SP-HiRenew Sensitivity2022 summer peak load conditions with hi renewable dispatch sensitivity
796 20 188 188 588 36 28
NVLY-2027-SP-QF Sensitivity2027 summer peak load conditions with QF retirement sensitivity
991 39 272 93 859 36 28
Note: DR and storage are modeled offline in starting base cases.
BTM-PVNet Load
(MW)
Demand ResponseBase Case
Scenario Type Description
Gross Load (MW)
AAEE (MW)

Slide 4
Generation Assumptions – North Valley Area
Installed (MW)
Dispatch (MW)
Installed (MW)
Dispatch (MW)
Installed (MW)
Dispatch (MW)
Installed (MW)
Dispatch (MW)
NVLY-2019-SP Baseline2019 summer peak load conditions. Peak load time - hours between 16:00 and 18:00. 0 0 0 103 34 1,774 1,662 1,065 511
NVLY-2022-SP Baseline2022 summer peak load conditions. Peak load time - hours between 16:00 and 18:00. 0 0 0 103 34 1,774 1,662 1,065 482
NVLY-2027-SP Baseline2027 summer peak load conditions. Peak load time - hours between 16:00 and 18:00. 0 0 0 103 34 1,774 1,662 1,065 384
NVLY-2019-ML Baseline2019 spring light load conditions. Light load time - hours between 02:00 and 04:00. 0 0 0 103 10 1,774 203 1,065 311
NVLY-2022-SOP Baseline2022 spring off-peak load conditions. Off-peak load time – weekend morning. 0 0 0 103 103 1,774 896 1,065 210
NVLY-2019-SP-PS Sensitivity2019 summer peak load conditions with peak-shift sensitivity 0 0 0 103 34 1,774 1,662 1,065 437
NVLY-2027-SP-PS Sensitivity2027 summer peak load conditions with peak-shift sensitivity 0 0 0 103 34 1,774 1,662 1,065 413
NVLY-2022-SP-PS-AAEE Sensitivity2022 summer peak load conditions with peak-shift and AAEE sensitivity 0 0 0 103 34 1,774 1,662 1,065 479
NVLY-2022-SP-HiRenew Sensitivity2022 summer peak load conditions with hi renewable dispatch sensitivity 0 0 0 103 103 1,774 1,618 1,065 285
NVLY-2027-SP-QF Sensitivity2027 summer peak load conditions with QF retirement sensitivity 0 0 0 103 34 1,774 1,647 1,065 399
Note: DR and storage are modeled offline in starting base cases.
Hydro ThermalBattery Storage (MW)
Solar Wind
Study Case Scenario Type
Description
Previously Approved Transmission Projects Modelled in base cases
Slide 5
• None of the active projects were modelled in the base cases.– Delevan 230 kV and Cottonwood 115 kV shunt reactor projects were modelled in the case but were switched off.
These projects are discussed in the Voltage Assessment presentation.

Previously Approved Transmission Projects Not modelled in the base cases
Slide 6
Project Name Current ISD
Cascade 115/60 kV No2 Transformer Project and Cascade – Benton 60 kV Line Project Jul-2019
Glenn #1 60 kV Reconductoring Apr-2021
Glenn 230/60 kV Transformer No 1 Replacement Jun-2019
Table Mountain – Sycamore 115 kV Line Dec-2025
Cottonwood-Red Bluff No2 60 kV Line Project and Red Bluff Area 230/60 kV Substation Project Apr-2024
Cottonwood 115 kV Substation Shunt Reactor Nov-2019
Delevan 230 kV Substation Shunt Reactor Nov-2019
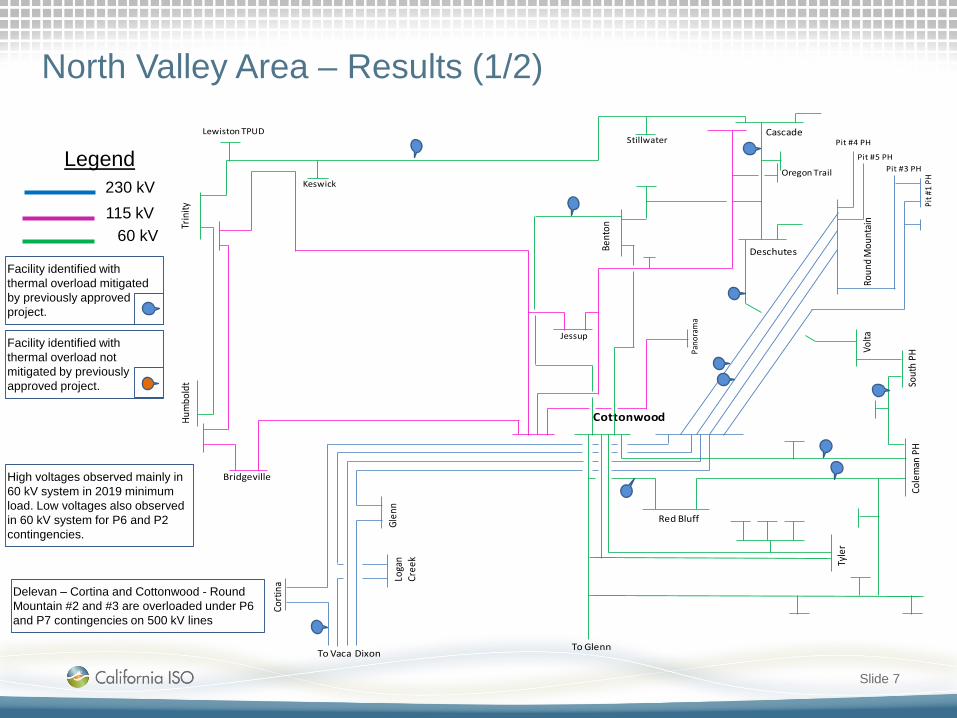
North Valley Area – Results (1/2)
Slide 7
Legend230 kV115 kV
60 kV
Roun
d M
ount
ain
Cottonwood
Pit #
1 PH
Red Bluff
Cole
man
PH
To Glenn
Tyle
r
Volta
Deschutes
Cascade
Trin
ity
Stillwater
Keswick
Lewiston TPUD
Bridgeville
Hum
bold
t
Jessup
To Vaca Dixon
Glen
nLo
gan
Cree
k
Cort
ina
Sout
h PH
Bent
on
Oregon Trail
Pano
ram
a
Pit #4 PH
Pit #5 PHPit #3 PH
Facility identified with thermal overload mitigated by previously approved project.
Facility identified with thermal overload not mitigated by previously approved project.
High voltages observed mainly in 60 kV system in 2019 minimum load. Low voltages also observed in 60 kV system for P6 and P2 contingencies.
Delevan – Cortina and Cottonwood - Round Mountain #2 and #3 are overloaded under P6 and P7 contingencies on 500 kV lines
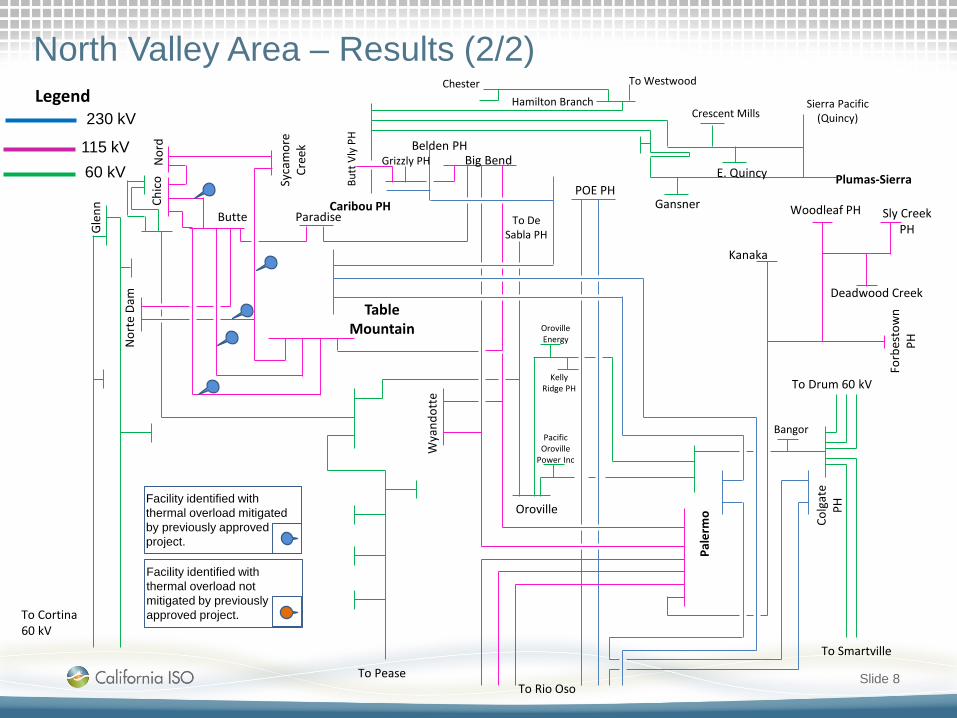
230 kV
115 kV60 kV
North Valley Area – Results (2/2)
Slide 8
Nor
te D
am
Butte
Syca
mor
e Cr
eek Belden PH
Caribou PH
Table Mountain
Pale
rmo
Big Bend
Wya
ndot
te
Paradise
POE PHWoodleaf PH
Kanaka
Sly Creek PH
Deadwood Creek
Forb
esto
wn
PH
Colg
ate
PH
To Rio OsoTo Pease
Oroville
Kelly Ridge PH
Oroville Energy
Pacific Oroville
Power Inc
Bangor
To Smartville
To Drum 60 kV
Glen
n
To Cortina 60 kV
Nor
dCh
ico
Grizzly PH
Butt
Vly
PH
To De Sabla PH
Plumas-Sierra
Sierra Pacific (Quincy)
E. Quincy
Crescent Mills
Gansner
Hamilton Branch
To WestwoodChesterLegend
Facility identified with thermal overload mitigated by previously approved project.
Facility identified with thermal overload not mitigated by previously approved project.

Review of Previously Approved Transmission Projects Not Modelled in the Base Cases
Slide 9

Glen 230/60 kV Transformer No. 1 Replacement
• Original need– 2013-2014 TPP: Planning for New
Transmission vs. Involuntary Load Interruption Standard (BCR Project)
• Reliability Assessment Need– BCR Project
• Mitigation still required– BCR is greater than 1 (2.21)
• Review of current project to meet need– BCR Project
• Alternatives– Status quo
• Preliminary conclusion– Proceed with original scope
Slide 10

Glen #1 60 kV Reconductoring
• Original need– 2009 TPP: NERC Category P1 and P7
thermal overload.• Reliability Assessment Need
– No reliability issue was identified• Mitigation is not required
– Not Needed for reliability– Not needed for LCR– Not needed for generation deliverability
• Review of current project to meet the need
– Not applicable• Alternatives
– Not applicable• Preliminary conclusion
– Cancel the project
Slide 11

Cascade 115/60 kV No. 2 Transformer Project and Cascade-Benton 60 kV Line Project
• Original need– 2010-2011 TPP: NERC P6 thermal
overload and P1, P3, and P6 voltage issues.
• Reliability Assessment Need– NERC Categories P2 and P6 thermal
overloads and voltage issues under base cases.
• Mitigation still required– Needed for reliability.
• Review of current project to meet need– Current scope of approved project
mitigates identified thermal overloads. Under review for potential alternative solutions.
• Alternatives– Install a new 115/60 kV Transformer
and high side breaker at Cascade substation.
– Install high side breaker at Cascade substation. Evaluate SPS for other contingencies.
• Preliminary Conclusion– Further analysis is required
Slide 12

Table Mountain-Sycamore 115 kV Line
• Original need– 2010-2011 TPP: NERC Category
P2, P6, P7 severe thermal overload.
• Reliability Assessment Need– NERC Categories P6 and P7
thermal overloads in the base case. P2 mostly in sensitivity.
• Mitigation still required– Needed for reliability.
• Review of current project to meet need
– Current scope of approved project mitigates identified thermal overloads but it is under review for potential alternative solutions with reduced scope.
• Alternatives– SPS
• Preliminary conclusion– Further analysis is required
Slide 13
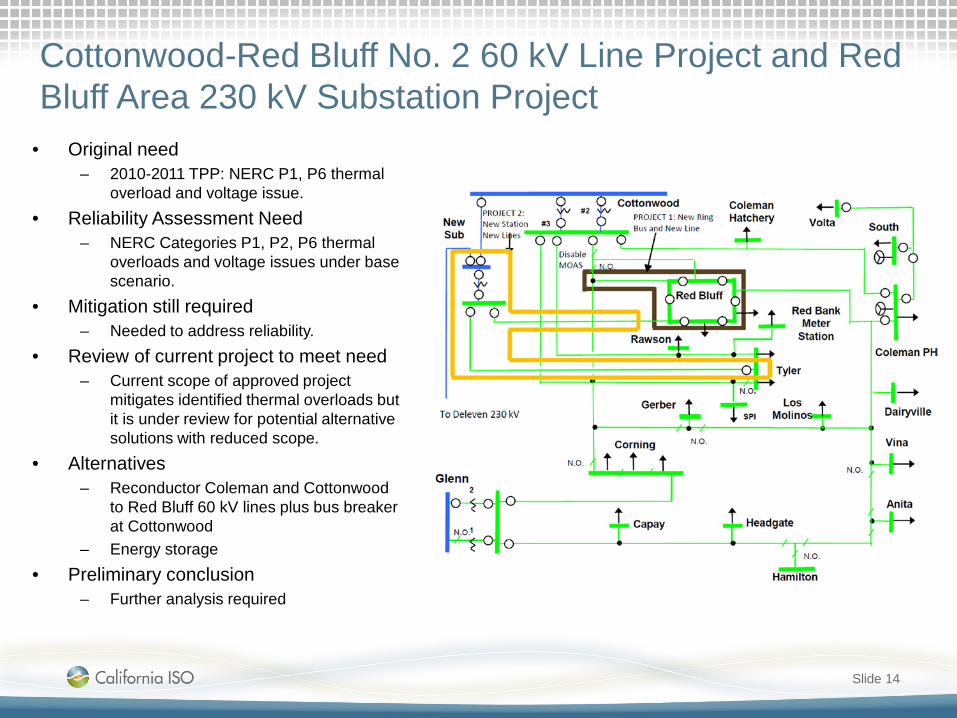
Cottonwood-Red Bluff No. 2 60 kV Line Project and Red Bluff Area 230 kV Substation Project
• Original need– 2010-2011 TPP: NERC P1, P6 thermal
overload and voltage issue.• Reliability Assessment Need
– NERC Categories P1, P2, P6 thermal overloads and voltage issues under base scenario.
• Mitigation still required– Needed to address reliability.
• Review of current project to meet need– Current scope of approved project
mitigates identified thermal overloads but it is under review for potential alternative solutions with reduced scope.
• Alternatives– Reconductor Coleman and Cottonwood
to Red Bluff 60 kV lines plus bus breaker at Cottonwood
– Energy storage• Preliminary conclusion
– Further analysis required
Slide 14
Additional Mitigation Requirements
Slide 15
• No need for new thermal mitigation measures was identified under base scenarios.
• There are high voltages at 115 kV and 60 kV system that could be addressed by load power factor correction. If power factor correction is not feasible or cost effective, voltage support at transmission level is required. This is discussed in detail in Voltage Assessment presentation.
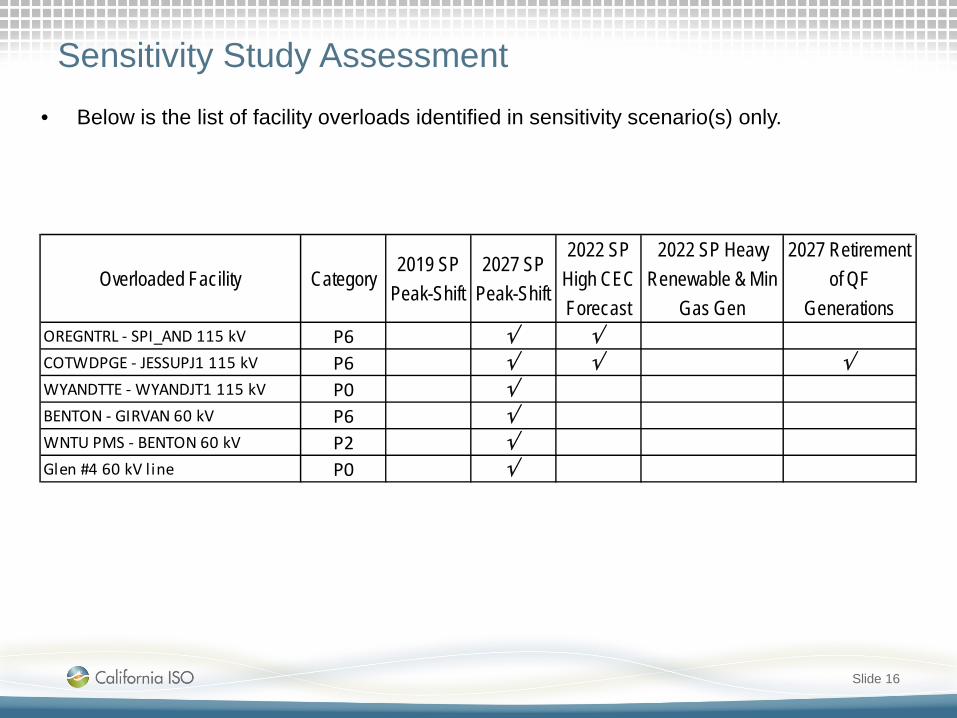
Sensitivity Study Assessment
Slide 16
• Below is the list of facility overloads identified in sensitivity scenario(s) only.
Overloaded Facility Category2019 SP
Peak-Shift2027 SP
Peak-Shift
2022 SP High CEC Forecast
2022 SP Heavy Renewable & Min
Gas Gen
2027 Retirement of QF
GenerationsOREGNTRL - SPI_AND 115 kV P6 √ √COTWDPGE - JESSUPJ1 115 kV P6 √ √ √WYANDTTE - WYANDJT1 115 kV P0 √BENTON - GIRVAN 60 kV P6 √WNTU PMS - BENTON 60 kV P2 √Glen #4 60 kV l ine P0 √

Central Valley AreaPreliminary Reliability Assessment Results
Ebrahim RahimiLead Regional Transmission Engineer
2017-2018 Transmission Planning Process Stakeholder MeetingSeptember 21-22, 2017

Central Valley Area
Includes the following divisions: Sacramento Sierra Stockton Stanislaus
Transmission facilities: 60, 115, 230 and 500 kV.
Slide 2
Sacramento Division
SierraDivision
StanislausDivision
StocktonDivision

Load and Load Modifier Assumptions – Central Valley Area
Slide 3
Installed (MW)
Output (MW)
Total (MW)
D2 (MW)
CVLY-2019-SP Baseline2019 summer peak load conditions. Peak load time - hours between 16:00 and 18:00.
3,865 96 688 229 3,540 101 59
CVLY-2022-SP Baseline2022 summer peak load conditions. Peak load time - hours between 16:00 and 18:00.
3,995 159 807 273 3,563 103 59
CVLY-2027-SP Baseline2027 summer peak load conditions. Peak load time - hours between 16:00 and 18:00.
4,246 272 1,162 398 3,577 104 59
CVLY-2019-ML Baseline2019 spring light load conditions. Light load time - hours between 02:00 and 04:00.
1,354 66 688 0 1,288 101 59
CVLY-2022-SOP Baseline2022 spring off-peak load conditions. Off-peak load time – weekend morning.
2,046 127 807 763 1,156 103 59
CVLY-2019-SP-PS Sensitivity2019 summer peak load conditions with peak-shift sensitivity
3,835 96 688 142 3,597 101 59
CVLY-2027-SP-PS Sensitivity2027 summer peak load conditions with peak-shift sensitivity
4,072 272 1,162 107 3,693 104 59
CVLY-2022-SP-PS-AAEE Sensitivity2022 summer peak load conditions with peak-shift and AAEE sensitivity
3,958 0 807 105 3,853 103 59
CVLY-2022-SP-HiRenew Sensitivity2022 summer peak load conditions with hi renewable dispatch sensitivity
3,433 138 807 807 2,488 103 59
CVLY-2027-SP-QF Sensitivity2027 summer peak load conditions with QF retirement sensitivity
4,246 272 1,162 398 3,577 104 59
DR and storage are modeled offline in starting base cases.Note:
BTM-PVNet Load
(MW)
Demand ResponseBase Case
Scenario Type Description
Gross Load (MW)
AAEE (MW)

Slide 4
Generation Assumptions – Central Valley Area
Installed (MW)
Dispatch (MW)
Installed (MW)
Dispatch (MW)
Installed (MW)
Dispatch (MW)
Installed (MW)
Dispatch (MW)
CVLY-2019-SP Baseline2019 summer peak load conditions. Peak load time - hours between 16:00 and 18:00.
34 46 12 1,376 454 1,389 1,101 1,501 1,188
CVLY-2022-SP Baseline2022 summer peak load conditions. Peak load time - hours between 16:00 and 18:00.
34 46 12 1,376 454 1,389 1,099 1,501 1,181
CVLY-2027-SP Baseline2027 summer peak load conditions. Peak load time - hours between 16:00 and 18:00.
34 46 12 1,376 454 1,389 1,095 1,501 1,171
CVLY-2019-ML Baseline2019 spring light load conditions. Light load time - hours between 02:00 and 04:00.
34 46 0 1,376 138 1,389 891 1,501 1,237
CVLY-2022-SOP Baseline2022 spring off-peak load conditions. Off-peak load time – weekend morning.
34 46 46 1,376 1,376 1,389 742 1,501 335
CVLY-2019-SP-PS Sensitivity2019 summer peak load conditions with peak-shift sensitivity
34 46 7 1,376 454 1,389 1,133 1,501 1,188
CVLY-2027-SP-PS Sensitivity2027 summer peak load conditions with peak-shift sensitivity
34 46 3 1,376 454 1,389 1,133 1,501 1,054
CVLY-2022-SP-PS-AAEE Sensitivity2022 summer peak load conditions with peak-shift and AAEE sensitivity
34 46 4 1,376 454 1,389 1,133 1,501 1,053
CVLY-2022-SP-HiRenew Sensitivity2022 summer peak load conditions with hi renewable dispatch sensitivity
34 46 46 1,376 1,376 1,389 1,091 1,501 305
CVLY-2027-SP-QF Sensitivity2027 summer peak load conditions with QF retirement sensitivity
34 46 12 1,376 454 1,389 1,085 1,501 1,181
Note: DR and storage are modeled offline in starting base cases.
Base Case Scenario Type
Description
Hydro ThermalBattery Storage (MW)
Solar Wind
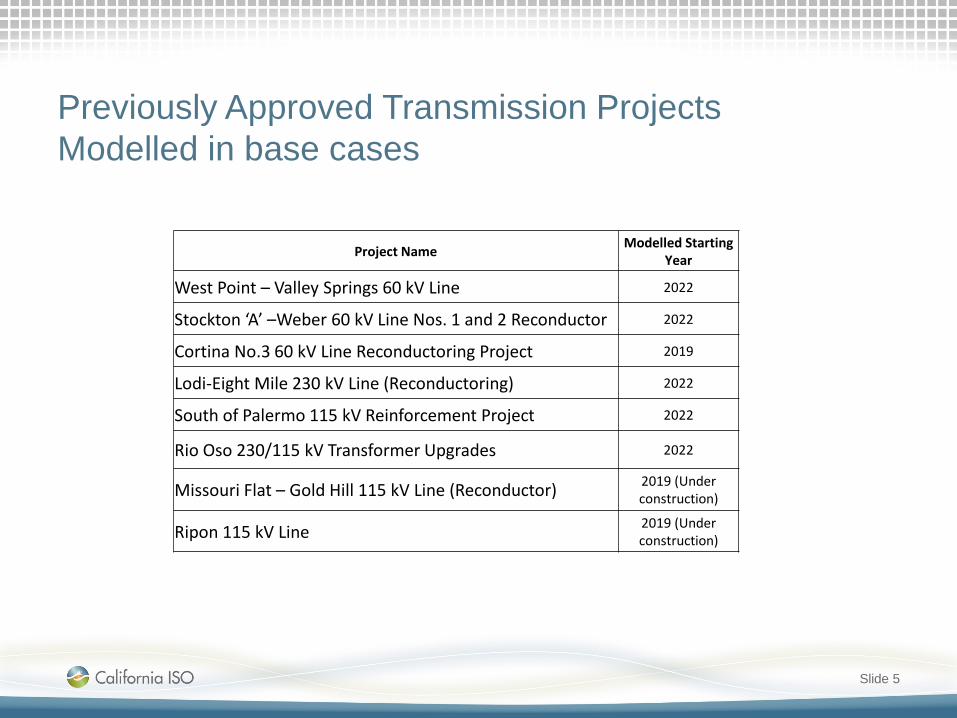
Previously Approved Transmission Projects Modelled in base cases
Slide 5
Project Name Modelled Starting Year
West Point – Valley Springs 60 kV Line 2022
Stockton ‘A’ –Weber 60 kV Line Nos. 1 and 2 Reconductor 2022
Cortina No.3 60 kV Line Reconductoring Project 2019
Lodi-Eight Mile 230 kV Line (Reconductoring) 2022
South of Palermo 115 kV Reinforcement Project 2022
Rio Oso 230/115 kV Transformer Upgrades 2022
Missouri Flat – Gold Hill 115 kV Line (Reconductor) 2019 (Underconstruction)
Ripon 115 kV Line 2019 (Underconstruction)
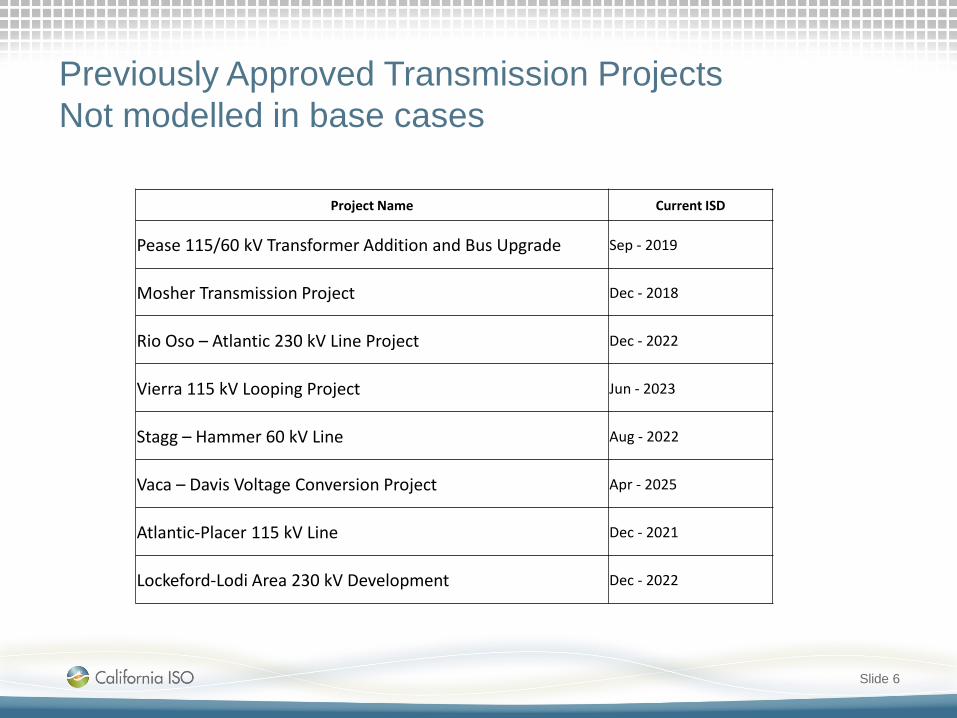
Previously Approved Transmission Projects Not modelled in base cases
Slide 6
Project Name Current ISD
Pease 115/60 kV Transformer Addition and Bus Upgrade Sep - 2019
Mosher Transmission Project Dec - 2018
Rio Oso – Atlantic 230 kV Line Project Dec - 2022
Vierra 115 kV Looping Project Jun - 2023
Stagg – Hammer 60 kV Line Aug - 2022
Vaca – Davis Voltage Conversion Project Apr - 2025
Atlantic-Placer 115 kV Line Dec - 2021
Lockeford-Lodi Area 230 kV Development Dec - 2022

Legend230 kV115 kV60 kV
Rio Oso
Brig
hton
West Sacramento
Woo
dlan
dDa
vis
UC D
avis
Deepwater
Woodland Biomass
Knights LandingZamora
Barker Slough
Post
To Lockford
To BellotaTo Grand
IslandTravis A.F.B
Bata
via
Dixon CanningDixon
SuisunVacaville
Wol
fski
llEn
ergySchmalbach
Hal
eJa
mes
on
Cord
elia
Vaca Dixon
Cal P
eak
Mad
ison
Win
ters
Plainfield
To E. Nicolaus
Wilkins SloughDIST 108
El Dorado PSCarnack
Puta
hCr
eek
Arb
uckl
e
Cor
tina
Dunnigan
Dra
ke
Har
ringt
on
Wad
ham
Col
usa
Max
wel
l
To Glenn
Ric
e
Willi
ams
Sacramento Area
Slide 7
Delevan
Birds Landing
Contra Costa
Facility identified with thermal overload mitigated by previously approved project.
Facility identified with thermal overload not mitigated by previously approved project.
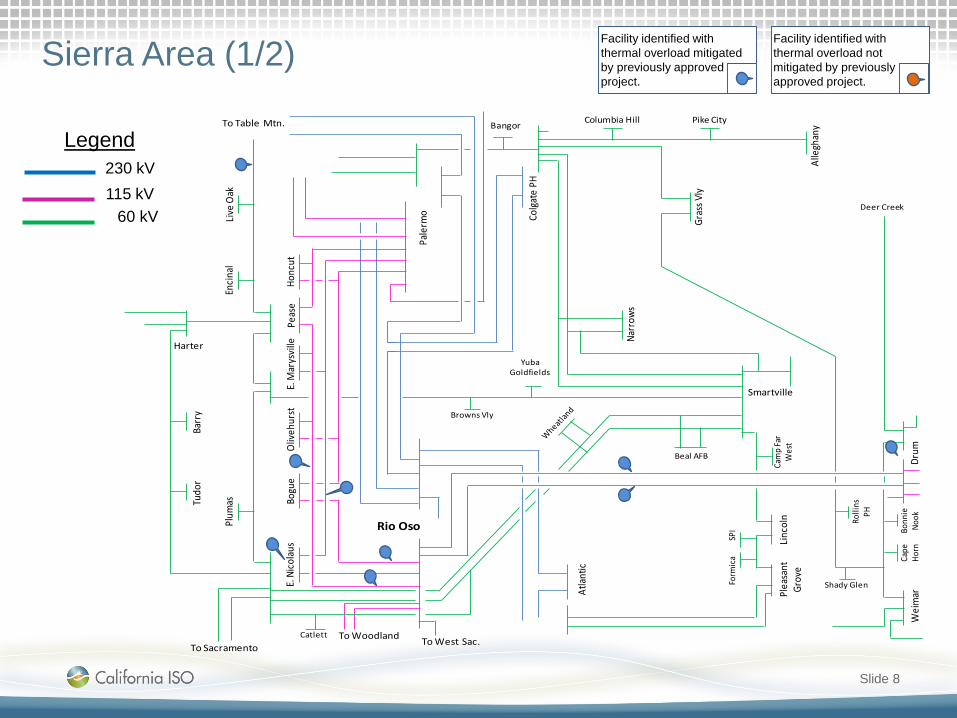
Legend230 kV115 kV
60 kV
Pale
rmo Co
lgate
PH
Bangor
Smartville
To Woodland To West Sac.
Drum
Atlan
tic
Rio Oso
Peas
eHo
ncut
E. M
arys
ville
Olive
hurs
tBo
gue
E. Ni
colau
s
To Table Mtn.
Encin
alLiv
e Oak
Barr
yTu
dor
Harter
Browns Vly
Yuba Goldfields
Narr
ows
Linco
lnPl
easa
nt
Grov
e
Form
ica
SPI
Cam
p Fa
r W
est
Beal AFB
Catlett
Gras
s Vly
Alle
ghan
y
Pike CityColumbia Hill
Deer Creek
Wei
mar
Shady Glen
Rolli
ns
PH
Bonn
ie
Nook
Cape
Ho
rn
Plum
as
To Sacramento
Sierra Area (1/2)
Slide 8
Facility identified with thermal overload mitigated by previously approved project.
Facility identified with thermal overload not mitigated by previously approved project.

Rio Oso
Gol
d Hi
ll
Atlantic
Del Mar
Rocklin
Tayl
or R
d
Penryn
Sierra Pine
Pleasant Grove
Hors
esho
e
New
cast
le
PHCl
arks
ville
Flin
t
Shin
gle
Sprin
gsDi
amon
d Sp
rings
Eldo
rado
PH
Placerville
Apple HillTo Middle Fork
To Stockton Area
Wise
PHPl
acer
Aubu
rn Mtn
. Q
uarr
ies
Halse
y PH
Weimar
Rolli
ns
PH
To G
rass
Vly
.
Shady Glen
Foresthill
Oxbow PH
BellHi
ggin
s
Chicago Park PH Dutch Flat #1 PH
Drum
Bonn
ie
Noo
k
Spaulding PH
To
Sum
mit
Cisco GroveTamarack
Ralst
on P
HM
iddl
e Fo
rk P
H
French Meadows PH
Hell
Hole
PH
Dutch Flat #2 PHBrunswick
Lincoln
Sierra Area (2/2)
Slide 9
Legend230 kV115 kV
60 kV
Facility identified with thermal overload mitigated by previously approved project.
Facility identified with thermal overload not mitigated by previously approved project.
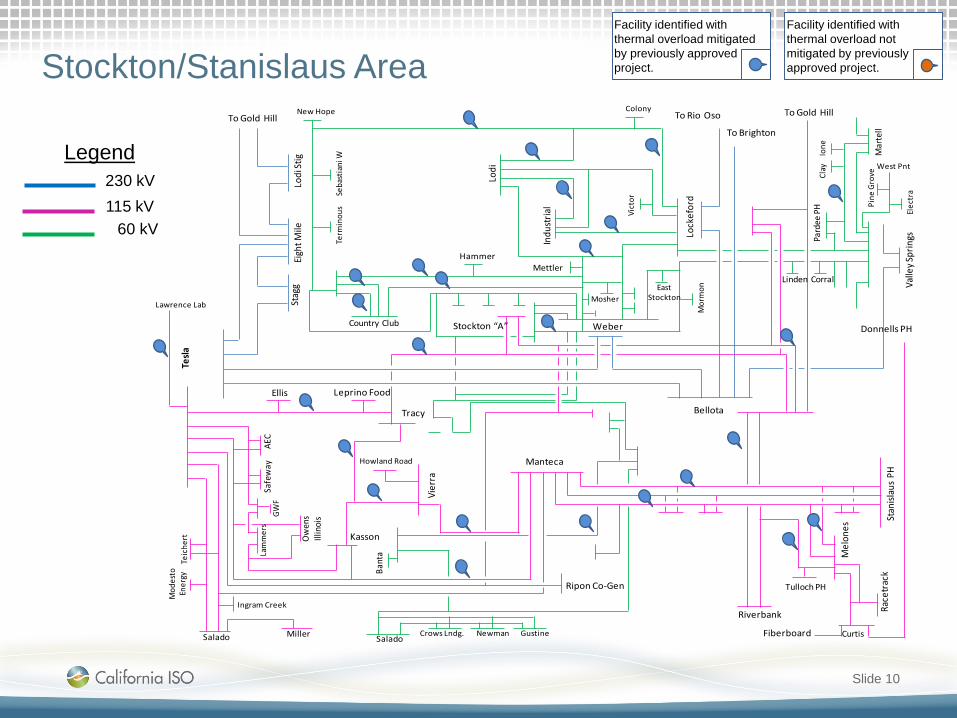
Legend230 kV115 kV
60 kV
To Rio Oso
Tesla
Stag
gEi
ght M
ileLo
di St
ig
To Gold Hill
Lock
efor
d
To Brighton
Bellota
Weber
Ellis
Tracy
Kasson
Howland Road
Vier
ra
Safe
way
GWF
Ow
ens
Illin
ois
Lam
mer
sAE
C
Salado Miller
Ingram Creek
Mod
esto
En
ergy
Teic
hert
Lawrence Lab
Leprino Food
Ripon Co-Gen
Stan
islau
s PH
Riverbank
Mel
ones
Tulloch PH
CurtisFiberboard
Race
trac
k
Donnells PH
Manteca
Stockton “A”
To Gold Hill
Lodi
Indu
stria
l
Valle
y Spr
ings
Country Club
Mosher
HammerMettler
Mar
tell
Pard
eePH
West Pnt
Elec
tra
Pine
Gro
ve
Ione
Clay
CorralLinden
Mor
monEast
Stockton
Salado
Bant
a
GustineCrows Lndg. Newman
Term
inou
s
New Hope
Seba
stia
niW
Colony
Vict
or
Stockton/Stanislaus Area
Slide 10
Facility identified with thermal overload mitigated by previously approved project.
Facility identified with thermal overload not mitigated by previously approved project.

Review of Projects Not Modelled in The Base Cases
Slide 11

Vierra 115 kV Looping Project
• Original need– 2010-2011 TPP: NERC Category P3, P6
thermal overload.• Reliability Assessment Need
– NERC Categories P3 and P6 thermal overloads.
• Mitigation still required– Needed for reliability– Needed for LCR in Tesla-Bellota sub-
area• Review of current project to meet need
– Not applicable.• Alternatives
– Not applicable. • Preliminary conclusion
– Proceed with the original scope of the project
Slide 12

Mosher Transmission Project Project Review
• Original need– 2013-2014 TPP: Planning for New
Transmission vs. Involuntary Load Interruption Standard (BCR Project)
• Reliability Assessment Need– BCR project.
• Mitigation still required– BCR is greater than 1 (1.05) with
reduced scope of single 715 AAC.• Review of current project to meet
need– BCR project.
• Alternatives– Single 715 AAC conductor
• Preliminary conclusion– Proceed with Single 715 AAC
conductor.
Slide 13

Atlantic-Placer Project Review
• Original need– 2012-2013 TPP studies identified NERC
P0, P1, P2, P6, P7 overload and P1 voltage deviation, P6, P7 low voltage (voltage collapse.
• Reliability Assessment Need– NERC Categories P2, P6 thermal issue
and voltage collapse under P6 and minor voltage issue under P7.
• Mitigation still required– Needed to address reliability issues.
• Review of current project to meet need– Current scope of approved project
mitigates identified criteria violation. Under review for potential alternative solutions.
• Alternatives– Cancel the new line and keep the second
Placer 115/60 kV transformer and keep SPS at Gold Hill
– Cancel the line and the second transformer keep SPS at Gold Hill
• Preliminary conclusion– Further analysis required
Slide 14
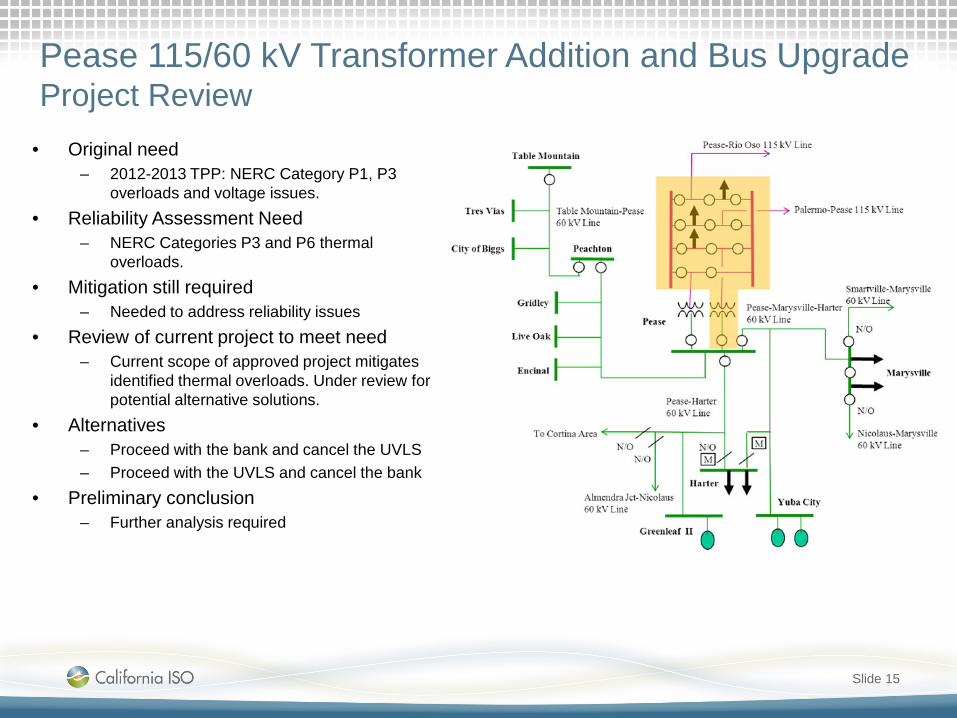
Pease 115/60 kV Transformer Addition and Bus Upgrade Project Review
• Original need– 2012-2013 TPP: NERC Category P1, P3
overloads and voltage issues.• Reliability Assessment Need
– NERC Categories P3 and P6 thermal overloads.
• Mitigation still required– Needed to address reliability issues
• Review of current project to meet need– Current scope of approved project mitigates
identified thermal overloads. Under review for potential alternative solutions.
• Alternatives– Proceed with the bank and cancel the UVLS– Proceed with the UVLS and cancel the bank
• Preliminary conclusion– Further analysis required
Slide 15

Vaca – Davis Voltage Conversion Project
• Original need– 2010-2011 TPP: NERC Category P0 voltage
issue, severe Category P1, P3 and P6 thermal issues, and Category P1, P3, and P6 voltage issues.
• Reliability Assessment Need– NERC Categories P1, P2, P6 under base
case and P0 under sensitivity scenario in 2027
• Mitigation still required– Needed for reliability.
• Review of current project to meet need– Current scope of approved project mitigates
identified thermal overloads. Under review for potential alternative solutions.
• AlternativesA combination of the followings:– Re-rate or reconductor 115 kV lines around
Davis– Energy storage at Davis and Plainfield– Re-conductor Vaca-Plainfield 60 kV line
• Preliminary conclusion– Further analysis required
Slide 16
• Original scope: – Reconductor and convert the two 60 kV lines to 115 kV operation. Reconductor/re-
rate four other 115 kV. – Construct/convert four 115 kV switching station.– Transfer load– Replace Vaca Dixon 230/115 kV Nos. 2 and 2A Txs with a 420 MVA transformer.
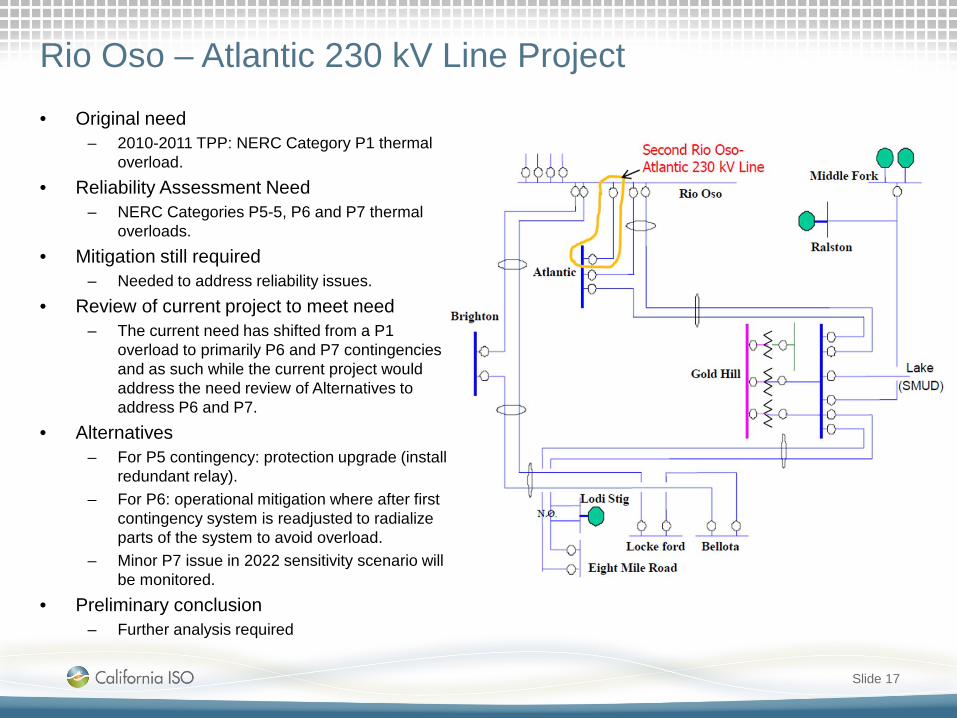
Rio Oso – Atlantic 230 kV Line Project
• Original need– 2010-2011 TPP: NERC Category P1 thermal
overload.• Reliability Assessment Need
– NERC Categories P5-5, P6 and P7 thermal overloads.
• Mitigation still required– Needed to address reliability issues.
• Review of current project to meet need– The current need has shifted from a P1
overload to primarily P6 and P7 contingencies and as such while the current project would address the need review of Alternatives to address P6 and P7.
• Alternatives– For P5 contingency: protection upgrade (install
redundant relay).– For P6: operational mitigation where after first
contingency system is readjusted to radialize parts of the system to avoid overload.
– Minor P7 issue in 2022 sensitivity scenario will be monitored.
• Preliminary conclusion– Further analysis required
Slide 17
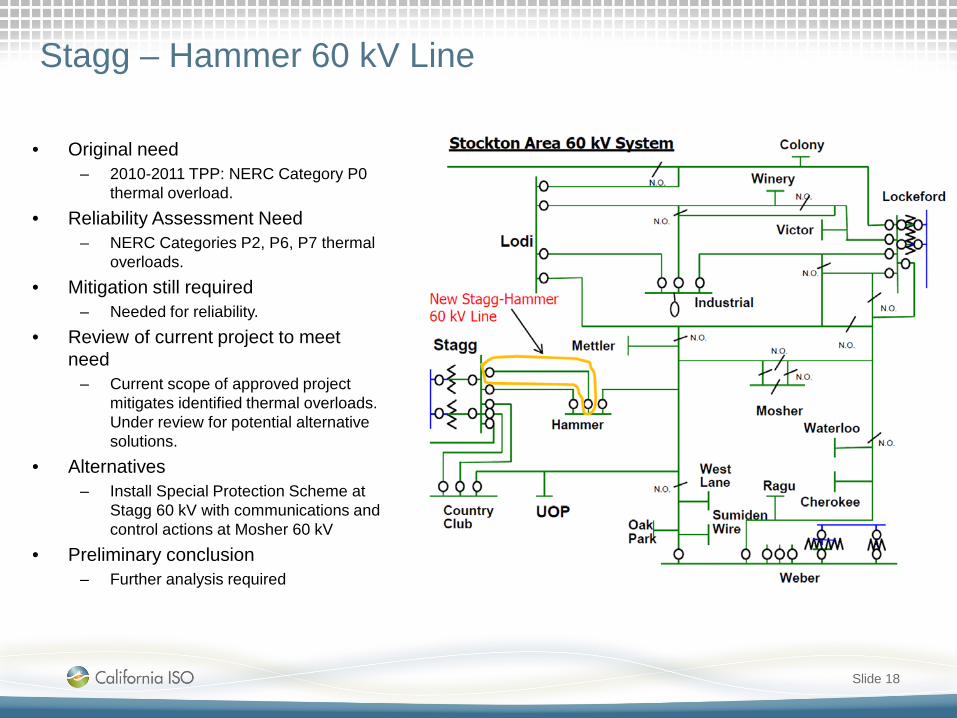
Stagg – Hammer 60 kV Line
• Original need– 2010-2011 TPP: NERC Category P0
thermal overload.• Reliability Assessment Need
– NERC Categories P2, P6, P7 thermal overloads.
• Mitigation still required– Needed for reliability.
• Review of current project to meet need
– Current scope of approved project mitigates identified thermal overloads. Under review for potential alternative solutions.
• Alternatives– Install Special Protection Scheme at
Stagg 60 kV with communications and control actions at Mosher 60 kV
• Preliminary conclusion– Further analysis required
Slide 18

Lockeford-Lodi Area 230 kV Development
• Original need– NERC Category P1 thermal overload.
• Reliability Assessment Need– NERC Categories P6 thermal
overloads and P1 voltage issues.• Mitigation still required
– Mitigation is needed for reliability.• Review of current project to meet
need– Current scope of approved project
mitigates identified but the scope is under review for potential alternative or reduced scope solutions.
• AlternativesA combinations of the following is being considered– Voltage support at Lockeford– Reinforcing 60 kV path between
Lockeford and Lodi– 230 kV lines to supply Industrial
• Preliminary conclusion– Further analysis required
Slide 19

Areas of additional mitigation requirement
Slide 20

Additional Mitigation Requirements
Slide 21
• There are high voltages at 115 kV and 60 kV system that could be addressed by load power factor correction. If power factor correction is not feasible or cost effective, voltage support at transmission level is required. This is discussed in detail in Voltage Assessment presentation.
• Reliability Assessment Need– NERC Categories P2-1 thermal
overloads on the Gold Hill to Eldorado 115 kV lines
• Potential Alternatives– Rerate/Reconductor the limiting
sections.– Preferred resources
• First Year of Need identified in Current Assessment
– 2019 • Interim Mitigation
– Action plan

Sensitivity Study Assessment
Slide 22
• Below is the list of facility overloads identified in sensitivity scenario(s) only.
Overloaded Facility Category2019 SP
Peak-Shift2027 SP
Peak-Shift
2022 SP High CEC Forecast
2022 SP Heavy Renewable & Min Gas Gen
2027 Retirement of QF
GenerationsRio Oso - Brighton 230 kV l ine P2 √ √Contra Costa PP - Birds Landing 230 kV l ine P2 √Vaca - Plainfield 60 kV l ine P0 √Rio Oso - West Sacramento 115 kV l ine P6 √Placer - Bell 115 kV l ine P2 √Higgins - Bell 115 kV l ine P2 √Placervil le - MIZOU_T1 115KV P2-1 √Table Mountain - Pease 60 kV l ine P3 √ √Lincoln - Ulura JT 115 kV l ine P6 √Hammer - Hammer Jct 60 kV l ine P7 √ √

Bulk and Regional Voltage Issues
Preliminary Reliability Assessment Results
Ebrahim RahimiLead Regional Transmission Engineer
2017-2018 Transmission Planning Process Stakeholder MeetingSeptember 21-22, 2017

Outline
Slide 2
Review of voltage issues in PG&E system
Operational and Planning Voltage Issues
Load/gen/path flow conditions with more voltage issues
Preliminary 2017-2018 TPP Voltage Assessment Results
Preliminary conclusions on projects

Bulk, Regional, and Local Networks in PG&E System
Slide 3
COI (Path 66)
Path 26
G
G
G
Load
Bulk System500 kV
Regional230 kV
Local115/60 kV

Analysis of existing voltage issues
Slide 4
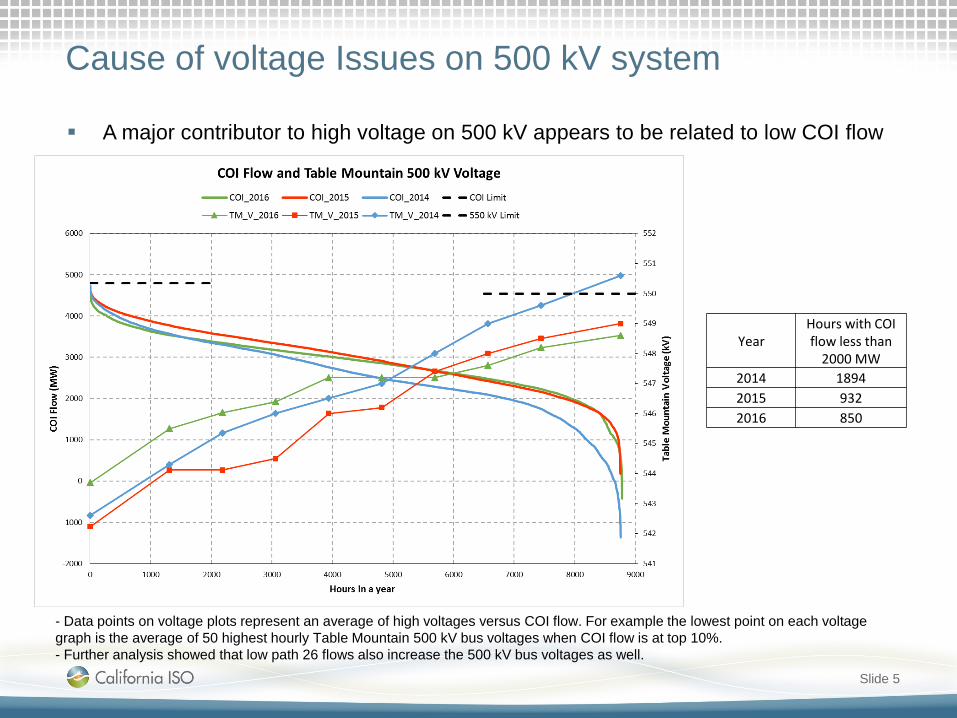
Cause of voltage Issues on 500 kV system
Slide 5
A major contributor to high voltage on 500 kV appears to be related to low COI flow
- Data points on voltage plots represent an average of high voltages versus COI flow. For example the lowest point on each voltage graph is the average of 50 highest hourly Table Mountain 500 kV bus voltages when COI flow is at top 10%.- Further analysis showed that low path 26 flows also increase the 500 kV bus voltages as well.
YearHours with COI flow less than
2000 MW2014 18942015 9322016 850

Local System Voltages (115 kV)
Slide 6
Max Placerville = 128.7 kV
Max Exchequer = 128.6 kV
Max Bogue = 128.1 kV
Max East Nicolaus = 126.4 kV

Cause of voltage Issues
Slide 7
A major contributor to high voltage on 500 kV appears to be related to low COI flow
There are several factors impacting voltage at local 115 kV and 60 kV networks: Voltage at 230 kV system
230/115 kV transformer taps
Scheduled voltage of generators
Status of shunts
Load power factor
A combination of the above factors cause voltage issues at local network

Summary of Real Time Data Review
Slide 8
High voltages are observed at all voltage levels in 2016
High voltage on 500 kV appears to be related to COI flow Also appears to be a potential link to Path 26 flows as well
Is more severe when one or both Diablo units are off-line
High voltages on 115 kV buses are mostly caused by: leading load power factor
outside of ISO Tariff requirements
high transformer tap settings; and
high 230 kV voltage

2017-18 TPP Study Plan Assumptions Regarding Voltage Assessment
Slide 9
Power Factor Assumptions in PG&E System
• Bus load power factor for the year 2019 were modeled based on the actual data recorded in the EMS system
• For the subsequent study years a power factor of 0.99 lagging for summer peak cases, and unity power factor for spring off-peak cases, were used.
Slide 10

Voltage Support Projects Model
• Voltage support projects were offline in the study cases:
Slide 11
Cayucos 70 kV Shunt Capacitor CCLP
Diablo Canyon Voltage Support Project CCLP
Bellota 230 kV Substation Shunt Reactor CVLY
Rio Oso Area 230 kV Voltage Support CVLY
Los Esteros 230 kV Substation Shunt Reactor GBA
Borden 230 kV Voltage Support GFA
Wilson Voltage Support GFA
Maple Creek Reactive Support (Install 10 Mvar SVC at Maple Creek Sub) Humboldt
Wheeler Ridge Voltage Support Kern
Ignacio 230 kV Substation Shunt Reactor NCNB
Cottonwood 115 kV Substation Shunt Reactor NVLY
Delevan 230 kV Substation Shunt Reactor NVLY
Voltage Study Results
Slide 12
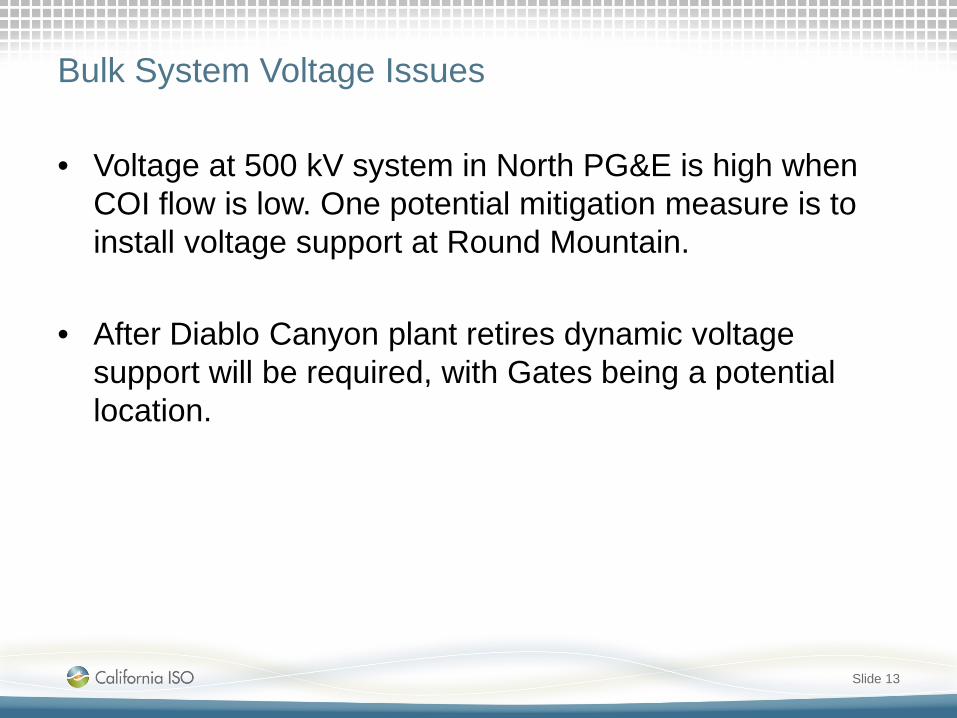
Bulk System Voltage Issues
• Voltage at 500 kV system in North PG&E is high when COI flow is low. One potential mitigation measure is to install voltage support at Round Mountain.
• After Diablo Canyon plant retires dynamic voltage support will be required, with Gates being a potential location.
Slide 13
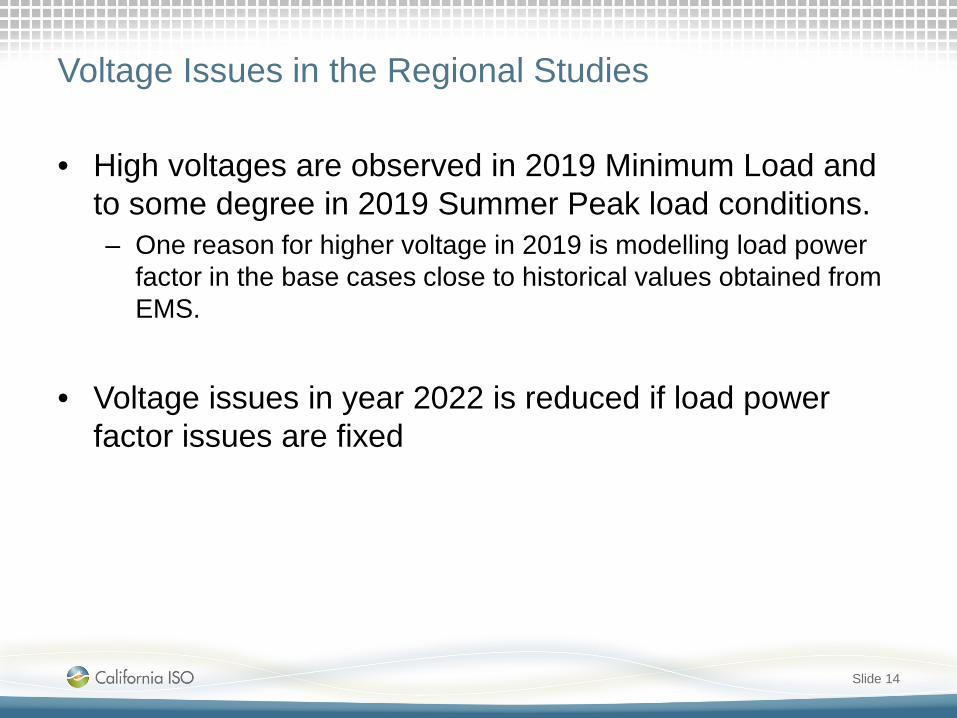
Voltage Issues in the Regional Studies
• High voltages are observed in 2019 Minimum Load and to some degree in 2019 Summer Peak load conditions.– One reason for higher voltage in 2019 is modelling load power
factor in the base cases close to historical values obtained from EMS.
• Voltage issues in year 2022 is reduced if load power factor issues are fixed
Slide 14

Reactive support projects approved in 2015-2016 Transmission Plan
Slide 15

Reactive projects approved in 2015-2016 Transmission Plan
Slide 16
Bellota 230 kV Substation Shunt Reactor CVLY
Los Esteros 230 kV Substation Shunt Reactor GBA
Wilson Voltage Support GFA
Ignacio 230 kV Substation Shunt Reactor NCNB
Cottonwood 115 kV Substation Shunt Reactor NVLY
Delevan 230 kV Substation Shunt Reactor NVLY
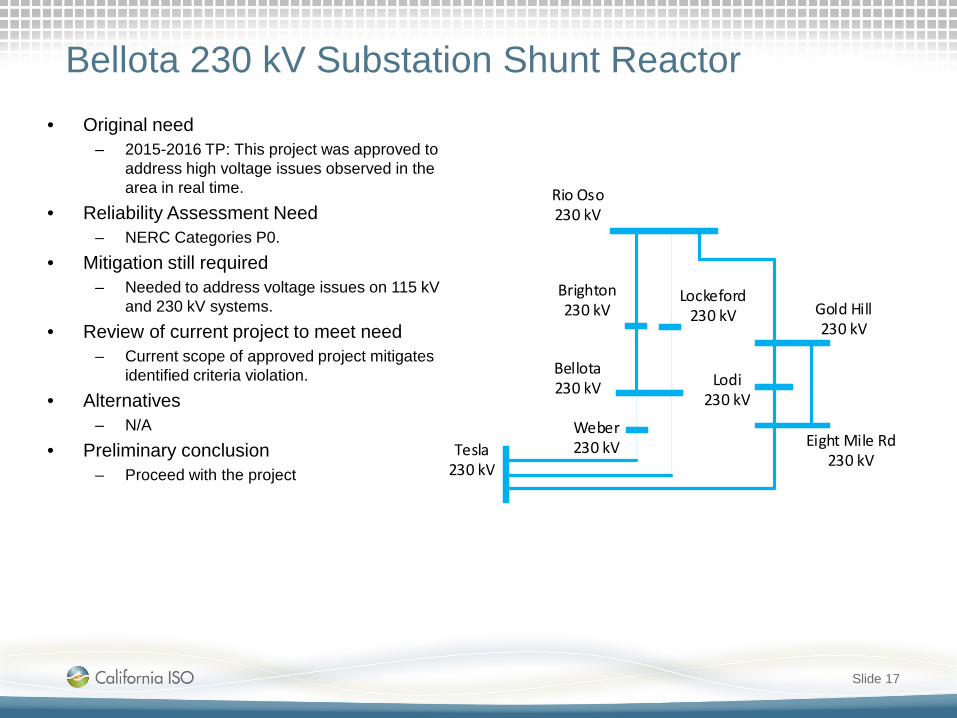
Bellota 230 kV Substation Shunt Reactor
Slide 17
• Original need– 2015-2016 TP: This project was approved to
address high voltage issues observed in the area in real time.
• Reliability Assessment Need– NERC Categories P0.
• Mitigation still required– Needed to address voltage issues on 115 kV
and 230 kV systems.• Review of current project to meet need
– Current scope of approved project mitigates identified criteria violation.
• Alternatives– N/A
• Preliminary conclusion– Proceed with the project
Rio Oso 230 kV
Gold Hill 230 kV
Eight Mile Rd 230 kV
Brighton 230 kV
Bellota 230 kV
Weber 230 kV
Lockeford230 kV
Lodi 230 kV
Tesla 230 kV

Los Esteros 230 kV Substation Shunt Reactor
Slide 18
• Original need– 2015-2016 TP: This
project was approved to address high voltage issues in San Jose area under light load conditions.
• Reliability Assessment Need
– NERC Categories P0.• Mitigation still required
– Needed to address voltage issues on 115 kV and 230 kV systems.
• Review of current project to meet need
– Current scope of approved project mitigates identified criteria violation.
• Alternatives– N/A
• Preliminary conclusion– Proceed with the project

Wilson Voltage Support
Slide 19
• Original need– 2015-2016 TP: This
project was approved to address high voltage issues in Northern Fresno Area.
• Reliability Assessment Need
– NERC Categories P0.• Mitigation still required
– Needed to address voltage issues on 115 kV and 230 kV systems.
• Review of current project to meet need
– Current scope of approved project mitigates identified criteria violation.
• Alternatives– N/A
• Preliminary conclusion– Proceed with the project

Ignacio 230 kV Substation Shunt Reactor
Slide 20
• Original need– 2015-2016 TP: This
project was approved to address high voltage issues observed in the area in real time.
• Reliability Assessment Need
– NERC Categories P0.• Mitigation still required
– Needed to address voltage issues on 115 kV and 230 kV systems.
• Review of current project to meet need
– Current scope of approved project mitigates identified criteria violation.
• Alternatives– N/A
• Preliminary conclusion– Proceed with the project

Cottonwood 115 kV Substation Shunt Reactor
Slide 21
• Original need– 2015-2016 TP: This project was approved
to address high voltage issues observed in the area in real time.
• Reliability Assessment Need– NERC Categories P0.
• Mitigation still required– Needed to address voltage issues on 115
kV and 230 kV systems.• Review of current project to meet need
– Current scope of approved project mitigates identified criteria violation.
• Alternatives– N/A
• Preliminary conclusion– Proceed with the project
Cottonwood230 kV
Round Mountain 230 kV
Delevan 230 kV
Vaca Dixon 230 kV
Cortina 230 kV

Delevan 230 kV Substation Shunt Reactor
Slide 22
• Original need– 2015-2016 TP: This project was
approved to address high voltage issues observed in the area in real time.
• Reliability Assessment Need– NERC Categories P0.
• Mitigation still required– Needed to address voltage issues on
230 kV systems.• Review of current project to meet need
– Current scope of approved project mitigates identified criteria violation.
• Alternatives– N/A
• Preliminary conclusion– Proceed with the project
Cottonwood230 kV
Round Mountain 230 kV
Delevan 230 kV
Vaca Dixon 230 kV
Cortina 230 kV
Voltage support projects approved in Transmission Plans prior to 2015
Slide 23

Voltage Support Projects Model
• Voltage support projects were offline in the study cases:
Slide 24
Wheeler Ridge Voltage Support Kern
Cayucos 70 kV Shunt Capacitor CCLP
Diablo Canyon Voltage Support Project CCLP
Rio Oso Area 230 kV Voltage Support CVLY
Borden 230 kV Voltage Support GFA
Maple Creek Reactive Support (Install 10 Mvar SVC at Maple Creek Sub) Humboldt
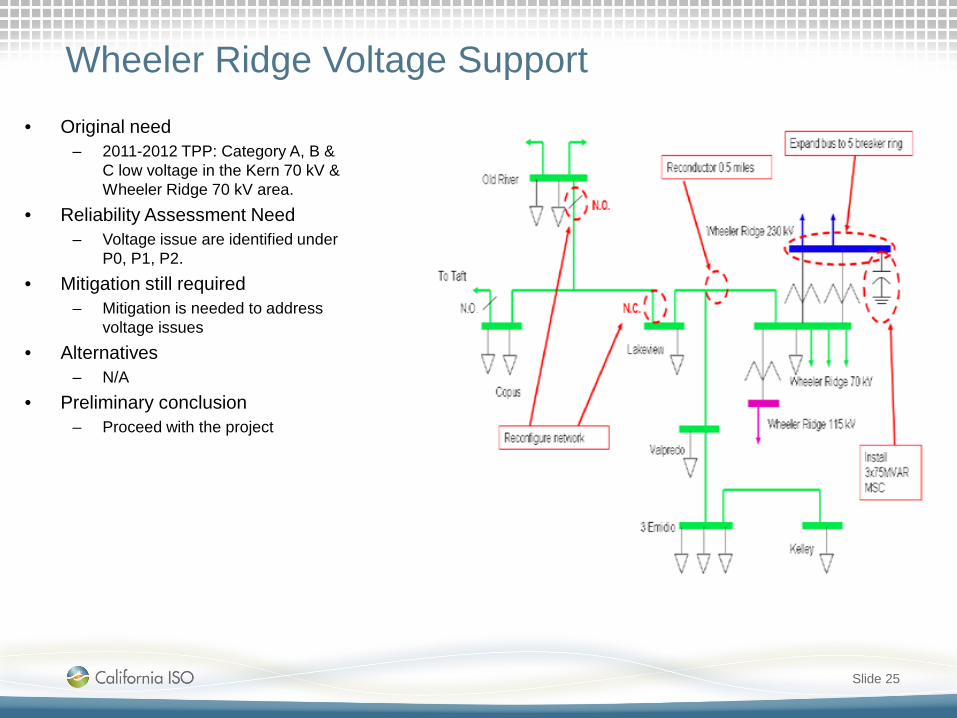
Wheeler Ridge Voltage Support
Slide 25
• Original need– 2011-2012 TPP: Category A, B &
C low voltage in the Kern 70 kV & Wheeler Ridge 70 kV area.
• Reliability Assessment Need– Voltage issue are identified under
P0, P1, P2.• Mitigation still required
– Mitigation is needed to address voltage issues
• Alternatives– N/A
• Preliminary conclusion– Proceed with the project

Cayucos 70 kV Shunt Capacitor Project
Slide 26
• Original need– 2010 TPP studies identified NERC
Category B voltage deviation and Category C low voltage
• Reliability Assessment Need– No voltage issue was identified
• Mitigation still required– Further analysis is required
• Alternatives– Cancel the capacitor banks and keep the
line Re-rate– Cancel both the capacitor bank and the
line re-rate• Preliminary conclusion
– Further analysis required

Diablo Canyon Voltage Support Project
Slide 27
• Original need– 2012-2013 TPP: NERC NUC-001-2,
NERC TPL Standards and CAISO Category B (L-1/G-1) resulting in low voltages below 0.90pu.
• Reliability Assessment Need– Voltage issue are identified
• Mitigation still required– Further analysis is required
• Alternatives– Reactive support at Mesa
• Preliminary conclusion– Further analysis required

Rio Oso Area 230 kV Voltage Support
• Original need– 2011-2012 TPP: NERC Category P0
voltage issues.• Reliability Assessment Need
– NERC Categories P0, P2, and P7 voltage issues.
• Mitigation still required– Needed to address voltage issues.
• Review of current project to meet need
– Under review for potential increase in the size of the SVC.
• Alternatives– Cancel Atlantic cap bank and proceed
with SVC– Cancel SVC and proceed with Atlantic
Cap bank• Preliminary conclusion
– Further analysis required
Slide 28
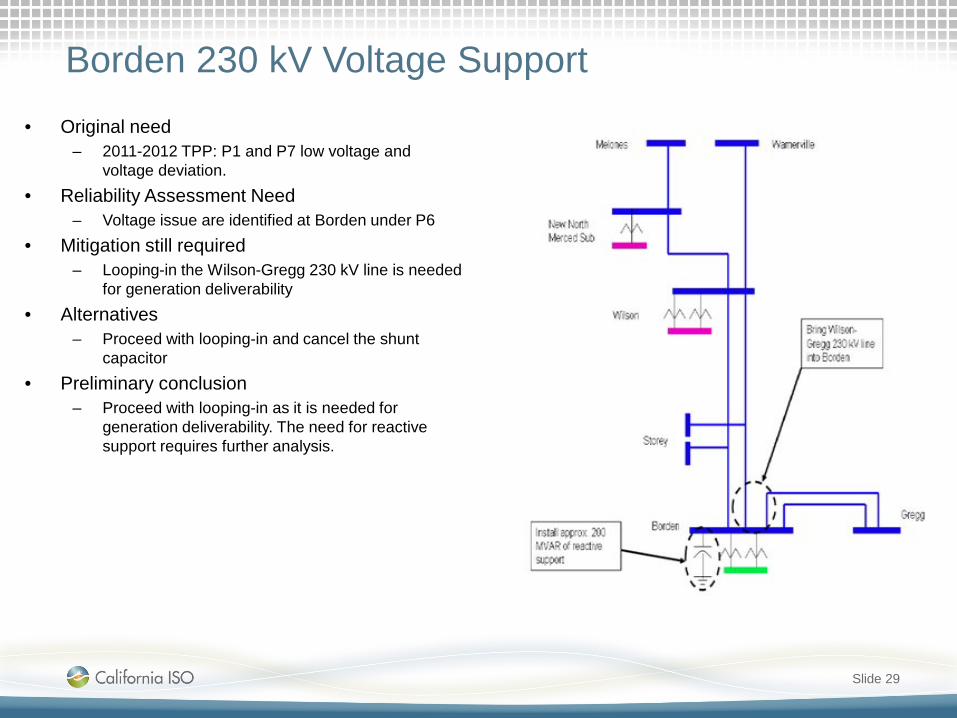
Borden 230 kV Voltage Support
Slide 29
• Original need– 2011-2012 TPP: P1 and P7 low voltage and
voltage deviation.• Reliability Assessment Need
– Voltage issue are identified at Borden under P6• Mitigation still required
– Looping-in the Wilson-Gregg 230 kV line is needed for generation deliverability
• Alternatives– Proceed with looping-in and cancel the shunt
capacitor• Preliminary conclusion
– Proceed with looping-in as it is needed for generation deliverability. The need for reactive support requires further analysis.
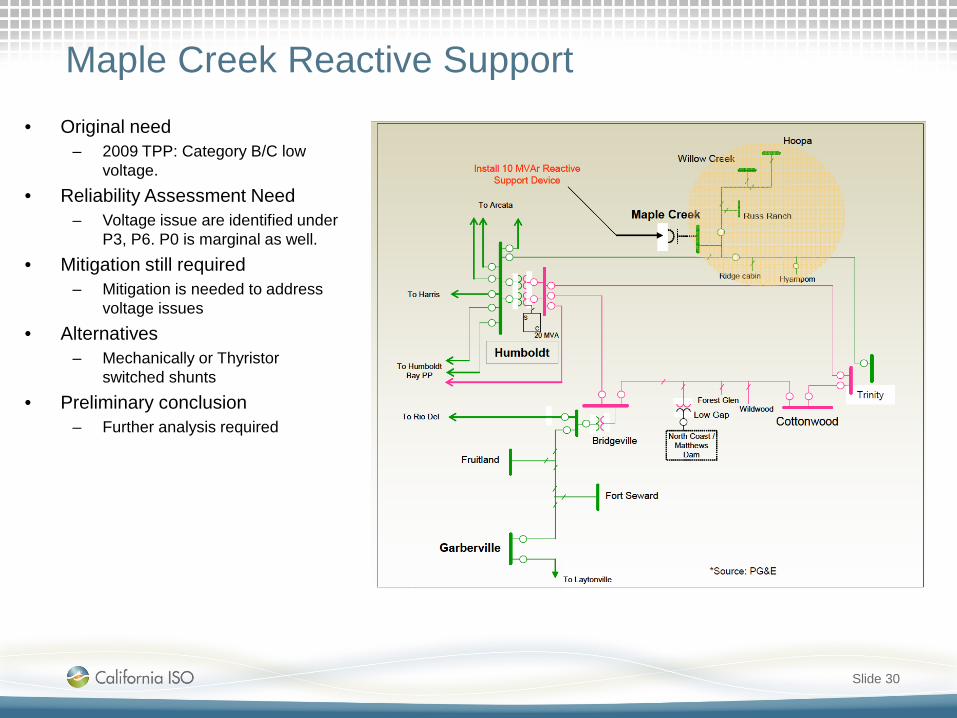
Maple Creek Reactive Support
Slide 30
• Original need– 2009 TPP: Category B/C low
voltage.• Reliability Assessment Need
– Voltage issue are identified under P3, P6. P0 is marginal as well.
• Mitigation still required– Mitigation is needed to address
voltage issues• Alternatives
– Mechanically or Thyristorswitched shunts
• Preliminary conclusion– Further analysis required

Summary of Voltage Assessment Results (1/2)
• Planning studies as well as review of real time data indicate that there are voltage issues at all voltage levels across the PG&E system.
• Voltage at 500 kV system in North PG&E is high when COI flow is low. One potential mitigation measure is to install voltage support at Round Mountain.
• After Diablo Canyon plant retires dynamic voltage support will be required, with Gates being a potential location.
Slide 31
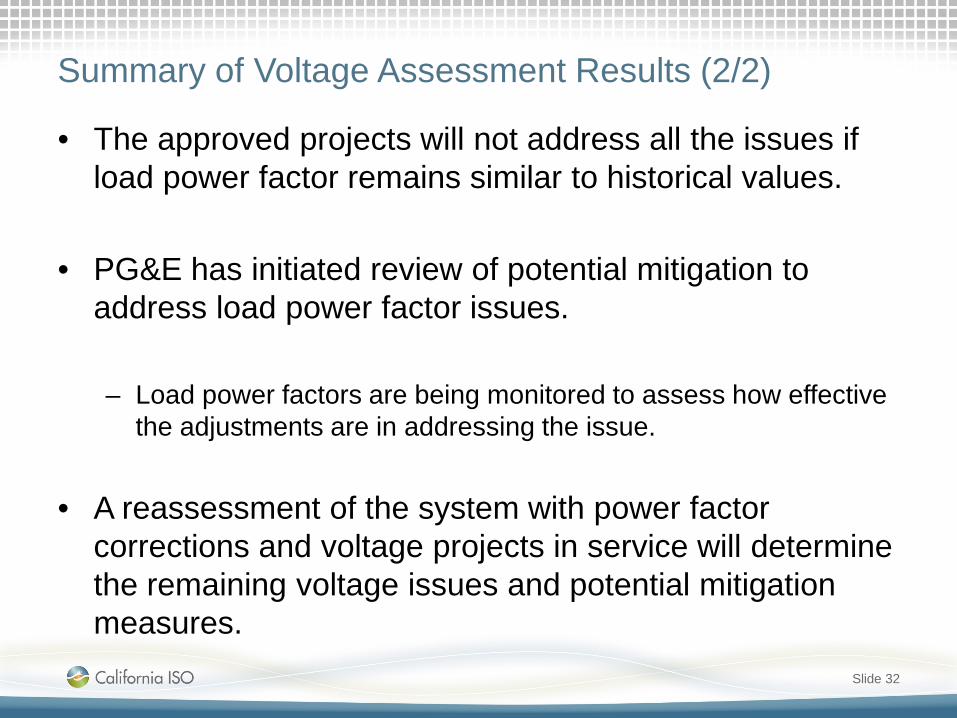
Summary of Voltage Assessment Results (2/2)
• The approved projects will not address all the issues if load power factor remains similar to historical values.
• PG&E has initiated review of potential mitigation to address load power factor issues.
– Load power factors are being monitored to assess how effective the adjustments are in addressing the issue.
• A reassessment of the system with power factor corrections and voltage projects in service will determine the remaining voltage issues and potential mitigation measures.
Slide 32
PG&E Bulk SystemPreliminary Reliability Assessment Results
Irina GreenSenior Advisor, Regional Transmission
2017-2018 Transmission Planning Process Stakeholder MeetingSeptember 21-22, 2017
SCE Bulk SystemPreliminary Reliability Assessment Results
Nebiyu YimerRegional Transmission Engineer Lead
2017-2018 Transmission Planning Process Stakeholder MeetingSeptember 21-22, 2017

SCE Metro AreaPreliminary Reliability Assessment Results
Nebiyu YimerRegional Transmission Engineer Lead
2017-2018 Transmission Planning Process Stakeholder MeetingSeptember 21-22, 2017

SCE Metro Area
Includes Los Angeles, Orange,
Ventura and Santa Barbara
counties
Comprised of 500 kV and 230 kV
transmission facilities
1-in-10 summer peak net load of
16,185 MW in 2027
Forecast 3,383 MW of BTM PV
and 1,347 MW of AAEE by 2027
10,400 MW of existing generation
of which 5,764 MW is scheduled
to be retired.
2,150 MW of approved resourcesSlide 2

SCE Metro Area Study Scenarios
Slide 3
Base scenarios
Sensitivity scenarios
No. Case DescriptionB1 2019 Summer Peak
Peak load time - hours between 16:00 and 18:00.B2 2022 Summer Peak
B3 2027 Summer Peak
B4 2019 Spring Light Load Spring light load time - hours between 02:00 and 6:00.
B5 2022 Spring Off-Peak Spring Off-peak load time – weekend morning
No Case DescriptionS1 2019 Summer Peak 2019 SP with peak-shift adjustment
S2 2022 Summer Peak 2022 SP with peak-shift and high CEC load
S3 2022 Summer Peak 2022 SP with high renewable minimal gasgeneration output
S4 2027 Summer Peak 2027 SP with peak-shift adjustment
S5 2022 Spring Off-Peak 2022 spring off-peak with minimum net load
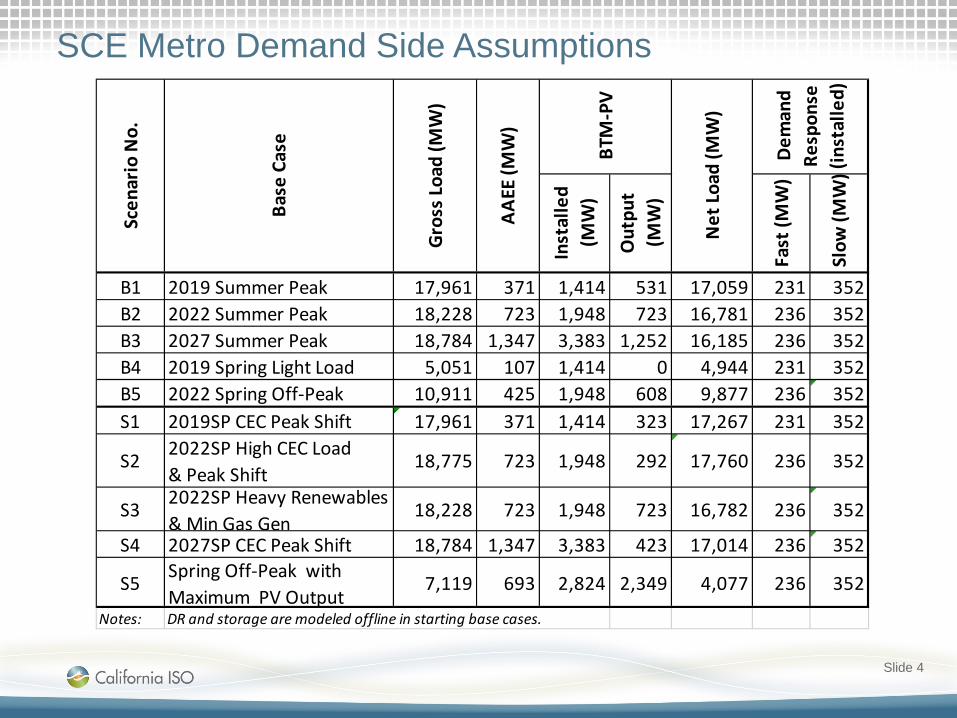
SCE Metro Demand Side Assumptions
Slide 4
Inst
alle
d (M
W)
Out
put
(MW
)
Fast
(MW
)
Slow
(MW
)
B1 2019 Summer Peak 17,961 371 1,414 531 17,059 231 352B2 2022 Summer Peak 18,228 723 1,948 723 16,781 236 352B3 2027 Summer Peak 18,784 1,347 3,383 1,252 16,185 236 352B4 2019 Spring Light Load 5,051 107 1,414 0 4,944 231 352B5 2022 Spring Off-Peak 10,911 425 1,948 608 9,877 236 352S1 2019SP CEC Peak Shift 17,961 371 1,414 323 17,267 231 352
S2 2022SP High CEC Load & Peak Shift
18,775 723 1,948 292 17,760 236 352
S3 2022SP Heavy Renewables & Min Gas Gen
18,228 723 1,948 723 16,782 236 352
S4 2027SP CEC Peak Shift 18,784 1,347 3,383 423 17,014 236 352
S5 Spring Off-Peak with Maximum PV Output
7,119 693 2,824 2,349 4,077 236 352
Notes: DR and storage are modeled offline in starting base cases.BT
M-P
V
Net
Load
(MW
)
Dem
and
Resp
onse
(in
stal
led)
AAEE
(MW
)
Scen
ario
No.
Base
Cas
e
Gros
s Loa
d (M
W)

SCE Metro Supply Side Assumptions
Sola
r (G
rid
Inst
alle
d (M
W)
Disp
atch
(M
W)
Inst
alle
d (M
W)
Disp
atch
(M
W)
Inst
alle
d (M
W)
Disp
atch
(M
W)
Inst
alle
d (M
W)
Disp
atch
(M
W)
B1 2019 Summer Peak 63 20 0 0 0 10 0 10,379 4,656 B2 2022 Summer Peak 327 383 122 0 0 10 0 6,569 4,009 B3 2027 Summer Peak 327 383 122 0 0 10 0 6,569 3,717 B4 2019 Spring Light Load 63 20 0 0 0 10 0 10,379 246 B5 2022 Spring Off-Peak 327 383 0 0 0 10 0 6,569 578 S1 2019SP CEC Peak Shift 63 20 0 0 0 10 0 10,379 4,656
S22022SP High CEC Load & Peak Shift
327 383 122 0 0 10 0 6,569 4,009
S3 2022SP Heavy Renewables & Min Gas Gen
327 383 316 0 0 10 0 6,569 3,460
S4 2027SP CEC Peak Shift 327 383 122 0 0 10 0 6,569 3,717
S5Spring Off-Peak with Maximum PV Output
327 383 14 0 0 10 2 6,569 341
Ther
mal
Win
d
Batt
ery
Stor
age
(Inst
alle
d)
No.
Base
Cas
e Hydr
oSlide 5

Metro Area Assessment Summary
Slide 6
Overloaded Facility Worst Contingencies
Cat
egor
y
Cat
egor
y D
escr
iptio
n
Loading (%)
Potential Mitigation Solutions
B12019
Summer
Peak
B32027
Summer
Peak
S12019 SP
CEC Peak Shift
S22022SP
High CEC Load &
Peak Shift
Pardee - Sylmar 230 kVOther Pardee - Sylmar 230 kV & Victorville - Lugo 500 kV
P6 L-1/L-1 <100 124 102 <100
System adjustments after initial contingency
Eagle Rock - Gould 230 kV
Gould - Sylmar 230 kV & Victorville - Lugo 500 kV P6 L-1/L-1 105 <100 107 <100
Mesa - Laguna Bell 230 kV #1
Mesa - Redondo & Mesa -Lighthipe 230 kV lines P6 L-1/L-1 <100 <100 <100 102
Serrano 500/230 kV Transformer
Two Serrano 500/230 kV Transformers P6 T-1/T-1 122 <100 124 105
System adjustments after initial or second contingency
Mira Loma 500/230 kV Transformer #4
Lugo - Rancho Vista & Mira Loma - Serrano 500 kV lines P6 L-1/L-1 117 <100 120 <100
Mira Loma 500/230 kV Transformer #1 or #2
Mira Loma - Serrano 500 kV & Mira Loma 500/230 kV Transformer #2 or #1
P6 L-1/T-1 106 <100 108 <100

SCE Metro Area Thermal Overloads
Slide 7
Pardee
Serrano
Johanna
Santiago
SanOnofre
HuntingtonBeach
Alamitos
Lighthipe
SDG&E
Redondo
El Segundo
N
Mira Loma
Mesa
VincentLugo
RanchoVista
Walnut
EagleRock
Sylmar
Barre Lewis
VillaPark
Ellis
Alberhill
Valley
Gould
Olinda
Goodrich
Rio Hondo
La Fresa
Hinson
LagunaBell

Thank you

Tehachapi and Big Creek CorridorPreliminary Reliability Assessment Results
Mudita SuriRegional Transmission Engineer
2017-2018 Transmission Planning Process Stakeholder MeetingSeptember 21-22, 2017

Agenda
• Area Introduction• Study Scenarios• Demand Side Assumptions• Supply Side Assumptions• TPP16-17 Approved Project• Steady State Results• Stability and Post-Transient Results
Slide 2
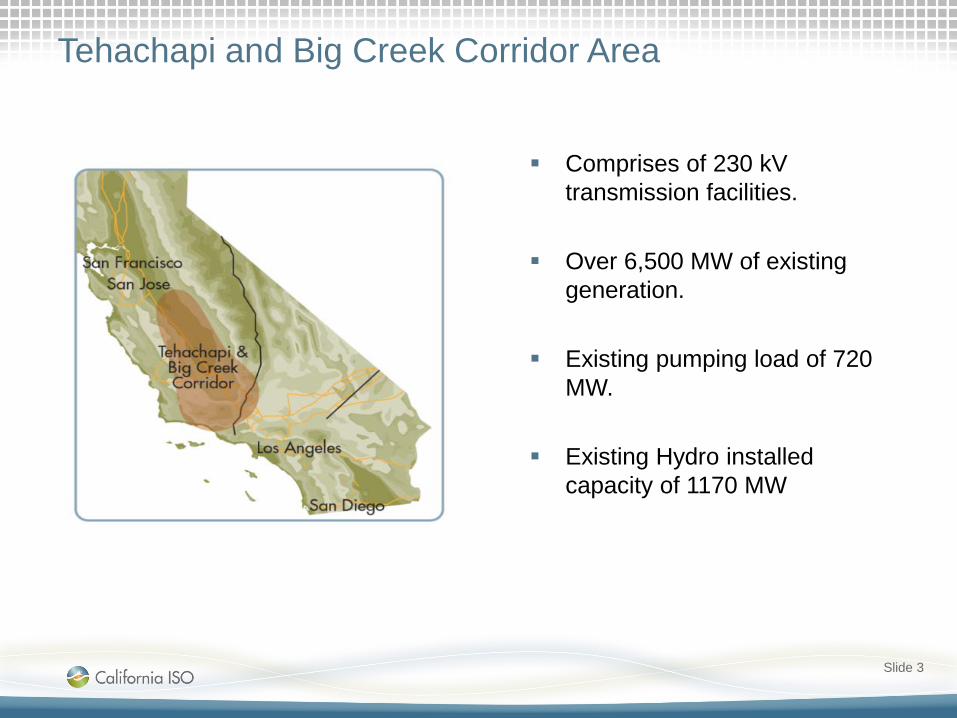
Tehachapi and Big Creek Corridor Area
Comprises of 230 kV transmission facilities.
Over 6,500 MW of existing generation.
Existing pumping load of 720 MW.
Existing Hydro installed capacity of 1170 MW
Slide 3

Study Scenarios
Slide 4
Five Base scenariosNo Case Description Renewables
Dispatch
B1 2019 Summer Peak
1-in 10 summer peak - hours between 16:00 and 18:00.
Solar - 36%Wind - 0%B2 2022 Summer Peak
B3 2027 Summer Peak
B4 2019 Spring Light Load Spring light load time - hours between 02:00 and 6:00.
Solar - 0%Wind - 93%
B5 2022 Spring Off-Peak Spring Off-peak load time –weekend morning
Solar - 93%Wind - 93%

Study Scenarios
Six Sensitivity scenarios
Slide 5
No Case Description
S1 2019SP CEC Peak Shift 2019 SP with peak-shift adjustment
S2 2022SP High CEC Load & Peak Shift 2022 SP with peak-shift and high CEC load
S3 2022SP Heavy Renewables & Min Gas Gen
2022 SP with high renewable minimal gas generation output
S4 2022SP Low Big Creek Hydro 2022SP with extremely low Big Creek hydro
S5 2027SP CEC Peak Shift 2027 SP with peak-shift adjustment
S6 2022 Spring Off-Peak with Maximum BTM PV Output 2022 spring off-peak with increased BTM PV

SCE BC&TH Demand Side Assumptions
Slide 6
Inst
alle
d (M
W)
Out
put
(MW
)
Fast
(M
W)
Slow
(M
W)
B1 2019 Summer Peak 4142.3 78.7 423.0 227.0 3836.7 88.4 42.4B2 2022 Summer Peak 4277.6 151.3 527.0 286.9 3839.4 97.3 43.4B3 2027 Summer Peak 4579.4 268.0 841.0 443.7 3867.7 97.3 43.4B4 2019 Spring Light Load 956.0 19.2 423.0 0.0 936.8 88.4 42.4B5 2022 Spring Off-Peak 2673.2 92.2 527.0 241.0 2340.0 97.3 43.4S1 2019SP CEC Peak Shift 4053.0 78.7 423.0 138.0 3836.3 88.4 42.4S2 2022SP High CEC Load & Peak Shift 4248.3 151.3 527.0 115.6 3981.4 97.3 43.4S3 2022SP Heavy Renewables & Min Gas
Gen4277.6 151.3 527.0 286.9 3839.4 97.3 43.4
S4 2022SP Low Big Creek Hydro 4277.6 151.3 527.0 286.9 3839.4 97.3 43.4S5 2027SP CEC Peak Shift 4298.5 268.0 841.0 149.8 3880.7 97.3 43.4S6 2022 Spring Off-Peak with Maximum
BTM PV Output2467.6 56.7 1241.0 972.0 1438.9 97.3 43.4
DR and storage are modeled offline in starting base cases.
Dem
and
Resp
onse
Note:
S. N
o.
Base
Cas
e
Gros
s Loa
d (M
W)
AAEE
(MW
) BTM
-PV
Net
Loa
d (M
W)

Generation Assumption
• Summer Peak Base Cases: Minimum hydro generation required to mitigate N-1 overloads in Big Creek area (without any load arming)
• Low Hydro Sensitivity Case: Worst hydro generation periods (during peak load hours) were analyzed for 2015 Summer to evaluate lowest generation amount (330MW)
Slide 7

SCE BC&TH Supply Side Assumptions
Slide 8
Inst
alle
d (M
W)
Disp
atch
(M
W)
Inst
alle
d (M
W)
Disp
atch
(M
W)
Inst
alle
d (M
W)
Disp
atch
(M
W)
Inst
alle
d (M
W)
Disp
atch
(M
W)
B1 2019 Summer Peak 0.0 2894.0 945.0 3539.0 0.0 1169.9 604.0 4415.0 1510.0B2 2022 Summer Peak 0.5 2905.0 945.0 3539.0 0.0 1169.9 604.0 4695.0 1759.0B3 2027 Summer Peak 0.5 2905.0 956.0 3539.0 0.0 1169.9 652.0 4695.0 1685.5B4 2019 Spring Light Load 0.0 2894.0 0.0 3539.0 3085.0 1169.9 396.0 4415.0 0.0B5 2022 Spring Off-Peak 0.5 2905.0 2419.0 3539.0 3085.0 1169.9 562.0 4695.0 157.0S1 2019SP CEC Peak Shift 0.0 2894.0 945.0 3539.0 0.0 1169.9 604.0 4415.0 1514.0S2 2022SP High CEC Load & Peak Shift 0.5 2905.0 945.0 3539.0 0.0 1169.9 639.3 4695.0 1720.0S3 2022SP Heavy Renewables & Min Gas
Gen0.5 2905.0 2624.0 3539.0 1415.6 1169.9 604.0 4695.0 795.0
S4 2022SP Low Big Creek Hydro 0.5 2905.0 945.0 3539.0 0.0 1169.9 345.0 4695.0 1726.0S5 2027SP CEC Peak Shift 0.5 2905.0 956.0 3539.0 0.0 1169.9 652.0 4695.0 1685.5S6 2022 Spring Off-Peak with Maximum
BTM PV Output0.5 2905.0 1470.0 3539.0 305.0 1169.9 203.7 4695.0 694.8
DR and storage are modeled offline in starting base cases.
Ther
mal
Note:
S. N
o.
Base
Cas
e
Batt
ery
Stor
age
(MW
)
Sola
r
Win
d
Hydr
o
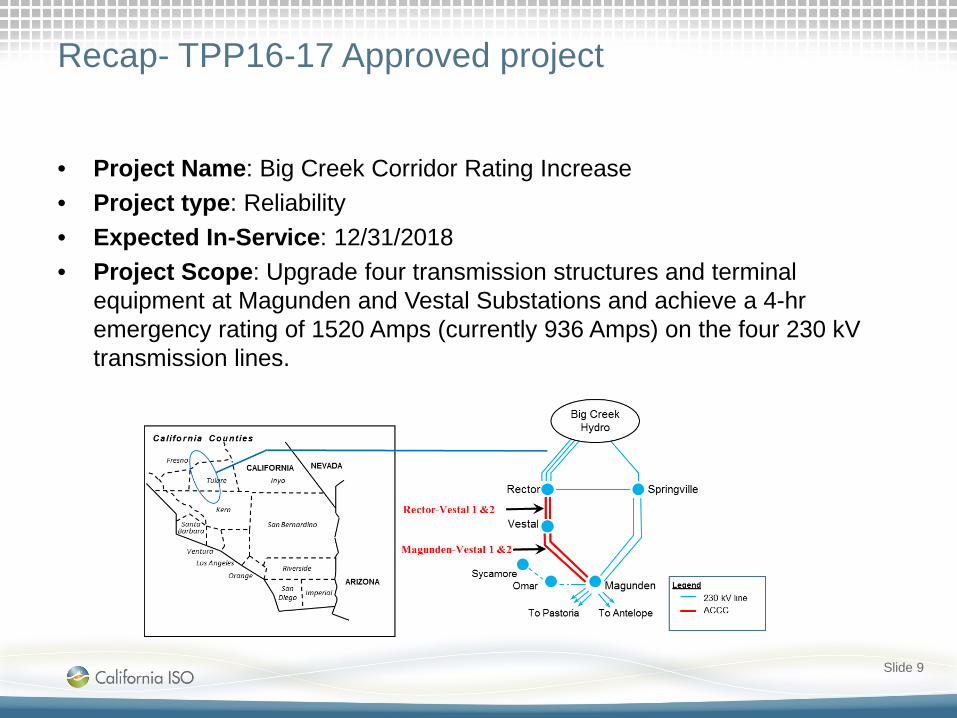
Recap- TPP16-17 Approved project
Slide 9
• Project Name: Big Creek Corridor Rating Increase• Project type: Reliability• Expected In-Service: 12/31/2018• Project Scope: Upgrade four transmission structures and terminal
equipment at Magunden and Vestal Substations and achieve a 4-hr emergency rating of 1520 Amps (currently 936 Amps) on the four 230 kV transmission lines.

Steady State Assessment Summary
Slide 10
Overloaded Facility Worst Contingency
Cat
egor
y
Cat
egor
y D
escr
iptio
n
Loading (%)
Potential Mitigation Solutions
S4-2022SP
Low Hydro
MAGUNDEN-SPRINGVL 230 kV
#2 line
MAGUNDEN-VESTAL 230kV 1 and 2 (with RAS) P7 N-2 <100
Increase Big Creek Hydro output or arm load per Big
Creek RAS
MAGUNDEN-SPRINGVL 230 kV 1 and EASTWOOD 13.80 Unit ID 1 P3 N-1/G-1 104.27
System adjustments after initial contingency
MAGUNDEN-SPRINGVL 230 kV 1 and BIG CRK1-EASTWOOD 230kV
1P6 N-1-1 102.52
MAGUNDEN-SPRINGVL 230 kV 1 and MAMMOTH-BIG CRK3 230kV 1 P6 N-1-1 104.28

SCE BC&TH Thermal Overloads
Slide 11
Big Creek 1
230 kV line & bus
Outage
Overload
Legend
Big Creek 2
Big Creek 3
Big Creek 8
Big Creek 4
RectorSpringville
Generator
Load
#1#2
Vestal
Magunden
Eastwood
Mammoth Pool
Pastoria
Well Gen
Pstria

Post Transient & Stability Assessment Summary
Slide 12
Contingency Category Study Mitigation
Pardee-Bailey 230kV and Bailey -Pastoria
230kV
P6 Low Voltage (Post-Transient analysis) at
Bailey 230kV
Operating Procedure 46
Big Creek 1-Big Creek 2 230 kV
P5 Local area instability (Transient analysis)
Protection Project- OD of 12/31/2019
Big Creek 3‐Rector No.2 & Big Creek 4‐Springville
P6 Local area instability*(Transient analysis)
Big Creek generation runback. ModifyBig Creek RAS
* This scenario was run on 2022 Spring Off peak base case with high (maximum) Big Creek Hydro output

Thank you
Questions?
North of Lugo AreaPreliminary Reliability Assessment Results
Meng ZhangSenior Regional Transmission Engineer2017-2018 Transmission Planning Process Stakeholder MeetingSeptember 21-22, 2017

North of Lugo (NOL) Area Comprised of 55, 115 and 230 kV
transmission facilities Total installed generation capacity
in the area is about 2100 MW. Summer peak loads of 964, 972
and 1000.8 MW in 2019, 2022 and 2027 respectively. These include AAEE as forecasted by CEC.
The loads are mainly served from Control, Kramer and Victor substations. The area can be divided into following subareas: North of Control Kramer/North of Kramer/Cool Water Victor
Slide 2
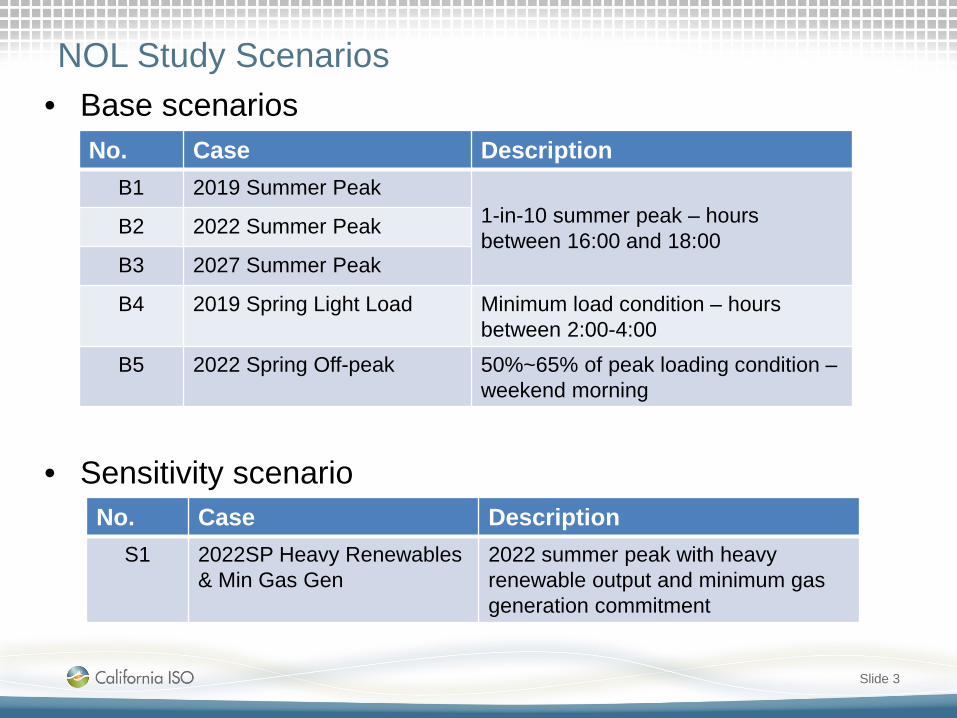
NOL Study Scenarios• Base scenarios
• Sensitivity scenario
Slide 3
No. Case DescriptionB1 2019 Summer Peak
1-in-10 summer peak – hours between 16:00 and 18:00
B2 2022 Summer Peak
B3 2027 Summer Peak
B4 2019 Spring Light Load Minimum load condition – hours between 2:00-4:00
B5 2022 Spring Off-peak 50%~65% of peak loading condition –weekend morning
No. Case DescriptionS1 2022SP Heavy Renewables
& Min Gas Gen2022 summer peak with heavy renewable output and minimum gas generation commitment

NOL Load and Load Modifier Assumptions
Slide 4
Installed Output Fast (MW) Slow(MW)2019 Summer Peak 978 14 156 64 900 82.44 0.772022 Summer Peak 1002 29 211 78 894 82.44 0.772027 Summer Peak 1056 55 316 117 884 82.44 0.772019 Spring Light Load 272 4 156 0 268 82.44 0.772022 Spring Off-peak 625 18 211 65 541 82.44 0.772022SP Heavy Renewable & Min Gas Gen 739 22 211 78 639 82.44 0.77
Gross Load (MW)
Case AAEE (MW)BTM-PV Net Load
(MW)Demand Response

NOL Generation Assumptions
Slide 5
15%
3%
82%
NOL Installed Capacity
15%
1%
84%
NOL Generation Dispatch, All Cases
Solar
Hydro
Others
Total Installed Capacity: 2132 MW Total Dispatch: 1543 MW
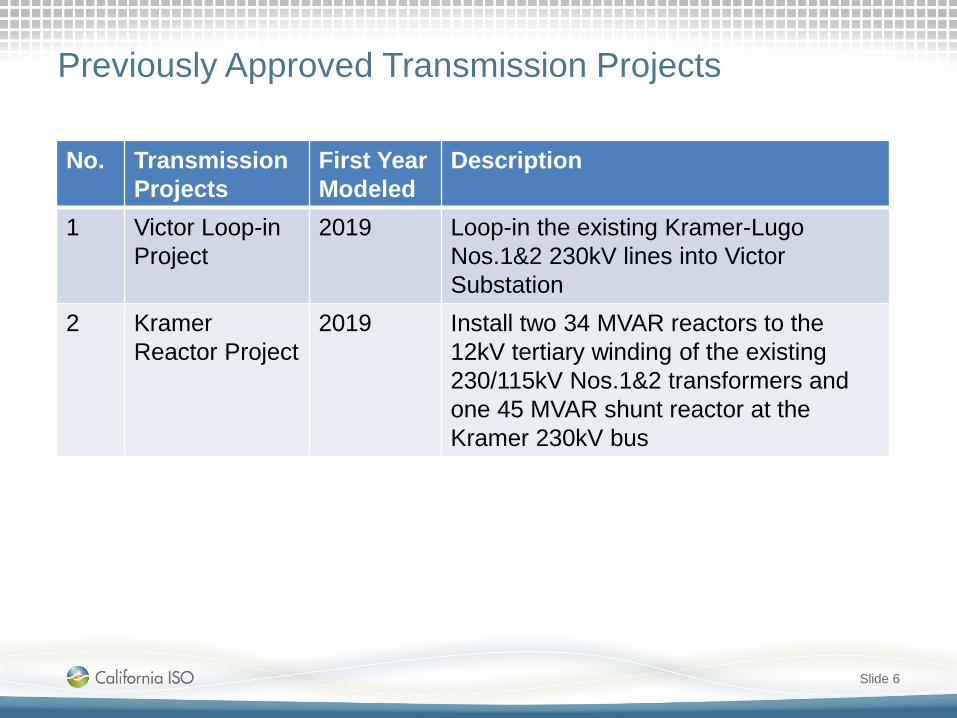
Previously Approved Transmission Projects
Slide 6
No. TransmissionProjects
First Year Modeled
Description
1 Victor Loop-in Project
2019 Loop-in the existing Kramer-Lugo Nos.1&2 230kV lines into Victor Substation
2 Kramer Reactor Project
2019 Install two 34 MVAR reactors to the 12kV tertiary winding of the existing 230/115kV Nos.1&2 transformers and one 45 MVAR shunt reactor at the Kramer 230kV bus
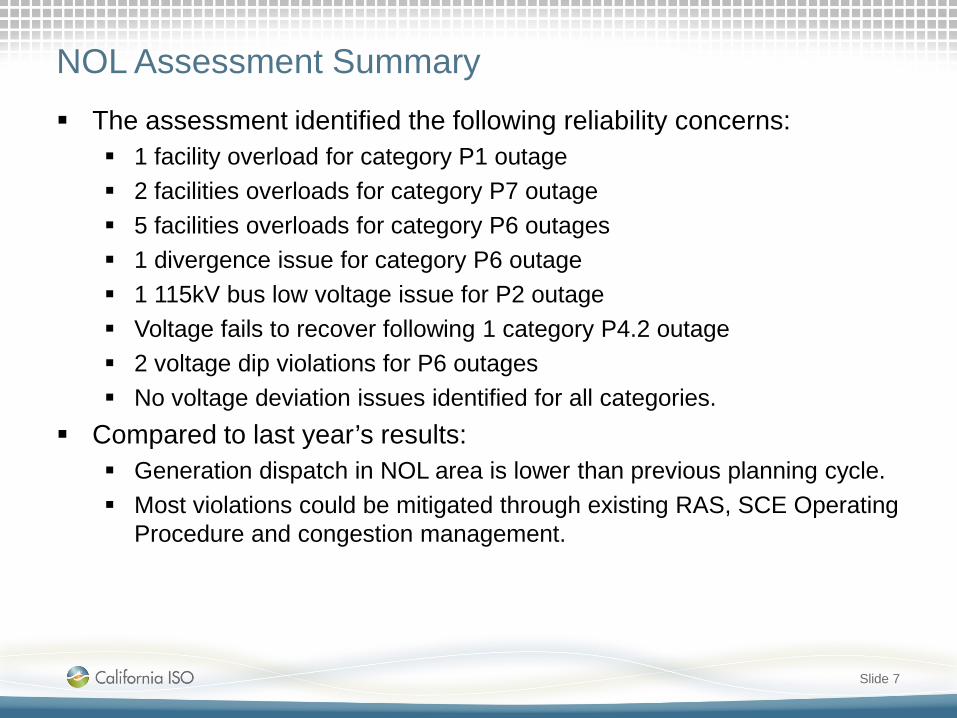
NOL Assessment Summary The assessment identified the following reliability concerns:
1 facility overload for category P1 outage 2 facilities overloads for category P7 outage 5 facilities overloads for category P6 outages 1 divergence issue for category P6 outage 1 115kV bus low voltage issue for P2 outage Voltage fails to recover following 1 category P4.2 outage 2 voltage dip violations for P6 outages No voltage deviation issues identified for all categories.
Compared to last year’s results: Generation dispatch in NOL area is lower than previous planning cycle. Most violations could be mitigated through existing RAS, SCE Operating
Procedure and congestion management.
Slide 7
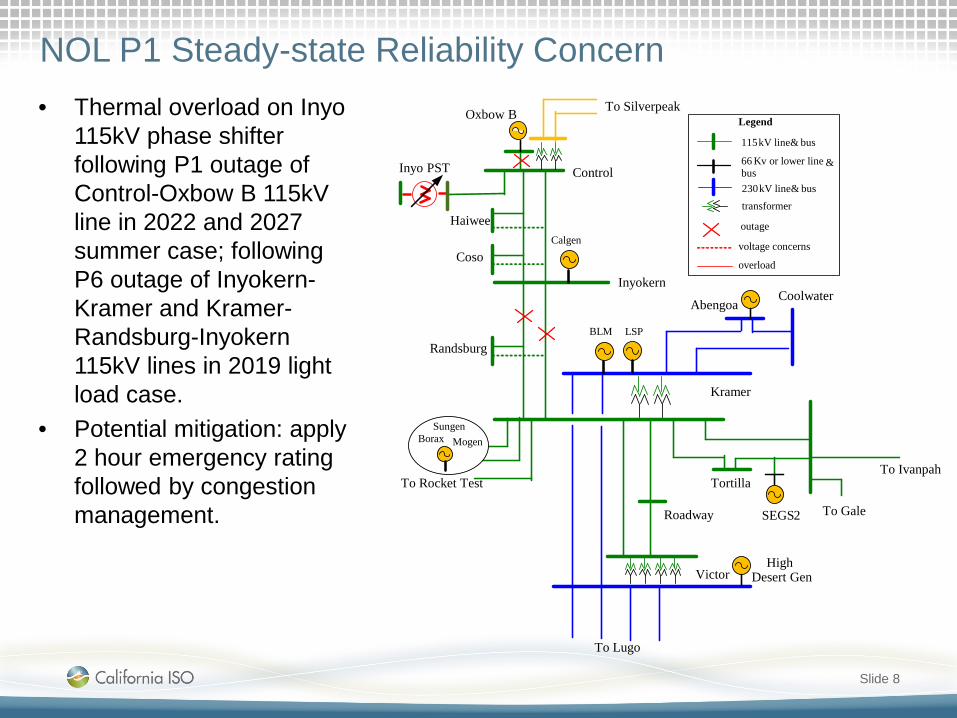
NOL P1 Steady-state Reliability Concern
Slide 8
• Thermal overload on Inyo 115kV phase shifter following P1 outage of Control-Oxbow B 115kV line in 2022 and 2027 summer case; following P6 outage of Inyokern-Kramer and Kramer-Randsburg-Inyokern 115kV lines in 2019 light load case.
• Potential mitigation: apply 2 hour emergency rating followed by congestion management.
Control
Inyokern
Kramer
Victor
To Silverpeak
Haiwee
Coso
Randsburg
To Rocket Test
To Lugo
LSPBLM
Borax MogenSungen
CoolwaterAbengoa
Calgen
Tortilla
High Desert Gen
To GaleSEGS 2
Inyo PST
Roadway
66 Kv or lower line & bus
115 kV line & bus
outage
Legend
voltage concerns
transformer
overload
230 kV line & bus
To Ivanpah
Oxbow B

NOL Low Voltage Concern• Control 115kV bus voltage
below 0.9 p.u. following Control 115kV west bus fault in 2022 summer peak case.
• Potential mitigation: adjust voltage schedules and curtail distribution load at Control if necessary.
Slide 9
Control
Inyokern
Kramer
Victor
To Silverpeak
Haiwee
Coso
Randsburg
To Rocket Test
To Lugo
LSPBLM
- Poole- Lundy
- BS Hydro- Casa Diblo- Rush
- Oxbow
Borax MogenSungen
CoolwaterAbengoa
Calgen
Tortilla
High Desert Gen
To GaleSEGS 2
Inyo PST
Roadway
66 Kv or lower line & bus
115 kV line & bus
outage
Legend
voltage concerns
overload
230 kV line & bus
To Ivanpah
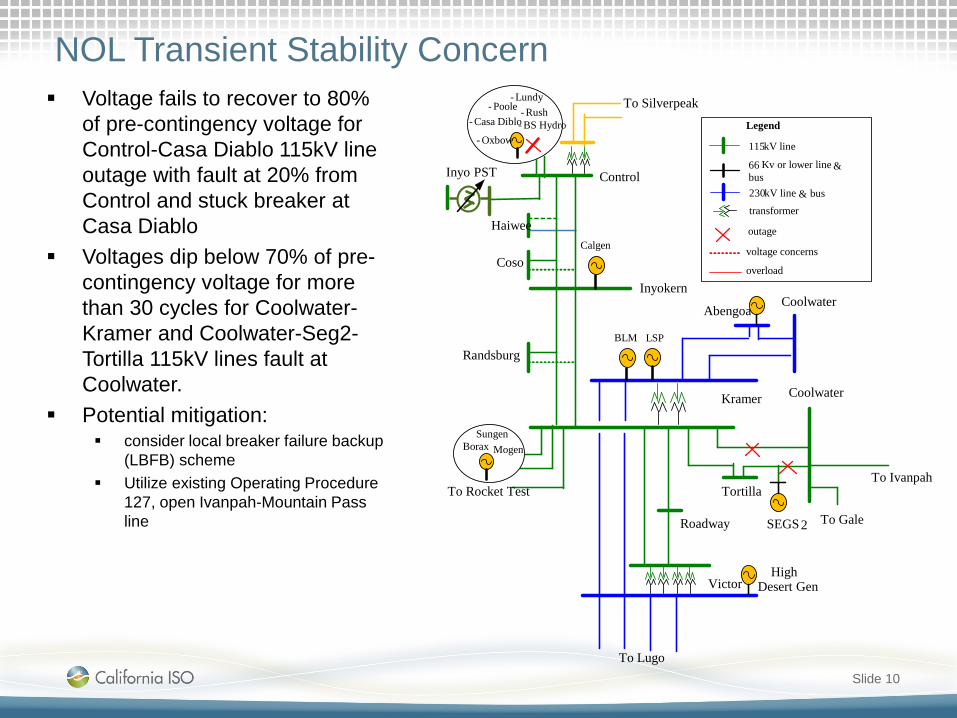
NOL Transient Stability Concern
Slide 10
Voltage fails to recover to 80% of pre-contingency voltage for Control-Casa Diablo 115kV line outage with fault at 20% from Control and stuck breaker at Casa Diablo
Voltages dip below 70% of pre-contingency voltage for more than 30 cycles for Coolwater-Kramer and Coolwater-Seg2-Tortilla 115kV lines fault at Coolwater.
Potential mitigation: consider local breaker failure backup
(LBFB) scheme Utilize existing Operating Procedure
127, open Ivanpah-Mountain Pass line
Control
Inyokern
Kramer
Victor
To Silverpeak
Haiwee
Coso
Randsburg
To Rocket Test
To Lugo
LSPBLM
- Poole- Lundy
- BS Hydro- Casa Diblo- Rush
- Oxbow
Borax MogenSungen
CoolwaterAbengoa
Calgen
Tortilla
High Desert Gen
To GaleSEGS 2
Inyo PST
Roadway
66 Kv or lower line & bus
115 kV line
outage
Legend
voltage concerns
transformer
overload
230 kV line & bus
To Ivanpah
Coolwater

Slide 11
Thank you

East of Lugo AreaPreliminary Reliability Assessment Results
Meng ZhangSenior Regional Transmission Engineer
2017-2018 Transmission Planning Process Stakeholder MeetingSeptember 21-22, 2017
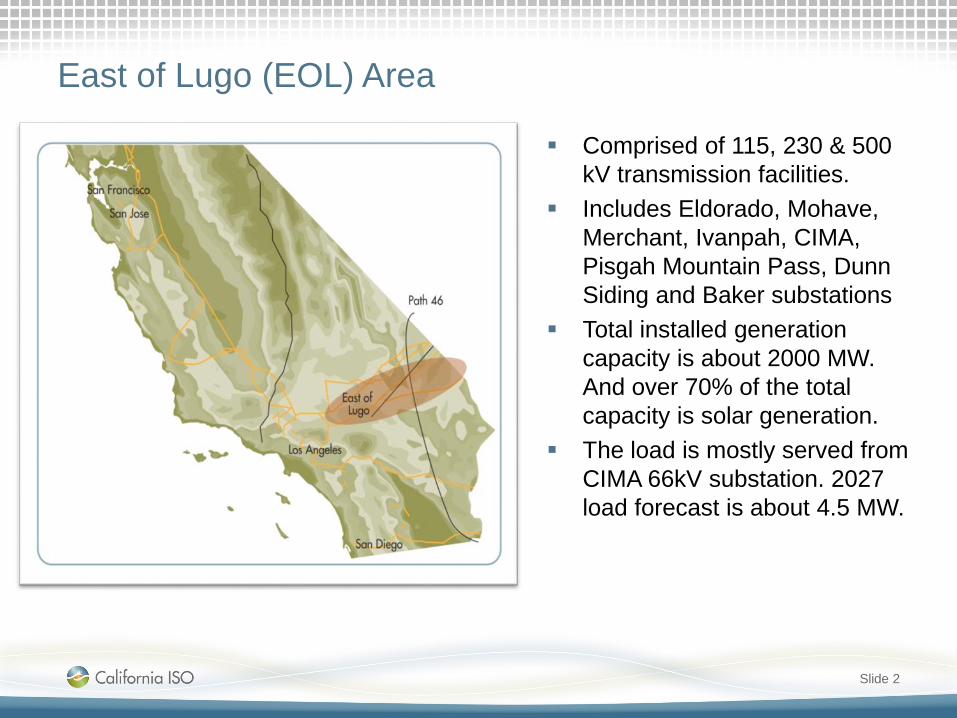
East of Lugo (EOL) Area
Comprised of 115, 230 & 500 kV transmission facilities.
Includes Eldorado, Mohave, Merchant, Ivanpah, CIMA, Pisgah Mountain Pass, Dunn Siding and Baker substations
Total installed generation capacity is about 2000 MW. And over 70% of the total capacity is solar generation.
The load is mostly served from CIMA 66kV substation. 2027 load forecast is about 4.5 MW.
Slide 2

EOL Study Scenarios• Base scenarios
• Sensitivity scenario
Slide 3
No. Case DescriptionB1 2019 Summer Peak
1-in-10 summer peak – hours between 16:00 and 18:00
B2 2022 Summer Peak
B3 2027 Summer Peak
B4 2019 Spring Light Load Minimum load condition – hours between 2:00-4:00
B5 2022 Spring Off-peak 50%~65% of peak loading condition –weekend morning
No. Case DescriptionS1 2022SP Heavy Renewables
& Min Gas Gen2022 summer peak with heavy renewable output and minimum gas generation commitment
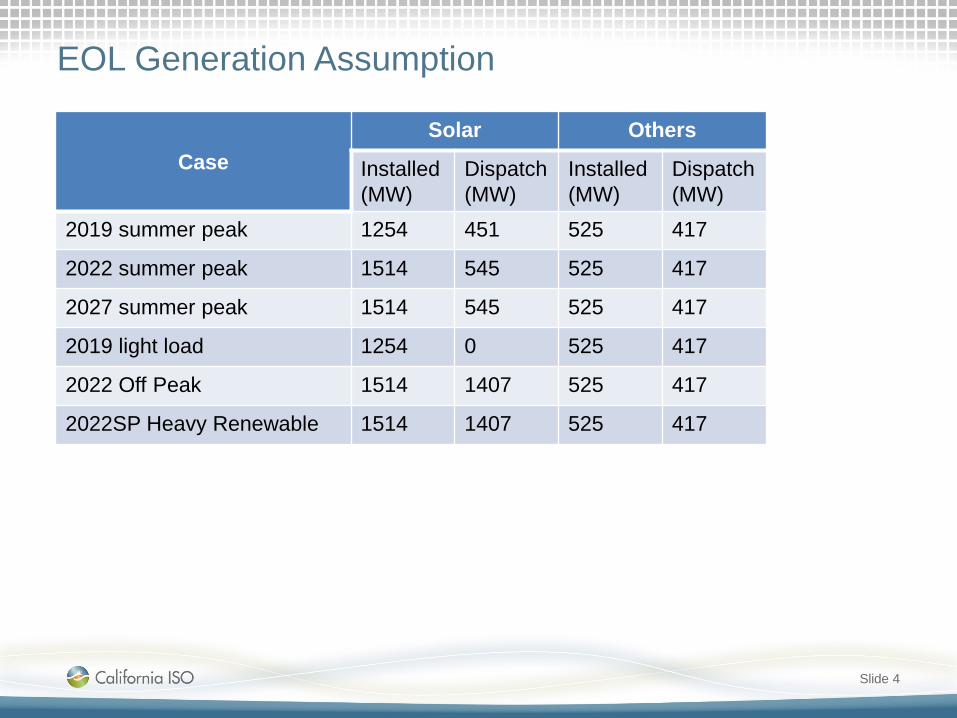
EOL Generation Assumption
CaseSolar Others
Installed(MW)
Dispatch(MW)
Installed(MW)
Dispatch(MW)
2019 summer peak 1254 451 525 417
2022 summer peak 1514 545 525 417
2027 summer peak 1514 545 525 417
2019 light load 1254 0 525 417
2022 Off Peak 1514 1407 525 417
2022SP Heavy Renewable 1514 1407 525 417
Slide 4

Previously Approved Transmission Projects
Slide 5
No. Transmission Projects First Year Modeled
Description
1 Eldorado-Lugo Series Capacitor Upgrade
2022 Upgrade the existing 500KV line series capacitors at Eldorado and Lugo on the Eldorado-Lugo 500KV line
2 Lugo-Mohave Series Capacitor Upgrade
2022 Upgrade the existing 500kV lines series capacitors at Mohave on the Lugo-Mohave 500kV line
3 Calcite 230kV Substation
2022 Construct new Calcite 230kV substation and loop into Lugo-Pisgah #1 230kV line
4 Lugo-Victorville 500kV Line Upgrade
2022 Upgrade terminal equipment and remove ground clearance limitations to achieve higher ratings.
EOL Area Assessment Summary
The assessment identified: 3 facilities overloads for category P6 outages in off-peak and sensitivity cases 2 potential system divergence for category P5 outages (fault plus relay failure to
operate)
Compared to last year’s results: Similar results due to similar load forecast and generation dispatch Most steady-state violations can be mitigated by the existing RAS and CAISO
approved transmission project in previous cycle Potential mitigation solution for the new identified issue is to install redundant relay.
Slide 6

EOL Thermal Overload Concerns
Slide 7
Ivanpah-Mountain Pass 115kV line is overserved to be overloaded in 2019, 2022 and 2027 summer peak cases following loss of both Ivanpah 230/115kV transformers.
Ivanpah 230/115 kV transformers Nos.1&2 are observed to be overloaded in 2022 off-peak and 2022 high renewable sensitivity cases for loss of Ivanpah-Mountain Pass and the other Ivanpah230/115kV transformer
Potential Mitigation Existing Ivanpah RAS Congestion management
MEAD (WAPA)
Pisgah
Pahrump
Coolwater
Merchant
Eldorado
500 kV
500 kV
CIMA
230 kV
Bob Tap(VEA)
IvanpahMtnPass
BakerDunn Siding
230 kV138 kV
McCullough(LADWP)
Moenkopi(ASP)
Eldorado (SCE)
230 kV115 kV
115 kV
230 kV
Mohave 500 kV
To Lugo
To Lugo
Primm
To Northwest (NVE)
To Kramer

Thank you

Valley Electric AreaPreliminary Reliability Assessment Results
Meng ZhangSenior Regional Transmission Engineer
2017-2018 Transmission Planning Process Stakeholder MeetingSeptember 21-22, 2017

Valley Electric Association (VEA) Area VEA system is comprised of 138
and 230 KV transmission facilities under ISO control
Gridliance West Transco is now the Transmission Owner for the 230 kV facilities in the VEA area
Connect to WAPA’s Mead 230kV substation, WAPA’s Amargosa 138kV substation, NV Energy’s Northwest 230kV substation and share buses at Jackass 138kV and Mercury 138kV stations
Approximately 15 MW of renewable generation is modeled.
Forecasted 1-in-10 summer peak loads for 2018, 2022 and 2027 are 141, 144 and 153 MW respectively.
Slide 2

VEA Study Scenarios• Base scenarios
• Sensitivity scenario
Slide 3
No. Case DescriptionS1 2022OP Renewable
Generation Addition2022 summer off-peak with heavy renewable output and minimum gas generation commitment

No. Transmission Projects First Year Modeled
Description
1 Bob 230kV SwitchingStation
2022 Build a new Bob 230kV Switching Station and loop into existing Pahrump-Mead 230kV Line
2 Eldorado-Bob 230kV Line
2022 New 230kV line between SCE’s Eldorado 220kV substation and VEA’s 230kV Bob switching station
3 Charleston-Vista 138kV Line
2022 New 138kV line between Charleston and Vista 138kV substations
Slide 4
Previously Approved Transmission Projects
VEA Assessment Summary
The assessment identified: Potential system divergence for category P6 outages 1 230kV bus with low voltage concerns for category P6 outage. Entire 138kV system experiencing high/low voltage concerns for
category P6 outages. Several 138kV lines overloaded for Category P1, P4, P6 and P7
outages in the sensitivity case Compared to last year results:
Very similar to last year’s results since the planned upgrades modeled in this year’s TPP base cases are the same as in last year’s
All the identified issues could be mitigated through existing UVLS, RAS in the VEA area or system adjustment after the first outage.
Slide 5

VEA Thermal and Voltage Violations
Slide 6
Low voltage at Pahrump 230kV bus following loss of Pahrump-Innovation and Pahrump-Mead 230kV lines in 2019 light load case Low voltages at Vista,
Charleston and Thousandaire138kV buses for loss of Gamebird-Thousandaire and Pahrump-Vista 138kV lines in 2019, 2022 and 2027 summer peak cases. Potential system diverge
following loss of Pahrump-Bob SS and Pahrump-Innovation 230kV lines or loss of Pahrump-Bob SS and Desert View-Northwest 230kV lines in 2022 and 2027 summer peak cases Potential Mitigation
• New Bob 230kV Switching Station • Exisiting UVLS and operation
switching after first outage.
Northwest (NVE)
MEAD (WAPA)
Pahrump
Vista
Valley Switch
Valley
Jackass
Lathrop Switch
Bond Tap
Beatty
Mercry Switch
RadarIS TapMercry
IND SPR
Snow MtnCanyonColdcreek
Bob
Amargosa (WAPA)
Gamebird
Charleston
Thousandaire
Sandy
Desert View
SCEEldorado
Innovation
French FlatTweezer
Valley NTS Stock
Wash
transformer
115/138 kV line & bus
230 kV line & bus
outage
bus voltage concern
Legend
boundary line
Johnie
Thank you

SDG&E Main SystemPreliminary Reliability Assessment Results
Frank ChenRegional Transmission Engineer Lead
2017-2018 Transmission Planning Process Stakeholder MeetingSeptember 21-22, 2017

SDG&E Main Transmission System
Covers San Diego, Imperial, and Southern Orange counties
Comprised of 500 kV and 230 kV transmission facilities
Net peak load of 4,555 MW with AAEE and BTM-PV load reduction in 2027
Generation: 6000 MW of installed capacity by 2019, of which a total of 1970 MW renewable generation is expected to be operational
A total of 1,563 MW BTM PV capacity and 401 MW of AAEE by 2027

Study Scenarios
Page 3
• Five Baseline Study Cases• Five Sensitivity Study Cases
B1-19SP B2-22SP B3-27SP B4-19LL B5-22OP S1-22SP HL-PS
S2-19SP PS
S3-27SP PS
S4-22SP HRPS
S5-22SP HNB
2019 Summer
Peak Load
2022 Summer
Peak Load
2027 Summer
Peak Load
2019 Spring
Light Load (35% of the peak
load)
2022 Spring
Off-Peak (65% of the peak
load)
High CEC Load
Forecast & Peak-Shift
Heavy Renewable
Output
Heavy NB Flow via the SONGS path
Study Scenario
Baseline Cases (CEC 1-in-10 mid demand forecast with low AAEE) Sensitivity Cases
Description CEC Peak-Shift

Load and Load Reduction Assumptions
Slide 4
B1-19SP B2-22SP B3-27SP B4-19LL B5-22OP S1-22SP HL-PS
S2-19SP PS
S3-27SP PS
S4-22SP HRPS
S5-22SP HNB
CEC Forecast Net Load (MW) 4753 4704 4555 1650 3031 5312 4960 5315
AAEE (MW)* -151 -241 -401 -53 -158 -241 -151 -401
BTM-PV Load Reduction (MW)* -327 -400 -574 0 -872 0 0 0
Demand Response (MW)** -64 -64 -64 0 0 -64 -64 -64
LTPP Track-4 EE (MW)** -22 -22 -22 -8 -15 -22 -22 -22
Gross Load (MW)* 5231 5345 5530 1703 4061 5553 5111 5716
** DR and LTPP Track-4 EE were modeled offline in starting cases
Baseline Cases Sensitivity Cases
Note: * Gross Load and load reduction of AAEE and DR were modeled in starting cases
Study Scenario
4704
5345
-241
-400
-64
-22
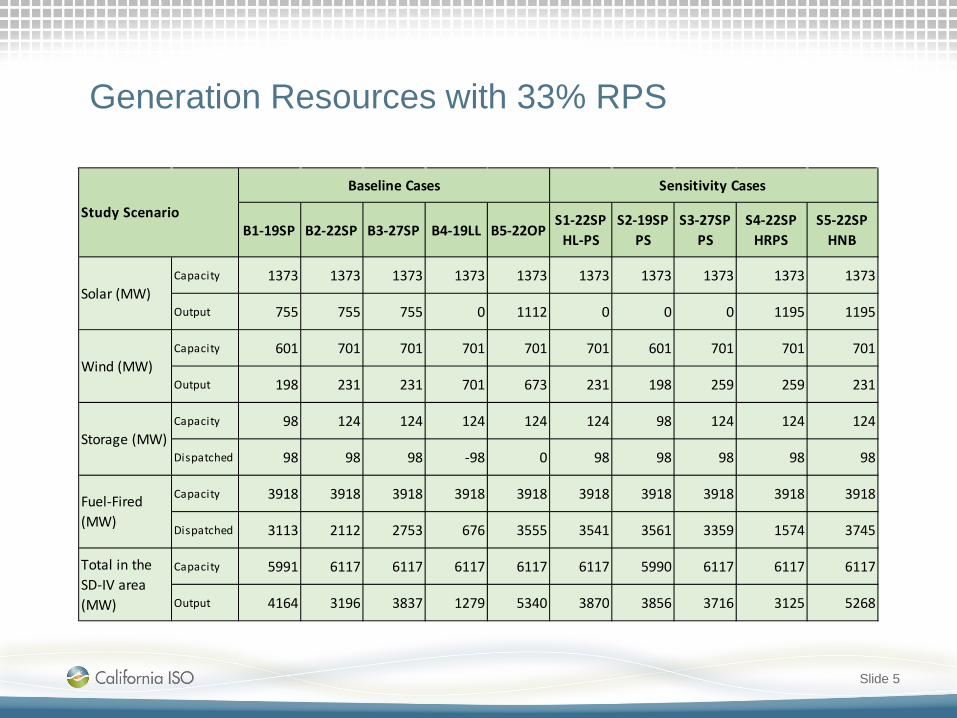
Generation Resources with 33% RPS
B1-19SP B2-22SP B3-27SP B4-19LL B5-22OPS1-22SP
HL-PSS2-19SP
PSS3-27SP
PSS4-22SP
HRPSS5-22SP
HNB
Capacity 1373 1373 1373 1373 1373 1373 1373 1373 1373 1373
Output 755 755 755 0 1112 0 0 0 1195 1195
Capacity 601 701 701 701 701 701 601 701 701 701
Output 198 231 231 701 673 231 198 259 259 231
Capacity 98 124 124 124 124 124 98 124 124 124
Dispatched 98 98 98 -98 0 98 98 98 98 98
Capacity 3918 3918 3918 3918 3918 3918 3918 3918 3918 3918
Dispatched 3113 2112 2753 676 3555 3541 3561 3359 1574 3745
Capacity 5991 6117 6117 6117 6117 6117 5990 6117 6117 6117
Output 4164 3196 3837 1279 5340 3870 3856 3716 3125 5268
Fuel-Fired (MW)
Total in the SD-IV area (MW)
Baseline Cases Sensitivity Cases
Study Scenario
Solar (MW)
Wind (MW)
Storage (MW)
Slide 5
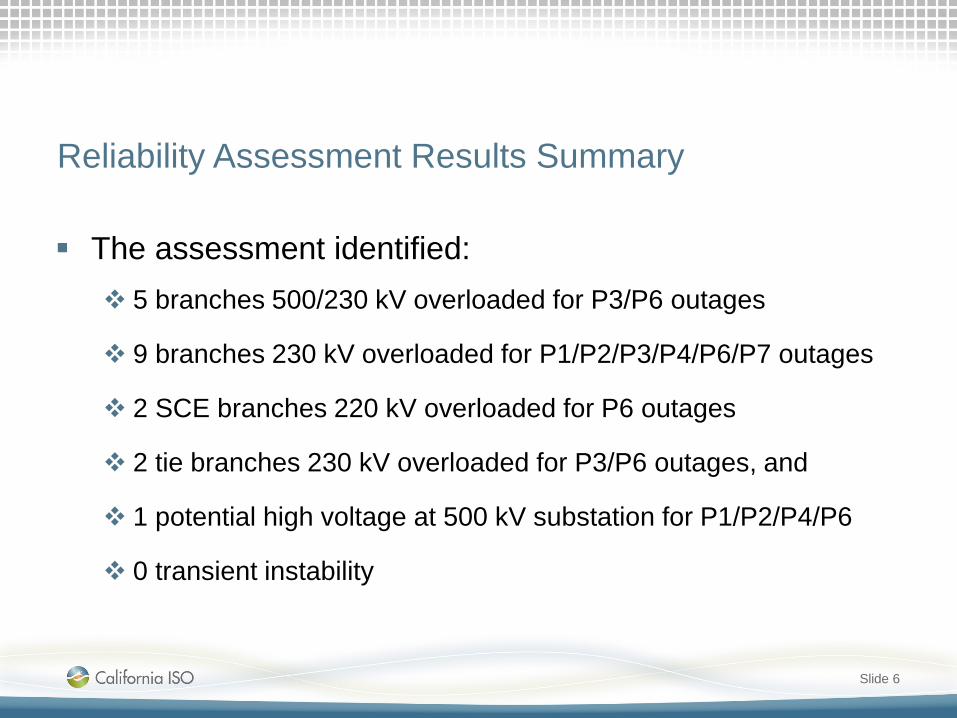
Reliability Assessment Results Summary
The assessment identified: 5 branches 500/230 kV overloaded for P3/P6 outages
9 branches 230 kV overloaded for P1/P2/P3/P4/P6/P7 outages
2 SCE branches 220 kV overloaded for P6 outages
2 tie branches 230 kV overloaded for P3/P6 outages, and
1 potential high voltage at 500 kV substation for P1/P2/P4/P6
0 transient instability
Slide 6

Reliability Assessment Results Summary - Cont'd
B1-19SP B2-22SP B3-27SP B4-19LL B5-22OP
No.01 San Luis Rey-SONGS 230 kV path Overload P2/P4/P6/P7
No.02 Encina-San Luis Rey 230 kV path Overload P1/P2/P4/P6/P7
No.03 Bay Blvd-Silvergate-OldTown 230 kV path Overload P6 P6 P4/P6
No.04 Miguel BK80 and BK81 Overload P6 P6 P6
No.05 Suncrest-Sycamore 230 kV path Overload P6 P6 P6
No.06 Suncrest BK80 and BK81 Overload P6 P6 P6
No.07 Suncrest 500 kV bus Voltage P1/P2/P4/P6 P1/P2/P4/P6 P1/P2/P4/P6 P1/P2/P4/P6 P1/P2/P4/P6
No.08 Imperial Valley BK80 Overload P6 P6 P6 P6
No.09 SCE's the Ellis south 220 kV corridor Overload P6
No.10 Otay Mesa-Tijuana 230 kV tie Overload P6 P6
No.11 Imperial Valley-El Centro 230 kV tie Overload P3/P6 P3/P6 P6
Baseline Cases
Reliability ConcernsType of Concern
Slide 7
A list of reliability concerns identified in the baseline scenarios

Reliability Assessment Results Summary - Cont'd
S1-22SP HL-PS S2-19SP PS S3-27SP PS S4-22SP HRPS S5-22SP HNB
No.01 San Luis Rey-SONGS 230 kV path Overload
No.02 Encina-San Luis Rey 230 kV path Overload P1/P2/P4/P6
No.03 Bay Blvd-Silvergate-OldTown 230 kV path Overload P6 P6 P6
No.04 Miguel BK80 and BK81 Overload P6 P6 P6 P6 P6
No.05 Suncrest-Sycamore 230 kV path Overload P6 P6 P6 P6 P6
No.06 Suncrest BK80 and BK81 Overload P6 P6 P6 P6 P6
No.07 Suncrest 500 kV bus Voltage P1/P2/P4/P6 P1/P2/P4/P6 P1/P2/P4/P6 P1/P2/P4/P6 P1/P2/P4/P6
No.08 Imperial Valley BK80 Overload P6 P6 P6 P6 P6
No.09 SCE's the Ellis south 220 kV corridor Overload P6 P6 P6
No.10 Otay Mesa-Tijuana 230 kV tie Overload P6 P6
No.11 Imperial Valley-El Centro 230 kV tie Overload P3/P6 P3/P6 P3 P3/P6
Sensitivity Cases
Reliability ConcernsType of Concern
Slide 8
A list of reliability concerns identified in the sensitivity scenarios, which will be reviewed case-by-case
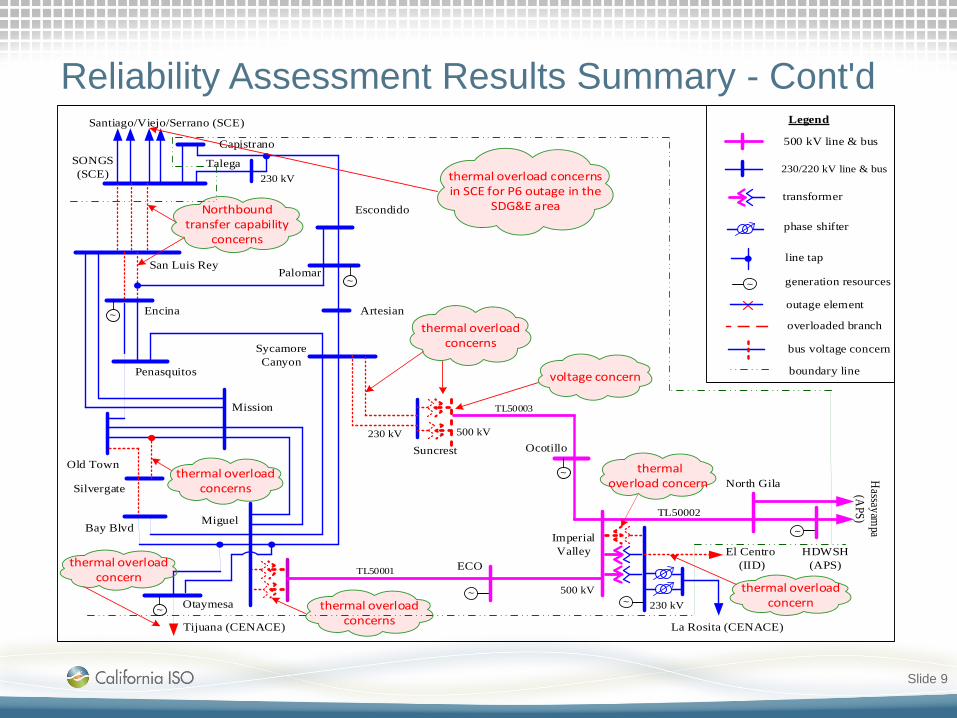
Reliability Assessment Results Summary - Cont'd
Slide 9
Suncrest
Imperial Valley
Sycamore Canyon
Mission
Otaymesa
Miguel
Ocotillo
ECO
SONGS (SCE)
San Luis Rey
Talega
Penasquitos
Old Town
Encina
Palomar
Silvergate
Escondido
Tijuana (CENACE) La Rosita (CENACE)
El Centro (IID)
HDWSH(APS)
Santiago/Viejo/Serrano (SCE)
230 kV
230 kV
500 kV
500 kV
Capistrano
TL50001
TL50003
TL50002
North Gila Hassayam
pa(A
PS)
230 kV
~
Bay Blvd ~transformer
230/220 kV line & bus
500 kV line & bus
outage element
overloaded branch
bus voltage concern
Legend
line tap
phase shifter
boundary line
generation resources ~
~
~
~~
~
Artesian
Northbound transfer capability
concerns
thermal overload concerns
thermal overload concerns
thermal overload concerns
thermal overload concern
thermal overload concern
thermal overload concern
voltage concern
thermal overload concerns in SCE for P6 outage in the
SDG&E area

Reliability Assessment Results Summary - Cont'd
Compared to last year results: The Encina-San Luis Rey 230 kV overloads become more
severe due to scope change of the SX-PQ project
The need for previously approved Mission-Penasquitos project
was not identified due to scope change of the SX-PQ project
The CEC peak-shift load forecast was investigated as sensitivity
scenario
Slide 10

Potential Mitigation Solutions Summary
rely on operation procedure (OP)
implement special protection system (SPS) as needed
depend on short-time emergency rating if feasible
suggest favored areas to procure preferred resources & energy storage
develop cost-effective solutions as needed in the Encina-San Luis Rey 230/69 kV and the southern systems, such as system reconfiguration, reconductor, line compensation, and/or installation of flow controller
develop 30-minute emergency rating for Suncrest 500/230 kV banks
coordinate control schemes of the reactive power facilities at Suncrest
Slide 11
Detailed Discussions on the Identified Reliability Concerns and
Potential Mitigation Solutions
Slide 12
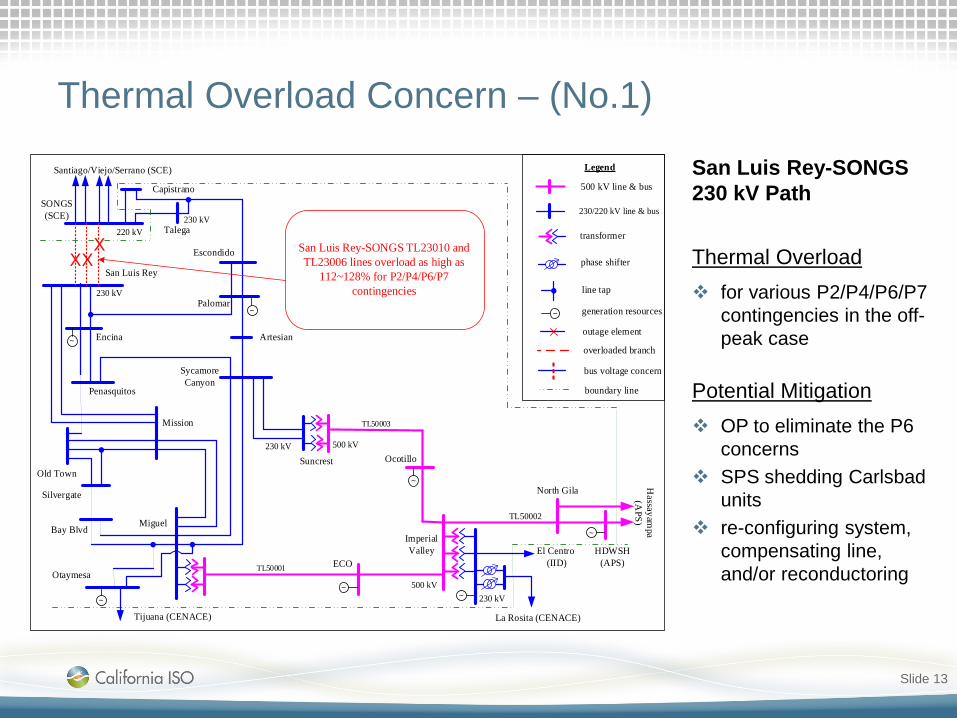
Thermal Overload Concern – (No.1)
Slide 13
San Luis Rey-SONGS 230 kV Path
Thermal Overload for various P2/P4/P6/P7
contingencies in the off-peak case
Potential Mitigation OP to eliminate the P6
concerns SPS shedding Carlsbad
units re-configuring system,
compensating line, and/or reconductoring
Suncrest
Imperial Valley
Sycamore Canyon
Mission
Otaymesa
Miguel
Ocotillo
ECO
SONGS (SCE)
San Luis Rey
Talega
Penasquitos
Old Town
Encina
Palomar
Silvergate
Escondido
Tijuana (CENACE) La Rosita (CENACE)
El Centro (IID)
HDWSH(APS)
Santiago/Viejo/Serrano (SCE)
230 kV
230 kV
500 kV
220 kV
500 kV
Capistrano
TL50001
TL50003
TL50002
North Gila Hassayam
pa(A
PS)
230 kV
230 kV
~
Bay Blvd ~
transformer
230/220 kV line & bus
500 kV line & bus
outage element
overloaded branch
bus voltage concern
Legend
line tap
phase shifter
boundary line
generation resources ~
~
~~ ~
~
Artesian
San Luis Rey-SONGS TL23010 and TL23006 lines overload as high as
112~128% for P2/P4/P6/P7 contingencies
XXX

Thermal Overload Concern – (No.2)
Slide 14
Encina-San Luis Rey 230 kV Path
Thermal Overload for various
P1/P2/P4/P6/P7 contingencies in the off-peak case
Potential Mitigation OP to eliminate the P6
concerns SPS shedding Carlsbad
units reconfiguring system,
compensating line, and/or reconductoring
Suncrest
Imperial Valley
Sycamore Canyon
Mission
Otaymesa
Miguel
Ocotillo
ECO
SONGS (SCE)
San Luis Rey
Talega
Penasquitos
Old Town
Encina
Palomar
Silvergate
Escondido
Tijuana (CENACE) La Rosita (CENACE)
El Centro (IID)
HDWSH(APS)
Santiago/Viejo/Serrano (SCE)
230 kV
230 kV
500 kV
220 kV
500 kV
Capistrano
TL50001
TL50003
TL50002
North Gila Hassayam
pa(A
PS)
230 kV
230 kV
~
Bay Blvd ~
transformer
230/220 kV line & bus
500 kV line & bus
outage element
overloaded branch
bus voltage concern
Legend
line tap
phase shifter
boundary line
generation resources ~
~
~~ ~
~
Artesian
Encina-San Luis Rey Line and Encina-San Luis Rey-Palomar 3-terminal Line overload as high as 113% and 127% for
P1/P2/P4/P7 events, and as high as 155% and 170% for various P6 events
X
X
X
X
X
X

Thermal Overload Concern – (No.3)
Slide 15
Old Town-Silvergate-Bay Blvd 230 kV path
Thermal Overload for P2/P4/P6
contingencies (2019)
Potential Mitigation Procure PR and ES
up to 160 MW in the north coast
OP to eliminate the P6 concerns
reconfiguring system, reconductoring, compensating line, and/or installing power flow controller
Suncrest
Imperial Valley
Sycamore Canyon
Mission
Otaymesa
Miguel
Ocotillo
ECO
SONGS (SCE)
San Luis Rey
Talega
Penasquitos
Old Town
Encina
Palomar
Silvergate
Escondido
Tijuana (CENACE) La Rosita (CENACE)
El Centro (IID)
HDWSH(APS)
Santiago/Viejo/Serrano (SCE)
230 kV
230 kV
500 kV
220 kV
500 kV
Capistrano
TL50001
TL50003
TL50002
North Gila Hassayam
pa(A
PS)
230 kV
230 kV
~
Bay Blvd ~
transformer
230/220 kV line & bus
500 kV line & bus
outage element
overloaded branch
bus voltage concern
Legend
line tap
phase shifter
boundary line
generation resources ~
~
~~ ~
~
Artesian
Silvergate-Old Town and Silvergate-OldTownTap 230 kV lines overload as high as 128% for P2/P4/P6/P7 events, and Bay Blvd-Silvergate 230 kV line
overloads as high as 107% for a couple of P6 contingencies
X
XX
X
X
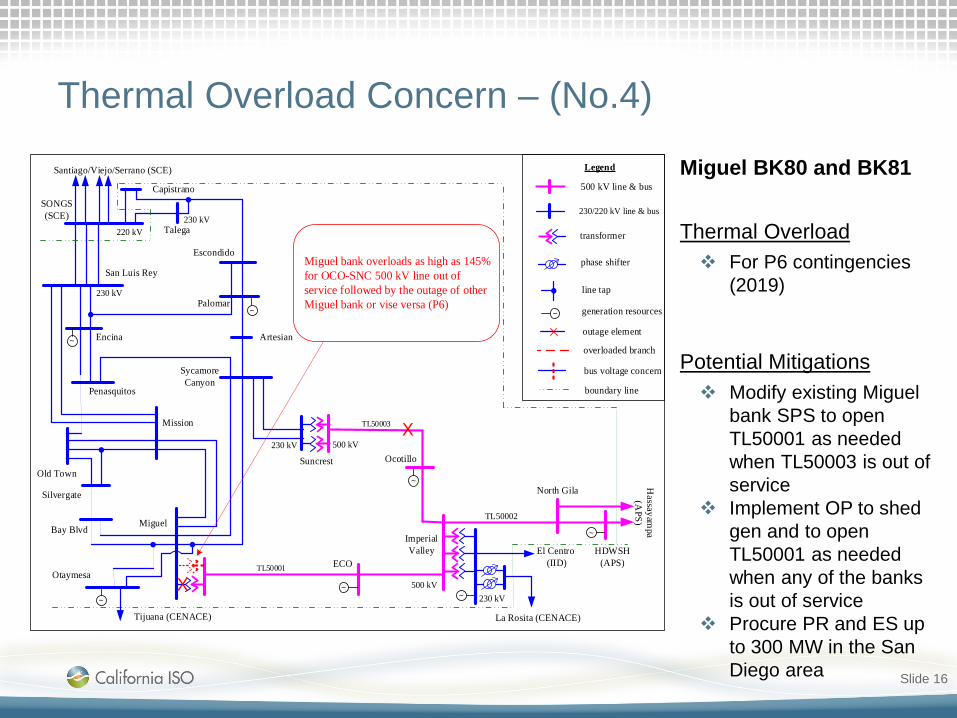
Thermal Overload Concern – (No.4)
Slide 16
Miguel BK80 and BK81
Thermal Overload For P6 contingencies
(2019)
Potential Mitigations Modify existing Miguel
bank SPS to open TL50001 as needed when TL50003 is out of service
Implement OP to shed gen and to open TL50001 as needed when any of the banks is out of service
Procure PR and ES up to 300 MW in the San Diego area
Suncrest
Imperial Valley
Sycamore Canyon
Mission
Otaymesa
Miguel
Ocotillo
ECO
SONGS (SCE)
San Luis Rey
Talega
Penasquitos
Old Town
Encina
Palomar
Silvergate
Escondido
Tijuana (CENACE) La Rosita (CENACE)
El Centro (IID)
HDWSH(APS)
Santiago/Viejo/Serrano (SCE)
230 kV
230 kV
500 kV
220 kV
500 kV
Capistrano
TL50001
TL50003
TL50002
North Gila Hassayam
pa(A
PS)
230 kV
230 kV
~
Bay Blvd ~
transformer
230/220 kV line & bus
500 kV line & bus
outage element
overloaded branch
bus voltage concern
Legend
line tap
phase shifter
boundary line
generation resources ~
~
~~ ~
~
Artesian
Miguel bank overloads as high as 145% for OCO-SNC 500 kV line out of service followed by the outage of other Miguel bank or vise versa (P6)
X
X

Thermal Overload Concern – (No.5)
Slide 17
Sycamore-Suncrest 230 kV lines
Thermal Overload for P6 contingencies
(2019)
Potential Mitigation Add SPS to shed gen and
to open TL50003 as needed when TL50001 is out of service first
Implement OP to shed gen and to open TL50003 as needed when any of the 230 kV lines is out of service first
Procure PR and ES up to 500 MW in San Diego
Upgrade the 230 kV system
Suncrest
Imperial Valley
Sycamore Canyon
Mission
Otaymesa
Miguel
Ocotillo
ECO
SONGS (SCE)
San Luis Rey
Talega
Penasquitos
Old Town
Encina
Palomar
Silvergate
Escondido
Tijuana (CENACE) La Rosita (CENACE)
El Centro (IID)
HDWSH(APS)
Santiago/Viejo/Serrano (SCE)
230 kV
230 kV
500 kV
220 kV
500 kV
Capistrano
TL50001
TL50003
TL50002
North Gila Hassayam
pa(A
PS)
230 kV
230 kV
~
Bay Blvd ~
transformer
230/220 kV line & bus
500 kV line & bus
outage element
overloaded branch
bus voltage concern
Legend
line tap
phase shifter
boundary line
generation resources ~
~
~~ ~
~
Artesian
Suncrest-Sycamore 230 kV line overloads as high as 184 % for ECO-Miguel 500 kV line out of service followed by the outage of other Suncrest-Sycamore 230 kV line or vise versa (P6)
X
X
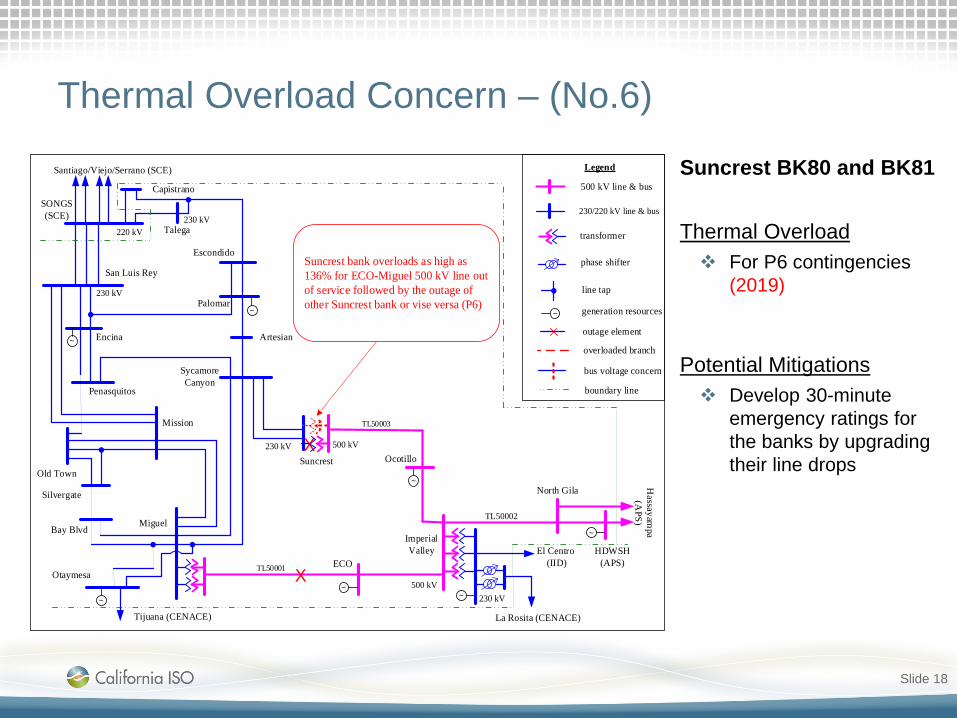
Thermal Overload Concern – (No.6)
Slide 18
Suncrest BK80 and BK81
Thermal Overload For P6 contingencies
(2019)
Potential Mitigations Develop 30-minute
emergency ratings for the banks by upgrading their line dropsSuncrest
Imperial Valley
Sycamore Canyon
Mission
Otaymesa
Miguel
Ocotillo
ECO
SONGS (SCE)
San Luis Rey
Talega
Penasquitos
Old Town
Encina
Palomar
Silvergate
Escondido
Tijuana (CENACE) La Rosita (CENACE)
El Centro (IID)
HDWSH(APS)
Santiago/Viejo/Serrano (SCE)
230 kV
230 kV
500 kV
220 kV
500 kV
Capistrano
TL50001
TL50003
TL50002
North Gila Hassayam
pa(A
PS)
230 kV
230 kV
~
Bay Blvd ~
transformer
230/220 kV line & bus
500 kV line & bus
outage element
overloaded branch
bus voltage concern
Legend
line tap
phase shifter
boundary line
generation resources ~
~
~~ ~
~
Artesian
Suncrest bank overloads as high as 136% for ECO-Miguel 500 kV line out of service followed by the outage of other Suncrest bank or vise versa (P6)
X
X

Voltage Concern – (No.7)
Slide 19
Suncrest 500 kV Bus
Potential High Voltage for P1/P2/P4/P6
contingencies if the reactive power facilities are not well coordinated
Potential Mitigation implement a
coordinated control scheme of the reactive power facilities
Suncrest
Imperial Valley
Sycamore Canyon
Mission
Otaymesa
Miguel
Ocotillo
ECO
SONGS (SCE)
San Luis Rey
Talega
Penasquitos
Old Town
Encina
Palomar
Silvergate
Escondido
Tijuana (CENACE) La Rosita (CENACE)
El Centro (IID)
HDWSH(APS)
Santiago/Viejo/Serrano (SCE)
230 kV
230 kV
500 kV
220 kV
500 kV
Capistrano
TL50001
TL50003
TL50002
North Gila Hassayam
pa(A
PS)
230 kV
230 kV
~
Bay Blvd ~
transformer
230/220 kV line & bus
500 kV line & bus
outage element
overloaded branch
bus voltage concern
Legend
line tap
phase shifter
boundary line
generation resources ~
~
~~ ~
~
Artesian
X
Suncrest 500 kV bus voltage might go beyond 1.05 pu or even 1.10 pu of
its nominal voltage 525 kV for P1/P2/P4/P6 outages without
coordination of reactive power support facilities
Suncrest SVC

Thermal Overload Concern – (No.8)
Slide 20
Suncrest
Imperial Valley
Sycamore Canyon
Mission
Otaymesa
Miguel
Ocotillo
ECO
SONGS (SCE)
San Luis Rey
Talega
Penasquitos
Old Town
Encina
Palomar
Silvergate
Escondido
Tijuana (CENACE) La Rosita (CENACE)
El Centro (IID)
HDWSH(APS)
Santiago/Viejo/Serrano (SCE)
230 kV
230 kV
500 kV
220 kV
500 kV
Capistrano
TL50001
TL50003
TL50002
North Gila Hassayam
pa(A
PS)
230 kV
230 kV
~
Bay Blvd ~
transformer
230/220 kV line & bus
500 kV line & bus
outage element
overloaded branch
bus voltage concern
Legend
line tap
phase shifter
boundary line
generation resources ~
~
~~ ~
~
Artesian
IV BK80 overloads as high as 242% for the loss of outage of both IV BK81 and BK82 (P6)
XX
Imperial Valley BK80
Thermal Overload For P6 contingency (T-
1-1)
Potential Mitigation Maintenance program to
upgrade added and non-standard IV BK80 and modify existing IV BK80 SPS accordingly

Thermal Overload - (No.9)
Slide 21
SCE’s Ellis-Johanna and Ellis-Santiago 220 kV lines
Thermal Overload for P3 contingencies
Potential Mitigation rely on the ISO market
congestion management and operation procedure
Procure PR and ES up to 250 MW in San Diego and Orange counties
Upgrade the Ellis 220 kV south corridor
Suncrest
Imperial Valley
Sycamore
Mission
Otaymesa
South Bay
Miguel
Ocotillo
ECO
SONGS (SCE)
San Luis Rey
Talega
Penasquitos
Oldtown
Encina
Palomar
Silvergate
Escondido
Tijuana (CENACE) La Rosita (CENACE)
IIDAPS
230 kV
230 kV
230 kV
525 kV
220 kV
525 kV
525 kV
Capistrano
~
~TDM Plant
TL50001 TL50004
TL50003
TL50005TL50002
North Gila
~
Serrano (SCE)
Santiago (SCE)
Viejo (SCE)Johanna
Villa Park
Barre
Huntington Beach
Chino (SCE)
Ellis
Lewis
220 kV
525 kV
230 kV
230 kV
Del Amo
Alamitos
SCE’s Ellis-Johanna and Ellis-Santiago 220 kV lines overload as
high as 102% and 107% for various overlapping outages (P6)
X
X
transformer
230/220 kV line&bus
525 kV line & bus
outage element
overloaded line
bus voltage concern
Legend
boundary line
line tap
phase shifter
alt. outage elementX
Artesian
X
X
X
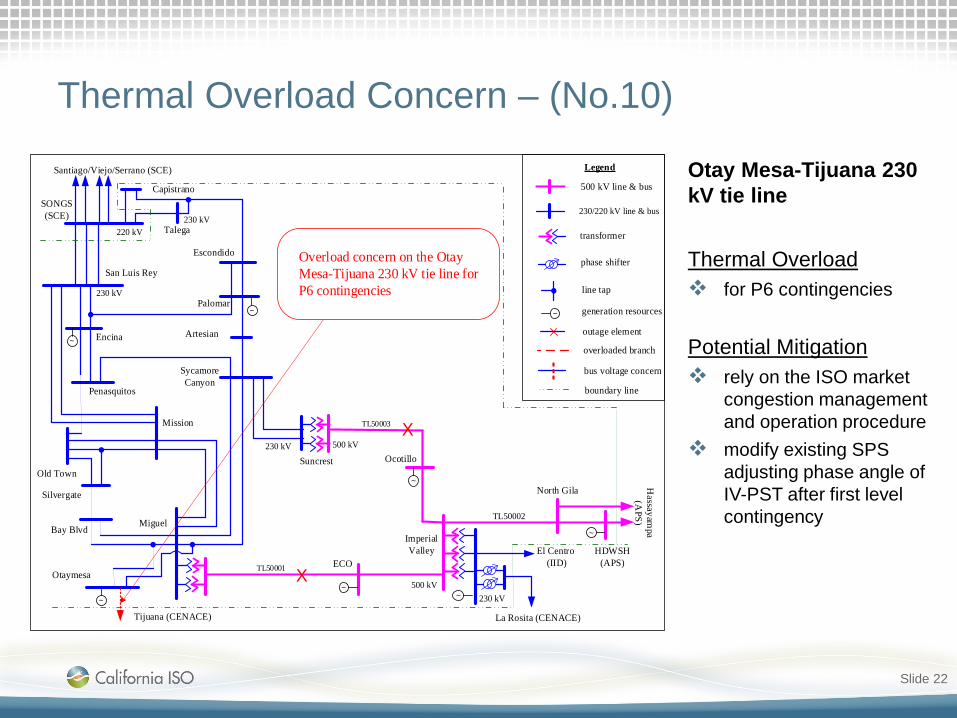
Thermal Overload Concern – (No.10)
Slide 22
Otay Mesa-Tijuana 230 kV tie line
Thermal Overload for P6 contingencies
Potential Mitigation rely on the ISO market
congestion management and operation procedure
modify existing SPS adjusting phase angle of IV-PST after first level contingency
Suncrest
Imperial Valley
Sycamore Canyon
Mission
Otaymesa
Miguel
Ocotillo
ECO
SONGS (SCE)
San Luis Rey
Talega
Penasquitos
Old Town
Encina
Palomar
Silvergate
Escondido
Tijuana (CENACE) La Rosita (CENACE)
El Centro (IID)
HDWSH(APS)
Santiago/Viejo/Serrano (SCE)
230 kV
230 kV
500 kV
220 kV
500 kV
Capistrano
TL50001
TL50003
TL50002
North Gila Hassayam
pa(A
PS)
230 kV
230 kV
~
Bay Blvd ~
transformer
230/220 kV line & bus
500 kV line & bus
outage element
overloaded branch
bus voltage concern
Legend
line tap
phase shifter
boundary line
generation resources ~
~
~~ ~
~
Artesian
Overload concern on the Otay Mesa-Tijuana 230 kV tie line for P6 contingencies
X
X

Thermal Overload Concern – (No.11)
Slide 23
Suncrest
Imperial Valley
Sycamore Canyon
Mission
Otaymesa
Miguel
Ocotillo
ECO
SONGS (SCE)
San Luis Rey
Talega
Penasquitos
Old Town
Encina
Palomar
Silvergate
Escondido
Tijuana (CENACE) La Rosita (CENACE)
El Centro (IID)
HDWSH(APS)
Santiago/Viejo/Serrano (SCE)
230 kV
230 kV
500 kV
220 kV
500 kV
Capistrano
TL50001
TL50003
TL50002
North Gila Hassayam
pa(A
PS)
230 kV
230 kV
~
Bay Blvd ~
transformer
230/220 kV line & bus
500 kV line & bus
outage element
overloaded branch
bus voltage concern
Legend
line tap
phase shifter
boundary line
generation resources ~
~
~~ ~
~
Artesian
Overload concern on the Imperial Valley-El Centro 230 kV tie line for the TDM power plant outage followed by the N.Gila-IV 500 kV line outage (P3)
X
X
Imperial Valley-El Centro 230 kV tie line
Thermal Overload for P3 contingencies
Potential Mitigation rely on the ISO market
congestion management and operation procedure
San Diego Gas & Electric Area Sub-TransmissionPreliminary Reliability Assessment Results
Charles CheungSenior Regional Transmission Engineer
2017-2018 Transmission Planning Process Stakeholder MeetingSeptember 21-22, 2017
Study Scenarios
5 Baseline Scenarios: 2019 Summer Peak 2022 Summer Peak 2027 Summer Peak 2019 Spring Light Load 2022 Spring Off-Peak
3 Sensitivity Scenarios: 2019 Summer Peak with CEC peak-shift 2022 Summer Peak with high CEC forecasted load and peak
shift 2027 Summer Peak with CEC peak-shift
Slide 2

SDG&E Area Sub-Transmission Assessment Summary The assessment identified:
Thermal overloads due to Category P2.1 – 2, P3 – 4, P4 – 6, P6 – 43 and P7 – 9
Compared to last year results: More thermal violations in the Peak Shift scenarios
Slide 3

SDG&E Area Sub-Transmission Mitigation
Potential Mitigation Solutions: Network upgrades to address sub-transmission Category P1,
P2.1, P6, and P7 issues
Operation Procedure, SPS
Slide 4
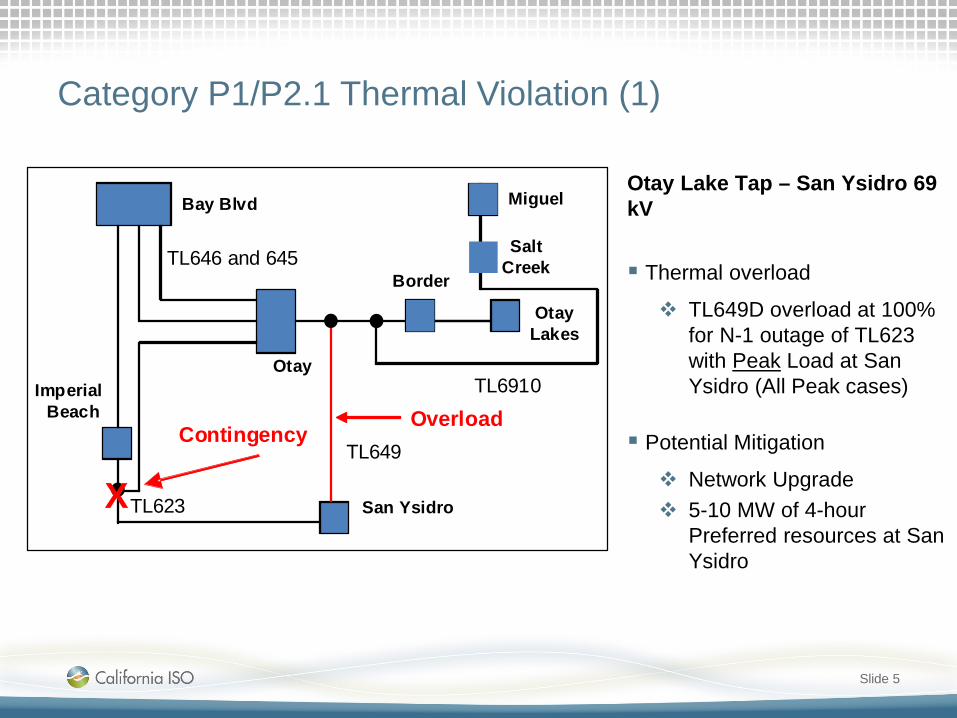
Category P1/P2.1 Thermal Violation (1)
Slide 5
Otay Lake Tap – San Ysidro 69 kV
Thermal overload
TL649D overload at 100% for N-1 outage of TL623 with Peak Load at San Ysidro (All Peak cases)
Potential Mitigation
Network Upgrade 5-10 MW of 4-hour
Preferred resources at San Ysidro
Miguel
Otay Lakes
Border
San Ysidro
OtayImperial
Beach
Bay Blvd
ContingencyOverload
TL646 and 645
TL623
TL649
TL6910
Salt Creek
X
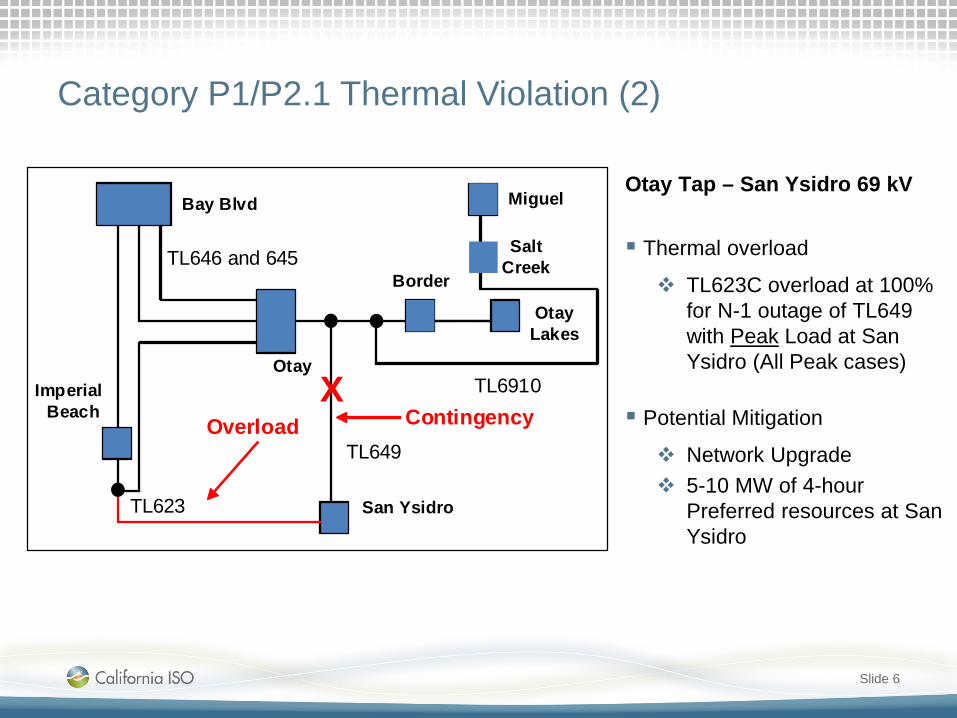
Category P1/P2.1 Thermal Violation (2)
Slide 6
Otay Tap – San Ysidro 69 kV
Thermal overload
TL623C overload at 100% for N-1 outage of TL649 with Peak Load at San Ysidro (All Peak cases)
Potential Mitigation
Network Upgrade 5-10 MW of 4-hour
Preferred resources at San Ysidro
Miguel
Otay Lakes
Border
San Ysidro
OtayImperial
Beach
Bay Blvd
ContingencyOverload
TL646 and 645
TL623
TL649
TL6910
Salt Creek
X
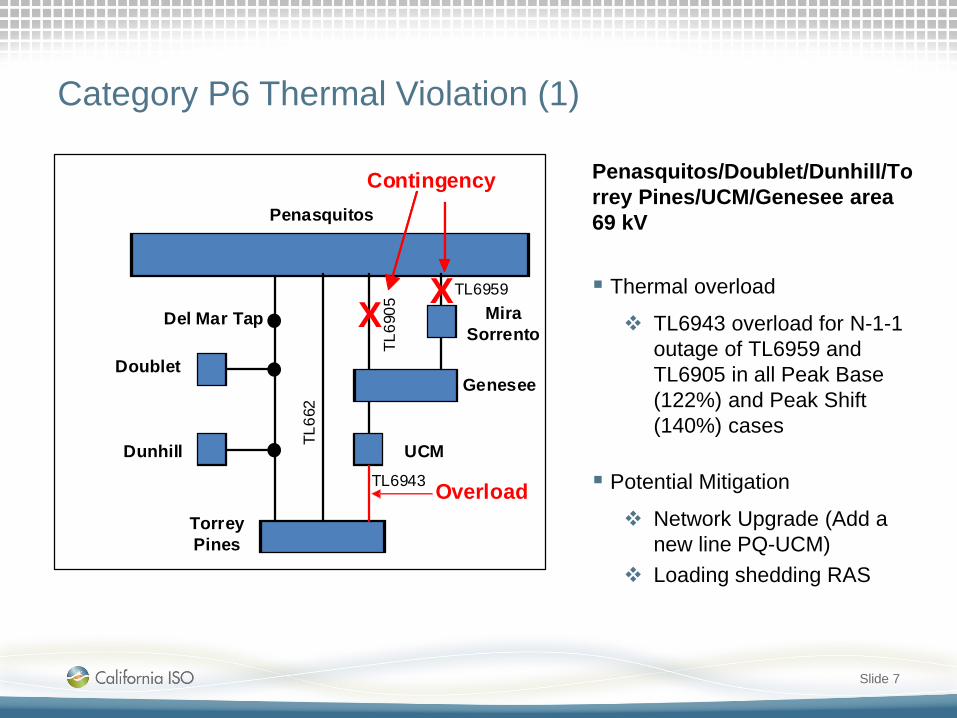
Category P6 Thermal Violation (1)
Slide 7
Penasquitos/Doublet/Dunhill/Torrey Pines/UCM/Genesee area 69 kV
Thermal overload
TL6943 overload for N-1-1 outage of TL6959 and TL6905 in all Peak Base (122%) and Peak Shift (140%) cases
Potential Mitigation
Network Upgrade (Add a new line PQ-UCM)
Loading shedding RAS
Doublet
Penasquitos
Dunhill
Torrey Pines
UCM
Genesee
Mira Sorrento
XX
Contingency
Overload
TL69
05
TL66
2Del Mar Tap
TL6959
TL6943
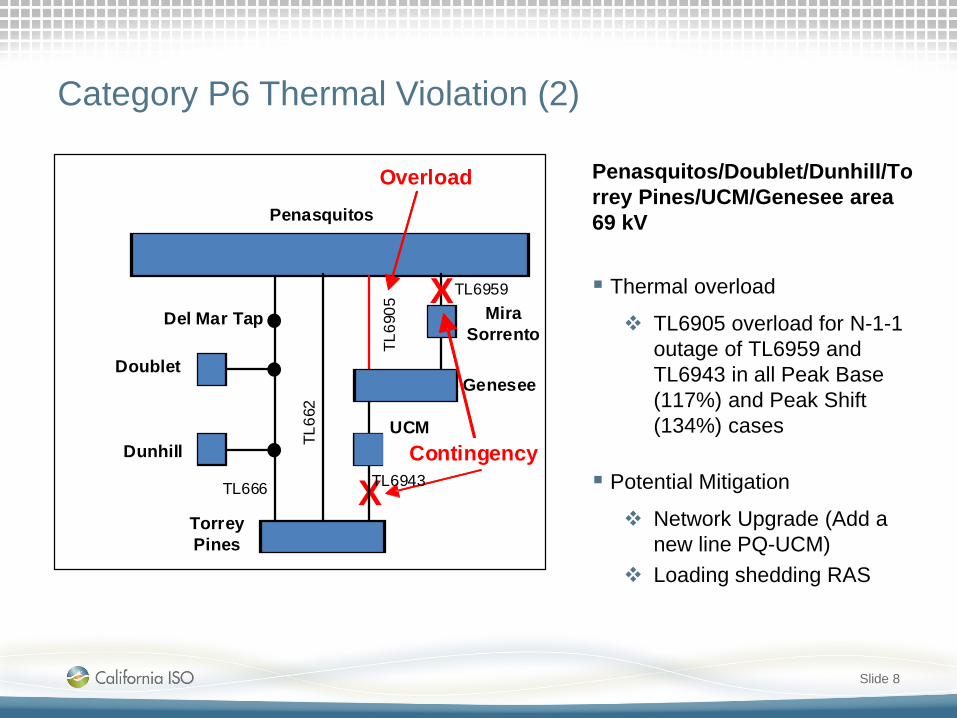
Category P6 Thermal Violation (2)
Slide 8
Penasquitos/Doublet/Dunhill/Torrey Pines/UCM/Genesee area 69 kV
Thermal overload
TL6905 overload for N-1-1 outage of TL6959 and TL6943 in all Peak Base (117%) and Peak Shift (134%) cases
Potential Mitigation
Network Upgrade (Add a new line PQ-UCM)
Loading shedding RAS
Doublet
Penasquitos
Dunhill
Torrey Pines
UCM
Genesee
Mira Sorrento
X
XContingency
Overload
TL69
05
TL66
2Del Mar Tap
TL6959
TL6943TL666

Category P6 Thermal Violation (3)
Slide 9
Penasquitos/Doublet/Dunhill/Torrey Pines/UCM/Genesee area 69 kV
Thermal overload
TL6959 overload for N-1-1 outage of TL6905 and TL6943 in all Peak Base (116%) and Peak Shift (133%) cases, TL665 overload for 2022 (109%) and 2027 (110%) Peak Shift cases
Potential Mitigation
Network Upgrade (Add a new line PQ-UCM)
Loading shedding RAS
Doublet
Penasquitos
Dunhill
Torrey Pines
UCM
Genesee
Mira SorrentoX
XContingency
Overload
TL69
05
TL66
2Del Mar Tap
TL6959
TL6943
TL665
TL666

Category P6 Thermal Violation (4)
Slide 10
Penasquitos/Doublet/Dunhill/Torrey Pines/UCM/Genesee area 69 kV
Thermal overload
TL666A, TL666B, TL666C, and TL666G overload for N-1-1 outage of TL6995 and TL662 in All Peak Shift cases (114%)
Potential Mitigation
Network Upgrade (Add a new line PQ-UCM)
Loading shedding RAS
Doublet
Penasquitos
Dunhill
Torrey Pines
UCM
Mira Sorrento
X
X
Contingency
TL69
05
TL66
2Del Mar Tap
TL6959
TL6943
GeneseeOverload
TL666

Category P6 Thermal Violation (5)
Slide 11
Penasquitos/Doublet/Dunhill/Torrey Pines/UCM/Genesee area 69 kV
Thermal overload
TL6907 overload for N-1-1 outage of TL666 and TL662 in 2022 and 2027 Peak Shift cases (108%)
Potential Mitigation
Network Upgrade (Add a new line PQ-UCM)
Loading shedding RAS
Doublet
Penasquitos
Dunhill
Torrey Pines
UCM
Mira Sorrento
XXContingency
TL69
05
TL66
2Del Mar Tap
TL6959
TL6943
Genesee
OverloadTL666
TL6907
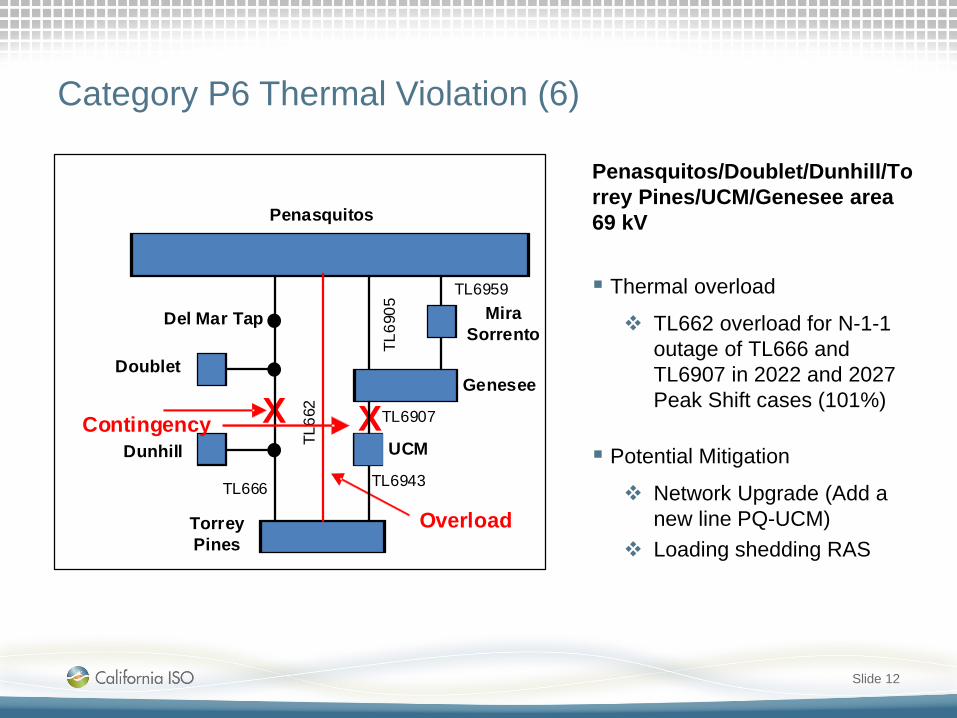
Category P6 Thermal Violation (6)
Slide 12
Penasquitos/Doublet/Dunhill/Torrey Pines/UCM/Genesee area 69 kV
Thermal overload
TL662 overload for N-1-1 outage of TL666 and TL6907 in 2022 and 2027 Peak Shift cases (101%)
Potential Mitigation
Network Upgrade (Add a new line PQ-UCM)
Loading shedding RAS
Doublet
Penasquitos
Dunhill
Torrey Pines
UCM
Mira Sorrento
XXContingency
TL69
05
TL66
2Del Mar Tap
TL6959
TL6943
Genesee
OverloadTL666
TL6907

Category P7 Thermal Violation (1)
Slide 13
Penasquitos/Doublet/Dunhill/Torrey Pines/UCM/Genesee area 69 kV
Thermal overload
TL666A, TL666B, TL666C, and TL666G overload for N-2 outage of TL662 and TL6905 in 2022 and 2027 Peak Shift cases (108%)
Potential Mitigation
Network Upgrade (Add a new line PQ-UCM)
Loading shedding RAS
Doublet
Penasquitos
Dunhill
Torrey Pines
UCM
Genesee
Mira Sorrento
XXDel Mar Tap
Contingency
Overload
TL666
TL69
05
TL66
2

Category P7 Thermal Violation (2)
Slide 14
Melrose Tap – San Marcos 69 kV
Thermal overload
TL680C overload (141%) for N-2 outage of TL23003 and TL23011 (2022 Off Peak)
Existing SPS trips the line and causes overload on Mission-San Luis Rey 230 kV
Potential Mitigation
Open Encina 230 kV Tap and build a 230 kV extension from the Tap position to San Luis Rey
Generation Tripping RAS
Encina 230 kV
X
Contingency
San Luis Rey 230 kV
Penasquitos 230 kV
Pen 230 kV
Mission 230 kV
Songs 230 kV San Luis Rey
69 kV
Melrose 69 kV
San Marcos 69 kV
Overload
Escondido 69 kV
Escondido 230 kV
X