
AGENCY MANAGEMENT REPORTLeadership and Knowledge Management Results-Oriented Performance Culture...
37
Department of Homeland Security AGENCY MANAGEMENT REPORT
Transcript of AGENCY MANAGEMENT REPORTLeadership and Knowledge Management Results-Oriented Performance Culture...

D e p a r t m e n t o f H o m e l a n d S e c u r i t yA G E N C Y M A N A G E M E N T R E P O RT

TABLE OF CONTENTS
3 About this Report
4 Report Overview
5 The 2011 Federal Employee Viewpoint Survey
6 Results at a Glance
7 Snapshot
8 Strengths
9 Challenges
10 Increases and Decreases
11 Above and Below the Governmentwide Average
12 Indices
HCAAF
Employee Engagement
14 Decision Aid
18 Work/Life Programs
20 Action Planning
Appendices
23 Appendix A
A1: Item Results and Benchmarks
A2: Demographic Characteristics
31 Appendix B: Trend Analysis: 2006 vs. 2008 vs. 2010 vs. 2011 Results
35 Appendix C: 2011 Federal Employee Viewpoint Survey Methodology
RESULTS FRO
M TH
E 2011 FEDERA
L EMPLO
YEE VIEWPO
INT SU
RVEY
2

ABOUT THIS REPORTDelivering a world-class Federal workforce
Part of delivering a world-class Federal workforce is acknowledging that our employees are our greatest asset. It is for this reason that the Federal Employee Viewpoint Survey (FEVS) focuses on employee perceptions regarding critical areas of their work lives: areas which drive employee satisfaction, commitment, and ultimately retention in the workforce. This year marks the sixth administration of the FEVS by the Office of Personnel Management (OPM).
Becoming America’s model employer depends on attracting, developing, and retaining talented employees and ensuring that they have a direct line of sight between the work they do and one or more of your agency’s missions.
Assessing your agency’s strengths and challenges
Results from the 2011 FEVS offer unique insight into Federal employees’ perceptions of workforce management. In addition, studying trends across the various survey administrations allows your agency’s leadership to determine areas where progress was made, as well as areas that may need further effort and focus.
Throughout this report, Governmentwide results and your agency’s 2010 results are provided for comparison purposes. These comparisons will provide valuable feedback on agency trends and may be used to help set the direction for further improvements in your agency.
Human Capital Assessment and Accountability Framework
To guide Governmentwide efforts to support agency mission results with strong human capital strategies, OPM created the Human Capital Assessment and Accountability Framework (HCAAF). As required by the Chief Human Capital Officers Act of 2002, agencies are evaluated on their progress in meeting the HCAAF standards. The FEVS provides one source of information for evaluating success in three essential systems included in the HCAAF:
Leadership and Knowledge Management Results-Oriented Performance Culture Talent Management
OPM developed metrics for each of these systems, including four indices based on items in the survey. For more information on these metrics, refer to OPM’s website at:
www.opm.gov/hcaaf_resource_center/assets/hcaaf_ssm.pdf
Starting in 2007, agencies were required to administer all of the items in the HCAAF indices as part of the Federal Government’s Annual Employee Survey (AES). Appendix A provides a listing of the survey items with the AES items designated by a double dagger. OPM included all AES items on the 2011 FEVS to help agencies meet that requirement.
OPM now administers the FEVS annually, thus meeting agencies’ yearly AES commitment. As in 2008 and 2010, agencies are still required to post the OPM-provided results to their agency website, along with the agency’s evaluation of their results. In addition, agencies will assess their performance on other HCAAF metrics, as required by the Chief Human Capital Officers Act of 2002.
RESULTS FRO
M TH
E 2011 FEDERA
L EMPLO
YEE VIEWPO
INT SU
RVEY
3

REPORT OVERVIEWMultiple perspectives of your agency’s results
This report is designed to give a broad but interconnected picture of your results, and includes:
A Snapshot: Your agency’s survey respondent characteristics;
Strengths and Challenges: Results for the 10 survey items with the highest percent positive and the highest percent negative for your agency;
Increases and Decreases: Results for survey items that increased or decreased by 5 or more percentage points since 2010;
Above and Below: Results for items where your agency leads and items where your agency trails the Federal Government average by 5 or more percentage points;
Indices: Results for the four HCAAF Indices, as well as a new set of indices pertaining to Conditions for Employee Engagement;
A Decision Aid: A summary table illustrating your agency’s results in comparison to various perspectives;
Work/Life Programs: Results for the items pertaining to work/life programs;
Action Planning: A section describing how to use the survey results and develop action plans; and,
Appendices: A set of appendices that show survey item results benchmarked against agency high/low results and percentile scores; a trend analysis of 2006, 2008, 2010, and 2011 results; and a description of the survey methodology.
Working with this information and other HCAAF measures, your agency can make a thorough assessment of its own progress in its strategic goals and develop a plan of action for further improvement. For additional agency results and ideas for moving from results to action, refer to the OPM website (www.FedView.opm.gov) or contact your OPM Human Capital Officer.
RESULTS FRO
M TH
E 2011 FEDERA
L EMPLO
YEE VIEWPO
INT SU
RVEY
4

THE 2011 FEDERAL EMPLOYEE VIEWPOINT SURVEYMore than 265,000 Federal employees participated in this survey
When were Federal employees surveyed?
OPM conducted the Federal Employee Viewpoint Survey (FEVS) in April/May 2011. The survey was administered electronically. Paper versions were provided to employees without Internet access.
Which Federal employees participated in the survey?
The survey sample included employees from 29 major Federal agencies, as well as 54 small and large independent agencies. The sample was designed to be representative of the full-time, permanent Federal workforce. The Governmentwide response rate was 49.3 percent.
What did the survey measure?
The 95-item survey included 11 demographic questions and 84 items that measured Federal employees’ perceptions about how effectively agencies manage their workforces. Survey questions addressed three HCAAF systems—Leadership and Knowledge Management, Results-Oriented Performance Culture, and Talent Management. This year a new section on work/life programs was added. The survey was grouped into eight topic areas: Personal Work Experiences, Work Unit, Agency, Supervisor/Team Leader, Leadership, Satisfaction, Work/Life, and Demographics.
The 2011 FEVS included 84 items plus 11 demographic items; 77 were in common between the 2010 and 2011 surveys, 58 were in common between the 2008 and 2011 surveys, and 57 were in common between the 2006 and 2011 surveys.
What do the survey results represent?
The survey results represent a snapshot in time of the perceptions of the Federal workforce. Statisticians weighted returned survey data to adjust for differences between the characteristics of the survey respondents and the population of Federal employees surveyed. The Governmentwide results have a plus or minus 1 percent margin of error.
RESULTS FRO
M TH
E 2011 FEDERA
L EMPLO
YEE VIEWPO
INT SU
RVEY
5

RESULTS AT A GLANCE
YOUR AGENCY RESPONSE
Field PeriodApril 4, 2011 – May 12, 2011
Response Rate52% (15,506 out of 29,906
employees responded)
Subagency Response Rates66% Federal Law Enforcement
Training Center64% Bureau of Citizenship and
Immigration Services63% Office of the Under
Secretary for Science and Technology
62% Office of the Inspector General
61% DHS Headquarters60% U.S. Coast Guard59% National Protection and
Programs Directorate (NPPD)
58% Bureau of Immigration and Customs Enforcement
57% Domestic Nuclear Detection Office
53% Federal Emergency Management Agency
48% U.S. Secret Service48% Transportation Security
Administration43% Bureau of Customs and
Border Protection
Agency results have a margin of error of +/- 1%
YOUR AGENCY FINDINGS
23 items had positive ratings of 65 percent or more (strengths)
11 items had negative ratings of 35 percent or more (challenges)
8 items had neutral ratings of 30 percent or more
0 items increased by 5 percentage points or more since 2010
1 item decreased by 5 percentage points or more since 2010
0 items were 5 percentage points or more above the Governmentwide average
53 items were 5 percentage points or more below the Governmentwide average
33rd on Leadership & Knowledge Management*
35th on Results-Oriented Performance Culture*
33rd on Talent Management*
33rd on Job Satisfaction*
* Your agency HCAAF Indices rankings out of 37 agencies.
Achieving your agency’s mission and producing superior resultsThis page provides highlights of your agency’s 2011 Federal Employee Viewpoint Survey (FEVS) results and provides rules of thumb for interpreting your results. Positive ratings are the sum of the two positive categories (e.g., Strongly Agree/Agree or Very Satisfied/Satisfied).
Rules of thumb for comparisonsMany comparisons are made throughout this report. Although significance tests could be run on each comparison, it is impractical to do so, and for large agencies or the Federal Government, even very small differences will be significant. Therefore, when reviewing and interpreting results, it is often useful to apply rules of thumb to determine the “notable” or “meaningful” results. These rules of thumb apply to looking at your own results, as well as when making comparisons.
Items that are 65 percent or more positive are strengths Items that are 35 percent or more negative are challenges Items that are 30 percent or more neutral may indicate opportunities
for more communication A difference of 5 percentage points or more is notable
Reminder: The 2011 FEVS included 84 items plus 11 demographic items; 77 were in common between the 2010 and 2011 surveys, 58 were in common between the 2008 and 2011 surveys, and 57 were in common between the 2006 and 2011 surveys.
6
RESULTS FRO
M TH
E 2011 FEDERA
L EMPLO
YEE VIEWPO
INT SU
RVEY: RESULTS AT A
GLA
NCE

SNAPSHOTYour agency's survey respondent characteristics
MALE
SUPERVISOR/ MANAGER
11-20 YEARS
FEMALE
> 20 YEARS
FIGURE 1 Agency Survey Respondent Characteristics
6-10 YEARS
4-5 YEARS
1-3 YEARS
< 1 YEAR
TEAM LEADER
NON-SUPERVISOR
GENDER
LENGTH OF SERVICE WITH AGENCY
SUPERVISORY STATUS
SES
SL/ST
GS 13-15
GS 7-12
GS 1-6
FEDERAL WAGE SYSTEM
PAY GRADE
50-59
60 OR OLDER
40-49
30-39
26-29
25 AND UNDER
AGE
EXECUTIVE
OTHER
64%
36%
2% 5%
21%
33%
30%
10%
3%
2%
35%
42%
2%
<1%
16%3%
21%
14%
36%
16%
10%
51%
14%
33%
2%
7
RESULTS FRO
M TH
E 2011 FEDERA
L EMPLO
YEE VIEWPO
INT SU
RVEY: SNA
PSHO
T

7. When needed I am willing to put in the extra effort to get a job done.
13. The work I do is important.
8. I am constantly looking for ways to do my job better.
5. I like the kind of work I do.
12. I know how my work relates to the agency’s goals and priorities.
6. I know what is expected of me on the job.
49. My supervisor/team leader treats me with respect.
16. I am held accountable for achieving results.
28. How would you rate the overall quality of work done by your work unit?
50. In the last six months, my supervisor/team leader has talked with me about my performance.
STRENGTHSTable 1A displays your agency’s 10 highest percent positive responses. This table also includes the 2011 Governmentwide percent positive for comparison.
DHS GOVERNMENTWIDE
TABLE 1A Positive Response Items for Your Agency
96% 97%
91% 92%
90% 92%
84% 85%
81% 85%
78% 80%
78% 80%
78% 84%
76% 82%
75% 77%
8
RESULTS FRO
M TH
E 2011 FEDERA
L EMPLO
YEE VIEWPO
INT SU
RVEY: STRENG
THS

CHALLENGESTable 1B displays your agency’s 10 highest percent negative responses. This table also includes the 2011 Governmentwide percent negative for comparison.
33. Pay raises depend on how well employees perform their jobs.
23. In my work unit, steps are taken to deal with a poor performer who cannot or will not improve.
22. Promotions in my work unit are based on merit.
24. In my work unit, differences in performance are recognized in a meaningful way.
9. I have sufficient resources (for example, people, materials, budget) to get my job done.
25. Awards in my work unit depend on how well employees perform their jobs.
32. Creativity and innovation are rewarded.
53. In my organization, leaders generate high levels of motivation and commitment in the workforce.
67. How satisfied are you with your opportunity to get a better job in your organization?
37. Arbitrary action, personal favoritism and coercion for partisan political purposes are not tolerated.
TABLE 1B Negative Response Items for Your Agency
DHS GOVERNMENTWIDE
54% 47%
48% 41%
46% 35%
41% 34%
40% 34%
40% 31%
39% 29%
38% 28%
37% 32%
35% 24%
9
RESULTS FRO
M TH
E 2011 FEDERA
L EMPLO
YEE VIEWPO
INT SU
RVEY: CHA
LLENG
ES

INCREASES AND DECREASESAgency items that increased and decreased the most from 2010
Table 2 shows the survey items that had the greatest changes in percent positive rating for your agency since the 2010 survey administration. This table displays up to 10 items with positive ratings that increased or decreased by 5 percentage points or more from 2010 to 2011. If your agency had more than 10 items that changed by 5 percentage points or more, only the 10 items with the greatest changes are shown. If fewer than 10 items are listed, it is because your agency had fewer than 10 items that changed by at least 5 percentage points since 2010.
TABLE 2 Increases and Decreases in Positive Responses
Percent Positive
2010 2011 Difference
Increased the Most
Your agency had no items that increased by 5 percentage points or more since 2010.
Decreased the Most
82. How satisfied are you with the following Work/Life programs in your agency? Employee Assistance Program (EAP)
50 42 -8
RESULTS FRO
M TH
E 2011 FEDERA
L EMPLO
YEE VIEWPO
INT SU
RVEY: INCREA
SES AN
D D
ECREASES
10
RESULTS FRO
M TH
E 2011 FEDERA
L EMPLO
YEE VIEWPO
INT SU
RVEY: INCREA
SES AN
D D
ECREASES
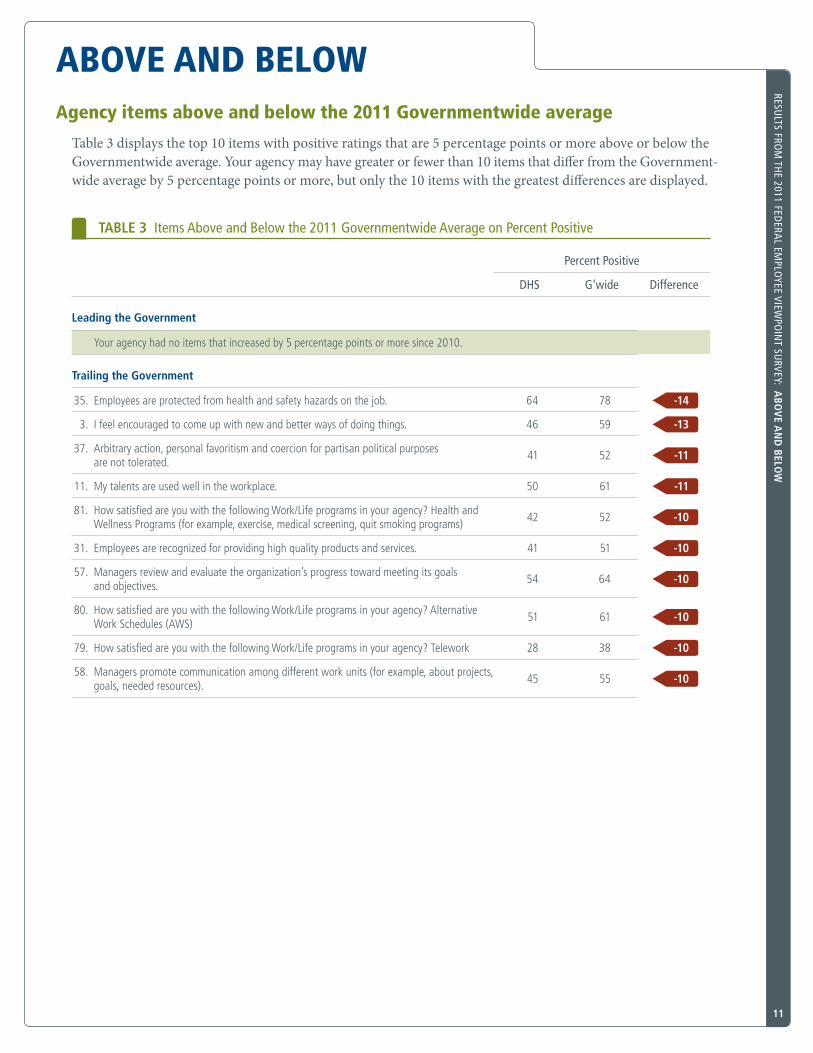
ABOVE AND BELOWAgency items above and below the 2011 Governmentwide average
Table 3 displays the top 10 items with positive ratings that are 5 percentage points or more above or below the Governmentwide average. Your agency may have greater or fewer than 10 items that differ from the Government-wide average by 5 percentage points or more, but only the 10 items with the greatest differences are displayed.
TABLE 3 Items Above and Below the 2011 Governmentwide Average on Percent Positive
Percent Positive
DHS G‘wide Difference
Leading the Government
Your agency had no items that increased by 5 percentage points or more since 2010.
Trailing the Government
35. Employees are protected from health and safety hazards on the job. 64 78 -14
3. I feel encouraged to come up with new and better ways of doing things. 46 59 -13
37. Arbitrary action, personal favoritism and coercion for partisan political purposes are not tolerated.
41 52 -11
11. My talents are used well in the workplace. 50 61 -11
81. How satisfied are you with the following Work/Life programs in your agency? Health and Wellness Programs (for example, exercise, medical screening, quit smoking programs)
42 52 -10
31. Employees are recognized for providing high quality products and services. 41 51 -10
57. Managers review and evaluate the organization’s progress toward meeting its goals and objectives.
54 64 -10
80. How satisfied are you with the following Work/Life programs in your agency? Alternative Work Schedules (AWS)
51 61 -10
79. How satisfied are you with the following Work/Life programs in your agency? Telework 28 38 -10
58. Managers promote communication among different work units (for example, about projects, goals, needed resources).
45 55 -10
11
RESULTS FRO
M TH
E 2011 FEDERA
L EMPLO
YEE VIEWPO
INT SU
RVEY: ABO
VE A
ND
BELOW

INDICESHuman Capital Assessment and Accountability Framework (HCAAF)
The HCAAF indices provide consistent metrics for measuring progress toward HCAAF objectives. Figure 2 shows your agency results compared with Governmentwide results for the four HCAAF Indices. The four indices are: Leadership and Knowledge Management Index, Results-Oriented Performance Culture Index, Talent Management Index, and Job Satisfaction Index. There are a total of 39 items that make up the indices. See Appendix A for the results of the individual items that make up the HCAAF Indices.
The LEADERSHIP & KNOWLEDGE MANAGEMENT INDEX indicates the extent to which employees hold their leadership in high regard, both overall and on specific facets of leadership. It is made up of items 10, 35, 36, 51, 52, 53, 55, 56, 57, 61, 64, and 66.
The RESULTS-ORIENTED PERFORMANCE CULTURE INDEX indicates the extent to which employees believe their organizational culture promotes improvement in processes, products and services, and organizational outcomes. It is made up of items 12, 14, 15, 20, 22, 23, 24, 30, 32, 33, 42, 44, and 65.
The TALENT MANAGEMENT INDEX indicates the extent to which employees think the organization has the talent necessary to achieve organizational goals. It is made up of items 1, 11, 18, 21, 29, 47, and 68.
The JOB SATISFACTION INDEX indicates the extent to which employees are satisfied with their jobs and various aspects thereof. It is made up of items 4, 5, 13, 63, 67, 69, and 70.
FIGURE 2 HCAAF Indices – Positive Responses
LEADERSHIP & KNOWLEDGE MANAGEMENT
RESULTS-ORIENTED PERFORMANCE CULTURE
TALENT MANAGEMENT
JOB SATISFACTION
2011 GOVERNMENTWIDE
2010 DHS
2011 DHS
62%
54%
60%
68%64%
65%
53%
54%
48%
49%
55%
55%
12
RESULTS FRO
M TH
E 2011 FEDERA
L EMPLO
YEE VIEWPO
INT SU
RVEY: IND
ICES

13
2011 GOVERNMENTWIDE
2010 DHS
2011 DHS
RESULTS FRO
M TH
E 2011 FEDERA
L EMPLO
YEE VIEWPO
INT SU
RVEY: IND
ICES
Employee Engagement
The Federal Employee Viewpoint Survey (FEVS) was developed to measure organizational climate, including job and organizational satisfaction, within Government agencies. There has been movement towards measuring employee engagement, which emphasizes the passion, commitment and involvement of employees. An engaged employee is seen as one who is immersed in the content of the job and energized to spend extra effort in job performance.
The current FEVS does not contain direct measurements of employee feelings of engagement such as passion, commitment, and involvement. However, it does include questions that cover most, if not all, of the conditions likely to lead to employee engagement. Using these questions, OPM developed an index that tapped the conditions that lead to engaged employees. In order to differentiate this index from a job satisfaction index, survey items that asked respondents "how satisfied" were excluded, but items measuring the common drivers of employee engagement such as leadership, opportunity to use skills, etc. were included.
Figure 3 shows your organization's scores on the Conditions for Employee Engagement Index, and its component indices: Leaders Lead, Supervisors, and Intrinsic Work Experiences, with appropriate comparisons.
FIGURE 3 Conditions for Employee Engagement Index – Positive Responses
LEADERS LEAD
SUPERVISORS
INTRINSIC WORK EXPERIENCES
LEADERS LEAD reflects the employees' perceptions of the integrity of leadership, as well as leadership behaviors such as communication and workforce motivation. It is made up of items 53, 54, 56, 60, and 61.
SUPERVISORS reflects the interpersonal relationship between worker and supervisor, including trust, respect, and support. It is made up of items 47, 48, 49, 51, and 52.
INTRINSIC WORK EXPERIENCES reflects the employees' feelings of motivation and competency relating to their role in the workplace. It is made up of items 3, 4, 6,11, and 12.
EMPLOYEE ENGAGEMENT
56%
72%
72%
67%
64%
65%
68%
68%
48%
49%
60%
61%
2011 DHS %Comparisons to
% Positive
Positive
Neutral
Negative ‘10 DHS
G’wide Average
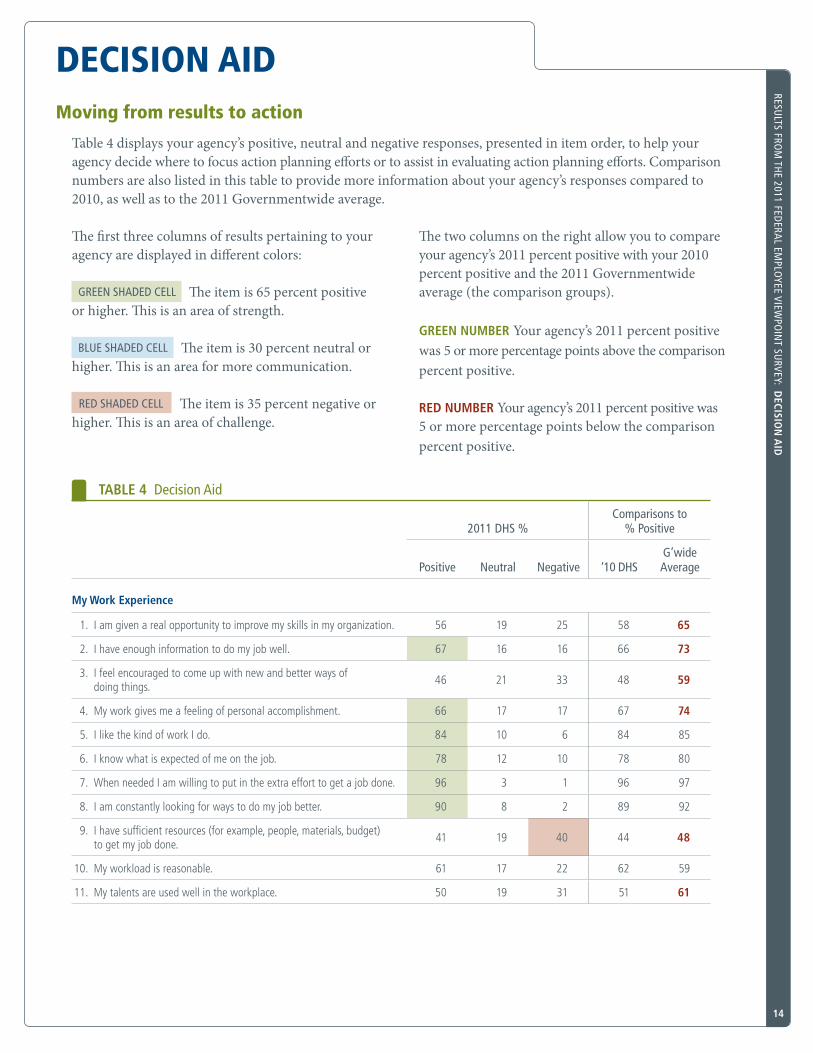
My Work Experience
1. I am given a real opportunity to improve my skills in my organization. 56 19 25 58 65
2. I have enough information to do my job well. 67 16 16 66 73
3. I feel encouraged to come up with new and better ways of doing things.
46 21 33 48 59
4. My work gives me a feeling of personal accomplishment. 66 17 17 67 74
5. I like the kind of work I do. 84 10 6 84 85
6. I know what is expected of me on the job. 78 12 10 78 80
7. When needed I am willing to put in the extra effort to get a job done. 96 3 1 96 97
8. I am constantly looking for ways to do my job better. 90 8 2 89 92
9. I have sufficient resources (for example, people, materials, budget) to get my job done.
41 19 40 44 48
10. My workload is reasonable. 61 17 22 62 59
11. My talents are used well in the workplace. 50 19 31 51 61
DECISION AIDMoving from results to action
Table 4 displays your agency’s positive, neutral and negative responses, presented in item order, to help your agency decide where to focus action planning efforts or to assist in evaluating action planning efforts. Comparison numbers are also listed in this table to provide more information about your agency’s responses compared to 2010, as well as to the 2011 Governmentwide average.
The first three columns of results pertaining to your agency are displayed in different colors:
GREEN SHADED CELL The item is 65 percent positive or higher. This is an area of strength.
BLUE SHADED CELL The item is 30 percent neutral or higher. This is an area for more communication.
RED SHADED CELL The item is 35 percent negative or higher. This is an area of challenge.
The two columns on the right allow you to compare your agency’s 2011 percent positive with your 2010 percent positive and the 2011 Governmentwide average (the comparison groups).
GREEN NUMBER Your agency’s 2011 percent positive was 5 or more percentage points above the comparison percent positive.
RED NUMBER Your agency’s 2011 percent positive was 5 or more percentage points below the comparison percent positive.
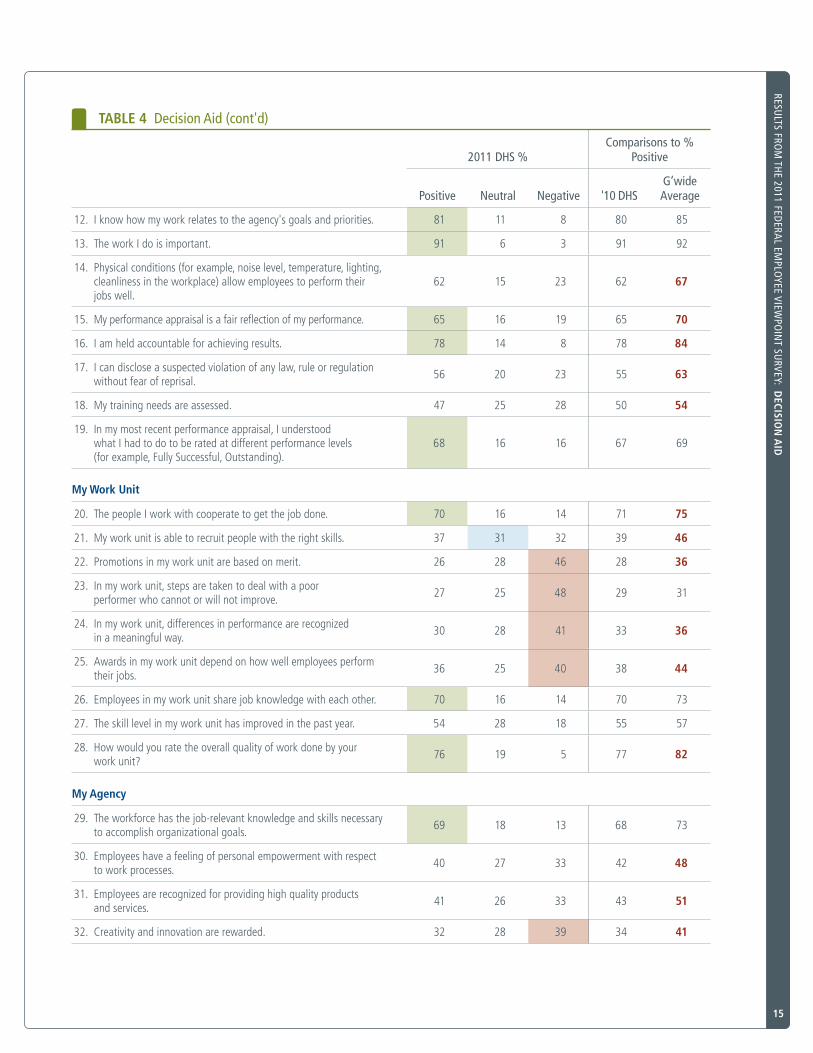
TABLE 4 Decision Aid
14
RESULTS FRO
M TH
E 2011 FEDERA
L EMPLO
YEE VIEWPO
INT SU
RVEY: DECISIO
N A
ID
15
RESULTS FRO
M TH
E 2011 FEDERA
L EMPLO
YEE VIEWPO
INT SU
RVEY: DECISIO
N A
ID
2011 DHS %Comparisons to %
Positive
Positive
Neutral
Negative '10 DHS
G’wide Average
12. I know how my work relates to the agency's goals and priorities. 81 11 8 80 85
13. The work I do is important. 91 6 3 91 92
14. Physical conditions (for example, noise level, temperature, lighting, cleanliness in the workplace) allow employees to perform their jobs well.
62 15 23 62 67
15. My performance appraisal is a fair reflection of my performance. 65 16 19 65 70
16. I am held accountable for achieving results. 78 14 8 78 84
17. I can disclose a suspected violation of any law, rule or regulation without fear of reprisal.
56 20 23 55 63
18. My training needs are assessed. 47 25 28 50 54
19. In my most recent performance appraisal, I understood what I had to do to be rated at different performance levels (for example, Fully Successful, Outstanding).
68 16 16 67 69
My Work Unit
20. The people I work with cooperate to get the job done. 70 16 14 71 75
21. My work unit is able to recruit people with the right skills. 37 31 32 39 46
22. Promotions in my work unit are based on merit. 26 28 46 28 36
23. In my work unit, steps are taken to deal with a poor performer who cannot or will not improve.
27 25 48 29 31
24. In my work unit, differences in performance are recognized in a meaningful way.
30 28 41 33 36
25. Awards in my work unit depend on how well employees perform their jobs.
36 25 40 38 44
26. Employees in my work unit share job knowledge with each other. 70 16 14 70 73
27. The skill level in my work unit has improved in the past year. 54 28 18 55 57
28. How would you rate the overall quality of work done by your work unit?
76 19 5 77 82
My Agency
29. The workforce has the job-relevant knowledge and skills necessary to accomplish organizational goals.
69 18 13 68 73
30. Employees have a feeling of personal empowerment with respect to work processes.
40 27 33 42 48
31. Employees are recognized for providing high quality products and services.
41 26 33 43 51
32. Creativity and innovation are rewarded. 32 28 39 34 41
TABLE 4 Decision Aid (cont'd)

16
RESULTS FRO
M TH
E 2011 FEDERA
L EMPLO
YEE VIEWPO
INT SU
RVEY: DECISIO
N A
ID
2011 DHS %Comparisons to %
Positive
Positive
Neutral
Negative '10 DHS
G’wide Average
33. Pay raises depend on how well employees perform their jobs. 19 27 54 22 24
34. Policies and programs promote diversity in the workplace (for example, recruiting minorities and women, training in awareness of diversity issues, mentoring).
54 30 16 54 59
35. Employees are protected from health and safety hazards on the job.
64 18 18 63 78
36. My organization has prepared employees for potential security threats.
70 16 14 66 78
37. Arbitrary action, personal favoritism and coercion for partisan political purposes are not tolerated.
41 24 35 41 52
38. Prohibited Personnel Practices (for example, illegally discri minating for or against any employee/applicant, obstructing a person’s right to compete for employment, knowingly violating veterans’ preference requirements) are not tolerated.
62 22 16 60 67
39. My agency is successful at accomplishing its mission. 72 18 10 71 79
40. I recommend my organization as a good place to work. 62 22 16 63 69
41. I believe the results of this survey will be used to make my agency a better place to work.
45 27 28 46 45
My Supervisor/Team Leader
42. My supervisor supports my need to balance work and other life issues.
71 14 15 70 77
43. My supervisor/team leader provides me with opportunities to demonstrate my leadership skills.
62 18 20 62 67
44. Discussions with my supervisor/team leader about my performance are worthwhile.
59 22 19 59 63
45. My supervisor/team leader is committed to a workforce representative of all segments of society.
61 27 12 62 66
46. My supervisor/team leader provides me with constructive suggestions to improve my job performance.
59 21 20 59 62
47. Supervisors/team leaders in my work unit support employee development.
60 20 19 61 67
48. My supervisor/team leader listens to what I have to say. 71 15 14 73 75
49. My supervisor/team leader treats me with respect. 78 12 10 78 80
50. In the last six months, my supervisor/team leader has talked with me about my performance.
75 12 13 73 77
51. I have trust and confidence in my supervisor. 64 18 18 64 67
52. Overall, how good a job do you feel is being done by your immediate supervisor/team leader?
66 20 14 66 69
TABLE 4 Decision Aid (cont'd)

17
RESULTS FRO
M TH
E 2011 FEDERA
L EMPLO
YEE VIEWPO
INT SU
RVEY: DECISIO
N A
ID
TABLE 4 Decision Aid (cont'd)
2011 DHS %Comparisons to %
Positive
Positive
Neutral
Negative '10 DHS
G’wide Average
Leadership
53. In my organization, leaders generate high levels of motivation and commitment in the workforce.
37 25 38 38 45
54. My organization's leaders maintain high standards of honesty and integrity.
51 23 27 51 57
55. Managers/supervisors/team leaders work well with employees of different backgrounds.
59 23 18 59 65
56. Managers communicate the goals and priorities of the organization. 56 22 23 57 64
57. Managers review and evaluate the organization's progress toward meeting its goals and objectives.
54 27 20 54 64
58. Managers promote communication among different work units (for example, about projects, goals, needed resources).
45 25 30 47 55
59. Managers support collaboration across work units to accomplish work objectives.
49 25 26 50 58
60. Overall, how good a job do you feel is being done by the manager directly above your immediate supervisor/team leader?
50 27 24 51 58
61. I have a high level of respect for my organization’s senior leaders. 49 23 27 51 57
62. Senior leaders demonstrate support for Work/Life programs. 46 27 26 47 55
My Satisfaction
63. How satisfied are you with your involvement in decisions that affect your work?
45 26 29 47 53
64. How satisfied are you with the information you receive from management on what's going on in your organization?
43 25 32 44 51
65. How satisfied are you with the recognition you receive for doing a good job?
43 25 32 45 51
66. How satisfied are you with the policies and practices of your senior leaders?
37 28 35 39 46
67. How satisfied are you with your opportunity to get a better job in your organization?
35 28 37 38 40
68. How satisfied are you with the training you receive for your present job? 51 23 26 54 55
69. Considering everything, how satisfied are you with your job? 65 19 15 67 71
70. Considering everything, how satisfied are you with your pay? 62 16 23 63 62
71. Considering everything, how satisfied are you with your organization? 56 22 23 56 62

2% 6%3%
9%
35%7%
26%
12%
20%
80%
WORK/LIFE PROGRAMS
DHS GOVERNMENTWIDE
FIGURE 4 Eligibility to Telework (Question 72)
FIGURE 5 Your Agency's Teleworking Situation (Question 73)
TELEWORK I telework 3 or more days per week.
I telework 1 or 2 days per week.
I telework, but no more than 1 or 2 days per month.
I telework very infrequently, on an unscheduled or short-term basis.
DO NOT TELEWORK I do not telework because I have to be physically present on the job (e.g., Law Enforcement Officers, Park Rangers, Security Personnel).
I do not telework because I have technical issues (e.g., Connectivity, inadequate equipment) that prevent me from teleworking.
I do not telework because I did not receive approval to do so, even though I have the kind of job where I can telework.
I do not telework because I choose not to telework.
YES
NO
Have you been notified that you are eligible to telework? Telework means working at a location other than your normal work site during your regular work hours (excludes travel). NOT SURE
Note: The sum of percentages may not add to 100 due to rounding
1% 3% 2%6%
60%
3%
17%
8%
12%
88%
20%
72%
8%
18
RESULTS FRO
M TH
E 2011 FEDERA
L EMPLO
YEE VIEWPO
INT SU
RVEY: WO
RK/LIFE PRO
GRA
MS

19
FIGURE 7 Satisfaction with Work/Life Programs (Questions 79-84)
FIGURE 6 Participation in Work/Life Programs (Questions 74-78)
NEGATIVE
NOT AVAILABLE
NEUTRAL
NO
POSITIVE
YES
Note: Does not include those who responded "no basis to judge".
Child Care Programs (for example, daycare, parenting classes, parenting support groups)
Elder Care Programs (for example, support groups, speakers)
Employee Assistance Program (EAP)
Alternative Work Schedules (AWS)
Health and Wellness Programs (for example, exercise, medical screening, quit smoking programs)
TeleworkAlternative Work Schedules (AWS)
Child Care Programs (for example, daycare, parenting classes, parenting support groups)
Elder Care Programs (for example, support groups, speakers)
Health and Wellness Programs (for example, exercise, medical screening, quit smoking programs)
Employee Assistance Program (EAP)
32%
46%
22%
18%
60%
22%
4%
80%
16%
23%
76%
2%
21%
77%
1%
19%
30%
51%
17%
41%
42%
7%
50%
42%
16%
70%
14%
12%
75%
12%
27%
45%
28%
RESULTS FRO
M TH
E 2011 FEDERA
L EMPLO
YEE VIEWPO
INT SU
RVEY: WO
RK/LIFE PRO
GRA
MS

ACTION PLANNINGExamining and using your Federal Employee Viewpoint Survey (FEVS) results through action planning
The overall goal when reviewing your agency results is to determine what you can do to improve how your agency manages its workforce. Continuous improvement means monitoring progress, adapting constantly, and evaluating the impact of actions on your human capital management challenges. Action planning involves identifying goals for improvement, and making change happen.
The following simple steps for action planning guide you through using your FEVS results to help your agency meet its strategic human capital management goals.
Step 1: Identify the issues
In the first step of action planning you review your survey results and conduct follow-up activities needed to clarify their meaning. You then communicate the results to your employees, and describe the issues your agency plans to address.
Review and reflect on the results
Compare your agency’s current results with previous results; note the items on which your agency has decreased the most since 2010 (Table 2).
Compare your agency’s results with Governmentwide results; note the items on which you scored lowest in comparison to the rest of the government (Table 3).
Identify any Human Capital Assessment and Accountability Framework (HCAAF) indices on which you scored lower than the rest of the government (Figure 2).
Consider how your results relate to priorities in your agency’s strategic human capital plan.
Determine the follow-up activities needed to clarify issues
Supplement survey findings with focus groups to collect more information.
Seek clarification from employees or labor organizations to identify reasons for low scores.
Summarize and communicate your results
Summarize and develop a description of issues your agency plans to address.
Communicate both positive and negative results from the survey and follow-up activities to employees and all interested parties.
Step 2: Set goals
In the second step of action planning you develop goals for improvement.
Translate your issues into a manageable number of goals (1-4 goals recommended)
While developing your goals, consider:
Which issues are the most critical for your agency?
Which issues are related to the agency’s strategic goals?
20
RESULTS FRO
M TH
E 2011 FEDERA
L EMPLO
YEE VIEWPO
INT SU
RVEY: ACTIO
N PLA
NN
ING

21
RESULTS FRO
M TH
E 2011 FEDERA
L EMPLO
YEE VIEWPO
INT SU
RVEY: ACTIO
N PLA
NN
ING
Which issues will provide short-term visible results, measurable during the next survey administration?
Which issues will require long-term change to meet agency goals?
Craft goals that are:
Clearly defined with regard to target area of improvement, rationale for selecting that area, timeline for implementation, and who should be involved in the process.
Reasonable in scope given any constraints on time, staffing, resources, and agency commitment.
Measurable, including interim milestones to assess progress, and assuring advancement toward on-time completion.
Step 3: Identify your staff and budget resources
In the third step of action planning you pull together a team, and evaluate the time and resources available to you.
Assemble your team
Be sure to include a variety of perspectives and skills.
Consider staff members’ interests and capabilities as they relate to working on particular aspects of your goals.
Identify resources available for this effort
Consider how much time your team members will be able to commit.
Consider the monetary resources needed both to reach your goals and to communicate your results.
Step 4: Develop the action plan
In the fourth step of action planning you break down the goals into actions to be accomplished, and assign them to responsible parties. You then seek necessary approvals for your action plan.
Hold meetings of the team that will develop the action plan. During the meetings:
Clearly state the objectives associated with each goal.
Brainstorm about different processes you might use to achieve your goals.
Develop a concise list of actions you will take to achieve your goals.
Organize the actions into a chronology, indicating which steps may be completed simultaneously, and which must be completed in sequence.
Assign timeframes to each step, including start dates, end dates, and milestones along the way.
Assign staff responsibilities for each step.
Identify individuals (or groups of individuals) who will be affected by the proposed actions.
Review the plan to ensure that it is both complete, and as streamlined as possible.
Get your action plan approved as necessary

22
RESULTS FRO
M TH
E 2011 FEDERA
L EMPLO
YEE VIEWPO
INT SU
RVEY: ACTIO
N PLA
NN
ING
Step 5: Implement the action plan
In the fifth step of action planning you publicize your plan within your agency, and launch the plan that will help you meet your agency’s goals.
Communicate your plan
Take steps to inform your agency staff about your action plan. Examples of communication activities in-clude: all-hands meetings, small division meetings, and electronic announcements on your intranet or through email.
Show top-level support for change.
Implement the Action Plan
Ensure that your team is ready to begin the assigned steps toward your goals.
Launch your plan!
Step 6: Monitor and evaluate the results of the implementation
In the sixth step of action planning, you monitor progress and evaluate outcomes of your action plan. You also provide regular feedback on progress and outcomes to managers and employees.
Monitor your implementation
Decide how you will evaluate and document progress, and identify what metrics or outcome measures you will use.
Identify the indicators of interim and final success, including specific improvement targets.
Set a timeframe for monitoring and evaluation, including dates on which data will be collected.
Identify any anticipated secondary effects of your efforts, either positive or negative, that should be monitored.
Consider what your procedures will be if monitoring efforts indicate a need for adjustments to efforts or goals.
Provide feedback to managers and employees
Communicate both progress toward goals and final results.
Share successes in making changes.
Consider establishing a working group or task force for continuous improvement monitoring.
Remember that a good Action Plan:
Clearly outlines actions to be taken, key deliverables, timelines, responsibilities and resources.
Aligns with organizational strategy and culture.
Is actionable.
Presents the value added to the organization by following the Action Plan.

APPENDIX AAppendix A1: Item results and benchmarks
Your agency’s percent positive for each survey item is listed in the left column, and benchmarks are listed on the right for comparison purposes. The benchmark scores were compiled from the results for Departments and large agencies and small and large independent agencies with 800 or more employees. Note that these benchmarks are based on 37 agencies where Army, U.S. Army Corps of Engineers, Air Force, Navy, U.S. Marine Corps, and Other Defense are rolled up into Department of Defense.
The following benchmark scores are listed to allow you to compare your agency’s percent positive with the results of other agencies:
The highest and lowest percent positive scores
Represent the agency that scored the highest/lowest for that survey item.
The 90th, 50th, 10th percentiles
Compare your percent positive score with the percentile scores for each item. If your agency had a positive score of 83 percent for an item and the benchmark for the 90th percentile was 80 percent positive, then you can conclude that your agency is above the 90th percentile of agency scores for that item. In other words, your agency scored higher than at least 90 percent of the benchmark agencies.
Appendix A2: Demographic characteristics (unweighted data)
The percentages for the demographic items listed are based on unweighted data.
23
RESULTS FRO
M TH
E 2011 FEDERA
L EMPLO
YEE VIEWPO
INT SU
RVEY: APPEN
DIX
A

24
RESULTS FRO
M TH
E 2011 FEDERA
L EMPLO
YEE VIEWPO
INT SU
RVEY: APPEN
DIX
A
DHS% Positive
2011 FEVS Benchmarks % Positive
Percentile
2011 High 90th 50th 10th Low
My Work Experiences
‡1. I am given a real opportunity to improve my skills in my organization. 56 84 78 67 57 52
2. I have enough information to do my job well. 67 86 81 73 66 57
3. I feel encouraged to come up with new and better ways of doing things.
46 74 68 59 50 44
‡4. My work gives me a feeling of personal accomplishment. 66 79 79 75 69 66
‡5. I like the kind of work I do. 84 88 87 84 80 78
6. I know what is expected of me on the job. 78 86 84 79 73 64
7. When needed I am willing to put in the extra effort to get a job done. 96 99 98 97 96 95
8. I am constantly looking for ways to do my job better. 90 94 93 91 88 85
9. I have sufficient resources (for example, people, materials, budget) to get my job done.
41 71 62 50 40 32
‡10. My workload is reasonable. 61 74 70 59 45 41
‡11. My talents are used well in the workplace. 50 69 63 59 52 50
‡12. I know how my work relates to the agency's goals and priorities. 81 93 90 85 80 71
‡13. The work I do is important. 91 96 95 91 86 80
‡14. Physical conditions (for example, noise level, temperature, lighting, cleanliness in the workplace) allow employees to perform their jobs well.
62 85 80 70 62 54
‡15. My performance appraisal is a fair reflection of my performance. 65 82 76 68 64 52
16. I am held accountable for achieving results. 78 91 89 84 77 72
17. I can disclose a suspected violation of any law, rule or regulation without fear of reprisal.
56 78 70 62 56 48
‡18. My training needs are assessed. 47 69 59 49 42 28
‡19. In my most recent performance appraisal, I understood what I had to do to be rated at different performance levels (for example, Fully Successful, Outstanding).
68 78 74 67 58 40
Note: Items included on the Annual Employee Survey are noted by a double dagger (‡).
APPENDIX A1 Item Results and Benchmarks

25
RESULTS FRO
M TH
E 2011 FEDERA
L EMPLO
YEE VIEWPO
INT SU
RVEY: APPEN
DIX
A
Note: Items included on the Annual Employee Survey are noted by a double dagger (‡).
DHS% Positive
2011 FEVS Benchmarks % Positive
Percentile
2011 High 90th 50th 10th Low
My Work Unit
‡20. The people I work with cooperate to get the job done. 70 87 85 76 70 66
‡21. My work unit is able to recruit people with the right skills. 37 77 65 48 39 35
‡22. Promotions in my work unit are based on merit. 26 58 50 39 30 26
‡23. In my work unit, steps are taken to deal with a poor performer who cannot or will not improve.
27 42 40 32 26 20
‡24. In my work unit, differences in performance are recognized in a meaningful way.
30 54 46 37 30 16
25. Awards in my work unit depend on how well employees perform their jobs.
36 62 57 46 36 26
26. Employees in my work unit share job knowledge with each other. 70 83 81 73 69 63
27. The skill level in my work unit has improved in the past year. 54 66 65 57 51 48
28. How would you rate the overall quality of work done by your work unit?
76 91 89 84 79 74
My Agency
‡29. The workforce has the job-relevant knowledge and skills necessary to accomplish organizational goals.
69 88 83 73 64 59
‡30. Employees have a feeling of personal empowerment with respect to work processes.
40 67 57 47 38 35
31. Employees are recognized for providing high quality products and services.
41 76 64 52 43 35
‡32. Creativity and innovation are rewarded. 32 61 52 42 32 25
‡33. Pay raises depend on how well employees perform their jobs. 19 53 40 26 19 9
34. Policies and programs promote diversity in the workplace (for example, recruiting minorities and women, training in awareness of diversity issues, mentoring).
54 80 69 59 49 46
‡35. Employees are protected from health and safety hazards on the job. 64 93 86 78 67 57
‡36. My organization has prepared employees for potential security threats. 70 86 84 75 67 52
37. Arbitrary action, personal favoritism and coercion for partisan political purposes are not tolerated.
41 67 61 53 45 39
38. Prohibited Personnel Practices (for example, illegally discriminating for or against any employee/applicant, obstructing a person’s right to compete for employment, knowingly violating veterans’ preference requirements) are not tolerated.
62 80 77 68 61 54
APPENDIX A1 Item Results and Benchmarks (cont'd)

26
RESULTS FRO
M TH
E 2011 FEDERA
L EMPLO
YEE VIEWPO
INT SU
RVEY: APPEN
DIX
A
Note: Items included on the Annual Employee Survey are noted by a double dagger (‡).
DHS% Positive
2011 FEVS Benchmarks % Positive
Percentile
2011 High 90th 50th 10th Low
39. My agency is successful at accomplishing its mission. 72 92 86 78 70 60
40. I recommend my organization as a good place to work. 62 84 76 69 55 50
41. I believe the results of this survey will be used to make my agency a better place to work.
45 69 57 47 41 37
My Supervisor/Team Leader
‡42. My supervisor supports my need to balance work and other life issues. 71 89 86 80 74 64
43. My supervisor/team leader provides me with opportunities to demonstrate my leadership skills.
62 79 75 68 62 58
‡44. Discussions with my supervisor/team leader about my performance are worthwhile.
59 74 69 63 57 53
45. My supervisor/team leader is committed to a workforce representative of all segments of society.
61 78 73 68 61 57
46. My supervisor/team leader provides me with constructive suggestions to improve my job performance.
59 74 69 62 56 51
‡47. Supervisors/team leaders in my work unit support employee development.
60 84 76 68 61 56
48. My supervisor/team leader listens to what I have to say. 71 85 82 77 72 68
49. My supervisor/team leader treats me with respect. 78 88 85 82 77 75
50. In the last six months, my supervisor/team leader has talked with me about my performance.
75 92 89 82 67 61
‡51. I have trust and confidence in my supervisor. 64 78 74 67 63 57
‡52. Overall, how good a job do you feel is being done by your immediate supervisor/team leader?
66 81 76 69 66 60
Leadership
‡53. In my organization, leaders generate high levels of motivation and commitment in the workforce.
37 66 54 44 36 30
54. My organization's leaders maintain high standards of honesty and integrity.
51 77 69 58 51 41
‡55. Managers/supervisors/team leaders work well with employees of different backgrounds.
59 80 73 66 58 55
‡56. Managers communicate the goals and priorities of the organization. 56 81 76 64 56 43
‡57. Managers review and evaluate the organization's progress toward meeting its goals and objectives.
54 81 75 65 54 37
58. Managers promote communication among different work units (for example, about projects, goals, needed resources).
45 72 66 54 45 42
APPENDIX A1 Item Results and Benchmarks (cont'd)

27
RESULTS FRO
M TH
E 2011 FEDERA
L EMPLO
YEE VIEWPO
INT SU
RVEY: APPEN
DIX
A
DHS% Positive
2011 FEVS Benchmarks % Positive
Percentile
2011 High 90th 50th 10th Low
59. Managers support collaboration across work units to accomplish work objectives.
49 76 68 58 49 46
60. Overall, how good a job do you feel is being done by the manager directly above your immediate supervisor/team leader?
50 75 68 58 52 48
‡61. I have a high level of respect for my organization’s senior leaders. 49 75 68 57 48 45
62. Senior leaders demonstrate support for Work/Life programs. 46 83 69 57 46 26
My Satisfaction
‡63. How satisfied are you with your involvement in decisions that affect your work?
45 71 61 53 46 44
‡64. How satisfied are you with the information you receive from management on what's going on in your organization?
43 72 62 52 43 37
‡65. How satisfied are you with the recognition you receive for doing a good job?
43 70 62 52 43 39
‡66. How satisfied are you with the policies and practices of your senior leaders?
37 68 55 46 35 33
‡67. How satisfied are you with your opportunity to get a better job in your organization?
35 55 48 39 31 23
‡68. How satisfied are you with the training you receive for your present job?
51 76 67 54 44 34
‡69. Considering everything, how satisfied are you with your job? 65 80 75 71 64 62
‡70. Considering everything, how satisfied are you with your pay? 62 77 72 65 60 56
71. Considering everything, how satisfied are you with your organization? 56 78 71 63 53 49
Work/Life
72. Have you been notified that you are eligible to telework? (See page 18)
73. Please select the response below that best describes your teleworking situation. (See page 18)
74-78. Do you participate in the following Work/Life programs? (See page 19)
Note: Items included on the Annual Employee Survey are noted by a double dagger (‡).
APPENDIX A1 Item Results and Benchmarks (cont'd)

28
DHS% Positive
2011 FEVS Benchmarks % Positive
Percentile
2011 High 90th 50th 10th Low
79-84. How satisfied are you with the following Work/Life programs in your agency?
79. Telework 28 76 71 53 28 22
80. Alternative Work Schedules (AWS) 51 91 84 67 45 33
81. Health and Wellness Programs (for example, exercise, medical screening, quit smoking programs)
42 77 74 54 39 28
82. Employee Assistance Program (EAP) 42 63 52 43 34 16
83. Child Care Programs (for example, daycare, parenting classes, parenting support groups)
14 47 38 20 11 6
84. Elder Care Programs (for example, support groups, speakers) 12 32 28 17 9 8
RESULTS FRO
M TH
E 2011 FEDERA
L EMPLO
YEE VIEWPO
INT SU
RVEY: APPEN
DIX
A
Note: Items included on the Annual Employee Survey are noted by a double dagger (‡).
APPENDIX A1 Item Results and Benchmarks (cont'd)

29
RESULTS FRO
M TH
E 2011 FEDERA
L EMPLO
YEE VIEWPO
INT SU
RVEY: APPEN
DIX
A
2011 DHS Percentages
85. Where do you work?
Headquarters 28
Field 72
‡86. What is your supervisory status?
Non-Supervisor 51
Team Leader 14
Supervisor 22
Manager 11
Executive 2
‡87. Are you:
Male 64
Female 36
‡88. Are you Hispanic or Latino?
Yes 14
No 86
‡89. Are you:
American Indian or Alaska Native 1
Asian 4
Black or African American 15
Native Hawaiian or Other Pacific Islander 1
White 75
Two or more races (not Hispanic or Latino) 4
90. What is your age group?
25 and under 2
26-29 5
30-39 21
40-49 33
50-59 30
60 or older 10
91.What is your pay category/grade?
Federal Wage System (ex. WB, WD, WG, WL, WM, WS, WY) 3
GS 1-6 2
GS 7-12 35
GS 13-15 42
Senior Executive Service 2
Senior Level (SL) or Scientific or Professional (ST) <1
Other 16
APPENDIX A2 Demographic Characteristics (Unweighted Data)
Note: Items included on the Annual Employee Survey are noted by a double dagger (‡).

30
RESULTS FRO
M TH
E 2011 FEDERA
L EMPLO
YEE VIEWPO
INT SU
RVEY: APPEN
DIX
A
2011 DHS Percentages
92. How long have you been with the Federal Government (excluding military service)?
Less than 1 year 2
1 to 3 years 14
4 to 5 years 10
6 to 10 years 31
11 to 14 years 11
15 to 20 years 11
More than 20 years 21
93. How long have you been with your current agency (for example, Department of Justice, Environmental Protection Agency)?
Less than 1 year 3
1 to 3 years 21
4 to 5 years 14
6 to 10 years 36
11 to 20 years 16
More than 20 years 10
94. Are you considering leaving your organization within the next year, and if so, why?
No 67
Yes, to retire 4
Yes, to take another job within the Federal Government 23
Yes, to take another job outside the Federal Government 3
Yes, other 4
95. I am planning to retire:
Within one year 3
Between one and three years 8
Between three and five years 9
Five or more years 80
APPENDIX A2 Demographic Characteristics (Unweighted Data) (cont'd)
Note: Items included on the Annual Employee Survey are noted by a double dagger (‡).

Percent Positive Significant Trends2006 2008 2010 2011
‡1. I am given a real opportunity to improve my skills in my organization. 49 56 58 56 Þ Ú Ú
2. I have enough information to do my job well. 64 68 66 67 Þ Ú Þ
3. I feel encouraged to come up with new and better ways of doing things. 42 49 48 46 Þ Ú Ú
‡4. My work gives me a feeling of personal accomplishment. 62 68 67 66 Þ Ú Ú
‡5. I like the kind of work I do. 80 82 84 84 Þ Ú Ú
6. I know what is expected of me on the job. — — 78 78 NA NA Ú
7. When needed I am willing to put in the extra effort to get a job done. — — 96 96 NA NA Ú
8. I am constantly looking for ways to do my job better. — — 89 90 NA NA Ú
9. I have sufficient resources (for example, people, materials, budget) to get my job done.
38 47 44 41 Þ à à
‡10. My workload is reasonable. 55 61 62 61 Þ Ú Ú
‡11. My talents are used well in the workplace. 48 53 51 50 Þ à Ú
‡12. I know how my work relates to the agency's goals and priorities. 77 81 80 81 Þ Ú Ú
‡13. The work I do is important. 90 91 91 91 Ú Ú Ú
‡14. Physical conditions (for example, noise level, temperature, lighting, cleanliness in the workplace) allow employees to perform their jobs well.
55 59 62 62 Þ Þ Ú
‡15. My performance appraisal is a fair reflection of my performance. 57 58 65 65 Ú Þ Ú
16. I am held accountable for achieving results. 70 77 78 78 Þ Ú Ú
17. I can disclose a suspected violation of any law, rule or regulation without fear of reprisal.
43 49 55 56 Þ Þ Ú
APPENDIX BTrend analysis: 2006 vs. 2008 vs. 2010 vs. 2011 results
Appendix B consists of a set of trend tables which displays your agency’s positive results for each item for the last four survey administrations. The last column of the table indicates whether or not there were significant increases, decreases, or no changes in positive ratings from 2006 to 2008 (the first arrow in the pair), from 2008 to 2010 (the second arrow), and from 2010 to 2011 (the last arrow). Arrows slanting up indicate a statistically significant increase, and arrows slanting down indicate a statistically significant decrease. Horizontal arrows indicate the change was not statistically significant. For example, symbols ÚÞÞ indicate there was no significant change in positive ratings from 2006 to 2008, but there was a significant increase in positive ratings from 2008 to 2010, and from 2010 to 2011. Similarly, symbols àÚÚ indicate there was a significant decrease from 2006 to 2008, but there no significant change in positive ratings from 2008 to 2010 or from 2010 to 2011.
Note: Items included on the Annual Employee Survey are noted by a double dagger (‡). An "NA" indicates that the item was not included in the survey that year.
APPENDIX B Trend Analysis
31
RESULTS FRO
M TH
E 2011 FEDERA
L EMPLO
YEE VIEWPO
INT SU
RVEY: APPEN
DIX
B

32
Percent Positive Significant Trends2006 2008 2010 2011
‡18. My training needs are assessed. 44 50 50 47 Þ Ú à
‡19. In my most recent performance appraisal, I understood what I had to do to be rated at different performance levels (for example, Fully Successful, Outstanding).
— 64 67 68 NA Þ Ú
‡20. The people I work with cooperate to get the job done. 79 82 71 70 Þ à Ú
‡21. My work unit is able to recruit people with the right skills. 35 38 39 37 Þ Ú à
‡22. Promotions in my work unit are based on merit. 23 28 28 26 Þ Ú Ú
‡23. In my work unit, steps are taken to deal with a poor performer who cannot or will not improve.
24 29 29 27 Þ Ú à
‡24. In my work unit, differences in performance are recognized in a meaningful way.
23 28 33 30 Þ Þ à
25. Awards in my work unit depend on how well employees perform their jobs. 30 35 38 36 Þ Þ à
26. Employees in my work unit share job knowledge with each other. 73 74 70 70 Ú à Ú
27. The skill level in my work unit has improved in the past year. 51 52 55 54 Ú Þ Ú
28. How would you rate the overall quality of work done by your work unit? 75 78 77 76 Þ Ú Ú
‡29. The workforce has the job-relevant knowledge and skills necessary to accomplish organizational goals.
68 69 68 69 Ú Ú Ú
‡30. Employees have a feeling of personal empowerment with respect to work processes.
30 37 42 40 Þ Þ à
31. Employees are recognized for providing high quality products and services. — — 43 41 NA NA à
‡32. Creativity and innovation are rewarded. 26 31 34 32 Þ Þ à
‡33. Pay raises depend on how well employees perform their jobs. 16 21 22 19 Þ Ú à
34. Policies and programs promote diversity in the workplace (for example, recruiting minorities and women, training in awareness of diversity issues, mentoring).
53 59 54 54 Þ à Ú
‡35. Employees are protected from health and safety hazards on the job. 53 60 63 64 Þ Þ Ú
‡36. My organization has prepared employees for potential security threats. 60 63 66 70 Þ Þ Þ
37. Arbitrary action, personal favoritism and coercion for partisan political purposes are not tolerated.
35 42 41 41 Þ Ú Ú
38. Prohibited Personnel Practices (for example, illegally discriminating for or against any employee/applicant, obstructing a person’s right to compete for employment, knowingly violating veterans’ preference requirements) are not tolerated.
56 60 60 62 Þ Ú Ú
39. My agency is successful at accomplishing its mission. — — 71 72 NA NA Ú
40. I recommend my organization as a good place to work. 51 58 63 62 Þ Þ Ú
Note: Items included on the Annual Employee Survey are noted by a double dagger (‡). An "NA" indicates that the item was not included in the survey that year.
RESULTS FRO
M TH
E 2011 FEDERA
L EMPLO
YEE VIEWPO
INT SU
RVEY: APPEN
DIX
B
APPENDIX B Trend Analysis (cont'd)

33
Note: Items included on the Annual Employee Survey are noted by a double dagger (‡). An "NA" indicates that the item was not included in the survey that year.
Percent Positive Significant Trends2006 2008 2010 2011
41. I believe the results of this survey will be used to make my agency a better place to work.
— — 46 45 NA NA Ú
‡42. My supervisor supports my need to balance work and other life issues. 65 68 70 71 Þ Þ Ú
43. My supervisor/team leader provides me with opportunities to demonstrate my leadership skills.
— — 62 62 NA NA Ú
‡44. Discussions with my supervisor/team leader about my performance are worthwhile.
49 51 59 59 Ú Þ Ú
45. My supervisor/team leader is committed to a workforce representative of all segments of society.
— — 62 61 NA NA Ú
46. My supervisor/team leader provides me with constructive suggestions to improve my job performance.
— — 59 59 NA NA Ú
‡47. Supervisors/team leaders in my work unit support employee development. 53 58 61 60 Þ Ú Ú
48. My supervisor/team leader listens to what I have to say. — — 73 71 NA NA à
49. My supervisor/team leader treats me with respect. — — 78 78 NA NA Ú
50. In the last six months, my supervisor/team leader has talked with me about my performance.
— — 73 75 NA NA Ú
‡51. I have trust and confidence in my supervisor. 56 59 64 64 Þ Þ Ú
‡52. Overall, how good a job do you feel is being done by your immediate supervisor/team leader?
57 61 66 66 Þ Þ Ú
‡53. In my organization, leaders generate high levels of motivation and commitment in the workforce.
27 35 38 37 Þ Þ Ú
54. My organization's leaders maintain high standards of honesty and integrity. 43 48 51 51 Þ Þ Ú
‡55. Managers/supervisors/team leaders work well with employees of different backgrounds.
57 63 59 59 Þ à Ú
‡56. Managers communicate the goals and priorities of the organization. 49 53 57 56 Þ Þ Ú
‡57. Managers review and evaluate the organization's progress toward meeting its goals and objectives.
46 50 54 54 Þ Þ Ú
58. Managers promote communication among different work units (for example, about projects, goals, needed resources).
41 47 47 45 Þ Ú Ú
59. Managers support collaboration across work units to accomplish work objectives.
— — 50 49 NA NA Ú
60. Overall, how good a job do you feel is being done by the manager directly above your immediate supervisor/team leader?
— — 51 50 NA NA Ú
‡61. I have a high level of respect for my organization’s senior leaders. 41 47 51 49 Þ Þ Ú
RESULTS FRO
M TH
E 2011 FEDERA
L EMPLO
YEE VIEWPO
INT SU
RVEY: APPEN
DIX
B
APPENDIX B Trend Analysis (cont'd)

34
Note: Items included on the Annual Employee Survey are noted by a double dagger (‡). An "NA" indicates that the item was not included in the survey that year.
Percent Positive Significant Trends2006 2008 2010 2011
62. Senior leaders demonstrate support for Work/Life programs. — — 47 46 NA NA Ú
‡63. How satisfied are you with your involvement in decisions that affect your work?
39 45 47 45 Þ Ú à
‡64. How satisfied are you with the information you receive from management on what's going on in your organization?
35 43 44 43 Þ Ú Ú
‡65. How satisfied are you with the recognition you receive for doing a good job? 35 42 45 43 Þ Þ à
‡66. How satisfied are you with the policies and practices of your senior leaders? 30 38 39 37 Þ Ú à
‡67. How satisfied are you with your opportunity to get a better job in your organization?
28 37 38 35 Þ Ú à
‡68. How satisfied are you with the training you receive for your present job? 48 52 54 51 Þ Ú à
‡69. Considering everything, how satisfied are you with your job? 57 62 67 65 Þ Þ Ú
‡70. Considering everything, how satisfied are you with your pay? 55 57 63 62 Þ Þ à
71. Considering everything, how satisfied are you with your organization? 44 50 56 56 Þ Þ Ú
79-84. How satisfied are you with the following Work/Life programs in your agency?
79. Telework 28 32 26 28 Þ à Ú
80. Alternative Work Schedules (AWS) 40 43 48 51 Þ Þ Ú
81. Health and Wellness Programs (for example, exercise, medical screening, quit smoking programs)
— — 39 42 NA NA Þ
82. Employee Assistance Program (EAP) — — 50 42 NA NA à
83. Child Care Programs (for example, daycare, parenting classes, parenting support groups)
— — 15 14 NA NA à
84. Elder Care Programs (for example, support groups, speakers) — — 15 12 NA NA à
RESULTS FRO
M TH
E 2011 FEDERA
L EMPLO
YEE VIEWPO
INT SU
RVEY: APPEN
DIX
B
APPENDIX B Trend Analysis (cont'd)

APPENDIX C2011 Federal Employee Viewpoint Survey (FEVS) methodology
OPM conducted the 2011 FEVS to collect data on Federal employees’ perceptions about how effectively agencies are managing their workforces. The FEVS is a tool that measures employees’ perceptions of whether, and to what extent, conditions that charac-terize successful organizations are present in their agencies. This survey was administered for the first time in 2002 and then repeated in 2004, 2006, 2008, 2010, and most recently in April/May 2011. The survey provides general indicators of how well the Federal Government is running its human resources management systems. It also serves as a tool for OPM to assess individual agencies and their progress on strategic management of human capital, and gives senior managers critical information. OPM and agency managers will use the findings to develop policies and action plans for improving agency performance.
The survey
The 95-item survey included 11 demographic questions and 84 items that measured Federal employees’ perceptions about how effectively agencies manage their workforces. The 95 items in the questionnaire are grouped into eight topic areas that respondents see as they proceed through the survey: Personal Work Experiences, Work Unit, Agency, Supervisor/Team Leader, Leadership, Satisfaction, Work/Life, and Demographics. The demographic items include location of employment (headquarters vs. field), supervisory status, gender, ethnicity/race, age, pay category/grade, Federal employment tenure, and agency tenure. In addition, the survey includes items on intention to leave the organization, and plans to retire. There are 77 (non-demographic) items in common between the 2011 and 2010 surveys, 58 between the 2011 and 2008 surveys, and 57 between the 2011 and 2006 surveys.
The sample
As was the case for each of the previous administra-tions of the survey, the 2011 survey was directed at full-time, permanent employees. OPM extended an invitation to all small and independent agencies, and 54 chose to participate in the survey effort. The survey was administered as a census to most of the small/independent agencies, as well as 13 larger agencies, at the agencies’ request.
The sample was designed to ensure representative survey results would be reported by agency/subagency and supervisory status (i.e., non-supervisors, super-visors, and executives) as well as for the overall Federal workforce.
Sample type
The sample was a probability sample; that is, each employee in the target population had a known, non-zero probability of selection. Probability sampling is a prerequisite to generalizing from survey respondents to the survey population.
Sampling frame
The sample was drawn from lists of employees from all agencies participating in the survey. Some agencies requested a census, that is, they wanted all of their employees invited to take the survey. The rest were sampled as described above. Employees were grouped into 1,114 sample subgroups corresponding to agency, subagency, and supervisory status reporting require-ments. A total of 560,084 employees were invited to participate from 83 agencies. These agencies comprise 97 percent of the executive branch workforce.
35
RESULTS FRO
M TH
E 2011 FEDERA
L EMPLO
YEE VIEWPO
INT SU
RVEY: APPEN
DIX
C
36
RESULTS FRO
M TH
E 2011 FEDERA
L EMPLO
YEE VIEWPO
INT SU
RVEY: APPEN
DIX
C
Data collection
Mode/Method
The 2011 FEVS was a self-administered Web survey. OPM distributed paper versions of the survey to components of agencies that did not have electronic access.
Response rate
Of the 540,727 employees receiving surveys, 266,376 completed the survey for a Governmentwide response rate of 49.3 percent.
Data weighting
Data collected from 2011 survey respondents were weighted to produce survey estimates that accurately represent the survey population. Unweighted data are likely to produce biased estimates of population statistics. The weights developed for the 2011 FEVS take into account the variable probabilities of selection across the sample domains, nonresponse, and known demographic characteristics of the survey population. Thus, the final data set reflects the agency composition and demographic makeup of the Federal workforce within plus or minus 1 percentage point.
Reported data
The percentages presented throughout the report are weighted data that are representative of the survey population of Federal employees and your agency’s employees. Appropriate domain weights were applied to the answers of each respondent. This process did not change any answers; rather, it gave accurate relative importance to a respondent’s answers, adjusting for over- and under-represented groups of respondents.
Data analysis
In performing statistical analyses for this report, OPM employed a number of grouping procedures to simplify presentations. Most of the items had six response categories: Strongly Agree, Agree, Neither Agree nor Disagree, Disagree, Strongly Disagree, and No Basis to Judge/Do Not Know. In some instances, these responses are collapsed into one positive category (Strongly Agree and Agree), one negative category (Strongly Disagree and Disagree), and a neutral category (Neither Agree nor Disagree).
Six items were added to the 2011 survey. These six items (Q. 72, Q. 74, Q. 75, Q. 76, Q. 77, Q. 78) were added to the Work/Life section. In addition, more response choices were added for the telework item (Q. 73) for the 2011 survey. In the 2010 survey, this item (Q. 72) had fewer response choices with slightly different wording.
We conducted analyses on all survey items for the various demographic categories. More detailed survey statistics are available in the published Federal Employee Viewpoint Survey Data volume for this survey and can be downloaded from OPM’s Federal Employee Viewpoint Survey website: www.FedView.OPM.gov.
"Do Not Know" and "No Basis to Judge" responses
Responses of Do Not Know/No Basis to Judge were removed before calculation of percentages. In 2006 and 2008, all responses were included in the calculations. To ensure comparability, data from previous years were recalculated, removing Do Not Know/No Basis to Judge responses, before any calculations with prior survey data were carried out.

United StateS Office Of PerSOnnel ManageMent
Planning and Policy Analysis1900 E Street, NW
Washington, DC 20415www.FedView.opm.gov


