AGE WANTS TO LIVE LIFE - Doroas Italy, Spain and the Baltic countries. In o ctober, Doro launched...
58
AGE WANTS TO LIVE LIFE ANNUAL REPORT 2015
Transcript of AGE WANTS TO LIVE LIFE - Doroas Italy, Spain and the Baltic countries. In o ctober, Doro launched...

AGE WANTS TO LIVE LIFE
ANNUAL REPORT 2015

CONTENTS
DORO in brief 3Year in brief 5CEO’s Comment 6Strategy 8Market 11The Doro share 12Sustainable operations 14Case study Doro Care 16Directors’ report 17Coporate governance report 22Board of Directors 25Management 26Financial report 27Notes and accounting principles 36
The formal Annual Reportcomprises pages 17–53.
This annual report is a translation of the Swedish orginal. If any differences exist the Swedish version is the official version and should prevail.
25%annual growth rate for the last five years
40 COUNTRIES ON
5 CONTINENTS
MISSIONWe develop telecom products and services for Seniors to lead full and rich lives: to do things they want to do more easily as well as the things they thought they might never do.
VISIONWe want to make Age a life stageof independence, empowermentand enjoyment: Seniors shouldfeel free to pursue their desiresand get what they want out of life.

Doro is the market leader for senior mobile solutions in Europe. The company is dedicated to understanding and responding to the needs and preferences of senior users with the objective to cre-ate satisfied and loyal end-users. Doro’s products are highly appreciated by their users and as many as 82 percent would recommend them to friends and family.
LARGE AND GROWING MARKETGlobally, there are more than 550 million people aged 65 or older and demo-graphics indicate that the number will be growing fast for many years to come. By the year 2020 the group is expected to consist of more than 700 million people. Most of them will at some point need support in keeping up with the technical development and exploring new conve-nience services.
GLOBAL DISTRIBUTIONDoro’s product are sold in more than 40 countries on five continents through an extensive network of leading telecom operators, specialists and retailers with strong distribution channels to end-customers. The distribution network and Doro’s ability to efficiently develop new distribution relationships are key compe-titive advantages.
SOLUTIONS FOR INDEPENDENT LIVINGDoro offers value-added consumer solutions for seniors in form of easy-to-use phones with functions that facilitate everyday life. Doro also offers services that further enable and improve the qua-lity of independent living for seniors and their families. Doro’s offering spans from phones and smart devices, to software and support services, with a strong focus on ease of use.
CONTINUOUS INNOVATIONDoro has comprehensive in-depth knowledge of its target group, and has in-house teams for product develop-ment in Paris, Lund and Hong Kong. The acquisition of Caretech AB in 2015 added further know-how in the area of digital care solution development.
1,838Total revenue 2015, SEK m
DORO IN BRIEF
Doro is the market leader in telecom solutions for seniors. The company provides easy-to-use telecom and care solutions tailored for the world’s growing population of seniors.
A history of growthIn the last five years, Doro has enjoyed a compound annual growth rate of 25 percent.
0
250
500
750
1 000
1 250
1 500
1 750
2 000
20152014201320122011
Total revenue, SEKm
DORO ANNUAL REPORT 2015 DoRo In BRIEf3

DORO IS THE EUROPEAN MARKET LEADER IN TELECOM SOLUTIONS FOR SENIORS, PRO-VIDING EASY-TO-USE TELECOM AND CARE SOLUTIONS TAILORED FOR THE WORLD’S GROWING POPULATION OF ELDERLY

YEAR IN BRIEF
Doro made great progress in 2015. Total revenue grew by 44 percent and operating profit increased by 19 percent.
The sales growth consolidated Doro’s strong market position in easy-to-use mobile and digital care solutions serving the elderly target group. Doro’s market share of the senior mobile phone market in the UK, france and Germany has increased. The company also significantly strengthened its position in relatively new markets such as Italy, Spain and the Baltic countries. In october, Doro launched its first 4G-phone in Europe, which was was well received by operators and end-users. The integra-tion of Caretech, one of the leading European suppliers of digital care solutions and services for elderly, was car-ried out according to plan. In early 2016, Caretech was renamed Doro Care.
Q1 • Total revenue and new orders increased by 46.0 per-cent and 77.9 percent respectively. Results impacted by heavy currency losses.
• Caretech consolidated in february.
Q2 • Total revenue and new orders increased by 55.3 per-cent and 31.4 percent respectively. operating margin of 6.9 percent.
• Caretech won numerous Swedish contracts with municipalities.
Q3 • Total revenue and new orders increased by 34.5 per-cent and 33.7 percent respectively. operating margin of 6.7 percent.
Q4 • Total revenue and new orders grew by 43.1 percent and 43.8 percent respectively. operating margin of 9.4 percent.
• Commercial launch of Doro’s first 4G smartphone.
44%revenue growth
80 000DoroCare subscribers
GoalOutcome
2015
Annual growth, % 20 44.0
Long-term operating margin, % 10 5.2
Maximum leverage ratio (interest-bearing debt/equity) 1.0 0.40
Dividend, portion of net profit, % 33 0
2014 2015
Total revenue, SEKm 1,276 1,838
Gross margin, % 41.0 37.2
Operating profit (EBIT), SEKm 79.7 95.2
Operating margin (EBIT), % 6.2 5.2
Cash flow from operations, SEKm 22.5 85.7
Earnings per share after tax, SEK 2.76 2.78
Dividend per share, SEK1) 0 0
Number of employees 172 3581) See information on proposed allocation of company profit page 20.
Financial goals and goal achievement
Key figures
DORO ANNUAL REPORT 2015 YEAR In BRIEf5

CEO’S COMMENT
I am pleased to report that our history of strong growth continued in 2015 as sales grew by 44 percent. This included the acquisition of Caretech which was consolidated on 1 february 2015, but even excluding Caretech sales grew by 30 percent. This consolidates our market leading position in easy-to-use mobile and digital care solutions for seniors.
There were several reasons for the strong growth. We made good progress in our devices business in most regions, and won a number of large telecom operators as new customers. In addition, growth was driven by the introduction of new smart phones and the launch of our first 4G-phone in the fourth quarter. We also noticed that competition became a little less fierce in the feature phone segment, as some of the leading phone suppliers chose to shift their focus more towards smart phones. At Doro, howe-ver, we are convinced that demand for feature phones in the senior segment will last for many years to come.
Geographically, we made good inroads in Italy and Spain in particular, while our nordic business expanded in the Baltics. In USA and Canada we believe that sales
will pick up following the launch of our first smart phones in these markets in early 2016.
Meanwhile, Caretech now called Doro Care (see page 16), developed according to plan. The digitalization of the Swedish market for which our offer is very well positioned, has continued at good pace. The first synergies were reali-zed during the year, and more will follow as Doro Care will increasingly benefit from Doro’s international presence. Having previously focused entirely on business-to-business solutions, Caretech took its first step into the consumer mar-ket by launching a Personal Care Alarm service in the UK in partnership with BT and Lloyds Pharmacy.
Our operating profit also improved, though not at the same rate as sales, mainly due to a negative currency impact in the first quarter related to insufficient hedging. The operating profit improved due to successfully being able to com-pensate the higher dollar level in pricing, lower cost as percentage of sales and lower technology cost.one of the most encouraging aspects of 2015 was that we strengthened our
platform for continued growth and improved profitability even further, both in devices with the smartphone platform and now also in services. In recent years, we have significantly increased our investments in the development of new devices. Investments will now stabilize going forward and this enables us to improve profitability.
We also intend to expand Doro Care, both by means of a broader offering and international expansion greatly facilitated by Doro’s established net-work. In february 2016 Doro acquired Trygghetssentralen, the largest private social alarm center in norway.
The group has the intention to develop an offering to the consumer market. Growth in services will have the added benefit of increasing our share of recur-ring revenues. I firmly believe that our growth in services can be as strong as in devices, even though it may take some time to reach that level.
Several years of strong growth inevita-bly puts some strain on the organisation, and in 2016 we will consolidate our organizational structure in a number of areas in order to prepare for continued expansion.
I would like to take this opportunity to thank all Doro employees for their valua-ble contributions. Their competence and commitment are crucial for our conti-nued progress. our accomplishments during 2015 further strengthened our portfolio and market position, and I am convinced that we have a firm foundation on which to achieve continued growth and improved profits in 2016 and beyond.
In 2015 we strengthened our platform for continued growth even further and improved profitability, in devices and now also services.
Jérôme Arnaud, President & CEo
DORO ANNUAL REPORT 2015 CEo’S CoMMEnT6

JÉRÔME ARNAUD, PRESIDENT & CEO
our history of strong growth continued in 2015 as sales grew by 44 percent. This includes the acquisition of Caretech.
“
”

STRATEGY
CLOSING THE TECHNOLOGY GAPDoro develops secure and easy-to-use products and services for seniors. As people increasingly communicate via mobile devices and the Internet, it crea-tes a technology gap between seniors and the rest of the population.
Doro’s products and services help close this gap. By offering value-added, easy-to-use, secure solutions, Doro enables seniors to communicate more easily with family and friends and to be active citizens and consumers despite impairments that may come with age.
Doro has comprehensive expertise in this market and closely monitors techno-logy developments in order to adopt new
trends and solutions, and thereby enable continuous innovation.
INCREASING SERVICE CONTENTHistorically, Doro’s business model was dominated by hardware, but in a broader strategic approach the service side of the business is now increasing. The increased share of services implies an increased share of recurring revenue and a more stable revenue stream. An offering which combines hardware and services makes Doro more competitive and enables pro-duct differentiation, while also increasing brand loyalty and alleviating immediate price pressure.
The acquisition of Caretech in 2015 was a key step in this strategy. Caretech offers a complete social alarm service and targets customer segments such as municipalities. (See page 16.) Combining Caretech’s services with Doro’s mobile devices will add user value and strengthen the customer value proposition.
INTERACTION WITH END USERSAt the heart of Doro’s expertise is a solid understanding of communica-tion patterns and the specific needs of seniors. This in-depth knowledge enables the company to refine and improve its product portfolio according to defined
user needs and to enhance the user experience.
Doro regularly conducts major market surveys in order to fully understand the target group. The 2014 survey involved 1,600 persons aged 60+ who considered buying a phone within the next 12 months.
A number of end users have agreed to let Doro track their device habits for research purposes. Doro can monitor and analyse how much time its end users spend phoning and surfing, what types of apps they download, etc. The information is of course anonymised. other sources of input from customers and potential customers are the Doro flagship store in Paris and the web shop launched in 2015.
Increasing quality of life by using technology.In order to achieve its mission, Doro applies a strategy based on three pillars
FINANCIAL GOALS
33%Dividend, portion of net profit
1.0Maximum leverage ratio (interest-bearing debt/equity)
20%Annual growth
10%Long-term operating margin
DORO ANNUAL REPORT 2015 STRATEGY8

AT THE HEART OF DORO’S EXPERTISE IS A SOLID UNDERSTANDING OF COMMUNICATION PATTERNS AND THE SPECIFIC NEEDS OF SENIORS

DEMOGRAPHICS ARE A KEY LONG-TERM DRIVER OF A GROWING DEMAND FOR DORO’S PRODUCTS AND SERVICES. THE AGE STRUCTURE IS SHIFTING RAPIDLY, ESPECIALLY IN THE OECD COUNTRIES, AND SENIORS NOW COMPRISE THE FASTEST-GROWING AGE GROUP

MARKET Doro is the market leader in the senior segment of the mobile phone market. Product development and marketing are based on an in-depth understanding of the communication needs of seniors.
THE SENIOR PHONE MARKETDoro addresses the senior segment of the mobile phone market, offering easy-to-use and reliable telecom products and services. As the number of seniors grows, so does the number of people needing special products and solutions, as many feel that the mainstream market offer does not address their needs. Doro offers telephones with large buttons, clear sound, easy-to-read displays and, in particular, a number of functions that facilitate the user’s everyday life and provide security.
DEMOGRAPHICS DRIVE DEMANDDemographics are a key long-term driver of a growing demand for Doro’s products and services. The age structure is shifting rapidly, especially in the oECD countries, and seniors now comprise the fastest-growing age group.
over the coming decades the group of seniors will continue to grow, both as a proportion of the total population and in absolute terms. Between 2010 and 2050 the older population in the EU will increase by 58 million or 77 percent, according to European Commission forecasts.
FEATURE PHONES REMAIN IMPORTANTAs in the overall mobile market, seniors are increasingly migrating from feature phones towards smartphones. feature phones do, however, remain very important in the senior segment as a large proportion still feels that feature phones are more comfortable. Doro expects sales of senior feature phones to remain stable for several more years, and will continue to improve both its ranges of mobile phones.
Doro launched its first 4G smartphone in Europe during the fourth quarter and in the US during the first quarter 2016.
THE CLEAR MARKET LEADERDoro is the market leader in the senior segment of the mobile phone market, and present in more than 40 countries. The company has its strongest position in the nordic countries. Sales outside the nordics have risen considerably in recent years, especially in france, Germany and the UK. In 2015, Doro also gained market shares in several markets including Spain, Italy and the Baltics. In regions outside the nordics, Doro expects significant growth opportunities within the existing geographical footprint.
IN-DEPTH MARKET RESEARCHSeniors are not a homogenous group. Doro continuously conducts consumer studies to ensure a deep understanding of consumers aged 65+. The company’s segmentation model holds a wealth of in-depth description of the seniors’ needs, wants and interest, and confirms that actual attitudes towards technology and outlook on life are more important than age to define the seniors’ needs for telecom products and services. The model consists of six distinct segments, and four of those are defined as Doro’s core segments.
This model allows Doro to build a balanced product range and focus pro-duct development on the most relevant segments, while also taking into account geographical differences.
DORO ANNUAL REPORT 2015 MARKET11

THE DORO SHARE
The Doro share has been listed on nasdaq oMX Stockholm’s nordic Small Cap list since 1993. It has a diversified ownership base and good liquidity.
SHARE PRICE AND MARKET CAPITALIZATION During the year, the value of the Doro share increased by 59.8 percent compa-red with the oMX Stockholm PI index, which increased by 6.5 percent.
The highest price paid for the share during the year was SEK 62.00 and lowest was SEK 37.50. As of December 30, 2015, the closing price for the Doro share was SEK 62 and the market capitali-zation SEK 1,440m (823).
In 2015, more than 97 percent of the turnover in the Doro share was genera-ted on nasdaq oMX Stockholm. In total approximately 20.9m shares were traded during the year with an average daily tur-nover of approximately 83,300 shares.
SHARE CAPITALThe Annual General Meeting in April 2014 adopted the Board of Director’s proposal to obtain authorization, in the period until the next Annual General Meeting is held, to issue new shares up to an aggregate number of shares corresponding to 10 per cent of the out-standing shares at the time of the AGM. following a vote, the AGM also adopted a
Board resolution authorizing the acquisi-tion of treasury shares.
As of January 1, 2015, Doro’s share capital amounted to SEK 21,204,483 (20,806,174) with a total number of outstanding shares of 21,204,483 (20,806,174), each with a quotient value of SEK 1.00. The share capital increased by SEK 2,033,772 in 2015, corresponding to 2,033,772 shares with a quotient value of SEK 1.00. At the end of 2015, share capital was SEK 23,238,255 (21,204,483) and the number of shares 23,238,255 (21,204,483) with a quotient value of SEK 1.00.
EMPLOYEE WARRANTS PROGRAM The Extraordinary General Meeting on August 21, 2014 adopted a resolution to effect a directed issue of warrants to senior executives and key employees in the Doro group. Each warrant entitles the holder to subscribe for one share at a pre-determined price of SEK 42.00 in the period May 22, 2017 to June 21, 2017. The warrant price of SEK 1.26 is calculated according to the Black & Scholes model, taking into consideration estimated dividend and a share price
of SEK 31.10, volatility of 30%, risk-free interest of 0.31% and a duration of 2.78 years (Sep 12, 2014-Jun 21, 2017). The CEo subscribed for 200.000 warrants and the rest of the group management subscribed for 325.000 warrants. other senior executives subscribed for 175.000 warrants. Doro Incentive subscribed for 141.000 warrants to be used for future employees. Doro issued a total of 841.000 warrants. In 2015, senior executives subscribed for a further 135,000 warrants and 65,000 warrants were repurchased. Detailed information about the warrants program is available at www.doro.com.
DIVIDEND AND EQUITY-RELATED TARGETS Doro’s long-term target is a dividend payout ratio of approximately one-third of net profit. In addition, the Board has set a maximum debt/equity ratio of 1.0. By the end of 2015, Doro’s net interest-bearing liabilities totaled SEK 116.6 m (excluding financial leasing of alarms). The Board proposes that no dividend be paid for 2015. Read more about the Doro share and the current share price at www.doro.com.
SHAREHOLDINGS BY HOLDING SIZE2) Holding, no. of shares
No. of shareholders
% of allshareholders
1–500 5,358 72.4
501–1,000 976 13.2
1,001–5,000 823 11.1
5,001–10,000 105 1.4
10,001–15,000 27 0.4
15,001–20,000 19 0.3
Over 20,001 97 1.3
Total 7,405 100.02) Data from Euroclear
53%
SwedenLuxemburgUK
FranceFinland
14.4%
6.5%
10.9%
5.0%10.2%
Other
1) Data from Euroclear
INVESTORS PER COUNTRY 1)
DORO ANNUAL REPORT 2015 THE DoRo SHARE12

SHARE CAPITAL TRENDYear Transaction
Change in numberof shares
Issue pricein SEK*
Increase in sharecapital in SEKm
Amount paidin SEKm
Total numberof shares
2001 Directed issue 11,764,705 8.50 11.8 100
2005 New issue 7,141 1.00 0.0 0
2005 Reverse split, 5:1 –17,180,000 0.00 0.0 0
2006 New issue, 3:1 12,885,000 6.00 64.4 71.2
2006 Offset issue 227,631 7.66 1.1 1.5
2009 Directed issue 1,700,000 9.50 1.7 16.2
2011 Directed issue 241,543 25.56 0.2 6.3
2013 Directed issue 1,457,000 27.89 1.5 40.6 20,806,174
2014 Warrant program 398,309 35.30 0.4 14.1 21,204,483
2015 Directed issue 2,033,772 41.50 2.0 84,4 23,238,255
SHARE DATATransaktion 2015 2014 2013 2012
Undiluted number of shares at year-end, thousand 23,238 21,204 20,806 19,349
Share price at year-end, SEK 62.00 38.80 44.00 24.50
Quotient value, SEK 1.00 1.00 1.00 1.00
Earnings per share, SEK 2.78 2.76 3.07 2.73
Cash flow per share, SEK1) 3.69 1.06 5.60 2.08
Reported equity, SEK 20.74 15.79 13.79 10.80
Dividend per share, SEK 1.50 1.25
P/E-ratio2) 22.30 14.05 14.33 8.98
Dividend yield,%3) 3.4 5.11) Cash flow from operations divided by undiluted number of shares at year-end2) The share price at year-end divided by earnings per share for the year.3) Dividend per share divided by the share price at year-end.
MAJOR SHAREHOLDERS 4) 5) At 31 December 2015 Ten largest shareholders
No. ofshares
Share of capitaland votes, %
Accendo Capital 1,710,310 7.4
Handelsbanken Fonder 1,384,061 6.0
Nordea Investment Funds 1,167,428 5.0
Swedbank Robur Fonder 1,166,929 5.0
Clearstream Banking S.A., W8IMY 1,152,144 5.0
Försäkringsaktiebolaget, Avanza Pension 1,000,959 4.3
FCP Objectif Investissement, Microcaps 875,000 3.8
Catella Fondförvaltning 654,800 2.8
Originat AB 650,000 2.8
Nordnet Pensionsförsäkring AB 566,009 2.4
Subtotal 10,407,640 44.8
Total number of shares 23,238,255 1004) Data from Euroclear5) www.doro.com
0
1,000
2,000
3,000
4,000
5,000
6,000
30
40
50
60
70
80
Jan Feb Mar Apr May Jun Jul Aug Sep Oct Nov Dec
PRICE TREND AND VOLUME
Number of shares traded OMX (incl. aftermarket) '000 Doro share, SEK OMX Stockholm P1
DORO ANNUAL REPORT 2015 THE DoRo SHARE13

SUSTAINABLE OPERATIONS
operations are conducted in a respon-sible and honest manner to secure and safeguard long-term sustainable devel-opment. Doro wishes to earn the trust of all its stakeholders, from shareholders and others active in the capital market, through employees and suppliers to customers and society. This is not only a key value – it also plays an important role in the company’s success. for this reason, Doro maintains a sustainability perspec-tive in all decisions and processes.
RESPONSIBILITY THROUGHOUT THE CHAINDoro’s core values are Trust, Care and Ease • Trust is about always delivering what we promise.
• Care is about compassion and attend-ing to the needs of others.
• Ease is about doing all we can to make everyday life a little easier.
These core values imbue Doro’s corpo-rate culture and act as guiding principles in Doro’s product development and interaction with employees, custom-ers and end users. In a rapidly evolving
industry, Doro must understand the various needs of end users, and how such needs change. Doro must be flexible in order to deliver the best easy-to-use products while assuming responsibility throughout the entire chain.
FROM DESIGN TO RECYCLING IN A RESPONSIBLE WAYDoro creates and develops high-quality products. When we develop a product, we always try to make it a little better than its predecessor, not just in terms of performance, but also with energy efficiency, ergonomics, user-friendliness, recycling and service in mind. Doro takes a holistic view of the life cycle of its products.
for us, quality and respect for the environment and people are among the cornerstones of our business, on which we have built our success and the Group’s long-term profitability.
The use and recycling of our products are covered by several environmental directives, regulations and stringent legal requirements. Doro’s quality and environmental manager is responsible for Doro’s compliance with prevailing
laws and regulations. In addition, each country in which Doro operates has an Environmental officer responsible for ensuring compliance with the envi-ronmental legislation of the country in question.
MATERIALSDoro seeks to select materials with the least possible impact on the environ-ment. As more environmentally friendly materials are developed, we assess whether they can replace those currently used.
Registration of chemicals accord-ing to REACH1) concerns importers or manufacturers of chemical substances. As an importer of finished products with a final technical specification and design from a non-EU manufacturing unit, and since these products do not emit any chemical substances in normal use, Doro is not required to register or report its use of any chemicals. However, the products must comply with the disclo-sure requirements of REACH’s SVHC section.2) These requirements do not in themselves impose any limitations, but require informing distributors and users
if the threshold for any listed chemical is exceeded.
There are several EU directives and regulations that affect Doro’s operations. The more exhaustive ones include the Directive on the restriction of the use of certain hazardous substances, RoHS,3)
from 2006 in the 2012 recast of the RoHS directive, which is the second stage of the directive. The directive now also entails a CE labelling requirement, effective from January 2013, and not just environmental labelling, as was previously the case. A restriction for materials is Po P5) ordinance, which was tightened in some parts in 2012.
PRODUCTIONDoro does not conduct any operations that are subject to Permits or notifica-tion. nor does Doro own any production units; instead, it cooperates extensively with several plants that manufacture its products.
Various environmental requirements are imposed in reviews of such plants. Doro’s major suppliers are ISo 14001 certified, and an increasing number of plants are working with various
Doro’s products and services are designed to make daily life easier and more secure for end customers.
DORO ANNUAL REPORT 2015 SUSTAInABLE oPERATIonS14

environmental programs with the inten-tion of gaining ISo 14001 certification.
TRANSPORTIn its own operations, Doro seeks to minimize its external Impact on the environment through the efficient use of resources in all channels. Product and packaging logistics are optimized by means of a constant focus on planning and reviewing volume requirements for packaging and instructions. As far as is commercially viable, Doro uses environ-mentally certified suppliers and transport companies. Doro also broadly uses video- and teleconferencing.
RECYCLINGThe Waste electrical and electronic equipment directive, WEEE,4) also affects Doro’s operations. There is also a directive regarding batteries from 2008, according to which battery importers must bear the costs associated with bat-tery waste, as well as Packaging Material regulation.
As an importer, Doro must also ensure that all imported battery cells are labelled in accordance with the directive.
Doro is also part of the packaging industry’s own recycling organization.
GSM ASSOCIATIONDoro cooperates with mobile operators and suppliers.
Through the GSM Association to develop energy-efficient infrastructure and ensure that customers use energy-efficient handsets. Reducing mobile device emissions through design and recycling is an example.
DORO’S ETHICAL RESPONSIBILITYother important cornerstones in Doro’s operations are honesty and conducting business with great personal integrity and respect for the integrity of others. Clear guidelines for employees and suppliers alike are provided in our Doro Business Ethics. It is the responsibility of each manager to ensure that their staff are familiar with these rules and comply with them. The company also applies the Doro Corporate Social Responsibility Policy, which is based primarily on the generally accepted principles of the United nations. Through its “Supplier Score Card”, Doro gives direct feedback to suppliers.
Since 2008, Doro has conducted third-party audits to ensure compliance with the company’s policies. If discrepan-cies are discovered, Doro is entitled to discontinue all cooperation with the supplier. In this regard, inspections are regularly conducted at all plants.
DORO’S BUSINESS ETHICS Doro’s Code of Ethics is a guide for both employees and the company’s suppliers in order to secure a responsible conduct towards all our stakeholders.
With regard to its employees, Doro focuses in particular on: • Work environment • Labor rights • Reward and development • Conflicts of interest • Employee participation
With regard to its customers, Doro focuses on: • Customer satisfaction • Product quality • Prohibited gifts and favors
With regard to its suppliers, Doro focuses on: • Prohibited gifts and favors • Human rights • Environmental issues
With regard to society, Doro focuses on: • Compliance with laws and other local regulations
• Commitment to the community • Environmental impact
With regard to its shareholders, Doro focuses on: • Communication
The code is available in its entirety at www.doro.com.
DORO’S RESPONSIBILITIES TO ITS EMPLOYEESGreat and equal development opportu-nities and recruiting, retaining and devel-oping individuals with the right expertise and attitude is crucial for a company such as Doro. We therefore attach consider-able importance to employee satisfac-tion. We strive to provide employees with the scope and resources to grow, both in their current positions and advancement opportunities.
Doro aims to keep decision-making paths short and for each individual to feel involved in and responsible for the devel-opment of the Company. In Doro’s flat organization, responsibilities and powers
are delegated, which places demands on employees.
one advantage of Doro’s organization is that sales people, product developers and marketers live close to customers and suppliers – an aspect that is increas-ing in importance as joint development projects are on the rise and reaching completion faster. Another advantage is that the origins of Doro’s employees are diverse, they speak a variety of languages and understand different cultures.
With operations in more than 40 countries, Doro has a large number of interfaces with suppliers, retailers and customers. Today, the exchange of expe-rience and expertise between the various companies is relatively advanced and the ambition is to formalize training activities, primarily in sales methods and product development.
1) Registration, Evaluation, Authorization and restrictions of Chemicals.
2) Substances of Very High Concern.3) Restriction on the Use of Certain
Hazardous Substances. 4) Waste of Electric and Electronic Equipment.5) Persistent organic Pollutants.
DORO ANNUAL REPORT 2015 SUSTAInABLE oPERATIonS15

DORO CARE Doro Care is a leading provider of digital care solutions. The offering includes alarm and communication services that enable elderly to independently live in their homes longer and more safely.
In 2015, Doro Care (previously Caretech) achieved continued strong growth in revenue, and a growing demand for digital alarm services. The company’s social alarm service now handles around 80,000 users in Scandinavia alone. The growing demand is driven by well known long-term demographic changes meaning that the population is getting older, particularly in developed countries. Most seniors like to continue to live at home, and for society this is also the most cost-effective way to care for dependent elderly. furthermore, technological development drives a shift away from analogue systems towards digital solu-tions. This trend has been strong in the nordic countries in 2014 and 2015. A similar global development is ongo-ing and expected to gather further momentum in the coming years.
Caretech was successfully integrated into Doro during 2015, and in early 2016 the name was changed to Doro Care. The services offered by Doro Care complement the Doro products and vice
versa, and there is a significant scope for developing competitive solutions combining products and services. The Doro brand and infrastructure are also expected to assist the progress of Doro Care’s international growth.
our focus is on expanding the pre-sence outside the nordic markets as well as extending the service offering. The strategy for international expansion will be based on Doro’s established network, and will initially target a number of European markets. The broader offering will include solutions for the consumer market, whereas previously the focus has been on business-to-business solutions. In 2015 the more mobile solutions of Doro were added to the Caretech offe-ring and the products were aligned for alarm receiving and alarm pendants. An example of the broader offering was the launch in Sweden of a remote visit ser-vice that minimizes the need for nightly check-ups that are both costly to society and intrusive for the individual.
DORO ANNUAL REPORT 2015 DoRo CARE16

DIRECTORS REPORT

OPERATIONS IN 2015
Doro AB (also referred to below as Doro) is a public limited company. The Company has its registered office in Lund, Sweden. It is registered in Sweden under corporate identity number 556161-9429. The head office address is Magistratsvägen 10, 226 43 Lund, Sweden. Doro has subsidiaries in France, Hong Kong, Norway, the UK, Germany, Italy and the US. The legal structure of the Group is shown in Note 9.
OPERATIONSDoro is a Swedish company that develops, markets and sells mobile communications solutions that are specially adapted for the growing number of seniors worldwide. With more than 40 years’ experience and operations in more than 40 countries, Doro is the world-leading brand for easy-to-use mobile phones and complementary safety services for seniors. Doro created the category of Care Electronics and has won a number of international design awards, most recently Best Mobile Device for Accessibility & Inclusion at the 20th Global Mobile Awards.
BUSINESS ENVIRONMENTDoro operates in the rapidly changing market for mobile communications solutions for older consumers in Europe, North and South America and the Asia-Pacific region. Doro’s products are manufactured by contractors, mainly in China. Doro protects its products by owning moulding tools and design rights, and also by actively participating in the design, development and quality assurance processes. Doro coordinates its sourcing so as to achieve economies of scale and attractive prices.
THE SHAREInformation about the Doro share can be found on page 12–13.
THE PAST YEAR’S OPERATIONS IN BRIEFTotal revenue amounted to SEK 1,838.0m (1,276.2), an increase of 44.0 percent. Adjusted for acquisitions the increase was 30.5 percent.• Operating profit (EBIT) totalled SEK 95.2 (79.7).• The operating margin was 5.2 percent (6.2).• Profit after tax for the year amounted to SEK 63.8 (58.2m).
• Earnings per share after tax amounted to SEK 2.78 (2.76).• Cash flow from current activities amounted to SEK 85.7m (22.5).• Doro acquired Caretech AB in February 2015 (see note 18)
During the year a number of new products and services were launched. Examples include:• Doro Liberto® 825 – the 4G smartphone that thinks like you, thanks to its
unique easy-to-use interface. • Doro Liberto® 820mini – the small smartphone with a big heart.• Doro 820mini Claria – the easy to use talking smartphone for blind and
visually impaired people. • Doro 6030 – easy camera phone with large display. • Doro Secure®580IP – easy mobile phone for improved safety, with IP
protocol to the Alarm Receiving Center.• A complete new range of accessories, including qualitative smart magnetic
wallet and flip cases for smartphones.
REVENUE AND RESULT OF OPERATIONSDoro’s total revenue during the year amounted to SEK 1838.0m (1,276.2), an increase of 44.0 percent compared with 2014. Adjusted for acquisitions the increase was 30.5 percent. All markets grew. The strongest growth came in Nordic where Caretech has a strong position, we have also seen strong growth in EMEA, Germany and the UK, where new product launches have been well received by customers.
EBIT amounted to SEK 95.2m (79.7), yielding an EBIT margin of 5.2 percent (6.2). The lower margin is an effect from a non-recurring currency loss due to insufficient hedging of SEK –27.1 in Q1,2015. Operating margin in quarter 4,2015 was 9.4 percent (8.1).
Net income for the year amounted to SEK 63.8m (58.2). Net financial items were SEK –10.8m (–0.4).
CASH FLOW, INVESTMENTS AND FINANCIAL POSITIONCash flow from current activities amounted to SEK 85.7m (22.5).The Group’s net cash flow and change in liquid funds, which during the year amounted to SEK –34.3m (–45.7), was charged with corporate acquisitions of SEK
–162.0m (–21.9) and investments of SEK –58.7m (–29.3).The investments that were capitalised are primarily attributable to product development. No dividend was paid in 2015 (-31.7). At year-end Doro had interest-bearing liabilities of SEK 194.6m (41.7), while cash and cash equivalents amounted to SEK 43.9m (78.2). The equity ratio increased to 40.4 percent (39.3) at the end of the period.
FINANCIAL POLICYThe aim of the policy is to clarify responsibilities and to describe general rules and guidelines for specific areas within Doro, with a view to supporting operations, reducing financial risk and allowing efficient use of capital and cash flow.
The estimated net flows based on normal volumes and current price lists (which usually apply for around three months) are 60–80 percent hedged. Doro applies hedge accounting in accordance with IFRS.
BOARD OF DIRECTORSThe Board of Directors consists of Chairman of the Board Bo Kastensson, Charlotta Falvin, Karin Moberg, Jonas Mårtensson, Lena Hofsberger, Henri Österlund and CEO Jérôme Arnaud. The Company’s CFO Magnus Eriksson is co-opted onto the Board as secretary.
REMUNERATION TO SENIOR EXECUTIVESThe Board’s proposed guidelines for remuneration of senior executives for 2016 are principally that salaries and other terms of employment for the management will be at market levels. In addition to fixed basic salary, the management can also receive variable remuneration and bonuses which are to have a predetermined ceiling and are to be based on results achieved relative to established targets (and in certain cases other key performance indicators).
The maximum cost, including social security contributions, for variable remuneration may not exceed the fixed base salary of the company’s management.
For 2015 the amount was SEK 15 million. An amount is to be set annually for the total cost for fixed and variable remuneration. This amount must
DORO ANNUAL REPORT 2015 DIRECTORS´ REPORT18

include all the Company’s remuneration costs. The Company’s senior executives are able to allocate part of their fixed and variable remuneration to other benefits, such as pension benefits. The management’s pension plans shall mainly be defined contribution plans.
If employment is terminated by the Company, senior executives may be entitled to severance pay; in which case, this shall have a predetermined ceiling. No severance pay is payable if employment is terminated by the employee. The Board has the right to deviate from the guidelines if there are particular reasons for this in individual cases.
This proposal is in line with the guidelines adopted by the 2015 Annual General Meeting.
PRODUCT DEVELOPMENT AND DEVELOPMENT EXPENSESDoro carries out product development and design projects jointly with various external partners. In addition to the Company’s own development costs, the manufacturing partner also has significant development costs. Doro engages design companies from different countries and the costs may be either fixed or variable. Doro also sometimes buys technology from various external companies.
In addition, Doro invests in various moulding tools and design rights in order to protect the products’ designs. These costs are capitalised until the products are ready to be supplied, when depreciation begins.
For 2015 the Group’s costs of development work amounted to SEK 60.5m (65.6).
At the end of 2015 Doro had been granted two registered European patents as well as the right to use various patents under contract. Doro has registered the trademarks Doro, Doro Care, Care Electronics, Doro Phone-Easy, Doro Secure, Doro Experience, Doro Connect & Care, Doro Liberto, Ergonomic Sound, Audioline, along with a large number of other product names and figurative trademarks.
Doro has also protected its designs through a large number of registered design rights. During the year we applied for three patents in accordance with the Company’s patent routines, as well as a couple of new trademarks and design rights.
INVESTMENTSInvestments are made in design, moulding tools, certification processes, control equipment, other equipment, computers and software systems.
Investments amounted to SEK 58.7m (29.3). See also accounting principles.
LEGAL PROCEEDINGSDuring the year Doro was not involved in any disputes that have affected or will affect the Company’s position in a material manner.
Doro has brought an action against mobile phone manufacturer Beafon Mobile GmbH citing infringement of the Company’s registered design rights. During the year the parties reached a settlement that involves Beafon paying EUR 1 for each phone sold for use of the design rights.
In addition, the holder of the rights to the French brand and trademark EASYPC has written to Doro threatening to object to Doro’s trademark application in the EU for “Doro EasyPC”. Doro has contested that there is any risk of confusion and opposition proceedings are now in progress before the EU’s registration authority OHIM.
QUALITYRegular follow-up of suppliers’ quality is carried out quarterly using the “Doro scorecard”. Follow-up focuses on the suppliers’ manufacturing processes and specifies points of escalation for reported quality failures and associated remedial action. Potential suppliers are assessed on site in respect of all quality-related processes. At the same time, an initial evaluation is carried out in connection with Doro’s Code of Supplier Conduct. The product quality of individual consignments is also checked on an ongoing basis.
REGULATIONSDoro’s quality and environmental manager continually monitors the Company’s products to check that, as a minimum, they meet requirements set by authorities in relevant markets, technical specifications and environmental requirements.
DIVIDEND AND FINANCIAL TARGETSThe Company has a long-term operating margin target of 10 percent and an annual growth target of 20 percent for the coming years.
The Company’s long-term target is a dividend of around a third of net profit after tax. Finally, the Board of Directors has specified a maximum debt/equity ratio of 1.0 (interest-bearing liabilities/shareholders’ equity).
The Board has proposed to the 2016 Annual General Meeting that no dividend is paid for 2015.
FINANCIAL OVERVIEWThe various financial reports provide the following quarterly statements:• income statement• statement of comprehensive income• balance sheet• statement of cash flows• statement of changes in equity• quarterly summary• five-year summary
PARENT COMPANYIn addition to Group management and financial functions, the Parent Company Doro AB also provides a number of support functions for the rest of the Group. Marketing and product development are coordinated by the Parent Company, while the product and quality department oversees design and tool modifications, among other things, as well as quality assurance of deliveries. Purchasing and logistics are also coordinated by the Parent Company, which is responsible for flows of material within the Group.
Doro AB had Total revenue of SEK 1,394.7m (1,012.4). Profit after financial items amounted to SEK 26.4m (31.9). Doro AB is responsible for the subsidiaries’ financing. The Parent Company’s net debt was SEK 168.7m (43.8) at year-end 2015. Shareholders’ equity amounted to SEK 370.9m (264.9).
DORO ANNUAL REPORT 2015 DIRECTORS´ REPORT19

RISKSDoro’s risks and uncertainties primarily relate to its ability to continually develop competitive products, to disruptions in supply, customer relations and exchange rate fluctuations.
Further information on Doro’s management of financial risks can be found in Note 23. Other risks are described below.
PRICE RISKDoro operates mainly within telecommunications and is affected by general price decreases and cost development within the consumer electronics industry. This means that selling prices may fall faster than production prices.
Doro works actively with various forecasting tools and follow-up programmes for production planning and stock management.
The Company works in partnership with suppliers, which allows good flexibility based on forecasts that are converted into purchase orders.
Changes in authorities’ requirements and technological developments could result in products in stock having a significantly lower sales value than estimated.
BORROWINGIn January 2015 a loan of SEK 180m was raised in connection with the acquisition of Caretech, which has been amortised by SEK 30m during the year. Doro also has a overdraft facility with Handelsbanken of SEK 50m.
CASH FLOW RISKDoro’s cash flow from operating activities is usually slightly negative in the first quarter, with positive cash flow during the rest of the year. The Company’s cash funds and credit agreements have been adapted to deal with these fluctuations.
COMPETITION RISKDoro operates within competitive markets. Market segmentation is one way of facing this competition.
In addition, Doro continually carries out market surveys to find out end customers’ needs and requirements, so as to be able to develop unique
products. Activities to increase productivity are carried on in parallel. Brand development within the seniors market is also a distinguishing feature that is an asset of the Company.
RISK OF BAD DEBTSIn recent years Doro has had a low level of bad debts since its main customer group is large business groups with regular trade. In 2015 Doro had confirmed bad debts of SEK 5.0m (0.3). Probable bad debts occurring in 2015 amount to SEK 1.7m (3.5).
In 2015 no individual customer accounted for more than 10 percent of revenue
RISK OF COMPLAINTSThe risk of complaints refers to the costs of correcting faults arising in products supplied by Doro.
Warranty periods are usually 12–24 months. Various provisions are made for outstanding warranties. The Group’s extensive quality work has improved quality in recent years.
INSURANCE RISKDoro has a coordinated programme for insurance. Drawing on external expertise, a policy was drawn up stating the type of insurance to be taken out, the amounts of cover required and the distribution of risk between the Parent Company and subsidiaries.
POLITICAL RISKPolitical risk refers to the risk that authorities in various countries take political decisions that make continued operations more difficult, more expensive or impossible. All production takes place in Asia (this is also largely true of all our competitors).
ENVIRONMENTAL RISKEnvironmental risk refers to the costs that may be incurred by the Group in reducing its environmental impact. Doro does not manufacture products itself.
Doro works actively to comply with various new directives relating to the environment and has had no problems with managing charges for returns of electronic waste, packaging and used batteries.
LEGAL DISPUTESThis type of risk refers to the costs that may be incurred by Doro for pursuing various legal proceedings, as well as costs of third parties.
In 2015 Doro was involved in a dispute with Beafon Mobile GmbH citing infringement of the Company’s registered design rights. Doro draws on external expertise with a view to prevention and actively safeguards its rights.
ANNUAL GENERAL MEETINGThe Annual General Meeting will be held at 3 p.m. on 3 May 2016 at the ScandicAnglais Hotel, Humlegårdsgatan 23, 102 44 Stockholm.
PROPOSED ALLOCATION OF THE COMPANY’S PROFITThe board of directors has decided to propose no dividend for 2015. The background for this is that the board of directors considers that, at the moment, the shareholder value of the company is best supported by a strong capital base for actively developing the most recent acquisitions made, supporting the strong organic growth demonstrated by the company with the need of increased working capital as well as pursuing a continued active acquisition agenda. The Board thereby prioritizes its strategy to strengthen and develop the rapidly growing niche for telecommunication for elderly within which Doro has taken a leading position.
The following unrestricted funds in the Parent Company are available to the Annual General Meeting:
Share premium reserve 158,614,455.70Fair value reserve –2,273,932.00Retained earnings 115,074,315.18Profit for the year 20,295,338.80 291,710,177.68
DORO ANNUAL REPORT 2015 DIRECToRS´ REPoRT20

The Board of Directors proposes that no dividend is paid for 2015 and that the funds of SEK 291,710,177.68 available to the Annual General Meeting are carried forward.
FULL-YEAR OUTLOOK FOR 2016The Group’s sales and profit for 2016 are expected to increase. As in previous years, the majority is expected to be generated in the second half of the year.
EVENTS AFTER THE END OF THE YEARA new call center in KalixDoro announced on January 7 that it has decided to establish a new call center in Kalix, Sweden. As the number of municipalities switching to digital social alarms keep increasing, this is a necessary investment in order to be able to offer a 100% redundancy service. Doro will be the only digital social alarm provider operating two call centers in the Nordic region. The two call centres, including the previous one in Malmö, will offer services in all Nordic languages as well as another 15 more. The call-center in Kalix will open in March 2016.
Caretech rebranded Doro CareAnnounced January 20th, all offerings related to digital and mobile care solutions are now rebranded and organized under one name, Doro Care. At the same time as the rebranding was communicated, Doro Care also launched the alarm device Doro Secure 480. This watch is the result of a joint R&D project with participants from Doro’s hardware development team and Doro Care’s development team. The watch is an alarm device and mobile phone that offers features such as GPS tracking and Geofencing. (Geofencing uses GPS to send notifications when a person leaves or enters an area preset to personal preferences and as such increasing the security for the elderly.)
Acquistion of TrygghetssentralenAnnounced February 18th the acquisition, via Doro Care AB, of Trygghets-sentralen, the largest private social alarm center in Norway. Trygghetssentralen
delivers social alarm services to approximately 34,000 users on behalf of 110 municipalities. The company has 68 permanent employees and approximately 60 temporary employees. It is headquartered in Oslo. The handover of Trygghetssentralen is scheduled for mid April and the final purchase price is expected to be just below NOK 30m.
DORO ANNUAL REPORT 2015 DIRECToRS´ REPoRT21

CLEAR RESPONSIBILITY FOR OPERATIONS CREATES CONFIDENCE
Essential to Doro’s continued success is having the confidence of the market, shareholders and the public. To achieve this, the Board of Directors and the management must work in a way that is responsible, transparent and committed. It is thus reassuring that over the year our Company has had an effective Board of Directors that has worked constructively with the Company’s management and other employees. The role of the Board is becoming increasingly important in a global business environment where change occurs ever more rapidly – not only in terms of the macroeconomic climate and the specific business conditions in which Doro operates, but also the increased competition that we are now seeing in some of our markets. We are well prepared to face market developments and can adapt the Company quickly to new circumstances.
We are also seeing a period of significant investment in new products and services that make life easier for the world’s seniors. This makes great demands of the Board’s ability to take well-founded decisions and to balance the risks and opportunities that are always associated with a commercial enterprise.
Just as important for Doro’s credibility is our openness to the market and the fact that we continually provide information about our ongoing measures and business results. This forms the basis of a value-adding relationship with all our stakeholders in which both existing and new shareholders can feel sure that they will receive accurate information at the right time.
Doro AB is a Swedish public limited company listed on OMX Nasdaq Stockholm (“the Stockholm stock exchange”). Doro’s corporate governance is based on Swedish legislation, primarily Sweden’s Companies Act, but also on the Stockholm stock exchange’s rule book
for issuers, the Swedish Corporate Governance Code (“the Code”) and other applicable rules. In addition to these, the Company is governed in accordance with its articles of association, internal instructions and policies, and recommendations issued by relevant organisations. This corporate governance report has been prepared by the Board of Directors of Doro AB in accordance with the Swedish Annual Accounts Act and the Code. The report forms part of the formal Annual Report.
SHAREHOLDERSAccording to Euroclear Sweden AB’s register of shareholders, as of 31 December 2015 Doro AB had 7,405 shareholders. Foreign investors accounted for 48.7 percent of the total number of shares. The number of shares in Doro AB as of 31 December 2015 amounted to SEK 23,238,255 and on the same date Doro’s market capitalisation was SEK 1,440.8 million.
Doro’s largest shareholder is AIF Clients, which owns 7.7 percent of the Company’s shares.
SWEDISH CORPORATE GOVERNANCE CODEThe Swedish Corporate Governance Code is to be applied to all companies that are listed on the Stockholm stock exchange. The aim is to improve corporate governance in listed companies and to create confidence in these companies, both among the general public and among players in the capital market. The Code is based on the principle of “comply or explain”, which means that companies may deviate from the rules provided they give a satisfactory explanation for the deviation and describe the chosen alternative. The Code is available on the website www.corporategovernanceboard.se.
ANNUAL GENERAL MEETINGThe Annual General Meeting is the Company’s highest decision-making body. The Board of Directors and Chairman of the Board of Doro AB are elected at the Annual General Meeting. The Company’s auditors are also appointed. The Annual General Meeting approves the income statement and balance sheet, and the appropriation of the profit or loss for the year. The other matters to be dealt with are laid down in the Swedish Companies Act. The Annual General Meeting is to be held within six months of the end of the financial year. Shareholders who are registered in Euroclear Sweden’s register of shareholders on the record day and have notified their intention to attend are entitled to participate in the general meeting.
NOMINATION COMMITTEEThe Annual General Meeting appoints the members of the Company’s Nomination Committee. The tasks of the Nomination Committee are to nominate Board members and, where relevant, auditors for election at the next Annual General Meeting, and to propose to the Annual General Meeting remuneration for work on the Board and its committees. The Nomination Committee also proposes a chairman for the Annual General Meeting.
The Nomination Committee consists of Helmut Schweiger; Bengt Belfrage, nominated by Nordea Fonder AB; Mark Shay, nominated by Accendo Capital and Bo Kastensson (Chairman of the Board of Doro AB).
BOARD OF DIRECTORSDoro AB’s Board of Directors consists of the Company’s CEO along with six other members, all elected by the Annual General Meeting held on 27 April 2015. A more detailed presentation of each member can be found on
page 25. The Company’s CFO Magnus Eriksson is co-opted onto the Board as secretary. Other senior executives participate in Board meetings by presenting information.
BOARD MEETINGSThe Board met eleven times in 2015. Six meetings were held in Stockholm, two on the Company’s premises in Lund and one off-site. In addition, two meetings were held by telephone. All members were present at all the meetings. The Company’s CFO and the Board secretary were present at all the meetings.
The Board deals with matters arising such as the market situation, budget, results for the period and cost efficiency. All the Board meetings follow an agenda approved in advance. This is sent out to each Board member a week in advance of the meeting, along with relevant documentation and a list of matters outstanding from the previous meeting. The meetings of the Remuneration Committee and Audit Committee are reported back to the Board and minutes of these meetings are distributed to the Board.
Each month the previous month’s results are also sent out with comments.
THE BOARD’S RULES OF PROCEDUREThe Board’s rules of procedure lay down the form that work of the Board of Doro AB is to take. The Board’s rules of procedure are based on the articles of association, the Companies Act and the Code. The Board has an overall responsibility for the Doro Group.
The Board’s responsibility also includes Doro’s relations with shareholders, the public, authorities and other organisations and stakeholders. The Board is responsible for executing decisions made by the Annual
DORO ANNUAL REPORT 2015 CoRPoRATE GoVERnAnCE REPoRT22

General Meeting and for achieving the business objectives set out in the articles of association. The Board’s mandate is described in the articles of association and in the Companies Act.
DISTRIBUTION OF DUTIES BETWEEN THE BOARD OF DIRECTORS AND THE CEOThe Company’s Board appoints its Chief Executive Officer. The distribution of duties between the Board of Directors and the CEO is described in the Board’s rules of procedure and in the instructions for the CEO. These documents establish that the Board is responsible for the Company’s governance, supervision, organisation, strategies, internal control and policies. In addition, the Board decides on matters concerning major investments, matters of principle relating to the governance of subsidiaries and on the election of board members and managing directors of subsidiaries.
The Board ensures the quality of the financial reporting. The CEO is in turn responsible for the Company being managed in accordance with the Board’s guidelines and instructions. In addition, the CEO is responsible for budget work and the planning of the Company’s operations in order to achieve specific objectives. The CEO shall ensure a good control environment and that the Group’s risk taking always complies with the Board’s instructions. Any deviations must be reported to the Board. The Board also receives regular updates from the CEO via monthly reports.
REMUNERATION COMMITTEE The Board as a whole is responsible for remuneration matters and other terms of employment for the Group management and five other key employees. The Chairman of the Board is to approve the terms for managers who report to the CEO. In total, the terms of employment for twelve people are dealt with (11 in 2014).
The Board fees are decided annually by the Annual General Meeting.
Proposals for fees are prepared in the Company’s Nomination Committee.
The Board then sets the remuneration to the CEO. The Board has appointed Jonas Mårtensson and Henri Österlund to the Remuneration Committee from among its members. The Committee met for the first time on 8 May 2015 to determine the remuneration principles for 2015, including the packages to Group management team. Both members were present at the meeting. A second meeting was held on 9 December
2015 to discuss current pay levels, bonus schemes and the remuneration principles for 2015; both members also attended this meeting. The minutes of these meetings were presented at the subsequent Board meetings.
REMUNERATION The total fees to the members of the Board amounted to SEK 1,100,000 in accordance with the decision by the Annual General Meeting. Of this amount, the fees to the Chairman of the Board amounted to SEK 350,000 and to other Board members SEK 150,000. The Company’s CEO received no Board fee.
The Company’s CEO received a salary of SEK 4,164,000 for his work in 2015. Variable remuneration to the CEO amounted to SEK 820,000 for 2015. Salaries to the other six members of the Group management amounted to SEK 8,004,000. These six members were paid variable remuneration of SEK 582,000 for the 2015 financial year. All employed members of the Group management including the CEO receive employment benefits in the form of a company car. The Annual General Meeting held on 27 April 2015 adopted guidelines for remuneration of senior executives for the 2015 financial year.
Under his current employment contract, the CEO and the Company have a reciprocal notice period of 12 months. The CEO is entitled to full salary and other employment benefits during the notice period. Other senior executives have a notice period of three to nine months.
GOVERNANCE OF SUBSIDIARIESThe fifteen subsidiaries are governed and supervised by their own boards of directors in the country concerned, primarily consisting of representatives of Doro AB in Sweden. Doro AB’s President and CEO is the chairman of the board of each subsidiary with the exception of Doro SAS in France, where Bo Kastensson is chairman. The subsidiaries report to the Board of Doro AB whenever they meet. The reports contain information on each company’s development and financial position.
STEERING GROUP FINANCEThe Steering Group Finance consists of the Chairman of the Board Bo Kastensson and the Board members Jonas Mårtensson and Henri Österlund along with the Company’s CEO Jérôme Arnaud and CFO Magnus Eriksson. The Committee’s primary task is to prepare quarterly reports and decision-making documentation for acquisitions and the Group’s financing.
CONTROL AND AUDITINGThe Board of Directors has ultimate responsibility for ensuring that the Company has a satisfactory structure for internal control and the preparation of reliable financial reports. It is the responsibility of the Board and the Group management to monitor and identify commercial risks and to govern the Company in such a way that it is able to manage the main risks.
The auditors monitor and review how the Company is being managed by its Board of Directors and CEO, and the quality of the Company’s financial reporting.
The 2015 Annual General Meeting appointed Ernst & Young as Doro’s auditor for a period of one year, with Stefan Engdahl as chief auditor.
In the past three years the fees for audit work within the Doro Group amounted to SEK 2.1m (2015), SEK 1.2m (2014) and SEK 1.3m (2013) respectively.
AUDIT COMMITTEEThe responsibilities of the Audit Committee are Performed by the Steering Group Finance as an integrated part of both the board meeting and minutes of these meetings. The auditor is scheduled to participate the meetings twice a year.
The focus and scope of the audit is presented by the Company’s auditor. An audit is performed based on the quarterly close as of 30 September, the result of which is reported at a meeting with the Audit Committee.
All members attended all the meetings, along with the auditor Stefan Engdahl. The Audit Committee satisfies the independence requirement in the Swedish Corporate Governance Code.
The Committee’s primary task is to support the Board in its work on auditing and internal control, accounting and financial reporting. In 2015 the work focused mainly on follow-up of the 2014 audit and on more detailed review of the period January–September 2015, known as the hard close.
INTERNAL CONTROLAn important part of the control environment is that the organisation, decision-making structures, responsibilities and authority levels are clearly defined and communicated in the Company’s steering documents. More information on the Company’s internal control can be found in the directors’ report on page 24.
The Group controller is responsible for raising certain matters with the CFO. In view of the limited size of the finance department, there is judged to be no need for a separate internal audit function.
DORO ANNUAL REPORT 2015 CoRPoRATE GoVERnAnCE REPoRT23

THE BOARD’S REPORT ON INTERNAL CONTROL FOR THE 2015 FINANCIAL YEARAccording to Swedish Corporate Governance Code, the Board shall ensure that the Company has sound internal control and shall constantly be kept informed concerning, and evaluate the functioning of, the Company’s system for internal control. In addition, the Board shall submit a report showing how internal control over financial reporting is organised and, if there is no internal audit function, evaluate the need for such a function and justify its position.
CONTROL ENVIRONMENTWith a view to creating and maintaining a functioning control environment, the Board has established a number of fundamental documents of significance for financial reporting, including in particular the Board’s rules of procedure and instructions for the CEO and the committees. The CEO has the primary responsibility for maintaining the control environment established by the Board in the day-to-day work of the Company. He reports regularly to the Board as part of established procedures. In addition, reports are received from the Company’s auditors.
The internal control system also rests on a management system based on the Company’s organisation and method of conducting operations, with clearly defined roles, areas of responsibility and delegation of powers. Steering documents such as policies and guidelines also play an important role in the control structure.
RISK ASSESSMENTThe Group conducts ongoing risk assessment to identify material risks in respect of the financial statements. The main risk relating to the financial
statements is considered to be that of material misstatement, e.g. in bookkeeping and the measurement of assets, liabilities, income and expenses, or other discrepancies.
Fraud and losses through embezzlement are a further risk. Risk management is an integral part of each process and various methods are used to evaluate and limit risks, and to ensure that the risks to which Doro is exposed are managed according to established rules, instructions and follow-up procedures. The purpose of this is to minimise any risks and promote accurate accounting, reporting and disclosure.
CONTROL ACTIVITIESControl activities are in place to manage the risks that the Board and Company management consider to be material to the business, internal control and financial reporting. The control structure sets out clear roles within the organisation that enable the efficient distribution of responsibility for specific control activities aimed at the timely detection and prevention of the risk of reporting errors. Such control activities include a clear decision-making hierarchy and procedures for major decisions such as acquisitions, other types of major investments, divestments, agreements and analyses.
An important duty of Doro’s staff units is to implement, develop further and maintain the Group’s control procedures and conduct internal control geared to business-critical matters. Those responsible for processes at different levels are responsible for implementing the necessary controls in respect of financial reporting. The period close and reporting processes include controls relating to measurement, accounting principles and estimates.
Continual analysis of financial reporting is carried out and this, along with the analysis performed at Group level, is of great importance in ensuring that the financial statements are free from material misstatement.
The Group controller plays an important role in the internal control process, bearing responsibility for the financial reporting from each unit being accurate, complete and timely.
INFORMATION AND COMMUNICATIONDoro works with the communications consultancy Hallvarsson & Halvarsson AB, which aims to promote completeness and accuracy in financial statements released to the stock market. Regular updates and bulletins inform the employees concerned of changes to accounting principles and reporting requirements and also provide them with other information. The organisation has access to policies and guidelines.
The Board receives monthly financial reports. External information and communication is governed by the Company’s Communications Policy, among other things, which describes Doro’s general disclosure principles.
FOLLOW-UPDoro’s compliance with adopted policies and guidelines is monitored by the Board and management team. The Company’s financial position is discussed at each Board meeting. The Board’s Remuneration Committee and Steering Group Finance play an important role in matters such as remuneration, financial reporting and internal control.
Before publication of interim reports and the Annual Report the Board and management review the financial statements.
Doro’s management conducts monthly follow-up of earnings, analysing deviations from budget, forecasts and the previous year. The duties of the external auditor include performing an annual review of the internal controls implemented by Group subsidiaries.
The Board meets with the auditors twice a year to discuss internal control and, in specific cases, to instruct the auditors to perform separate reviews focusing on specific areas. In light of this, the Board has not found it necessary to establish a separate internal audit function.
Lund, 11 April 2016The Board of Doro AB
INTERNAL CONTROL
DORO ANNUAL REPORT 2015 CoRPoRATE GoVERnAnCE REPoRT24

BOARD OF DIRECTORS
BO KASTENSSON
Primary occupation: CEO Kastensson Holding AB
Education: Bachelor of Arts, Lund University
Year of election: 2006, Chairman since 2007
Year of birth: 1951
Nationality: Swedish
Other assignments: Industrial Adisor, EQT, Chairman of the Board: Pricer AB (publ.), Coromatic Group AB, Axema Access Control AB
Dependence: Company: No Owners: No
Previous assignments: Formerly CEO of Bewator Group, Incentive Development, held various posi-tions in the Axel Johnson Group
Own and related parties share-holdings, 2015: 335,000 shares (through companies)
Own and related parties share-holdings, 2014: 285,000 shares (through companies)
Board attendance: 11/11
Attendance: – Steering Group Finance: 2/2
Board remuneration: 350,000
CHARLOTTA FALVIN
Primary occupation: Education: MBA, Lund University
Year of election: 2011
Year of birth: 1966
Nationality: Swedish
Other assignments: Chairman of the Board: Ideon AB, Lund Busi-ness Incubator AB Board member: Sydsvenska Industri & Handelskammaren, Fasiro AB, Invisio Communica-tions AB, Bure Equity AB, CLX Communications AB
Dependence: Company: No Owners: No
Previous assignments: CEO TAT, CEO Decuma, COO Axis
Own and related parties share-holdings, 2015: –Own and related parties share-holdings, 2014: –Board attendance: 11/11
Board remuneration: 150,000
KARIN MOBERG
Primary occupation: Founder and CEO of Friends of Adam
Education: MBA, Stockholm Uni-versityt
Year of election: 2009
Year of birth: 1963
Nationality: Swedish
Other assignments: Board member: Friends of Adam AB, Doro Care AB, SBAB
Dependence: Company: No Owners: No
Previous assignments: 14 years within TeliaSonera Group inclu-ding Communications Director and Managing Director Telia e-bolaget Chairman of the Board: Caretech AB, Board member: IAR AB, AP 7
Own and related parties share-holdings, 2015: 5,000 shares
Own and related parties share-holdings, 2014: 5,000 shares
Board attendance: 11/11
Board remuneration: 150,000
JONAS MÅRTENSSON
Primary occupation: Partner and board member in Alted AB
Education: MBA, Stockholm School of Economics
Year of election: 2007
Year of birth: 1963
Nationality: Swedish
Other assignments: Chairman of the Board: Ownpower Projects Europe AB, Board member: DistIT AB, Alcadon Holding AB, IAR Systems Group AB, JNM Invest AB
Dependence: Company: No Owners: No
Previous assignments: 17 years in corporate finance at SEB Enskilda, Maizels Westberg & Co and Nordea
Own and related parties share-holdings, 2015: 100,000 shares
Own and related parties share-holdings, 2014: 85,000 shares (through companies)
Board attendance: 11/11
Attendance: – Steering Group Finance: 2/2 – Remuneration Committee: 2/2
Board remuneration: 150,000
JÉRÔME ARNAUD
Primary occupation: President and CEO, Doro AB
Education: MSc Engineering, École Centrale de Paris
Year of election: 2007
Year of birth: 1963
Nationality: French
Other assignments: Dependence: Company: Yes Owners: No
Previous assignments: Matra Nortel Communications
Own and related parties share-holdings, 2015: 163,336 shares, 200,000 warrants
Own and related parties share-holdings, 2014: 163,336 shares, 200,000 warrants
Board attendance: 11/11
LENA HOFSBERGER
Primary occupation: Professio-nal Board member and industrial adviser
Education: Master of Business Administration, Bachelor of Arts, Bothe degrees Gothenburg University
Year of election: 2015
Year of birth: 1954
Nationality: Swedish
Other assignments: Chairman of the Board: Ambea Sweden, Pharma Relations, Leos Lekland, RestaurangAssistans Board member: Max Hambur-gerrestauranger, Anders Löfberg, SABIS, Rent-A-Doctor AB
Dependence: Company: No Owners: No
Previous assignments: Board member: SSP Group Ltd
Own and related parties share-holdings, 2015: –Own and related parties share-holdings, 2014: –Board attendance: 11/11
HENRI ÖSTERLUND
Primary occupation: Managing Partner, Accendo Capital
Education: M.Sc. (econ.), Helsinki School of Economics
Year of election: 2015
Year of birth: 1971
Nationality: Finnish
Other assignments: Vice Chair-man of the Board: Okmetic Oyj
Dependence: Company: No Owners: No
Previous assignments: Associate, Doughty Hanson & Co; Partner, Triton; Partner, Conventum Corporate Finance; Chairman, InterQuest
Own and related parties share-holdings, 2015: 50 shares
Own and related parties share-holdings, 2014: –Board attendance: 11/11
Attendance: – Steering Group Finance: 2/2 – Remuneration Committee: 2/2
DORO ANNUAL REPORT 2015 CoRPoRATE GoVERnAnCE REPoRT25

MANAGEMENT
JÉRÔME ARNAUD
Position: CEO, Doro AB, Deputy Director of Sales (interim)
Employed since: 2000
Education: MSc Engineering, École Centrale de Paris
Year of birth: 1963
Nationality: French
Previous experience: Business Development at Matra Nortel Communications
Own and related parties share-holdings, 2015: 163,336 shares, 200,000 warrants
Own and related parties share-holdings, 2014: 163,336 shares, 200,000 warrants
THOMAS BERGDAHL
Position: Vice President Product Development
Employed since: 2002
Education: MSc, Industrial Engi-neering and Management, Insti-tute of Technology Linköping
Year of birth: 1964
Nationality: Swedish
Previous experience: Director of manufaturing, Anoto
Own and related parties share-holdings, 2015: 39,082 shares, 65,000 warrants
Own and related parties share-holdings, 2014: 39,082 shares, 50,000 warrants
ULRIK NILSSON
Position: Vice President Operations
Employed since: 1991
Education: Technician, telecoms
Year of birth: 1971
Nationality: Swedish
Previous experience: Supply manager
Own and related parties share-holdings, 2015: 3,897 shares, 65,000 warrants
Own and related parties share-holdings, 2014: 3,897 shares, 65,000 warrants
CAROLINE NOUBLANCHE
Position: Vice President Marketing & Portfolio
Employed since: 2011
Education: HEC Business School, Paris
Year of birth: 1976
Nationality: French
Previous experience: Founder and CEO of Prylos
Own and related parties share-holdings, 2015: 2,449 shares, 65,000 warrants
Own and related parties share-holdings, 2014: 2,449 shares, 65,000 warrants
ULF LINDSTEN
Position: CEO Doro Care AB
Employed since: 2015
Education: Telecom Engineering
Year of birth: 1960
Nationality: Swedish
Previous experience: CEO global telecom systems supplier, Inter-national Business Development, telecom
Own and related parties share-holdings, 2015: 29,994 shares, 42,000 warrants
Own and related parties share-holdings, 2014: –
MAGNUS ERIKSSON
Position: Chief Financial Officer
Employed since: 2015
Education: Master of Science in Business Administration, Lunds University
Year of birth: 1969
Nationality: Swedish
Previous experience: CFO at Lekolar, CEO BRIO Holding AB, Head of Corporate Business Control at Sony Ericsson
Own and related parties share-holdings, 2015: –Own and related parties share-holdings, 2014: –
SUSANNE VON WOWERN
Position: Human Resources Director
Employed since: 2015
Education: Master of Science in Business Administration, Gothenburg University
Year of birth: 1971
Nationality: Danish
Previous experience: HR mana-ger Itella, HR manager DT Group
Own and related parties share-holdings, 2015: –Own and related parties share-holdings, 2014: –
DORO ANNUAL REPORT 2015 CORPORaTE GOvERnanCE REPORT26

FINANCIAL REPORTS

CONSOLIDATED INCOME STATEMENTTHE GROUP
STATEMENT OF COMPREHENSIVE INCOMETHE GROUP
SEK m Note 2015 2014
1 recalculated
REVENUE
Net sales 2, 3 1,828.9 1,270.3
Other revenue 2 9.1 5.9
1,838.0 1,276.2
OPERATING COSTS
Merchandise 19 –1,149.1 –749.8
Other external costs 4, 16 –341.1 –279.2
Personnel costs 5 –179.0 –118.7
Depreciation and impairment of property, plant and equipment 8 –2.6 –4.4
Depreciation and impairment of intangible assets 7 –41.4 –38.5
Other expenses 2 –29.6 –5.9
Operating profit/loss 2 95.2 79.7
PROFIT/LOSS FROM FINANCIAL ITEMS
Interest income and similar profit/loss items 6 4.1 7.5
Interest costs and similar profit/loss items 6 –14.9 –7.9
Profit/loss after financial items 84.4 79.3
Tax on profit/loss for the year 17 –20.6 –21.1
Profit/loss for the year 63.8 58.2
Attributable to: Parent company’s shareholders 63.8 58.2
KEY FIGURES
Average number of shares, thousands 11 22,937 21,059
Average number of shares after dilution, thousands 22,995 21,059
Earnings per share after tax, SEK 2.78 2.76
Earnings per share after tax,after dilution, SEK 2.77 2.76
SEK m 2015 2014
Profit/loss for the year 63.8 58.2
Other comprehensive income to be reclassified to profit or loss in subsequent periods:
Translation differences –2.3 8.7
Effects from cash flow hedges 1.7 –2.8
Deferred tax –0.4 0.6
Total result 62.8 64.7
Attributable to Parent company 62.8 64.7
DORO ANNUAL REPORT 2015 fInAnCIAL REPoRTS28
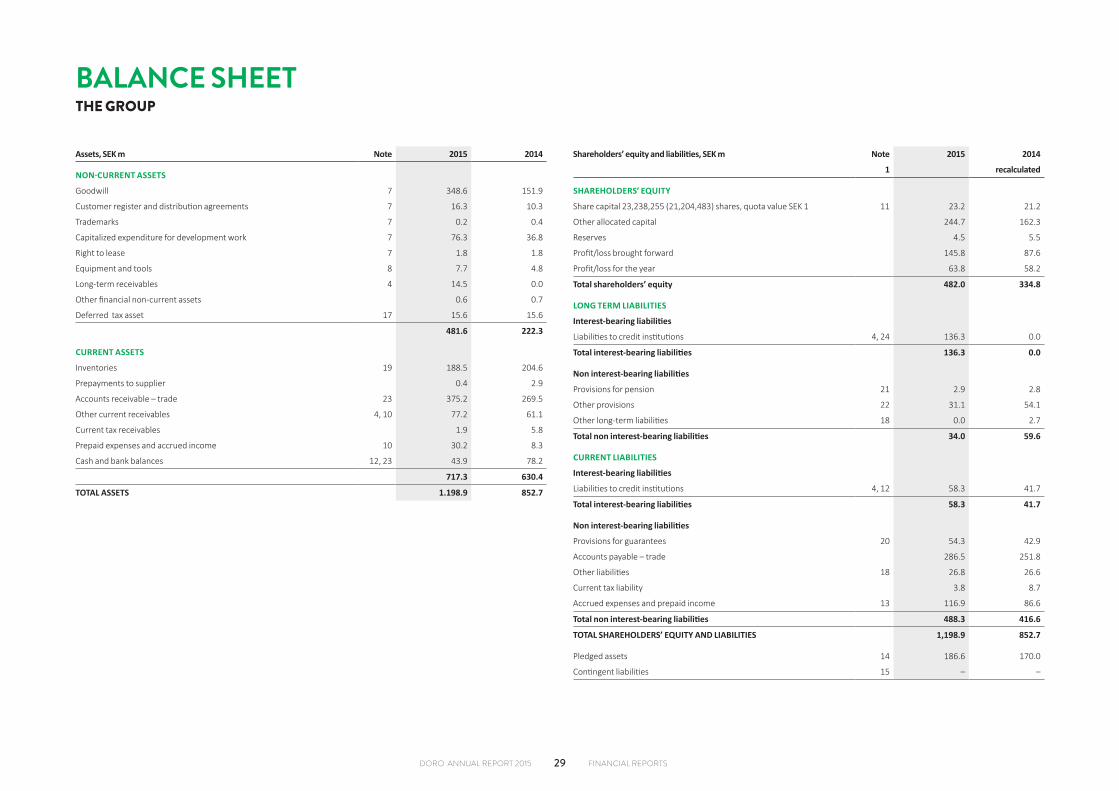
BALANCE SHEETTHE GROUP
Assets, SEK m Note 2015 2014
NON-CURRENT ASSETS
Goodwill 7 348.6 151.9
Customer register and distribution agreements 7 16.3 10.3
Trademarks 7 0.2 0.4
Capitalized expenditure for development work 7 76.3 36.8
Right to lease 7 1.8 1.8
Equipment and tools 8 7.7 4.8
Long-term receivables 4 14.5 0.0
Other financial non-current assets 0.6 0.7
Deferred tax asset 17 15.6 15.6
481.6 222.3
CURRENT ASSETS
Inventories 19 188.5 204.6
Prepayments to supplier 0.4 2.9
Accounts receivable – trade 23 375.2 269.5
Other current receivables 4, 10 77.2 61.1
Current tax receivables 1.9 5.8
Prepaid expenses and accrued income 10 30.2 8.3
Cash and bank balances 12, 23 43.9 78.2
717.3 630.4
TOTAL ASSETS 1.198.9 852.7
Shareholders’ equity and liabilities, SEK m Note 2015 2014
1 recalculated
SHAREHOLDERS’ EQUITY
Share capital 23,238,255 (21,204,483) shares, quota value SEK 1 11 23.2 21.2
Other allocated capital 244.7 162.3
Reserves 4.5 5.5
Profit/loss brought forward 145.8 87.6
Profit/loss for the year 63.8 58.2
Total shareholders’ equity 482.0 334.8
LONG TERM LIABILITIES
Interest-bearing liabilities
Liabilities to credit institutions 4, 24 136.3 0.0
Total interest-bearing liabilities 136.3 0.0
Non interest-bearing liabilities
Provisions for pension 21 2.9 2.8
Other provisions 22 31.1 54.1
Other long-term liabilities 18 0.0 2.7
Total non interest-bearing liabilities 34.0 59.6
CURRENT LIABILITIES
Interest-bearing liabilities
Liabilities to credit institutions 4, 12 58.3 41.7
Total interest-bearing liabilities 58.3 41.7
Non interest-bearing liabilities
Provisions for guarantees 20 54.3 42.9
Accounts payable – trade 286.5 251.8
Other liabilities 18 26.8 26.6
Current tax liability 3.8 8.7
Accrued expenses and prepaid income 13 116.9 86.6
Total non interest-bearing liabilities 488.3 416.6
TOTAL SHAREHOLDERS’ EQUITY AND LIABILITIES 1,198.9 852.7
Pledged assets 14 186.6 170.0
Contingent liabilities 15 – –
DORO ANNUAL REPORT 2015 fInAnCIAL REPoRTS29
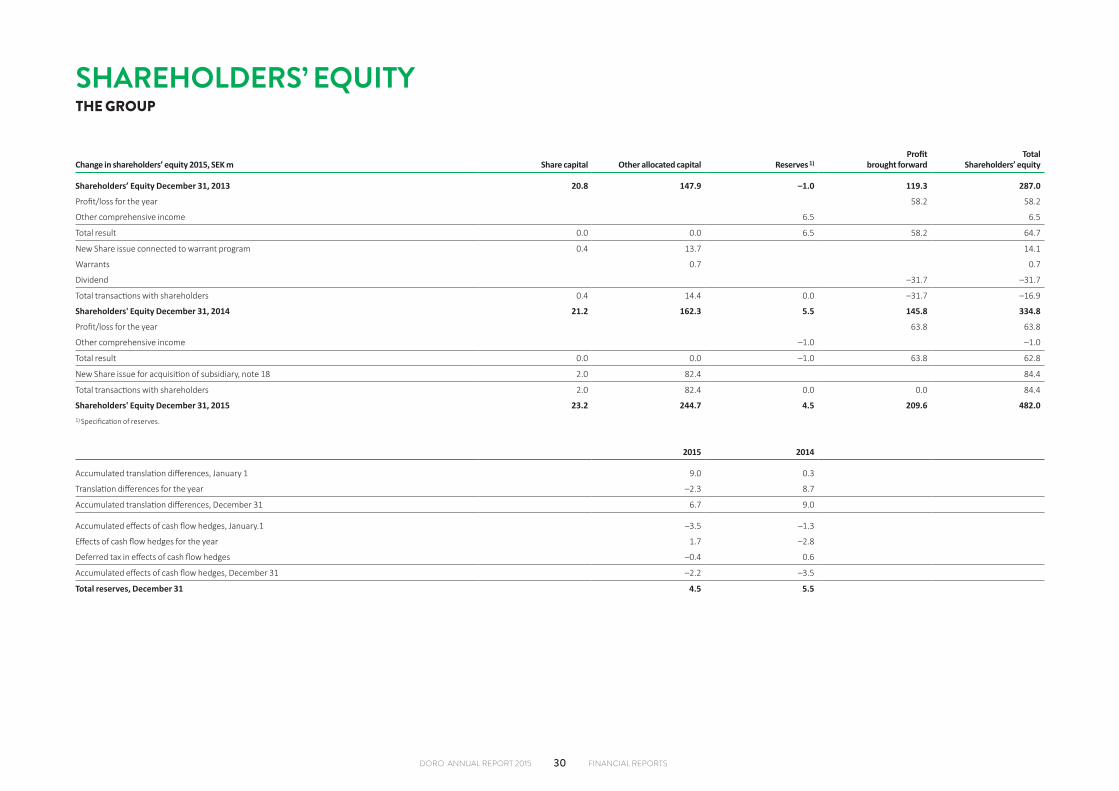
SHAREHOLDERS’ EQUITYTHE GROUP
Change in shareholders’ equity 2015, SEK m Share capital Other allocated capital Reserves 1)Profit
brought forwardTotal
Share holders’ equity
Shareholders’ Equity December 31, 2013 20.8 147.9 –1.0 119.3 287.0
Profit/loss for the year 58.2 58.2
Other comprehensive income 6.5 6.5
Total result 0.0 0.0 6.5 58.2 64.7
New Share issue connected to warrant program 0.4 13.7 14.1
Warrants 0.7 0.7
Dividend –31.7 –31.7
Total transactions with shareholders 0.4 14.4 0.0 –31.7 –16.9
Shareholders' Equity December 31, 2014 21.2 162.3 5.5 145.8 334.8
Profit/loss for the year 63.8 63.8
Other comprehensive income –1.0 –1.0
Total result 0.0 0.0 –1.0 63.8 62.8
New Share issue for acquisition of subsidiary, note 18 2.0 82.4 84.4
Total transactions with shareholders 2.0 82.4 0.0 0.0 84.4
Shareholders' Equity December 31, 2015 23.2 244.7 4.5 209.6 482.01) Specification of reserves.
2015 2014
Accumulated translation differences, January 1 9.0 0.3
Translation differences for the year –2.3 8.7
Accumulated translation differences, December 31 6.7 9.0
Accumulated effects of cash flow hedges, January.1 –3.5 –1.3
Effects of cash flow hedges for the year 1.7 –2.8
Deferred tax in effects of cash flow hedges –0.4 0.6
Accumulated effects of cash flow hedges, December 31 –2.2 –3.5
Total reserves, December 31 4.5 5.5
DORO ANNUAL REPORT 2015 fInAnCIAL REPoRTS30

CASH FLOW STATEMENTTHE GROUP
SEK m Note 2015 2014
Profit/loss after financial items 1) 84.4 79.3
Adjusted for items not in cash flow
Change in provisions 20, 21, 22 –11.5 –11.3
Depreciation and write downs 7, 8 44.0 42.9
Adjustment for other non-cash items:
Unrealized exchange differences in cash flow hedges 6.3 –15.1
Reverse of additional purchase price in acquisitions 18 –0.5 –7.9
Total adjustment for other non-cash items 38.3 8.6
Taxes paid 17 –17.4 –18.3
Cash flow from current activities before changes in working capital 105.3 69.6
Change in working capital
Change in stocks 19 26.0 –74.1
Change in receivables –95.8 –60.9
Change in non-interest-bearing liabilities 50.2 87.9
Cash flow from current activities 85.7 22.5
INVESTMENT ACTIVITIES
Acquisitions of subsidiaries 18 –162.0 –21.9
Acquisition of intangible fixed assets 7 –56.9 –27.7
Acquisition of tangible fixed assets 8 –1.8 –1.6
Cash flow from investment activities –220.7 –51.2
SEK m Note 2015 2014
FINANCING ACTIVITIES
Dividend 0.0 –31.7
New Share issue 0.0 14.1
Warrant Program, new issue 0.6 0.7
Warrant Program, buy back –0.6 0.0
Amortization of loans –52.9 –45.0
Loan raised 154.7 41.5
Cash flow from financing activities 101.8 –20.4
Cash flow for the year –33.2 –49.1
Liquid assets at start of year 78.2 123.9
Exchange rate difference in liquid assets –1.1 3.4
Liquid assets at end of year 23 43.9 78.21) Paid and received interests appeaer in note 6.
DORO ANNUAL REPORT 2015 fInAnCIAL REPoRTS31

INCOME STATEMENTPARENT COMPANY
STATEMENT OF COMPREHENSIVE INCOMEPARENT COMPANY
SEK m Note 2015 2014
1 recalculated
OPERATING INCOME
Net sales 2, 3 1,393.4 1,011.6
Other revenue 2 1.3 0.8
1,394.7 1,012.4
OPERATING COSTS
Merchandise 19 –912.0 –578.7
Other external costs 4, 16 –340.0 –319.2
Personnel costs 5 –51.6 –42.4
Depreciation and impairment of property, plant and equipment 8 –0.7 –3.4
Depreciation and impairment of intagible assets 7 –30.3 –35.4
Other expenses 2 –28.6 –5.5
Operating profit/loss 2 31.5 27.8
PROFIT/LOSS FROM FINANCIAL ITEMS
Interest income and similar profit/loss items 6 8.3 11.7
Interest costs and similar profit/loss items 6 –13.4 –7.6
Profit/loss after financial items 26.4 31.9
Tax on profit/loss for the year 17 –6.1 –7.3
PROFIT/LOSS FOR THE YEAR 20.3 24.6
SEK m 2015 2014
Profit/loss for the year 20.3 24.6
Other comprehensive income to be reclassified to profit or loss in subse-quent periods:
Effects from cash flow hedges 1.7 –2.8
Deferred tax –0.4 0.6
Total result 21.6 22.4
DORO ANNUAL REPORT 2015 fInAnCIAL REPoRTS32

BALANCE SHEETPARENT COMPANY
Assets, SEK m Note 2015 2014
FIXED ASSETS
Intangible assets
Capitalized expenditure for development work 7 58.1 36.8
Goodwill 7 0.0 0.0
Customer register 7 0.8 2.0
Brands 7 0.1 0.3
Tangible assets
Equipment and tools 8 1.4 2.1
Financial assets
Participations in Group companies 9, 25 309.9 73.4
Deferred income tax recoverable 17 9.4 12.0
Total fixed assets 379.7 126.6
CURRENT ASSETS
Inventories
Finished goods and goods for resale 19 120.8 156.9
Advanced payment to suppliers 0.4 2.9
Current receivables
Accounts receivable – trade 23 271.3 202.1
Receivables from Group companies 198.5 175.8
Other current receivables 10 47.9 52.9
Prepaid expenses and accrued income 10 7.1 10.1
Cash and bank balances 12, 23 7.1 9.9
Total current assets 653.1 610.6
TOTAL ASSETS 1,032.8 737.2
Shareholders’ equity and liabilities, SEK m Note 2015 2014
1 recalculated
SHAREHOLDERS’ EQUITY
Restricted equity
Share capital 23,238,255 (21,204,483) shares, quota value SEK 1 11 23.2 21.2
Revaluation reserve 0.5 0.5
Other allocated capital 55,5 55,5
Total restricted equity 79,2 77,2
Shareholders’ equity and liabilities, SEK m Note 2015 2014
1 recalculated
Non-restricted equity
Share premium reserve 158.6 76.2
Fair value reserve –2.2 –3.5
Profit/loss brought forward 115.0 90.4
Profit/loss for the year 20.3 24.6
Total non-restricted equity 291,7 187,7
Total shareholders’ equity 370.9 264.9
PROVISIONS
Provisions for guarantees 20 48.0 36.9
Other provisions 22 25.0 36.6
Total provisions 73.0 73.5
LONG-TERM LIABILITIES
Interest-bearing liabilities
Liabilities to credit institutes 120.0 0.0
Total interest-bearing liabilities 120.0 0.0
CURRENT LIABILITIES
Interest-bearing liabilities
Overdraft facility 12 4.1 41.5
Liabilities to credit institutes 30.0 0.0
Liabilities to Group companies 21.7 12.2
Total interest-bearing liabilities 55.8 53.7
Non interest-bearing liabilities
Accounts payable – trade 250.0 232.5
Prepayments 0.0 0.0
Liabilities to Group companies 73.2 29.8
Other liabilities 9.9 8.5
Current tax liability 0.4 6.3
Accrued expenses and prepaid income 13 79.6 68.1
Total non interest-bearing liabilities 413.1 345.2
TOTAL SHAREHOLDERS’ EQUITY AND LIABILITIES 1,032.8 737.3
Pledged assets 14 170.0 170.0
Contingent liabilities 15 3.0 –
DORO ANNUAL REPORT 2015 fInAnCIAL REPoRTS33

CHANGES IN SHAREHOLDERS’ EQUITYPARENT COMPANY
Changes in shareholders’ equity 2015, SEK m Share capital Revaluation reserve Statutory reserve Share premium reserve Fair value reserve Retained earningsTotal share -
holders’ equity
Shareholders’ Equity December 31, 2013 20.8 0.5 55.5 61.9 –1.3 122.1 259.5
Profit for the year 24.6 24.6
Other comprehensive income –2.2 –2.2
Total result –2.2 24.6 22.4
Dividend –31.7 –31.7
New Share issue in connection with excercise of warrants 0.4 13.7 14.1
Warrant program 0.6 0.6
Total transactions with shareholders 0.4 0.0 0.0 14.3 0.0 –31.7 –17.0
Shareholders’ Equity December 31, 2014 21.2 0.5 55.5 76.2 –3.5 115.0 264.9
Profit for the year 20.3 20.3
Other comprehensive income 1.3 1.3
Total result 0.0 0.0 0.0 0.0 1.3 20.3 21.6
Non-cash issue for acquisition of subsidiary 2.0 82.4 84.4
Total transactions with shareholders 2.0 0.0 0.0 82.4 0.0 0.0 84.4
Shareholders’ Equity 31 December 2015 23.2 0.5 55.5 158.6 –2.2 135.3 370.9
DORO ANNUAL REPORT 2015 fInAnCIAL REPoRTS34

CASH FLOW STATEMENTPARENT COMPANY
SEK m Note 2015 2014
CURRENT ACTIVITIES
Profit/loss after financial items 1) 26.4 31.9
Adjusted for items not in cash flow
Change in provisions 20, 21, 22 –0.6 –12.5
Depreciation and write downs 7, 8 31.0 38.8
Unrealized exchange differences in cash flow hedges 6.3 –15.1
Total adjustment for other non-cash items 36.7 11.2
Taxes paid –9.9 –2.1
Cash flow from current activities before changes in working capital 53.2 41.0
Change in working capital
Change in stocks 19 36.1 –69.3
Change in receivables –87.7 –112.0
Change in non-interest-bearing liabilities 73.1 105.8
Cash flow from current activities 74.7 –34.5
INVESTMENT ACTIVITIES
Acquisition of subsidiaries 18 –149.3 –5.1
Acquisition of intangible fixed assets 7 –50.3 –27.7
Acquisition of tangible fixed assets 8 0.0 –1.2
Cash flow from investment activities –199.6 –34.0
FINANCING ACTIVITIES
Dividend 0.0 –31.7
New share issue 2) 0.0 14.1
Warrant program 0.0 0.6
Change in non interest-bearing liabilities subsidiares 9.5 3.3
Loans raised 155.1 41.5
SEK m Note 2015 2014
Amortization of loan –42.5 –44.3
Cash flow from financing activities 122.1 –16.5
Cash flow for the year –2.8 –85.0
Liquid assets at start of year 9.9 94.9
Liquid assets at end of year 23 7.1 9.9
1) Paid and received interests appeaer in note 6.2) Consists 2014 of new share issue in connection with exercise of warrants.
DORO ANNUAL REPORT 2015 fInAnCIAL REPoRTS35

NOTES AND ACCOUNTING PRINCIPLES
NOTE 1ACCOUNTING PRINCIPLESThe Annual Report and Consolidated Accounts were approved for publication by the Board and CEO on April 11, 2016 and will be presented to the AGM on May 3, 2016 for approval.
The Consolidated Accounts were prepared in accordance with International Financial Reporting Standards (IFRS/IAS) as issued by the International Accounting Standards Board (IASB) as adopted by the EU.
Furthermore, the Consolidated Accounts were prepared in
accordance with the Swedish Annual Accounts Act and the Swedish Financial Reporting Board’s recommendation RFR 1 (Supplementary Accounting Rules for Groups).
The Annual Report of the Parent Company was prepared in accordance with the Swedish Annual Accounts Act and applying the Swedish Financial Reporting Board’s recommendation RFR 2 (Accounting for Legal Entities). Statements applicable to listed companies issued by the Swedish Financial Reporting Board have also been applied.
New accounting policies for 2015There are no new accounting principles and interpretations that came into effect as of January 1, 2015 that significantly effects the Doro financial statements.
New accounting policies for 2016 and laterA number of accounting standards and interpretations have been published, but have not yet become effective.
IFRS 9 Financial instrumentsIFRS 9 is divided in three parts: Classification and Measurement, Impairment and Hedge Accounting, and will replace the current IAS 39 Financial instruments: recognition and measurement. Doro is currently assessing the effect of IFRS 9. The mandatory effective date is January 1, 2018, with earlier application allowed.
IFRS 15 Revenue from Contracts with CustomersIFRS 15 represent a new framework for recognising revenue with additional disclosure requirements. The framework establishes principles about the nature, amount, timing and uncertainty of revenue and cash flow arising from an entity’s contracts with customers. IFRS 15 will replace current IAS 11 Construction contracts and IAS 18 Revenue. Doro is assessing the impact of the IFRS 15 and monitors any statements from the IASB and FASB Joint transition resource group for revenue recognition as well as amendments to
the standard. The mandatory effective date is January 1, 2018, with earlier application allowed.
IFRS 16 LeasesIFRS 16 Leases was published in January 2016 and are replacing the former IAS 17 Leases and the related interpretations IFRIC 4, SIC-15 and SIC-27. The accounting for lessors will in all material aspects be unchanged, however the accounting for lessees will change. There will no longer be a distinction between operating and finance lease, all leases will be recognized on the balance sheet except for short-term leases and those of minor value. The model reflects that, at the start of a lease, the lessee obtains the right to use an asset for a period of time and has an obligation to pay for that right. The standard is effective for annual periods beginning on or after 1 January 2019. Early adoption is permitted. Doro will assess the impact of IFRS 16.
IFRS 9, IFRS 15 and IFRS 16 has not yet been adopted by the EU when this Annual Report is published.
Other new or revised accounting standards are not considered to have a material impact on the Doro financial statements.
Basis for the preparation of the financial statements Assets, provisions and liabilities are based on historical cost unless otherwise stated below.
All amounts, unless otherwise stated, are in millions of Swedish kronor (SEK m).
GROUP Consolidated Accounts Principles The Group’s Consolidated Accounts include the Parent Company Doro AB, and the companies in which the Parent Company, directly or indirectly owns shares equaling more than half of the voting rights. This means that Doro AB has a controlling influence over Group company, which entitles Doro AB to devise strategies for the Group company with a view to obtaining financial gains.
At the end of the financial year there were 13 (10) operating companies in the Group.
Acquired companies are included in the Consolidated Accounts from the date of acquisition or when control of the company arise. Sold companies are included up to and including the date they are sold.
The Consolidated Accounts are prepared in line with the acquisition method, which means that the historical cost of participations in Group companies is broken down into identifiable assets and liabilities at their fair value on the date of acquisition. Unutilized loss carry-forwards for tax
purposes in the acquired company are converted into deferred tax assets in the Consolidated Accounts if assessed earning capacity is such that utilising them is deemed possible. Furthermore, deferred tax is calculated on the difference between the fair values of assets and liabilities and their tax base. In cases where the historical cost of participations in Group companies exceeds the net of acquired assets and liabilities, as above, the difference is recognized as goodwill, which is tested at least once a year for impairment.
For company acquisitions, the purchase price can be earnings dependent. The calculation is then based on future profit and hence the total purchase price. On a quarterly basis, an assessment is made and any adjustment of the expected purchase price. Changes in the item in question are recognized in the income statement.
Intra-Group balances and unrealized internal gains are eliminated in the Consolidated Accounts. When eliminating internal transactions, accounts is also taken of the tax effect on the basis of nominal tax rates in each country.
Exchange rates Translation of foreign operations All of the assets and liabilities of foreign Group companies are translated at the closing day rate, while all items in the income statements are translated at the average rate for the financial year. The exchange rate differences arising in this context are partly an effect of the differences between the income statements’ average rates and closing day rates, and partly of the fact that net assets are translated at a different rate at the end of the year than at the beginning of the year. Translation differences are recognized in the statement of comprehensive income.
Exchange rates The following exchange rates have been used in the translation of foreign operations:
Average-rate Closing Day rate
Currency 2015 2014 2015 2014
EUR 9.33 9.11 9.18 9.40
HKD 1.08 0.89 1.09 1.00
NOK 1.04 1.08 0.95 1.04
GBP 12.83 11.32 12.46 12.07
USD 8.40 6.89 8.42 7.75
Effects of changing exchange rates Receivables and liabilities in foreign currencies are translated at the closing day rates and unrealized exchange gains and losses related to operations are included in other income and other expenses. Exchange rate differences
DORO ANNUAL REPORT 2015 fInAnCIAL REPoRTS36

related to financial income and expenses are accounted for in net financial income.
Revenue recognition Doro only has one revenue type: product sales. Revenue from product sales is recognized principally when all risks and rights associated with ownership have been transferred to the buyer, which usually occurs upon delivery.
Employee remuneration Employee remuneration is reported as salaries earned and paid plus earned bonus. Earned holiday pay and social security contributions are recognized as accrued expenses.
Pensions The predominant share of Doro’s obligations towards employees consists of various defined-contribution pension plans.
A defined-contribution pension plan is a pension plan according to which the Group pays fixed fees to a separate legal entity. The Group has no legal or informal obligations to pay further fees if this legal entity lacks sufficient funds to pay all remuneration to employees associated with the employees’ service during current or previous periods.
For defined-contribution pension plans, the Group pays fees to publicly or privately managed pension insurance plans on a compulsory, contractual or voluntary basis. The Group has no further payment obligations once these fees have been paid. The fees are recognized as personnel costs when they fall due for payment. Prepaid fees are recognized as an asset to the extent that cash repayment or reductions in future payments may accrue to the Group.
In addition, a limited number of employees at the Group’s French subsidiary have defined-benefit pension plans. A defined-benefit pension plan is one that is not a defined-contribution plan. Characteristic of defined-benefit plans is that they specify an amount for the pension benefit to be received by an employee following retirement. This is normally based one or more factors such as age, period of service and salary.
All obligations for which provisions are made are assessed by an actuary to determine the amount of the provision. The liability recognized in the balance sheet with regard to defined-benefit pension plans is the present value of the defined-benefit obligation at the close of the reporting period. Since the recognized liability with regard to defined-benefit pension plans is an insignificant amount, the assumptions on which the actuarial calculations are based are not presented in the annual report.
Research and development Product development is carried out in cooperation with various manufacturing partners and most expenditure is borne by them. Doro works in an environment of rapid technological development. Product development refers to expenditure for product adaptations, design, model approval, etc.
Expenses relating to the development phase are capitalized as an intangible asset if it is likely, with a high degree of reliability, that they will result in future financial benefits for the Group.
This means that strict criteria must be met before a development project results in intangible assets being capitalized. Such criteria include the option of ending a project, proof that a project is technically feasible and that a market exists, and that there is an intention and opportunity to use or sell the intangible asset. There must also be an opportunity to reliably measure expenses during the development phase.
External partners’ moulds for manufacturing the products are, however, owned by Doro and expenditure for them is capitalized and depreciated according to plan if the lifespan of the product is expected to exceed one year.
Doro has no research expenses.
Property, plant and equipment and intangible fixed assets Property, plant and equipment and intangible fixed assets are recognized at historical cost less accumulated depreciation/amortization according to plan, except goodwill and right to lease, which is not amortized in the Group.
Financial instruments Financial instruments recognized as assets in the balance sheet include,
on the asset side, accounts receivable, other receivables, forward currency contracts, non-current investments and bank balances. Included in shareholders’ equity and liabilities are overdraft facilities, liabilities to credit institutions, accounts payable and other current liabilities. With the exception of forward currency contracts, financial instruments are initially recognized at historical cost, equaling the fair value of the instrument plus transaction expenses. Instruments are then recognized subject to how they have been classified in accordance with the following. Forward currency contracts are recognized in the balance sheet as per the contract date and are measured at fair value, both initially and in subsequent reassessments. For more information see the section on hedge accounting below.
A financial asset or financial liability is recognized in the balance sheet when the company becomes party to the instrument’s contractual terms. Accounts receivable are recognized in the balance sheet when invoiced. Liabilities are recognized once the counterparty has completed its task and there is a contractual obligation to pay, even though an invoice may not yet
have been received. Accounts payable are recognized when invoices are received.
A financial asset or part thereof is de-recognized from the balance sheet when the contractual rights are realized, mature or are no longer under the company’s control. This also applies for part of a financial asset. A financial liability or part thereof is de-recognized from balance sheet when contractual obligations are met or otherwise extinguished. The same applies to part of a financial liability.
The acquisition or divestment of financial assets is recognized at the transaction date, which is the date on which the Company undertake to acquire or divest the asset.
A financial assets and financial liability are offset against each other and the net amount recognized in the balance sheet only when there is a legal right to offset the amounts and there is an intention to settle the items to a net amount or realize the asset and settle the liability simultaneously.
Financial instruments are measured at fair value and classified into the following categories:• Derivatives held for trade• Derivatives subject to hedge accounting• Saleable assets• Accounts receivable and loans receivable• Other financial liabilities
Fair value is determined based on the following three levels:• Level 1: According to quoted prices on an active market for the same
instrument• Level 2: Based on directly or indirectly observable market data not
included in Level 1• Level 3: Based on input data not observable on the market
All financial instruments measured at fair value have been measured according to Level 2.
Financial assetsDerivatives – Currency hedgesDerivatives are classified as Held for trade or Held for sale.
Held for trade• Measurement at fair value occurs in the income statement.
Held for sale• Measurement at fair value occurs through other comprehensive income.
DORO ANNUAL REPORT 2015 fInAnCIAL REPoRTS37

Accounts receivable and loans receivableAccounts receivable and loans receivable are non-derivative financial assets with determined or determinable payments that are not quoted on an active market. They are included among currents assets, with the exception of items maturing more than 12 month after the close of the reporting period, which are classified as non-current assets. The Group’s accounts receivable and loans receivable consist of accounts receivable and other receivables in the balance sheet. Accounts receivable are recognized net less doubtful accounts receivable. Deductions for doubtful accounts receivable are based on a model in which extended maturities give increased deductions. In addition, an individual assessment is made of accounts receivable, with account taken of anticipated bad debt losses. Other receivables are recognized net less doubtful receivables based on individual assessments with account taken of the expected losses they are expected to incur.
Other financial liabilitiesOther financial liabilities consist of accounts payable, liabilities to banks and accrued expenses apart from social security contributions and taxes. Other financial liabilities are measured at amortized cost.
Hedge accountingEffective from January 1, 2013, Doro applies hedge accounting for forward currency contracts. Doro’s overall hedging strategy is followed according to the adopted treasury policy in terms of purpose, amounts, maturities and currencies.
Changes in the value of forward exchange contracts classified as cash-flow hedges are recognized in other comprehensive income. Hedge accounting ceases when the underlying exposure enters the balance sheet (i.e. when purchase and sale occur). Accumulated results in the hedging reserve (which is in other comprehensive income) will then be dissolved in the cost of goods sold for forward exchange contracts pertaining to purchases, or in sales for forward exchange contracts pertaining to sales. Value changes pertaining to forward exchange contracts from the date on which hedge accounting ceased will be recognized directly in the cost of goods sold, or sales.
Forward exchange contracts linked to commercial flows not subject to hedge accounting are classified as “held for trade”. Value changes pertaining to such foreign exchange transactions have been recognized directly in sales for contracts relating to sales, and in the cost of goods sold for contracts relating to purchases.
Hedge accounting only occurs for forward contracts in EUR, USD, NOK and GBP and which refer to exposures that have not yet entered the balance sheet.
Foreign exchange derivatives linked to liquidity management and loans are not subject to hedge accounting. They are classified as “held for trade”. Value changes pertaining to such foreign exchange transactions are recognized in net financial income/expense.
Impairment At least at every year-end at the close of accounts, an assessment is made as to whether there is any indication of impairment of the carrying amounts of the Group’s assets. When there is such an indication, the recoverable amount of the asset is calculated. The recoverable amount is the higher of an asset’s net sale value and its value in use. When establishing value in use, present value computation is performed for estimated future payments that the asset is expected to generate during its useful life.
In present value computation, an interest rate before tax is used for the purpose of the calculation that reflects the current market interest rate and the risk attributable to the asset. If the recoverable amount is below the carrying amount then the asset is impaired to its recoverable amount. Reversals of impairment are recognized if there are no grounds for such impairment, except in terms of goodwill. Impairment and reversals of impairment are recognized in the income statement.
At least once a year, an assessment of forecast future earnings and cash flow trends is made with regard to goodwill and right to lease. When the carrying amount exceeds the recoverable amount, it is impaired.
Depreciation of property, plant and equipment Depreciation according to plan occurs on a straight-line basis on the historical cost of the asset category and the estimated useful life:
Tools for the manufacture of products included in intangible assets, capitalized development costs. All tools previously classified as property is fully depreciated.
Equipment and tools 2–5 years
Amortization of intangible assetsIntangible assets are amortized over their estimated useful life. For capitalized product development, amortization commences as of market launch of the product in question. Amortization according to plan occurs on a straight-line basis on the historical cost of the asset category: Capitalized expenditure for development work 1–3 yearsTrademarks 1–5 yearsCustomer register and distribution agreements 3–5 years
Leases Leases are classified in the Consolidated Accounts as either financial or operating leases. Finance leases exist when the financial risk and benefits associated with the ownership are essentially transferred to the lessee. Finance leases mainly refers to the lease out of alarm devices to public sector customers, that are simultaneously leased-in from a finance company. Leases are otherwise considered operating. Leases for company cars, photocopiers, computer equipment and the like are recognized as operating leases. Rents for premises are included in operating leases.
Inventory Inventories are measured at the lower of cost (in accordance with the first-in, first out principle – FIFO) and the net sale value (in accordance with the lowest value principle). Cost is calculated for each delivery.
Technological development is rapid and prices fall regularly. Impairment of inventory is recognized according to a model whereby older inventory gives greater impairment. Different product groups have varying rates of impairment. The net sales value is defined as the selling price less selling expenses. Impairment to the net sale value includes impairment due to technological and commercial obsolescence made in the Group company in question.
Impairment increases according to a scale, with products impaired to 50 percent after 6–12 months as inventory, depending on the product group, and fully impaired after 18 months. In addition, individual impairment tests may be carried out. The measurement technique using different obsolescence steps provides a sound assessment of fair value.
Provisions Provisions are defined as liabilities that are uncertain in term of amounts or time of settlement. A provision is recognized when there is an undertaking ensuring from a transpired event, it is probable that an outflow of resources will be required in order to settle the undertaking and that the amount can be reliably estimated. Pensions, guarantee commitments, disputes and additional expenses are recognized as provisions in the balance sheet.
Warranties and repairs Provisions are made for estimated repair expenditure and losses of margins regarding goods that may be returned within the warranty period (between one and two years from the sale to the end user).
A statistical program has been developed that captures outcomes regarding the time at which products are sold until they are returned, the proportion that is repaired, scrapped, compensated for through product exchange of crediting as well as cost for checking, repairs (including parts) and transport. In the event of deviations (mainly in the share of returned
DORO ANNUAL REPORT 2015 fInAnCIAL REPoRTS38

products), warranty provision requirements are changed.The total warranty reserve is classified as current liabilities as majority of guarantees falls within one year.
Tax All tax expected to be payable on reported profit is recognized in the income statement. Such taxes have been calculated according to each country’s tax regulations and are recognized under the item Tax on profit for the year.
The Group’s total tax in the income statement consists of current tax on taxable profits for the period, and deferred tax. The deferred tax mainly consists of changes in deferred tax assets with respect to loss carry-forwards and for tax purposes and other temporary differences.
The Group uses the balance sheet method for calculating deferred tax assets and liabilities. According to the balance sheet method, the calculation is made based on tax rates on the closing date applied to temporary differences between an asset or liability’s value in terms of accounting and taxations, and loss carry-forwards for tax purposes. Deferred tax assets are recognized in the balance sheet only to the extent of value that can probably be utilized within the foreseeable future. An individual assessment is performed of the situation for companies in each country.
Cash flow statement Cash flow statements are prepared using the indirect method, which means that profit/loss after financial income/expense is adjusted for transactions that did not entail incoming and outgoing payments during the period, and for income and expenses relating to the cash flow of investment activities.
Cash and cash equivalents Cash and equivalents comprise cash, bank balances and current investments. In 2015 and 2014 Doro had no current investments,
Segment reporting (IFRS 8) Operating segments are reported in a manner consistent with the internal reporting presented to the chief operating decision maker of the Group. The chief operating decision maker is the function responsible for the allocation of resources and the assessment of the segments’earnings. For Doro, this function has been identified as the CEO.
For further information about the segment reporting of Doro, see note 2.
Classification The balance sheet items entitled current assets and current liabilities are expected to be recovered or paid within a twelve-month period. All other balance sheet items are recovered or repaid later.
Critical accounting matters and uncertainty in estimates In their preparation of Doro’s Consolidated Accounts, the Board of Directors and the CEO, besides estimates made, have made a series of judgments regarding critical accounting matters that can significantly affect the amounts recognized. These pertain to the following:
Goodwill measurement When assessing testing for carrying amounts of goodwill for impairment, assumptions are made about the future expected profit and cash flow trend for the lowest possible cash-generating unit. This is further described in Note 7.
Deferred tax related to loss carry-forwards When measuring deferred tax assets an assessment is made of future surpluses for tax purposes of each company, and thereby of the ability to utilize the loss carry-forwards. The size of the loss carry-forwards is detailed in Note 17.
Credit risks in accounts receivable Individual assessments are made when evaluating credit risks in accounts receivable. The assessment is based on past payment capacity and other information. Doro has in the past had very low realized bad debt losses, but is active in follow up. Refer to Note 23 for further information.
Measurement of inventory Measurement of inventory is based on an inventory turnover model. In addition, individual assessments are performed based on past sale statistics and sales forecasts compared with product volumes in inventory and in production with suppliers.
Changed reporting principle for exchange rate differencesDoro has changed its reporting principle of exchange rate differences regarding revaluation of bank account balances and intra group loans in foreign currency. Previously this kind of exchange rate differences were not separated and reported in the operating result. As of January 1st 2015 the reporting principles have been change changed and these kind of exchange rate differences are reported in the financial result. Hence the figures for previous periods have been recalculated for comparison.
Changed reporting principles for accounts payableDoro has changed its reporting principle of accounts payable so that good invoices that have not yet been matched against delivery are classified as accounts payable instead of accrued expenses.
Adjustment in 2014 Consolidated income statement
Before adjustment Change
After adjustment
Other revenue 6.8 –0.9 5.9
Other expenses 0 –5.9 –5.9
Operating profit/loss 86.5 –6.8 79.7
Interest income and similar 0.7 6.8 7.5
Adjustment in 2014 Parent company income statement
Before adjustment Change
After adjustment
Other revenue 2.1 –1.3 0.8
Other expenses 0 –5.5 –5.5
Operating profit/loss 34.6 –6.8 27.8
Interest income and similar 4.9 6.8 11.7
Adjustment in 2014 Consolidated balance sheet
Before adjustment Change
After adjustment
Accounts payable - trade 159.9 91.9 251.8
Accrued expenses and prepaid income 178.5 –91.9 86.6
Adjustment in 2014 Parent company balance sheet
Before adjustment Change
After adjustment
Accounts payable - trade 140.6 91.9 232.5
Accrued expenses and prepaid income 160.0 –91.9 68.1
PARENT COMPANYImpairment of participation in Group companies and impairment reversalsParticipations in Group companies are measured at historical cost. If the recoverable amount (see section above entitled “impairment”) should prove to be lower, there is an impairment. Impairment of the value of participations in subsidiaries is reversed when there are no longer grounds for such impairment.
Financial instrumentsThe parent company applies fair value accounting for financial instruments in accordance with Annual Accounts Act Chap 4:14.
DORO ANNUAL REPORT 2015 fInAnCIAL REPoRTS39

NOTE 2SEGMENT REPORTING, INCOME AND OTHERE REVENUE AND – EXPENSES
Group Parent Company
Income divided into type of income 2015 2014 2015 2014
Net sales of products 1,828.9 1,270.3 1,393.4 1,011.6
Other revenue 9.1 5.9 1.3 0.8
Total 1,838.0 1,276.2 1,394.7 1,012.4
Group Parent Company
Other Revenue 2015 2014 2015 2014
EU funding 0.0 –0.4 0.0 –0.4
Capitalized development costs 6.1 4.3 1.3 0.0
Insurance income 0.0 1.2 0.0 1.2
Recovered receivables 0.0 0.1 0.0 0.0
Gain on sale of fixed assets 0.1 0.5 0.0 0.0
Others 2.9 0.2 0.0 0.0
Total 9.1 5.9 1.3 0.8
Other Expenses 2015 2014 2015 2014
Exchange rate differences –29.6 –5.9 –28.6 –5.5
Total –29.6 –5.9 –28.6 –5.5
Segment reporting (According to IFRS 8)Doro is recognized as a functional organization. The functional matrix structure provides a focused support for the organization and these services will be shared amongst the various products, geographical regions and distribution channels.
The Doro business is one reporting segment, and the financial information is analyzed and reviewed by the executive chief operating decisions maker as one segment in the assessment of the Doro’s performance.
The location of the customers forms the basis of sales by geographic region. No single customer amounts to more than 10% of Net sales. All significant tangible and intangible fixed assets are controlled by the Parent company in Sweden.
Total revenue per region 2015 2014
Nordic 492.9 270.8
Whereof Sweden 417.6 196.6
EMEA (Europe, Mid East and Africa) 462.9 309.7
DACH (Germany, Austria, Switzerland) 435.8 348.0
UK (Great Britain, Ireland) 267.9 206.4
USA and Canada 149.5 137.3
Rest of the world 12.3 9.4
Central overhead 16.7 –5.4
Total 1,838.0 1,276.2
NOTE 3INTRA GROUP TRANSACTIONSOf the Parent Company’s invoicing SEK 134.5 m (78.1) relates to subsidiaries. Invoicing from subsidiaries to the Parent Company amounted to SEK 96.2 (89.3). Invoicing between subsidiaries amounted to SEK 0.0 m (4.3).
NOTE 4RENTAL AND LEASING AGREEMENTSCosts for operational rental and leasing charges during the year amounts to SEK 14.5m (9.0) for the group and SEK 2.9m (2.9) for the parent company. Agreed future rental and leasing costs fall due for payment as shown below.
Group Parent Company
Rental and leasing 2015 2014 2015 2014
Within 1 year 11.3 8.1 2.8 2.7
Within 2 to 5 years 17.5 9.4 5.0 2.1
Later than 5 years 0.0 0.0 0.0 0.0
Total 28.8 17.5 7.8 4.8
In addition to the normal rental- and lease agreement dislosed above, Doro has financial lease out of alarm devices to customers in the public sector that are simultaneously leased-in from a finance company. The lease term is normally 24 months both from finance company and to customer.
The financial lease receivables are divided into short-term (within 1 year) of SEK 19.7m and long-term (2 to 5 years) of SEK 14.4m. Long-term financial lease liability amounts to SEK 14.4m and short-term financial lease liability amounts to SEK 19.7m.
NOTE 5PERSONNELAVERAGE NUMBER OF EMPLOYEES
Number 2015of whom
men 2014of whom
men
Parent Company 48 29 41 27
Other companies Sweden 122 54 0 0
Norway 3 3 3 3
United Kingdom 13 8 10 7
France 39 24 37 22
Hong Kong 9 7 8 6
Germany 48 35 56 40
Italy 1 1 0 0
Total 282 160 155 105
SALARIES AND REMUNERATIONSalaries, remuneration, social charges and pension cost have appeared with the following amounts:
Group Parent Company
SEK m 2015 2014 2015 2014
Salaries and other remuneration 140.1 81.6 32.6 25.3
140.1 81.6 32.6 25.3
Payroll overheads excluding pension costs 37.9 23.2 10.5 9.1
37.9 23.2 10.5 9.1
Pension costs 12.2 9.5 5.3 5.5
of which premium-based 10.5 8.7 5.3 5.5
12.2 9.5 5.3 5.5
DORO ANNUAL REPORT 2015 fInAnCIAL REPoRTS40

GENDER OF SENIOR MANAGERS
Number 2015Women
% 2014Women
%
Board 7 43 6 33
Group Management 7 29 6 17
SALARIES AND REMUNERATION INCLUDING BOARD FEE
2015 2014
SEK mBoard
and CEOOther
employeesBoard
and CEOOther
employees
Sweden 4.0 76,4 3.8 22.5
Norway 0.0 2.2 2.4
United Kingdom 0.0 7.3 6.7
France 2.0 21.6 2.1 19.4
Germany 0.0 20.8 21.2
Hong Kong 0.0 5.0 3.7
Italy 0.0 1.9 0.8
Total 6.0 135,2 5.9 76.7
MANAGEMENT REMUNERATION (SEK K)
The Board 2015 Fees Pension
Other remune-
ration Total
Chairman of the Board 350 0 0 350
Other Board members1) 675 0 0 675
Total 1,025 0 0 1,025
1) Charlotta Falvin, Jonas Mårtensson and Karin Moberg have received a fee of SEK 150k each. Lena Hofsberger and Henri Österlund, who were appointed board members on the Annual General Meeting April 27, 2015 received a fee of SEK 75k. Fredrik Hedlund that left the board on the Annual General Meeting April 27, 2015 received a fee of SEK 75k.
Senior Executives 2015 Salary
Bonus and
variable remune-
ration PensionOther
benefits Total
Jérôme Arnaud (CEO) 4,164 820 358 93 5,435
Other senior executives 8,004 582 1,877 460 10,923
Total 12,168 1,402 2,235 553 16,358
The amounts include salaries and remunerations to employed senior excecutives. In 2015, the management team has consisted of seven persons.
The Board 2014 Fees Pension
Other remune-
ration Total
Chairman of the Board 350 0 0 350
Other Board members1) 600 0 0 600
Total 950 0 0 950
1) Other Board members, except the CEO, received SEK 150k per person.
Senior Executives 2014 Salary
Bonus and
variable remune-
ration PensionOther
benefits Total
Jérôme Arnaud (CEO) 4,053 124 537 67 4,781
Other senior executives 5,776 633 1,799 517 8,725
Total 9,829 757 2,336 584 13,506
The amounts include salaries and remunerations to employed senior excecutives. In 2014, the management team has consisted of six persons.
PrinciplesFees are paid to the Chairman and other Board members in accordance with decisions made by the AGM. Payment for work on the boards of subsidiaries is made separately. Remuneration to the CEO and other senior executives comprises a basic salary, variable remuneration, other benefits (primarily a company car) and pension premiums. The balance between basic salary and variable remuneration should be in proportion to the executive’s responsibilities and authorities. Average number of senior executives in the management team in 2015 was 7 (6).
PensionsThe retirement age for CEO and other senior executives of the Group is 65–67 and pensions are usually paid in accordance with the general pension plan plus full remuneration for the entire amount of salaries according to the ITP/ITPK plans. All pension benefits are irrevocable,i.e. not dependent on continued employment.The retirement age for the CEO is 65 years. No agreements have been signed concerning pension commitments or the equivalent, more than is mentioned in the periods of notice mentioned above, whether for board members or senior executives. Pension schemes for senior executives are substantially premium-based with premiums of SEK 2.2 m (2.3) paid.
NoticeIf notice is served by the company or by the CEO himself, the period of notice is one year. The CEO has the right to salary over 12 months during the period of notice. No severance pay will be paid if notice is given by CEO. Other senior executives have agreement of salary during notice between 3 and 9 months.
Nominations and decision-making processesThese procedures are explained in the Directors’ Report.
DORO ANNUAL REPORT 2015 fInAnCIAL REPoRTS41

Share-related compensation and OptionsAn extraordinary General Meeting was held in August 21, 2014, and descision was made on directed issue of new warrants to senior executives and key employees within the Doro group. Each warrant gives the holder the right to buy one share to a predetermined price of SEK 42.00 during May 22, 2017 until June 21, 2017.
The warrant price of 1,26 was calculated according to the Black & Scholes model, taking into consideration estimated dividend and used share price of SEK 31.10, volatility 30%, riskfree interest 0.31% and duration of 2.78 year (2014-09-12 - 2017-06-21).
The CEO subscribed for 200,000 warrants and the rest of the group management subcribed for 325,000 warrants.
In 2015 an additional 42,000 warrants were subscribed by the group management and 65,000 warrants were re-purchased.
NOTE 6INTEREST AND SIMILAR ITEMS
Group Parent Company
Income 2015 2014 2015 2014
Interest income, external 0.0 0.2 0.0 0.3
Interest income, internal 0.0 0.0 4.6 4.1
Exchange rate gain 3.7 7.3 3.7 7.3
Other 0.4 0.0 0.0 0.0
Total 4.1 7.5 8.3 11.7
Expenses
Interest expenses, external –9.1 –2.6 –6.8 –1.8
Interest expenses, internal 0.0 0.0 –0.7 –0.3
Exchange rate losses –5.8 –5.3 –5.8 –5.3
Other 0.0 0.0 –0.1 –0.2
Total –14.9 –7.9 –13.4 –7.6
Financial net –10.8 –0.4 –5.1 4.1
NOTE 7INTANGIBLE FIXED ASSETS
Group/Goodwill, SEK m 2015 2014
Opening cost 151.9 142.2
Acquisitions during the year 200.0 1.4
Exchange rate difference –3.3 8.3
Closing accumulated cost 348.6 151.9
Group / Customer register and distribution agreements 2015 2014
Acquisition value brought forward 22.6 21.2
Acquisitions during the year 15.2 0.0
Exchange rate difference –0.5 1.4
Closing accumulated acquisition value 37.3 22.6
Write-downs brought forward –12.3 –5.5
Write-downs for the year –9.0 –6.2
Exchange rate difference 0.3 –0.6
Closing depreciation/write-downs –21.0 –12.3
Closing residual value according to plan 16.3 10.3
Parent company / Goodwill 2015 2014
Acquisition value brought forward 19.1 19.1
Acquisitions during the year 0.0 0.0
Closing accumulated acquisition value 19.1 19.1
Write-downs brought forward –19.1 –19.1
Write-downs for the year 0.0 0.0
Closing depreciation/write-downs –19.1 –19.1
Closing residual value according to plan 0.0 0.0
Parent company / Customer register 2015 2014
Acquisition value brought forward 14.8 14.8
Acquisitions during the year 0.0 0.0
Closing accumulated acquisition value 14.8 14.8
Write-downs brought forward –12.9 –9.9
Write-downs for the year –1.1 –3.0
Closing depreciation/write-downs –14.0 –12.9
Closing residual value according to plan 0.8 2.0
The Group assesses the need for goodwill to be written down on an annual basis or when indications of impairment arise. Impairment testing is applied at the lowest level where separable cash flows can be identified. Since all the Group companies’ activities and their contributions are very much dependent on each other there is no breakdown of goodwill.
The recoverable value of the unit has been established based on the current value in use of future cash flows. Future cash flows are estimated on the basis of expected growth rate in accordance with established forecasts for the next five years. These forecasts are based on historical experience, but also takes expected future development into account. Assumptions regarding future growth and profitability are based on external and internal estimates of market growth, past performance and management’s assessment of market shares.The WACC discount factor, has been set using the Capital Asset Pricing Model (CAPM). As part of the WACC the risk free interest equivalent to the yield on 10-year government-bonds has been applied with the addition of stock market ’s risk premium for small companies. The return requirement has been ascertained based on the optimum capital structure as derived from the capital market. Since the recoverable amount exceeds the carrying amount, no need for impairment is deemed to exist.
SENSITIVITY ANALYSISGrowth rate after 5 years: A change in the growth rate from 2 to 1 percent implies no impairment. Discount rate before tax increases by 1 percentage point: the discount rate before tax changes from 13.6 to 14.6 percent. The change implies no impairment.
DORO ANNUAL REPORT 2015 fInAnCIAL REPoRTS42

The Group/Brands, SEK m 2015 2014
Acquisition value brought forward 1.1 1.0
Acquisitions during the year 0.7 0.0
Exchange rate difference 0.0 0.1
Closing accumulated acquisition value 1.8 1.1
Depreciation according to plan brought forward –0.7 –0.5
Depreciation according to plan for the year –0.9 –0.2
Closing depreciation according to plan –1.6 –0.7
Closing residual value according to plan 0.2 0.4
Parent Company/Brands 2015 2014
Acquisition value brought forward 36.8 36.8
Acquisitions during the year 0.0 0.0
Closing accumulated acquisition value 36.8 36.8
Depreciation according to plan brought forward –36.5 –36.3
Depreciation according to plan for the year –0.2 –0.2
Closing depreciation according to plan –36.7 –36.5
Closing residual value according to plan 0.1 0.3
Group/Right to lease 2015 2014
Acquisition value brought forward 1.8 0.0
Acquisitions 0.0 1.8
Closing accumulated cost 1.8 1.8
The Group’s capitalized expenditure for development work / IT, SEK m 2015 2014
Acquisition value brought forward 108.8 76.0
Balanced during the year 37.8 18.6
Acquisitions 13.6 0.0
Exchange rate difference 0.0 0.4
Sales/Disposals -9.3 0.0
Reclassifications 8.4 13.8
Closing accumulated acquisition value 159.3 108.8
Depreciation according to plan brought forward –81.7 –49.4
Depreciation according to plan for the year –31.4 –32.1
Sales/Disposals 9.3 0.0
Reclassifications 0.0 0.0
Exchange rate difference 0.0 0.0
Closing depreciation according to plan –103.8 –81.7
Closing residual value according to plan 55.5 27.1
Ongoing capitalized expenditure for development work /IT, SEK m 2015 2014
Opening balance 9.7 14.6
Reclassifications –8.4 –13.8
New expenditure 20.3 9.1
Cost accounted –0.8 –0.2
Closing balance 20.8 9.7
Total closing residual value 76.3 36.8
Parent company / Capitalized expenditure for development work / IT, SEK m 2015 2014
Acquisition value brought forward 108.8 76.4
Balanced during the year 31.2 18.6
Sales/Disposals 0.0 0.0
Reclassifications 8.4 13.8
Closing accumulated acquisition value 148.4 108.8
Depreciation according to plan brought forward –81.7 –49.5
Depreciation according to plan for the year –29.0 –32.2
Sales/Disposals 0.0 0.0
Closing depreciation according to plan 0.0 0.0
Closing residual value according to plan –110.7 –81.7
Closing residual value according to plan 37.7 27.1
Ongoing capitalized expenditure for development work /IT 2015 2014
Opening balance 9.7 14.6
Reclassifications –8.4 –13.8
New expenditure 20.3 9.1
Cost accounted –1.2 –0.2
Closing balance 20.4 9.7
Total closing residual value 58.1 36.8
DORO ANNUAL REPORT 2015 fInAnCIAL REPoRTS43

NOTE 8TANGIBLE FIXED ASSETS
Group Parent Company
Equipment and tools, SEK m 2015 2014 2015 2014
Acquisition value brought forward 31.4 29.1 23.5 22.3
Acquisitions during the year 1.8 1.6 0.0 1.2
Acquisitions 4.1 0.4 0.0 0.0
Sales/Disposals –11.3 -0.3 –9.0 0.0
Reclassifications 0.0 0.0 0.0 0.0
Exchange rate difference –0.2 0.6 – –
Closing acquisition value 25.8 31.4 14.5 23.5
Depreciation according to plan –26.6 –22.1 –21.4 –18.0
Depreciation according to plan –2.6 –4.4 –0.7 –3.4
Sales/Disposals 11.0 0.2 9.0 0.0
Reclassifications 0.0 0.0 0.0 0.0
Exchange rate difference 0.1 –0.3 – –
Closing depreciation according to plan –18.1 –26.6 –13.1 –21.4
Closing residual value according to plan 7.7 4.8 1.4 2.1
2015 2014
Opening balance 73.4 68.3
Acquisition 236.5 5.0
Newly formed company 0 0.1
Closing balance 309.9 73.4
Subsidiary – Company reg. no Registered office
Doro A/S – 934210719 Fredrikstad, Norway
Doro UK Ltd – 1180330 Chalfont St Peter, United Kingdom
Doro SAS - 309,662,195 Versailles, France
Doro Hong Kong Ltd – 08194263-000-12-98-6 Kowloon, Hongkong
Doro Inc. - 4706937,810 0,090679976 New York, USA
Doro Incentive AB - 556843-4962 Lund, Sweden
Doro Deutschland GmbH - HRB75859 Köln, Germany
IVS Industrievertretung Schweiger GmbH
– HRB 2040 Amberg, Germany
Doro S.R.L - 08721340969 Milano, Italy
Aldebaran SAS - 504,770,116 Paris, France
Doro Care AB - 556388-9335 Kalix, Sweden
– Doro Trygghetsjour AB - 556569-9740 Malmö, Sweden
– Doro Care Nordic AB - 556773-1301 Kalmar, Sweden
– Doro Care Sales UK Limited - 7776454 London, United Kingdom
– Doro Care GmbH - HRB 6783 Taunus, Germany
NOTE 9PARTICIPATION IN GROUP COMPANIES
SubsidiaryNo. of shares %
Book value, SEK m, 2015
Book value, SEK m, 2014
Doro A/S, Norway 200 100 0.60 0.60
Doro UK Ltd 3,013,400 100 4.20 4.20
Doro SAS 66,667 100 11.60 11.60
Doro Hong Kong Ltd 4,500 100 5.10 5.10
Doro Inc 3,000 100 0.04 0.04
Doro Incentive AB 50,000 100 0.06 0.06
Doro Deutschland GmbH 1 100 0.20 0.20
IVS Industrievertretung Schweiger GmbH1) 9,239 33.33 46.50 46.50
Doro S.R.L 1 100 0.10 0.10
Aldebaran SAS 275,000 100 5.20 5.00
Doro Care AB2) 78,376 100 236.30 0.00
– Doro Trygghetsjour AB
– Doro Care Nordic AB
– Doro Care Sales UK Limited
– Doro Care GmbH
Total 309.9 73.4
1) IVS industrievertretung Schweiger GmbH is included in the Group to 100%. Doro AB owns 33.33% and Doro Deutschland GmbH owns 66.67%.
2) Doro Care AB’s subsidiaries are wholly-owned.
DORO ANNUAL REPORT 2015 fInAnCIAL REPoRTS44

NOTE 10OTHER CURRENT RECEIVABLES AND PREPAID EXPENSES AND ACCRUED INCOME
Group Parent Company
Other current receivables 2015 2014 2015 2014
VAT receivable 38.2 39.2 36.9 34.4
Cash Flow hedges 10.8 16.0 10.8 16.0
Financial lease receivables 19.7 0.0 0.0 0.0
Other current receivables 8.5 5.9 0.2 2.5
Total 77.2 61.1 47.9 52.9
Group Parent Company
Prepaid expenses and accrued income 2015 2014 2015 2014
Rent 3.8 0.6 0.4 0.4
Acquisition costs Caretech 0.0 0.0 0.0 3.0
Insurance premiums 0.6 1.4 0.0 1.2
Exhibition costs 1.4 2.3 1.3 2.3
IT costs 0.5 0.6 0.4 0.6
Licence costs 3.1 2.2 2.9 2.2
Installation expenses1) 17.3 0.0 0.0 0.0
Other prepaid expenses 3.5 1.2 2.1 0.4
Total 30.2 8.3 7.1 10.11) Prepaid installation expenses is related to the Caretech business, acquired in 2015.
NOTE 11SHARE CAPITAL AND DIVIDENDS
No. of shares Voting rights Class
A shares 23,238,255 1 vote per share Normal
Share capital23,238,255 shares at a quota value of SEK 1.00 per share = SEK 23,238,255.
New share issueDoro has during the year made a non-cash issue of 2,033,772 shares as payment to the sellers of 36.3% of the shares in Caretech AB.The total value of the non-cash issue was MSEK 84.4. The share issue increased the number of shares in Doro from 21,204,483 to 23,238,255, resulting in dilution of approximately 8.7% for existing shareholders.
DividendsThe Board of Directors proposes no dividend for the 2015 financial year.
Warrant programAn extraordinary General Meeting was held in August 21, 2014, and descision was made on directed issue of new warrants to senior executives and key employees within the Doro group. Each warrant gives the holder the right to buy one share to a predetermined price of SEK 42.00 during May 22, 2017 until June 21, 2017.
The warrant price is calculated according to the Black & Scholes model, taking into consideration estimated dividend and used share price of SEK 31.10, volatility 30%, riskfree interest 0.31% and duration of 2.78 year (2014-09-12 - 2017-06-21).
The CEO subscribed for 200,000 warrants and the rest of the group management subcribed for 325,000 warrants. Doro Incentive subcribed for 141,000 warrants possible to be used for future employees. Totaly 841,000 warrants were issued.
In 2015 an additional 135,000 warrants were subscribed and 65,000 warrants were re-purchased.
NOTE 12OVERDRAFT FACILITIES
Group Parent Company
SEK m 2015 2014 2015 2014
Approved credit 50.0 50.0 50.0 50.0
Utilized credit 4.1 41.5 4.1 41.5
NOTE 13ACCRUED EXPENSES AND PREPAID INCOME
Group Parent Company
SEK m 2015 2014 2015 2014
Holiday pay liability 12.0 7.7 4.4 4.2
Payroll overheads 7.7 5.9 2.4 1.9
Other staff liabilities 5.4 3.6 0.0 0.1
Accrued royalty 32.6 21.0 31.9 21.0
Accrued customer bonus 27.3 17.3 19.8 14.5
Other accrued expenses 31.9 31.1 21.1 26.4
Total 116.9 86.6 79.6 68.1
DORO ANNUAL REPORT 2015 fInAnCIAL REPoRTS45

NOTE 14PLEDGED ASSETS TO CREDIT INSTITUTIONS
Group Parent Company
SEK m 2015 2014 2015 2014
Chattel mortgages 186.6 170.0 170.0 170.0
Total 186.6 170.0 170.0 170.0
NOTE 15CONTINGENT LIABILITIES
Group Parent Company
2015 2014 2015 2014
Guarantees for subsidiary 0.0 0.0 3.0 0.0
Total 0.0 0.0 3.0 0.0
NOTE 16AUDITORSThe Annual General Meeting 2015 elected the audit firm Ernst & Young AB as auditor of Doro AB, with Stefan Engdahl as head auditor. Ernst & Young will carry out the audit of all large units for the period of one year.
Group Parent Company
Fees and costs, SEK m 2015 2014 2015 2014
Auditing assignments 2.1 1.0 0.9 0.4
Auditing outside the assignment 1.2 0.2 0.3 0.2
Tax assignments 0.6 0.4 0.5 0.4
Other advisory services by auditors 0.4 2.1 0.4 2.1
Total 4.3 3.7 2.1 3.1
NOTE 17TAXES
Group Parent Company
Taxes on profit/loss for the year, SEK m 2015 2014 2015 2014
Current tax –19.1 –15.1 –3.9 –4.0
Deferred tax –1.5 –6.0 –2.2 –3.3
Total tax on profit/loss for the year –20.6 –21.1 –6.1 –7.3
Connection between the tax expense for the year and the reported earnings before tax:
Group Parent Company
Taxes, SEK m 2015 2014 2015 2014
Reported profit/loss before tax 84.4 79.3 26.4 31.9
Tax at current rate 22.0 % –18.6 –17.4 –5.8 –7.0
Non-deductible expenses –4.1 –0.3 –0.3 –0.3
Non-taxable income 1.5 0.0 0.0 0.0
Utilisation of previously unrecogni-zed tax loss carryforwards 1.1 0.0 0.0 0.0
Change in valuation in losses carry-forwards 6.1 1.0 0.0 0.0
Change in valuation of temporary differences 0.0 0.7 0.0 0.0
Tax cost concerning previous year –2.4 –1.9 0.0 0.0
Adjustment for tax rates in foreign Group company –4.2 –3.2 0.0 0.0
Reported tax –20.6 –21.1 –6.1 –7.3
Temporary differences arise in those cases where accounted values of assets or liabilities and their tax value are different. Temporary differences, unutilized losses carry forward and other future tax deductions have led to deferred tax liabilities and tax assets for the following:
Group Parent Company
Deferred tax asset, SEK m 2015 2014 2015 2014
Unutilized losses carry forward 8.6 0.0 0.0 0.0
Temporary differences, provisions 8.8 15.5 8.8 11.0
Temporary differences, other –1.8 0.1 0.6 1.0
Total reported deferred tax asset 15.6 15.6 9.4 12.0
Deferred tax assets are shown for unutilized losses carried forward and temporary differences in the balance sheet, when they are calculated to be used in the near future. A single calculation is made for each company with respect to past earnings trends, future plans and the option of using losses carried forward.
Of the consolidated losses carried forward, SEK 95m (88) can be used without a time limit being imposed. The remaining losses are in the United Kingdom, France and Sweden.
Losses carry forward due as follows:
2015 2014
Without limit 95 88
Total 95 88
Non-accounted deferred tax assets in the balance sheet concerning unutilized taxable losses carry forward amount to:
Group Parent Company
SEK m 2015 2014 2015 2014
15 26 0 0
DORO ANNUAL REPORT 2015 fInAnCIAL REPoRTS46

NOTE 18ACQUISITIONSOn January 30, 2015 Doro AB acquired 63.7% of the stock in Caretech AB in Kalix. The remaining 36.3% was acquired on 18 February 2015 through an issule of new shares. Cost of acquisition has been charged to 2014 earnings with SEK 3m and to 2015 earnings with SEK 0.8m. The purchase price was paid in cash with SEK 148.1m and SEK 84.4m as a non-cash issue. Goodwill is linked to the enhanced position in the Care segment that Caretech’s new sales channels provide, as well as increased expertise in the care segment for the senior population. On the acquisition date, the headcount was 154. Net sales for 2014 amounted to SEK 130.1m with an EBIT of SEK 7.5m.
In 2015 the Caretech business was integrated with Doro and consequently it is not possible to measure Net sales and EBIT for the acquired operations isolated.
The figures for the acquired net assets and goodwill are presented below.
Fair value SEK m
Intangible assets 29.7
Tangible fixed assets 4.1
Deferred tax asset 5.1
Other financial assets 0.3
Inventories 9.9
Accounts receivable 20.2
Other receivables, prepaid expenses and accrued income 10.7
Cash and bank 2.0
Interest bearing debt –16.0
Accounts payable –11.9
Deferred tax liability –3.1
Other liabilites, accrued expenses and prepaid income –18.5
Acquired Net Assets 32.5
Goodwill 200.0
Total purchase consideration 232.5
Whereof paid with new share issue –84.4
Cash in company acquired –2.0
The acquisition's impact on the Group's cash flow 146.1
Acquisition after closingOn 18 February 2016 Doro agreed with SOS International to acquire Trygghetssentralen, the largest private social alarm center in Norway. Trygghetssentralen delivers social alarm services to approximately 34,000 users on behalf of 110 municipalities. The company has 68 permanent employees and approximately 60 temporary employees. Trygghetssentralen has annual sales of NOK 68 million. It is headquartered in Oslo. The take over of ownership is expected to take place in mid April. The final purchase price is estimated to NOK 30 million.
Contingent and deferred consideration for acquisitions 2013IVS GmbHDuring Q1,2015 deferred consideration of EUR 1.6m (SEK 14.9m) was paid. The deferred consideration was discounted to present value of EUR 1.458m in the purchase price analysis. The difference of EUR 0.142m has been accounted for as a financial cost in the consolidated accounts. The acquisition of IVS is now fully paid.
Isidor SASThe contingent consideration as of December 31, 2014 was estimated to SEK 3.6m, whereof SEK 2.6m was accounted for as a long-term liability and SEK 1.0m as a current liability. During Q2,2015 the contingent consideration for 2014, SEK 0.9m was paid. The contingent consideration for 2015 is revised as of December 31, 2015 and is estimated to SEK 2.1m and accounted for as a current liability.
Group
Company acquisition impact on Group cash flow 2015 2014
Caretech AB –146.1 0.0
IVS GmbH –14.9 –18.2
Isidor SAS –0.9 –0.3
Aldebaran 0.0 –3.4
–162.0 –21.9
NOTE 19FINISHED GOODS AND GOODS FOR RESALE
The Group, SEK m 2015 2014
Opening gross stock 214.8 141.2
Acquisition 10.1 0.2
Change in gross stock –21.8 71.8
Internal profit in stock –0.1 –1.8
Exchange rate difference –1.2 3.4
Closing gross stock 201.8 214.8
Opening write-downs of stock –10.2 –10.9
Acquisition –0.2 0.0
Change in write-downs of stock –3.1 1.2
Exchange rate difference 0.2 –0.5
Closing write-downs of stock 1) –13.3 –10.2
Net stock in balance sheet 188.5 204.6
1) Acquisition value for the inventory that write-downs of stock of SEK 13.3 m (10.2) relates to is based on inventory book value of SEK 42.7 m (36.4).
Parent company, SEK m 2015 2014
Opening gross stock 163.1 92.9
Change in gross stock –33.3 70.2
Closing gross stock 129.8 163.1
Opening write-downs of stock –6.2 –5.3
Change in write-downs of stock –2.8 –0.9
Closing write-downs of stock 1) –9.0 –6.2
Net stock in balance sheet 120.8 156.9
1) Acquisition value for the inventory reserve of SEK 9.0 m (6.2) is based on inventory book value of SEK 42.4 m (30.4).
DORO ANNUAL REPORT 2015 fInAnCIAL REPoRTS47

NOTE 20PROVISION FOR GUARANTEES
Group Parent Company
SEK m 2015 2014 2015 2014
Opening balance 42.9 41.1 36.9 33.7
Amount released –61.2 –45.6 –53.1 –43.9
New provisions 72.7 47.1 64.2 47.1
Exchange rate difference –0.1 0.3 – –
Closing balance 54.3 42.9 48.0 36.9
NOTE 21PENSION PROVISIONS
The Group, SEK m 2015 2014
Opening balance 2.8 1.7
Amount released 0.0 0.0
New provisions 0.2 0.9
Exchange rate difference –0.1 0.3
Closing balance 2.9 2.8
NOTE 22OTHER PROVISIONS
Group Parent Company
SEK m 2015 2014 2015 2014
Opening balance 54.1 68.2 36.6 52.3
Amount released –4.7 –2.1 –1.2 –0.3
New provisions 8.1 5.2 0.3 2.7
Unutilized amount cancelled –27.2 –18.5 –11.8 –18.5
Reclassification 0.9 0.4 1.1 0.4
Exchange rate difference –0.1 0.9 – –
Closing balance 31.1 54.1 25.0 36.6
Group Parent Company
2015 2014 2015 2014
Additional costs 25.7 53.9 25.0 36.6
Other provisions 5.4 0.2 0.0 0.0
Closing balance 31.1 54.1 25.0 36.6
Additional costsAdditional costs include costs that are known but that have not been debited at the time of invoicing and those that are unknown but expected at the time of invoicing. The provision for additional costs is charged against costs for goods sold to obtain correct allocation by period of the gross margin.
NOTE 23RISK MANAGEMENT AND FINANCIAL INSTRUMENTSFinancial risk managementThe Board of Directors of Doro has adopted a treasury policy that regulates how financial risks are to be identified and managed. Risk Management aims to reduce or eliminate risks. The main objective is to achieve a low risk profile.
Doro AB (parent company) has the overall responsibility for the Group´s financial risk management including currency risk management, liquidity management and cash management. Centralisation and coordination enable substantial economies of scale with respect to the terms obtained for financial transactions and financing. The risk to which Doro is exposed are described below.
Credit and counterparty riskThe Group is primarily exposed to credit risk associated with financial investments and in accounts receivable, as well as counterparty risk associated with futures hedging. Credit and counterparty risks are managed centrally by the parent company of Doro AB and regulated by the treasury policy. Financial instruments may only be done with counterparties/issuers within the categories government, municipalities and banks. At 31 December 2015 and 31 December 2014 there were no short-term investmetns.
The value of accounts receivable amounted to SEK 375.2m (269.4). In recent years Doro has experienced low credit losses (less than 0.5 percent of sales) due to the fact that the main customer group is large business with regular trade. The single largest customer accounts for less than 10% of Group sales. In most countries Doro operates without credit insurance.
DORO ANNUAL REPORT 2015 fInAnCIAL REPoRTS48
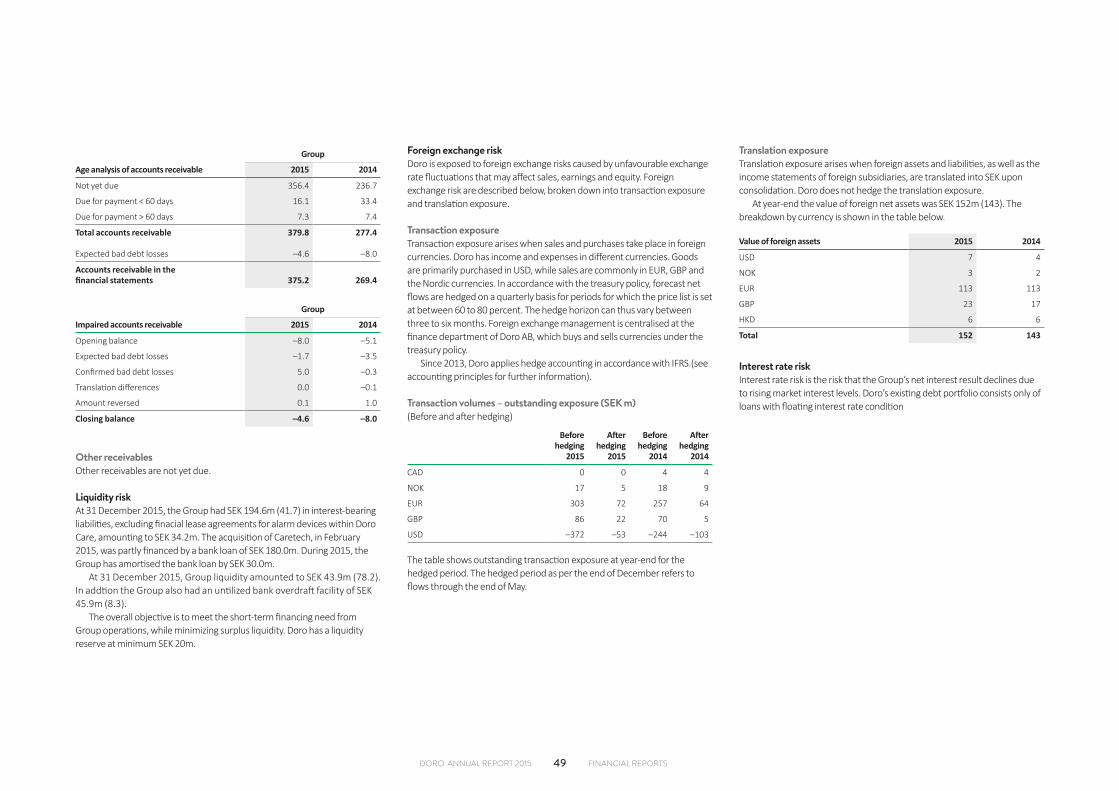
Group
Age analysis of accounts receivable 2015 2014
Not yet due 356.4 236.7
Due for payment < 60 days 16.1 33.4
Due for payment > 60 days 7.3 7.4
Total accounts receivable 379.8 277.4
Expected bad debt losses –4.6 –8.0
Accounts receivable in the financial statements 375.2 269.4
Group
Impaired accounts receivable 2015 2014
Opening balance –8.0 –5.1
Expected bad debt losses –1.7 –3.5
Confirmed bad debt losses 5.0 –0.3
Translation differences 0.0 –0.1
Amount reversed 0.1 1.0
Closing balance –4.6 –8.0
Other receivablesOther receivables are not yet due.
Liquidity riskAt 31 December 2015, the Group had SEK 194.6m (41.7) in interest-bearing liabilities, excluding finacial lease agreements for alarm devices within Doro Care, amounting to SEK 34.2m. The acquisition of Caretech, in February 2015, was partly financed by a bank loan of SEK 180.0m. During 2015, the Group has amortised the bank loan by SEK 30.0m.
At 31 December 2015, Group liquidity amounted to SEK 43.9m (78.2). In addtion the Group also had an untilized bank overdraft facility of SEK 45.9m (8.3).
The overall objective is to meet the short-term financing need from Group operations, while minimizing surplus liquidity. Doro has a liquidity reserve at minimum SEK 20m.
Foreign exchange riskDoro is exposed to foreign exchange risks caused by unfavourable exchange rate fluctuations that may affect sales, earnings and equity. Foreign exchange risk are described below, broken down into transaction exposure and translation exposure.
Transaction exposureTransaction exposure arises when sales and purchases take place in foreign currencies. Doro has income and expenses in different currencies. Goods are primarily purchased in USD, while sales are commonly in EUR, GBP and the Nordic currencies. In accordance with the treasury policy, forecast net flows are hedged on a quarterly basis for periods for which the price list is set at between 60 to 80 percent. The hedge horizon can thus vary between three to six months. Foreign exchange management is centralised at the finance department of Doro AB, which buys and sells currencies under the treasury policy.
Since 2013, Doro applies hedge accounting in accordance with IFRS.(see accounting principles for further information).
Transaction volumes – outstanding exposure (SEK m)(Before and after hedging)
Before hedging
2015
After hedging
2015
Before hedging
2014
After hedging
2014
CAD 0 0 4 4
NOK 17 5 18 9
EUR 303 72 257 64
GBP 86 22 70 5
USD –372 –53 –244 –103
The table shows outstanding transaction exposure at year-end for the hedged period. The hedged period as per the end of December refers to flows through the end of May.
Translation exposureTranslation exposure arises when foreign assets and liabilities, as well as the income statements of foreign subsidiaries, are translated into SEK upon consolidation. Doro does not hedge the translation exposure.
At year-end the value of foreign net assets was SEK 152m (143). The breakdown by currency is shown in the table below.
Value of foreign assets 2015 2014
USD 7 4
NOK 3 2
EUR 113 113
GBP 23 17
HKD 6 6
Total 152 143
Interest rate riskInterest rate risk is the risk that the Group’s net interest result declines due to rising market interest levels. Doro’s existing debt portfolio consists only of loans with floating interest rate condition
DORO ANNUAL REPORT 2015 fInAnCIAL REPoRTS49
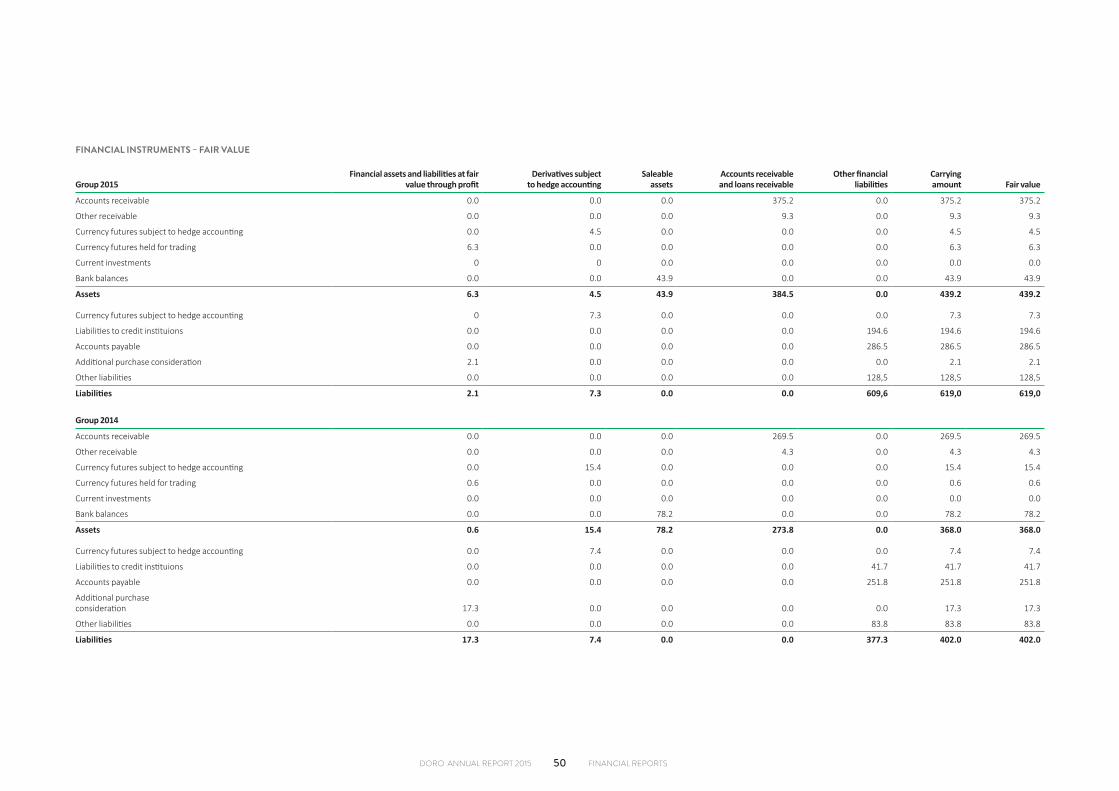
FINANCIAL INSTRUMENTS – FAIR VALUE
Group 2015Financial assets and liabilities at fair
value through profitDerivatives subject
to hedge accountingSaleable
assetsAccounts receivable
and loans receivableOther financial
liabilitiesCarrying amount Fair value
Accounts receivable 0.0 0.0 0.0 375.2 0.0 375.2 375.2
Other receivable 0.0 0.0 0.0 9.3 0.0 9.3 9.3
Currency futures subject to hedge accounting 0.0 4.5 0.0 0.0 0.0 4.5 4.5
Currency futures held for trading 6.3 0.0 0.0 0.0 0.0 6.3 6.3
Current investments 0 0 0.0 0.0 0.0 0.0 0.0
Bank balances 0.0 0.0 43.9 0.0 0.0 43.9 43.9
Assets 6.3 4.5 43.9 384.5 0.0 439.2 439.2
Currency futures subject to hedge accounting 0 7.3 0.0 0.0 0.0 7.3 7.3
Liabilities to credit instituions 0.0 0.0 0.0 0.0 194.6 194.6 194.6
Accounts payable 0.0 0.0 0.0 0.0 286.5 286.5 286.5
Additional purchase consideration 2.1 0.0 0.0 0.0 0.0 2.1 2.1
Other liabilities 0.0 0.0 0.0 0.0 128,5 128,5 128,5
Liabilities 2.1 7.3 0.0 0.0 609,6 619,0 619,0
Group 2014
Accounts receivable 0.0 0.0 0.0 269.5 0.0 269.5 269.5
Other receivable 0.0 0.0 0.0 4.3 0.0 4.3 4.3
Currency futures subject to hedge accounting 0.0 15.4 0.0 0.0 0.0 15.4 15.4
Currency futures held for trading 0.6 0.0 0.0 0.0 0.0 0.6 0.6
Current investments 0.0 0.0 0.0 0.0 0.0 0.0 0.0
Bank balances 0.0 0.0 78.2 0.0 0.0 78.2 78.2
Assets 0.6 15.4 78.2 273.8 0.0 368.0 368.0
Currency futures subject to hedge accounting 0.0 7.4 0.0 0.0 0.0 7.4 7.4
Liabilities to credit instituions 0.0 0.0 0.0 0.0 41.7 41.7 41.7
Accounts payable 0.0 0.0 0.0 0.0 251.8 251.8 251.8
Additional purchase consideration 17.3 0.0 0.0 0.0 0.0 17.3 17.3
Other liabilities 0.0 0.0 0.0 0.0 83.8 83.8 83.8
Liabilities 17.3 7.4 0.0 0.0 377.3 402.0 402.0
DORO ANNUAL REPORT 2015 fInAnCIAL REPoRTS50

FINANCIAL INSTRUMENTS – FAIR VALUE
Parent Company 2015Financial assets and liabilities at fair
value through profitDerivatives subject
to hedge accountingSaleable
assetsAccounts receivable
and loans receivableOther financial
liabilitiesCarrying amount Fair value
Accounts receivable 0.0 0.0 0.0 271.3 0.0 271.3 271.3
Receivables from Group companies 0.0 0.0 0.0 198.5 0.0 198.5 198.5
Other receivables 0.0 0.0 0.0 0.2 0.0 0.2 0.2
Currency futures subject to hedge accounting 0 4.5 0.0 0.0 0.0 4.5 4.5
Currency futures held for trading 6.3 0.0 0.0 0.0 0.0 6.3 6.3
Current investments 0 0 0.0 0.0 0.0 0.0 0.0
Bank balances 0.0 0.0 7.1 0.0 0.0 7.1 7.1
Assets 6.3 4.5 7.1 470.0 0.0 487.9 487.9
Currency futures subject to hedge accounting 0.0 7.3 0.0 0.0 0.0 7.3 7.3
Liabilities to credit institutions 0.0 0.0 0.0 0.0 154.1 154.1 154.1
Accounts payable 0.0 0.0 0.0 0.0 250.0 250.0 250.0
Receivables from Group companies 0.0 0.0 0.0 0.0 94.9 94.9 94.9
Other liabilities 0.0 0.0 0.0 0.0 79,1 79,1 79,1
Liabilities 0.0 7.3 0.0 0.0 578,1 585,4 585,4
Parent Company 2014
Accounts receivable 0.0 0.0 0.0 202.1 0.0 202.1 202.1
Receivables from Group companies 0.0 0.0 0.0 175.8 0.0 175.8 175.8
Other receivables 0.0 0.0 0.0 0.8 0.0 0.8 0.8
Currency futures subject to hedge accounting 0 15.4 0.0 0.0 0.0 15.4 15.4
Currency futures held for trading 0.6 0.0 0.0 0.0 0.0 0.6 0.6
Current investments 0.0 0.0 0.0 0.0 0.0 0.0 0.0
Bank balances 0.0 0.0 9.9 0.0 0.0 9.9 9.9
Assets 0.6 15.4 9.9 378.7 0.0 404.6 404.6
Currency futures subject to hedge accounting 0.0 7.4 0.0 0.0 0.0 7.4 7.4
Liabilities to credit institutions 0.0 0.0 0.0 0.0 41.5 41.5 41.5
Accounts payable 0.0 0.0 0.0 0.0 232.4 232.4 232.4
Receivables from Group companies 0.0 0.0 0.0 0.0 42.0 42.0 42.0
Other liabilities 0.0 0.0 0.0 0.0 66.6 66.6 66.6
Liabilities 0.0 7.4 0.0 0.0 382.5 389.9 389.9
The breakdown of fair value determination is performed at the following three levels:Level 1: According to quoted prices on an active market for the same instrument.Level 2: Based on directly or indirectly observable market data not included in Level 1.Level 3: Based on input date not observable on the market.Derivates and additional purchase considerations at fair value in the table above have been valued according to Level 2.For other financial instruments, the carrying amount is a reasonable estimate of fair value.
DORO ANNUAL REPORT 2015 fInAnCIAL REPoRTS51

NOTE 24LONG-TERM LIABILITIES
Group Parent Company
2015 2014 2015 2014
Bank loans 121.9 0.0 120.0 0.0
Financial leasing liability 14.4 0.0 0.0 0.0
Total 136.3 0.0 120.0 0.0
Group Parent Company
2015 2014 2015 2014
Amounts that fall due in 1–5 years 136.3 0.0 120.0 0.0
Amounts that fall due later than 5 years 0.0 0.0 0.0 0.0
Total 136.3 0.0 120.0 0.0
NOTE 25RELATED PARTY TRANSACTIONSHelmut Schweiger, owner of 4.9% of Doro, has at year-end a liability to Doro amounting to SEK 6 million referring to tax expenses relating to the time before Doro acquired IVS GmbH from him. The parties have agreed that Helmut Schweiger pays the liability when the Group settles the corresponding liability towards the German tax authority.
No other related party transactions during the year, apart from salaries and remunerations in Note 5.
DORO ANNUAL REPORT 2015 fInAnCIAL REPoRTS52

BOARD SIGNING
The undersigned hereby pledge that the consolidated accounts and the annual report have been drawn up in accordance with the International Financial Reporting Standards (IFRS) as adopted by the EU and according to
good accounting practices and give a true picture of the Group´s and company´s position and earnings, and the consolidated directors´report and directors´report give a true overview of developments in the Group´s and
company´s business, position and earnings and describes significant risks and uncertainty factors faced by Group companies.
Lund, April 11, 2016
Bo Kastensson
Chairman of the Board
Charlotta Falvin Lena Hofsberger Karin Moberg
Board member Board member Board member
Jonas Mårtensson Henri Österlund Jérôme Arnaud
Board member Board member CEO
Our auditor´s report was submitted on April 11, 2016
Ernst & Young AB
Stefan Engdahl
Authorized Public Accountant
DORO ANNUAL REPORT 2015 fInAnCIAL REPoRTS53

AUDITOR’S REPORTTo the annual meeting of the shareholders of Doro AB (publ), corporate identity number 556161-9429
REPORT ON THE ANNUAL ACCOUNTS AND CONSOLIDATED ACCOUNTSWe have audited the annual accounts and consolidated accounts of Doro AB (publ) for the year 2015, except for the corporate governance statement on pages 22–26. The annual accounts and consolidated accounts of the company are included in the printed version of this document on pages 17–53.
Responsibilities of the Board of Directors and the Managing Director for the annual accounts and consolidated accountsThe Board of Directors and the Managing Director are responsible for the preparation and fair presentation of these annual accounts in accordance with the Annual Accounts Act and of the consolidated accounts in accordance with International Financial Reporting Standards, as adopted by the EU, and the Annual Accounts Act, and for such internal control as the Board of Directors and the Managing Director determine is necessary to enable the preparation of annual accounts and consolidated accounts that are free from material misstatement, whether due to fraud or error.
Auditor’s responsibilityOur responsibility is to express an opinion on these annual accounts and consolidated accounts based on our audit. We conducted our audit in accordance with International Standards on Auditing and generally accepted auditing standards in Sweden. Those standards require that we comply with ethical requirements and plan and perform the audit to obtain reasonable assurance about whether the annual accounts and consolidated accounts are free from material misstatement.
An audit involves performing procedures to obtain audit evidence about the amounts and disclosures in the annual accounts and consolidated accounts. The procedures selected depend on the auditor’s judgement, including the assessment of the risks of material misstatement of the annual accounts and consolidated accounts, whether due to fraud or error. In making those risk assessments, the auditor considers internal control relevant to the company’s preparation and fair presentation of the annual accounts and consolidated accounts in order to design audit procedures that are appropriate in the circumstances, but not for the purpose of expressing an opinion on the effectiveness of the company’s internal control. An audit also includes evaluating the appropriateness of accounting policies used and the reasonableness of accounting estimates made by the Board of Directors and the Managing Director, as well as evaluating the overall presentation of the annual accounts and consolidated accounts.
We believe that the audit evidence we have obtained is sufficient and appropriate to provide a basis for our audit opinions.
OpinionsIn our opinion, the annual accounts have been prepared in accordance with the Annual Accounts Act and present fairly, in all material respects, the financial position of the parent company as of 31 December 2015 and of its financial performance and its cash flows for the year then ended in accordance with the Annual Accounts Act. The consolidated accounts have been prepared in accordance with the Annual Accounts Act and present fairly, in all material respects, the financial position of the group as of 31 December 2015 and of their financial performance and cash flows for the year then ended in accordance with International Financial Reporting Standards, as adopted by the EU, and the Annual Accounts Act. Our opinions do not cover the corporate governance statement on pages 22–26. The statutory administration report is consistent with the other parts of the annual accounts and consolidated accounts.
We therefore recommend that the annual meeting of shareholders adopt the income statement and balance sheet for the parent company and the group.
Report on other legal and regulatory requirementsIn addition to our audit of the annual accounts and consolidated accounts, we have also audited the proposed appropriations of the company’s profit or loss and the administration of the Board of Directors and the Managing Director of Doro AB (publ) for the year 2015. We have also conducted a statutory examination of the corporate governance statement.
Responsibilities of the Board of Directors and the Managing DirectorThe Board of Directors is responsible for the proposal for appropriations of the company’s profit or loss. The Board of Directors and the Managing Director are responsible for administration under the Companies Act and that the corporate governance statement on pages 22–26 has been prepared in accordance with the
Auditor’s responsibilityOur responsibility is to express an opinion with reasonable assurance on the proposed appropriations of the company’s profit or loss and on the administration based on our audit. We conducted the audit in accordance with generally accepted auditing standards in Sweden.
As a basis for our opinion on the Board of Directors’ proposed appropriations of the company’s profit or loss, we examined whether the proposal is in accordance with the Companies Act. As a basis for our opinion concerning discharge from liability, in addition to
our audit of the annual accounts and consolidated accounts, we examined significant decisions, actions taken and circumstances of the company in order to determine whether any member of the Board of Directors or the Managing Director is liable to the company. We also examined whether any member of the Board of Directors or the Managing Director has, in any other way, acted in contravention of the Companies Act, the Annual Accounts Act or the Articles of Association.
We believe that the audit evidence which we have obtained is sufficient and appropriate in order to provide a basis for our opinions.
Furthermore, we have read the corporate governance statement and based on that reading and our knowledge of the company and the group we believe that we have obtained a sufficient basis for our opinion. This means that our statutory examination of the corporate governance statement is different and substantially less in scope than an audit conducted in accordance with International Standards on Auditing and generally accepted auditing standards in Sweden.
OpinionsWe recommend to the annual meeting of shareholders that the profit be appropriated in accordance with the proposal in the statutory administration report and that the members of the Board of Directors and the Managing Director be discharged from liability for the financial year.
A corporate governance statement has been prepared, and its statutory content is consistent with the other parts of the annual accounts and the consolidated accounts.
Malmö, 11 April 2016Ernst & Young AB
Stefan EngdahlAuthorized Public Accountant
DORO ANNUAL REPORT 2015 fInAnCIAL REPoRTS54

QUARTERLY SUMMARY
2015 2014
SEK m Q 1 Q 2 Q 3 Q 4 Q 1 Q 2 Q 3 Q 4
QUARTERLY PROFIT TREND
Income/Net sales 340 425 447 626 233 274 332 437
Operating costs –352 –386 –407 –554 –218 –251 –292 –392
Operating profit/loss before depreciation –12 39 40 72 15 23 40 45
Planned depreciation and write-downs –11 –10 –10 –13 –11 –11 –11 –10
Operating profit/loss after depreciation –23 29 30 59 4 12 29 35
Net financial items –5 –2 –1 –2 –1 1 1 –2
Profit/loss after financial items –28 27 29 57 3 13 30 33
Taxes 6 –6 –7 –14 –1 –4 –6 –11
Net profit/loss –22 21 22 43 2 9 24 22
QUARTERLY BALANCE SHEET FOR THE GROUP
Intangible assets 428 433 440 443 197 203 201 201
Tangible assets 10 7 7 8 6 6 6 5
Financial assets 1 1 14 15 1 1 1 1
Deferred Tax Asset 19 19 15 16 20 19 19 16
Inventories 237 185 225 189 116 133 189 205
Current receivables 322 325 387 485 193 199 259 348
Cash and bank balances 52 54 43 43 70 89 96 78
Total assets 1,069 1,024 1,131 1,199 603 649 769 853
Shareholders' equity 409 421 449 482 292 288 316 335
Long -term Liabilities 225 188 187 170 108 108 66 60
Current Liabilities 435 415 495 547 204 253 387 458
Total shareholders' equity and liabilities 1,069 1,024 1,131 1,199 603 649 769 853
2015 2014
SEK m Q 1 Q 2 Q 3 Q 4 Q 1 Q 2 Q 3 Q 4
QUARTERLY CASH FLOW
Operating profit/loss after financial items –28 27 29 57 3 13 30 33
Depreciation accrding to plan 11 10 10 13 11 11 11 10
Other non cash flow items 16 –4 1 –6 –2 3 –14 –11
Taxes –10 –6 –3 1 –4 –3 –4 –7
Change in working capital –34 38 –4 –33 –38 23 –9 –35
Cash flow from current activities –45 65 33 32 –30 47 14 –10
Investments –251 –16 –13 –23 –24 –12 –8 –7
Cash flow from investment activities –251 –16 –13 –23 –24 –12 –8 –7
Dividend/ Premium for Warrant Program 0 0 0 0 0 –32 0 0
New share issue and premium for warrant program 84 0 0 0 0 14 1 0
Change in interest-bearing liabilities 186 –47 –32 –6 0 0 0 –3
Cash flow from financial activities 270 –47 –32 –6 0 –18 1 –3
Translation differences and other 0 0 1 –2 0 2 0 2
Liquid assets (change in liquid funds) –26 2 –11 1 –54 19 7 –18
DORO ANNUAL REPORT 2015 fInAnCIAL REPoRTS55

FIVE YEAR SUMMARY
SEK m 2015 2014 2013 2012 2011
INCOME STATEMENT
Income 1,838.0 1,276.2 1,142.5 837.5 745.4
Operating profit/loss before depreciation and write-downs, EBITDA 139.2 122.6 113.7 83.1 75.6
Operating profit/loss after depreciation and write-downs, EBIT 95.2 79.7 78.9 61.4 62.0
Net financial items –10.8 –0.4 –0.7 –11.9 10.9
Profit/loss after financial items 84.4 79.3 78.2 49.5 72.9
BALANCE SHEET
Fixed assets 481.4 222.3 227.8 93.2 86.1
Current assets 673.8 552.2 397.2 282.1 214.3
Cash and bank balances 43.9 78.2 123.9 141.1 148.4
Shareholders’ equity 482.0 334.8 287.0 209.0 177.3
Long-term liabilities 170.3 59.6 138.3 73.1 88.7
Current liabilities 546.6 458.3 323.6 234.3 182.8
Balance sheet total 1,198.9 852.7 748.9 516.4 448.8
KEY FIGURES (Definitions on page 58)
RETURN RATIOS
Average return on capital employed, % 17.2 32.8 52.2 94.5 116.1
Average return on shareholders’ equity, % 15.6 18.7 24.4 27.4 38.8
Eranings per share, after taxes paid, SEK 2.9 2.9 3.68 2.34 3.62
Cash Conversion Rate 90.0 26.0 140.0 65 169
SEK m 2015 2014 2013 2012 2011
MARGINS
Operating margin, EBITDA, % 7.6 9.6 10.0 9.9 10.1
Operating margin, EBIT, % 5.2 6.2 6.9 7.3 8.3
Net margin, % 4.6 6.2 6.8 5.9 9.8
CAPITAL TURNOVER
Capital turnover rate (multiple) 1.8 1.6 1.8 1.7 1.9
FINANCIAL DATA
Equity/assets ratio, % 40.4 39.3 38.3 40.5 39.5
Cash flow from current activities 85.7 22.5 110.5 40.2 104.9
Number of employees 358.0 172.0 149.0 81.0 77.0
Liquid assets (incl. unused credit) 89.8 86.7 123.9 172.6 177.5
Investments (incl. acquisitions 2011,2013) 220.7 51.2 146.7 27.3 40.8
DORO ANNUAL REPORT 2015 fInAnCIAL REPoRTS56

PRESS RELEASES 2015
150130 Doro’s acquisition of Caretech AB
150210 Doro to present its report for the fourth quarter via audio cast and telephone conference
150218 Doro AB (publ) completes acquisition of Caretech AB with non-cash issue
150227 New number of shares in Doro
150306 An array of launches from award-winning Doro at the GSMA Mobile World Congress in Barcelona
150319 Doro – Guidance regarding first quarter and dividend. Outlook for the year is unchanged-
150326 Notice of annual general meeting 2015
150402 Annual Report 2014
150402 Doro to present its report for the fourth quarter via audiocast and telephone conference
150409 Doro to present its report for the first quarter via audio cast and telephone conference
150428 Press release from Doro AB*s Annual General Meeting 2015
150504 Doro enters Romania with Vodafone listings
150618 The operator O2 in Germany will offer Dori
150623 Caretech, Doro’s acquisition in digital alarms, secures numerous Swedish municipality
150818 Doro to present its report for the second quarter via audio cast and telephone conferencre
150821 Doro Q2 2015 report
150921Caretech, Dor’s acquisition in digital social alarms, launches its first large scale private offer, a pilot in 50 UK pharmacies
151009 Doro AB’s Nomination Committee for the 2016 Annual General Meeting
151022 Doro to present its report for the third quarter via audio cast and telephone conference
151104 High sales growth continues with strengthened order book
DORO ANNUAL REPORT 2015 fInAnCIAL REPoRTS57

DEFINITIONS
AVERAGE NUMBER OF SHARESNumber of shares at the end of the month divided by the number of months.
AVERAGE NUMBER OF SHARES, DILUTEDAverage number of shares adjusted for the dilution effect from warrants is calculated as the difference between the assumed number of shares issued at the redemption price and the assumed number of shares issued at the average share price for the period.
CAPITAL EMPLOYEDTotal assets less non-interest-bearing liabilities.
CAPITAL TURNOVER RATENet sales for the year divided by the average balance sheet total.
CASH AND CASH EQUIVALENTSCash position plus granted unutilised credits from banks and current investments in interest-bearing certificates.
CASH CONVERSION RATECash flow from operating activities divided by EBIT.
CASH FLOWCash flow from operating activities.
CASH FLOW PER SHARECash flow from operating activities divided by the average number of shares.
EARNINGS PER SHARE AFTER TAXProfit/loss after tax divided by the average number of shares for the period.
EARNINGS PER SHARE AFTER TAX, DILUTEDProfit/loss after financial items divided by the average number of shares for the period, after dilution.
EARNINGS PER SHARE AFTER TAXES PAIDProfit/loss after taxes paid divided by the average number of shares for the period.
EARNINGS PER SHARE AFTER TAXES PAID, DILUTEDProfit/loss after taxes paid divided by the average number of shares for the period, after dilution.
EARNINGS PER SHARE BEFORE TAXProfit/loss before tax divided by the average number of shares for the period.
EARNINGS PER SHARE BEFORE TAX, DILUTEDProfit/loss before tax divided by the average number of shares for the period, after dilution.
EBIT MARGINOperating profit/loss (after depreciation/amortisation) as a percentage of sales for the year.
EBITDA MARGINProfit/loss before depreciation/amortisation as a percentage of sales for the year.
EQUITY PER SHAREShareholders’ equity at the end of the period divided by the number of shares at the end of the period.
EQUITY PER SHARE, DILUTEDShareholders’ equity at the end of the period divided by the number of shares at the end of the period, after dilution.
EQUITY/ASSETS RATIOShareholders’ equity as a percentage of the balance sheet total.
INTEREST COVERAGE RATIOProfit/loss after net financial items plus interest expenses divided by financial expenses.
INVESTMENTSNet investments including acquisitions.
MARKET CAPITALISATION, SEK MShare price at the end of the period multiplied by the number of shares at the end of the period.
NET DEBT/EQUITY RATIOInterest-bearing liabilities minus cash position as a percentage of shareholders’ equity.
NET DEBT/NET CASHCash and bank balances less interest-bearing liabilities.
NET MARGINProfit/loss after financial items as a percentage of sales for the year.
NUMBER OF EMPLOYEESAverage number of employees.
NUMBER OF SHARES AT END OF PERIODNumber of shares at the close of the period.
NUMBER OF SHARES AT END OF PERIOD, DILUTEDThe number of shares at the end of the period adjusted for the dilution effect from warrants is calculated as the difference between the assumed number of shares issued at the redemption price and the assumed number of shares issued at the average share price at the end of the period.
REPORTED EQUITY PER SHAREShareholders’ equity divided by the number of shares at year-end.
RETURN ON AVERAGE CAPITAL EMPLOYEDOperating profit/loss divided by the quarterly average capital employed excluding cash and bank balances.
RETURN ON AVERAGE SHAREHOLDERS’ EQUITYProfit/loss after financial items and tax divided by average shareholders’ equity.
SHARE PRICE AT PERIOD END, SEKClosing price at the end of the period.
DORO ANNUAL REPORT 2015 fInAnCIAL REPoRTS58


![[Gokigenyou] Doro to 73](https://static.fdocuments.net/doc/165x107/577ccf241a28ab9e788efd10/gokigenyou-doro-to-73.jpg)