Differences in susceptibility of Arabidopsis ecotypes to crown gall ...
Age-Related Differences in Susceptibility to Carcinogenesis II. Approaches for Application and Uncertainty Analyses for Individual Genetically Acting Carcinogens
Dale Hattis,1 Robert Goble,1 Margaret Chu2
1George Perkins Marsh Institute, Clark University, 950 Main Street, Worcester, Massachusetts 01610
2Office of Research and Development, U.S. Environmental Protection Agency, Washington, D.C. 20460.
1
Running Title: Age-Related Differences in Carcinogenesis
Key words: Susceptibility, Carcinogenesis, Fetal, Mutagenic Chemicals, Risk Assessment, Uncertainties, Acrylamide
Acknowledgment: This research is supported by a cooperative agreement with the US Environmental Protection Agency--CR 829746-01. However, the conclusions are those of the authors and do not necessarily reflect the views of the US Environmental Protection Agency.
Abbreviations:
UCL—Upper Confidence LimitLCL— Lower Confidence Limit
2

Section headers:
Abstract
Introduction
Uncertainties in Central Estimates of Life-Stage-Specific Sensitivity to Carcinogenesis for Mutagenic Agents
Departures from Life-Stage-Specific Model Fits for Individual Chemicals
Mapping Rodent Life Stages to Human Periods—Implications for Uncertainties in Risk Projections for Expected Risks for Lifetime Exposures to Genetically Acting Carcinogens
Monte Carlo Simulation Modeling of the Uncertainties in Full-Life Exposures to a Generic Mutagenic Carcinogen
Brief Discussion of Further Needs for Risk and Uncertainty Modeling to Estimate Full Life Mutagenic Cancer Risks for an Illustrative Example Chemical: Acrylamide
Conclusions
References
3

Abstract
An earlier paper (Hattis et al., 2003) developed a quantitative likelihood-based statistical analysis of the differences in apparent sensitivity of rodents to mutagenic carcinogens across three life stages (fetal, birth-weaning, and weaning-60 days) relative to exposures in adult life. This report assesses three types of uncertainties that arise in the application of the earlier results to human quantitative risk projections for full life exposures to a generic individual mutagenic carcinogen. These are
(1) uncertainty in the central estimates of the life-stage-specific sensitivity factors estimated earlier,
(2) uncertainty from chemical-to-chemical differences in life-stage-specific sensitivities for carcinogenesis
(3) uncertainty in the mapping of rodent life stages to human ages/exposure periods
The results of this analysis indicate that the third of these sources of uncertainty is quantitatively the most important. The interspecies time mapping is accomplished by (1) assuming that the developmental ages in mice, rats, and humans are equivalent at the reported times of sexual maturity for each gender, based on literature data, and (2) mapping other times in each species in proportion to the growth in body weight relative to body weights at sexual maturity. As it happens, this approach leads to differences of several fold in central estimates of the duration of the human equivalent of the “birth-weaning” period in rodents—the period of maximum sensitivity for carcinogenesis by the mutagenic agents in the available data base. The potential implications of this are explored with the aid of lognormal distributions for the human equivalent time periods estimated from the rat-mouse differences. The distributions are truncated at the upper end so that the human equivalent of the sum of birth-weaning and weaning-60 day rodent periods is not allowed to exceed 16 years in human males or 15 years in human females—the approximate average ages when vertical growth ceases, based on data from the third National Health And Nutrition Survey.
The combined effect of the three types of uncertainties listed above is estimated with the aid of Monte Carlo analyses. Final results are based on averages of three sets of 5000 Monte Carlo trials each. Overall, the population arithmetic mean risk from lifetime exposures to a generic mutagenic carcinogen is estimated to be about 3.5 fold larger than for exposure only during the “adult” (60+ day equivalent for rodents) period, with 5%-95% confidence limits of 1.7 –7.4 fold.
A final portion of the paper notes some additional issues that need to be represented in an uncertainty analysis for a model example chemical with an apparent mutagenic mode of action—acrylamide. These are (1) differential exposure of children of various life stages per body weight3/4 relative to adults (2) a multiplicity of animal bioassays available for human risk projections, (3) adjustments for the inclusion of an appreciable portion of the “weaning-60 day” period in the existing acrylamide bioassays, in contrast to the assumption in our analysis that testing starts in full adulthood at about 60 days of age in rodents, (4) integration of likelihood-based uncertainties in estimated dose response slopes from the bioassay data into the overall uncertainty analysis, (5) incorporation of estimates of delivered dose, across species and life
4

stages, preferably with the aid of physiologically-based pharmacokinetic models, along with pharmacodynamic uncertainties in interspecies projections. Incorporation of all of these considerations into an integrated analysis of cancer risks for full lifetime exposure to acrylamide awaits further work.
5

Introduction
Both the 1996 Safe Drinking Water Act (SDWA) Amendments and the 1996 Food Quality Protection Act (FQPA) direct EPA to conduct studies to identify and characterize groups that may be at greater risk than the general population from exposures to contaminants. EPA is required to use a risk-based standard-setting process and sound science in fulfilling the requirements of the Act. Specifically these laws mandate the use of a default additional 10-fold safety factor (10X) for protection of children from non-cancer effects unless specific data are available to indicate that this extra protection is not needed.
As part of its revision of cancer risk assessment guidelines, the U. S. Environmental Protection Agency has assembled and analyzed animal cancer bioassay data for exposures to mutagenic and putatively non-mutagenic chemicals over different periods of life. A previous paper (Hattis et al., 2003, submitted) offered an improved analysis of the available bioassay data, using likelihood methods to avoid excluding cases where no tumors were observed in either adult or other groups and providing for quantitative estimation of confidence limits for the data as a whole, and selectged subsets of the data. This current paper is a follow-up to that earlier work showing how the previous results might be applied to distributional risk analyses of specific carcinogens thought to act by a mutagenic mode of action.
Doing this requires analyses of three particular sources of uncertainty:
uncertainty in the central estimates of the life-stage-specific sensitivity factors estimated earlier,
uncertainty from chemical-to-chemical differences in life-stage-specific sensitivities for carcinogenesis, and
uncertainty in the mapping of rodent life stages to human ages/exposure periods.
The implications of these three component uncertainties are assessed in a Monte Carlo simulation. The underlying distributional input data, and the Excel Monte Carlo simulation model will be made available via our website: http://www2.clarku.edu/faculty/dhattis.
Uncertainties in Central Estimates of Life-Stage-Specific Sensitivity to Carcinogenesis for Mutagenic Agents
Table 1 and Figures 1-2 show the results of our prior analyses of the overall central tendency differences between exposures during various life stages and similar exposure (per unit body weight3/4 or per unit concentration in external air or water or food) per day during adulthood (over 60 days of age in rodents). There are appreciable differences between the estimated life-stage specific increments in relative risk for the two sexes; therefore all the analyses in this paper are done separately for males and females.
6

Figures 1 and 2 show lognormal probability plots (Hattis and Burmaster, 1994) of the statistical uncertainty distributions for the life stage/adult sensitivity ratios for the male and female combined discrete and continuous dosing data for mutagenic carcinogens. In this type of plot, correspondence of the points to the fitted line is an indicator of the fit of a lognormal distribution to the statistical uncertainties in central estimate life stage/adult sensitivity ratios. (The Z-Score that makes up the X-axis is the number of standard errors above or below the median of the normal distribution log10 transformed values). It can be seen in Figures 1-2 that the uncertainty distributions from the overall fits to the data are well described by fitted lognormal distributions. We stress that these plots are of confidence limits on the aggregate central tendency results for all chemicals in the covered groups.
Departures from Life-Stage-Specific Model Fits From the Central Estimates for Individual Chemicals
A risk assessor or risk manager considering the risks of exposure to a particular carcinogen faces more uncertainty than the simple statistical confidence limits on the aggregate fit of all the data quantified in the previous section. There is also the chance that the particular chemical under study differs in its relative life-stage-specific/adult sensitivity ratios from other chemicals in the group providing observational data.
To give assessors and managers a preliminary set of estimates of chemical-to-chemical differences, Table 2 shows an analysis of the subset of the life-stage-specific carcinogenesis data where groups of animals received exposure that was confined to a single life-stage (i.e., fetal, birth-weaning, or weaning-60 day periods). Other data points contributing to the fits in Table 1 had exposures that extended across various life stages, were for adults only or were unexposed controls. The bolded results at the bottom of the table are standard deviations of the common logarithms (using a base of 10) of the departures of the chemical-specific observations from the overall model predictions. In the later Monte Carlo simulation the antilog of this factor will be used as the geometric standard deviation of a log normally distributed multiplier for the life-stage specific risks with a geometric mean of 1. It can be seen in Figures 3 and 4 that although the data are sparse, lognormal distributions are generally reasonable descriptions of these data.
Also it can be seen in Table 2, that the very limited data for the fetal life stage indicate greater chemical-to-chemical differences than are present for the birth-weaning and weaning-60 day exposure periods. Observations in the previous paper indicated that there were substantial differences between direct-acting chemicals (nitrosoureas) and chemicals requiring metabolic activation in the extent of elevation of fetal-stage carcinogenesis sensitivity over the sensitivity to exposures during adulthood.
The approach represented here is not the only possible way in which chemical-to-chemical differences might have been analyzed. In some ways a better approach might have been to estimate all of the coefficients and uncertainties shown in Table 1 separately for each chemical and gender. Had that been possible, we could have preserved for the Monte Carlo simulations whatever dependencies there might have been in the data between live-stage specific risk increments for individual chemicals. Unfortunately this would have required estimates of five different parameters per sex per chemical per tumor site (the background rate of tumors, the tumor risk for adult-only exposure, and the relative multiplicative increment of tumor risk for
7

each of the three life stages). After attempting this for a few chemicals we concluded that few if any of the chemicals and tumor sites for which we had information had rich enough data sets to support robust estimation of the required five independent parameters.
As an alternative, to check for dependencies we did simple pair wise correlation analyses of the data in Table 2 for different life stages. Of the six possible pair wise correlations, we found only one that was marginally statistically significant at P < .05—a finding that could easily be the result of chance fluctuations and multiple comparisons. We therefore elected not to incorporate this possible dependency into our Monte Carlo simulation analysis of uncertainties in overall life stage specific risks.
Mapping Rodent Life Stages to Human Periods—Implications for Uncertainties in Projections of Expected Risks for Lifetime Exposures to Genetically Acting Carcinogens
An EPA committee (Brennan et al., 2003) has previously defined a series of human age groups based on behavioral and physiological milestones likely to be predictive of changes in exposure rates:
Age Groups < 1 Yeara Age Groups ≥ 1 Year
Birth to < 1 month 1 to < 2 years
1 to < 3 months 2 to <3 years
3 to < 6 months 3 to <6 years
6 to < 12 months 6 to < 11 years
11 to <16 years
16 to <18 years
18 to <21 Years (to be considered on a case-by case basis
aFor purposes of evaluating exposure or potential dose but not internal dose, it may be acceptable to combine some of these groups (e.g., the first three groups could be combined to encompass “birth to <6 months)”.
Unfortunately it is not clear how these proposed divisions relate to the fetal, birth-weaning, and weaning-60 day periods used in our previous analysis of excess risks from rodent early life exposures to mutagenic carcinogens. Ideally, a theory for interspecies mapping of differences in the timing of enhanced susceptibility for carcinogenesis should be based on an understanding of the carcinogenic process, and how it is affected by age.
Considerable past work has emphasized the potential for age-related differences in long term risks from carcinogenic exposures that could result from early- vs late-life exposure to
8

carcinogens that tend to cause mutations at a single stage that is either early or late in the multistage molecular pathological sequence of genetic changes (Whittemore, 1977; Day and Brown, 1980; Brown and Hoel, 1986). In general carcinogenic risks will tend to be greater for early-life exposure to a carcinogen that causes relevant early-stage transitions, but will tend to be greater for late-life exposure to a carcinogen that causes relevant late-stage transitions. (For example Figure 5 shows the effects of age-at-exposure on absolute excess risks over a 10% lifetime background cancer for classical 5-stage Armitage Doll models in which different stage transitions are enhanced by a carcinogenic exposure.)
Recent analyses of atomic bomb survivor data have tended to deemphasize this type of mechanistic consideration. Analyses by Pierce and Mendelsohn (1999) suggest that those data are most compatible with a model in which radiation enhances all stages of classical Armitage-Doll processes (Model III in Figure 5). If this is correct, although excess relative risks are much greater for early life exposures in the first decades after exposure eventual lifetime absolute risks per dose (the types of estimates made by EPA in its typical slope factor assessments) are expected to be much less influenced by age at exposure. The most recent empirical excess absolute risk descriptions from the atomic bomb survivor data (Preston et al., 2003) appear to project lifetime absolute risks that are only about twice as large for exposure before age 15 than for exposure between age 15 and 60. It is not clear, however, that these data have been analyzed for very fine breakdowns of early-life human exposures (i.e. finer than ten year age periods, such as 0-9 years). 90% of the people in the atomic bomb survivor group who were exposed as 0-9 year olds are still alive, so it is likely that much more extensive examination of the eventual cancer mortality experience of the youngest exposed people will be possible in the next few decades.
One plausible factor that may be contributing to life-stage specific differences in risks of carcinogenic transformation per unit dose is a difference in cell replication rates for relevant stem cells. During early life stages, it is likely that these cells must reproduce more quickly in order to support the additional cells at all stages of differentiation that are required to make up the growing organism. Because of more rapid reproduction of such stem cells, there is likely to be less time to accomplish DNA repair before copying and the fixation of newly generated DNA lesions into permanent point mutations and larger chromosomal changes. Therefore it is natural to attempt to make some estimates of equivalent times in different species that are related to some measures of growth in those species.
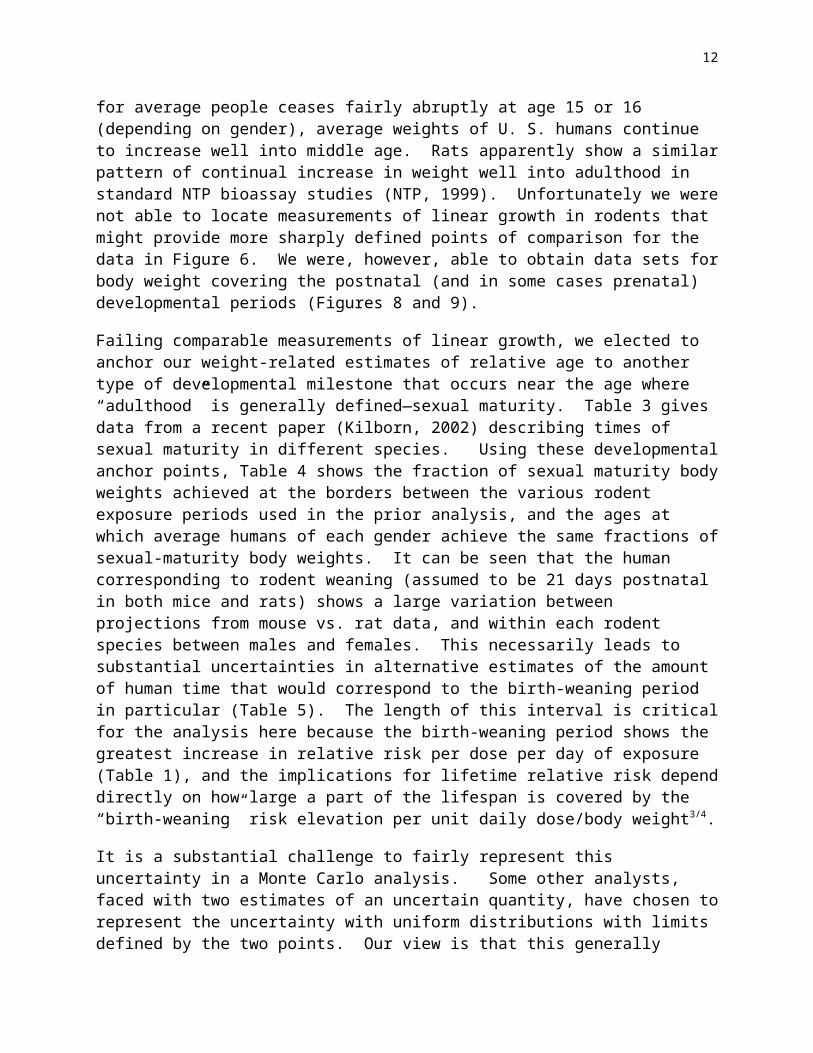
All measures of growth, of course, are not equally likely to be accurate reflections of the kind of stem cell replication that is likely to lead to increases in vulnerability to carcinogenesis. Figures 6 and 7 contrast two measures of growth—in body weight vs. height—that are available for a large representative sample of U.S. humans (from the Third National Health And Nutrition Survey—USDHHS, 1996). It can be seen that while growth in height for average people ceases fairly abruptly at age 15 or 16 (depending on gender), average weights of U. S. humans continue to increase well into middle age. Rats apparently show a similar pattern of continual increase in weight well into adulthood in standard NTP bioassay studies (NTP, 1999). Unfortunately we were not able to locate measurements of linear growth in rodents that might provide more sharply defined points of comparison for the data in Figure 6. We were, however, able to obtain data sets for body weight covering the postnatal (and in some cases prenatal) developmental periods (Figures 8 and 9).
9
Failing comparable measurements of linear growth, we elected to anchor our weight-related estimates of relative age to another type of developmental milestone that occurs near the age where “adulthood” is generally defined—sexual maturity. Table 3 gives data from a recent paper (Kilborn, 2002) describing times of sexual maturity in different species. Using these developmental anchor points, Table 4 shows the fraction of sexual maturity body weights achieved at the borders between the various rodent exposure periods used in the prior analysis, and the ages at which average humans of each gender achieve the same fractions of sexual-maturity body weights. It can be seen that the human corresponding to rodent weaning (assumed to be 21 days postnatal in both mice and rats) shows a large variation between projections from mouse vs. rat data, and within each rodent species between males and females. This necessarily leads to substantial uncertainties in alternative estimates of the amount of human time that would correspond to the birth-weaning period in particular (Table 5). The length of this interval is critical for the analysis here because the birth-weaning period shows the greatest increase in relative risk per dose per day of exposure (Table 1), and the implications for lifetime relative risk depend directly on how large a part of the lifespan is covered by the “birth-weaning” risk elevation per unit daily dose/body weight3/4.
It is a substantial challenge to fairly represent this uncertainty in a Monte Carlo analysis. Some other analysts, faced with two estimates of an uncertain quantity, have chosen to represent the uncertainty with uniform distributions with limits defined by the two points. Our view is that this generally understates the associated uncertainty because there can be no assurance that the two available estimates happen to represent the absolute lowest and highest possible values for the uncertain parameter. We believe that sharp limits on uncertainty distributions should be set only where there is good reason to believe that values outside the limits are impossible (Hattis and Burmaster, 1994). For the present case, we find it hard to believe that the human equivalent of the total period from birth through 60 days in rodents could be more than about 15 years in females or 16 years in males—corresponding to the average cessation of vertical growth seen in the NHANES III data (Figure 6). We therefore chose to define lognormal uncertainty distributions as shown in Table 5 for human equivalents of the various rodent exposure periods, subject only to the limitation that within any Monte Carlo trial, the total birth-weaning + weaning-60 day equivalents could not exceed these gender-dependent limits. In cases where these limits were exceeded on individual trials, both the component periods were reduced proportionately to values that would add up to the prescribed limits. This introduced a negative dependency between possible values for the birth-weaning and weaning-60 day periods.
Monte Carlo Simulation Modeling of the Uncertainties in Full-Life Exposures to a Generic Mutagenic Carcinogen
Using the Microsoft Excel rand() and normsinv() commands, each simulation trial drew random values for a particular gender for
The central estimate of the risk/dose multiplier for each of the three periods relative to adults (See Figures 1 and 2 for lognormal parameters),
The chemical-to-chemical relative risk multiplier [geometric mean of 1 and log(geometric standard deviations given as the bolded values in Table 2], and
10

The length of the human equivalents of the three periods, subject to the 15 and 16 year limitations described above.
The period-specific increments to lifetime risk (relative to comparable adult period exposure, defined as 1) were then calculated as the product of these three terms normalized to the calculated duration of the adult period for that trial. (The length of the adult period varied from trial to trial as the difference between 70 years and the sum of the human-equivalent birth-weaning and weaning-60 day periods.) The model spreadsheet available on the website cited above should be consulted for further methodological details.
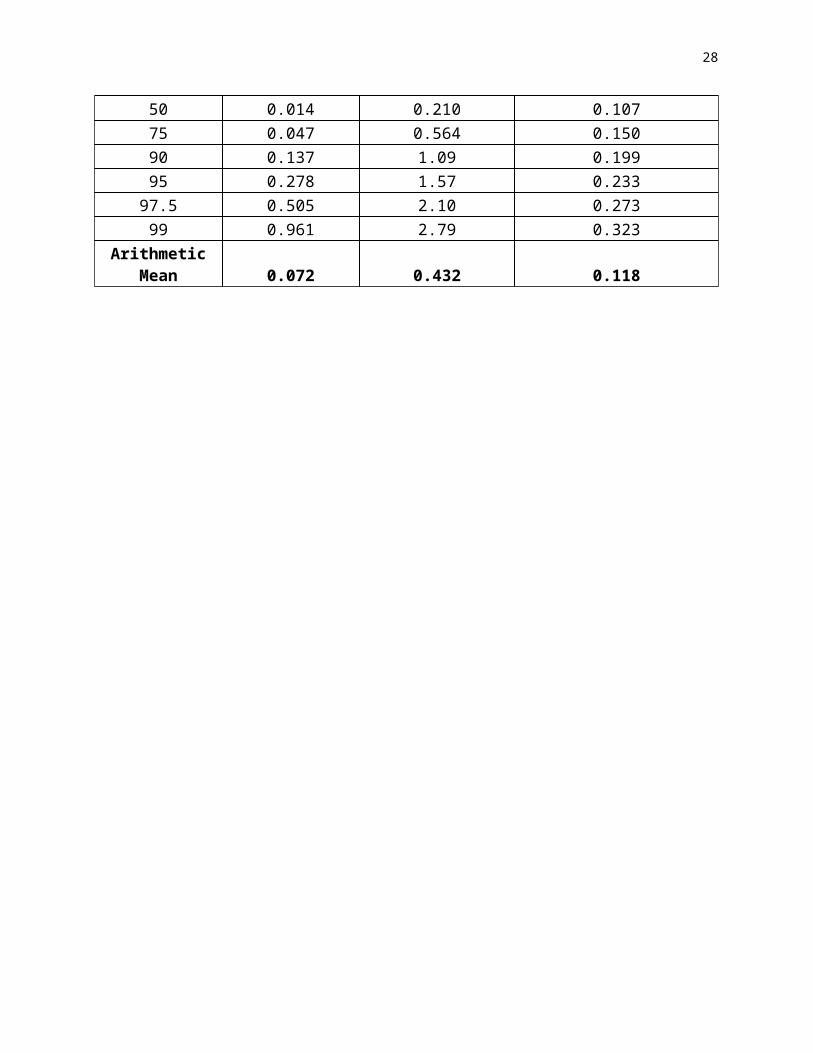
The uncertainty distributions for the gender- and life-stage specific contributions to expected lifetime risk are given in Table 6. In each case the numbers represent the increment to lifetime relative risk/dose where the risk from treatment for the full adult period is defined as 1. For example the 50th percentile of the uncertainty distribution under the “male fetal” column is 0.173. This means that treatment at the similar dose rate to the mother through the fetal period (rodent gestation day 12 equivalent through birth) is expected to produce about 17% of the lifetime risk of exposure to the generic mutagenic carcinogen through the entire period of adulthood.
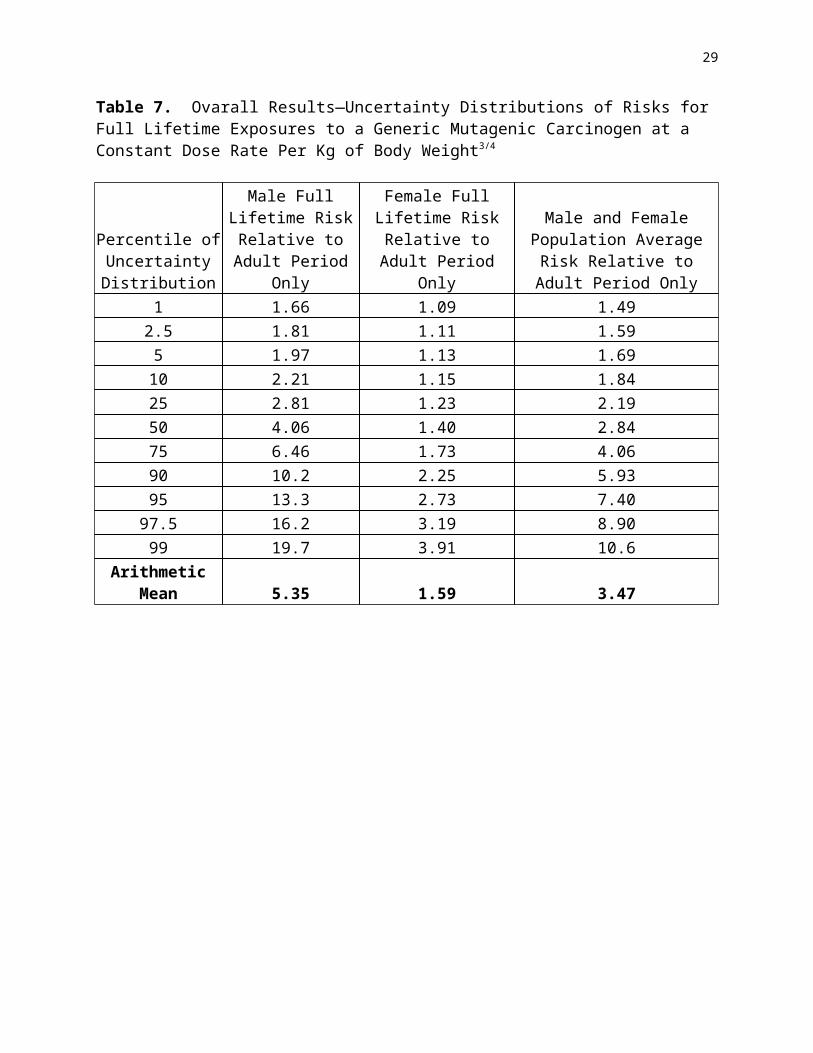
The potential aggregate public health significance of these results can be seen in the “bottom line” distributions provided in Table 7. The final column, aggregating results for males and females, suggests that full lifetime risks for full life constant exposure per kg body weight3/4 to a generic mutagenic carcinogen are expected to be about 3.5 times larger than would be estimated for similar exposure only through the full period of adulthood. There is appreciable uncertainty in this estimate (with 5%-95% confidence limits corresponding to a range from a 70% increment to over a 7 fold increment from adult-only exposure), but it gives analysts and decision-makers a starting point for reasoning about the potential risks from early life exposures to particular agents.
Brief Discussion of Further Needs for Risk and Uncertainty Modeling to Estimate Full Life Mutagenic Cancer Risks for an Illustrative Example Chemical: Acrylamide
The case of acrylamide offers a useful example to place the results of the analysis above in the context of a current visible issue. Acrylamide has recently been found to be a frequent dietary constituent as a result of heat-related degradation of asparagines in the presence of common carbohydrates (Friedman, 2003; European Commission, 2002). How would the analysis above need to be further adapted for application to this case?
Currently there are two animal bioassays (both in rats) that have been used for projections of human cancer risks (Johnson, et al., 1986; Friedman et al., 1995). Both yielded positive results for multiple tumor sites in both genders, but not all sites that were statistically significantly elevated in the first study also showed independent statistically significant findings in the second. One aspect of these bioassays that immediately requires adaptation of the assumptions in the prior analysis is that they did not start as late as is presumed in the model generic analysis above. The Friedman (1995) bioassay started when the rats were only 25 days of age, shortly after weaning, and the other seems to have started when the rats were about 5-6 weeks old (Johnson, et al, 1986). To accommodate this, only a portion of the “weaning-60 day” period could be
11
considered outside the purview of the existing bioassays, and the ratios for relative elevation of risks for the other periods would have to be adjusted (in most cases downward) accordingly.
The extensive pharmacokinetic information available across species for acrylamide and its long-lived active metabolite glycidamide also requires adaptations (Calleman, 1996; Kirman et al., 2003). It is possible utilizing existing models and existing and forthcoming hemoglobin adduct measurements to assess both human and rat AUCs for acrylamide and glycidamide. Such AUCs, particularly for glycidamide are good candidates for equivalent dosimeters that should allow better estimation of risks across species than simple use of external dose per body weight3/4. Given the prospective use of soundly based estimates of AUCs, how should existing procedures for estimating interspecies projection uncertainties be adapted? Also in the pharmacokinetic area, there are opportunities to make life-stage-specific pharmacokinetic models given developmental information on the changing activity of P4502E1, the primary enzyme that is apparently involved in metabolic activation, and similar data, if available, on the rates of relevant catalyzed and uncatalyzed glutathione-based detoxification reactions. Finally, likelihood distributions for the linear term in multistage model fits have been prepared McDonald and colleagues at Cal-EPA (McDonald et al., 2003, personal communication). These distributional estimates of potency in rats can readily be incorporated into the kind of age-related distributional analysis illustrated in earlier parts of this paper.
Conclusions
In conclusion, improved life-stage specific analyses are possible based on current information. These involve appreciable uncertainties, particularly in the mapping of rodent exposure periods to human equivalents. However current understanding can at least provide decision-makers and the public with preliminary estimates of the potential importance of exposures at early life stages in the overall context of cancer risks from genetically active agents. The suggestion of the current analysis is that early-life exposure could make important contributions to full-life cancer risks.
However, we offer the caveat that due to the multistage and multifactorial nature of cancer development, these analyses should be grounded on the mode of action of the specific agent or classes of agents with putatively similar modes of action.
12

References
Brennan T, Dawson J, Firestone M, Hammerstrom K, Hubal E, Kennedy P, Leighton T, Moya J, Pollard K, Zartarian V. 2003. Guidance on Selecting the Appropriate Age Groups for Assessing Childhood Exposures to Environmental Contaminants, Report of a Risk Assessment Forum Technical Panel, EPA/630/P-03/003A, February 2003 External Review Draft.
Brown KG, Hoel, DG. 1986. Statistical modeling of animal bioassay data with variable dosing regimens: Example—vinyl chloride. Risk Analysis 6: 155-166.
Calleman CJ. 1996. The metabolism and pharmacokinetics of acrylamide: implications for mechanisms of toxicity and human risk estimation. Drug Metab Rev 28: 527-590.
Day NE, Brown CC. 1980. Multistage models and primary prevention of cancer. Journal of the National Cancer Institute 64: 977-989.
European_Commision. 2002. Opinion of the scientific committee on food on new findings regarding the presence of acrylamide in food (http://europa.eu.int/comm/food/fs/sc/scf/out131_en.pdf). Brussels, Belgium.
Friedman, M. 2003. Chemistry, Biochemistry, and Safety of Acrylamide. A Review. J Agric Food Chem 51: 4504-26.
Friedman, M. A., Dulak, L. H. and Stedham, M. A. 1995. A lifetime oncogenicity study in rats with acrylamide. Fundam Appl Toxicol 27: 95-105.
Gentry PR, Haber L, Covington T, Zhao Q, Nance P, Clewell HJ III. 2003. Physiological parameters for neonatal mice and neonatal Sprague-Dawley rats: Data for PBPK modeling. Final Report from EPA Purcahse Request Number 2C-R131-NTNA, February 24, 2003.
Goedbloed JF. 1972. The embryonic and postnatal growth of rat and mouse. I. The embryonic and early postnatal growth of the whole embryo. A model with exponential growth and sudden changes in growth rate. Acta Anat. 82: 305-336.
Hattis D, Burmaster DE. 1994. Assessment of variability and uncertainty distributions for practical risk analyses. Risk Analysis 14: 713-730.
Hattis D, Goble R, Russ A. Chu M, Ericson J. 2003. Age-related differences in susceptibility to carcinogenesis—a quantitative analysis of empirical animal bioassay data,” Report to the U. S. Environmental Protection Agency under Cooperative Grant Agreement No. CR 829746-01. Submitted to Environmental Health Perspectives.
Johnson KA, Gorzinski SJ, Bodner KM, Campbell RA, Wolf CH, Friedman MA, Mast RW. 1986. Chronic toxicity and oncogenicity study on acrylamide incorporated in the drinking water of Fischer 344 rats. Toxicol Appl Pharmacol 85: 154-68.
13

Kilborn SH, Trudel G, Unthoff H. 2002. Review of growth plate closure compared with age at sexual maturity and lifespan in laboratory animals. Contemporary topics in laboratory animal sciences 41(5): 21-26.
Kirman CR. Gargas ML, Deskin R, Tonner-Navarro L, Andersen ME. 2003. A physiologically based pharmacokinetic model for acrylamide and its metabolite, glycidamide, in the rat. J Toxicol Environ Health A 66: 253-74.
McDonald T, Zeise L, Sandy M. 2003. Personal communication.
National Toxicology Program (NTP). (1999) Toxicology and Carcinogenesis Studies of Pentachhlorophenol (CAS No. 87-86-5) in F344/N Rats (Feed Studies). NTP TR-483.
Nomura T. 1976. Comparison of tumour susceptibility among various organs of foetal, young and adult ICR/Jcl mice. Br J Cancer 33: 521-33.
Pierce DA, Mendelsohn ML. 1999. A model for radiation-related cancer suggested by the atomic bomb survivor data. Radiation Research 152: 642-654.
Preston DL, Shimizo Y, Pierce DA, Syama A, Mabuchi K. 2003. Studies of mortality of atomic bomb survivors. Report 13: Solid cancer and noncancer disease mortality: 1950-1997. Radiation Research 160: 381-407.
Potter EL, Craig JM. 1975. Pathology of the Fetus and the Infant (3rd edition) Year Book Medical Publishers, Inc. Chicago.
Robie, D, DiNovi M. 2003 Powerpoint presentation by Dona robie and Michael DiNovi, Office of Food Addditive Safety, U. S. food and Drug Administration, Feb. 24, available on FDA web site
Sunderman FW, Boerner F. 1949. Normal Values in Clinical Medicine, W. B. Saunders Company, Philadelphia, quoted in Hall, J. G., Foster-Iskenius, U. G., and Allanson, J. E. Handbook of Normal Physical Measurements, Oxford University Press, New York, 1989, reprinted 1995.
U.S. Department of Health and Human Services (DHHS). National Center for Health Statistics. Third National Health and Nutrition Examination Survey, 1988-1994, NHANES III Public Use Data File Documentation Number 76200. Hyattsville, MD.: Centers for Disease Control and Prevention, 1996. Available from National Technical Information Service (NTIS), Springfield, VA.
Whittemore A. 1977. The age distribution of human cancer for carcinogenic exposures of varying intensity. American Journal of Epidemiology 106: 418-432.
14

Table 1. Comparative Results for Male vs Female Animals for Mutagenic Chemicals—Analysis of Combined Data from Continuous and Discrete Dosing Experiments
Male Animals (9 compounds, 153 tumor incidence observations):
Male Mutagen Discrete + Continuous Dosing Data
Maximum likelihood estimate of potency
relative to adults 95% LCL 95% UCLArithmetic
Mean
Fetal Period (8 days beginning GD 12) 25 15.6 42 27
Birth-Weaning (21 days) 57 38 89.8 59
Weaning-60 days (39 days) 5.0 3.1 8.6 5.3
Female Animals (9 compounds, 153 tumor incidence observations):
Male Mutagen Discrete + Continuous Dosing Data
Maximum likelihood estimate of potency
relative to adults 95% LCL 95% UCLArithmetic
Mean
Fetal Period (8 days beginning GD 12) 1.77 1.05 2.9 1.83
Birth-Weaning (21 days) 4.4 3.3 6.0 4.5
Weaning-60 days (39 days) 0.82 0.50 1.29 0.85
15

Table 2. Log(Geometric Mean) Departures of Age Related Changes in Susceptibility to Carcinogenesis for Individual Mutagenic Carcinogens from Model “Predictions”—Combining All Available Cancer Sites for Each Agent
Data for Observations in Male Animals:
Chemical
Male Fetal Period log(Obs/Pred Cancer Transformations/ Animal Relative to Adults)
Male Birth-Weaning Period log(Obs/Pred Cancer Transformations /Animal Relative to Adults)
Male Weaning-60d Period log(Obs/Pred Cancer Transformations/ Animal Relative to Adults)
benzidine 0.004 0.163 -0.367Benzo(a)pyrene 0.017 -0.045DEN Diethylnitrosamine -0.961 -0.045 0.132DMBA Dimethylbenz(a)anthracene -0.108 -0.166ENU Ethylnitrosourea 0.103 -0.135 0.423N-Nitroso-N-Methylurea (NMU) -0.257 0.142safrole -0.486 0.084 -0.236urethane 0.008 -0.023
Standard Deviation 0.490 0.132 0.249
Data for Observations in Female Animals:
Chemical
Male Fetal Period log(Obs/Pred Cancer Transformations/ Animal Relative to Adults)
Male Birth-Weaning Period log(Obs/Pred Cancer Transformations /Animal Relative to Adults)
Male Weaning-60d Period log(Obs/Pred Cancer Transformations/ Animal Relative to Adults)
benzidine -0.104 -0.111Benzo(a)pyrene 0.037 0.098DEN Diethylnitrosamine -1.086 -0.025 -0.172DMBA Dimethylbenz(a)anthracene -0.087 -0.038ENU Ethylnitrosourea 0.416 0.006 -0.142N-Nitroso-N-Methylurea (NMU) -0.184 0.038safrole -0.720urethane 0.183
Standard Deviation 0.763 0.269 0.115
16

Table 3. Species Differences in Times of Sexual Maturity
Species (and Time Units) Male FemaleMouse (months) 1.5 1.0Rat (months) 1.8-2.1 1.8-2.1
Human (Years) 11.5 10.5
Source: Kilborn et al. (2002) Contemp Top Lab Animal Sci 41(5):21-26.
17

Table 4. Inferences of Corresponding Human Ages from Weight-Based Comparisons Relative to the Times of Sexual Maturity
Male Mouse Time/Event
Fraction of Male Mouse Weight at Sexual Maturity
Source of Human Weight Data
Corresponding Human Ages
Units of Human Age
Begin Fetal Dosing (GD12) 6.4E-04 Potter and Craig (1975) 93
Days gestation
Birth (GD20) 0.048 Potter and Craig (1975) 35Weeks gestation
Weaning (PND21) 0.354 NHANES III 3.16Years postnatal
60 day postnatal = "adult" 1.163 NHANES III 12.8
Years postnatal
Female Mouse Time/Event
Fraction of Female Mouse
Weight at Sexual
MaturitySource of Human Weight
DataCorresponding Human Ages
Units of Human Age
Begin Fetal Dosing (GD12) 1.8E-03 Potter and Craig (1975) 112
Days gestation
Birth (GD20) 0.092 Sunderman and Boerner, 1949 14Days postnatal
Weaning (PND21) 0.677 NHANES III 7.40Years postnatal
60 day postnatal = "adult" 1.435 NHANES III 15.1
Years postnatal
18

Table 4, Continued
Male Rat Time/Event
Fraction of Male Rat Weight at
Sexual MaturitySource of Human
Weight DataCorresponding Human Ages
Units of Human Age
Begin Fetal Dosing (GD12) 6.3E-05 Potter and Craig (1975) 66
Days gestation
Birth (GD22) 0.023 Potter and Craig (1975) 28Weeks gestation
Weaning (PND21) 0.195 NHANES III 0.44Years postnatal
60 day postnatal = "adult" 1.035 NHANES III 11.7
Years postnatal
Female Rat Time/Event
Fraction of Female Rat
Weight at Sexual Maturity
Source of Human Weight Data
Corresponding Human Ages
Units of Human Age
Begin Fetal Dosing (GD12) 6.3E-05 Potter and Craig (1975) 66
Days gestation
Birth (GD22) 0.029 Potter and Craig (1975) 30Weeks gestation
Weaning (PND21) 0.250 NHANES III 0.90Years postnatal
60 day postnatal = "adult" 1.025 NHANES III 10.6
Years postnatal
19

Table 5. Estimated Lengths of Various Life Stages in Humans Inferred from the Ages of Sexual Maturity in Mice, Rats, and Humans, and Patterns of Growth of Body Weight for Rodents Through 60 Days of Age, and for Humans Through Age 16
Rodent Life Stage Equivalent and Gender
Mouse-Based Estimate (days)
Rat-Based Estimate (days)
Geometric Mean
Geometric Standard Deviation
Gestation Day 12 –Birth (Fetal), Males 150 134 142 1.105Birth-Weaning, Males 1184 235 527 3.945Weaning-60 Days, Males 3514 4128 3809 1.146Gestation Day 12 –Birth (Fetal), Females 175 142 157 1.195Birth-Weaning, Females 2689 392 1027 5.115Weaning-60 Days, Females 2827 3560 3172 1.216
20

Table 6. Detailed Results by Life Stage and Gender-- Uncertainty Distributions of Risks for Full Lifetime Exposures to a Generic Mutagenic Carcinogen at a Constant Dose Rate Per Kg of Body Weight3/4 (In each case the numbers represent the increment to lifetime relative risk/dose where the risk from treatment for the full adult period is defined as 1).
Results for MalesPercentile of Uncertainty Distribution
Male Fetal Period Risk Relative to
Adult Period
Male Birth-Weaning Period Risk Relative to
Adult PeriodMale Weaning-60d Period
Risk Relative to Adult Period1 0.011 0.054 0.167
2.5 0.018 0.084 0.2175 0.026 0.135 0.27310 0.039 0.220 0.36525 0.078 0.565 0.56350 0.173 1.44 0.88275 0.392 3.77 1.3890 0.764 7.79 2.0395 1.20 10.7 2.53
97.5 1.72 13.2 3.1899 2.89 17.4 3.91
Arithmetic Mean 0.351 2.92 1.09
Results for FemalesPercentile of Uncertainty Distribution
Female Fetal Period Risk Relative to
Adult Period
Female Birth-Weaning Period Risk Relative to
Adult PeriodFemale Weaning-60d Period Risk Relative to Adult Period
1 0.000 0.004 0.0122.5 0.000 0.007 0.0215 0.001 0.012 0.03410 0.001 0.023 0.04925 0.004 0.069 0.07450 0.014 0.210 0.10775 0.047 0.564 0.15090 0.137 1.09 0.19995 0.278 1.57 0.233
97.5 0.505 2.10 0.27399 0.961 2.79 0.323
Arithmetic Mean 0.072 0.432 0.118
21
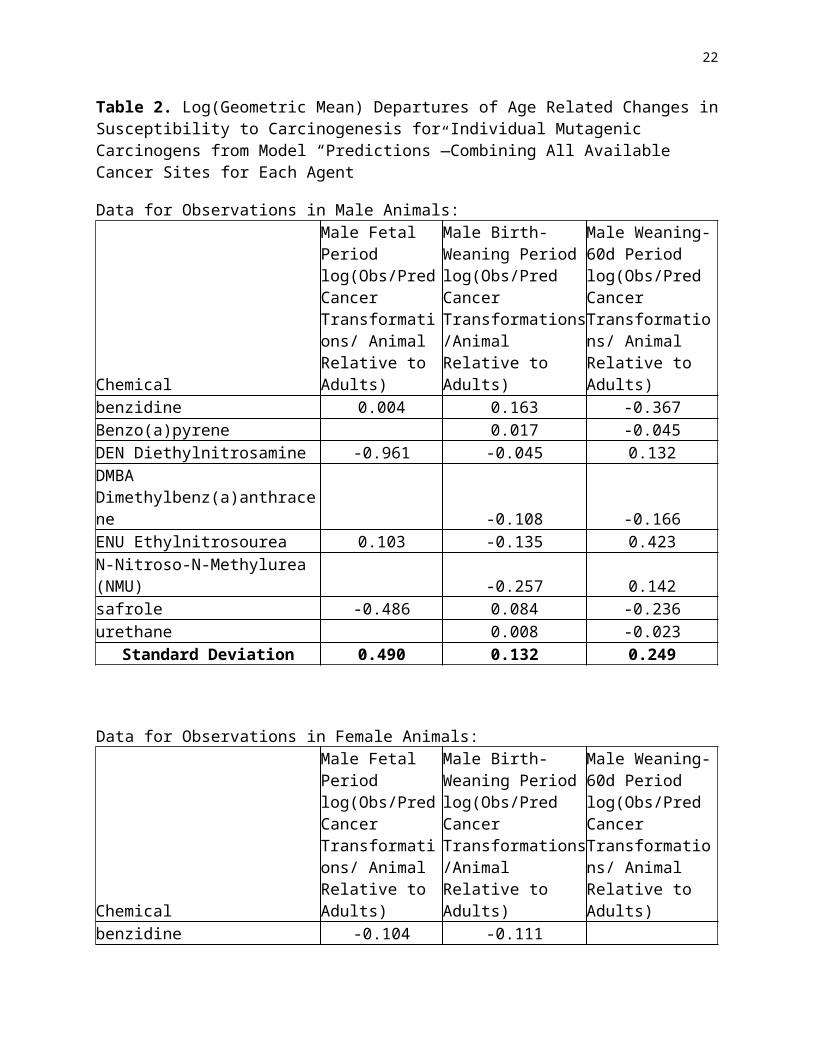
Table 7. Ovarall Results—Uncertainty Distributions of Risks for Full Lifetime Exposures to a Generic Mutagenic Carcinogen at a Constant Dose Rate Per Kg of Body Weight3/4
Percentile of Uncertainty Distribution
Male Full Lifetime Risk Relative to
Adult Period Only
Female Full Lifetime Risk Relative to Adult
Period Only
Male and Female Population Average Risk Relative to
Adult Period Only1 1.66 1.09 1.49
2.5 1.81 1.11 1.595 1.97 1.13 1.6910 2.21 1.15 1.8425 2.81 1.23 2.1950 4.06 1.40 2.8475 6.46 1.73 4.0690 10.2 2.25 5.9395 13.3 2.73 7.40
97.5 16.2 3.19 8.9099 19.7 3.91 10.6
Arithmetic Mean 5.35 1.59 3.47
22

Figure 1. Females—Lognormal Plots of Likelihood-Based Uncertainty Distributions for Cancer Transformations Per Daily Dose for Various Life Stages for Mutagenic Chemicals (Relative to Comparable Exposures of Adults) for Combined Discrete and Continuous Dosing Experiments
Figure 2. Males—Lognormal Plots of Likelihood-Based Uncertainty Distributions for Cancer Transformations Per Daily Dose for Various Life Stages for Mutagenic Chemicals (Relative to Comparable Exposures of Adults) for Combined Discrete and Continuous Dosing Experiments
Figure 3. Males--probability plots of the individual chemical geometric mean ratios of observed/predicted excess cancer transformations over control/dose3/4 for treatment in various life stages relative to adults.
Figure 4. Females--probability plots of the individual chemical geometric mean ratios of observed/predicted excess cancer transformations over control/dose3/4 for treatment in various life stages relative to adults.
Figure 5. Effects of age at exposure on risks over background for classical Armitage-Doll 5-stage multistage models in which the carcinogen enhances different transitions over a background lifetime risk of 10%: I—enhancement of the first stage only; II—enhancement of the fourth stage only; III—equal enhancement of all stages (Pierce and Mendolsohn, 1999); IV--smoking-radon analogy 2/3 enhancement of stage I and 1/3 enhancement of stage 4.
Figure 6. Population-weighted differences in mean height for NHANES III subjects of different ages (2-90 years)
Figure 7. Population- weighted differences in Log(Mean Weight in kg) for NHANES III subjects of different ages (2-90 years)
Figure 8. Post-natal growth of Sprague-Dawley Rats, based on data compiled for EPA (Source,: Gentry et al., 2003)
Figure 9. Post-natal growth of ICR/Jcl mice, based on data of Nomura (1976).
23

210-1-2-0.4
-0.2
0.0
0.2
0.4
0.6
0.8
1.0Fem Mut Log(Birth-Wean/Adult)
Fem Mut Log(Fetal/Adult)
Fem Mut Log(Wean-60d/Adult)
Z-Score
Fem Mut Log(Period/Adult Risk Per Daily Dose/BW^3/4)
y = 0.646 + 0.0785x R^2 = 1.000y = 0.246 + 0.134x R^2 = 1.000
y = - 0.0880 + 0.124x R^2 = 0.999
No difference from adult risk
3X greater than adult risk
95% Lower Confidence Limits
95% Upper Confidence Limits
24

210-1-20.4
0.6
0.8
1.0
1.2
1.4
1.6
1.8
2.0
2.2Male Mut Log(Birth-Wean/Adult)Male Mut Log(Fetal/Adult)Male Mut Log(Wean-60d/Adult)
Z-Score
Male Mut Log(Period/Adult Risk Per Daily Dose/Body Weight^3/4)
y = 1.76 + 0.113x R^2 = 0.999y = 1.41 + 0.132x R^2 = 1.000
y = 0.705 + 0.133x R^2 = 0.999
10x greater than adult risk
30x greater than adult risk
95% Lower Confidence Limits
95% Upper Confidence Limits
25

210-1-2-1.0
-0.8
-0.6
-0.4
-0.2
0.0
0.2
0.4
0.6
0.8
1.0Male Fetal/Adult log(Obs/Pred)Male Birth-Wean log(Obs/Pred)Male Wean-60d log(Obs/Pred)
Z-Score
Male log(Observed/Model Predicted Cancer Sensitivity Relative to Adults)
y = - 0.335 + 0.530x R^2 = 0.929y = - 0.034 + 0.141x R^2 = 0.986y = - 0.017 + 0.264x R^2 = 0.971
26

210-1-2-1.5
-1.0
-0.5
0.0
0.5
1.0Fem Fetal/Adult log(Obs/Pred)Fem Birth-Wean log(Obs/Pred)Fem Wean-60d log(Obs/Pred)
Z-Score
Female log(Observed/Model PredictedCancer Sensitivity Relative to Adults)
y = - 0.258 + 0.864x R^2 = 0.969y = - 0.112 + 0.255x R^2 = 0.781y = -0.043 + 0.124x R^2 = 0.960
27
Absolute excess risk over background
0.00%
2.00%
4.00%
6.00%
8.00%
10.00%
12.00%
0.00% 10.00% 20.00% 30.00% 40.00% 50.00% 60.00% 70.00% 80.00%Age at exposure (%life)
Absolute risk
IIIIIIIV
28
908070605040302010080
100
120
140
160
180
Male Ht (cm)Female Ht (cm)
Age (yrs)
Mean Height (cm)
Age 15
Age 16
29
90807060504030201001.0
1.2
1.4
1.6
1.8
2.0
Log(Male Body Weight kg)Log(Female Body Weight kg)
Age (yrs)
Log(Male Body Weight kg)
30

1008060402000.5
1.0
1.5
2.0
2.5
3.0
3.5
Male Log(g Body Weight)Female Log(g Body Weight)
Age (Days)
Log(g Body Weight)
31

7063564942352821147000.0
0.5
1.0
1.5
2.0
Male Mouse Log(BW g)Female Mouse Log(BW g)
Days Postnatal
Mouse Log(BW g)
Birth
32