Age at marriage and modernisation in sub-saharan...
21
Age at marriage and modernisation in sub-Saharan Africa Michel Garenne 1 Abstract The study reviews levels, trends and factors of female age at first marriage in 32 sub- Saharan African countries over the past five decades. Data were provided by the World Fertility Surveys and the Demographic and Health Surveys. Estimates of the median age at first marriage were calculated by 5-year birth cohort, for urban and rural areas separately. Results confirm that median age at first marriage is still low, in the 15–19 age band for most countries, with the exception of three Southern African countries (Namibia, Botswana and South Africa), where it is much higher. In most countries the median age at first marriage tended to increase for cohorts born after 1950, usually after a period of steady levels, or sometimes after a period of significant decrease, and exceeds the 20 years threshold for cohorts born after 1975 in several countries. In only a few countries, the median age at first marriage remained stable over time. The increase in median age at first marriage was small in rural areas, and more pronounced in urban areas, sometimes exceeding by 3 to 8 years earlier estimates. Main factors of increase in age at marriage were level of education and income, plus a small residual time trend. Main factors of lower age at marriage were religions (Islam and Christianity), polygyny, and urbanisation after controlling for income and education. Results are discussed in light of social changes occurring in Africa over the 20th century, and the course of this new nuptiality transition. Keywords Marriage, nuptiality, age at first marriage, polygyny, level of education, income, religion, Christian, Islam, socio-economic determinants, sub-Saharan Africa SAJDem 9(2):57–77 57 1 Dr. Michel Garenne, Directeur de Recherche, French Institute for Research and Development (IRD), 15 rue de l’école de médecine, 75270 Paris Cedex 06. Email: [email protected]
Transcript of Age at marriage and modernisation in sub-saharan...
Age at marriage and modernisationin sub-Saharan Africa
Michel Garenne1
Abstract
The study reviews levels, trends and factors of female age at first marriage in 32 sub-
Saharan African countries over the past five decades. Data were provided by the World
Fertility Surveys and the Demographic and Health Surveys. Estimates of the median age
at first marriage were calculated by 5-year birth cohort, for urban and rural areas
separately. Results confirm that median age at first marriage is still low, in the 15–19
age band for most countries, with the exception of three Southern African countries
(Namibia, Botswana and South Africa), where it is much higher. In most countries the
median age at first marriage tended to increase for cohorts born after 1950, usually after
a period of steady levels, or sometimes after a period of significant decrease, and exceeds
the 20 years threshold for cohorts born after 1975 in several countries. In only a few
countries, the median age at first marriage remained stable over time. The increase in
median age at first marriage was small in rural areas, and more pronounced in urban
areas, sometimes exceeding by 3 to 8 years earlier estimates. Main factors of increase in
age at marriage were level of education and income, plus a small residual time trend.
Main factors of lower age at marriage were religions (Islam and Christianity), polygyny,
and urbanisation after controlling for income and education. Results are discussed in
light of social changes occurring in Africa over the 20th century, and the course of this
new nuptiality transition.
Keywords
Marriage, nuptiality, age at first marriage, polygyny, level of education, income, religion,
Christian, Islam, socio-economic determinants, sub-Saharan Africa
SAJDem 9(2):57–77
57
1 Dr. Michel Garenne, Directeur de Recherche, French Institute for Research and Development (IRD), 15 rue de
l’école de médecine, 75270 Paris Cedex 06. Email: [email protected]
INTRODUCTION
Female age at first marriage is an important characteristic of population
dynamics. With respect to fertility, age at marriage is a critical element of the
susceptibility to childbearing, even though a significant proportion of women
now have children prior to the first marriage. First marriage also determines in
part the social status life cycle, and the dynamics of family formation. With
respect to health, age at first marriage is an important factor of exposure to
multiple sexual partnerships, and as a consequence to sexually transmitted
disease (STDs), in particular toHIV/AIDS. Earlymarriage (at age 15–19 years)
is usually associated with higher fertility, larger families, lower numbers of
sexual partners, and fewer STDs. Early marriage was most common in
traditional societies of Africa and Asia prior to 1950, and is still the dominant
pattern in many countries in these continents. Late marriage (above age 25)
seems to be a common feature of modern western societies and Japan at the
end of the 20th century, as well as some atypical Southern African societies
(South Africa, Namibia, Botswana). Other developing countries and
transitional societies seem to be in general in the 20–24 age band, with large
variations at the individual level (UN yearbook; Singh and Samara 1996;
Westoff, Blanc and Nyblade 1994, Althaus 1991).
Age at marriage appears often stable for long periods of time, and at the
same time is susceptible to rapid changeswithmodernisation, and in particular
with prolonged schooling and new attitudes towards partnership. Age at
marriage is also quite responsive to economic crises, and in periods of
economic hardship marriage is often delayed by a few years, though these
effects tend to not last for long periods of time. Patterns of marriage may also
differ between urban and rural areas. Polygyny is prevalent throughout Africa,
and is assumed to reduce the female age at first marriage, primarily by
providing more marriage opportunities to women. Other factors of early
marriage, often neglected in the demographic literature, are monotheist
religions of Middle Eastern origin, in particular Christianity and Islam. Both
give a high value to marriage and to chastity of women prior to marriage, and
may therefore have an effect on age at first marriage.
Sub-Saharan African societies went through major social changes in the
20th century, with great diversity between countries. European colonisation
affected the whole continent, brought some economic development and
initiated economic growth in a number of countries. According to Maddison
(2003), 35 of the 48 countries surveyed had some significant growth in income
58 Southern African Journal of Demography 9(2)
per capita over the 1950–2000 period, where income was measured in gross
domestic product in parity purchasing power (GDP–PPP). Christian
missionaries devoted much time and effort to promote modern education,
especially between 1930 and 1960. This effort was later taken over to a large
extent by the newly established states, and by the time of independence
(around 1960 for most countries), virtually all countries had a national system
of primary and secondary schools, often working side by side with missionary
schools.
More recently, Islamic schools developed, especially in West Africa, with
subsidies from Arab countries. According to the United Nations recent review
(UNPD 2002), urbanisation developed rapidly in Africa in the second part of
the 20th century, tripling from an estimated value of 11.5 per cent in 1950 to
34.3 per cent in year 2000. Monotheist religions also expanded during the
20th century. Islam expanded further south from its traditional base in the
northern part of the Sahelian band going from the Senegal River to Egypt.
With the Catholic and Protestant missionaries, Christian religions expanded
rapidly in most of sub-Saharan Africa south and east of the rain forest, and
converted numerous populations in southern, central and eastern Africa, as
well as inMadagascar. As it will seen below, all these changes had effects on the
age at marriage.
In his seminal work on marriage in sub-Saharan Africa, Van de Walle
(1967) analysed a variety of censuses and surveys available at that time, and
paid great attention to the quality of data. He noted the frequent age
misreporting around the age at first marriage, in particular under-reporting of
women in their teens and over-reporting of women over age 20, which
suggests that young married women preferred to appear older than they were.
Despite this bias, the singulate mean age at marriage (SMAM), estimated from
proportions of ever married women by age in censuses, was found to be low
(below age 20) in most countries investigated, ranging from 15.2 in Niger to
19.4 in Mozambique, with the exception of Burundi where the SMAM was
22.1 years. He also found significant variations by regions within the same
country. In further work on the same topic, using World Fertility Survey
(WFS) data and Demographic and Health Survey (DHS), the same author
(Van de Walle 1993) observed a similar range of the median age at marriage
(from 15.6 to 19.7 years) in more recent periods, and a relatively close
relationship with the SMAM found in censuses, though the latter tended to be
usually somewhat higher. At the end of a careful analysis of uncertainty in the
Age at marriage and modernisation in sub-Saharan Africa 59
data, the author concluded that age at first marriage has tended to increase
since the beginning of data collection, and that in eastern and southern Africa
it was breaking the threshold of 20 years. Changes in age at marriage could
explain in part the differences betweenmedian age estimated from surveys and
SMAM estimated from censuses.
A great deal of attention has been devoted to the quality of data on age at
first marriage, age at first birth, and age at first sexual intercourse in WFS and
DHS surveys (McCarthy 1982; Blanc and Rutenberg 1990; Gage 1993). In
WFS and DHS surveys, marriage includes in principle both formal marriage
(whether legal in the modern sense or traditional) and consensual unions with
cohabitation. Inmost countries throughout Africa, first cohabitation is usually
synonymous with first marriage, and this is virtually universal in rural areas.
However, in large cities many young women now cohabit with a partner
before the first marriage, especially in the recent years. The WFS surveys
included a question on “type of union”,which allows comparison of “common
law unions” with “formal marriages”, whether modern or traditional. In six
out of ten African surveys, only formal marriage was taken into account by the
fieldworkers as a “union” (Cameroon, Ghana, Kenya, Lesotho, Nigeria,
Sudan). In two WFS surveys, common law unions were rare compared to
formal marriages (Benin: 8 per cent, and Senegal: 0.1 per cent). In the
remaining two countries (Cote d’Ivoire and Rwanda) a large proportion of
unions were not coded as formal marriages (22 per cent and 41 per cent
respectively). The case of Rwanda, a very Catholic country, seems doubtful,
and it seems likely thatmost of these unionswere equivalent towhatwas called
“traditional marriage” elsewhere. The case of Cote d’Ivoire seems different,
and in the 1999 DHS conducted in the same country, a relatively high
proportion of women currently in union declared to not be formally married
(25 per cent), a proportion similar to that of first unions in the 1980 WFS
survey. In any case, the mean age at first marriage and the mean age at first
informal union appeared similar in all cases investigated: in two countries
(Benin and Cote d’Ivoire) there was no significant difference (18.7 and 18.4
years respectively, P= 0.33 in Benin; 17.4 and 17.6 years respectively, P=
0.16 in Cote d’Ivoire), and in Rwanda the difference was very small, without
any practical implication (19.2 and 18.9, P< 0.05). Due to very small numbers
(n= 5 common law unions), the same comparison could not be conducted in
Senegal. In summary, estimates of age at marriage in WFS and DHS surveys
seem robust to marriage definitions, and consistent with SMAMs.
60 Southern African Journal of Demography 9(2)

InWFS andDHS surveys, the date of first marriage was usually taken as the
date of first cohabitation in union, although two countries (Senegal and
Burkina Faso) used the date of marriage consummation as a reference. In these
two countries, wheremarriage is universal and early, the two dates are likely to
be very similar, and if anything the definition chosen could only reduce the
median age at marriage by a few months. In DHS surveys, date of birth and
date of first marriage are reported for all women inmonth and year, and age at
first marriage is computed from these dates. Further crosschecking is
conducted with the date of the first birth and the interval between first birth
and first union. Therefore, one can expect a good accuracy of age at marriage
data, and internal consistency with birth histories. In general, data on age at
first marriage were found of good quality in WFS and DHS surveys, with
details on dates bymonth and year in a largemajority of cases. The proportion
of cases where the year of marriage had to be imputed was low in almost all
countries, with the exception of Malawi, 1992 and to a lesser extent of
Tanzania, 1991 (Gage 1994). Some heaping on date of marriage was noted,
though with a relatively minor incidence in most surveys, with an index on
date heaping ranging from 0.97 (Rwanda) to 1.39 (Nigeria).
Further investigation conducted for this study showed that only the
“15 years”milestone attractedmanywomen as an age at first marriage inDHS
surveys, and otherwise the distribution of age atmarriage by single year for age
10 to age 30 was smooth, and close to a Poisson distribution. While
investigating trends, Gage (1994) also found evidence of small increases in age
at marriage in a number of African surveys, and some irregularities in others
(such as Nigeria, Kenya and Sudan), interpreted as age misreporting, although
formal trend analysis and testing differences were not conducted.
The aim of this study is to provide a new look at trends in age at marriage in
sub-Saharan African countries, by using more data than were available 10 years
ago, and by attempting to relate changes in age at marriage, as well as differ-
ences between countries, to the modernisation processes. By modernisation,
we mean here large social changes susceptible to have an effect on age at first
marriage, such as level of education, income, and urban residence; we also in-
cluded some cultural factors susceptible to change over time, such as polygyny
and religion. This study is part of a more comprehensive investigation of the
factors of premarital fertility in sub-Saharan Africa.
Age at marriage and modernisation in sub-Saharan Africa 61

DATA AND METHODS
This study utilised all WFS and DHS data sets from sub-Saharan Africa
available in early 2004: 10 WFS surveys, and 58 DHS surveys, covering
32 countries and about 85 per cent of African populations. Most of these
surveys were based on samples of women aged 15–49 years of any marital
status, though two surveys were based on ever-married women (Lesotho
1977; Sudan 1989). For these two surveys, themedian age was not considered
for the most recent cohorts, because of the selection bias inducing a lower
median age at marriage than in the whole population. However, since most
women were ever married by age 25, the median age at marriage could be
studied for earlier cohorts in both of these countries.
Median age at firstmarriage (the age bywhich 50 per cent of a cohort is ever
married) was systematically computed for each survey by 5-year birth cohorts,
from women born in 1925–1929 to women born in 1975–1979, whenever
available.When several surveys were available for the same country, data were
merged for the same cohorts. Cohorts of less than 100 women were ignored,
to avoid large fluctuations due to sample size. Data cover some 50 years of
social change, and a large part of the second part of the 20th century, since
most of these women would have married between 1940 and 1999. Some
countries with both WFS and DHS surveys (Benin, Cameroon, Cote d’Ivoire,
Ghana, Kenya, Nigeria, Rwanda, Senegal, Sudan) are better documented than
others, since they cover almost the whole period, and others with only one
survey (either WFS or DHS) allow only limited analysis (Botswana, Burundi,
Chad, Central African Republic, Comoro Islands, Ethiopia, Gabon, Guinea,
Lesotho, Liberia, South Africa).
Demographic data on median age at first marriage were matched with a
series of social and economic data: income, level of education, urbanisation,
polygyny, and religion. Data on income per capita were derived from the
OECD data bank (Maddison 2003). They are expressed as the gross domestic
product, corrected for parity purchasing power (GDP–PPP), converted into
constant 1990 USD. Income data were grouped by 5-year period, and were
matched with cohort marriage data by shifting the former by 20 years. For
instance, income data for 1950–1954 were considered the income conditions
prevailing at the time of marriage of the 1930–1934 cohort.
Data on urbanisation were derived from the databank gathered by the
United Nations Population Division (2002). Here again period values were
fitted to cohort data by shifting the cohort values by 20 years, as for income.
62 Southern African Journal of Demography 9(2)
The proportion urban in the surveys were compared to the UNdata and found
to be consistent with respect to the ranking of countries, though systematically
7 per cent higher than the survey estimates. This may be due to selection biases
induced by the surveys focusing on female adults in their reproductive ages,
who are more likely to be urbanised than the total population.
Other modernisation data were derived directly from the WFS and DHS
surveys. For education, themean number of years schoolingwas computed for
each 5-year birth cohort. The prevalence of polygyny was expressed as the
proportion of currently married women aged 15–49 in a polygynous union.
Religions were grouped into three categories: Christian, Muslim and other
and unknown, the last category grouping primarily traditional religions
prevailing inAfrica before the arrival ofmonotheist religions. The proportions
of Christian and Muslim women were used in the analyses.
Consistency between the surveys was tested by comparing the estimates of
the median age at first marriage for the same cohorts between successive sur-
veys. Consistency was high altogether and no systematic bias was found. Out
of the differences between the 159 pairs of estimates ofmedian age at firstmar-
riage matching the same cohorts in the same country, most were small (on the
average ±6 months), and not statistically significant (109/159) using a simple
test ignoring the design effect of each sample survey. When a design effect of
1.8 was used, a common value for DHS surveys, only 36 differences remained
significant. No difference exceeded 18 months, and most differences were
within ±12 months (147/159). When needed, trends in median age at mar-
riage were also systematically tested on segments when they were monotonic
by using linear regressions on time period.
Multiple regressions were used to evaluate the net effect of income,
education, time period, urbanisation, polygyny and religion on levels and
trends in median age at first marriage.
RESULTS
Levels
Estimates of the median age at first marriage derived from DHS surveys were
consistent with earlier estimates, though they covered a wider list of countries
and more time periods (Table 1). Most estimates by country lay within the
15–19 age band when all cohorts were combined. The main outliers were
Namibia, Botswana, and South Africa, withmedian ages at marriage averaging
24 years. Only three other countries exceeded 19 years on the average:
Age at marriage and modernisation in sub-Saharan Africa 63

Rwanda, Burundi, and Gabon. On the low side, only two countries had an
average median age at first marriage below 16 years: Niger and Chad. The
clusters of high values in southern Africa (Namibia, Botswana, South Africa),
and to a lesser extent in central Africa (Rwanda, Burundi), as well as the
clusters of low values in north-western Sahelian Africa (Mali, Niger, Chad)
suggest linkswith cultural factors, and in particularwith ethnicity and religion.
The other countries investigated fitted well with common knowledge of low
median age at first marriage and high homogeneity, in the range of 16–18
years. The overall average was 18 years, which was also the modal value of the
distribution by country.
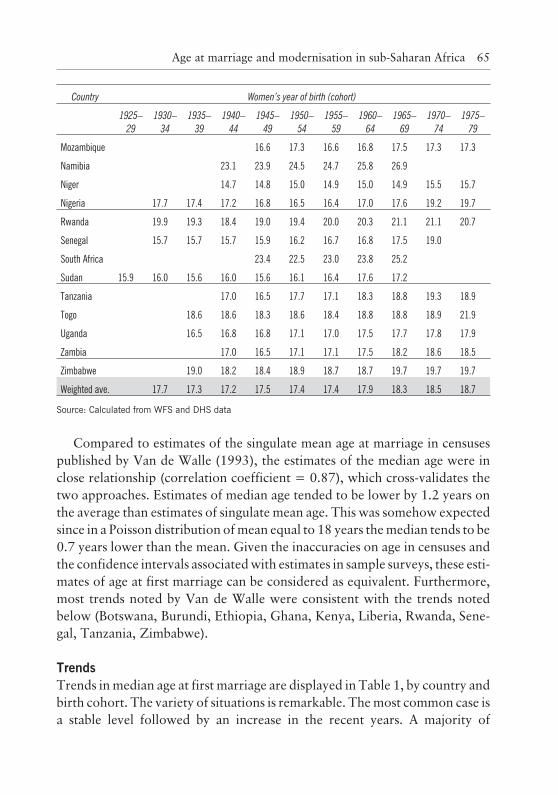
Table 1 Median age at first marriage, by birth cohort, selected African countries
Country Women’s year of birth (cohort)
1925–
29
1930–
34
1935–
39
1940–
44
1945–
49
1950–
54
1955–
59
1960–
64
1965–
69
1970–
74
1975–
79
Benin 19.5 18.8 18.3 18.0 18.0 18.5 18.4 18.6 18.7 18.9
Botswana 22.2 25.3 23.2 22.3 24.4 25.5
Burkina Faso 17.7 17.3 17.4 17.4 17.3 17.4 17.4 17.5
Burundi 20.3 19.3 19.4 19.5 19.4 19.8
Cameroon 18.1 18.0 17.0 16.9 16.4 16.8 16.9 17.0 17.2 18.1 18.6
Cen’l Afr’n R. 17.3 16.5 17.6 17.3 17.3 17.3
Chad 15.2 15.6 15.7 15.9 15.8 16.0 16.4
Comoro Is. 17.7 17.7 17.8 18.3 20.1 20.7
Cote d’Ivoire 17.5 17.7 17.6 17.4 17.8 17.6 17.8 18.2 19.2 20.2
Ethiopia 15.6 15.7 15.7 15.8 16.9 18.1
Gabon 17.8 19.1 19.3 19.9 20.4 20.1
Ghana 18.5 18.0 17.8 18.1 18.3 18.4 18.7 18.9 19.4 19.5
Guinea 16.1 16.2 16.9 16.2 16.3 16.5
Kenya 17.9 18.6 17.4 17.8 17.6 18.2 18.4 18.8 19.7 20.3
Lesotho 18.1 18.4 18.7 18.6 18.5 18.4
Liberia 16.2 16.5 16.5 17.3 17.4 18.3
Madagascar 17.3 17.4 17.9 18.1 18.3 19.0 18.8 18.8
Malawi 18.0 18.3 18.1 17.2 17.6 17.5 18.0 18.3
Mali 15.6 15.8 15.6 16.0 15.9 16.1 16.1 16.4 16.6
64 Southern African Journal of Demography 9(2)
Country Women’s year of birth (cohort)
1925–
29
1930–
34
1935–
39
1940–
44
1945–
49
1950–
54
1955–
59
1960–
64
1965–
69
1970–
74
1975–
79
Mozambique 16.6 17.3 16.6 16.8 17.5 17.3 17.3
Namibia 23.1 23.9 24.5 24.7 25.8 26.9
Niger 14.7 14.8 15.0 14.9 15.0 14.9 15.5 15.7
Nigeria 17.7 17.4 17.2 16.8 16.5 16.4 17.0 17.6 19.2 19.7
Rwanda 19.9 19.3 18.4 19.0 19.4 20.0 20.3 21.1 21.1 20.7
Senegal 15.7 15.7 15.7 15.9 16.2 16.7 16.8 17.5 19.0
South Africa 23.4 22.5 23.0 23.8 25.2
Sudan 15.9 16.0 15.6 16.0 15.6 16.1 16.4 17.6 17.2
Tanzania 17.0 16.5 17.7 17.1 18.3 18.8 19.3 18.9
Togo 18.6 18.6 18.3 18.6 18.4 18.8 18.8 18.9 21.9
Uganda 16.5 16.8 16.8 17.1 17.0 17.5 17.7 17.8 17.9
Zambia 17.0 16.5 17.1 17.1 17.5 18.2 18.6 18.5
Zimbabwe 19.0 18.2 18.4 18.9 18.7 18.7 19.7 19.7 19.7
Weighted ave. 17.7 17.3 17.2 17.5 17.4 17.4 17.9 18.3 18.5 18.7
Source: Calculated from WFS and DHS data
Compared to estimates of the singulate mean age at marriage in censuses
published by Van de Walle (1993), the estimates of the median age were in
close relationship (correlation coefficient = 0.87), which cross-validates the
two approaches. Estimates of median age tended to be lower by 1.2 years on
the average than estimates of singulate mean age. This was somehow expected
since in a Poisson distribution ofmean equal to 18 years themedian tends to be
0.7 years lower than the mean. Given the inaccuracies on age in censuses and
the confidence intervals associatedwith estimates in sample surveys, these esti-
mates of age at first marriage can be considered as equivalent. Furthermore,
most trends noted by Van de Walle were consistent with the trends noted
below (Botswana, Burundi, Ethiopia, Ghana, Kenya, Liberia, Rwanda, Sene-
gal, Tanzania, Zimbabwe).
Trends
Trends inmedian age at first marriage are displayed in Table 1, by country and
birth cohort. The variety of situations is remarkable. Themost common case is
a stable level followed by an increase in the recent years. A majority of
Age at marriage and modernisation in sub-Saharan Africa 65
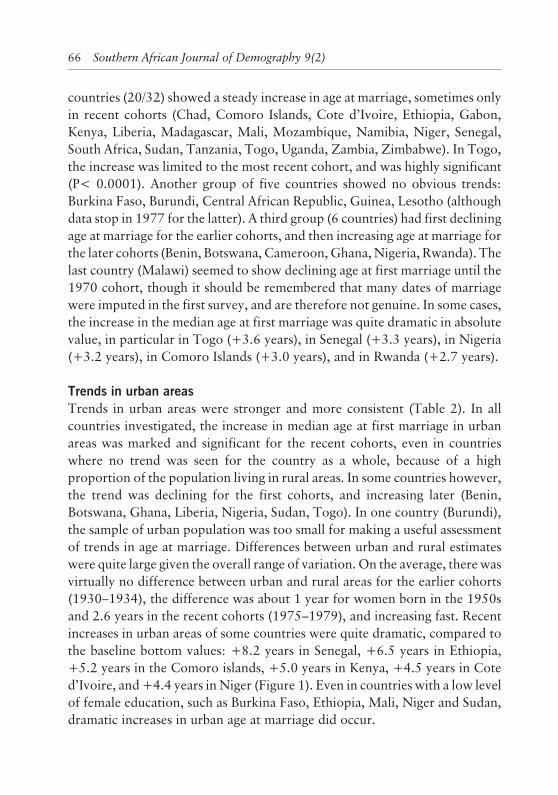
countries (20/32) showed a steady increase in age at marriage, sometimes only
in recent cohorts (Chad, Comoro Islands, Cote d’Ivoire, Ethiopia, Gabon,
Kenya, Liberia, Madagascar, Mali, Mozambique, Namibia, Niger, Senegal,
South Africa, Sudan, Tanzania, Togo, Uganda, Zambia, Zimbabwe). In Togo,
the increase was limited to the most recent cohort, and was highly significant
(P< 0.0001). Another group of five countries showed no obvious trends:
Burkina Faso, Burundi, Central African Republic, Guinea, Lesotho (although
data stop in 1977 for the latter). A third group (6 countries) had first declining
age at marriage for the earlier cohorts, and then increasing age at marriage for
the later cohorts (Benin, Botswana,Cameroon,Ghana,Nigeria, Rwanda). The
last country (Malawi) seemed to show declining age at first marriage until the
1970 cohort, though it should be remembered that many dates of marriage
were imputed in the first survey, and are therefore not genuine. In some cases,
the increase in the median age at first marriage was quite dramatic in absolute
value, in particular in Togo (+3.6 years), in Senegal (+3.3 years), in Nigeria
(+3.2 years), in Comoro Islands (+3.0 years), and in Rwanda (+2.7 years).
Trends in urban areas
Trends in urban areas were stronger and more consistent (Table 2). In all
countries investigated, the increase in median age at first marriage in urban
areas was marked and significant for the recent cohorts, even in countries
where no trend was seen for the country as a whole, because of a high
proportion of the population living in rural areas. In some countries however,
the trend was declining for the first cohorts, and increasing later (Benin,
Botswana, Ghana, Liberia, Nigeria, Sudan, Togo). In one country (Burundi),
the sample of urban population was too small for making a useful assessment
of trends in age at marriage. Differences between urban and rural estimates
were quite large given the overall range of variation.On the average, there was
virtually no difference between urban and rural areas for the earlier cohorts
(1930–1934), the difference was about 1 year for women born in the 1950s
and 2.6 years in the recent cohorts (1975–1979), and increasing fast. Recent
increases in urban areas of some countries were quite dramatic, compared to
the baseline bottom values: +8.2 years in Senegal, +6.5 years in Ethiopia,
+5.2 years in the Comoro islands, +5.0 years in Kenya, +4.5 years in Cote
d’Ivoire, and+4.4 years inNiger (Figure 1). Even in countries with a low level
of female education, such as Burkina Faso, Ethiopia, Mali, Niger and Sudan,
dramatic increases in urban age at marriage did occur.
66 Southern African Journal of Demography 9(2)

Table 2 Median age at first marriage in urban areas, by birth cohort, selected African
countries
Country Women’s year of birth (cohort)
1925–
29
1930–
34
1935–
39
1940–
44
1945–
49
1950–
54
1955–
59
1960–
64
1965–
69
1970–
74
1975–
79
Benin 19.6 19.2 19.0 18.7 19.5 19.4 20.0 19.9 20.8
Botswana 24.9 22.1 23.4 24.3 25.0
Burkina Faso 17.4 17.7 17.9 17.9 18.5 18.7 20.7
Burundi
Cameroon 17.2 18.8 16.7 17.2 17.3 17.9 18.0 17.9 18.2 20.2
Cen’l Afr’n R. 16.8 15.7 17.2 17.0 17.1 17.6
Chad 15.3 15.6 15.8 16.2 16.0 16.4 16.8
Comoro Is. 17.7 18.3 17.8 19.3 22.8
Cote d’Ivoire 16.7 17.4 17.6 17.5 18.1 18.1 18.1 19.4 21.2
Ethiopia 15.4 15.4 15.8 16.3 19.3 21.9
Gabon 18.6 19.4 19.3 20.5 20.8 20.8
Ghana 19.3 18.6 18.1 18.7 18.7 19.0 19.4 19.9 21.3
Guinea 17.1 17.0 17.7 17.5 17.1 18.4
Kenya 18.4 16.3 18.2 18.4 19.5 19.5 20.2 21.4 21.2
Lesotho 19.0 20.1 19.5 19.7
Liberia 18.5 17.5 17.1 17.8 17.8 19.3
Madagascar 18.9 19.8 20.0 20.4 20.8 20.6
Malawi 17.8 18.6 18.0 18.1 18.3 18.7 19.8
Mali 15.4 15.6 16.7 16.2 17.0 17.1 17.9 18.6
Mozambique 18.1 17.9 17.4 18.4 17.8 18.2 19.0
Namibia 25.2 25.4 27.0 26.4 26.6 26.3 26.4
Niger 15.0 15.4 15.3 15.6 16.3 17.4 19.4
Nigeria 18.4 19.8 18.4 18.3 17.9 17.9 18.7 20.2 20.5
Rwanda 20.4 20.8 21.2 22.2 21.8 22.3
Senegal 16.2 15.8 16.2 16.7 17.5 18.4 18.9 20.6 23.9
South Africa 23.8 23.0 23.7 24.5 26.4
Sudan 16.2 16.5 16.1 15.7 16.4 17.5 18.7 17.8
Tanzania 17.0 17.1 17.8 17.2 18.7 19.4 20.2 20.6
Togo 19.9 19.6 19.2 19.5 20.0 19.8 21.2
Age at marriage and modernisation in sub-Saharan Africa 67

Country Women’s year of birth (cohort)
1925–
29
1930–
34
1935–
39
1940–
44
1945–
49
1950–
54
1955–
59
1960–
64
1965–
69
1970–
74
1975–
79
Uganda 17.5 18.5 17.8 18.7 19.2 19.2 19.7
Zambia 16.8 16.2 17.4 17.1 17.7 19.0 19.1 19.4
Zimbabwe 19.4 18.8 19.4 19.2 19.3 20.8 21.1 20.8
Weighted ave. 18.0 18.3 17.8 18.2 18.1 18.2 18.8 19.6 20.0 20.4
Source: Calculated from WFS and DHS data
Socio-economic determinants
The regression of median age at first marriage on modernisation variables
revealed the most salient factors of change in age at marriage (Table 3). Three
factors had a net positive effect: time, income and education, and three factors
had a net negative effect: urbanisation, polygyny and religions (both
Christianity and Islam). The effect of education seems straightforward, since
when girls go longer to school they tend to delay their firstmarriage. The effect
of income was in the expected direction, and seems to reveal the effects of
westernisation. This may include the image of modern roles coming from
Western societies, and possibly the effect of female labour force participation:
68 Southern African Journal of Demography 9(2)
Senegal
Ethiopia
Comoro Islands
Kenya
Cote d'Ivoire
Niger
Cameroon
South Africa
Burkina Faso
Mali
Ghana
Sudan
14
16
18
20
22
24
26
28
1925-29 1930-34 1935-39 1940-44 1945-49 1950-54 1955-59 1960-64 1965-69 1970-74 1975-79
Year of birth (cohort)
Media
nage
at
firs
tm
arr
iage
Figure 1 Typical increase in median age at first marriage in urban areas of selected
African countries
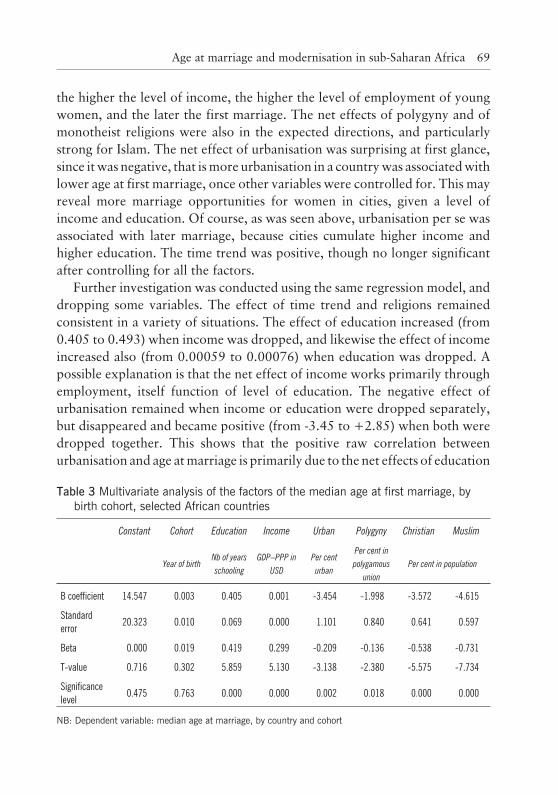
the higher the level of income, the higher the level of employment of young
women, and the later the first marriage. The net effects of polygyny and of
monotheist religions were also in the expected directions, and particularly
strong for Islam. The net effect of urbanisation was surprising at first glance,
since itwas negative, that ismore urbanisation in a countrywas associatedwith
lower age at first marriage, once other variables were controlled for. This may
reveal more marriage opportunities for women in cities, given a level of
income and education. Of course, as was seen above, urbanisation per se was
associated with later marriage, because cities cumulate higher income and
higher education. The time trend was positive, though no longer significant
after controlling for all the factors.
Further investigation was conducted using the same regression model, and
dropping some variables. The effect of time trend and religions remained
consistent in a variety of situations. The effect of education increased (from
0.405 to 0.493) when income was dropped, and likewise the effect of income
increased also (from 0.00059 to 0.00076) when education was dropped. A
possible explanation is that the net effect of income works primarily through
employment, itself function of level of education. The negative effect of
urbanisation remained when income or education were dropped separately,
but disappeared and became positive (from -3.45 to +2.85) when both were
dropped together. This shows that the positive raw correlation between
urbanisation and age atmarriage is primarily due to the net effects of education
Age at marriage and modernisation in sub-Saharan Africa 69
Table 3 Multivariate analysis of the factors of the median age at first marriage, by
birth cohort, selected African countries
Constant Cohort Education Income Urban Polygyny Christian Muslim
Year of birthNb of years
schooling
GDP–PPP in
USD
Per cent
urban
Per cent in
polygamous
union
Per cent in population
B coefficient 14.547 0.003 0.405 0.001 -3.454 -1.998 -3.572 -4.615
Standard
error20.323 0.010 0.069 0.000 1.101 0.840 0.641 0.597
Beta 0.000 0.019 0.419 0.299 -0.209 -0.136 -0.538 -0.731
T-value 0.716 0.302 5.859 5.130 -3.138 -2.380 -5.575 -7.734
Significance
level0.475 0.763 0.000 0.000 0.002 0.018 0.000 0.000
NB: Dependent variable: median age at marriage, by country and cohort
and income. Last, the effect of polygyny increased significantly in absolute
value (from -2.15 to -3.44) when educationwas dropped, which indicates that
education modulates somewhat the impact of polygyny.
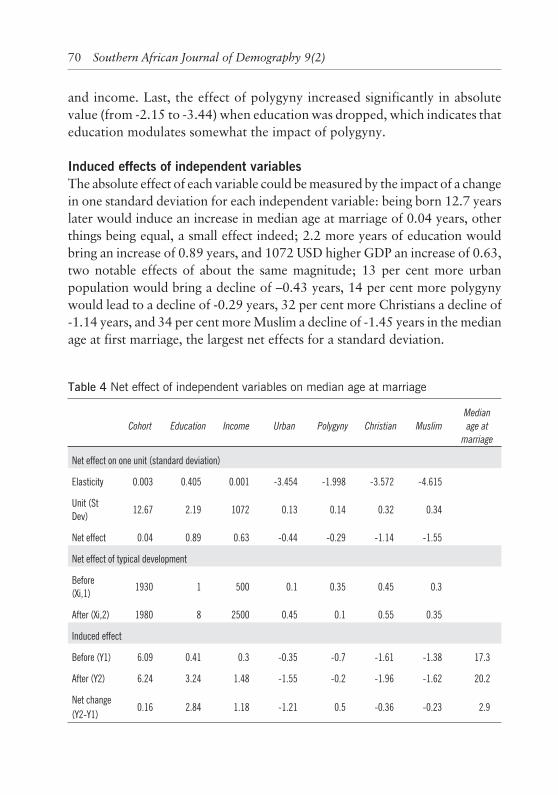
Induced effects of independent variables
The absolute effect of each variable could bemeasured by the impact of a change
in one standard deviation for each independent variable: being born 12.7 years
later would induce an increase in median age at marriage of 0.04 years, other
things being equal, a small effect indeed; 2.2 more years of education would
bring an increase of 0.89 years, and 1072 USD higher GDP an increase of 0.63,
two notable effects of about the same magnitude; 13 per cent more urban
population would bring a decline of –0.43 years, 14 per cent more polygyny
would lead to a decline of -0.29 years, 32 per cent more Christians a decline of
-1.14 years, and 34 per centmoreMuslim a decline of -1.45 years in themedian
age at first marriage, the largest net effects for a standard deviation.
70 Southern African Journal of Demography 9(2)
Table 4 Net effect of independent variables on median age at marriage
Cohort Education Income Urban Polygyny Christian Muslim
Median
age at
marriage
Net effect on one unit (standard deviation)
Elasticity 0.003 0.405 0.001 -3.454 -1.998 -3.572 -4.615
Unit (St
Dev)12.67 2.19 1072 0.13 0.14 0.32 0.34
Net effect 0.04 0.89 0.63 -0.44 -0.29 -1.14 -1.55
Net effect of typical development
Before
(Xi,1)1930 1 500 0.1 0.35 0.45 0.3
After (Xi,2) 1980 8 2500 0.45 0.1 0.55 0.35
Induced effect
Before (Y1) 6.09 0.41 0.3 -0.35 -0.7 -1.61 -1.38 17.3
After (Y2) 6.24 3.24 1.48 -1.55 -0.2 -1.96 -1.62 20.2
Net change
(Y2-Y1)0.16 2.84 1.18 -1.21 0.5 -0.36 -0.23 2.9

Another way at looking at the global effect of modernisation is to take
arbitrary values of typical modernisation over a 50-year period, and to calculate
the absolute change induced: increase in income from 500 of 2500 USD
(consistent with leading countries such as Botswana or Gabon), increase in
education from1 to8 years (consistentwith countries such asKenya orNigeria),
increase in urbanisation from 10 per cent to 45 per cent (consistent with
countries such as Botswana), decline of polygyny from 35 per cent to 10 per
cent, and minor change in religious affiliation (Christian from 45 per cent to
55 per cent andMuslim from 30 per cent to 35 per cent), values consistent with
average trends in the continent according to DHS surveys. The change for the
median age at first marriage would be an increase of 2.9 years (from 17.3 to
20.2), most of which would be attributable to education (+2.84 years) and
income (+1.18 years) plus a small contribution of time trend (+0.16 years) and
of the decline in polygyny (+0.50 years), and despite the negative effect of
urbanisation (-1.21 years) and religious affiliations (-0.36 and –0.23
respectively for Christianity and Islam). This finding reveals the leading
mechanisms of increases in age at first marriage: education and income.
Outliers and cultural factors
A number of countries lay far away from values predicted by the regression
model given their background characteristics (income, education, urbanisa-
tion, polygyny, religion). Taking themean residuals by country, and a gap of at
least 1 year between the observed and the predicted value ofmedian age at first
marriage identified a short list of 12 countries out of the 32 investigated: 6 pos-
itive outliers (observed value higher than expected) and 6 negative outliers
(observed value lower than expected). Positive outliers were: Namibia (24.8
observed, 20.6 predicted), Botswana (23.8 observed, 21.3 predicted), South
Africa (23.6 observed, 21.2 predicted), Rwanda (19.9 observed, 18.4 pre-
dicted), Burundi (19.6 observed, 17.8 predicted), and Comoro Islands (18.7
observed, 16.9 predicted). Negative outliers were: Niger (15.1 observed, 16.1
predicted), Liberia (17.0 observed, 18.5 predicted), Zimbabwe (19.0 ob-
served, 20.5 predicted), Mozambique (17.1 observed, 18.6 predicted), Le-
sotho (18.5 observed, 20.1 predicted), and Gabon (19.4 observed, 21.8 pre-
dicted). The residual analysis underlines the heterogeneity of the sample of
countries with respect to our modernisation variables, and the likely influence
of specific factors, cultural or contextual, in these countries.
Age at marriage and modernisation in sub-Saharan Africa 71

Accounting for declining trends in earlier periods
The declining trends inmedian age atmarriage for earlier cohorts has not been
documented so far. The regression model provides clues to understand this
unexpected finding. In Benin, the median age declined from 19.5 in 1930–
1934 cohort to 18.0 in 1945–1949 cohort. This can be explained in part by the
negative effect of urbanisation, which rose from 5 per cent to 17 per cent and
the expansion of monotheist religions (16 per cent to 33 per cent for
Christianity and 14 per cent to 19 per cent for Islam). The net effects of these
three variables already explained a decline of –1.19 years in median age at
marriage, 79 per cent of the total decline. This occurred in a context of steady
income, and minor rise in level of education (from 0.1 to 0.9 years of
schooling) which had only marginal effects.
In Cameroon, median age at marriage also declined from 18.0 in 1930–
1934 cohort to 16.4 in 1945–1949 cohort. However, in this case, the model
could not explain the change: the net effects added up to an predicted increase
of 1.21 years, instead of the observed decrease of -1.60 years, and only
urbanisation had a negative impact, though very small effect (-0.30 years).
InGhana,median age atmarriage declined from 18.5 in 1930–34 cohort to
17.8 in 1945–1949 cohort. This was associated with increasing urbanisation,
and increasing proportions Muslim, both of which explain 78 per cent of the
decline inmedian age at first marriage (-0.29 and -.025 years respectively), in a
context of minor changes in education and income.
In Malawi, like in Cameroon, the model explained little of the decline in
median age at first marriage from 1940–1944 to 1955–1959 (18.0 to 17.2
years). The model predicted rather an increase of 1.02 years, and the negative
effects of urbanisation and increasing number of Christians accounted only for
a small fraction (28 per cent) of the decline in age at marriage. In Nigeria,
median age at first marriage declined steadily from 17.7 in cohort 1930–1934
to 16.4 in cohort 1955–1959. This decline could be explained almost fully
(92 per cent) by increasing urbanisation (-0.45 years) and increasing Islam
(-0.65 years). However, this should have been compensated by the rise in
education (+0.94 years) and income (+0.39 years), so that all factors
included, the model does not predict the decline in age at marriage. In
summary, the model provides some clues to understand the decline in median
age at marriage in certain countries, primarily as an effect of urbanisation and
religious affiliations, though is not able to explain per se all changes observed.
72 Southern African Journal of Demography 9(2)

Accounting for increasing trends in later periods
Running a similar exercise on the 1950–1979 period, or on the last 30 years
available led to some extra light in the explanatory power of the model. Over
this period, trends in median age at marriage were increasing or steady. In
about two thirds of the countries investigated (19/31), the model performed
well, and changes in explanatory variables with a positive effect could explain
the rise in age at marriage. In nine countries, the changes in explanatory vari-
ables explained about half of the rise in age at marriage: Comoros (+67 per
cent), Cote d’Ivoire (76 per cent), Ethiopia (39 per cent), Liberia (61 per cent),
Namibia (54 per cent), Nigeria (49 per cent), Senegal (56 per cent), South
Africa (72 per cent), and Zambia (43 per cent). In the last three cases, the
model failed to fit the changes. InGabon, themodel predicted a decline of -2.6
years (instead of an increase of +2.3 years), primarily attributable to a decline
in real income combined with fast urbanisation; in Madagascar and in Togo,
the model predicted no change, because of strong negative effects of income
and urbanisation balancing the other positive effects, whereas both countries
had a significant rise in age at marriage (+1.0 years and +2.6 years respec-
tively). If overall the model performed well, it was found quite sensitive to
outstanding situations, in particular to unexpected decline in income.
For the average of the 31 countries, about half of the increase in age at
marriage induced by positive variables was attributable to increase in level of
education (50 per cent), the rest being attributable to decline in polygyny
(22 per cent), increase in income (10 per cent), time trend (5 per cent), and to
changes in religious affiliations. For Africa as awhole, themodel accounted for
about half of the increase in median age at marriage from cohorts 1950–1954
to 1975–1979.
DISCUSSION
This study confirmed the overall impression of lowmedian age at first marriage
in Africa compared to developed countries, and the relative homogeneity of the
continent, despite someoutstanding cases such asNamibia, Botswana and South
Africa. It also confirmed the impression of increasing trends, especially in urban
areas.However the study revealed that someother changesmight have occurred
earlier in the 20th century, with lowering ages at marriage in a number of coun-
tries. Unfortunately, the data were limited, and did not cover the whole century
for all African countries, not counting the fact that data might be biased for
earlier cohorts in some countries due to age misreporting.
Age at marriage and modernisation in sub-Saharan Africa 73
Computations of median age at first marriage in urban and rural areas refer
to current status of the interviewedwomen. Some womenmay have grown up
in rural areas, married there, and then moved to town or cities with the new
husband where they were interviewed. This will tend to bias downwards the
estimates of median age at marriage in urban areas, and only reinforces the
value of the differences between the two areas of residence and of the trends
noted in urban areas. It is beyond the scope of this paper to do a full analysis of
the complex relationships between marriage, migration and urbanisation,
which anyway would require more details than available in DHS surveys.
We have also used the current polygyny status at time of survey in various
cohorts. Although this provided solid information for cross-country analysis,
this may have biased the cohort trends, since older cohorts were older at time
of the first survey, and younger cohorts were younger at time of last survey.
Since polygyny changes with age, this might have introduced a bias. Further-
more, polygyny status might change over time for the same person, which
could not be taken into account. Ideally, one wished to have the polygyny
status at time of firstmarriage for all women, information not available inWFS
or DHS surveys.
The study provided some quantitative elements of the effect of well-known
or suspected determinants of age at first marriage. Most of those seem classic
cases of the effect of modernisation on demographic parameters. It should be
remembered, however, that with further modernisation these relationships
might prove to bemore complex and changeable. For instance, in the 1950s age
at marriage for European women went down, and rose dramatically some
25 years later, for a variety of reasons which had less to dowith socio-economic
changes than with the new opportunities created by the end of the Second
World War and later with changing norms and attitudes towards marriage.
Another finding of this study was the many negative factors of age at
marriage, in particular religion and polygyny. These negative factors could
explain why the median age at first marriage was declining in the early phase,
before the effect of income and education could take over. In particular, the
spread of monotheist religions probably had a significant impact, which seems
to have been neglected so far. Furthermore, the development of a cash
economy, increasing income, and new job opportunities in the second phase of
colonisation (1930–1960), together with a younger age structure due to more
rapid population growth associated with declining child mortality, could also
have provided new opportunities for polygyny, by increasing income of older
74 Southern African Journal of Demography 9(2)

men and increasing the ratio of women aged 15–19 to older men. All these
factors could have produced a lower median age at first marriage in the 1950s
and 1960s, for women born between 1930 and 1949.
The net effect of urbanisation would necessitate a special study. Part of the
negative effect could be due to outstanding countries, with high age at
marriage and low urbanisation, such as Rwanda and Burundi which have a
heavy weight in a relatively homogeneous sample, or to interaction with the
early phase of development which occurred despite low levels of education
and income, or to other unknown factors which had an effect on age at
marriage and occurred at the same time as urban areas grew.
The positive effect of incomewas clear in a number of countries with steady
economic growth, but difficult to interpret in cases of changing income trends.
To document cases where declining income had a negative effect on age at
marriagewould require further investigations. Furthermore, inmany cases the
positive effect of income was just counterbalanced by the negative effect of
urbanisation. Here again, the complex interactions between income, labour
force participation and urbanisation would require more research.
We have interpreted changes in socio-economic variables as normal and
desirable changes during the modernisation process, i.e. changes expected to
occur with economic development, namely increasing modern education,
urbanisation, and rising income. If this approach sounds reasonable for the
population as awhole, the situation of the poorer stratamight be different. For
the poor, social change might be more the result of unwanted external
pressure, than of improving situation. For instance, the pattern of circulatory
migration, so prevalent in southern Africa, and in particular in the three
countries with the highest age at first marriage, is primarily due to an economy
organised around mining, and to a tradition of separation of spouses during
the apartheid years. This situation might have induced a strong stress on
families and on the society as a whole, and might be the main cause of
postponement of the first marriage.
Similarly, difficult situations created by civil strife, unrest, international
wars or major economic crises, might have put many persons in situations
where they simply had to delay marriage. In addition, limitations on arable
land, and lack of employment in cities have induced massive out-migration of
youngmen, whowould have been eligible for marriage, delaying therefore the
marriage of young women. For instance, this could be an explanation for the
rapid rise in age at marriage in urban Senegal. So, average for a country does
Age at marriage and modernisation in sub-Saharan Africa 75

not reflect all the complex individual situations. InmanyAfrican countries, the
local situation has not been steady and favourable to early marriage over the
past 25 years. These political situations do not reflect necessarily in national
socio-economic indicators, andmight hide other strong determinants of age at
first marriage.
The analysis of residuals from the regressions showed that variations in the
median age at first marriage could not be reduced to a series of modernisation
indicators. Some large discrepancies between observed and predicted values,
notably in countries of southern Africa (Namibia, Botswana, South Africa) and
central Africa (Rwanda, Burundi), reveal strong social factors, and norms
different from the other countries. The case of Comoro Islands is somewhat
different, since this island evolved quite independently from the rest of
continental Africa. Similarly, low values ofmedian age atmarriage in countries
such as Niger, Sudan, Uganda, Zimbabwe and Mozambique could not be
explained by the regression, and suggest independent cultural effects, which
remain to be explored. The case of Zimbabwe is particularly striking when
compared to neighbouring countries such as Botswana, Namibia, and South
Africa.
Major changes in the median age at first marriage were already visible in a
number of countries, and the 20-year threshold was already passed by
9 countries out of the 32 investigated, and by 19 countries for urban areas.
Future increases in modern education and income are likely to produce more
increases in the median age at marriage, and could be the catalysts for a long
nuptiality transition. Future changes in the age at marriage would also change
the marriage market for multiple unions and, together with the pronounced
fertility decline already in course in Africa (Garenne and Joseph 2002), are
likely to reduce the incidence of polygyny, which in turn will have a positive
effect on age at first marriage.12 It seems that many countries in sub-Saharan
Africa are just starting a major nuptiality transition, the course of which needs
to be monitored and analysed in the future.
ACKNOWLEDGEMENT
This study is part of a more comprehensive study on premarital fertility supported by the
Wellcome Trust, Health Consequences of Population Change panel.
76 Southern African Journal of Demography 9(2)
REFERENCES
Althaus F. 1991. “Early marriage and childbearing remain common in much ofdevelopingworld, even as fertility falls”, International Family Planning Perspectives,17(3):119–120.
Blanc A.K. and Rutenberg N. 1990. “Assessment of the quality of data on age at firstsexual intercourse, age at first marriage, and age at first birth in the DemographicandHealth Surveys”,DHS Methodological Reports No. 1.Columbia, IRD-Macro.
Gage A. 1995. “An assessment of the quality of age at first union, first birth, and firstsexual intercourse for phase II of the Demographic and Health Surveys program”,DHS Occasional Papers, No 4.
GarenneM. and Joseph V. 2002. “The timing of the fertility transition in sub-SaharanAfrica”, World Development, 30(10): 1835–1843.United Nations, DemographicYearbook. Various issues.
Maddison A. 2003. The world economy: historical statistics. Paris, OECD.
McCarthy J. 1982. “Differentials in age at first marriage”, WFS Comparative StudiesNo. 9. Voorburg, Netherlands, NIDI.
Singh S. and Samara R. 1996. “Earlymarriage amongwomen in developing countries”,International Family Planning Perspectives, 22(4):148–157.
United Nations, Population Division. 2002.World urbanisation prospects.New York,NY, United Nations (Available on web site: unpopulation.org).
Van de Walle E. 1967. “Marriage in African censuses and inquiries”, in TheDemography of Tropical Africa, edited by Brass W., Coale A.J. et al. Princeton, NJ,Princeton University Press: 183–238.
Van de Walle E. 1993. “Recent trends in marriage ages”, in Demographic change insub-Saharan Africa, edited by Foote K.A., Hill K.H. and Martin L.G. Washington,DC, National Academy Press: 117–152.
Westoff C.F., Blanc A.K. and Nyblade L. 1994. “Marriage and entry into parenthood”,DHS Comparative Studies No 10. Columbia, IRD-Macro.
Age at marriage and modernisation in sub-Saharan Africa 77