AgCam Calibration Test Results
21
UMAC Annual Meeting 2005 AgCam Calibration Test Results Xiaodong Zhang
-
Upload
quinlan-roberts -
Category
Documents
-
view
39 -
download
4
description
AgCam Calibration Test Results. Xiaodong Zhang. Calibration Tests. Spectral Radiometric Flat Field Focus Thermal Effects First light. NIR Camera. Red Camera. Spectral Calibration Configuration. MONOCHROMETER. AgCam. LIGHT SOURCES. 100W Tungsten Halogen bulb. CHOPPER. - PowerPoint PPT Presentation
Transcript of AgCam Calibration Test Results

UMAC Annual Meeting 2005
AgCam Calibration Test Results
Xiaodong Zhang
UMAC Annual Meeting 2005
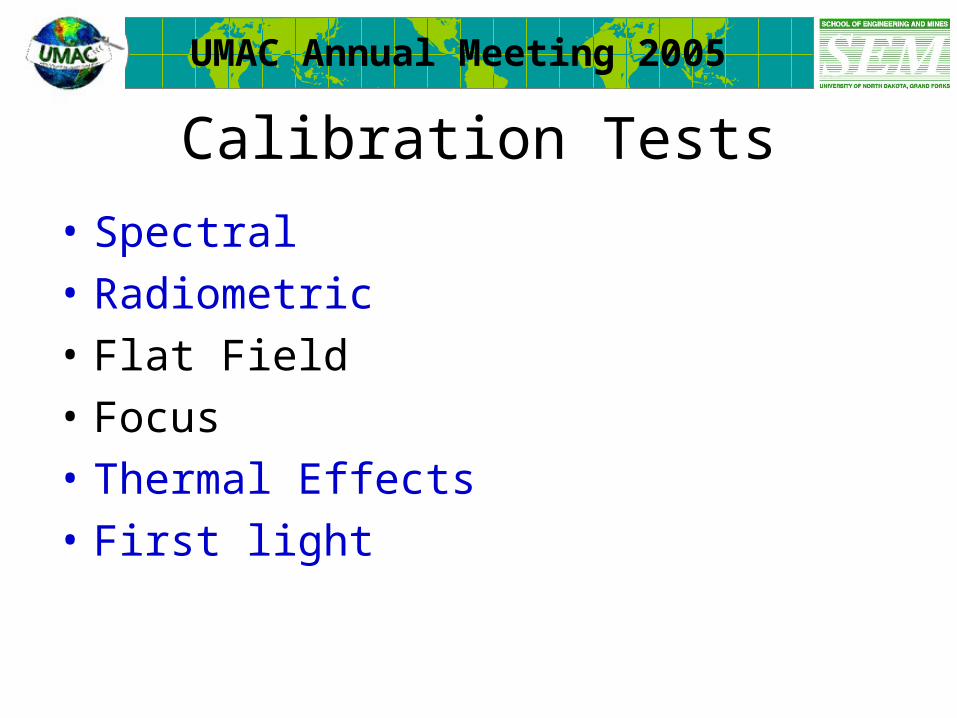
Calibration Tests
• Spectral
• Radiometric
• Flat Field
• Focus
• Thermal Effects
• First light

UMAC Annual Meeting 2005
Spectral Calibration
LIGHT SOURCES
100W TungstenHalogenbulb
MONOCHROMETER
AgCam
M3
M2
M4M1
Spectral Calibration Configuration
CHOPPER
FILTER WHEEL
Collimator
Red Camera
NIR Camera
PDC

UMAC Annual Meeting 2005
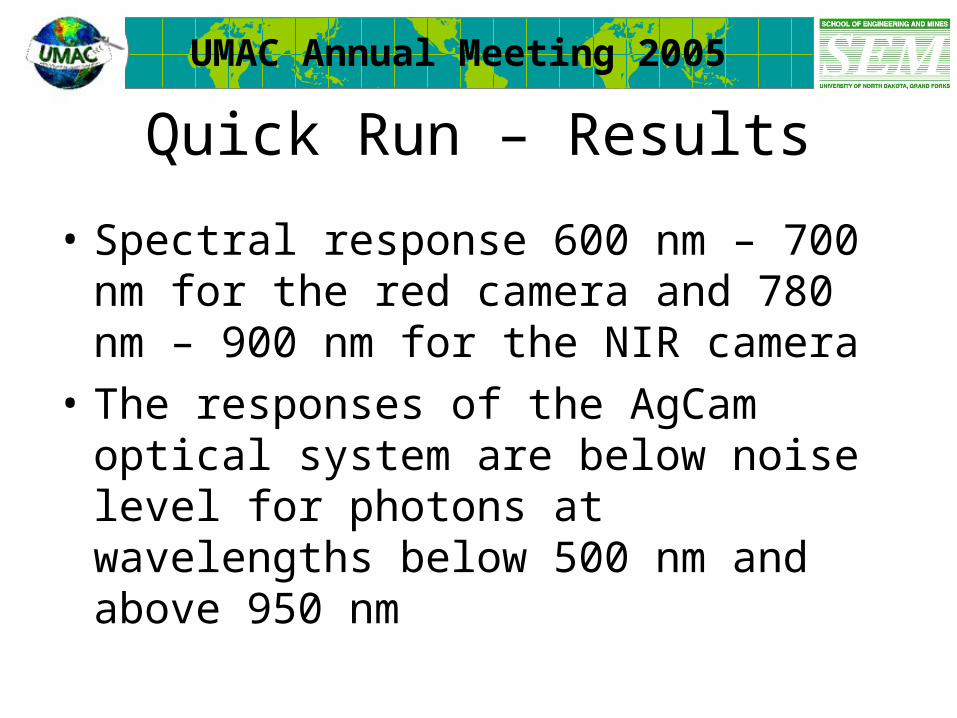
Spectral Calibration – Quick Run
• Approximately determine the spectral band pass of the AgCam system
• Every 5 nm from 330 nm to 1200 nm
• 7 nm FWHM (bandwidth)• Integration time 400 s
for both cameras• Visually check if signal >
noise
UMAC Annual Meeting 2005
Quick Run – Results
• Spectral response 600 nm – 700 nm for the red camera and 780 nm – 900 nm for the NIR camera
• The responses of the AgCam optical system are below noise level for photons at wavelengths below 500 nm and above 950 nm
UMAC Annual Meeting 2005
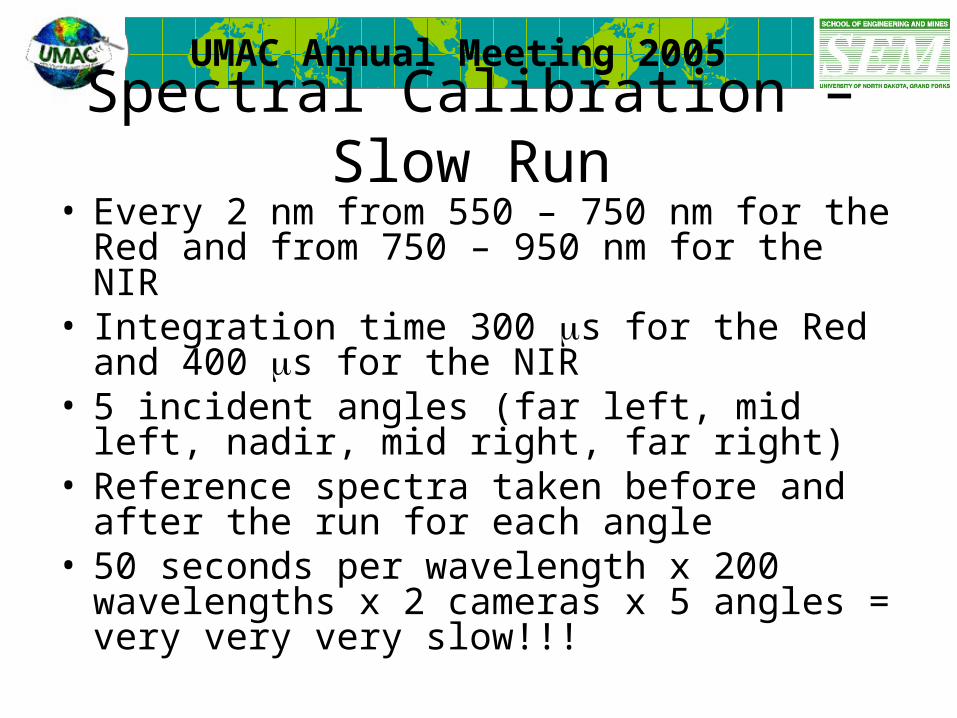
Spectral Calibration – Slow Run• Every 2 nm from 550 – 750 nm for the Red and
from 750 – 950 nm for the NIR• Integration time 300 s for the Red and 400 s
for the NIR• 5 incident angles (far left, mid left, nadir, mid
right, far right)• Reference spectra taken before and after the run
for each angle• 50 seconds per wavelength x 200 wavelengths x
2 cameras x 5 angles = very very very slow!!!

UMAC Annual Meeting 2005
LIGHT SOURCES(Tungsten Lamp, Glowbar)
MONOCHROMETERMAS SPECTROMETER
M3
M2
M4M1
Spectral Calibration Configuration
CHOPPER
FILTER WHEEL

UMAC Annual Meeting 2005
Spectral Calibration – Preliminary Results
0
64
128
192
256
550 600 650 700 750
array low end
array center
array low mid
array high end
array high mid
0
64
128
192
256
750 800 850 900 950
Array center
Array low end
Array low mid
array high end

UMAC Annual Meeting 2005
500 550 600 650 700 750 800 850 900 950 10000
0.1
0.2
0.3
0.4
0.5
0.6
0.7
0.8
0.9
1System Transmittance
Wavelength (nm)
Tra
nsm
ittan
ce
Red
NIR
500 600 700 800 900 1000 1100 12000
0.1
0.2
0.3
0.4
0.5
0.6
0.7
0.8
0.9
1Spectral Transmittance
Wavelength (nm)
Tra
nsm
ittan
ce
beamsplitter for red
beamsplitter for NIRred filter
NIR filter

UMAC Annual Meeting 2005
Spectral Calibration – preliminary conclusions
• Meets the requirement• Different spectral responses for different incident
angles (true for almost all flat filters, because travel distance of photons across the flat filter varies with incident angles)
• Non-symmetrical w.r.t. the optical axis (because long axis of the beam-splitter aligns with the CCD array
CCD Red
CCD NIR
Beamsplitter
UMAC Annual Meeting 2005
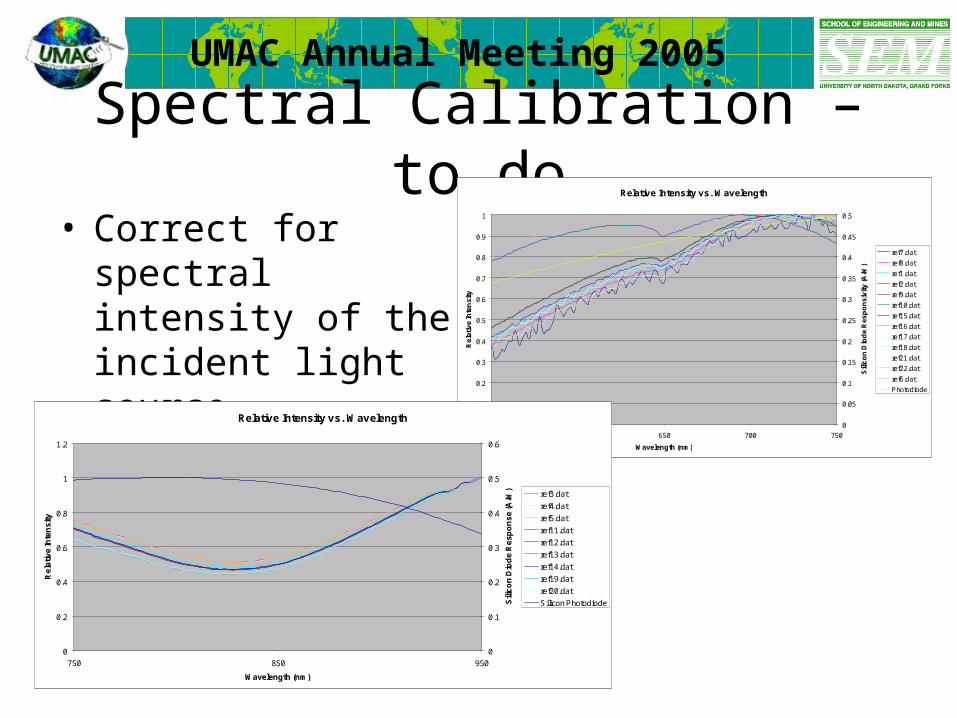
Spectral Calibration – to do• Correct for spectral
intensity of the incident light source
Relative Intensity vs. Wavelength
0
0.1
0.2
0.3
0.4
0.5
0.6
0.7
0.8
0.9
1
550 600 650 700 750
Wavelength (nm)
Re
lati
ve
Inte
ns
ity
0
0.05
0.1
0.15
0.2
0.25
0.3
0.35
0.4
0.45
0.5
Sili
co
n D
iod
e R
es
po
ns
ivit
y (
A/W
)
ref7.dat
ref8.dat
ref1.dat
ref2.dat
ref9.dat
ref10.dat
ref15.dat
ref16.dat
ref17.dat
ref18.dat
ref21.dat
ref22.dat
ref6.dat
Photodiode
Relative Intensity vs. Wavelength
0
0.2
0.4
0.6
0.8
1
1.2
750 850 950
Wavelength (nm)
Re
lati
ve
Inte
ns
ity
0
0.1
0.2
0.3
0.4
0.5
0.6
Sili
co
n D
iod
e R
es
po
ns
e (
A/W
) ref3.dat
ref4.dat
ref5.dat
ref11.dat
ref12.dat
ref13.dat
ref14.dat
ref19.dat
ref20.dat
Silicon Photodiode
UMAC Annual Meeting 2005
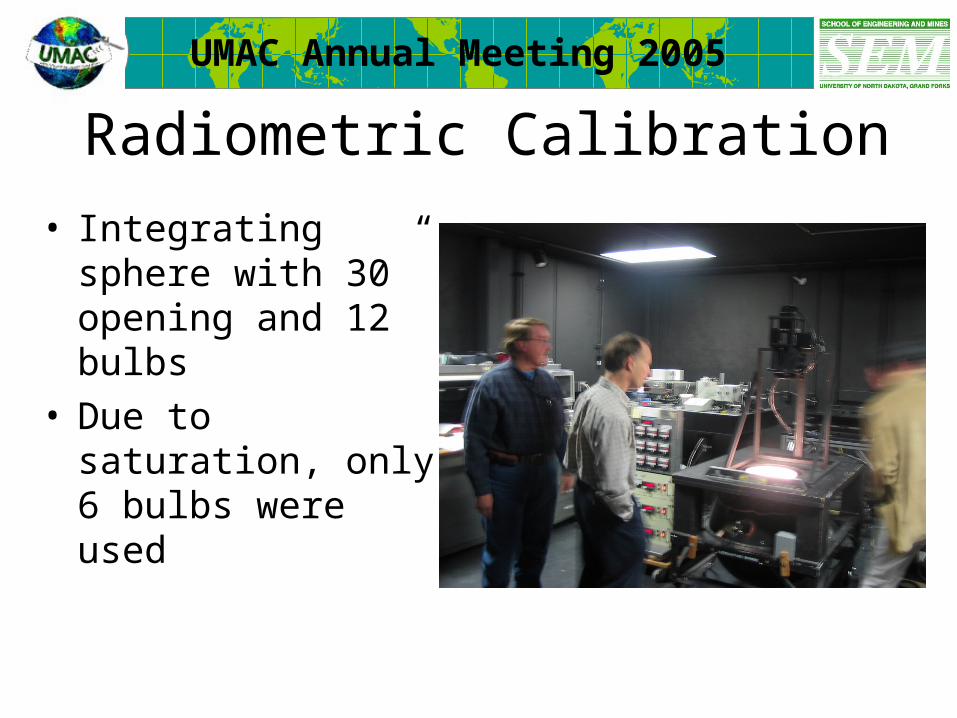
Radiometric Calibration
• Integrating sphere with 30” opening and 12 bulbs
• Due to saturation, only 6 bulbs were used

UMAC Annual Meeting 2005
Radiometric Calibration – Preliminary results and conclusions
Peak pixel value vs. #Bulbs
0
50
100
150
200
250
300
0 2 4 6 8
# Bulbs
Max
. pix
el v
alu
e
IR Camera
Red Camera
23
8

UMAC Annual Meeting 2005
Radiometric Calibration – Preliminary results and conclusions
CCD array center
Lens center
CCD center
Vignett effect, which need s to be corrrected

UMAC Annual Meeting 2005
Radiometric Calibration – to do
• Quantify the radiometric response in terms of radiance per digital count, using– Calibrated radiometric outputs of the
integrating sphere– Spectral responses of the AgCam system
• Pixel by pixel

UMAC Annual Meeting 2005
Thermal Effect• Temperature-
controllable chamber• Integrating
hemisphere with 20” opening
• T = 18C (site room temp), 30°C (normal temp at ISS), and 35°C (hot day at ISS)

UMAC Annual Meeting 2005
Thermal Effects – preliminary results
• The red camera is hotter than the NIR
• The camera temperatures are always ~10°C higher than ambient
• The camera temperatures increased rapidly during the 1st hour of operation (At the ambient temperature of 35C, they reached ~46C in about 50 minutes )
• At 18°C, the camera temperatures increased to 32°C during 4 hours.
Camera Temperature vs. Time
27.5
28
28.5
29
29.5
30
30.5
31
31.5
32
32.5
14:24:00 14:52:48 15:21:36 15:50:24 16:19:12 16:48:00 17:16:48 17:45:36 18:14:24 18:43:12
Time (HH:MM:SS)
Tem
per
atu
re (
C)
Camera 0
Camera 1
UMAC Annual Meeting 2005
Thermal Effects – Preliminary conclusions
• Don’t not operate the camera more than 1 hour.
UMAC Annual Meeting 2005
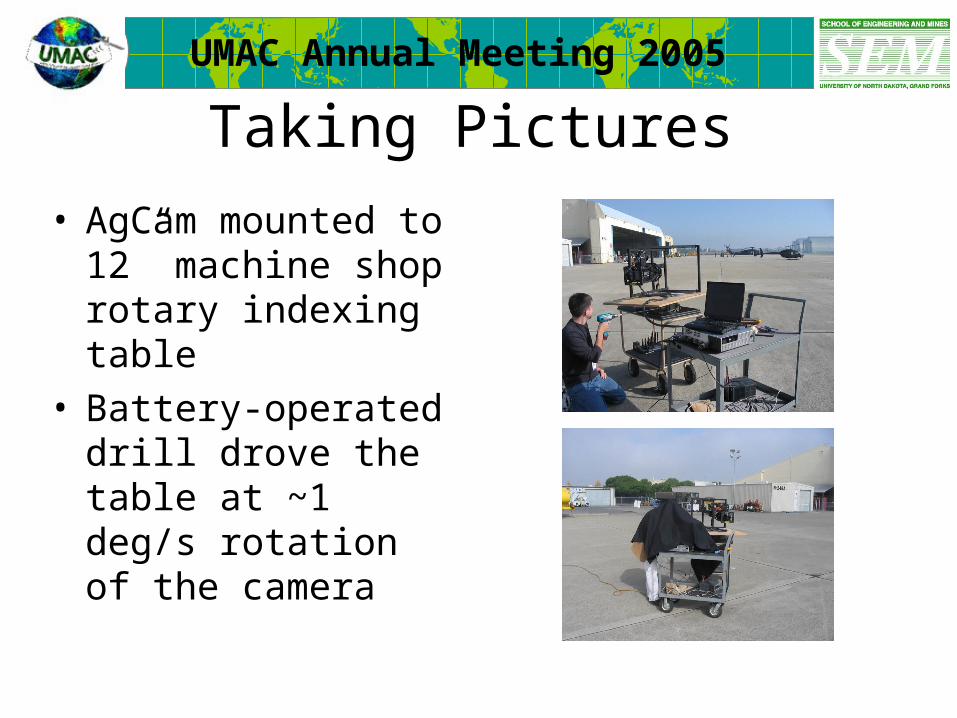
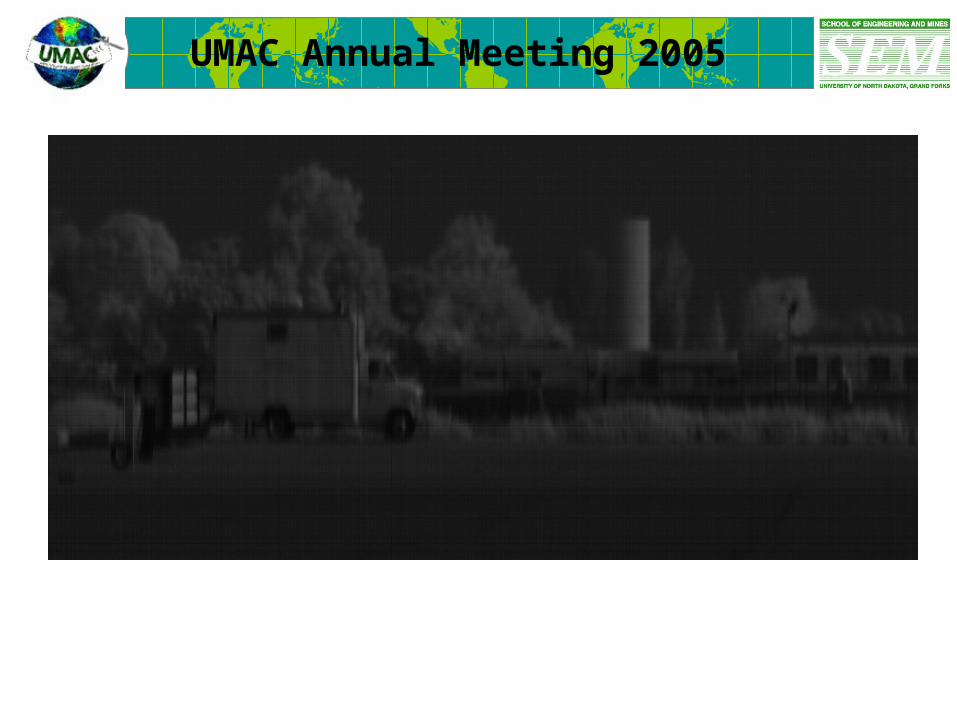
Taking Pictures
• AgCam mounted to 12” machine shop rotary indexing table
• Battery-operated drill drove the table at ~1 deg/s rotation of the camera

UMAC Annual Meeting 2005
UMAC Annual Meeting 2005