Against All Odds - baltercap.com · Against All Odds Hedge Fund Industry Developments and...
17
Against All Odds Hedge Fund Industry Developments and Implications for Growth August 2016 Prime Services Capital Solutions Hedge Fund Pulse For Institutional Investors Only Not For Redistribution This Document Is Not Research This Document Is Produced by Barclays Capital Solutions Group, Not Barclays Research Department This Document Does Not Constitute Legal, Business, Investment, Accounting or Tax Advice See Additional Disclaimer on Back Cover
Transcript of Against All Odds - baltercap.com · Against All Odds Hedge Fund Industry Developments and...
Against All OddsHedge Fund Industry Developments and Implications for Growth
August 2016
Prime ServicesCapital SolutionsHedge Fund Pulse
For Institutional Investors Only Not For Redistribution This Document Is Not Research This Document Is Produced by Barclays Capital Solutions Group, Not Barclays Research Department This Document Does Not Constitute Legal, Business, Investment, Accounting or Tax Advice See Additional Disclaimer on Back Cover

ContentsI. Study overview 2
II. Executive summary 3
III. HedgeFundperformanceandflows 4
IV. Investor sentiment 9
V. Looking ahead 12
VI. Key considerations 15
VII. Capital Solutions 15

I. Study overviewThe Hedge Fund (HF) industry has been under a substantial amountofpressureinthefirsthalfof2016duetoperceivedunderperformance and frequent industry news highlighting redemptionsfromlargeinstitutionalinvestors,highprofilehedge fund closings, and the constant push to drive fees lower. It is therefore an important time to take the pulse of investors to better understand how recent performance and news have affected their behavior, whether they are planning to redeem and, if not, which steps they are planning to take to make sure they are satisfiedwiththeirHFallocationgoingforward.
With this in mind, the Strategic Consulting team has sought to provide a mid-year analysis on the major developments in the HF industry with a view to assessing the evolving value proposition of HFs, key investor themes, and the asset raising landscape for 2016.Thethreemaintopicsaddressedinthisstudyare:
1. Hedge Fund performance
a. How have HFs performed in recent years on a beta-adjusted basis?
b. What drivers do investors attribute the industry’s relative underperformance to? Is there evidence to support their hypotheses?
c. Is the HF industry too big?
d. How have macro factors impacted the industry’s ability to generate alpha?
2. Investor sentiment
a. Has recent HF performance disappointed investors’ expectations? What steps, if any, are investors planning to take as a result?
b. Have HFs been additive to investors’ portfolios in recent years?
c. How are investors responding to performance challenges in their interactions with HFs?
d. How do investors now perceive different types of HF managers?
3. Looking ahead
a. How do we expect recent events to impact HF launches andliquidationsin2016?
b. What are our expectations for the industry size going forward? How much of the change do we expect to come fromperformanceversusflows?
c. What HF strategies are investors most keen on increasing / decreasing allocations to?
MethodologyTheteamprimarilyusedfivedifferentsourcestoensuredepthandbreadthofdataforouranalyses:
1. Conductedasurveyin2Q16of340investorswith~$8tnintotal AUM
2. Analyzed Equity HF data sourced from Novus1
a. ReturnsandAUMsof>800EquityHFmanagersfrom >60countries
b. >100kpositions,totalingto~$1.7trillionofmarketvalue
3. Reliedextensivelyonexternaldataandresearch,including:
a. Datafrommorethan50differentresearchpublicationsand academic research papers
b. ~10,000datapointsonHFreturns(HFRdatabase)
4. EstablishedongoingdialoguewithHFmanagers/investorsincoordination with the Barclays Capital Solutions team
5. Utilized prior Strategic Consulting studies, including ‘Bracing for Impact’, ‘Coming to Terms’, and ‘Mind the Gap’
Figure1showsthedistributionofthe340investorswhoparticipated in this study along four dimensions – investor type, amount of investor portfolio assets under management (AUM), experienceinvestinginHFs,andinvestorlocation.Selecthighlights:
• Theinvestorfirmsinourstudyrepresentapproximately $7.7trillionintotalAUMandabout$900billioninHFAUM,~30%oftheHFindustry.Theinvestorshaddiversebackgroundsas~45%oftherespondentswereinstitutional,(i.e.,Pensions,Insurance Companies, Endowments & Foundations (E&Fs), and theirinvestmentconsultants/advisors).Another~24%ofthesampleconsistedofprivateinvestors(FamilyOfficesandPrivateBanks/WealthManagers)and~21%wereFundofHedgeFunds(FoHFs).Theremainder(11%)includedManagedAccountPlatforms (MAP), Outsourced CIOs, Sovereign Wealth Funds (SWFs), etc.
• These investors were well distributed across total AUM size categories,asinvestorswithlessthan$1bninAUMandthosewith$1–$5bneachrepresented~25%oftherespondents,thosebetween$5and$30bnrepresented~35%,andthebalance,thosewithmorethan$30bninAUM,representedtheremaining~15%.WithregardtotheirexperienceinvestinginHFs,theinvestorsindicatedasignificantskewtowardbeingmoreexperienced–thosewithmorethan10yearsofexperience investing in HFs represented almost two-thirds oftherespondentsandthosewithbetweenfiveand10yearswere almost one-quarter, leaving the most inexperienced HF investorsasonly12%ofourrespondents.Thegeographicalbreakdown shows that a vast majority is based in North America(73%),while21%arebasedinEurope,andonly6%are from the “rest of the world” (ROW).
• We believe our investor sample provides a good representation of the underlying HF investor universe with one important caveat. Given that this is a select group of individuals (and organizations) that chose to share their views on the HF industry, we believe they may be more knowledgeable about HFs (as can be seen by their collective experience investing in HFs), may have higher current allocations to HFs than their peers, and are more likely to be invested directly into HFs rather than through FoHFs. This also makes it potentially more bullish on HFs, in our opinion.
2 | For institutional and professional investors only. For information purposes only. Not for further distribution or distribution to retail investors.
1.Novusisaserviceprovider(unaffiliatedwithBarclays)thatprovidesindustryintelligencetoinstitutionalinvestorsandassetmanagers

II. Executive summaryThefollowingarehighleveltakeawaysfromthestudy:
HF performance • Although HFs have produced considerable excess returns
since1993,suchlevelshavebyandlargeplateauedsince2011,which may be at least partially due to managers’ reducing their risk appetite.
• However, survey respondents indicated that they believe the size of the industry and macro conditions are more likely the reasons for recent HF underperformance.
• With regard to the size of the industry, across various strategies, the Compound Annual Growth Rate (CAGR) over thepastsixyearsforHFs’AUMwasbetween9%and12%,with a majority of the growth driven by an increase in average fund size as opposed to an increase in the number of funds.
• Yettheglobalstockoffinancialassetshasreached~$305tnbyYE2015,whichmeansthatHFassetsstillaccountforonly1%of total assets – suggesting the size of the industry probably is not the issue, whereas the size of individual HFs may be.
• Some of this underperformance by the largest managers may be attributable to the rise in crowded trades, which has increased substantially in recent years.
• Furthermore,fromthesecondhalfof2015onward,weobserved considerable underperformance on the part of larger funds relative to smaller funds, a phenomenon that affected all strategies to varying extents.
• Macro conditions appear to have aligned against HFs in recent times, as intra-stock correlation and dispersion have been at disadvantageous levels – making it challenging for HFs to produce alpha.
Investor sentiment • More than half of the investors we surveyed recently indicated
that HFs did not meet their expectations over the last couple of years.
• However, despite recent press to the contrary, the vast majority of investors we surveyed indicated that they are not pulling back wholesale from their HF allocations.
• The commitment to HFs can at least partially be explained by the positive attribution HFs seem to offer after combining their risk-adjusted returns with their low correlation to indices.
• Furthermore, it appears that HFs are mitigating further underperformance by securing discounts, especially to management fees, though performance fees are discounted as well, particularly by strategies without capacity issues / netting risk.
• Investors appear keen on increasing allocations to small and newmanagersinsearchofbetterreturnsandmoreflexibilityon fees and terms.
Looking ahead • WeexpectHFliquidationsin2016toriseto12%fromarecent
historicalaverageof10%,giventheperformancechallengesof2015andearly2016.
• Additionally,if2016HFperformancecontinuesat,orfallsbelow,theannualized1Q16/2H15levels,theindustrymayfaceareductioninAUMasnetnewflowsareunlikelytobeadditive.
• Based on investor input, we expect Systematic / Commodity Trading Advisors (CTA), Quant Equity, Distressed Credit, and Equity Market Neutral strategies to attract investor interest and allocationsoverthenext6to12months.
• Conversely, Event Driven and Equity Long / Short strategies appear to be the least in favor among investors at the mid-year.
FIGURE 1: Survey Respondents – Investors
Respondents Profile
Note: The results presented are from a relatively small number of respondents and therefore are indicative only and not meant to reflect conclusive industry trends. Data and other information presented are derived directly from respondents and we cannot confirm the accuracy of such information. All figures refer to Barclays Strategic Consulting analysis
Σ=340Investors
By Investor Portfolio AUM By Investor Location
Σ=~$7.7tnTotal AUM
By Investor HF Experience
30 2613
39 3866
18
73
37
PublicPension
PrivatePension
Insurance E&F Consultant FamilyOffice
PrivateBank
FoHF Other
9%
44%Institutional
24%Private
21%FoHF
11%Other
8% 4% 11% 11%19%
5%21%
11%
NorthAmerica
Europe Rest ofWorld
246
7321
73%
21% 6%<$1bn $1 – $5bn $5 – $30bn $30bn+
86 83
118
53
25% 24%35%
16%
<5 Yrs 5 – 10 Yrs 10 Yrs+
4083
217
12% 24%
64%
CapitalSolutions–HedgeFundPulse,August2016| 3

III. Hedge Fund performance and flows
HF performance – Excess returnsWhen we discuss HF performance, the most important criterion is generally the alpha generated by HF managers (i.e., excess returns beyond what is attributable to beta or exposure to a market benchmark).Welookedatalphaacrossseveraldifferentlenses,thefirstof which can be seen in Figure 2. In this chart, we regressed monthly HF returns against key market indices (a proxy for beta) from 1993 to May 2016(includingS&P500forEquityHedgeandEventDriven,BarclaysAgg for Macro, and Barclays HY Index for Fixed Income Relative Value
(FIRV)) and then we aggregated the excess returns on a monthly basis andshowedtheresultsona36-monthrollingbasis.Itshowsusthatfrom1993–May2016,HFsproducedcumulatively~134%ofalpha.However,peakcumulativealphaovertheperiodwas139%,achievedin2011,whichsuggeststhatinthelastalmost4.5years,HFsactuallygeneratednegativecumulativealpha.Morespecifically,theaveragemonthlyalphahasdeclinedto-0.07%(annualized~0.8%)from2011toMay2016comparedtoanaverageof+0.48%(-5.9%annualized)fortheentireperiodanalyzed(1993toMay2016).
FIGURE 2: HF Performance – Excess Returns (I / III)
Cumulative HF Alpha / Excess Returns (1993 – May 2016)1
1. HFR, S&P 500, Barclays Strategic Consulting analysis. Performance is calculated net of different exposures; Between 1993 – May 2016 exposures were: 0.21 to S&P 500, (0.08) to Barclays Aggregate and 0.30 to Barclays HY Index
0%
25%
19931995
19971999
20012003
20052007
20092011 2013
2015
50%
75%
100%
125%
150% Peak cumulative alpha: 139%
FIGURE 3: HF Performance – Excess Returns (II / III)
HF 36-Month Trailing Excess Returns and Standard Deviation (1993 – May 2016)1
1. HFR, S&P 500, Barclays Strategic Consulting analysis. Performance is calculated net of different exposures; Between 1993 – May 2016 exposures were: 0.21 to S&P 500, (0.08) to Barclays Agg and 0.30 to Barclays HY Index; Risk is standard deviation of 36-month rolling Alpha
(0.5%)
0.0%
0.5%
1.0%
1.5%
0.0% 0.5% 1.0% 1.5% 2.0%
Standard Deviation of 36-Month Trailing Excess Returns
Ave
rage
36-
Mon
th T
raili
ng
Exce
ss R
etur
ns (
Mon
thly
) Early tomid 1990s
Dot combubble
Early to mid 2000s
Financial crisis and recovery
Recent 5 years
’93 – ’98 ’99 – ’02 ’03 – ’07 ’08 – ’11 ’12 – ’16
4| For institutional and professional investors only. For information purposes only. Not for further distribution or distribution to retail investors.

The next lens we used to evaluate HF alpha was to compare the risk and returns of HFs from the same time frame. Figure 3 illustratestherelationshipbetweenthe36-monthtrailingexcessreturnsversusthe36-monthstandarddeviationsofthosereturns(we use this as a proxy for risk) over various market cycles (i.e., ’93–’98,’99–’02,’03–’07,’08–’11,’12–’16).Aswelookedat the various market cycles we found an interesting ‘pattern’ in the relationship between risk and returns. If you exclude the firstmarketcycleintheearlytomid’90s,whenHFswereabletogeneratesignificantexcessreturnsquitesteadily,thereisaclear relationship between the excess return HFs generate and the standard deviation of those returns, a measure of the ‘active risk’ taken by HFs. Since 1993, average excess returns have been decreasing rather steadily, while risk has gone up / down over the variousperiods–inthelastcycle,startingin2011,riskhasgonedown to its lowest levels, which may help explain / contribute to the industry’s recent underperformance.
Thefinallensweusedisavariationontheprioranalyses,onlynow we are comparing the excess returns across HF strategies. Figure4showstheregressionofmonthlyHFreturnsbystrategyagainst the same key market indices used previously. The results tell two distinct stories. The annualized excess returns across all strategiesfrom1993to2011wererobust.Sincethen,however,excess returns across all strategies have declined. The results are particularly striking for Equity Hedge and Event Driven strategies,whichprovidedinvestors810bpsand660bpsofalpharespectively in the earlier period while they created negative annualizedexcessreturnsfrom2011–May2016(i.e.,EquityHedgegenerated-200bpsofalphaandEventDriven-80bps).
Drivers of recent HF underperformanceRegardless of the way we analyzed recent HF performance, it appears that HFs have been underperforming lately. Let’s then turn to the question of why that is the case, a question we posed to our investors. Figure 5 shows that the most common driver perceived to adversely impact recent HF performance (chosen byalmost75%ofinvestors)hasbeenthattheHFindustryhas become too big relative to the opportunities available. Morethanhalfofrespondents(57%)indicatedthatmacroconditions (e.g., political, central bank, etc.) have contributed to the underperformance. The balance of factors (i.e., changes to market behavior, ‘high’ fees, ‘other’) suggest that there are many other perceived explanations for the poor results, though these are much less widely held. One of the key considerations when discussing underperformance of HFs is the reference point for investors’ expectations. As one of the investors we interviewed mentioned, the HF market has changed considerably (e.g., new regulations, monetary intervention, increased operational burden, etc.) and it might make sense to change the expectations of HFs commensurately. While this will not relieve HF managers from the pressure of pushing fees down for instance, it might change the conversation with investors regarding what the objectives / expectations of an allocation should be.
FIGURE 4: HF Performance – Excess Returns (III / III)
Average Excess Return by HF Strategy (1993 – May 2016)1
1. HFR, Barclays Strategic Consulting analysis. Performance is calculated net of different exposures; Between 1993 – May 2016 exposures were; Equity Hedge (0.45 to S&P 500), Relative Value (0.31 to Barclays Global HY and (0.05) to Barclays Aggregate), Event Driven (0.16 to the S&P 500 and 0.35 to Barclays Global HY) and Macro (0.33 to Barclays Agg)
(0.25%)
0.25%
0.75%
1.25%
1.75%
1993
1994
1995
1996
1997
1998
1999
2000
2001
2002
2003
2004
2005
2006
2007
2008
2009
2010
2011
2012
2013
2014
2015
2016
Cumulative(1993 – 2011)
EH
ED
Macro
FIRV
810 (200)
660 (80)
210 70
250 200
(1010 bps)
(740 bps)
(140 bps)
(50 bps)
Annualized Excess Return (bps)
36-M
onth
Rol
ling
Mon
thly
Exc
ess
Retu
rns
4.5-Year(2011 – May 2016)
CapitalSolutions–HedgeFundPulse,August2016| 5

FIGURE 5: Drivers of Recent HF Underperformance
Source: Barclays Strategic Consulting analysis
Drivers of Recent HF Underperformance
The size of the industry and macro conditions are the most often-cited reasons by investors for recent HF underperformance
Drivers of Poor Performance Illustrative Investor Quotes
57%
74%HF industry is too bigrelative to opportunities
Fees are too highrelative to returns 5%
26%
Market behaviorhas changed
37%
Macro conditions
Other
Q: What do you think are the main reasons why HFs, on average, haveunderperformed relative to investor expectations recently? (Select all that apply)
“Best practices have become widely followed reducing historicalpha opportunities.” – $30bn+ FoHF
“Systematic / quant managers with tons of data are starting to be better positioned than typical fundamental HFs.” – $2bn+ Family Office
“Fees are too high relative to risk free rates and return expectations.” – $30bn+ Endowment
“Investor expectations are still rooted in historically extraordinary returns for HFs from the 1990s to early 2000s; if we can barely sustain beta returns without unprecedented monetary (and soon, fiscal) intervention, while insisting on increasing regulatory and operational burdens (and costs), alpha expectations will suffer.” – $20bn Private Pension
HF AUM growth Regarding the most common driver referenced above, ‘the HF industry has become too big relative to the opportunities available’, we decided to evaluate how the HF industry has grown. Figure6showsusthattheoverallCAGRforHFAUMfrom2009–2015was10%andthattheindividualstrategycomponentseachwentupbybetween9%and12%.Acrossthevariousstrategies,it appears that, on average, asset growth in the individual funds account for two-thirds of the overall growth by strategy while the number of new funds accounts for only one-third. This suggests that, on average, HFs are growing their AUM quite considerably and that the bigger HFs are in fact getting bigger.
DespitetheHFindustry’ssignificantgrowthsince2009,itisstillverysmallrelativetothepoolofglobalfinancialassets.Figure7 showsthattheestimatedvalueofallfinancialassetsin2015was$305tnandthatHFsat$2.9tnaccountforjustunder1%ofthetotal.AlthoughovertheperiodHFshadaCAGRof~10%theyonlyincreasedtheirportionofthepoolbyabout300bps,from0.7%to1%.Furthermore,PublicEquitiesandPublicDebthadCAGRsof7.5%and6.6%versus4%forallfinancialassetsandthereforedid a much better job of keeping pace with the growth in HFs. This suggests that the issue is likely not the growth in size of the overall HF industry, as there appears to be an ample supply of assets. The issue may be, however, the growth in size of many individual HFs, which are pursuing similar strategies leading to crowding.
FIGURE 6: HF AUM by Strategy
Source: HFR; Barclays Strategic Consulting analysis
AUM Growth by Strategy ($bn)
OverallCAGR
506 571 552 598 734 789 829
414497 499 558
698 754 745289
381 443488
512542 550
391
469 514609
684760 773
2009 2010 2011 2012 2013 2014 2015
+12%
+11%
+10%
+9%
CAGR AvgFund AUM
7.3%
7.4%
7.5%
5.0%
1,600
1,918 2,0082,253
2,6282,845 2,897 ~10% 6.6%
+≈
Equity Hedge
Event Driven
Macro
FIRV
~2.0x
CAGR# of Funds
4.4%
3.7%
2.6%
3.4%
3.5%
1.7x
2.0x
3.0x
1.5x
6| For institutional and professional investors only. For information purposes only. Not for further distribution or distribution to retail investors.

Position crowding While there are many advantages that larger HFs have (e.g., access to talent, institutional infrastructure, etc.), there are also several drawbacks. One such drawback is that as HFs become larger, their investable universe can often be diminished (e.g., due to position limits) as it is often not ‘worth it’ to invest in smaller situations that can hardly move the PnL needle. Figure 8illustrateshowsincethemiddleof2012positioncrowdinginUSEquitieshasincreasedsignificantly–risingfrom2.2%at3Q12to5.2%in3Q15.Historically,investingincrowdednameshas generated positive returns, particularly in stable, rising markets. However, when the reverse happens, it tends to be
sharp and painful. The reverse, in this case, started in 3Q15, with indicescomposedofcrowdednamesdroppingsignificantly.Wediscussedthisphenomenoninourrecentpiece‘HangingTough:Landscape and Recent Developments in Event Driven Strategies’.
What is worthwhile to mention here is how this coincides with asignificantunderperformanceoflargerfunds,evidentinthedifference between the 12-month rolling returns of the HFRI Fund Weighted (i.e., equally-weighting all funds) and Asset Weighted (e.g., all funds are not counted equally) indices. In Figure 9, we canseethatfromJuly2011throughJuly2015theresultswerevariableandinconsistent,whereassinceJuly2015thepatternseems to be much clearer and it appears to be trending down
1. Business Insider, ‘The $64 trillion question: Convergence in asset management,’ McKinsey & Company; Barclays Strategic Consulting Analysis; 2. HFR
FIGURE 7: AUM Growth – Global Financial Assets vs. HFs
Global Financial Assets ($tn)1
Outstanding Loans (Non-Securitized)Outstanding Loans (Securitized)
Corporate Bonds (Non Financial)
Corporate Bonds (Financial Institutions)
Public Debt
Public Equities 20% 21% 18% 19% 22% 23% 24%17% 18% 20% 20%
20% 20% 20%24% 23% 23% 22%
21% 20% 20%11% 10% 11% 11% 11% 11% 11%6% 6% 5%
5% 5% 5%22%
22% 23% 22%21% 21% 21%
2009 2010 2011 2012 2013 2014E 2015E
243259 261 272 285 294 305
CAGR
2.7%
(0.3%)2.9%
0.6%
6.6%
7.5%
1.6 1.9 2.0 2.3 2.6 2.8 2.9HFs2
0.7% 0.7% 0.8% 0.8% 0.9% 1.0% 1.0%
10.4%
HF AUM as a % of Global Assets
6%
3.8%
Source: Novus, Barclays Strategic Consulting analysis
FIGURE 8: Position Crowding in US Equities
Novus ‘Crowdedness’ Portfolio as a % of Hedge Fund Universe, 3Q12 – 3Q15
2.2%2.4%
1.9%
2.3%
3.1%2.8%
3.7%3.9%
2.8%3.2%
3.6%
5.1% 5.2%
3Q12 4Q12 1Q13 2Q13 3Q13 4Q13 1Q14 2Q14 3Q14 4Q14 1Q15 2Q15 3Q15
CapitalSolutions–HedgeFundPulse,August2016|7
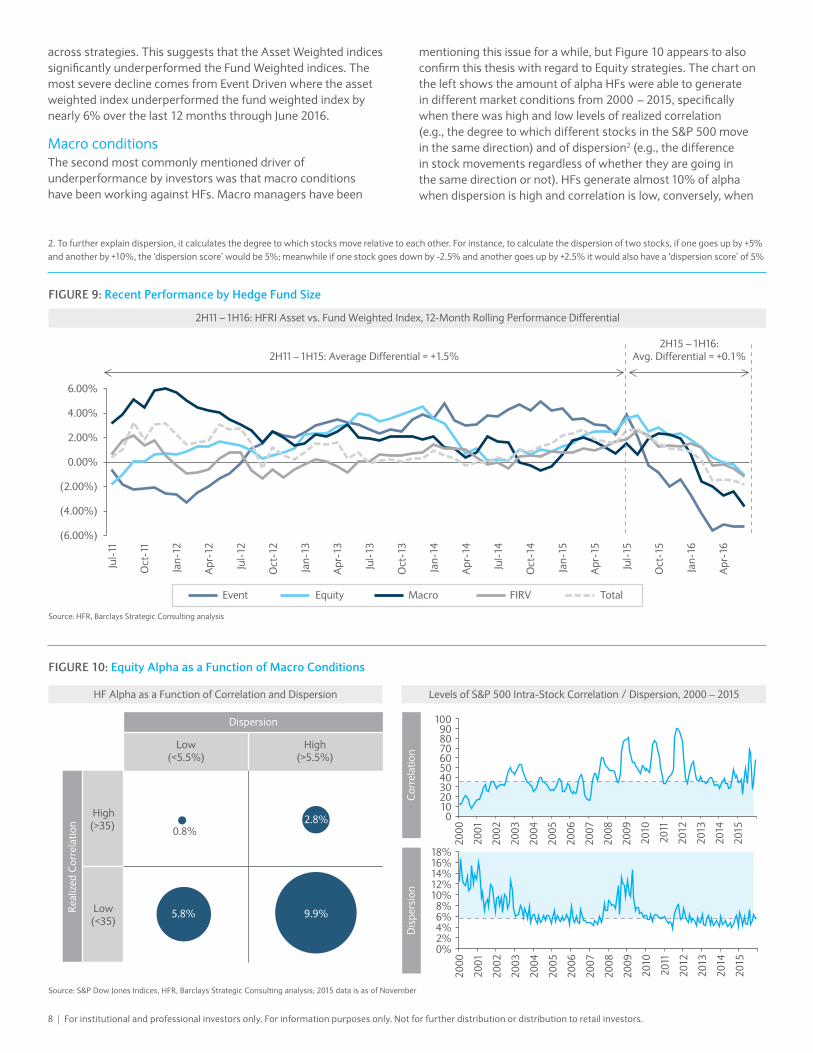
across strategies. This suggests that the Asset Weighted indices significantlyunderperformedtheFundWeightedindices.Themost severe decline comes from Event Driven where the asset weighted index underperformed the fund weighted index by nearly6%overthelast12monthsthroughJune2016.
Macro conditions The second most commonly mentioned driver of underperformance by investors was that macro conditions have been working against HFs. Macro managers have been
mentioningthisissueforawhile,butFigure10appearstoalsoconfirmthisthesiswithregardtoEquitystrategies.Thechartonthe left shows the amount of alpha HFs were able to generate indifferentmarketconditionsfrom2000–2015,specificallywhen there was high and low levels of realized correlation (e.g.,thedegreetowhichdifferentstocksintheS&P500movein the same direction) and of dispersion2 (e.g., the difference in stock movements regardless of whether they are going in thesamedirectionornot).HFsgeneratealmost10%ofalphawhen dispersion is high and correlation is low, conversely, when
FIGURE 10: Equity Alpha as a Function of Macro Conditions
Source: S&P Dow Jones Indices, HFR, Barclays Strategic Consulting analysis; 2015 data is as of November
HF Alpha as a Function of Correlation and Dispersion Levels of S&P 500 Intra-Stock Correlation / Dispersion, 2000 – 2015
Dispersion
Low(<5.5%)
High(>5.5%)
Real
ized
Cor
rela
tion
High(>35) 0.8%
2.8%
Low(<35)
5.8% 9.9%
Dis
pers
ion
Cor
rela
tion
0102030405060708090
100
2000
2001
2002
2003
2004
2005
2006
2007
2008
2009
2010
2011
2012
2013
2014
2015
0%2%4%6%8%
10%12%14%16%18%
2000
2001
2002
2003
2004
2005
2006
2007
2008
2009
2010
2011
2012
2013
2014
2015
2.Tofurtherexplaindispersion,itcalculatesthedegreetowhichstocksmoverelativetoeachother.Forinstance,tocalculatethedispersionoftwostocks,ifonegoesupby+5%andanotherby+10%,the‘dispersionscore’wouldbe5%;meanwhileifonestockgoesdownby-2.5%andanothergoesupby+2.5%itwouldalsohavea‘dispersionscore’of5%
Source: HFR, Barclays Strategic Consulting analysis
FIGURE 9: Recent Performance by Hedge Fund Size
2H11 – 1H16: HFRI Asset vs. Fund Weighted Index, 12-Month Rolling Performance Differential
(6.00%)
(4.00%)
(2.00%)
0.00%
2.00%
4.00%
6.00%
Jul-
11
Oct
-11
Jan-
12
Apr
-12
Jul-
12
Oct
-12
Jan-
13
Apr
-13
Jul-
13
Oct
-13
Jan-
14
Apr
-14
Jul-
14
Oct
-14
Jan-
15
Apr
-15
Jul-
15
Oct
-15
Jan-
16
Apr
-16
Event Equity Macro FIRV Total
2H11 – 1H15: Average Differential = +1.5%2H15 – 1H16:
Avg. Differential = +0.1%
8| For institutional and professional investors only. For information purposes only. Not for further distribution or distribution to retail investors.

dispersionislowandcorrelationishighHFsonlygenerate0.8%of alpha. The charts on the right show how correlation and dispersion have moved over time and it appears that we have been experiencing an adverse scenario for HFs over the last two years or so – high correlation and low dispersion.
Thus, it is apparent that the respondents in our survey have a pretty clear grasp of the issues facing HFs as there appears to be evidence behind the two common causes of the recent underperformance cited by investors.
IV. Investor sentiment In the second section of this study, we endeavor to understand how recent HF performance has affected investors’ general perceptions of HFs. We take a look at how investors’ perceptions of HF performance aligned with their expectations, what their allocation plans may be, what the portfolio effects have been from recent HF performance, how investor sentiment toward new and small HF managers has changed, and the importance of manager selection.
FIGURE 11: HF Performance vs. Investor Expectations
Investor Perception of Recent HF Performance
Recent HF Performance Relative to Expectations Recent HF Performance Relative to Expectations by Investor Type
Source: All figures refer to Barclays Strategic Consulting analysis collected in May 2016
60%
Q: Do you feel that Hedge Funds in your portfolio have met your expectations in the last couple of years (2014 – YTD 2016)?
24%
Unsure / Undecided
Yes or Mostly Yes
No or Mostly No 61%
15%
PublicPension
Insurance E&F PrivateBank
FamilyOffice
30%
10%
PrivatePension
58%
31%
11%
54%
8%
38%
77%
13%
10%
61%
22%
17%
62%
23%
15%
FIGURE 12: Investor Allocation Plans
Investor Planned Changes to Portfolio
Investor Planned Changes in Response to HF Performance Planned Reallocations
Source: Barclays Strategic Consulting analysis
Other 2%
Increasing allocations to HFs but keeping # of HFs steady
6%
Reducing HF allocation 19%
Seeking fee discounts from allocated HFs
26%
Not taking any specific steps – Performance in line w/ long-term view 31%
Redeeming and Reallocating to other HFs 46%
Q: What steps, if any, have you taken or are planning to take in response to the performance of HFs in your portfolio recently? (Select all that apply)
3%
3%
Other 2%
Private Credit
HF Replication
Long Fixed Income
Commodities
7%
6%
6%Venture Capital
Private Equity 17%
Real Estate 10%
Cash 10%
Long Equity 9%
Real Assets 8%
Q: If reducing overall HF allocations, where are you increasing allocations? (Select all that apply)
CapitalSolutions–HedgeFundPulse,August2016| 9

HF performance vs. investor expectations We began by asking investors how their HF portfolios performed relative to their expectations over the last two years. The overall sentiment (shown in the left chart of Figure 11) appears tobefairlynegativeasmorethan60%ofourrespondentsindicated that HFs did not meet their performance expectations. Conversely, about a quarter of the investors indicated that HFs had at least mostly met their expectations. E&Fs and Family Officesappeartobethemostdissatisfiedchannel,whilePrivatePensionsarethemostsatisfied,with31%ofthemstatingthatHFshavemettheirexpectations.Thisisnotasurprisingresult:E&FsandFamilyOfficesgenerallyhavehigherreturntargetsfortheirallocations compared to pensions and also a stronger preference for equity strategies, which have recently disappointed.
Investor allocation plansAs a result of the general perceptions of underperformance by our respondents and the recent press3 concerning large-scale redemptions by pensions, we wanted to understand what our broad set of surveyed investors plan to do regarding their allocation plans toHFs.ThelefthandsideofFigure12showsthatlessthan20%indicated an intention to reduce their allocations to HFs. However, HFs should not take that as a sign that the status quo will remain. For instance, almost half of respondents indicated that they plan to redeem from poor performing HFs and reallocate to strong performers,whileanother~25%ofrespondentsindicatedtheywillseek discounts from the HFs they are currently allocated to – about halfofthepublicpensionsand40%ofFoHFsplantoseekfeediscounts. Among investors who plan to reduce allocations to HFs (see right hand side of Figure 12), illiquid alternatives seem a popular investmentalternative,with~20%planningtoallocatemoretoPrivateEquityand~10%planningtoallocatemoretoRealEstate.Thenext most popular response regarding allocation plans was Cash,
which could be a hedge against recent volatility in order to make a more strategic allocation in the future when markets settle down.
There are various reasons why investors are still by and large faithful to Hedge Funds, even if they are disappointed by their recent performance. One of the most important reasons is thatitisdifficulttofindanalternativewithsimilarrisk/returncharacteristics. And when the risk-adjusted returns are combined with the low correlation they tend to have, the impact on investors’ portfolios tend to be positive. Indeed, according to our analysis in Figure13,amajority(55%)ofHFs,eveninayearlike2015whereHFs did not perform particularly well, would have been additive and improvedtheefficientfrontierofthe60/40portfolio.Thuswhileperformance may have seemed poor on a stand-alone basis, there appears to be a role for HFs in investors’ portfolios.
Headline fees and discountsAs discussed, the majority of investors do not plan to reduce their allocations to HFs. What they want to do, however, is take some actions to make sure their allocations deliver on their objectives. One of the most popular actions is to seek out fee discounts from HF managers. Indeed, the depth of discounting that goes on for bothmanagementfees(leftchartinFigure14)andperformancefees(rightchartinFigure14)isquitesignificant.Thesefiguresdepicttheaveragemanager’s(bystrategyinoursample)flagshipheadline management and performance fees, the lowest average discounted fees paid by investors and, as the difference of the two, the maximum discount4 granted. When it comes to management fees, the largest discounts are happening in the Systematic space, mainly driven by competition from less expensive products such as ‘trend following’ and ‘alternative beta’. Performance fees tell adifferentstory:performancefeediscountsaremorecommonin strategies with less capacity issues / netting risk (e.g., Macro, Equity L / S), whereas strategies that are more likely to be sought
FIGURE 13: Portfolio Effects of HF Performance
2015 HF Performance vs. Passive Indices and Efficient Frontier Improvement1
Source: HFR, Barclays Strategic Consulting analysis; 1. Fund judged to improve efficient frontier of a passive 60 / 40 portfolio of S&P500 and Barclays US Agg if: Sharpe of fund > (Sharpe of 60 / 40 portfolio * correlation between fund and 60 / 40 portfolio); Data as of Q315
(40%)
(30%)
(20%)
(10%)
0%
10%
20%
30%
40%
0% 10% 20% 30%
Ann
ualiz
ed R
etur
ns
Annualized Volatility EF Improvement
55% Yes
45% No
SPX Barc US Agg 60 / 40 Increase EF Decrease EF
3.RecentexamplesofpressannouncementsrelatedtoHFredemptionplans:NYCERS–April14,2016;AIG–May3,2016;Metlife–May5,2016
4.Maximumdiscountreferstothedifferencebetweentheheadlinerateandthelowestmgmt/perffeepaidbyanexternalinvestorinaflagshipfundorinanSMA/FOO(comparabletoaflagshipfund)
10| For institutional and professional investors only. For information purposes only. Not for further distribution or distribution to retail investors.

after / capacity constrained (as some systematic managers are) or have netting risk associated with them (many Multi-strategy HFs) have higher headline performance fees and lower discounts, on average.
HF manager selectionBeyond fee negotiation, the other important lever investors are using to adjust their HF allocation is manager selection. Based on conversations with investors, we developed an HF segmentation matrixbasedonHFfirmsize(proxyforscale)andperformance(proxy for manager skill), shown in Figure 15. We believe that investors increasingly view HFs in these four broad categories andtheyareinterestedininvestinginonlythreeofthem:
• All Stars – They are the ‘holy grail’ of HFs. These managers usually have a long track record of strong performance (hence relatively few in number) and are often capacity constrained, collectively means they can charge high fees. The culture / incentivestructuresatthesefirmsareintegralcomponentstopostingconsistentpositivereturns.Thesefirmscanandoften do adopt a ‘take it or leave it’ attitude toward investors.
• Solution Providers – These managers typically have multiple products with good (but not great) performance, and they often leverage their scale to drive innovation through product development. They can offer holistic portfolio solutions to theirinvestorsacrossassetclasses.Theyareusuallyflexibleon
FIGURE 14: Headline Fees and Discounts
Headline Fees and Average Maximum Discounts1 Offered for Flagship Fund (or Comparable Managed Account)
Note: The results presented are from a relatively small number of respondents and therefore are indicative only and not meant to reflect conclusive industry trends. Data and other information presented are�derived directly from respondents and we cannot confirm�the accuracy of such information. All figures refer to Barclays Strategic Consulting analysis 1. Maximum discount refers to the difference between the headline rate and the lowest mgmt / perf fee paid by an external investor in a flagship fund or in an SMA / FOO (comparable to a flagship fund)
Headline and Discounted Management Fees Headline and Discounted Performance Fees
Equity
1.01%
1.55%
54 bps
Credit /FIRV
1.09%
1.65%
56 bps
Systematic /Vol
0.77%
1.82%
105 bps
Macro
1.01%
1.65%
64 bps
Multi-strat
1.02%
1.77%
75 bps
Macro12.7%
19.2%
6.5%
Credit /FIRV
13.8%
18.8%
5.0%
Systematic /Vol
17.0%
20.5%
3.5%
Equity
13.1%
18.6%
5.5%
Multi-strat
16.2%
20.3%
4.2%
Q: What is the lowest mgmt fee paid by any investor in your flagship or in an SMA / FOO (comparable to your flagship), excluding founders / employees?
Rate after Avg. Maximum DiscountAvg. Headline Rate Average Maximum Discount
FIGURE 15: HF Manager Perception by Investors
HF Manager Categorization by Investors
Data and other information presented are derived directly from respondents. All commentary is from Barclays Strategic Consulting analysis
Hig
h
Firm
Siz
e /
Scal
e
Low
Good Very StrongPerformance
All Star
Small and Mighty
Solution Provider
Run of the Mill Attractive to investors and viable business
Attractive to investors with some business risk
Not attractive / viable in the long run• Usually product specialists• Often capacity constrained• Limited ability to cut fees but often under pressure to do so
• Undifferentiated returns / track record• Small asset base• May have multiple, sub-scale products• Price takers (but may be a moot point)
• At-scale with long and strong track record• Often capacity constrained• Price-makers / high fees
• Multiple products with good (not great) performance• Scale driven with ability to customize solutions• Price-takers
CapitalSolutions–HedgeFundPulse,August2016| 11

product and fee structures and tend to be ‘price takers’. A key risk these managers run is of being perceived as ‘unfocused’ and / or ‘asset gatherers’. On a net basis, however, given their partnership approach, ability to offer customized mandates, freeadvisoryservices,andflexibilityonfees,manyinvestors(pensionfundsinparticular)findtheirofferingsattractive.
• Small and Mighty – As the name suggests, these managers are small in AUM, are usually focused on a single product / strategy, and have strong (though usually limited) track records. They may be capacity constrained and run the risk that their performance could decline, resulting in their relegation to the ‘Run of the Mill’ category before they can gain scale. Investors looking for performance increasingly turn to these managers.
• The remaining managers not perceived to be among one of thethreecategoriesabovearedefinedas‘RunoftheMill’,andthere will be limited interest in investing in them.
The increased interest in ‘small and mighty’ managers is clearly visible from the results of our survey. As shown in the left chart of Figure16,morethantwo-thirds(70%)ofrespondentsindicatedthey are allocated to smaller managers (i.e., HFs with less than $500mn)andjustoverone-third(36%)indicatedtheyareallocatedto new launches. For both small / new HFs, as could be expected, Private Banks and FoHFs, which we refer to as intermediaries, are themosttypicalallocatorsfollowedbyFamilyOfficesandE&Fs.With regard to the intermediaries, for many, this is a big part of their value proposition to end investors. We also looked into how allocations to these types of managers may take place going forward and we expect allocations to both to materially increase in 2016(i.e.,investorsare35%morelikelytoinvestinsmallmanagersand16%morelikelytoinvestinnewlaunches).
V. Looking aheadIn this section we take a look at several possible scenarios for HFs overthebalanceof2016.WeprojectthenumberofHFlaunchesand liquidations as well as the potential size of the HF industry by year end. Additionally, based on our survey responses, we describe the possible adjustments Investors may make to their HF allocationsoverthesecondhalfof2016.
HF launches and closures Based on recent HF performance and the increased challenges to launching an HF,5 we estimate that there would be a net decrease inthenumberoffundsbyYE2016.Inordertoestimatetheprojected levels of HF launches and closures, we took a look at historicalresults.Figure17depictsthepercentageofHFlaunchesand liquidations (the number of each relative to the existing total number of funds) as well as the estimated percentage of launches andliquidationsforthefullyearof2016.AccordingtoHFR,thenumber of new HF launches and liquidations (as a percentage of theexistingHFs)hasbeenfairlystablefrom2010through2015(otherthan2011).Overthistimeframe,onanannualizedbasis,newlauncheswereabout12%–13%andliquidationswereabout10%,whichresultsin2%–3%additionalnewfundsannually.In2016,basedonourongoingconversationswithmanagers,investors, and external research, we expect the launch rate to declineto~8%andtheliquidationratetoriseto~12%,resultinginanetdeclineinthenumberofHFsby~4%(i.e.,~340funds).There have been several established HFs with relatively long track records, particularly in the Fundamental Equity L / S space, that have shuttered their doors recently in addition to the normal attrition across the less prominent, newer HFs. As a point of reference,in2008,whentheindustrywasunderseverestress,theliquidationrateincreasedto21%.
FIGURE 16: Investor Sentiment toward Small and New Managers
Allocations to Small and New Managers Expected Change
Note: All figures refer to Barclays Strategic Consulting analysis
% InvestorsAllocating to
SmallManagers
% InvestorsAllocating to
NewLaunches
100%86% 82% 79%
56% 48%20%
PrivateBank
FoHF FamilyOffice
E&F PublicPension
PrivatePension
Insurance
PrivateBank
FoHF FamilyOffice
E&F PublicPension
PrivatePension
Insurance
Intermediaries2016 Exp. Change
Q: Are you allocated to the products listed below?
70%
Total
Total
67% 57% 45%29% 20% 19% 10%
36%
37%
2%
Increase Decrease
35 p.p.
2%18%
Increase Decrease
16 p.p.
5.Anecdotally,itisbelievedtheminimumAUMtosuccessfullylaunchanHFhasincreasedalmostthreefoldsincethe’08–’09FinancialCrisisandinvestors’expectationsfora track record and institutional infrastructure have similarly increased
12 | For institutional and professional investors only. For information purposes only. Not for further distribution or distribution to retail investors.

Industrysizein2016In ‘Bracing for Impact’, published earlier this year, we estimated that2016willbethefirstyearsince2009withnetoutflowsfromtheHFindustry.Tobeprecise,weestimated$30bnofnetoutflowswitharangebetweenzeroand$50bn.ToassessatwhatAUMleveltheindustrywillsettleattheendof2016,wealsoneed to take performance into consideration. Our base scenario isthatperformancewillbemuted(0%–4%return)andthereforetheindustrywilllikelyendupin2016withroughly$2.9tnAUM,roughly the same (or slightly higher) compared to the beginning oftheyear.InFigure18,welookatthreepotentialscenariosforYE2016basedontheestimatedflowsandHFreturns:
• Optimistic – HF performance rises to a healthy range of 4% – 8%in2016andflowsareflat.Overall,AUMislikelytoriseby$180bnto$3.1tn,drivenbyperformancegains.
• Baseline–HFreturnsimprovefrom2H15and1Q16levels,butonlytoalowpositivelevel(i.e.,0% – 4%returnfor2016),whileinvestorsredeemanetof$30bn,resultinginaslightoverallincrease in AUM from a year ago.
• Pessimistic–Industryreturnsdeteriorate(i.e.,-4% – 0%returnfor2016)andnetoutflowsincreaseto$50bn,whichwouldresultinindustryassetsdecliningbyover$100bnforYE2016.
FIGURE 17: HF Launches and Closures
HF Launches and Liquidations1
1. HFR, Barclays Strategic Consulting analysis; 2. Strategic Consulting estimate
8%
(12%)
16%
10% 11% 13% 15% 14% 13% 12% 12%
(7%)
(21%)
(15%)(10%) (10%) (11%) (11%) (10%) (11%)
2007 2008 2009 2010 2011 2012 2013 2014 2015
9% (11%) (4%) 3% 5% 3% 2% 2% 1% (4%2)
2016E2
Net
18
Launches as % of Total # of Funds Liquidations as % of Total # of Funds Net New Funds as % of Total # of Funds
FIGURE 18: Industry Size in 2016
Three Potential Scenarios Impact of Flows Impact of Returns Projected AUM (EOY 2016)
Source: Barclays Strategic Consulting analysis
Performance returnsto general expectations /
recent average(post crisis)
Performance belowlong-term expectations but
improves from2015 / Q116 levels
Performanceremains at or
falls below2015 / Q116 levels
Opt
imis
ticBa
selin
ePe
ssim
istic
240
120
180
90
(30)
30
(50)
170
(110)
TotalAUM
Change from EOY 2015 ($bn)
~$3.1tn
~$2.9tn
~$2.8tn
Avg $Impact
AnnualFlows
0%
(1%)
~(2%)
$0bn
($30bn)
($50bn)
Avg $Impact
4% to 8%
0% to 4%
(4%) to 0%
~$180bn
~$60bn
~($60bn)
AnnualReturns
CapitalSolutions–HedgeFundPulse,August2016| 13

Investors’ HF strategy preferences Ourfinalanalysiswasderivedcompletelybasedoninvestors’feedbackwithregardtotheirstrategypreferencesfor2016.Figures19and20showourrespondents’intentionswithregardto increasing / decreasing their allocations to various HF sub-strategiesforthesecondhalfof2016.Theincreaseversusdecrease preference difference is listed on the right hand side oftherespectivefiguresandweusethisasacrudeproxyforinvestor interest. The arrows on the far right hand side of the chart show the change in sentiment toward the sub-strategy between4Q15and2Q16(e.g.,abluearrowshowsanincreaseinthelevelofinterestin2Q16versus4Q15).Keytakeaways:
• Itappearsthatsystematicstrategies,Systematic/CTA(+25%)andQuantEquity(+24%),arenotonlythemostinfavor(ona net basis) over the next six to 12 months, but also are the strategies that gained the most in investor interest since the endof2015.
• Equity Market Neutral, Equity Emerging Markets, Macro, and FIRVallhadnetpositiveinterestat2Q16,butappeartohavelessnetinterestfrominvestorssinceYE2015.
• Meanwhile, Equity L / S and Event Driven have the lowest level of investor interest (on a net basis) and have actually seen the levelofinterestdeclinesinceYE2015.
FIGURE 20: Investors’ HF Strategy Preferences (II / II)
Interest in HF Sub-Strategies (%) Net Difference
Source: All figures refer to Barclays Strategic Consulting analysis
Q216Change vs.
Q415
7%
6%
3%
0%
(3%)
(9%)
(14%)
15
16
15
13
6
14
10
(12)
(13)
(23)
(24)
(9)
(10)
(8)Equity Sector Focused
Decrease Increase
Event Driven
Equity Long / Short
Multi-Manager
Multi-strategy
Long / Short Credit
Structured Credit
n/a
FIGURE 19: Investors’ HF Strategy Preferences (I / II)
Interest in HF Sub-Strategies (%) Net Difference
Source: All figures refer to Barclays Strategic Consulting analysis
Q216Change vs.
Q415
25%
24%
17%
16%
15%
15%
9%
27
(7)
(9)
(10)
(6) 15
25
18
25
24
27
(2)
(3)
(3)
Fixed Income Relative Value
Macro
Equity Emerging Market
Equity Market Neutral
Distressed Credit
Quant Equity
Systematic / CTA
Decrease Increase
14| For institutional and professional investors only. For information purposes only. Not for further distribution or distribution to retail investors.
• Multi-strategy(flatat2Q16,butdecliningsinceYE2015)andMulti-Manager(-3%at2Q16)alsoappeartobegarneringlessinvestor interest relative to the balance of strategies.
Overall trends appear to point to investors positioning their portfolios more toward systematic and quant type strategies. In addition to systematic strategies, we expect distressed type managerstoattractsignificantinterestfortheremainderoftheyear,whichmighttranslateintoflowsifinvestmentopportunitiesin the space increase.
VI. Key considerationsWe leave HF managers and investors with the following thoughts/considerations:
1. 2015wasatoughyearforHFmanagersand2016continuestobe challenging.
a. While there are some exceptions, HFs in general continue to face performance challenges.
b. Althoughtherearesomediversificationbenefitstoadding HFs to liquid portfolios, the industry’s recent underwhelming performance has heightened investors’ concerns about their HF allocations – as evidenced by recent industry headlines.
2. InvestorsareclearlydissatisfiedwithHFperformance,butitdoes not seem that they have given up on HFs.
a. While more than half of surveyed investors said they are dissatisfiedwiththeperformanceofHFsintheirportfolios,only a minority are looking to reduce their HF allocations. Most are looking to reallocate to other HFs, seek fee discounts from their current HFs, or just leave their current allocations unchanged.
b. Many investors are also seeking alternative ways to improvetheirreturnprofileorterms(e.g.,byinvestingwithemerging or small managers).6
c. Investor interest in certain strategies remains strong (e.g., Systematic / CTA, Macro, Distressed, Emerging Markets).
3. Ourbaselineestimateisthatthesizeoftheindustryin2016(versus2015)islikelytoremainunchangedat$2.9tn.
a. OuranalysisshowsthatHFperformanceimpactsflowswith a lag of one to three quarters, which we believe will resultinnetoutflowsfor2016,atleastinpart,toreflecttheperformancechallengesof2H15andearly2016.
b. However, our projection of a modest increase in HF returns (toaround0%–4%)willlikelyresultinassetsremainingflatversus2015asperformanceandflowsbalanceeachotheroutin2016.
c. That said, there are also optimistic and pessimistic scenarios which could see the industry grow assets by $180bnorseeareductioninassetsof$110bn,respectively.
VII. Capital SolutionsThe Capital Solutions team within Prime Services offers a unique blend of industry insights and tailored client solutions for a broad range of issues.
Strategic Consulting• Development of industry-leading content, driven by
primary analysis, on the HF industry and its participants (e.g., HF and FoHF managers, institutional investors, investment consultants).
• Provision of management consulting services to HFs, asset managers, institutional investors and internal management on a wide array of business topics including the launch of a new strategy, marketing effectiveness, product development and organizationalefficiency.
• Acting as an HF competence center internally for Barclays.
Capital Introductions• Maintenance of ongoing investor dialogue to provide valuable
feedback to HF managers.
• Introducing HF managers to a select number of interested investors. Hosting events that provide a forum for knowledge transfer and discussion / debate on industry issues that helps educate and inform both clients and investors.
• Helping HF managers identify and source high quality talent tofillopeningsacrosstheirorganizationsthroughatalentmanagement effort.
6.ManyHFsare,inturn,offeringdifferentliquiditystructures,lowerfees,andnewvehiclessuchaslongonlyproducts
CapitalSolutions–HedgeFundPulse,August2016| 15

P0408|CSNY572731USLv7|August2016
Contacts
DisclaimerThis document is being directed at persons who are professionals and is not intended for retail customer use. Not For Further Distribution or Distribution To Retail Investors.
For Discussion Purposes Only.
CONFLICTS OF INTEREST BARCLAYS IS A FULL SERVICE INVESTMENT BANK. In the normal course of offering investment banking products and services to clients, Barclays may act in several capacities (including issuer, market maker, underwriter, distributor, index sponsor, swap counterparty and calculation agent) simultaneouslywithrespecttoaproduct,givingrisetopotentialconflictsofinterestwhichmayimpacttheperformanceofaproduct.
NOT RESEARCH This document is from a Barclays Trading and / or Distribution desk and is not a product of the Barclays Research department. Any views expressed may differ from those of Barclays Research.
BARCLAYSPOSITIONS Barclays,itsaffiliatesandassociatedpersonnelmayatanytimeacquire,holdordisposeoflongorshortpositions(includinghedgingandtradingpositions) which may impact the performance of a product.
FOR INFORMATION ONLY THIS DOCUMENT IS PROVIDED FOR INFORMATION PURPOSES ONLY AND IT IS SUBJECT TO CHANGE. IT IS INDICATIVE ONLY AND IS NOT BINDING. NO OFFER Barclays is not offering to sell or seeking offers to buy any product or enter into any transaction. Any transaction requires Barclays’ subsequent
formal agreement which will be subject to internal approvals and binding transaction documents. Without limitation to the foregoing, any transaction may also be subject to review by Barclays against its published Tax Principles.
NO LIABILITY Barclays is not responsible for the use made of this document other than the purpose for which it is intended, except to the extent this would be prohibited by law or regulation.
NO ADVICE OBTAIN INDEPENDENT PROFESSIONAL ADVICE BEFORE INVESTING OR TRANSACTING. Barclays is not an advisor and will not provide any advice relating toaproduct.Beforemakingan investmentdecision, investorsshouldensure theyhavesufficient information toascertain the legal,financial,taxandregulatoryconsequencesofaninvestmenttoenablethemtomakeaninformedinvestmentdecision.
THIRD PARTY INFORMATION Barclays is not responsible for information stated to be obtained or derived from third party sources or statistical services.PAST AND SIMULATED Any past or simulated past performance (including back-testing) contained herein is no indication as to future performance. PAST PERFORMANCEOPINIONS SUBJECT All opinions and estimates are given as of the date hereof and are subject to change. Barclays is not obliged to inform investors of any change to TO CHANGE such opinions or estimates. NOT FOR RETAIL This document is being directed at persons who are professionals and is not intended for retail customer use. IMPORTANT DISCLOSURES For important regional disclosures you must read, click on the link relevant to your region. Please contact your Barclays representative if you are
unable to access. EMEA EMEADisclosures|http://group.barclays.com/disclosures/emea-disclosuresAPAC APACDisclosures|http://group.barclays.com/disclosures/apac-disclosuresUS USDisclosures|http://group.barclays.com/disclosures/us-disclosures IRSCIRCULAR230DISCLOSURE:Barclaysdoesnotprovidetaxadvice.Pleasenotethat(i)anydiscussionofUStaxmatterscontainedinthis
communication(includinganyattachments)cannotbeusedbyyouforthepurposeofavoidingtaxpenalties;(ii)thiscommunicationwaswrittentosupportthepromotionormarketingofthemattersaddressedherein;and(iii)youshouldseekadvicebasedonyourparticularcircumstancesfrom an independent tax advisor.
CONFIDENTIAL Thisdocumentisconfidentialandnopartofitmaybereproduced,distributedortransmittedwithoutthepriorwrittenpermissionofBarclays.ABOUT BARCLAYS Barclays offers premier investment banking products and services to its clients through Barclays Bank PLC. Barclays Bank PLC is authorised by the
Prudential Regulation Authority and regulated by the Financial Conduct Authority and the Prudential Regulation Authority and is a member of the LondonStockExchange.BarclaysBankPLCisregisteredinEnglandNo.1026167withitsregisteredofficeat1ChurchillPlace,LondonE145HP.
COPYRIGHT ©CopyrightBarclaysBankPLC,2016(allrightsreserved).
Louis MolinariManaging Director, Global Head of Capital [email protected]|+12125260742
Roark StahlerDirector [email protected]|+12125269065
Freddie Parker, CFAAssistant Vice President [email protected]|+442031345132
Ermanno Dal PontManaging Director, Head of Capital Solutions [email protected]|+442031348649
Shagufah NazaarVice President [email protected]|+12125286348
Taotao HeAnalyst [email protected]|+12125264655