
AFTA Travel Trends · Since 2013, the UK have added 100,000 movements. Source: January 2018...
16
AFTA Travel Trends March 2018 © AFTA Travel Trends Report 2018
Transcript of AFTA Travel Trends · Since 2013, the UK have added 100,000 movements. Source: January 2018...

AFTA Travel Trends March 2018
© AFTA Travel Trends Report 2018

Inbound and Outbound overview
Introduction
This snapshot provides an overview
of the balance of trade between
Inbound and Outbound Travel for
Year end of January 2018.
It uses information provided by the
Australian Bureau of Statistics (ABS)
Overseas Arrivals and Departures
(OAD) data set.

Source: January 2018 Short-term Movement, Residents Returning and Visitors Arriving - Selected Countries of Residence: Seasonally adjusted
Total Visitor and
Australian departure
and arrivals – Year End
January 2018
The ABS collects data on all
travellers entering and leaving
Australia through the Inbound
Passenger Card.
This section displays the number of
international tourists entering and
Australians departing Australia as
of January Year end 2017 and
2018.
For travel and tourism to be
sustainable it is imperative that
the trade between each country
is balanced and this snapshot
tracks overall benefits to each
country.
The countries chosen are the
major Australian source markets
and desired destinations.
January YE 2017 Total number of international
visitors to Australia
Inbound
January YE 2017Total number of international
trips by Australians
Outbound
January YE 2018Total number of international
visitors to Australia
Inbound
January YE 2018Total number of international
trips by Australians
Outbound
China 1,225,600 472,500 1,379,300 540,900
New Zealand 1,338,000 1,350,800 1,355,100 1,421,900
USA 724,400 1,078,000 796,300 1,077,400
UK 713,300 590,600 730,600 636,300
Singapore 430,100 388,600 443,700 406,900
Japan 421,200 357,100 437,400 407,700
Malaysia 391,200 254,900 402,300 273,700
South Korea 285,800 72,700 302,600 72,700
India 264,400 324,500 310,400 370,400
Hong Kong 248,000 220,400 286,300 225,700
Indonesia 175,700 1,226,100 191,200 1,177,400
Thailand 91,400 544,700 99,200 586,900
Fiji 36,600 347,100 43,200 341,000
National Total 8,301,100 9,976,100 8,896,900 10,591,300

Inbound Report
Introduction
These snapshots provide an
overview of the performance of the
Australian inbound tourism sector.
It uses information provided by the
Australian Bureau of Statistics (ABS)
Overseas Arrivals and Departures
(OAD) data set.
Performance indicators are provided
for each market and month.
A neutral rating is provided for
markets which have a year on year
variation of (+/-) 2%.
Where are our participants?
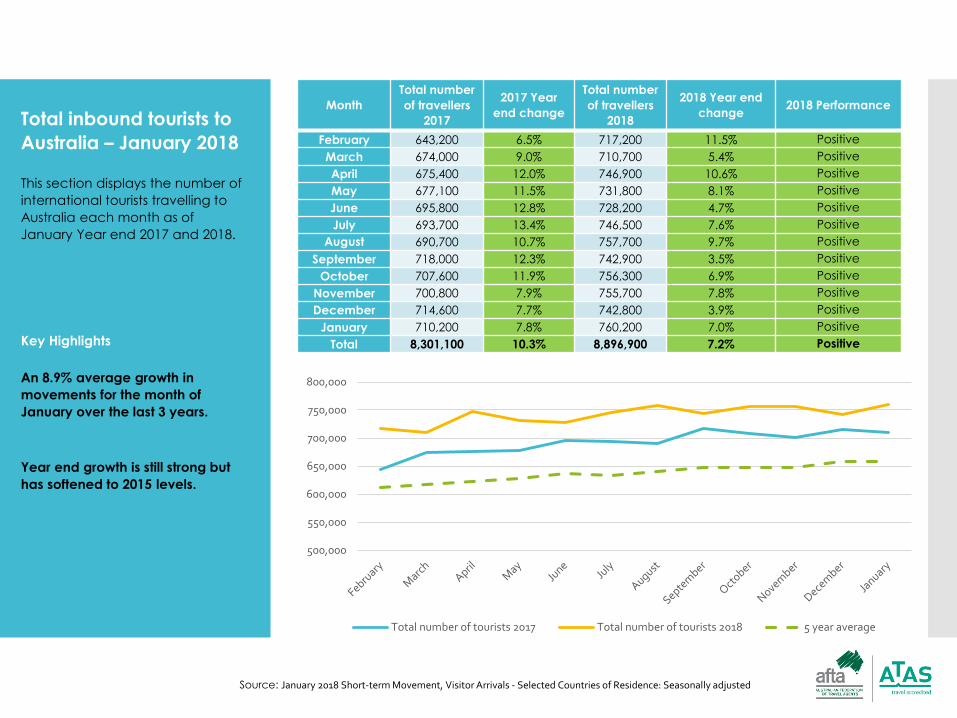
Total inbound tourists to
Australia – January 2018
This section displays the number of
international tourists travelling to
Australia each month as of
January Year end 2017 and 2018.
Month
Total number
of travellers
2017
2017 Year
end change
Total number
of travellers
2018
2018 Year end
change2018 Performance
February 643,200 6.5% 717,200 11.5% Positive
March 674,000 9.0% 710,700 5.4% Positive
April 675,400 12.0% 746,900 10.6% Positive
May 677,100 11.5% 731,800 8.1% Positive
June 695,800 12.8% 728,200 4.7% Positive
July 693,700 13.4% 746,500 7.6% Positive
August 690,700 10.7% 757,700 9.7% Positive
September 718,000 12.3% 742,900 3.5% Positive
October 707,600 11.9% 756,300 6.9% Positive
November 700,800 7.9% 755,700 7.8% Positive
December 714,600 7.7% 742,800 3.9% Positive
January 710,200 7.8% 760,200 7.0% Positive
Total 8,301,100 10.3% 8,896,900 7.2% PositiveKey Highlights
An 8.9% average growth in
movements for the month of
January over the last 3 years.
Year end growth is still strong but
has softened to 2015 levels.
Source: January 2018 Short-term Movement, Visitor Arrivals - Selected Countries of Residence: Seasonally adjusted
500,000
550,000
600,000
650,000
700,000
750,000
800,000
Total number of tourists 2017 Total number of tourists 2018 5 year average
Where are our participants?
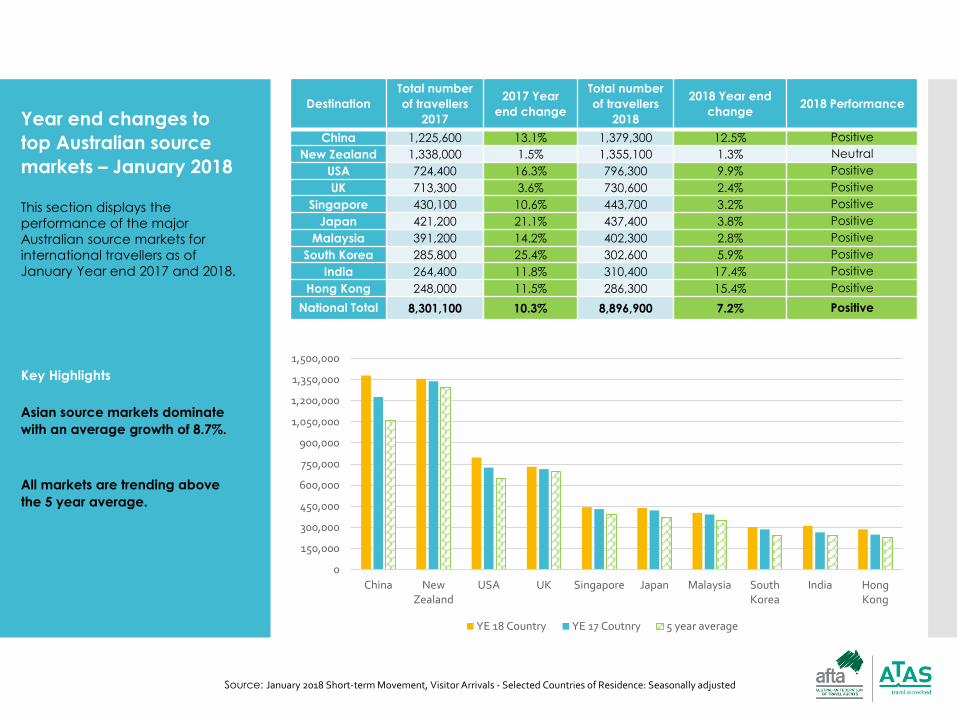
Year end changes to
top Australian source
markets – January 2018
This section displays the
performance of the major
Australian source markets for
international travellers as of
January Year end 2017 and 2018.
Destination
Total number
of travellers
2017
2017 Year
end change
Total number
of travellers
2018
2018 Year end
change2018 Performance
China 1,225,600 13.1% 1,379,300 12.5% Positive
New Zealand 1,338,000 1.5% 1,355,100 1.3% Neutral
USA 724,400 16.3% 796,300 9.9% Positive
UK 713,300 3.6% 730,600 2.4% Positive
Singapore 430,100 10.6% 443,700 3.2% Positive
Japan 421,200 21.1% 437,400 3.8% Positive
Malaysia 391,200 14.2% 402,300 2.8% Positive
South Korea 285,800 25.4% 302,600 5.9% Positive
India 264,400 11.8% 310,400 17.4% Positive
Hong Kong 248,000 11.5% 286,300 15.4% Positive
National Total 8,301,100 10.3% 8,896,900 7.2% Positive
Key Highlights
Asian source markets dominate
with an average growth of 8.7%.
All markets are trending above
the 5 year average.
Source: January 2018 Short-term Movement, Visitor Arrivals - Selected Countries of Residence: Seasonally adjusted
0
150,000
300,000
450,000
600,000
750,000
900,000
1,050,000
1,200,000
1,350,000
1,500,000
China NewZealand
USA UK Singapore Japan Malaysia SouthKorea
India HongKong
YE 18 Country YE 17 Coutnry 5 year average
Where are our participants?
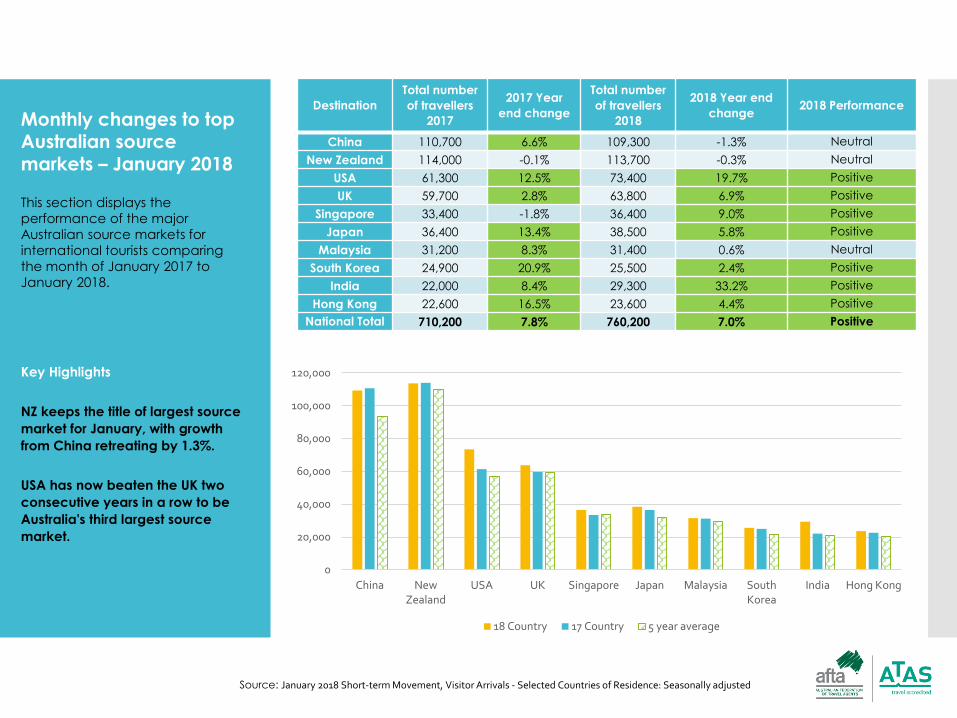
Monthly changes to top Australian source markets – January 2018
This section displays the
performance of the major
Australian source markets for
international tourists comparing
the month of January 2017 to
January 2018.
Key Highlights
NZ keeps the title of largest source
market for January, with growth
from China retreating by 1.3%.
USA has now beaten the UK two
consecutive years in a row to be
Australia's third largest source
market.
Destination
Total number
of travellers
2017
2017 Year
end change
Total number
of travellers
2018
2018 Year end
change2018 Performance
China 110,700 6.6% 109,300 -1.3% Neutral
New Zealand 114,000 -0.1% 113,700 -0.3% Neutral
USA 61,300 12.5% 73,400 19.7% Positive
UK 59,700 2.8% 63,800 6.9% Positive
Singapore 33,400 -1.8% 36,400 9.0% Positive
Japan 36,400 13.4% 38,500 5.8% Positive
Malaysia 31,200 8.3% 31,400 0.6% Neutral
South Korea 24,900 20.9% 25,500 2.4% Positive
India 22,000 8.4% 29,300 33.2% Positive
Hong Kong 22,600 16.5% 23,600 4.4% Positive
National Total 710,200 7.8% 760,200 7.0% Positive
Source: January 2018 Short-term Movement, Visitor Arrivals - Selected Countries of Residence: Seasonally adjusted
0
20,000
40,000
60,000
80,000
100,000
120,000
China NewZealand
USA UK Singapore Japan Malaysia SouthKorea
India Hong Kong
18 Country 17 Country 5 year average

OutboundReport
Introduction
This snapshot provides an overview
of the performance of the Australian
outbound travel sector.
It uses information provided by the
Australian Bureau of Statistics (ABS)
Overseas Arrivals and Departures
(OAD) data set. Performance
indicators are provided for each
market.
A neutral rating is provided for
markets which have a year on year
variation of (+/-) 2%.

Source: January 2018 Short-term Movement, Residents Returning - Selected Destinations: Seasonally adjusted
Total outbound Australian travellers –January 2018
This section displays the number of
Australians travelling outbound
each month as of January Year
end 2017 and 2018.
Key Highlights
Outbound movements for month
end return to growth up 5.3% in
2018.
End of year movements up 0.6% to
6.2% to the highest levels since
2013.
Month
Total number
of travellers
2017
2017 Year
end change
Total number
of travellers
2018
2018 Year end
change2018 Performance
February 792,700 5.7% 888,400 12.1% Positive
March 808,000 3.8% 857,700 6.2% Positive
April 816,600 4.9% 892,600 9.3% Positive
May 813,700 4.7% 893,400 9.8% Positive
June 825,200 5.0% 872,600 5.7% Positive
July 835,500 8.3% 870,800 4.2% Positive
August 836,900 5.0% 878,500 5.0% Positive
September 841,600 6.1% 891,900 6.0% Positive
October 838,500 6.0% 884,600 5.5% Positive
November 840,500 5.0% 891,900 6.1% Positive
December 877,800 7.7% 874,800 -0.3% Neutral
January 849,100 5.0% 894,100 5.3% Neutral
Total 9,976,100 5.6% 10,591,300 6.2% Positive
700,000
720,000
740,000
760,000
780,000
800,000
820,000
840,000
860,000
880,000
900,000
920,000
Total number of travellers 2018 Total number of travellers 2017 5 year average

Destination
Total number
of travellers
2017
2017 Year
end change
Total number
of travellers
2018
2018 Year end
change2018 Performance
New Zealand 1,350,800 6.9% 1,421,900 5.3% Positive
Indonesia 1,226,100 10.9% 1,177,400 -4.0% Negative
USA 1,078,000 4.1% 1,077,400 -0.1% Neutral
UK 590,600 -0.2% 636,300 7.7% Positive
Thailand 544,700 -3.7% 586,900 7.7% Positive
China 472,500 10.5% 540,900 14.5% Positive
Singapore 388,600 5.9% 406,900 4.7% Positive
Japan 357,100 14.1% 407,700 14.2% Positive
Fiji 347,100 -3.3% 341,000 -1.8% Neutral
India 324,500 12.7% 370,400 14.1% Positive
National Total 9,976,100 5.6% 10,591,300 6.2% Positive
Year end changes to popular international destinations travelled to by Australian’s –January 2018
This section displays the
performance of the major
destinations Australian’s are
travelling to as of January Year
end 2017 and 2018.
Key Highlights
7 of the 10 major source markets
achieve an average growth of
9.7%.
Since 2013, the UK have added
100,000 movements.
Source: January 2018 Short-term Movement, Residents Returning - Selected Destinations: Seasonally adjusted
0
200,000
400,000
600,000
800,000
1,000,000
1,200,000
1,400,000
1,600,000
NewZealand
Indonesia USA UK Thailand China Singapore Japan Fiji India
YE 18 Country YE 17 Country 5 year average

Monthly changes to popular international destinations travelled to by Australian’s –January 2018
This section displays the
performance of the major
destinations Australian’s are
travelling to comparing January
2017 to January 2018
Destination
Total number
of travellers
2017
2017 Year end
change
Total number
of travellers
2018
2018 Year end
change2018 Performance
New Zealand 117,200 8.8% 116,200 -0.9% Neutral
Indonesia 93,600 -9.2% 91,400 -2.4% Negative
USA 90,500 1.6% 91,300 0.9% Neutral
UK 53,200 10.8% 56,100 5.5% Positive
Thailand 44,600 -2.2% 49,100 10.1% Positive
China 43,300 19.3% 46,100 6.5% Positive
Singapore 33,200 11.0% 34,800 4.8% Positive
Japan 30,500 5.9% 36,500 19.7% Positive
Fiji 31,100 3.3% 27,800 -10.6% Negative
India 28,200 12.4% 33,500 18.8% Positive
National Total 849,100 5.0% 894,100 5.3% Positive
Key Highlights
Following two consecutive month
declines, USA is forecasted to be
Australia’s second most visited
destination in January 2019.
NZ update 5.3% for year end but
down 0.9% in January.
Source: January 2018 Short-term Movement, Residents Returning - Selected Destinations: Seasonally adjusted
0
20,000
40,000
60,000
80,000
100,000
120,000
140,000
NewZealand
Indonesia USA UK Thailand China Singapore Japan Fiji India
18 Country 17 Country 5 year average

Reasons to travel to popular international destinations by Australian’s – January 2017
This section displays the
performance of the popular
destinations visited by Australian’s
by reason of travel in January
2018.
HolidayVisiting
friends/relativesBusiness
Other Reasons for
Journey
New Zealand 47.0% 43.2% 4.4% 5.4%
Indonesia 83.1% 11.6% 1.2% 4.1%
USA 68.6% 19.7% 4.5% 7.2%
UK 38.7% 51.8% 4.1% 5.3%
Thailand 79.5% 13.3% 3.5% 3.7%
China 34.3% 47.4% 8.0% 10.4%
Singapore 61.4% 24.5% 8.0% 6.1%
Japan 78.4% 14.5% 2.4% 4.7%
Fiji 81.6% 14.7% 0.6% 3.1%
India 29.3% 61.3% 2.1% 7.3%
National Total 56.6% 33.3% 3.6% 6.5%
Source: January 2018 Short-term Movement, Residents Returning - Selected Destinations: Seasonally adjusted
0.0%
10.0%
20.0%
30.0%
40.0%
50.0%
60.0%
70.0%
80.0%
90.0%
100.0%
NewZealand
Indonesia USA UK Thailand China Singapore Japan Fiji India NationalTotal
Holiday Visiting friends/relatives Business Other Reasons for Journey

Source: International Airline Activity—Monthly Publications, December 2017
Introduction
This snapshot provides the market
share of each airline for international
travel.
Information is sourced directly from
the Department of Infrastructure and
Regional Development.
Airlines
Department Summary:
Fifty-eight international airlines
operated scheduled services to/from
Australia during December 2017
(includes five dedicated freight
airlines but excludes airlines operating
only via code share arrangements).

Airline activity - Month End
December 2017
This snapshot displays the market share of
each airline for international travel for the
month of December 2017.
This information from the Department of
Infrastructure and Regional Development
presents statistical information on the
scheduled operations of international
airlines operating into/out of Australia.
Monthly Share of passengers carried December -16 December -17
Qantas Airways 15.1% 15.9%
Emirates 9.1% 8.6%
Jetstar 8.9% 8.2%
Singapore Airlines 7.9% 7.8%
Air New Zealand 6.4% 6.4%
Virgin Australia 5.8% 5.9%
Cathay Pacific Airways 4.5% 4.6%
China Southern Airlines 3.2% 3.8%
AirAsia X 4.2% 3.7%
Etihad Airways 3.2% 3.1%
Source: International Airline Activity—Monthly Publications, December 2016 and December 2017
Qantas Airways, 15.9%
Emirates, 8.6%
Jetstar, 8.2%
Singapore Airlines, 7.8%
Air New Zealand, 6.4%
Virgin Australia, 5.9%
Cathay Pacific Airways, 4.6%
China Southern Airlines, 3.8%
AirAsia X, 3.7% Etihad Airways, 3.1%

Source: International Airline Activity—Monthly Publications, December 2016 and December 2017
Airline activity – Year End
December 2017
This snapshot displays the market share of
each airline for international travel of Year
end – December 2017.
This information from the Department of
Infrastructure and Regional Development
presents statistical information on the
scheduled operations of international
airlines operating into/out of Australia.
Year End share of
passengers carriedDecember -16
Year End share of
passengers carriedDecember - 17
Qantas Airways 15.6% Qantas Airways 16.4%
Jetstar 9.5% Jetstar 9.1%
Emirates 8.8% Emirates 8.3%
Singapore Airlines 8.1% Singapore Airlines 8.1%
Air New Zealand 6.8% Air New Zealand 6.6%
Virgin Australia 6.3% Virgin Australia 6.0%
Cathay Pacific Airways 4.9% Cathay Pacific Airways 4.6%
AirAsia X 3.9% AirAsia X 4.0%
Etihad Airways 3.1% Etihad Airways 3.2%
China Southern Airlines 2.9% China Southern Airlines 3.1%
Others 30.2% Others 30.7%
Qantas Airways, 16.4%
Jetstar, 9.1%
Emirates, 8.3%
Singapore Airlines, 8.1%
Air New Zealand, 6.6%Virgin Australia, 6.0%Cathay Pacific
Airways, 4.6%
AirAsia X, 4.0%
Etihad Airways, 3.2%
China Southern Airlines, 3.1%
Others, 30.7%

For further information please contact:
Dean Long
Head of Public Policy and Strategic Partnerships
Ph: 02 9287 9900
© AFTA Travel Trends Report 2018
The information contained within this Report has been prepared by AFTA based upon best endeavours to ensure the accuracy and completeness of material.
AFTA accepts no liability for any loss or damage a person suffers because that person has directly or indirectly relied on any information provided by AFTA.


