AFS AFS ––– Advanc Advanc Advances in Food Scienceses in ...
48
AFS AFS AFS AFS – Advanc Advanc Advanc Advances in Food Sciences es in Food Sciences es in Food Sciences es in Food Sciences Continuation of CMTL founded by F. Drawert Production by PSP – Parlar Scientific Publications, Angerstr. 12, 85354 Freising, Germany in cooperation with Lehrstuhl für Chemisch-Technische Analyse und Lebensmitteltechnologie, Technische Universität München, 85350 Freising - Weihenstephan, Germany Copyright © by PSP – Parlar Scientific Publications, Angerstr. 12, 85354 Freising, Germany. All rights are reserved, especially the right to translate into foreign language. No part of the journal may be reproduced in any form- through photocopying, microfilming or other processes- or converted to a machine language, especially for data processing equipment- without the written permission of the publisher. The rights of reproduction by lecture, radio and television transmission, magnetic sound recording or similar means are also reserved. Printed in GERMANY Printed in GERMANY Printed in GERMANY Printed in GERMANY – ISSN 1431 ISSN 1431 ISSN 1431 ISSN 1431-7737 7737 7737 7737
Transcript of AFS AFS ––– Advanc Advanc Advances in Food Scienceses in ...

AFS AFS AFS AFS –––– Advanc Advanc Advanc Advances in Food Scienceses in Food Scienceses in Food Scienceses in Food SciencesContinuation of CMTL founded by F. Drawert
Production by PSP – Parlar Scientific Publications, Angerstr. 12, 85354 Freising, Germany in cooperation with Lehrstuhl für Chemisch-Technische Analyse und Lebensmitteltechnologie,
Technische Universität München, 85350 Freising - Weihenstephan, Germany
Copyright © by PSP – Parlar Scientific Publications, Angerstr. 12, 85354 Freising, Germany. All rights are reserved, especially the right to translate into foreign language. No part of the journal
may be reproduced in any form- through photocopying, microfilming or other processes- or converted to a machine language, especially for data processing equipment- without the written permission of the publisher.
The rights of reproduction by lecture, radio and television transmission, magnetic sound recording or similar means are also reserved.
Printed in GERMANY Printed in GERMANY Printed in GERMANY Printed in GERMANY –––– ISSN 1431 ISSN 1431 ISSN 1431 ISSN 1431----7737773777377737

© by PSP Volume 24 – No 3. 2002 Advances in Food Sciences
1

© by PSP Volume 24 – No 3. 2002 Advances in Food Sciences
2
AFSAFSAFSAFS---- Editorial Board Editorial Board Editorial Board Editorial Board
Chief Editors: Chief Editors: Chief Editors: Chief Editors:
Prof. Dr. H. Parlar Institut für Lebensmitteltechnologie und Analytische Chemie, TU München -
85350 Freising-Weihenstephan, Germany - E-mail: [email protected]
Dr. G. Leupold Institut für Lebensmitteltechnologie und Analytische Chemie, TU München -
85350 Freising-Weihenstephan, Germany - E-mail: [email protected]
CoCoCoCo----EEEEditor:ditor:ditor:ditor:
Prof. Dr. R. G. Berger Zentrum Angewandte Chemie, Institut für Lebensmittelchemie, Universität Hannover
Wunstorfer Straße 14, 30453 Hannover - E-mail: [email protected]
AFSAFSAFSAFS- Advisory BoardAdvisory BoardAdvisory BoardAdvisory Board
E. Anklam, I M. Bahadir, D F. Coulston, USA J.M. de Man, CAN N. Fischer, D S. Gäb, D A. Görg, D U. Gill, CAN D. Hainzl, P W.P. Hammes, D D. Kotzias, I F. Korte, D M.G. Lindhauer, D B. Luckas, D S. Nitz, D A.M Raichlmayr-Lais, D M. Spiteller, D H. Steinhart, D R.F. Vogel, D R.P. Wallnöfer, D P. Werkhoff, D
Editorial ChiefEditorial ChiefEditorial ChiefEditorial Chief----Officer:Officer:Officer:Officer:
Selma Parlar PSP- Parlar Scientific Publications - Angerstr.12, 85354 Freising, Germany E-Mail: [email protected] - www.psp-parlar.de
Marketing Chief Manager:Marketing Chief Manager:Marketing Chief Manager:Marketing Chief Manager:
Max-Josef Kirchmaier MASELL-Agency for Marketing & Communication, Public-Relations Angerstr.12, 85354 Freising, Germany E-Mail: [email protected] - www.masell.com
© by PSP Volume 24 – No 3. 2002 Advances in Food Sciences
93
CONTENTS ORIGINAL PAPERS
EFFECTS OF STERILANTS ON GROWTH OF Pleurotus Sajor-Caju ON CASSAVA PEELS 94 C.O. Adenipekun and I. O Fasidi ANTIOXIDANT PROPERTIES OF OLIVE PHENOLIC COMPOUNDS 99 ON SUNFLOWER OIL STABILITY R. S Farag, N. M. Abd-Elmoien and E. A. Mahmoud GLYKOSIDISCH GEBUNDENE AROMASTOFFE IN HOPFEN (Humulus lupulus L.): 106 1. ENZYMATISCHE FREISETZUNG VON AGLYCONEN H. Kollmannsberger und S. Nitz
MICROBIAL AND BIOCHEMICAL CHANGES OCCURRING DURING 116 FERMENTATION OF marula (Sclerocarya birrea subspecies caffra) JUICE TO PRODUCE mukumbi, A TRADITIONAL ZIMBABWEAN WINE A. Mpofu and R. Zvauya COMPARATIVE STUDIES ON BIOSORPTION OF COBALT (II), NICKEL (II), 121 LEAD (II) AND MANGANESE (II) BY FOUR DIFFERENT FUNGI M. H. Habibi, G. Emtiazi, Z. Khalesi and M. A. Haghighipour
SHORT COMMUNICATION
PHYSICOCHEMICAL ANALYSIS OF TOKAT REGION (TURKEY) HONEYS 125 M. Tüzen
BOOK REVIEWS � BÜCHERSCHAU 128 G. Leupold INDEX 135

© by PSP Volume 24 – No 3. 2002 Advances in Food Sciences
94
EFFECTS OF STERILANTS ON GROWTH OF Pleurotus Sajor-Caju ON CASSAVA PEELS
C.O. Adenipekun and I. O Fasidi
Department of Botany and Microbiology, University of Ibadan, Ibadan, Nigeria
SUMMARY
The addition of 0.5% formalin as sterilant resulted in the best mycelial growth of Pleurotus sajor-caju on cas-sava peel wastes and also served as a good biocide in reducing the rate of contamination by other microorgan-isms. In all the series of experiments, in which calcium sulphate, calcium carbonate, ammonium nitrate, ammo-nium sulphate and urea were added, the fungus exhibited the best mycelial growth on the substrates containing 0.1% (w/v) of the salts, except for calcium carbonate, where the best growth was attained only by addition of 1.0% (w/v).
However, the addition of ammonium salts resulted in a decrease of mycelial growth with an increase in the salt concentration. A mixture of various proportions of CaSO4 and CaCO3 to the substrate produced no significant ef-fects on the growth of the fungus. It was also observed that the addition of the insecticide Rogor L 40 and fungi-cide Brestan in concentrations of 0.5%, 1.0% and 2.0% had highly significant inhibitory effects on growth.
KEYWORDS: Pleurotus sajor-caju, cassava peels, fungicides, insecticides.
INTRODUCTION
In Nigeria mushrooms are eaten generally because of their desirable flavour and food values. Kadiri and Fasidi [1] have shown that P. tuber-regium is highly nutritive and very rich in proteins but also in sugars such as galactose. They are also consumed in various combinations of me-dicinal herbs and other ingredients with the intention to cure headache, stomach ailments, colds and fever as well as asthma, smallpox and high blood pressure [2, 3].
The cultivation of Pleurotus species on tree stumps
and logs was first described by Falck [4]. Lozovoi [5] conducted a study on Pleurotus ostreatus and other Pleuro-tus strains and found that the recommended substrate for
cultivation consisted of sawdust (73-76%), chalk (1-2%), carbamide (0.3-0.5%), NPK (0.3 � 0.5%) and water (2.0 � 2.5%).
Recent studies show that Pleurotus species can be cultivated on sterilized straw compost [6]. Fasidi and Kadiri [7] found that Lentinus subnudus, a Nigerian edi-ble mushroom grew best on Andropogan tectorum (Poaceae) straw supplemented with 30% rice bran or milled cassava peels. Fructification also occurred on logs of Spondias mombin and unfermented compost compris-ing straw, rice bran, horse dung and CaSO4.
In Nigeria, cassava peels are one of the important wastes generated during the processing of cassava for garri production. It is proposed to crush the peels and allow this to ferment with the liquid squeezed out from the cassava mash (second waste in garri production) hav-ing microorganisms capable of hydrolyzing the gluco-sides. The resulting product is dried and used as animal feed. But if it will be useful as a substrate, then this will be a direct way of cleaning the environment. Pleurotus sajor-caju is an exotic and highly nutritive species and its cultivation should be encouraged to supplement the pro-tein requirements of Nigerians. To guarantee optimal mycelial growth, also formalin was used as a sterilant, because there are no up-to-date decrees or legislative regulations concerning its use in food production. This study, therefore, aims at investigating the growth of the oyster mushroom using cassava peels, an agricultural waste, as the main substrate.
MATERIALS AND METHODS
The pure culture of Pleurotus sajor-caju was ob-tained from I. O. Fasidi, Department of Botany and Mi-crobiology at the University of Ibadan. Fresh cultures were got by regular subculturing on potato dextrose agar medium.
Cassava peels were collected fresh from the cassava flour mill at Abadina, University of Ibadan, sun-dried for

© by PSP Volume 24 – No 3. 2002 Advances in Food Sciences
95
a period of one hour and then macerated in a laboratory mill into particles of about 5 mm in diameter.
Effects of sterilants
The effect of some sterilants on the rates of contami-nation and growth of P. sajor-caju mycelia on cassava peel substrate was determined. The sterilants Chlorox and for-malin were prepared in different concentrations (Chlorox, 10% and 20% (v/v); formalin, 0.5%, 1.0% and 2.0% (v/v)). 15 g of ground cassava peels were weighed into each petri dish containing 10 ml of sterilant solution. Then the mix-ture was stirred until the substrates were well-moistened. The plates were then cooked at 100 °C for a period of one hour in a waterbath and steam-sterilized in an autoclave at 121 °C for 30 min or left on the bench unsterilized.
Effect of biocides
Two fungicides, Benlate and Brestan, an insecticide roger 40 and sterilants fermalin and Aldrex T were pre-pared in different concentrations � 0.5%, 1.0% and 2.0%. For Benlate solution, 10ml of absoluten alcohol was added to dissolve the powder and the volume was made up to 100ml with sterile distilled water. Fifteen grammes of ground cassava peels were weighed into each isolate; 10ml of sterilant solution was pipetted into each plates the mixture was well stirred so that the substrate is well soaked.
Effect of additives
The effect of some mineral salts (calcium sulphate, calcium carbonate, ammonium nitrate ammonium sul-phate and urea) as additives on the rate of mycelial growth on cassava peels was investigated. These salts
were prepared in various concentrations, 0.1%, 0.5%, 1.0% and 2.0% (w/v).
15 g of ground cassava peels were weighed into each petri dish, followed by addition of 10 ml of salt solution with different concentrations and, finally, mixed thor-oughly with the cassava peels as substrate.
Also the effect of a mixture of two mineral salts, cal-cium carbonate and calcium sulphate, on the mycelial growth of the fungus was tested. A fixed concentration of CaSO4 (0.2%) with varying amounts of CaCO3 (0.2%, 0.4%, 2.0% and 4.0% w/v) was used. Into each petri dish containing 15 g of ground cassava peels, 5 ml of 0.2% CaSO4 (w/v) was pipetted, followed by the addi-tion of 5 ml each of the CaCO3 solutions in different concentrations. Afterwards the solutions were mixed thoroughly with the cassava peels.
In the set-up, 10 ml distilled water served as control solution and each treatment was carried out in triplicate. The petri dishes were wrapped with aluminium foil and autoclaved at 121 °C for 30 min. After cooling each of the substrates was inoculated in the centre with an agar plug (0.7 mm) obtained from a 7-day old pure culture of Pleu-rotus sajor-caju by means of a sterile cork borer. These sets of plates were then incubated at 30 ± 2 °C and read-ings of linear growth of mycelia on each plate were taken at 2-day intervals for a period of 8 days except for the experiments with biocides where readings were taken daily for a period of 7 days.
The ANOVA test was used to determine the effect of the treatments on the growth of mycelia of the fungus (P < 0.05 and P<0.01). The data were further analyzed using the LSD test at (P<0.05 and P<0.01).
TABLE 1 - Effectiveness of different methods of sterilization on rates of mycelial growth of Pleurotus sajor-caju
Substrates Diameter of mycelial growth (mm) CP + water + autoclaving (control) 6.38 ± 0.32 CP + 10% chlorox and autoclaving 5.40 ± 0.65 ns CP + 10% chlorox and cooking 6.38 ± 0.38 ns CP + 10% chlorox and left unsterilized C CP + 20% chlorox and autoclaving 5.25 ± 0.25ns CP + 20% chlorox and cooking 4.63 ± 0.88ns CP + 20% chlorox and left unsterilzed C CP + 0.5% formalin and autoclaving 6.65 ± 0.20ns CP + 0.5% formalin and cooking C CP + 0.5% formalin and left unsterilized C CP + 1.0% formalin and autoclaving 4.28 ± 0.15ns CP + 1.0% formalin and cooking C CP + 1.0% formalin and left unsterilized C CP + 2.0% formalin and autoclaving 4.23 ± 0.13ns CP + 2.0% formalin and cooking 0.70 ± 0.00 CP + 2.0% formalin and left unsterilized C
Each figure is a mean of 3 readings ± standard error taken on 8th day. CP = cassava peels; C = No growth recorded due to contamination; ns = values not significant (P < 0.05, P < 0.001) by LSD test; * = Significant (P<0.05) by LSD test; ** = Highly significant at (P < 0.05 and P < 0.01) by LSD test.

© by PSP Volume 24 – No 3. 2002 Advances in Food Sciences
96
TABLE 2 - Effect of some biocides on mycelial growth of Pleurotus. sajor – caju on cassava peels.
Substrates Diameter of mycelial growth (mm) CP + water (control) 5.50 ± 0.06 CP + 0.5% Aldrex T 5.05 ± 0.19ns CP + 1.0% Aldrex T 5.55 ± 0.00ns CP + 2.0% Aldrex T 4.85 ± 0.08ns CP + 0.5% Benlate 1.70 ± 0.10** CP + 1.0% Benlate 2.87 ± 0.13** CP + 2.0% Benlate 1.78 ± 0.46** CP + 0.5 % Brestan concn 4.80 ± 0.46ns CP + 1.0% Brestan concn. 4.75 ± 0.13ns CP + 2.0% Brestan concn 3.50 ± 0.06** CP + 0.5% formalin 6.18 ± 0.09** CP + 1.0% formalin 4.50 ± 0.00* CP + 2.0% formalin 0.70 ± 0.00** CP + 0.5% Rogor 40 4.25 ± 0.25** CP + 1.0% Rogor 40 3.22 ± 0.53** CP + 2.0% Rogor 40 1.69 ± 0.14**
Each figure is a mean of 3 readings ± standard error taken on 7th day. CP = cassava peels; ns = values not significant (P < 0.05, P < 0.001) by LSD test. * = Significant (P<0.05) by LSD test; ** = Highly significant at (P < 0.05 and P < 0.01) by LSD test.
RESULTS AND DISCUSSION
In all the substrates to which sterilants (Chlorox or formalin) were added followed by antoclaving, good myce-lial growth was observed, even in the control, but the un-sterilized substrate resulted in a serious culture contamina-tion (Table 1). The LSD test showed no significant differ-ence (P < 0.05 and P< 0.01) between control and all treat-ments except that of 2.0% formalin and cooking. Pizer [8] reported that steam sterilization for one hour at 20 lbs pres-sure prior to inoculation with spawn, altered the physical nature of the composts by dispersing starch and also brought about coagulation of proteins. He also found that the effect of sterilization on mycelial growth of fungus was dependent on the nature of the compost, the previous treatment and time of sterilization. Pleurotus sajor-caju exhibited lower mycelial growth on most of the substrates, to which biocides were added, compared to the control (Table 1). Better mycelial growth, however, was recorded on substrates to which 1.0% Aldrex T and 0.5% formalin were added, the latter stimulating better growth (Table 2). Lowest mycelial growth was recorded at 2.0% concentra-tions of the biocides with the lowest growth rate for forma-lin. Benlate and Rogor 40 at all concentrations had a highly significant effect (P<0.01) on mycelial growth, the former being a fungicide and the latter an insecticide. Brestan only recorded a highly significant effect (P≤ 0.05) at 2.0% (w/v), possibly its most efficacious concentration.
Formalin had highly significant effects (P ≤ 0.05) at concentrations of 0.5% and 2.0% (v/v). The low concen-tration coupled with autoclaving might have provided a selective substrate favourable for mycelia and other con-
taminations. This is in agreement with findings of Gen-ders [9] who used formalin as a sterilant before and dur-ing the process of composting either to prevent the spread of brown plaster mould or to sterilize soil sometimes used for casing where sterilization equipments are not avail-able. In the series of experiments, when CaSO4, CaCO3, NH4NO3, (NH4)2SO4 and urea were added, the fungus showed the best mycelial growth on the substrate to which 0.1% (w/v) concentration of the salts was added, except CaCO3, where optimal growth was achieved at a concentration of 1.0% (Table 3).
Duggar [10] found in his experiments that some slight advantages resulted from the inclusion of calcium com-pounds. Pizer and Thompson [11] suggested that the addi-tion of small amounts (0.5 parts of calcium per 100 parts of dry compost) flocculated the manure and that this was the most suitable for rapid, vigorous growth. Calcium has also been found to be an indispensable nutrient, since it is physiologically antagonistic to potassium and magnesium and also overcomes the inhibitory effect of these elements on the growth of the mycelium [12]. Calcium sulphate (gypsum) is a �conditioner� or �fertilizer�, which improves the yield of mushrooms when cultivated in the laboratory and on commercial basis, because of its indirect activity by improving conditioning of manure compost overcom-ing greasiness, excessive moisture, excess ammonia and excess alkalinity [13]. CaCO3 has been found to be less effective at concentrations of 0.1% and 0.5% (w/v), probably due to its low solubility under alkaline condi-tions or possibly that alkali carbonate is formed by base exchange, increased pH and had a detrimental effect on the structure of the mature culture [10]. Calcium has also been used to adjust the levels of pH between 7 and 8 [13].

© by PSP Volume 24 – No 3. 2002 Advances in Food Sciences
97
TABLE 3 - Effect of additives on mycelial growth of P. sajor. caju on cassava peels.
Substrates Diameter of mycelial growth (mm) CP + water (control) 6.00 ± 0.00 CP + 0.1% CaSO4 6.60 ± 0.20ns CP + 0.5 % CaSO4 5.92 ± 0.69ns CP + 1.0% CaSO4 4.63 ± 0.10* CP + 2.0% CaSO4 4.63 ± 0.10* CP + 0.1% CaCO3 6.52 ± 0.76ns CP + 0.5% CaCO3 5.77 ± 0.02ns CP + 1.0% CaCO3 7.07 ± 0.44* CP + 2.0% CaCO3 6.08 ± 0.08ns CP + 0.1% NH4NO3 6.75 ± 0.75ns CP + 0.5% NH4NO3 4.60 ± 0.40** CP + 1.0% NH4NO3 4.51 ± 0.06** CP + 2.0% NH4NO3 5.14 + 0.39ns CP + 0.1% (NH4)2SO4 7.75 ± 0.25** CP + 0.5% (NH4)2SO4 6.25 ± 0.05ns CP + 1.0% (NH4)2SO4 4.91 ± 0.05* CP + 2.0% (NH4)SO4 4.45 ± 0.20** CP + 0.1% urea 6.48 ± 0.38ns CP + 0.5% urea 6.28 ± 0.53ns CP + 1.0% urea 5.60 ± 0.10ns CP + 2.0% urea 5.30 ± 0.30ns
Each figure is a mean of 3 readings ± standard error taken on 8th day. ns = values not significant (P < 0.05, P < 0.001) by LSD test * = Significant (P<0.05) by LSD test; ** = Highly significant at (P < 0.05 and P < 0.01) by LSD test.
Duggar [10] found in his experiments that some slight
advantages resulted from the inclusion of calcium com-pounds. Pizer and Thompson [11] suggested that the addi-tion of small amounts (0.5 parts of calcium per 100 parts of dry compost) flocculated the manure and that this was the most suitable for rapid, vigorous growth. Calcium has also been found to be an indispensable nutrient, since it is physiologically antagonistic to potassium and magnesium and also overcomes the inhibitory effect of these elements on the growth of the mycelium [12]. Calcium sulphate (gypsum) is a �conditioner� or �fertilizer�, which improves the yield of mushrooms when cultivated in the laboratory and on commercial basis, because of its indirect activity by improving conditioning of manure compost overcom-ing greasiness, excessive moisture, excess ammonia and excess alkalinity [13]. CaCO3 has been found to be less effective at concentrations of 0.1% and 0.5% (w/v), probably due to its low solubility under alkaline condi-tions or possibly that alkali carbonate is formed by base exchange, increased pH and had a detrimental effect on the structure of the mature culture [10]. Calcium has also been used to adjust the levels of pH between 7 and 8 [13].
The addition of ammonium salts at 0.1% (w/v) levels resulted in better mycelial growth, compared to the control. Styer [14] reported ammonium salts as useful sources of nitrogen, the most complex being the most effective. A decrease in mycelial growth of the fungus with increase in the concentration of salts was also observed. This might be
due to the fact that mushroom mycelium is high in nitrogen (6.44% of its dry weight) with nearly half of this nitrogen in a water-soluble form and that ammonium salts of strong acids soon develop a highly acidic substratum that the my-celium is inhibited and eventually killed [15]. Zadrazil [16] recorded that inorganic nitrogen (e.g. ammonium nitrate) increases the yield of fruit bodies by about 30%. Addition of urea at all concentrations had no significant effect on growth of the fungus. This is in contrast to the findings of Styer [14] who reported that urea has been recognized as a utilizable nitrogen source and is sometimes more suitable than amino-acids in certain edible mushrooms.
Pleurotus sajor-caju showed better mycelial growth than the control on all the substrates to which a mixture of mineral salts was added. No significant difference (P<0.05, P<0.01) was observed when the individual treatments were compared with the control by means of the LSD test.
From these results it is clear that P. sajor-caju, an ex-otic species, can be cultivated in the tropical laboratory or in large quantities in the field on composts of cassava peels with 0.1% (w/v) of calcium sulphate, ammonium nitrate, ammonium sulphate, urea and 1.0% of calcium carbonate. The addition of biocides such as formalin at 0.5% as a sterilant followed by autoclaving to reduce the high rate of contamination by other fungi and microorgan-isms will ultimately result in better fruit body production of P. sajor-caju on cassava peels.

© by PSP Volume 24 – No 3. 2002 Advances in Food Sciences
98
TABLE 4 - Effect of a mixture of additives on growth of P. sajor-caju on cassava peels.
Substrates Diameter of mycelial growth (mm) CP + water (Control) 4.88 ± 0.19 CP + 0.2% CaS04 + 0.2% CaC03 4.88 ± 0.38ns CP + 0.2% CaS04 + 1.0% CaC03 5.10 ± 0.10ns CP + 0.2% CaS04 + 2.0% CaCo3 5.32 ± 0.20ns CP + 0.2% CaS04 + 4.0% Cac03 5.0 ± 0.29ns
Each figure is a mean of 3 readings ± standard error taken on 8th day. ns = values not significant (P < 0.05, P < 0.001) by LSD test.
REFERENCES
[1] Kadiri; M. and Fasidi, I. O. (1990a). Nig. J. Sci 24: 86 � 9.
[2] Oso, B. A. (1977). Mycologia 69 (2): 271-279.
[3] Fasidi, Isola O. and Olorunmaiye, Kehinde S. (1994). Food Chem. 50, 397-401.
[4] Falck, R. (1917). Z. forst. Jagdires 4: 159 � 165.
[5] Lozovoi, V. D. (1980). Rastit Resur 16 (1): 38 � 45.
[6] Chandrashekar, Y. R.; Bano, Z. and Rajarathnan, S. (1981). Trans Brit. Mycol. Soc. 77 (3): 491 � 495.
[7] Fasidi, I. O. and Kadiri, M. (1993). Rev. Biol. Trop. 4(3): 411 � 415.
[8] Pizer, N. H. (1937). J. Agric Sci. 27: 349 � 376.
[9] Genders, R. (1982). Mushroom growing for everyone. Ist ed. Faber and Faber publication 115pp.
[10] Duggar, B. M. (1905). U.S. Dept. Agr. Bur. Pl. Ind. Bull. 85: 1 � 60.
[11] Pizer, N. H. and Thompson, A. J. (1938). J. Agric Sc. 28: 604 � 617.
[12] Treschow, C. (1944). Dansk. Botanisk Arkiv. 11: 1 � 180.
[13] Singer, R. C. (1961). Mushrooms and Truffles. Botany cultiva-tion and utilization. World crops books 1st ed. interscience pub-lishers (nc 272 pp).
[14] Styer, J. F. (1928). Amer. J. Bot. 15: 246 � 250.
[15] Waksman and Nissen, W. (1932). Amer. J. Bot. 19: 514 � 537.
[16] Zadrazil, F. (1980). Eur. J. Appl. Microbiol. Biotechnicol 9: 31 � 35.
Received for publication: March 14, 2002 Accepted for publication: September 10, 2002 CORRESPONDING AUTHOR
C.O. Adenipekun Department of Botany and Microbiology University of Ibadan Ibadan - NIGERIA e-mail: [email protected]
AFS/ Vol 24/ No 3/ 2002 – pages 94 - 98
© by PSP Volume 24 – No 3. 2002 Advances in Food Sciences
99
ANTIOXIDANT PROPERTIES OF OLIVE PHENOLIC COMPOUNDS ON SUNFLOWER OIL STABILITY
R. S Farag, N. M. Abd-Elmoien and E. A. Mahmoud
Biochemistry Department, Faculty of Agriculture, Cairo University, Giza, Egypt.
SUMMARY The phenolic compounds from ripe leaves and fruits
of Kronakii olive variety were extracted and fractionated into three major fractions, i. e., free, esterified and resid-ual phenolic acids. These fractions were individually mixed with sunflower oil in different concentrations (100, 200 and 400 ppm) to assess their antihydrolytic and anti-oxidant behaviour. Some measurements of rancidity were conducted by estimating e.g., acid, peroxide and thiobar-bituric acid values for sunflower oil alone and mixed with phenolic components during storage at room temperature. The antihydrolytic and antioxidant phenomena of olive phenolic compounds were compared with BHT activity as a common synthetic antioxidant.
Total and free polyphenols obtained from both leaves
and fruits of Kronakii olive cultivar possessed antihydro-lytic and antioxidant activities increasing with concentra-tion. At 400 ppm level they exhibited remarkable effects, superior to those of BHT, in retarding sunflower oil sta-bility.
KEYWORDS: Polyphenols, olive fruits and leaves, sunflower oil, quality assurance tests, rancidity.
INTRODUCTION
Lipid peroxidation causes various damages not only in living organisms but also in foods. To retard undesir-able changes in lipids due to oxidation it is necessary to add antioxidants to food products before use [1, 2]. The most common antioxidants are tocopherols and synthetic phenolic compounds such as butylated hydroxy anisole (BHA) and butylated hydroxy toluene (BHT). The use of BHT or BHA in food has been decreased because of their suspected action as promoters of carcinogenesis, as well as the general consumer rejection of synthetic food addi-tives [3]. In addition, BHA and BHT are characterized by high volatility and instability at elevated temperatures [4].
Therefore, there is a great need for substituting the aforementioned synthetic antioxidants by other natural antioxidants [1, 5, 6].
Among the most important natural antioxidants are
tocopherols and ascorbic acid. Tocopherols are potent in vivo inhibitors of lipid peroxidation but they are less ef-fective than BHA or BHT as food antioxidants [6]. Melted beeswax and its unsaponifiable constituents were mixed with butter oil or refined cottonseed oil to study the hydrolytic and oxidative effects of the mixtures [7]. The unsaponifiables at different levels exhibited anti-hydrolytic and antioxidant effects on butter oil and refined cottonseed oil, respectively. Xinchu et al. [8] found that petroleum ether, acetic acid, ether and alcohol (95%) extracts of different parts of Salvia plebeia induced an antioxidant activity. Thyme and cumin essential oils were used to prevent cottonseed oil and butter rancidity during storage at room temperature [1]. In addition, thyme and clove essential oils are quite safe and can be applied prac-tically as natural antioxidants for lipids [9]. Charai et al. [10] studied the effect of essential oils obtained from certain aromatic plants as natural antioxidants for olive oil. Their results showed a wide variation in the antioxi-dant activity of the essential oils and the highest activity was observed with Thymus broussonetti essential oil.
The aim of the present work was to extract and frac-
tionate the total polyphenols from the leaves and fruits of Kronakii olive cultivar, i.e., free, esterified and residual phenolic compounds. These fractions were individually added to sunflower oil to increase its stability and to com-pare their antioxidant activity with BHT.
MATERIALS AND METHODS
Source of olive leaves and fruits
The leaves and ripe olive fruits of Kronakii cultivar were collected during the season 2000 from the Horticul-ture Research Institute, Ministry of Agriculture, Giza, Cairo, Egypt.

© by PSP Volume 24 – No 3. 2002 Advances in Food Sciences
100
Solvents and Reagents
All solvents were distilled before use. Butylated hy-droxy toluene (BHT) and thiobarbituric acid (TBA) were purchased from Sigma Chemical Co., St Louis, MO, USA; and Gerbsaure Chemical Co. Ltd., Germany, re-spectively.
Sunflower oil
Refined sunflower oil was obtained from Cairo Oil and Soap Co., El-Ayat, Giza, Egypt. The oil peroxide and acid values were 2.0 meq/kg and 0.4 mg KOH/1g oil, respectively.
Extraction of olive polyphenols:
The polyphenols of olive fruits and leaves were ex-tracted with ethanol followed by centrifugation at 1,500 g for 15 min. The ethanolic extracts were dried over anhy-drous sodium sulfate and evaporated to dryness [11].
Fractionation of polyphenols
Free, esterified and residual phenolic fractions were separated from olive fruits and leaves of Kronakii cultivar according to the method of Dabrowski and Sosulski [12]. Free phenolic acids were initially extracted with tetrahy-drofuran containing NaBH4 (0.5%), followed by extrac-tion of soluble phenolic esters with a mixture of metha-nol: acetone: water (7:7:6, v/v/v). Alkaline hydrolysis was employed, followed by extraction with a mixture of di-ethyl ether: ethyl acetate: tetrahydrofuran (1:1:1, v/v/v) to obtain the insoluble bound phenolic acids.
Oxidation systems
Different concentrations of total, free, esterified and residual phenolic compounds (100, 200, 400 ppm) and BHT (200 ppm) were individually added to sunflower oil. The antihydrolytic and antioxidant activities of each phe-nolic fraction were examined by the acid, peroxide and thiobarbituric acid tests daily over a period of 18 days. These values were used to compare the effectiveness of the phenolic fractions on sunflower oil stability.
Quality assurance methods
The acid and peroxide values were determined using Standard American Oil Chemists Society methods (A. O. C. S. [13]). The secondary oxidation products were de-termined by the thiobarbituric acid (TBA) test [14]. Three replications were run for each parameter during sunflower oil storage and the mean values are presented in the text.
Statistical analysis
The data of quality assurance tests were subjected to analysis of variance with a randomised complete block design to partition the effects of different parameters [15]. The simple regression coefficient (reaction slope) for acid value was statistically calculated.
RESULTS AND DISCUSSION
There is currently a great worldwide interest in find-ing new and safe antioxidants from natural sources to prevent food rancidity. The present study was focused on olive polyphenols which do not induce undesirable odour or taste, when separated from olive leaves and fruits of Kronakii variety (very cheap natural source) into 3 major fractions, i.e., free, esterified and residual phenolic com-pounds. These fractions were added individually to sun-flower oil at various concentrations besides the total poly-phenols in order to extend its shelf-life.
The antioxidant and antihydrolytic activities of the various olive phenolic components under study were determined by comparing their efficiency with the most commonly used synthetic antioxidants (BHT, BHA and PG added to fats and oils at concentrations of 100-400 ppm to suppress the development of peroxides during food stor-age (Allen and Hamilton, [16]). For this, in the experi-ment BHT (200 ppm) was mixed only with sunflower oil. The phenolic fractions were added at concentrations of 100, 200 and 400 ppm. The changes in efficiency were determined by the commonly used methods such as acid, peroxide and thiobarbituric acid values.
Fig. 1 shows the changes in acid values of sunflower oil mixed with phenolic fractions of olive leaves and fruits of Kronakii variety, and BHT during storage at room temperature. The acid values for sunflower oil alone, sunflower oil mixed with BHT, and total, free, esterified or residual phenolic fractions linearly increased with the storage period. To evaluate the effectiveness of the phenolic material added to sunflower oil, the reaction slope of the acid value curves was used as a guide in this context. Accordingly, the slope values for the acidity of sunflower oil alone and mixed with BHT (200 ppm), and total (100, 200, 400 ppm) and free (100, 200, 400 ppm) phenolic fractions of Kronakii leaves were 0.5; 0.3; 0.4, 0.3, 0.1; and 0.4, 0.3, 0.2, respectively. The slope values of the acid value curves representing the esterified (100, 200, 400 ppm) and residual (100, 200, 400 ppm) phenolic fractions of Kronakii leaves were identical (0.5). Slope values higher than 0.5 indicate pro-hydrolytic effects, whereas those lower than 0.5 demonstrate anti-hydrolytic activity. Hence, the systems containing BHT, total and free phenolic fractions exhibited an anti-hydrolytic activ-ity. Conversely, esterified and residual phenolic fractions at various levels caused non-significant anti-hydrolytic activity on sunflower oil.
The slope values of sunflower oil acidity using the phenolic fractions of Kronakii fruits were nearly similar to that obtained from the leaves. In general, total and free polyphenols possessed an anti-hydrolytic activity, which was increased by increasing their concentration. Also, one has to point out that the use of the latter two fractions at 400 ppm level significantly exhibited anti-hydrolytic activity and were superior to that of BHT in retarding sunflower oil hydrolytic rancidity.

© by PSP Volume 24 – No 3. 2002 Advances in Food Sciences
101
FIGURE 1 - Effect of total (T), free (F), residual (R) and esterified (E) polyphenolic compounds of Kronakii olive fruits and leaves on the acid value of sunflower oil.

© by PSP Volume 24 – No 3. 2002 Advances in Food Sciences
102
FIGURE 2 -Effect of total (T), free (F), residual (R) and esterified (E) polyphenolic compounds of Kronakii olive fruits and leaves on peroxide value of sunflower oil.

© by PSP Volume 24 – No 3. 2002 Advances in Food Sciences
103
FIGURE 3 – Effect of total (T), free (F), residual (R) and esterified (E) polyphenolic compounds of Kronakii olive fruits and leaves on thiobarbituric acid (TBA) value of sunflower oil.

© by PSP Volume 24 – No 3. 2002 Advances in Food Sciences
104
Fig. 2 shows the changes in peroxide values of sun-flower oil mixed with phenolic fractions obtained for both leaves and fruits of Kronakii olive cultivars during storage. An autocatalytic chain reaction was induced, i.e., the rate of hydroperoxide formation increased non-linearly with the time. Since the curves in Fig. 2 show an increase in perox-ide values with time, the peroxide values at the 14th day of storage for all systems were divided by that of the control (sunflower oil without any additives) to demonstrate the effect on the stability of sunflower oil. Therefore, a value higher than 1.0 indicates pro-oxidant effects while the values lower demonstrate anti-oxidant activity. Sunflower oil mixed only with BHT (200 ppm) was used as a control guide to indicate the anti-oxidant or pro-oxidant activities. The relative peroxide values for BHT (200 ppm), total (100, 200, 400 ppm) and free (100, 200, 400 ppm) phenolic componds of Kronakii leaves were 0.26; 0.40, 0.26, 0.12 and 0.40, 0.26, 0.12, respectively, and those for esterified (100, 200, 400 ppm) and residual (100, 200, 400 ppm) phenolic compounds of Kronakii leaves were all identical (1.0). The relative values for all systems using phenolic compounds from olive fruits were calculated as mentioned before and the values were nearly similar to those obtained from leaves of Kronakii olive cultivar.
The antioxidant values for the systems containing
200 ppm of total and free phenolic compounds from Kronakii olive leaves and fruits exhibited antioxidant activity similar to a system comprised of sunflower oil and BHT (200 ppm). On the other hand, the addition of esterified and residual phenolic compounds to sunflower oil of both leaves and fruits at various concentrations (100, 200, 400 ppm) did not exhibit any antioxidant activ-ity on sunflower oil. It is worth-mentioning that 400 ppm level of total and free phenolic compounds obtained from both leaves and fruits produced superior antioxidant power compared to that of BHT.
Fig. 3 shows the TBA values for the systems sun-
flower oil (control), sunflower oil plus BHT (200 ppm), total (100, 200, 400 ppm), free (100, 200, 400 ppm), esteri-fied (100, 200, 400 ppm) and residual (100, 200, 400 ppm) phenolic compounds extracted from leaves and fruits of Kronakii olive cultivar. The levels of secondary oxidation products from sunflower oil were very low and gradually increased with time. The addition of BHT and total or free phenolic fractions of olive leaves and fruits to sunflower oil significantly decreased the formation of secondary oxidation products at all concentrations, with their de-creasing tendency by increasing the levels of free and total phenolic fractions. The content of secondary oxida-tion products at the 16th day of storage period for sun-flower oil containing 100, 200, and 400 ppm of total and free phenolic compounds extracted from Kronakii leaves were 0.36, 0.21, 0.07 and 0.37, 0.23, 0.07, respectively, and nearly identical to those using the fruit phenolic com-pounds (0.36, 0.21, 0.09 and 0.36, 0.21, 0.07). On the other hand, the esterified and residual fractions of both
fruits and leaves did not cause any significant decrease of the level of secondary oxidation products.
Several authors extracted various phenolic com-
pounds from different plant sources and they generally caused an increase in the shelf-life of some vegetable oils. For instance, polyphenols were extracted from the olive oil using hexane, acetone and ethanol in a simple sequen-tial procedure yielding three fractions, A, B, and C, by Fayad et al. [17]. Fractions B and C were found to contain the highest ortho-diphenol concentrations (about 3%). The addition of purified fraction B at a level of 100 ppm to refined olive or soybean oils partially inhibited the oxidative deterioration when the oils were stored in the dark at 100 ºC. Also, Xing and White [18] reported that the antioxidant activities of oat groats and hulls increased with increasing concentrations. During 20 days of storage the groat extract (0.3%) was not significantly different from tertiary butyl hydroquinone (TBHQ) after day 16, and hull extracts (0.2 and 0.3%) were not significantly different from TBHQ on day 20. The antioxidative activ-ity of the total and free polyphenolic fractions tested, in general, could be attributed to the presence of hydroxyl groups in the phenolic ring. This is supported by the pow-erful antioxiant activites of the well-known synthetic BHT and the natural antioxidant thymol [19, 20]. The antioxidant activity to BHT or thymol is related to the inhibition of hydroperoxide formation. The first step in lipid oxidation is the abstraction of a hydrogen atom from a fatty acid and oxygen involvement gives a peroxy radi-cal. Generally, the antioxidants suppress the abstraction of hydrogen atoms from a fatty acid moiety which leads to the decrease of hydroperoxide formation. It is well-known that the phenolic compounds act as hydrogen donors in this reaction mixture and, therefore, the formation of hydroperoxides is decreased. The results of the present study are in agreement with these statements. The pheno-lic OH groups have to be in the free form and, if attached to other groups (such as glycosidic residues), it would prevent their antioxidant power due to the lack of hydro-gen atoms donated to fatty acid radicals. This hypothesis is supported by the fact that the total and free phenolic com-pounds induced powerful antioxidant effect, while the esterified and residual phenolic compounds exhibited only a low effect on retarding sunflower oil oxidative rancidity.
REFERENCES
[1] Farag, R. S.; Ali, M. N. and Taha, S. H. (1990). Use of some essential oils as natural preservatives for butter. J. Am. Oil Chem. Soc. 68: 188-191.
[2] Buck, D. F. and Edwards, M. K. (1997). Antioxidants to pro-long shelf-life. Food Technology International, 29:33-37.
[3] Namiki; M. (1990). Antioxidants/ antimutagenes in food. Crit. Riv. Food Sci. Nutr., 29: 273-279.

© by PSP Volume 24 – No 3. 2002 Advances in Food Sciences
105
[4] Dapkevicius A.; Venskutonis, R. ; Beek, T. A. and Linssen, J. P. H. (1998). Antioxidant activity of extracts obtained by different isolation procedures from some aromatic herbs grown in Lithuania. J. Sci. Food. Agric., 77 :140-146.
[5] Pratt, D. E. (1992) . Natural antioxidants from plant materi-als, in phenolic compounds in food and their effect on health. Ed. By M. T. Hung, C.T. Ho and C. Y. Lee, American Chemical Society, New York, PP. 55-71.
[6] Tsimidou, M. and Boskou, D. (1994). Antioxidant activity of essential oils from the plants of the lamiacae family. G. Charalambous (Ed) Spices Herbs and Edible fungi.
[7] Farag, R. S.; Hassan, M. N. A. and Ali, F. M. (1993). Bees-wax and its unsaponifiable components as natural preserva-tives for butter and cottonseed oils. J. Food Sci. & Nutr., 44: 197-205.
[8] Xinchu, W., Goufeng, C. ; Xinwei, D. and Shan, D. (1998). Antioxidant activity of lizhicaa (Salvia plebeia R. Br.). J. Chinese Cereals and Oils Association. 13: 25-28.
[9] Farag, R. S.; Abu-Raiia, S. H. and El-Desoy, G. E. and El-Baroty, G. S. A. (1991). Safety evaluation of thyme and clove essential oils as natural antioxidants. African J. of Ag-ricultural Sciences, 18:168-176.
[10] Charai, M.; Faid, M. and Chaouch, A. (1999). Essential oils from aromatic plants (Thysmus broussonetti Boiss., Ori-ganum compactum Benth., and citrus limon (L.) N. L. Burm.) as natural antioxidants for olive oil. J. Essen. Oil Res., 11 : 517-521.
[11] Kanner, J.; Edwin, F., Rina, G.; Bruce, G. and John, E. (1994). Natural antioxidants in graps and wines. J. Agric. Food. Chem., 42, 64-69.
[12] Dabrowski, K. J. and Sosulski, F. W. (1984). Composition of free and hydrolyzable phenolic acids in defatted flours of ten oilseeds. J. Agric Food Chem. 32: 128-130.
[13] A.O.C.S. (1985). Official and Tentative Methods of the American Oil Chemists Society, 3rd ed. American Oil Chem-ists Society, Champaign, IL.
[14] Ottolenghi, A. (1959). Interaction of ascorbic acid and mitochondrial lipids. Arch. Biochem. Biophys. 79:355-363.
[15] Steel, R. G. D., Torrie, J.H. (1980). Principles and procedures of Statistics, 3rd edn. McGraw-Hill, New York, U.S.A.
[16] Allen, J. C. and Hamilton. R. J. (1983). Rancidity in Food., pp. 85-173. London and New York. Applied Science Pub-lishers.
[17] Fayad, Z.; Sheabar, A. and Neemann, I. (1989). Separation and concentration of natural antioxidants from the rape of ol-ives., 65:990-993.
[18] Xing, Y. and White, P. (1997). Identification and function of antioxidants from oat groats and hulls. J. Am. Oil Chem. Soc. 74 :303-307.
[19] Farag, R. S. and El-Khowas, K. H. M. M. (1989). Influence of γ-irradiation and microwaves on the antioxidant property of some essential oils. Ibid, 49:109-115
[20] Topallar. H., Bayrak, Y. and Iscan, M. J. (1997). A kinetic study of the autooxidantion of sunflower seed oil. J. Am. Oil Chem. Soc. 74: 1323-1327.
Received for publication: May 21, 2002 Accepted for publication: July 17, 2002 CORRESPONDING AUTHOR
R. S. Farag Biochemistry Department Faculty of Agriculture Cairo University P.O.Box 12613 Giza - EGYPT e-mail: [email protected]
AFS/ Vol 24/ No 3/ 2002 – pages 99 - 105

© by PSP Volume 24 – No 3. 2002 Advances in Food Sciences
106
GLYKOSIDISCH GEBUNDENE AROMASTOFFE IN HOPFEN (Humulus lupulus L.):
1. ENZYMATISCHE FREISETZUNG VON AGLYCONEN
H. Kollmannsberger und S. Nitz
Department Lebensmittel und Ernährung, Lehrstuhl für Chem.-Techn. Analyse u. Chem. Lebensmitteltechnologie; Technische Universität München,
Wissenschaftszentrum Weihenstephan für Ernährung, Landnutzung und Umwelt, Weihenstephaner Steig 23, D-85350 Freising-Weihenstephan, FRG
GLYCOSIDICALLY BOUND FLAVOUR COMPOUNDS IN HOP (Humulus lupulus L.): 1. ENZYMATICAL LIBARATION OF AGLYCONES.
SUMMARY
The efficiency of different enzyme preparations (al-mond ß-glucosidase, glucosidase from Aspergillus niger, pectinase, hesperidinase, α-amylase, a amylase-mixture, a hemicellulase preparation) for the cleavage of glycosidically bound flavour compounds of hops (Humulus lupulus L.) was investigated. Enzymes were added to either synthetic ß-D-glucosides (phenyl- and octyl-) or hop extracts. The hop extracts were made by extraction with a water-methanol mixture, or by hot-water extraction and subse-quent adsorption on an Amberlite XAD-2 resin. The iso-lated aglycones were investigated by gas chromatography - mass spectrometry. Main compounds among the agly-cones were 3-methylbutan-2-ol, 3- and 2-methyl-butan-1-ol, 3-methyl-2-buten-1-ol, 3-methylpentan-2-ol, 3(Z)-hexenol, hexanol, 1-octen-3-ol, benzylalcohol, 2-phenyl-ethanol, linalool, α-terpineol, methylsalicylate, 2,6-di-methylocta-2,7-dien-1,6-diol, 3-hydroxy-7,8-dihydro-ß-ionol, 3-hydroxy-5,6-epoxy-ß-ionol, vomifoliol and 7,8-dihydro-vomifoliol. Additionally small amounts of 3-hy-droxy-ß-damascone, a precursor of the sensorial impor-tant ß-damascenone could be found among the aglycones. Best yields of aglycones could be achieved with glucosi-dase from Aspergillus niger and with rapidase (a hemicel-lulase preparation with glycosidic activities). Commer-cially available α−amylase was found to be not suitable for hydrolysis of hop glycosides.
KEYWORDS: Humulus lupulus L., hop flavour, glycosidically bound volatiles, glycosides, aglycones, enzymatic hydrolysis.
ZUSAMMENFASSUNG
Verschiedene Enzympräparate (ß-Glucosidase aus Mandeln, Glucosidase aus Aspergillus niger, Pectinase, Hesperidinase, α-Amylase, ein Amylase-Gemisch, ein Hemicellulase-Präparat) wurden auf ihre Eignung zur Spaltung von glycosidisch gebundenen Aromastoffen des Hopfens (Humulus lupulus L.) untersucht. Dazu wurden synthetische ß-D-Glucoside (Phenyl- und Octyl-), wäss-rig-methanolische Hopfenextrakte und säulenchroma-tographisch über Amberlite XAD-2 aufgereinigte Hop-fenextrakte mit den Enzymen versetzt und die extraktiv abgetrennten Aglycone gaschromatographisch-massen-spektrometrisch untersucht. Als mengenmäßig dominante Aglycone fanden sich 3-Methylbutan-2-ol, 3- und 2-Me-thylbutan-1-ol, 3-Methyl-2-buten-1-ol, 3-Methylpentan-2-ol, 3(Z)-Hexenol, Hexanol, 1-Octen-3-ol, Benzylalkohol, 2-Phenylethanol, Linalool, α-Terpineol, Methylsalicylat, (E)-2,6-Dimethyl-Octa-2,7-dien-1,6-diol, 3-Hydroxy-7,8-dihydro-ß-Ionol, 3-Hydroxy-5,6-epoxy-ß-Ionol, Vomifo-liol und 7,8-Dihydro-Vomifoliol. 3-Hydroxy-ß-Damas-con, aus dem durch Dehydratisierung der starke Geruchs-stoff ß-Damascenon gebildet werden kann, war ebenfalls in geringen Mengen unter den Aglyconen nachweisbar. Die besten Ausbeuten an Aglyconen ergaben sich mit Glucoside aus Aspergillus niger und mit Rapidase (ein Hemicellulase-Präparat mit glycosidischen Nebenaktivitä-ten). Handelsübliche α−Amylase eignet sich nicht zur Spaltung von Hopfenglycosiden.
EINLEITUNG
Glycoside (früher �Heteroside� genannt) sind eine umfangreiche Gruppe von Pflanzeninhaltsstoffen, welche sich aus einem oder mehreren Zuckern und einem oder mehreren Aglyconen (= Nicht-Zucker-Molekül-Anteilen) zusammensetzen. Das Aglycon ist dabei über ein Sauer-stoffatom (Ether-Bindung) an ein Halbacetal-Kohlenstoff-atom eines Zuckers gebunden. Der am häufigsten natür-

© by PSP Volume 24 – No 3. 2002 Advances in Food Sciences
107
lich vorkommende Zuckerrest der Glycoside ist die in ß-Stellung verknüpfte D-Glucose. Man nennt diese Glyco-side dann ß-D-Glucoside. Auch Disaccharid-Glycoside (z.B. Glucosyl-, Arabinosyl-, Rhamnosyl-, Xylosyl- und Apiosyl-Gucoside) kommen in der Natur vor [1].
Schon früh wurde die Bedeutung von Glycosiden als
Vorstufen für wertgebende Aromastoffe in Vanille [2], Rosenblättern [3] und Weintrauben [4] erkannt. Seither konnte eine Vielzahl von Glycosiden mit über 200 unter-schiedlichen Aglycon-Strukturen in fast 170 Pflanzenar-ten aus etwa 50 Pflanzenfamilien nachgewiesen werden [1, 5]. Auch in den Rückständen der CO2-Hochdruck-extraktion von Hopfen (Humulus lupulus L.) wurde kürz-lich das Vorkommen glycosidisch gebundener Aroma-stoffe beschrieben [6,7].
Glycoside werden als Speicher- bzw. Transportform
von Aromastoffen angesehen [1]. Möglicherweise kommt ihnen auch eine gewisse Schutzwirkung zu. Empfindliche Zellmembranen könnten von hohen Gehalten an freien phenolischen oder terpenoiden Alkoholen geschädigt werden [5]. Glycoside sind geruchlos, entsprechende Aro-mastoffe lassen sich daraus jedoch durch Erhitzen im Sau-ren oder durch enzymatische Hydrolyse freisetzen. Emp-findliche Aglyconstrukturen können bei der Hydrolyse der Glycoside strukturell verändert werden [8 - 10]. Beispiele dafür sind die Bildung des äußerst geruchsaktiven ß-Damascenons aus 3-Hydroxy-ß-Damascon und 3-Hydroxy-7,8-Dehydro-ß-Jonol [11], die Bildung der Rosenoxide aus 2,6-Dimethyl-3-Octen-2,8-diol [12] oder die Bildung von Linalool und α-Terpineol aus Neryl-glycosid [9].
Glycosidextrakte können nach entsprechender Deri-
vatisierung auch direkt gaschromatographisch untersucht werden [1]. Meist begnügt man sich jedoch damit, nur die durch gezielte enzymatische Hydrolyse freisetzbaren Aglykone zu messen. Hierzu müssen die Glycoside zu-nächst aus dem Pflanzenmaterial isoliert werden. Bei Blattmaterial wird üblicherweise mit kochendem Wasser [13,14], Methanol [15] oder einem Wasser-Methanol-Gemisch (80:20 v/v) [6] extrahiert. Methanolzusatz be-wirkt dabei auch eine Fällung von Protein (und damit eine Inaktivierung von Enzymen) [13]. Andere störende Be-standteile wie Polyphenole können durch Bindung an Polyvinylpyrrolidon eliminiert werden [13]. Dann folgt meist eine säulenchromatographische Aufreinigung an RP-18 [3,16,17] oder Amberlite XAD-2 [11,13,18,19]). Um freie Zucker auszuwaschen wird zunächst mit Wasser eluiert. Dem folgt meist eine Elution freier Aromastoffe mit Pentan [11,18,19], Pentan-Ether [13], Ether [6] oder Pentan-Dichlormethan [20,21], bevor die Glycoside mit Methanol [13,19,21,22] oder Ethylacetat [18,20] abgelöst werden. Die so gewonnene Glycosidfraktion kann nun (nach Entfernen des Methanols) unter definierten Bedin-gungen (optimaler pH-Wert und Temperatur) einer enzy-matischen Hydrolyse unterworfen werden. Nach entspre-chender Inkubationszeit (8h [14,15], 12h [18], 16h [8,19],
24h [6,23,24] 48 h [17], 72h [22,25]) werden die Aglycone isoliert und gaschromatographisch-massenspektrometrisch nachgewiesen. Einige Schnellmethoden verzichten auf die säulenchromatographische Aufreinigung [14], wobei hier eine Glycosidhydrolyse nur mit einer, gegenüber störenden Bestandteilen toleranten Glucosidase gelingt [26].
Zur enzymatischen Spaltung der Glycoside verwen-
det man meist ß-Glucosidase aus Mandeln (�Emulsin�, EC 3.2.1.21) [22]. Pectinasen (Pectinol [14], Rohapect C [20] Pectinase aus A.niger [19]) können bessere Ergebnis-se liefern. Pectinol VR ist weniger geeignet [27]. Die Effizienz der Hydrolyse hängt nicht nur von der Inkubati-onsdauer und dem pH-Wert, sondern auch von der Struk-tur der Aglycone und dem Ursprung des Enzymes ab [1, 28, 29]. Tertiäre Alkohole wie Linalool und α-Terpineol werden besser durch Glucosidase aus Aspergilus niger als durch Glucosidase aus Mandeln gespalten [28]. Die Unspezifität gegenüber tertiären Alkoholen ist vielen pflanzlichen Glycosidasen eigen [26]. Zur Spaltung von Glycosiden des Vomifoliols und anderer nor-Carotinoide eignet sich kommerziell erhältliche Hesperidinase [23]. Zur Analyse von Aglyconen hat sich auch ein Hemicellu-lase-Präparat der Fa. Gist-Brocades (Seclin, Frankreich) bewährt [21].
Mittels einer Appatatur zur kontinuierlichen Freiset-
zung von Aglyconen durch mehrmalige enzymatische Spaltungen der selben Probe (Simultane Enzym Katalyse Extraktion, SECE) [23] konnte beobachtet werden, daß sich die Konzentration der freigesetzten Aglycone mit der Zeit ändert. Die sensorisch interessanten C13-nor-Isoprenoide wurden dabei erst in späteren Hydrolysestu-fen in größeren Mengen freigesetzt [23].
Problematisch ist auch die Hydrolyse von Disaccha-
rid-Glycosiden, da hier zuerst der an die Glucose gebun-dene andere Zuckerrest abgespalten werden muß, um dann der ß-Glucosidase als Substrat dienen zu können [30]. Entsprechende Enzymnebenaktivitäten sind hierbei für eine möglichst vollständige Glycosidspaltung unerläß-lich. Dies läßt sich auch durch die kombinierte Verwen-dung mehrerer Enzympräparate erreichen [21].
Im Rahmen unserer Untersuchungen über glycosi-
disch gebundene Aromastoffe des Hopfens berichten wir hiermit über die Eignung verschiedener Enzympräparate zur Freisetzung von Aglyconen aus Hopfenglycosiden.
MATERIAL UND METHODEN
Probenmaterial: getrocknete Hopfendolden (gerntet im Jahr 2000) der Sorten Hallertauer Mittelfrüh (HHA), Hallertauer Tradition (HHT), Hallertauer Magnum (HHM), Hallertauer Hersbrucker (HHE), Czechischer Saazer (CSA) bezogen über Fa. Hopsteiner (HHV), D-84048 Mainburg. Phenyl-ß-D-Glucosid und Octyl-ß-D-

© by PSP Volume 24 – No 3. 2002 Advances in Food Sciences
108
Glucosid von Sigma-Aldrich, Chromatographie-Harz Amberlite XAD-2 von Sigma-Aldrich, Methanol puriss p.a. (99,8% GC) von Fluka, Polyclar AT pract von Serva.
Enzyme: ß-D-Glucosidase aus Mandeln (Emulsin, EC
3.2.1.21; 6,3 U/mg), Glucosidase aus Aspergillus niger (76 U/g), Pectinase aus Aspergillus niger (EC 3.2.1.15; 2,5 U/mg), Hesperidinase (7 U/g mit α-L-Rhamnosidase und ß-D-Glucosidase Activität) von Sigma-Aldrich. α-Amylase (Termamyl-120L) und Amylase-Mix (SAN Super 240L mit α-Amylase, Gluco-Amylase, Protease, stabilisiert mit Benzoe- und Sorbinsäure) von Novozymes DK-2880 Bagsvaerd. Ein nicht komerziell verfügbares Hemicellulase-Präparat mit glycosidischen Nebenaktivitä-ten (�Rapidase F-64�) wurde uns dankenswerterweise von Herrn Dipl.-Ing. B. Heimann, DSM Food Specialities, D-44319 Dortmund zur Verfügung gestellt (Dieses Präparat entspricht der in der Literatur [21] beschriebenen Hemi-cellulase REG2, von Gist-Brocades, Frankreich).
Modell-Lösung: jeweils 2,44 µM Phenyl-ß-D-Glucosid
und 1,62 µM Octyl-ß-D-Glucosid in 25 ml Phosphat-Citrat-Puffer (21 g Citronensäure-monohydrat und 71,5 g Na2HPO4 x 12 H2O pro Liter H2O dest., pH 5,0) lösen.
Hopfen-Extraktion: ca. 80 g Hopfendolden (Gemisch
aus HHA, HHE und CSA) im Mörser fein zerreiben und nach Zusatz von 19,5 µM Phenyl-ß-D-Glucosid mit einer Mischung aus 800 ml Methanol und 200 ml H2O 16 h rühren. Flüssige Phase über Glaswolle abdekantieren, 10 min mit 40 g Polyclar rühren und filtrieren. Am Rotati-onsverdampfer Methanol abziehen (40°C, 250-70 mbar). Wässrige Lösung (ca. 150 ml) 3mal mit 100 ml Diethy-lether ausschütteln. Anschließend zur Trockne einengen und Rückstand in 200 ml Phosphat-Citrat-Puffer, pH 5,0 aufnehmen und auf 8 Inkubationsgefäße verteilen. Jeder Ansatz enthält demnach 2,44µM Phenyl-ß-D-Glucosid und ca. 10 g Hopfen in 25 ml Puffer.
TABELLE 1 - Enzymzusatz bei den Inkubationsversuchen.
Probe Enzym Menge BW keines keine AMY α-Amylase 2,5 ml AMX Amylase-Mix 2,5 ml PCT Pectinase 100 mg HSP Hesperidinase 250 mg GLM Mandel-Glucosidase 25 mg GLA Asp. niger-Glucosidase 50 mg HEM Hemicellulase 25 mg
Vergleich der Enzymaktivitäten: Die Modell-Lösungen
bzw. die Hopfenansätze jeweils mit Enzympräparat verset-zen (siehe Tab. 1) und 66 h im Wasserbad (40°C) unter Rühren inkubieren. Anschließend Zugabe von 0,5 ml Stan-
dard-Lösung (Methyl-Octanoat 1g/l) und Isolierung der freigesetzten Aglycone durch 4-maliges Ausschütteln mit 50 ml Diethylether. Trocknung der Extrakte über Na2SO4 und Aufkonzentrierung an einer Vigreuxkolonne (40°C).
Säulenchromatographische Reinigung an XAD-2: jeweils
25 g fein zerriebene Hopfendolden (HHA, HHT, HHE, HHM, CSA) mit 5 µM Phenyl-ß-D-Glucosid versetzen und mit kochendem Wasser extrahieren. Nach Klärung mit Polyclar und Proteinfällung mit Methanol, zur Trockne einengen und in Wasser gelöst auf eine XAD-Säule auf-bringen. Elution mit 1 Liter H2O (6 ml/min), 500 ml Pen-tan-Dichlormethan (2:1 v/v, 7 ml/min) und 500 ml Methanol (5ml/min). Methanolisches Eluat zur Trockne einengen und in 50 ml Phosphat-Citrat-Puffer pH 5,0 aufnehmen. Jeweils 25 ml ohne Zusatz und 25 ml mit 25 mg ß-Glucosidase, 24 h bei 40°C unter Rühren inkubieren (vgl. [31]). Extraktion mit Diethylether wie oben.
Gaschromatographie-Massenspektrometrie (GC-MS): HP 5890 Ser. II Gaschromatograph direkt gekoppelt
mit Finnigan 8200 Magnetsektorfeld-Massenspektro-meter. EI-Modus, 70 eV, 33-400 amu, Injektor 250 °C, Transferleitung 230 °C, Ionenquelle 240 °C Temperatur-programm 60°C (5min), mit 2°C/min auf 260°C. Träger-gas Helium (1,15 ml/min bei 60°C), Split 1:10. Trennsäule TS1: SE 54 (DB 5 J&W), 30m x 0,25mm i.D., df 0,25 µm.
Siemens SiChromat II GC direkt gekoppelt mit Finnigan
8222 Magnetsektorfeld-MS EI-Modus, 70 eV; 35-600 amu, Injektor 250 °C; Transferleitung 200 °C Ionenquelle 180 °C; Sniffing-Modul 250 °C; Temperaturprogramm 100°C, mit 5min auf 250°C bzw. 60°C mit 5°C/min auf 250°C. Trä-gergas Helium (3 ml/min bei 100 °C); Split 1:10; Trennsäule TS2: SE54 (Supelco SPB-5); 30 m x 0,53 mm i.D., df 1,5 µm. Der Trägergasstrom wird am Ende der Kapillartrennsäule über ein Live-T-Stück aufgesplittet zum MS und zur mit angefeuchteter Preßluft gespülten Sniffing-Maske. (Splitverhältnis ca. 1:1)
Finnigan 9600 GC direkt gekoppelt mit Finnigan
4500 Quadrupole-MS. EI-Modus, 70 eV, 33-400 amu, Injektor 200°C, Transferleitung 200 °C, Ionenquelle 150°C, Temperaturprogramm 60°C (10min) mit 2°C/min auf 200°C. Trägergas Helium 1 ml/min, Split 1:10, Trennsäule TS3: CW20M (Permabond, M&N) 50 m x 0,25 mm i.D., df 0,25 µm.
Identifizierung: Die Identifizierung erfolgte durch
Vergleich von Massenspektren (MS) und Retentionsindi-ces (RITS1, RITS2 und RITS3) mit Daten von authenti-schen Referenzsubstanzen bzw. entsprechend abgesicher-ten Daten einer unter denselben GC-MS-Bedingungen erstellten MS/RI-Bibliothek (Kollmannsberger, Weihen-stephan). Wo keine Vergleichssubstanz zur Verfügung stand, wurde zur Identifizierung auf entsprechende Litera-turangaben zurückgegriffen.

© by PSP Volume 24 – No 3. 2002 Advances in Food Sciences
109
ERGEBNISSE UND DISKUSSION
In Tabelle 2 sind die, mit den verschiedenen Enzym-präparaten aus synthetischen Glucosiden freisetzbaren Gehalte der Aglyconen wiedergegeben. Es fällt auf, daß bei 66-stündiger Inkubation bereits im Blindwert ein Um-satz von 10 % (Octyl-Glucosid) bzw. 24 % (Phenyl-Glucosid) stattfindet. Bei 24-stündiger Inkubation liegen diese Werte noch deutlich niedriger (3-7% der theoreti-schen Menge).
TABELLE 2 - Freisetzung von Aglyconen (µg/Ansatz) aus synthetischem ß-D-Phenyl- (PHE) und ß-D-Octyl-Glucosid (OCT) durch verschiedene Enzympräparate (Inkubation 66 h, 40°C)
Probe: PHE a) (+/-)b) OCT a) (+/-)b) theoret. c) 229 210 BW 54 3 22 2 AMY 134 3 62 4 AMX 251 18 196 15 PCT 191 4 174 5 HSP 200 2 166 2 GLM 201 9 200 7 GLA 231 10 216 19 HEM 233 11 180 7
a) Mittelwert aus Doppelbestimmung
b) Abweichung bei Doppelbestimmung c) theroretisch erzielbarer Wert
24
59
110
83 87 88101 102
020406080
100120
BW AMY AMX PCT HSP GLM GLA HEM
1030
9383 79
95 10386
020406080
100120
BW AMY AMX PCT HSP GLM GLA HEM
ABBILDUNG 1 - Hydrolyse (%) von synthetischem ß-D-Phenyl- (PHE) und ß-D-Octyl-Glucosid (OCT) durch verschiedene Enzym-präparate (Inkubation 66 h, 40°C).
Die schlechteste Ausbeute an Aglyconen erhält man
mit dem α-Amylase-Präparat (AMY), während das Amy-lase-Gemisch (AMX) mit den synthetischen Glucosiden
erstaunlich hohe Werte liefert. Die beiden Glucosidasen (GLM, GLA) zeigen in den eingesetzten Konzentrationen eine höhere Spezifität für das aliphatische Octyl-ß-D-Glucosid. Das Hemicellulase-Präparat (HEM) und die Hesperidinase (HSP) scheinen das Phenyl-ß-D-Glucosid als Substrat zu bevorzugen. In Abb.1 sind die prozentua-len Ausbeuten an Aglyconen bezogen auf den theoretisch erreichbaren Wert dargestellt. Bei nur 24-stündiger Inku-bation mit ß-Glucosidase bzw. Hemicellulase betragen die Ausbeuten bei beiden Aglyconen etwa 76-78 % des nach 66-stündiger Inkubation erzielbaren Wertes. Neben der Inkubationsdauer ist natürlich auch die Konzentration an Enzym von entscheidenden Einfluß auf die Effizienz der Hydrolyse. Bei Inkubation von synthetischem Phenyl-ß-D-Glucopyranosid mit nur 25 mg A. niger Glucosidase wur-den nur 73 % des mit 50 mg der Glucosidase unter ansons-ten gleichen Bedingungen freigesetzten Phenols gemessen.
In Tabelle 3 sind die, mit den verschiedenen Enzym-
präparaten aus einer Hopfenprobe freisetzbaren Aglycone zusammengestellt. Die Ausbeuten einiger typischer Agly-cone sind in Abb. 2 graphisch dargestellt. Wiederum bestätigt sich die geringe Aktivität der α-Amylase (AMY), sowie die hohe Spezifität der A. niger Glucosida-se (GLA) und der Hemicellulase (HEM) für das auch hier zugesetzte Phenyl-ß-D-Glucosid. Das Amylase-Gemisch (AMX) zeigt in dem nicht säulenchromatographisch auf-gereinigten Hopfenextrakt eine deutlich geringere Hydro-lyse-Effizienz für das Phenylglucosid als in der Modell-Lösung (Abb. 1). Möglicherweise wirken hier nicht abge-trennte Hopfenbestandteile inhibierend.
Sehr gute Ausbeuten an allen Aglyconen erzielt man
mit der A. niger Glucosidase (GLA), während die anderen Enzympräparate offensichtlich eine starke Substratspezifi-tät aufweisen.
1-Octen-3-ol wird am besten durch die beiden Gluco-
sidasen (GLM, GLA) freigesetzt (Abb. 2). Bei den tertiä-ren Alkoholen α-Terpineol und Linalool lassen sich mit dem Hemicellulase-Präparat (HEM) die besten Ergebnis-se erzielen. Hesperidase (HSP) liefert nur bei einigen nor-Carotinoid-Derivaten brauchbare Resultate. Mit dem Amylase-Gemisch (AMX) werden die höchsten Werte für 3-Methyl-2-Pentanol und Vomifoliol erzielt (Abb. 2). Während mit Mandel-Glucosidase (GLM) nur ver-gleichsweise wenig Vomifoliol gefunden wird, läßt sich damit der höchste Gehalt an 3-Hydroxy-5,6-epoxy-ß-Jonol freisetzen (Tab.3).
2,6-Dimethyl-2,7-Octadien-1,6-diol (= 8-Hydroxy-
Linalool) verhält sich sehr ähnlich wie andere primäre Alkohole (Z.B. 3-Methylbutanol, 3Z-Hexenol und Benzy-lalkohol). Dies könnte ein Hinweis darauf sein, daß es über die endständige und nicht über die tertiäre OH-Gruppe glykosidisch verknüpft ist.
PHE
OCT

© by PSP Volume 24 – No 3. 2002 Advances in Food Sciences
110
ABBILDUNG 2 - Freisetzung von Aglyconen aus Hopfenextrakten durch verschiedene Enzympräparate
Phenol
7 26
170200 192 204
253225
050
100150200250300
BW AMY AMX PCT HSP GLM GLA HEM
Linalool
0 0 3 5 6 715
22
0102030
BW AMY AMX PCT HSP GLM GLA HEM
3-Hydroxy-ß-Damascon
0 01
45
3
65
0123456
BW AMY AMX PCT HSP GLM GLA HEM
3-Hydroxy-7,8-dihydro-ß-Jonol
0 5
45 43 58 59
132
74
0
50
100
150
BW AMY AMX PCT HSP GLM GLA HEM
2,6-Dimethyl-2,7-Octadien-1,6-diol 2
1846
124 134
77
124
237
142
0
50
100
150
200
250
BW AMY AMX PCT HSP GLM GLA HEM
7,8-dihydro-Vomifoliol
0 0
31
119 9
10
02468
1012
BW AMY AMX PCT HSP GLM GLA HEM
1-Octen-3-ol
0 334 21
59 74
124
55
0
50
100
150
BW AMY AMX PCT HSP GLM GLA HEM
Vomifoliol
6
30
60
15
40
12
40
20
0
20
40
60
80
BW AMY AMX PCT HSP GLM GLA HEM
3-Z-Hexenol
0 0
80 87
41
70
140
98
0
50
100
150
BW AMY AMX PCT HSP GLM GLA HEM
Benzylalkohol
1 9
84 9544
117
235
175
050
100150200250
BW AMY AMX PCT HSP GLM GLA HEM
Phenol
© by PSP Volume 24 – No 3. 2002 Advances in Food Sciences
111
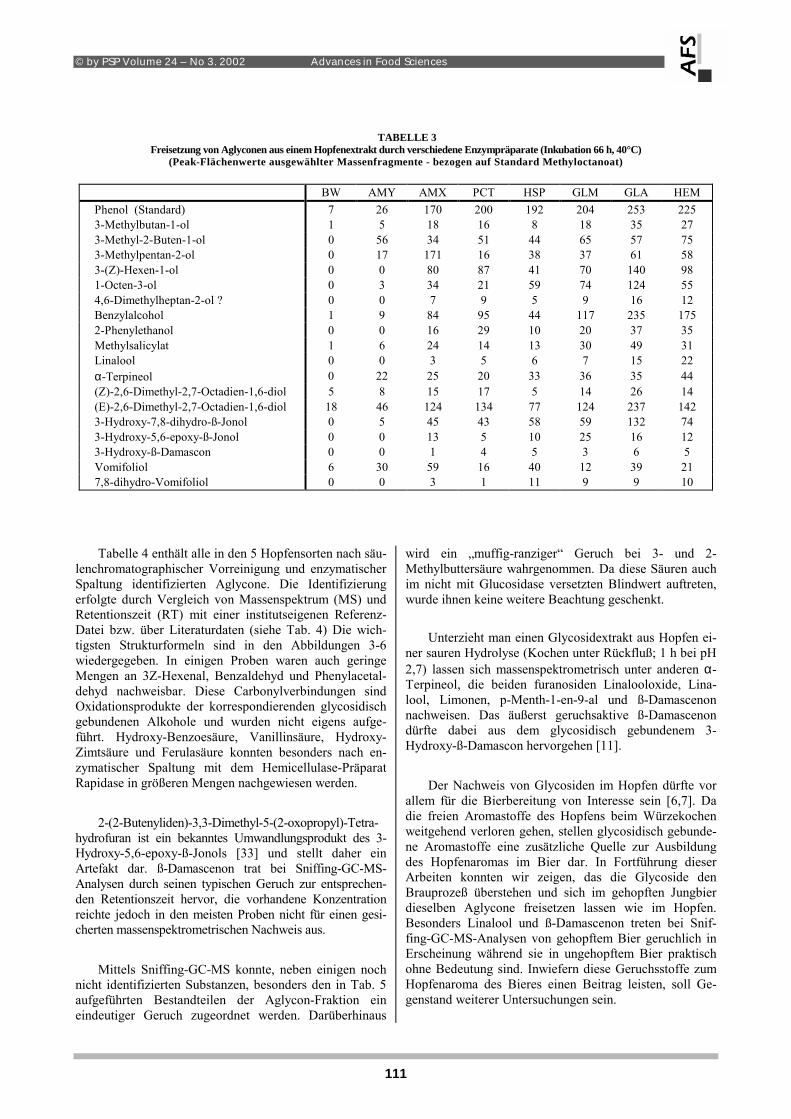
TABELLE 3 Freisetzung von Aglyconen aus einem Hopfenextrakt durch verschiedene Enzympräparate (Inkubation 66 h, 40°C)
(Peak-Flächenwerte ausgewählter Massenfragmente - bezogen auf Standard Methyloctanoat)
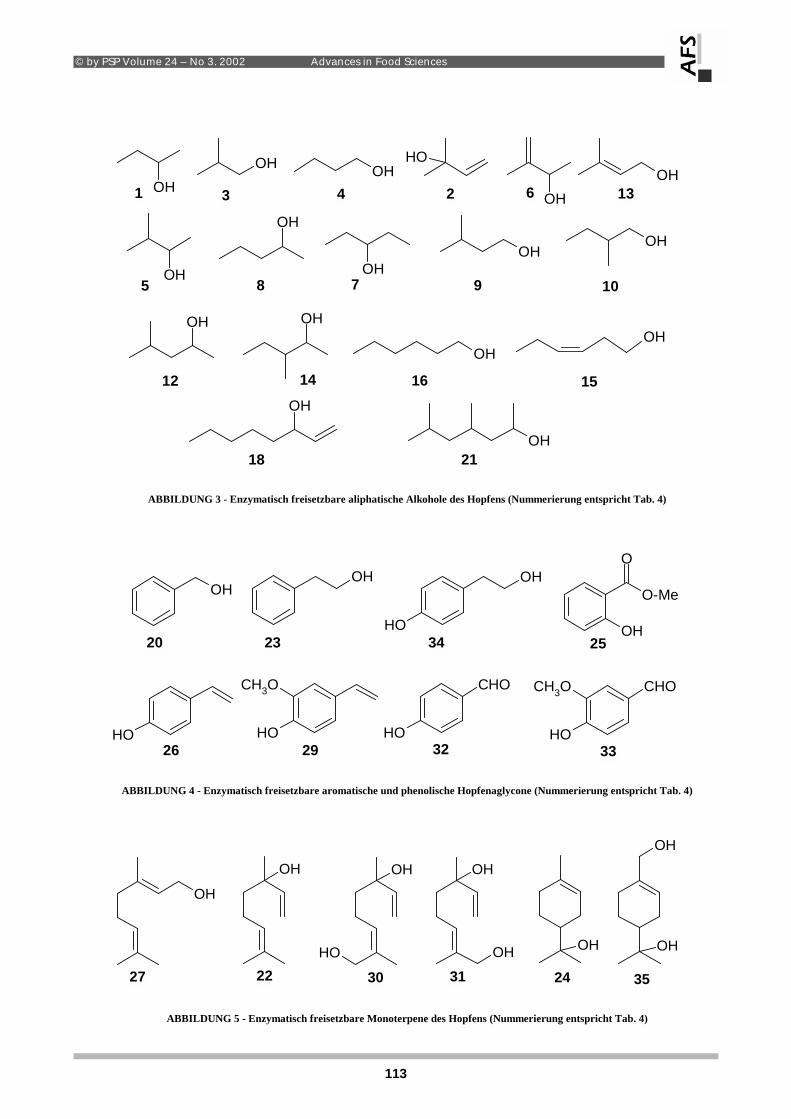
BW AMY AMX PCT HSP GLM GLA HEM Phenol (Standard) 7 26 170 200 192 204 253 225 3-Methylbutan-1-ol 1 5 18 16 8 18 35 27 3-Methyl-2-Buten-1-ol 0 56 34 51 44 65 57 75 3-Methylpentan-2-ol 0 17 171 16 38 37 61 58 3-(Z)-Hexen-1-ol 0 0 80 87 41 70 140 98 1-Octen-3-ol 0 3 34 21 59 74 124 55 4,6-Dimethylheptan-2-ol ? 0 0 7 9 5 9 16 12 Benzylalcohol 1 9 84 95 44 117 235 175 2-Phenylethanol 0 0 16 29 10 20 37 35 Methylsalicylat 1 6 24 14 13 30 49 31 Linalool 0 0 3 5 6 7 15 22 α-Terpineol 0 22 25 20 33 36 35 44 (Z)-2,6-Dimethyl-2,7-Octadien-1,6-diol 5 8 15 17 5 14 26 14 (E)-2,6-Dimethyl-2,7-Octadien-1,6-diol 18 46 124 134 77 124 237 142 3-Hydroxy-7,8-dihydro-ß-Jonol 0 5 45 43 58 59 132 74 3-Hydroxy-5,6-epoxy-ß-Jonol 0 0 13 5 10 25 16 12 3-Hydroxy-ß-Damascon 0 0 1 4 5 3 6 5 Vomifoliol 6 30 59 16 40 12 39 21 7,8-dihydro-Vomifoliol 0 0 3 1 11 9 9 10 Tabelle 4 enthält alle in den 5 Hopfensorten nach säu-
lenchromatographischer Vorreinigung und enzymatischer Spaltung identifizierten Aglycone. Die Identifizierung erfolgte durch Vergleich von Massenspektrum (MS) und Retentionszeit (RT) mit einer institutseigenen Referenz-Datei bzw. über Literaturdaten (siehe Tab. 4) Die wich-tigsten Strukturformeln sind in den Abbildungen 3-6 wiedergegeben. In einigen Proben waren auch geringe Mengen an 3Z-Hexenal, Benzaldehyd und Phenylacetal-dehyd nachweisbar. Diese Carbonylverbindungen sind Oxidationsprodukte der korrespondierenden glycosidisch gebundenen Alkohole und wurden nicht eigens aufge-führt. Hydroxy-Benzoesäure, Vanillinsäure, Hydroxy-Zimtsäure und Ferulasäure konnten besonders nach en-zymatischer Spaltung mit dem Hemicellulase-Präparat Rapidase in größeren Mengen nachgewiesen werden.
2-(2-Butenyliden)-3,3-Dimethyl-5-(2-oxopropyl)-Tetra-
hydrofuran ist ein bekanntes Umwandlungsprodukt des 3-Hydroxy-5,6-epoxy-ß-Jonols [33] und stellt daher ein Artefakt dar. ß-Damascenon trat bei Sniffing-GC-MS-Analysen durch seinen typischen Geruch zur entsprechen-den Retentionszeit hervor, die vorhandene Konzentration reichte jedoch in den meisten Proben nicht für einen gesi-cherten massenspektrometrischen Nachweis aus.
Mittels Sniffing-GC-MS konnte, neben einigen noch
nicht identifizierten Substanzen, besonders den in Tab. 5 aufgeführten Bestandteilen der Aglycon-Fraktion ein eindeutiger Geruch zugeordnet werden. Darüberhinaus
wird ein �muffig-ranziger� Geruch bei 3- und 2-Methylbuttersäure wahrgenommen. Da diese Säuren auch im nicht mit Glucosidase versetzten Blindwert auftreten, wurde ihnen keine weitere Beachtung geschenkt.
Unterzieht man einen Glycosidextrakt aus Hopfen ei-
ner sauren Hydrolyse (Kochen unter Rückfluß; 1 h bei pH 2,7) lassen sich massenspektrometrisch unter anderen α-Terpineol, die beiden furanosiden Linalooloxide, Lina-lool, Limonen, p-Menth-1-en-9-al und ß-Damascenon nachweisen. Das äußerst geruchsaktive ß-Damascenon dürfte dabei aus dem glycosidisch gebundenem 3-Hydroxy-ß-Damascon hervorgehen [11].
Der Nachweis von Glycosiden im Hopfen dürfte vor
allem für die Bierbereitung von Interesse sein [6,7]. Da die freien Aromastoffe des Hopfens beim Würzekochen weitgehend verloren gehen, stellen glycosidisch gebunde-ne Aromastoffe eine zusätzliche Quelle zur Ausbildung des Hopfenaromas im Bier dar. In Fortführung dieser Arbeiten konnten wir zeigen, das die Glycoside den Brauprozeß überstehen und sich im gehopften Jungbier dieselben Aglycone freisetzen lassen wie im Hopfen. Besonders Linalool und ß-Damascenon treten bei Snif-fing-GC-MS-Analysen von gehopftem Bier geruchlich in Erscheinung während sie in ungehopftem Bier praktisch ohne Bedeutung sind. Inwiefern diese Geruchsstoffe zum Hopfenaroma des Bieres einen Beitrag leisten, soll Ge-genstand weiterer Untersuchungen sein.

© by PSP Volume 24 – No 3. 2002 Advances in Food Sciences
112
TABELLE 4 - Durch enzymatische Spaltung freisetzbare Aglycone in säulenchroma- tographisch aufgereinigten wässrigen Extrakten aus verschiedenen Hopfensorten
Nr. Verbindung RI-TS1
RI-TS2
RI-TS3 m/e Identifi-
zierung
1 Butan-2-ol 613 1027 45,59-41,43,73 MS,RT 2 2-Methyl-3-Buten-2-ol 622 1041 43,71,59-53,86 MS,RT 3 2-Methyl-Propan-1-ol 632 1097 43-43,41,42,33,74 MS,RT 4 Butan-1-ol 674 1154 56-41,43,42,73 MS,RT 5 3-Methyl-Butan-2-ol 689 1096 45,55,73-43,87 MS,RT 6 3-Methyl-3-Buten-2-ol 696 1179 43,71-41,45,53,58,86 MS,RT 7 Pentan-3-ol ? 1114 59-41-55,58,57 MS,RT 8 Pentan-2-ol ? 1128 45-55,73,43 MS,RT 9 3-Methyl-Butan-1-ol 726 1217 55,42,70,41,43 MS,RT
10 2-Methyl-Butan-1-ol 730 1216 57,56,41,70 MS,RT 11 Pentan-1-ol ? 1263 42,55,70,41 MS,RT 12 4-Methyl-Pentan-2-ol 753 1175 45-43,69,84,87,57 MS,RT 13 3-Methyl-2-Buten-1-ol 793 772 1334 71,53,41,67,68,86 MS,RT 14 3-Methyl-Pentan-2-ol 789 1208 45-56,41,69,84,87 MS,RT 15 3Z-Hexenol 851 854 1393 67,41,82-55,69 MS,RT 16 Hexanol 865 864 1366 56-43,41,69,55,84 MS,RT 17 Cyclohexanol ? 887 898 1411 57,82-67,55,41 MS 18 1-Octen-3-ol 982 980 1461 57-72,43,81,85,99 MS,RT 19 Phenol (Standard) 983 990 2004 94,66,65,39 MS,RT 20 Benzylalkohol 1037 1050 1876 108,107,79,77 MS,RT 21 4,6-Dimethyl-heptan-2-ol ? 1055 1054 43,57,69,85,45,87,126,144 MS 22 Linalool 1099 1106 1555 71,93-41,55,80-121,136 MS,RT 23 Phenylethanol 1111 1135 1910 91,92,122,65 MS,RT
24 α-Terpineol 1192 1211 1699 59,93,121 MS,RT 25 Methylsalicylat 1188 1219 1774 120,152,92 MS,RT 26 4-Vinylphenol 1230 1245 2395 120,91 MS,RT 27 Geraniol 1253 1262 41,69-93,111,123 MS,RT 28 (ein Monoterpenalkohol?) 1272 1287 59-68,67,71,79,94,152 29 4-Vinylguajacol 1306 1339 2205 135,150- MS,RT 30 Z-2,6-Dimethyl-2,7-Octadien-1,6-diol 1343 1361 2268 43,71,67,55,68 [32] 31 E-2,6-Dimethyl-2,7-Octadien-1,6-diol 1363 1379 2308 43,71,67,55,68 [32] 32 4-Hydroxy-Benzaldehyd ? 1417 121,122,65,103 MS 33 Vanillin 1441 151,152,81,109 MS,RT 34 Tyrosol 1473 107,138,77 MS,RT 35 p-Menth-1-en-7,8-diol 1469 1504 2509 59,79,94 [19] 36 Hydroxy-Benzoesäure 1590 121,138,93,65 MS 37 Vanillinsäure 1613 168,153,97,125 MS
38 2-(2-Butenyliden)-3,3-Dimethyl-5-2-oxopropyl-Tetrahydrofuran 1589 1626 43,125,109,82,208,95,151 [33]
39 3-OH-ß-Damascon 1602 1637 2533 69,43,121,175,193,208 [34] 40 3-OH-7,8-dihydro-ß-Jonol 1651 1692 2627 121,43,119,93,105,136,-212 [22],[35] 41 3-OH-5,6-epoxy-ß-Jonol 1661 1703 43,125,109,82,208,107,166 [35] 42 3-OH-5,6-epoxy-ß-Jonon 1680 1715 123,43,109,95 [36] 43 3-OH-ß-Jonon 1715 43,175,193 [37] 44 Vomifoliol 1780 1837 124-43,79,135,150,168 [22],[38] 45 p-Hydroxy-Zimtsäure 1869 164,147,119,91,65 MS 46 7,8-Dihydro-Vomifoliol 1845 1898 43,110,111,152,96,68,170 [22] 47 Ferulasäure 1928 194,179,133,77,105 MS
© by PSP Volume 24 – No 3. 2002 Advances in Food Sciences
113
OHOH
OH
OH
OHOH
OH
OHOH
OH OH
OHOH
OH
1 3 2OH
4
5
OH
13OH6
8 7 9 10
12 14 16 15
18 21
ABBILDUNG 3 - Enzymatisch freisetzbare aliphatische Alkohole des Hopfens (Nummerierung entspricht Tab. 4)
OHOH
OH
O-Me
OOH
OH
OH OH
CH3O
OH
CHO
OH
CH3O CHO
20 23 34 25
26 29 32 33
ABBILDUNG 4 - Enzymatisch freisetzbare aromatische und phenolische Hopfenaglycone (Nummerierung entspricht Tab. 4)
OH
OH
OH
OH
OH
OH OH
OH
OH
27 22 30 31 24 35
ABBILDUNG 5 - Enzymatisch freisetzbare Monoterpene des Hopfens (Nummerierung entspricht Tab. 4)

© by PSP Volume 24 – No 3. 2002 Advances in Food Sciences
114
OH
OH
OH
OHO OO
OH
OOH
OH
OOH
OH
O O40 41 38
46 44 39 ß-Damascenon
-H2O
ABBILDUNG 6 - Enzymatisch freisetzbare Nor-Carotinoide des Hopfens (Nummerierung entspricht Tab. 4).
TABELLE 5 - Mittels Sniffing-GC-MS in enzymatisch hydroly-sierten Hopfenextrakten eindeutig zugeordnete Geruchsstoffe.
Verbindung Geruch 3Z-Hexenal grün-grasig 3Z-Hexenol grün-grasig 1-Octen-3-ol Champignon 2-Phenylacetaldehyd süß-wachsig Linalool blumig-citrus 2-Phenylethanol blumig, Wein Geraniol citrusartig ß-Damascenon blumig-fruchtig, Apfelsaft Vanillin Vanille
DANKSAGUNG
Für die Bereitstellung der Hopfenproben danken wir Herrn Dr. M. Biendl, HHV D-84048 Mainburg. Für die Überlasung eines Hemicellulase-Präparates (�Rapidase F-64�) danken wir Herrn Dipl.-Ing. B. Heimann, DSM Food Specialities, D-44319 Dortmund. Frau E. Schütz danken wir für ihre bewährte analytische Mitarbeit.
LITERATUR
[1] Crouzet, J., Chassagne, D., Glycosidically bound volatiles in plant, in Ikan, R (Editor) Naturally Occuring Glycosides, Wi-ley&sons, Chichester, p.225-274 (1999)
[2] Arana, F., Action of a ß-Glucosidase in the curing of vanilla; Food Research 8: 343-351 (1943)
[3] Francis, M.J.O., Allcock, C., ß-D-Glucoside; occurrence and synthesis in rose flowers, Phytochemistry 8: 1339-1347 (1969)
[4] Cordonnier, R., Bayonove, C., Mise en évidence dans la baie de raisin, var. Muscat d`Alexandrie, de monoterpenes liés, révélables par une ou plusieurs enzymes du fruit. C. R. Acad. Sci. Paris, (Ser. D.), 278: 3387-3390 (1974)
[5] Stahl-Biskup, E., Intert, F., Holthuijzen, J., Stengele, M., Schulz, G., Glycosidically bound volatiles - A Review 1986-1991, Flavour and Fragrance Journal 8: 61-80 (1993)
[6] Goldstein, H., Ting, P., Navarro, A., Ryder, D., Water-soluble hop flavor precursors and their role in beer flavor, EBC Congress p. 53-62 (1999)
[7] Goldstein, H., Ting, P.L., Schulze, W.G., Murakami, A.A., Lusk, L.T.,Young, V.D., Methods of making and using puri-fied kettle hop flavorants, US-Patent 5,972,411 (1999)
[8] Engel, K.-H., Tressl, R., Formation of aroma components from nonvolatile precursors in passion fruit. J. Agric. Food Chem. 31: 998-1002 (1983)*
[9] Williams, P.J., Strauss, C.R., Wilson, B., Massy-Westropp, R.A.; Studies on the Hydrolysis of vitis vinifera monoterpene precursor compounds an model monoterpene ß-D-Glucosides rationalizing the monoterpene composition of grapes; J. Ag-ric. Food Chem. 30: 1219-1223 (1982)
[10] Sefton, M.A., Williams, P.J., Generation of Oxidation Arti-facts during the hydrolysis of norisoprenoid glycosides by fungal enzyme preparations. J. Agric. Food Chem. 39: 1994-1997 (1991)
[11] Humpf, H.U., Schreier, P., Bound aroma compounds from the fruit and the leaves of blackberry (Rubus lacinista L.) J. Agric. Food Chem. 39: 1830-1832 (1991)
[12] Knapp, H., Straubinger, M., Fornari, S., Oka, N., Watanabe, N., Winterhalter P., S-3,7-Dimethyl-5-octene-1,7-diol and re-lated oxygenated monoterpenoids from petals of rosa damas-cena Mill., J. Agric Food Cem. 46: 1966-1970 (1998)
[13] Wang, D., Yoshimura, T., Kubota, K., Kobayashi, A.; Ana-lysis of glycosidically bound aroma precursors in tea leaves. J. Agric. Food Chem. 48: 5411-5418 (2000)

© by PSP Volume 24 – No 3. 2002 Advances in Food Sciences
115
[14] van den Dries, J.M.A., Baerheim Svendsen, A., A simple me-thod for detection of glycosidic bound monoterpenes and o-ther volatile compounds occuring in fresh plant material, Fla-vour and fragrance Journal 4: 59-61 (1989)
[15] Humpf, H.U., Schreier, P., 3-Hydroxy-5,6-epoxy-ß-ionol ß-D-glucopyranoside and 3-Hydroxy-7,8-dihydro-ß-ionol ß-D-glucopyranoside: new C13 norisoprenoid glucoconjugates from sloe tree (Prunus spinosa L.) leaves. J. Agric. Food Chem. 40: 1898-1901 (1992)
[16] Williams, P.J., Strauss, C.R., Wilson, B., Massy-Westropp, R.A.; Use of C18 reversed-Phase liquid Chromatography for the isolation of monoterpene glycosides and nor-isoprenoid precursors from grape juice and wines, J. Chromatogr. 235: 471-480 (1982)
[17] Winterhalter, P., Bound Terpenoids in the juice of the purple passion fruit (Passiflora edulis Sims), J. Agric. Food Chem. 38: 452-455 (1990)
[18] Günata, Y.Z., Bayonove, C.L., Baumes, R.L., Cordonnier, R.E., The aroma of grapes I. Extraction and determination of free and glycosidically bound fractions of some grape aroma components. J. Chromatogr. 331: 83-90 (1985)
[19] Sakho, M., Chassagne, D., Crouzet, J., African Mango glyco-sidically bound volatile compounds, J. Agic. Food Chem. 45: 883-888 (1997)
[20] Versini, G., Dalla Serra, A., Dell´Eva, M, Scienza, A., Rapp, A., Evidence of some glycosidically bound new monoterpe-nes and norisoprenoids in grapes, in Bioflavour´87 (editor: Schreier, P.), deGruyter, Berlin, p 161-170 (1988)
[21] Chassagne, D., Boulanger, R., Crouzet, J.; Enzymatic hydro-lysis of edible Passiflora fruit glycosides; Food Chemistry 66: 281-288 (1999)
[22] Winterhalter, P., Schreier, P., Free and bound C13 norisopre-noids in Quince (Cydonia oblonga, Mill.) fruit. J. Agric. Food Chem. 36: 1251-1256 (1988)
[23] Schwab, W., Schreier, P., Simultaneous Enzyme catalysis Extraction: A versatile technique for the study of flavor pre-cursors. J.Agric. Food Chem. 36: 1238-1242 (1988)
{24] Wilson, B, Strauss, C.R., Williams, P.J., Changes in free and glycosidically bound monoterpenes in developing muscat grapes; J. Agric. Food Chem. 32: 919-924 (1984)
[25] Wu, P., Kuo, M-C., Ho, C.T., Glycosidically bound aroma compounds in ginger (Zingiber officinale Roscoe), J. Agric. Food Chem. 38: 1553-1555 (1990)
[26] Aryan, A.P., Wilson, B., Strauss C.R., Williams, P.J., The pro-perties of glycosidases of Vitis vinifera and a comparison of their ß-glycosidase activity with that of exogenous enzymes. An assessment of possible applications in enology. American Journal of Enology and Viticulture 38: 182-188 (1987)
[27] Salles,C. Essaied, P., Chalier, P., Jallageas, J.C., Crouzet, J. Evidence and characterization of glycosidically bound volati-le components. Bioflavour´87 (editor: Schreier, P.), deGruy-ter, Berlin, p 145-160 (1988)
[28] Günata, Y.Z., Bayonove, C.L., Tapiero, C., Cordonnier, R.E., Hydrolysis of grape monoterpene ß-D-Glucosides by various ß-Glucosidases, J. Agric. Food Chem. 38: 1232-1236 (1990)
[29] Decker,C.H., Visser, J., Schreier, P. ß-Glucosidases from five black Aspergillus species: Study of their physico-chemical and biocatalytic properties. J. Agric. Food Chem. 48: 4929-4936 (2000)
[30] Günata, Y.Z., Bitteur, S., Brillouet, J.M., Bayonove, C.L., Cordonnier, R.E., Sequential enzymic hydrolysis of potenti-ally aromatic glycosides from grapes. Carbohydr. Res. 134: 139-149 (1988)
[31] Kollmannsberger, H., Nitz, S. Glykosidisch gebundene Aro-mastoffe in Hopfen (Humulus lupulus L.): 2. Derivatisierung mit Trifluoracetat, Adv. Food Sci. (CMTL) in Vorbereitung (2002)
[32] Winterhalter, P., Knapp, H., Straubinger, M., Fornari, S., Watanabe, N., Application of Countercurrent Chroma-tography to the Analysis of Aroma Precursors in Rose Flo-wers, in Mussinan, C.J., Morello, M.J. (Editors) Flavor Ana-lysis, ACS Symposium Series 705: 181-192 (1998)
[33] Neugebauer, W., Winterhalter, P., Schreier, P.; 2-(2-Butylidene)-3,3-dimethyl-5(2-oxopropyl)tetrahydrofuran: A new degradation product of 3-Hydroxy-5,6-epoxy-ß-ionol. J. Agric. Food Chem. 42: 2885-2888 (1994)
[34] Ohloff,G., Rautenstrauch, V., Schulte-Elte, Karl. H. Modell-reaktionen zur Biosynthese von Verbindungen der Damas-con-Reihe und ihre präparative Anwendung. Helv. Chim. Ac-ta 56: 1503-1513 (1973)
[35] Humpf, H.U., Isolierung und Charakterisierung von Glyko-konjungaten C13-norisoprenoider Aromastoffvor-stufen, Dissertation Julius-Maximilian-Universität Würzburg (1992)
[36] Krammer, G., Winterhalter, P., Schwab, M., Schreier, P., Glycosidically bound Aroma Compounds in the fruits of pru-nus Species. J. Agric. Food Chem. 39: 778-781 (1991)
[37] Loeber, D.E., Russell, S.W., Toube, T.P., Weedon, B.C.L., Diment, J. Carotenoids and related compounds. Part XXVIII. Synthesis of Zeaxanthin, ß-Cryptoxanthin and Zeinoxanthin (a-Cryptoxanthin) J. Chem. Soc. (C) 404-408 (1971)
[38] Strauss, C.R., Wilson, B, Williams, P.J., 3-oxo-α-Ionol, Vo-mifoliol and Roseoside in Vitis vinifera fruit., Phytoche-mistry 26: 1995-1997 (1987)
Received for publication: July 29, 2002 Accepted for publication: August 15, 2002 CORRESPONDING AUTHOR
H. Kollmannsberger/ S. Nitz
Lehrstuhl für Chem.-Techn. Analyse u. Chem. Lebens-mitteltechnologie Technische Universität München Weihenstephaner Steig 23 85350 Freising-Weihenstephan - GERMANY e-mail: [email protected] [email protected]
AFS/ Vol 24/ No 3/ 2002 – pages 106 - 115
© by PSP Volume 24 – No 3. 2002 Advances in Food Sciences
116
MICROBIAL AND BIOCHEMICAL CHANGES OCCURRING DURING FERMENTATION OF marula (Sclerocarya birrea subspecies caffra)
JUICE TO PRODUCE mukumbi, A TRADITIONAL ZIMBABWEAN WINE
1Mpofu A. and 2Zvauya R.
1 Department of Soil Science and Agricultural Engineering, 2 Department of Biochemistry University of Zimbabwe, Box MP 167, Mount Pleasant, Harare, Zimbabwe
SUMMARY
Traditional fermentation of marula juice from the fruit of marula tree (Sclerocarya birrea subsp. caffra) to produce mukumbi, a traditional Zimbabwean wine, was investigated in the laboratory. Microbial and biochemical changes were monitored throughout the 72 h fermentation period. There was a ten-fold increase in both aerobic mesophilic bacteria and lactic acid bacteria, and a hun-dred-fold increase in yeast and moulds during the fermenta-tion period. The final pH and acidity values were 3.4 and 0.95 % lactic acid, respectively. The glucose concentration increased from an initial value of 5.7 g/l to 8.6 g /l after 36 h, and then gradually decreased to a value of 0.4 g/l. Citric acid decreased from an initial value of 51.0 g/l to 5.5 g/l at 72 h. The microorganisms used citrate at first, then glucose and fructose as carbon and energy sources. The maximum alcohol level produced was 2.3 % (v/v) after 60 hrs of fermentation.
KEYWORDS: Alcoholic fermantation, yeasts, mukumbi, wine, marula.
INTRODUCTION
The majority of research on African fermented foods has been done in West Africa [1-3]. Due to the extensive studies done, some of the products have been commercialized e.g. gari, dawa dawa, and ogi [4]. East African fermented foods have also been studied to a greater extent than those of Central Africa [5]. The traditional fermented foods of Zimbabwe have not been systematically studied, except for some studies on fermented milk products [6], mahewu [7,8], masvusvu and mangisi [9].
The marula fruit is one of the most commonly utilized wild fruits of Southern Africa. Archeological evidence indicates that the marula fruit was known and consumed by mankind in Africa since 9,000- 10,000 years BC [10]. The plant is widely spread in Africa especially in semi arid regions [11]. The marula has characteristics which offer remarkable opportunities to the development of agricultur-ally based industries in Africa, which include drought resis-tance, exceptionally high yielding of fruit per tree, the possibility to utilize both the fruit and nut contained within the seed, ease of harvesting tall trees, exotic flavor and nutritive value of the fruit. Marula fruit can be consumed as a fresh fruit. The fruit has been processed into products such as mukumbi, wine, beer, jelly or jam. Limited amounts of juice are utilized industrially for flavor enhancement in the production of liquor in the Republic of South Africa, for example �Amarula Cream�, which is nuttier than other chocolate coffee liquors in the genre. Mukumbi is a popular beverage prepared from the ripe fruit in many villages of Zimbabwe. It is central to the most valued personal and social ceremonies of both highly literate and less literate societies. The green physiologically mature marula fruits fall to the ground and ripen (turn yellow in color). They are then harvested and processed to mukumbi. Fermentation procedures vary in different parts of Southern and Central Africa. Fermentation time varies from household to house-hold, but is usually 72 hrs. In certain regions of Zimbabwe the whole process is carried out under a tree. Mukumbi is yellow in color with a tart-sour taste and a slightly turpen-tine-like aroma. The alcohol content of the beverage varies from producer to producer and depends on the time of fermentation.
To the best knowledge of the researchers, there is no published scientific literature on microbial and chemical changes occurring during preparation of wines from tradi-tionally fermented fruits of Zimbabwe. This work was, therefore, aimed at evaluating these aspects of a mukumbi preparation.

© by PSP Volume 24 – No 3. 2002 Advances in Food Sciences
117
5
6
7
8
9
0 6 12 18 24 30 36 42 48 54 60 66 72 78
Log
10 (c
fu /
ml)
.
MATERIALS AND METHODS
Source of marula fruits
Fresh marula fruits were obtained from Mataga vil-lage in Mberengwa, a hot semi-arid communal area in Southern Zimbabwe. Fruits were brought to the laboratory overnight and immediately processed to mukumbi.
Laboratory preparation of mukumbi
Mukumbi was prepared in the laboratory in a manner similar to the traditional procedure. Ripe marula fruits, (10 kg) were pierced with a wooden spoon and the juice together with the seed were squeezed out of the skins. The skins were discarded. Seeds, which are coated by a muci-laginous flesh, were pounded in a wooden mortar and pestle to completely extract the juice and the flesh. The slurry mixture composed of the flesh and the juice was poured into a 5 l earthenware pot. An equal volume of water was added and the pot was covered with a wooden plate. The slurry mixture was left to ferment naturally at room temperature (25 oC) for 72 hrs. Fermented slurry was filtered through a 435 µm sieve and, thereafter, ready for consumption. A thick residue formed mainly from the flesh was collected on the sieve and discarded. The ex-periment was repeated two more times to check the re-producibility of the fermentation.
Sampling
Samples (10 ml) for microbial and biochemical analyses were collected during fermentation at 6 h inter-vals. A subsample (5 ml) was centrifuged at 12 000 rpm for 10 min. The supernatant was kept frozen at -20 oC in 1 ml Eppendorf tubes until biochemical assays.
Microbiological analysis
Standard microbial analysis methods were used. Each sample (1 ml) of the fermenting juice was serially diluted in 9 ml of peptone water and spread in triplicates onto selective media for microbial analysis. Total aerobic mesophilic bacterial counts were done using plate count agar (OXOID) and the plates were incubated at 30 oC for 48 hrs. Lactic acid bacterial counts were done using de Man Rogosa Sharpe (MRS) agar (OXOID) and plates were incubated at 37 oC for 48 hrs. Yeast and mould counts were done using wort agar (OXOID) and plates were incubated at 30 oC for 48 hrs. The microbial load was expressed as colony forming units per milliliter (cfu/ml) of fermenting juice.
Biochemical analysis
All assays were done in triplicate. The pH of the fer-menting juice was measured immediately after sampling using a Jenway 3010 pH meter. Titratable acidity was measured immediately as described elsewhere [9]. Citric acid concentration was determined with kits using the U.V method according to the manufacturers´ instructions (Boe-hringer Mannheim kit, Cat.No. 139 076). Lactic acid con-
centration was determined as described by Lawrence [12]. Sucrose, glucose and fructose levels were determined with kits using the U.V method according to the manufacturer�s instruction (Boehringer Mannheim kit, Cat.No. 716 260). Ethanol concentration was measured by gas chromatogra-phy (Shimadzu GC 4CM) using a 3 % Carbowax on Chro-mosorb column. The oven temperature was 55 oC, injection temperature 80 oC and the carrier gas flow rate 5 ml/min.
RESULTS AND DISCUSSION
In general, rapid microbial and biochemical changes were recorded in the alcoholic fermenting marula juice during the first 48 h. The changes were less significant during the last 24 h. The final product, mukumbi had a slightly sweet sour taste, a fruity aroma and a mildly al-coholic flavor.
Yeast and moulds Aerobic mesophilic bacteria Lactic acid bacteria
FIGURE 1
Microbial changes during fermentation of marula juice.
Microbial Analysis
Figure 1 shows the microbial changes occurring (cfu/ml) during natural fermentation of marula juice to produce mukumbi. The initial microbial load of the juice was already high and diverse (i.e. 3.14 x 10⁷ lactic acid bacteria, 2.10 x 10⁷ aerobic mesophilic bacteria and 2.05 x 10⁶ yeasts and moulds), when the laboratory fermentation started. The green physiological mature marula fruits fall, and are collected from the ground to be processed to mu-kumbi. On falling, the skin of some of the fruits ruptures exposing the juice to microbes on the fruit surface. Bees, wasps and fruit flies introduce yeasts into fruits during juice suckling. Yeasts survive from year to year in the intestines of bees and wasps and they are readily trans-ferred during the crushing season by fruit flies (Droso-
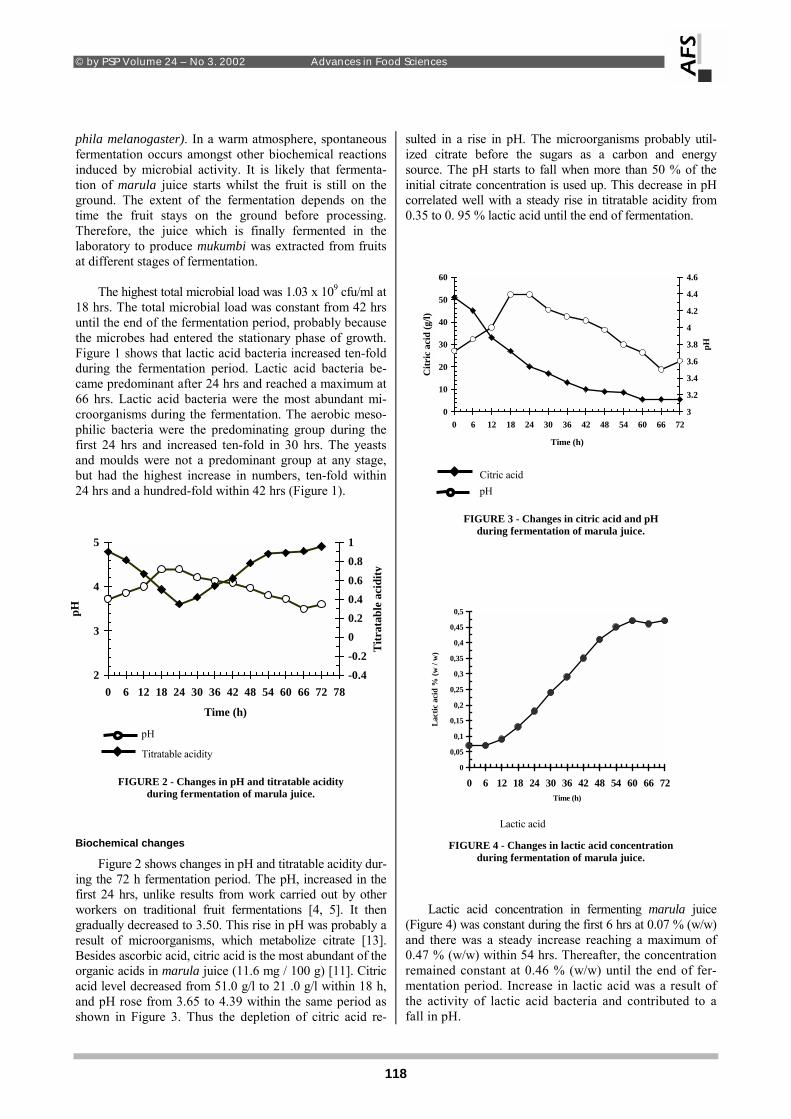
© by PSP Volume 24 – No 3. 2002 Advances in Food Sciences
118
phila melanogaster). In a warm atmosphere, spontaneous fermentation occurs amongst other biochemical reactions induced by microbial activity. It is likely that fermenta-tion of marula juice starts whilst the fruit is still on the ground. The extent of the fermentation depends on the time the fruit stays on the ground before processing. Therefore, the juice which is finally fermented in the laboratory to produce mukumbi was extracted from fruits at different stages of fermentation.
The highest total microbial load was 1.03 x 10⁹ cfu/ml at
18 hrs. The total microbial load was constant from 42 hrs until the end of the fermentation period, probably because the microbes had entered the stationary phase of growth. Figure 1 shows that lactic acid bacteria increased ten-fold during the fermentation period. Lactic acid bacteria be-came predominant after 24 hrs and reached a maximum at 66 hrs. Lactic acid bacteria were the most abundant mi-croorganisms during the fermentation. The aerobic meso-philic bacteria were the predominating group during the first 24 hrs and increased ten-fold in 30 hrs. The yeasts and moulds were not a predominant group at any stage, but had the highest increase in numbers, ten-fold within 24 hrs and a hundred-fold within 42 hrs (Figure 1).
pH
Titratable acidity
FIGURE 2 - Changes in pH and titratable acidity during fermentation of marula juice.
Biochemical changes
Figure 2 shows changes in pH and titratable acidity dur-ing the 72 h fermentation period. The pH, increased in the first 24 hrs, unlike results from work carried out by other workers on traditional fruit fermentations [4, 5]. It then gradually decreased to 3.50. This rise in pH was probably a result of microorganisms, which metabolize citrate [13]. Besides ascorbic acid, citric acid is the most abundant of the organic acids in marula juice (11.6 mg / 100 g) [11]. Citric acid level decreased from 51.0 g/l to 21 .0 g/l within 18 h, and pH rose from 3.65 to 4.39 within the same period as shown in Figure 3. Thus the depletion of citric acid re-
sulted in a rise in pH. The microorganisms probably util-ized citrate before the sugars as a carbon and energy source. The pH starts to fall when more than 50 % of the initial citrate concentration is used up. This decrease in pH correlated well with a steady rise in titratable acidity from 0.35 to 0. 95 % lactic acid until the end of fermentation.
Citric acid pH
FIGURE 3 - Changes in citric acid and pH during fermentation of marula juice.
Lactic acid
FIGURE 4 - Changes in lactic acid concentration during fermentation of marula juice.
Lactic acid concentration in fermenting marula juice
(Figure 4) was constant during the first 6 hrs at 0.07 % (w/w) and there was a steady increase reaching a maximum of 0.47 % (w/w) within 54 hrs. Thereafter, the concentration remained constant at 0.46 % (w/w) until the end of fer-mentation period. Increase in lactic acid was a result of the activity of lactic acid bacteria and contributed to a fall in pH.
2
3
4
5
0 6 12 18 24 30 36 42 48 54 60 66 72 78
Time (h)
pH
-0.4-0.200.20.40.60.81
Titr
atab
le a
cidi
ty
0
10
20
30
40
50
60
0 6 12 18 24 30 36 42 48 54 60 66 72
Time (h)
Citr
ic a
cid
(g/l)
3
3.2
3.4
3.6
3.8
4
4.2
4.4
4.6
pH
0
0,05
0,1
0,15
0,2
0,25
0,3
0,35
0,4
0,45
0,5
0 6 12 18 24 30 36 42 48 54 60 66 72Time (h)
Lact
ic a
cid
% (w
/ w
)

© by PSP Volume 24 – No 3. 2002 Advances in Food Sciences
119
02468
101214161820
0 6 12 18 24 30 36 42 48 54 60 66 72 78Time (h)
Etha
nol (
g / l
)
The pattern followed by glucose, fructose and sucrose during fermentation is shown in Figure 5. Glucose had an initial value of 5.7 g/l and increased to 8.6 g/l within 6 hrs of fermentation. There was a decrease in glucose levels after 36 hrs from 8.7 g/l to 0.4 g /l at the end of the fer-mentation. There was a sharp decrease of sucrose concen-tration within 12 hrs, followed by a gradual decrease until the end of the fermentation period to 0.83 g/l. The increase in glucose up to the 30 h fermentation period was due to hydrolytic action of invertase from the yeast cells breaking down sucrose to glucose and fructose. Yeast utilized glucose to produce ethanol. This was supported by a corresponding rise in ethanol from 1.5 g/l to 2.3 % (v/v) at fermentation time (Figure 6). Lactic acid bacteria are also thought to have utilized the sugars to produce lactic acid amongst other secondary products.
Sucrose Fructose Glucose
FIGURE 5 - Changes in glucose, fructose and sucrose during fermentation of marula juice
FIGURE 6 - Changes in ethanol levels during ermentation
of marula juice during the preparation of mukumbi.
Fructose increased steadily from an initial concentra-tion of 12.93 g/l to a maximum concentration of 19.13 g/l within 12 hrs. However, the levels of fructose remained constant and only started to drop after 48 h of fermenta-tion. The results indicate that microorganisms present used glucose before fructose as a carbon and energy source. Low final concentration of glucose, fructose and sucrose at the end of 72 hrs is thought to indicate that the fermentation process was essentially complete.
Figure 6 shows changes in ethanol concentration in
fermenting marula juice. There was already some ethanol (0.2 % (v/v)) when the fermentation was commenced in earthenware pots, suggesting that spontaneous fermenta-tion of marula starts whilst the fruit is still on the ground. There was very little increase in ethanol observed for the first 18 hrs. It is interesting that this period corresponds to a rapid decrease in citrate. A noticeable increase was observed from 0.3 to 2.3 % ethanol between the 18 h and 60 h fermentation period. Thereafter there was a gradual decrease in ethanol concentration until the end of fermen-tation. The increase observed in ethanol concentration may be attributed to the increasing fermentative activities of yeast cells. The ethanol levels only start to decrease slightly when all the sugars are used up at 66 hrs.
CONCLUSION
The final pH value of 3.4 and the final titratable acid-ity value of 0.95 % lactic acid makes mukumbi fall within values recommended for sweet dessert wines by Amerine & Ough [14]. The ethanol content of mukumbi is compa-rable to agadagidi from plantain fruits which has an etha-nol content of less than 3 % [15]. However, in mukumbi the final level of ethanol, the pH and titratable acidity varies from brew to brew as this is an uncontrolled fer-mentation. The possibility of using starter yeast cultures should be investigated. Since acceptance of a product depends considerably on consumer preference, additional studies with sensory evaluation should be conducted to optimize the process for small-scale industrial production.
ACKNOWLEDGMENTS
The authors would like to thank the Farm-level Ap-plied Research Methods for East and Southern Africa (FARMESA) and the Swedish Agency for Research Cor-poration with Developing Countries (SAREC) for fund-ing. We also acknowledge the assistance of DV Chiuswa, T Mugochi, W Parawira and Mapindu villagers of Mataga, Mberengwa for their knowledge on the art of mukumbi preparation. The assistance of Norbert Tsanyiwa during sample collection is greatly appreciated.
0
10
20
30
40
50
60
0 6 12 18 24 30 36 42 48 54 60 66 72Time (h)
Suga
rs (g
/ l)

© by PSP Volume 24 – No 3. 2002 Advances in Food Sciences
120
REFERENCES.
[1] Odunfa SA (1981): Microorganisms associated with fermen-tation locust bean during iru preparation. Journal of Plant Foods, 25, 249-250.
[2] Odunfa SA & Oyewole OE (1985): Identification of Bacillus species from iru, a fermented locust bean product. Journal of Basic Microbiology.26, 101-108.
[3] Adegoke GO & Babalola AK: (1988): Characteristics of microorganisms of importance in the fermentation of fufu and ogi - two Nigerian foods. Journal of Applied Bacteriology, 65, 449-493.
[4] Okafor N (1992): Commercialization of fermented foods in Sub-Saharan Africa. In Applications of Biotechnology to Traditional fermented foods. pp. 165-169. Washington, Na-tional Academy Press.
[5] Odunfa SA (1988): Review of African fermented foods. Art of Science. Mircen Journal. 4, 259-273.
[6] Feresu S (1992): Fermented milk products in Zimbabwe. In: Applications of Biotechnology to traditional Fermented Foods. pp 80-85. Washington National Academy Press.
[7] Simango C & Rukure G (1991): Survival of Campylobacter jejini and pathogenic Escherichia Coli in mahewu, a fer-mented cereal gruel. Transactions of the Royal of Tropical of Medicine and Hygiene, 85, 399-400.
[8] Bvochora JM, Reed JD, Read JS & Zvauya R (1999): Effect of fermentation processes on proanthocyanidins in sorghum during preparation of mahewu, a non alcoholic beverage. Process Biochemistry,. 35, 21 � 25.
[9] Zvauya R, Mugochi T and Farawira W (1997): Microbial and Biochemical changes occurring during production of masvus-vu and mangisi, Plant Foods for Human Nutrition, 51, 43-51.
[10] Friede H & Pienaar JN (1974): Applications of the flotation process to Kruger Cave deposit. Southern Africa Journal Science, 70, 375-376
[11] Gous F, Weinert IAG and Van Wyk PJ (1988): Selection and processing of Marula fruit (Sclerocarya birrea subsp. caffra). Lebensmittel Wissenschaft u. Technologie, 21, 256-266.
[12] Lawrence AJ (1975): Determination of lactic acid in cream. Australian Journal of Dairy Technology, 30, 14-15.
[13] Hugenholtz J, Starrenburg MJC & Weerkamp AH (1994): Diacetyl production by Lactococcus lactis Optimization and metabolic engineering. In. Proceedings of the 6th European Congress On Biotechnology, (Eds Albergina A, Frontali L & Sensi P) ECB6, Florence Italy, Elsevier Science.
[14] Amerine MA & Ough CS (Ed) (1980): Methods of Analysis of Musts and Wines, p. 241. New York, John Wiley
[15] Sanni AI & Oso BA (1988): The production of Agadagidi, a Nigerian fermented beverage. Die Nahrung. 32, 319-326.
Received for publication: August 07, 2002 Accepted for publication: September 03, 2002 CORRESPONDING AUTHOR
A. Mpofu Department of Soil Science and Agricultural Engineering University of Zimbabwe Box MP 167, Mount Pleasant Harare - ZIMBABWE Fax (263) (4) 308046 e-mail: [email protected]
AFS/ Vol 24/ No 3/ 2002 – pages 116 - 120

© by PSP Volume 24 – No 3. 2002 Advances in Food Sciences
121
COMPARATIVE STUDIES ON BIOSORPTION OF COBALT (II), NICKEL (II), LEAD (II) AND MANGANESE (II)
BY FOUR DIFFERENT FUNGI
Mohammad H. Habibia, Giti Emtiazib, Zohreh Khalesib and Mohammad Ali Haghighipoura
a Chemistry, and b Biology Department, Isfahan University, Isfahan 81745-117, Iran
ABSTRACT
Four different fungi, Aspergillus terreus, Aspergillus niger, Trichoderma reesei and Phanerochaete chrysospo-rium, showed different capacities for biosorption of heavy metals, e.g. Co, Ni, Pb, Mn. Fungal biosorption largely depends on the growth media. Phanerochaete chrysospo-rium grown on whey water had the highest sorption ca-pacity (Co(II), 10; Ni(II), 12.5; Pb(II), 27.6 and Mn(II), 35 mg/g removal). This research showed that fungal bio-sorption strongly influences the removal of heavy metal ions from aquatic systems.
KEYWORDS: Biosorption, metal ions, cobalt, nickel, lead, man-ganese, fungi, Aspergillus terreus, Aspergillus niger, Trichoderma reesei and Phanerochaete chrysosporium.
INTRODUCTION
Increased industrial and human activities have impact on the environment through heavy metal-containing waste disposal. Mine drainage, metal industries, refining, dye and leather industries, landfill leachate, agricultural runoff and domestic effluents contribute to such a kind of waste. Especially, electroplating wastewater is one of the major industrial contributors of heavy metal pollution in surface waters [1, 2]. There has been a growing concern with environmental protection, achieved either by decreasing the afflux of pollutants or their removal from contami-nated media. The former is a feasible choice only for pollutants of anthropogenic origin, whereas the latter is unavoidable, especially for those of natural origin. Since cobalt, nickel, lead and manganese are among the most toxic elements, numerous efforts have been made to lower their presence in contaminated media to innocuous quan-tities [3, 4].
The interactions of microorganisms and metal ions in aqueous media have been the focus of a growing number of scientific studies in recent years. The characteristics of passive microbial metal binding, commonly termed bio-sorption [5], have been investigated for a wide range of simple metal/organism systems. In addition, competition studies in solutions of multiple cations and/or anions have underscored the complexity of the sorption interactions involved as well as demonstrating the ability of certain co-ions to either reverse the augment of metal toxicity or uptake [6-8]. The principle exponents of metal-micro-organism interactions for environmental purposes remain traditionally biological waste treatment systems of the activated sludge/biological filter type.
In the concept of biosorption, several chemical proc-
esses may be involved, such as absorption, ion exchange and covalent bonding with biosorptive sites of the micro-organisms including carboxyl, hydroxyl, sulphydryl, amino and phosphate groups. Fungal cell walls and their components play a major role in biosorption process. Fungal biomass can also take up considerable quantities of heavy metals from aqueous solutions by adsorption or related processes, even in the absence of physiological activity [9-14].
The purpose of this investigation was to study the use
of different fungi, e.g. Aspergillus terreus, Aspergillus niger, Trichoderma reesei and Phanerochaete chrysospo-rium, as biosorbents for heavy metals from artificial wastewaters and to determine the maximum biosorption capacity of the fungal biomass.
EXPERIMENTAL
Potato dextrose agar (PDA) and brain-heart infusion (BHI) agar were obtained from Oxoid Ltd. Noble agar was from Difco Laboratories. The fungi, Aspergillus

© by PSP Volume 24 – No 3. 2002 Advances in Food Sciences
122
terreus, Aspergillus niger, Trichoderma reesei and Phan-erochaete chrysosporium used in this study were obtained from Isfahan University Microbial Collection. Aspergillus terreus was isolated from rotting wood and identified by laboratory methods in basic mycology (13). These fungi were maintained on PDA. The capability of fungi to ab-sorb the metals in the appropriate media was investigated. After inoculation of the fungi on a shaker at 30 °C, the biomass was harvested by filtration through a Watman Nr. 1 filter paper with distilled water and dried at 50 °C in an oven for 24 hrs.
In the first experimental series, biosorption of Co(II), Ni(II), Pb(II) and Mn(II) was investigated batchwise in conical flasks. 10 ppm of metal ions using CoCl2, NiSO4, Pb(CH3COO)2 and MnCl2 were added separately to BHI medium. After inoculation of the different fungi in the flasks and incubation at 30 °C for 3 days on a rotary shaker (120 rpm), the biomass was harvested and the heavy metal content of the supernatants was assayed. In another experimental series, biosorption of Co(II), Ni(II), Pb(II) and Mn(II) was investigated after the production of biomass in PDA (200 g filtrated and boiled potato include 10 g glucose in 1L distilled water) at 30 °C within 3 days or whey water (waste effluent from cheesemaking with 10 g/L lactose and 2g/L casein) at pH 6. The cells were washed and added separately to 10 ppm solutions of the different metal ions in flasks. After filtration of the biomass, the supernatant was assayed for metal ions.
General procedure for biosorption: Dry fungal biomass (1.2 g) was transferred to the different metal ion solutions (10 mg l-1
water), and after biosorption the biomass was separated by filtration. The concentration of the metal ions in the supernatant was measured by using a flame atomic ab-sorption spectrometer. The biosorption capacity was ob-tained by the following equation:
Bc = [(C0 � C) V]/mb where Bc is the biosorption capacity of the fungus
(mg g-1), C0 and C are the concentrations of metal ions in the solution (mgl �1) initially and after biosorption, V is the volume of the medium (L) and mb is the amount of biomass (g).
RESULTS AND DISCUSSION
Biosorption of lead (II) ions
The results showed that Phanerochaete chrysospo-rium biosorbed 27.2 mg g-1 of lead ions when grown on whey water or 9 mg g-1 when grown on PDA (Tables 1 and 2). Compared to the other fungi used in this study, Phanerochaete chrysosporium had maximum biosorption capacity grown on both potato broth and whey water. The addition of 10 ppm lead ions to BHI media suppressed especially the growth of Phanerochaete chrysosporium. Only 5 ppm of lead ions remained in the supernatant (Table 4).
Biosorption of cobalt (II) ions
Trichoderma reesei biosorbed 11.6 mg g-1 of cobalt ions grown on PDA and Phanerochaete chrysosporium 10mg g-1 when grown on whey water (Tables 1 and 2). The addition of 10 ppm cobalt ions to BHI media sup-pressed the growth of all fungi, which indicates that both biomass and culture medium affect their biosorption ca-pacity (Table 3). High percentages (60-88%) remained in the supernatants (Table 4).
Biosorption of manganese (II) ions
Aspergills niger biosorbed 6.7 mg g-1 of Mn(II) ions on PDA broth and Phanerochaete chrysosporium 35mg g-1, when grown on whey water (Tables 1 and 2). The addi-tion of 10 ppm manganese ions to the BHI media did not affect the growth of Aspergillus terreus and Trichoderma reesei, but suppressed that of Aspergillus niger and Phan-erochaete chrysosporium (Table 3).
Biosorption of nickel (II) ions
In identical experiments it was observed that Phan-erochaete chrysosporium biosorbed 9.7 mg g-1 of Ni(II) ions grown on PDA (Table 1) and 12.5 mg g-1 on whey water (Table 2). The addition of10ppm nickel ions to BHI media suppressed the growth of all fungi, but again espe-cially that of Phanerochaete chrysosporium and Aspergil-lus niger (Table 3). 86-90% of the nickel ions added re-mained in the supernatants as similarly observed with Mn(II) ions (Table 4).
TABLE 1 Biosorption capacity (mg g-1) of Co(II), Ni(II), Pb(II) and Mn(II) by different fungi grown on potato dextroseagar (PDA).
Fungi Biosorption Capacity (mg g-1)
Co(II) Ni(II) Pb(II) Mn(II) Aspergillus terreus 3 5.9 4.2 5.3 Aspergillus niger 2.4 3.4 8.2 6.7 Phanerochaete chrysosporium 3.9 9.2 9.0 2.8 Trichoderma reesei 11.6 3.5 1.0 5.0

© by PSP Volume 24 – No 3. 2002 Advances in Food Sciences
123
TABLE 2 Biosorption capacity (mg g-1) of Co(II), Ni(II), Pb(II) and Mn(II) by different fungi grown on whey water.
Fungi Biosorption Capacity (mg g-1)
Co(II) Ni(II) Pb(II) Mn(II) Aspergillus terreus 5.0 7.7 6.5 4.8 Aspergillus niger 4.3 5.6 11. 11.7 Phanerochaete chrysosporium 10.0 12.5 27.6 35 Trichoderma reesei 0.2 1.5 N.D 4.0
N.D = not detected
TABLE 3 Maximum biomass of the different fungi grown on BHI in the presence of different metal ions (10 ppm).
Fungi Maximum biomass (g L-1)
Co(II) Ni(II) Pb(II) Mn(II) No metal Aspergillus terreus 4.0 5.2 10.2 8.9 12 Aspergillus niger 0.3 0.18 8.8 0.3 10 Phanerochaete chrysosporium 0.2 0.3 5.3 0.4 8 Trichoderma reesei 0.2 6.3 9.0 12 13
TABLE 4 Addition of 10 ppm Mn(II) ,Pb(II), Co(II) or Ni(II) to the media of different fungi grown on BHI and concentration of the metal ions remaining in the supernatant.
Fungi Concentration of metal ions (ppm) Co(II) Ni(II) Pb(II) Mn(II) Aspergillus terreus 6.0 4.3 1.5 1.4 Aspergillus niger 6.8 8.6 2.5 9.4 Phanerochaete chrysosporium 8.8 9.0 5.0 9.4 Trichoderma reesei 8.8 3.8 2.5 1.0
The addition of 10 ppm cobalt, nickel or manganese
ions suppressed the growth of Aspergillus niger and Phanerochaete chrysosporium. Therefore, these ions re-main nearly totally in the supernatant. However, Phanero-chaete chrysosporium grown on whey water exhibited the highest biosorption capacities (10, 12.5, 27.6 and 35 mg of Co(II), Ni(II), Pb(II) and Mn(II) ions per g of biomass), when grown on whey water (Table 2). Cultivated on PDA, this fungus biosorbed 9.2 and 9.0 mg of Ni(II) and Pb(II) ions (Table 1).
ACKNOWLEDGMENT
We are grateful to Isfahan University Research Council for financial support of this work under grant number 780413.
REFERENCES
[1] M. Ajmal, A.M. Sulaiman and A.H. Khan, Wat. Air Soil Pol-lut. 68, 485 (1993).
[2] A. Golomb, Plating 59, 316 (1972).
[3] M.A. Ferro Garcia, J. Rivera Utrilla, I. Bautista Toledo and M.D. Mingoranc, Carbon 28, 546 (1990).
[4] E. Fourest, A. Serre and J.C. Roux, Toxic. Environ. Chem. 54, 1 (1996).
[5] E. Fourest and B. Volesky, Appl. Biochem. Biotechnol. 67, 215 (1997).
[6] G. M. Gadd and C. White, Biotechnol, 33, 592 (1989).
[7] Golomb, Plating 59, 316 (1972).

© by PSP Volume 24 – No 3. 2002 Advances in Food Sciences
124
[8] N. Hafez, A.S. Abdel-Razek and M.B. Hafez, J. Chem. Technol. Biotechnol. 68, 19 (1997).
[9] G. Yan and T. Viraraghavan, Water SA 26, 119 (2000).
[10] Z.R. Holan, B. Volesky and I. Prasetyo, Biotechnol. Bioeng. 41 819 (1993).
[11] C. White and G.M. Gudd, J. Chem. Tech. Biotech. 46, 331 (1990).
[12] A. Kapoor and T. Viravaghavan, Biores. Technol. 61, 221 (1997).
[13] E.J. Baron and M.S. Finegold, Diagonistic Microbiology, 8th ed., pp. 681-767. The C.V. Mosby Com., London 1990.
[14] J.M. Brady and J.M. Tubin, Enzyme Microb. Technol, 17, 791 (1978).
Received for publication: August 07, 2002 Accepted for publication: October 10, 2002 CORRESPONDING AUTHOR
Mohammad H. Habibi Chemistry Department Isfahan University Isfahan 81745-117 - IRAN Fax: +98-311-6689732 e-mail: [email protected]
AFS/ Vol 24/ No 3/ 2002 – pages 121 - 124

© by PSP Volume 24 – No 3. 2002 Advances in Food Sciences
125
PHYSICOCHEMICAL ANALYSIS OF TOKAT REGION (TURKEY) HONEYS
Mustafa Tüzen1 and Mustafa Duran2
1 Gaziosmanpaşa University, Faculty of Science and Arts, Chemistry Department, 60250 Tokat-Turkey 2 Gaziosmanpaşa University, Faculty of Science and Arts, Biology Department, 60250 Tokat-Turkey
SUMMARY
Standard methods were used for the determination of physico-chemical properties of Tokat region honey sam-ples. All samples were examined for pH, total acidity, moisture, ash, electrical conductivity, HMF, total solids, reducing sugars, total soluble solids, total sugars, and sucrose. Metal contents of honey samples were deter-mined by atomic absorption spectrometry. The physico-chemical characteristics of the honey samples investigated met all the compositional and quality criteria of the �Turkish Standards Institute (TSE 3036)� and generally agreed with the earlier published results.
KEYWORDS: Honey, pysico-chemical analysis, Tokat, Turkey.
INTRODUCTION
The climate and rich vegetation in Turkey provide a very suitable environment for apiculture which is in a state of expansion. Turkey is the third largest country, following Soviet Union and USA, with regard to the number of hives. In 1993, there were 3,686,000 hives representing a yearly increase of 4.1%. The production of honey was 59.207 tons in 1995 and increased to 80.000 tons in 1997 [1-2]. The amount of exported honey increased (2.517,9 tons in 1988 and 5.000 tons in 1997), but it is still very low because great amounts of honey produced are consumed within the country. Production of honey in Tokat region (800 tons in 2001) is also quite low compared with the total honey production in Turkey. There exist about 88 migratory and 1666 settled beekeepers and the number of hives is ap-proximately 40.000. The common honeybee races are Apis mellifera cacucasia, Apis mellifera anatilica and their hybrid Apis mellifera cacucasia gorb. While the mean production of honey is 20 kg per hive in the world, it is 16 kg in Tokat [3]. Although there is a sufficient number of hives
and a rich vegetation, honey production is rather low since advanced apiculture technology is not followed adequately. In Tokat region, the climate is mild in winter, rainy in spring and autumn and all over the year, espe-cially in spring and summer, ideal for apiculture. Tokat has 39% forested area, 13% meadowland and pasture, 33% agricultural land and 15% others. Vegetation in Tokat region is characterized by clover, trefoil, dead-nettle, daisy, poppy, centaury, hyacinth, blackthorn, tulip, monk, chicory, blackberry (common monocotyledon), apricot, cherry, apple, acacia, peach, plum, walnut and almond (common dicotyledon). The blossoming periods of various flowers last from April to August.
The faculties of agriculture, vocational high schools
of agriculture, the Ministry of Agriculture, Forestry and Village Affairs, and the Education Unit of Integrated Apiculture Project of Development Foundation of Turkey carry out research on the characteristics of bee races of the country and on artificial insemination, and produce controlled mother queen and swarm.
However, only a few numbers of investigations have
been related to physical properties and chemical composi-tion of Turkish honey samples [5-7]. In previous work, some metals have been determined in Tokat region hon-eys by monitoring environmental pollution [4]. Therefore, it is important to determine the essential composition and quality factors of Tokat region honeys and physico-chemical parameters were analyzed in this study using various instrumental and analytical techniques.
MATERIAL AND METHODS
Sampling
Fourty liquid honey samples were collected from To-kat city, Turkey in 1999. The samples were preserved in covered plastic containers and kept in the laboratory at room temperature until analysis. The honey samples were

© by PSP Volume 24 – No 3. 2002 Advances in Food Sciences
126
rich and light with a predominant sweet, clover-like fla-vour and an elegant floral aftertaste.
Physico-chemical analysis
The honey samples were analyzed according to the methods of the Association of Official Analytical Chem-ists (AOAC) [8] and Turkish Standards Institute (TSE 3036) [9].
The pH was measured in a solution containing 5 g
honey in 10 ml distilled water. Total acidity was deter-mined titrimetrically with 0.1 M NaOH (10 g honey dis-solved in 75 ml distilled water). Moisture and total solu-ble solids were determined refractometrically (total solids (%) calculated as 100 - moisture content). Ash percentage was measured by calcination overnight at 550 ºC in a furnace to constant mass. Electrical conductivity was determined in a solution containing 2 g honey in 10 ml distilled water at 20 ºC. Hydroxymethyl furfural (HMF) was determined after dilution with distilled water and
addition of p-toluidine solution. Absorbance was meas-ured at 550 nm using a 1 cm cell in a Jasco Model V-530 spectrophotometer. Total and reducing sugars were de-termined by titrimetric method (redox volumetry of Feh-ling reagent with methylene blue end point-detection). Sucrose (%) was calculated as (total sugars-reducing sugars) x 0.95. All determinations were carried out on wet weight basis. Metal contents (Pb, Cd, Fe, Cu, Mn and Zn) were determined according to the method earlier de-scribed using a Varian Spectr AA-220 atomic absorption spectrometer equipped with a graphite furnace [4]. Ca, Mg and Na, K were determined by flame atomic absorp-tion spectrometry and flame photometry, respectively.
RESULTS AND DISCUSSION
The chemical composition of the honey samples in-vestigated was compared with the values recommended in TSE 3036 (Table 1).
TABLE 1 - Chemical composition of Tokat honey samples analyzed and values recommended for honey in TSE 3036.
Parameters Mean Range Values in TSE 3036
pH 4.10 3.75-4.38 -
Total acidity (ml 0.1M NaOH/10 g honey) 3.26 1.20-4.85 max. 40 mmol/kg
Moisture (%) 16.10 15.30-18.26 max. 20%
Ash (%) 0.26 0.12-0.50 max. 0.6%
Electrical conductivity (10-4 s cm-1) 5.37 3.25-7.62 -
HMF (mg/kg) 4.82 2.36-17.61 max. 40 mg/kg
Total solids (%) 83.90 81.74-84.70 -
Reducing sugars (%) 74.48 70.05-78.54 min. 65%
Total soluble solids (%) 76.40 74.17-79.38 -
Total sugars (%) 77.56 71.63-86.45 -
Sucrose (%) 2.93 1.50-7.66 max. 5%
Sodium (mg/kg) 85±10 30-100 -
Potassium (mg/kg) 800±70 400-1500 -
Calcium (mg/kg) 62±12 50-300 -
Magnesium (mg/kg) 32±7 14-48 -
Copper (mg/kg) 0.75±0.09 0.30-1.45 -
Iron (mg/kg) 4.90±1.05 3.20-7.65 -
Manganese (mg/kg) 0.62±0.08 0.38-0.85 -
Zinc (mg/kg) 3.50±0.70 1.50-5.30 -
Lead (µg/kg) 54.6±5.8 39.30-64.50 -
Cadmium (µg/kg) 6.80±0.52 5.45-10.76 -
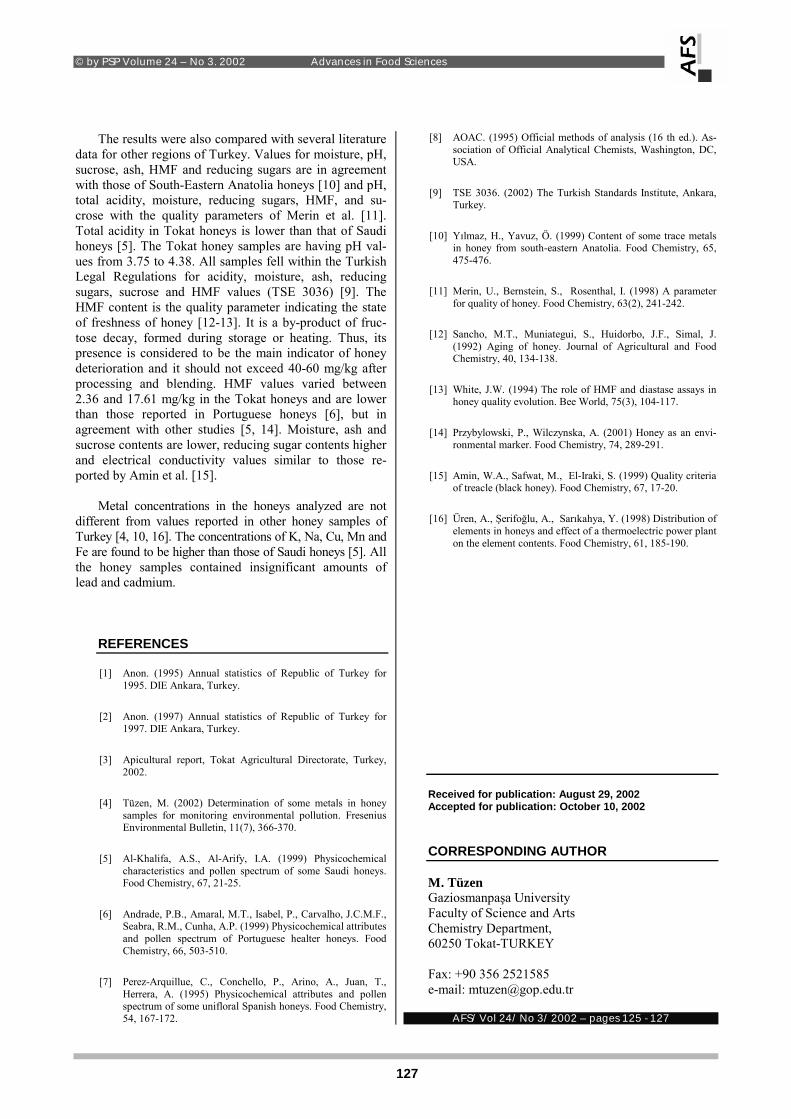
© by PSP Volume 24 – No 3. 2002 Advances in Food Sciences
127
The results were also compared with several literature data for other regions of Turkey. Values for moisture, pH, sucrose, ash, HMF and reducing sugars are in agreement with those of South-Eastern Anatolia honeys [10] and pH, total acidity, moisture, reducing sugars, HMF, and su-crose with the quality parameters of Merin et al. [11]. Total acidity in Tokat honeys is lower than that of Saudi honeys [5]. The Tokat honey samples are having pH val-ues from 3.75 to 4.38. All samples fell within the Turkish Legal Regulations for acidity, moisture, ash, reducing sugars, sucrose and HMF values (TSE 3036) [9]. The HMF content is the quality parameter indicating the state of freshness of honey [12-13]. It is a by-product of fruc-tose decay, formed during storage or heating. Thus, its presence is considered to be the main indicator of honey deterioration and it should not exceed 40-60 mg/kg after processing and blending. HMF values varied between 2.36 and 17.61 mg/kg in the Tokat honeys and are lower than those reported in Portuguese honeys [6], but in agreement with other studies [5, 14]. Moisture, ash and sucrose contents are lower, reducing sugar contents higher and electrical conductivity values similar to those re-ported by Amin et al. [15].
Metal concentrations in the honeys analyzed are not
different from values reported in other honey samples of Turkey [4, 10, 16]. The concentrations of K, Na, Cu, Mn and Fe are found to be higher than those of Saudi honeys [5]. All the honey samples contained insignificant amounts of lead and cadmium.
REFERENCES
[1] Anon. (1995) Annual statistics of Republic of Turkey for 1995. DIE Ankara, Turkey.
[2] Anon. (1997) Annual statistics of Republic of Turkey for 1997. DIE Ankara, Turkey.
[3] Apicultural report, Tokat Agricultural Directorate, Turkey, 2002.
[4] Tüzen, M. (2002) Determination of some metals in honey samples for monitoring environmental pollution. Fresenius Environmental Bulletin, 11(7), 366-370.
[5] Al-Khalifa, A.S., Al-Arify, I.A. (1999) Physicochemical characteristics and pollen spectrum of some Saudi honeys. Food Chemistry, 67, 21-25.
[6] Andrade, P.B., Amaral, M.T., Isabel, P., Carvalho, J.C.M.F., Seabra, R.M., Cunha, A.P. (1999) Physicochemical attributes and pollen spectrum of Portuguese healter honeys. Food Chemistry, 66, 503-510.
[7] Perez-Arquillue, C., Conchello, P., Arino, A., Juan, T., Herrera, A. (1995) Physicochemical attributes and pollen spectrum of some unifloral Spanish honeys. Food Chemistry, 54, 167-172.
[8] AOAC. (1995) Official methods of analysis (16 th ed.). As-sociation of Official Analytical Chemists, Washington, DC, USA.
[9] TSE 3036. (2002) The Turkish Standards Institute, Ankara, Turkey.
[10] Yõlmaz, H., Yavuz, Ö. (1999) Content of some trace metals in honey from south-eastern Anatolia. Food Chemistry, 65, 475-476.
[11] Merin, U., Bernstein, S., Rosenthal, I. (1998) A parameter for quality of honey. Food Chemistry, 63(2), 241-242.
[12] Sancho, M.T., Muniategui, S., Huidorbo, J.F., Simal, J. (1992) Aging of honey. Journal of Agricultural and Food Chemistry, 40, 134-138.
[13] White, J.W. (1994) The role of HMF and diastase assays in honey quality evolution. Bee World, 75(3), 104-117.
[14] Przybylowski, P., Wilczynska, A. (2001) Honey as an envi-ronmental marker. Food Chemistry, 74, 289-291.
[15] Amin, W.A., Safwat, M., El-Iraki, S. (1999) Quality criteria of treacle (black honey). Food Chemistry, 67, 17-20.
[16] Üren, A., Şerifoğlu, A., Sarõkahya, Y. (1998) Distribution of elements in honeys and effect of a thermoelectric power plant on the element contents. Food Chemistry, 61, 185-190.
Received for publication: August 29, 2002 Accepted for publication: October 10, 2002 CORRESPONDING AUTHOR
M. Tüzen Gaziosmanpaşa University Faculty of Science and Arts Chemistry Department, 60250 Tokat-TURKEY Fax: +90 356 2521585 e-mail: [email protected]
AFS/ Vol 24/ No 3/ 2002 – pages 125 - 127

© by PSP Volume 24 – No 3. 2002 Advances in Food Sciences
128
AFS Book Reviews - Bücherschau
Food, People and Society – A European Perspective of Consumers` Food Choices
Frewer, L. J., Risvik, E., Schifferstein, H (Eds).
462 pages, 71 figures, 63 tables; Springer-Verlag Berlin � Heidelberg � New York � London � Paris � Tokyo � Hong Kong, 2001; ISBN 3-540-41521-1; Hardcover GBP 74.00, US $ 109.00.
The exact determinants of food perception, liking and
food choice are parameters still not fully understood. This book �Food, People and Society�, edited and authored by a group of scientists experienced in European cross-cultural and interdisciplinary research in the special fields of consumer perceptions, sensory analysis, product image and risk research, tries to fill the gaps in our knowledge by studying the afore-mentioned processes from multiple perspectives. Some approaches focus mainly on the char-acteristics of food products eaten, several focus on the person who eats a particular food, whereas a part of the approaches emphasize the psychological, economic or social context in which food consumption takes place. This broad spectrum of different approaches in this book opens the opportunity to facilitate comprehension of the complex processes involved.
Therefore, this volume is essential for those engaged
in product development, market research and consumer science in food and agro industries but also of great inter-est for students and academics interested in food percep-tion and consumption, policy makers, health educators and nutritionists.
FROM THE CONTENTS
Part I. Food: Introduction. Development and acquisition of food likes. The food and I. Beliefs about Fat: Why do we hold beliefs about fat. Product packaging and branding. Effects of product beliefs on product perception and liking. Consumer's quality perception.
Part II. People: Does taste determine consumption?
Understanding the psychology of food choice. Food choice, phytochemicals and cancer prevention. Private body consciousness. Food neophobia and variety seeking. Convenience-oriented shopping. Food intake and the elderly � Social Aspects. Food related lifestyle.
Part III. Society: Cross-cultural differences in food
choice. Appropriateness as a cognitive-contextual meas-
ure of food attitudes. The origin of spices. Marketing PDO and PGI. Effect of communication on sales of com-modities. Food availability and the European consumer. The economics of food choice. Food choice in Europe. Beliefs associated with food production methods. Risk perception, communication and trust. Risk perception and food choice. Public Participation in developing policy related to food issues. The future of European food choice. Subject Index
NMR Spectroscopy: Data Acquisition (CD-ROM included “Spectroscopic Techniques: An Interactive Course”)
Christian Schorn
347 pages; Wiley-VCH Weinheim � New York � Chichester � Brisbane � Singapore � Toronto, 2001; ISBN 3-527-28827-9; Hardcover EUR 159.00.
The application of NMR spectroscopy in new fields
of research continues on a daily basis. For example, a higher magnetic field strength can be used to overcome problems associated with low sample concentrations en-abling the analysis of complex spectra of macromolecules such as biopolymers (e.g. proteins) or the study of non-liquid samples by MAS and solid state NMR spectros-copy. Apart from the chemical and physical research fields NMR is, in the meanwhile, a part of industrial pro-duction and medicine, e.g. by MRI (magnetic resonance imaging) and MRS (magnetic resonance spectroscopy). But the basic principles of acquiring and processing raw data and analysing the spectra is always similar irrespec-tive of the special technique used and basic knowledge may be transferred from one field to another, e.g. high resolution to solid state NMR.
These ideas were the origin for creating a series enti-
tled �Spectroscopic Techniques: An Interactive Course. The section relating to NMR spectroscopy consists of four volumes:
• Volume 1 Processing Strategies
• Volume 2 Data Acquisition
• Volume 3 Modern Spectral Analysis
• Volume 4 Intelligent Data Management. This complete series deals with all aspects of a standard
NMR investigation beginning with the definition of struc-tural problems and ending with the unravelled structure.
Volume 1 �Processing Stzartegies� gives the theoreti-
cal background for all processing steps and demonstrates

© by PSP Volume 24 – No 3. 2002 Advances in Food Sciences
129
the effects of different manipulations by means of suitable examples. If you intend to operate a NMR spectrometer yourself, or want to become more familiar with additional powerful software tools to make the best of your NMR data, you need this Volume 2 �Data Acquisition�.
This volume begins with the selection of the most ap-
propriate pulse experiment(s) necessary to solve a struc-tural problem by NMR analysis. Then the understanding of the basic principles of the most common experiments and being aware of the dependence of spectral quality on the various experimental parameters as the most impor-tant prerequisites for a successful appli-cation of any NMR experiment are explained. Spectral quality, on the other hand, strongly determines the reliability of structural information extracted in the subsequent steps of NMR analysis. These facts are not only of interest for the NMR operators but also for interpreters of spectral data. They have also to be familiar with the interdependence of vari-ous experimental parameters such as acquisition time and resolution, repetition rate, relaxation times and signal intensities. Many mistakes made with the application of modern NMR spectroscopy because of a lack of under-standing of these basic principles may be avoided. This volume covers all these aspects and explains them in an interactive way. Using the Bruker software package NMR-SIM together with 1D WIN-NMR and 2D WIN-NMR (included CD-ROM) allows the readers to simulate routine NMR experiments and study the interdependence of a number of NMR parameters to get an insight into modern multiple pulse NMR experimental work.
Volume 3 �Modern Spectral Analysis� discussing the
strategies needed for efficient and competent extract of the NMR parameters from the corresponding spectra and Volume 4 �Intelligent Data Management� as an intro-duction to the computer-assisted interpretation of molecu-lar spectra of organic compounds using Bruker software (WIN-SPECEDIT, STRUKED together with 1D WIN-NMR and 2D WIN-NMR) are additionally recommended to enable the user to evaluate NMR parameters, to gener-ate and exploit dedicated databases and, finally, to estab-lish molecular structures.
Meat refrigeration
S. J. James and C. James Woodhead Publishing in Food Science and Technology 347 pages, numerous tables and figures; CRC Press Boca Raton � Boston � New York � Washington D.C., pub-lished in Europe by Woodhead Publisihing Ltd, Abington Hall, Abington, Cambridge, CB1 6AH, UK, 2002; ISBN 1-85573-442-7; Hardcover £ 135.00/€ 210.00 (plus p&p).
Chilling and freezing of meat remains one of the es-sential ways to extend shelf-life and maintain quality. Based on the experiences and results of the internation-ally-renownded Food Refrigeration and Process Engi-neering Research Centre (FRPERC), this volume pro-vides a recommendable guide either to the impact of refrigeration on meat or the best practice in using it to maximise meat quality for the consumer.
Part 1 considers the impact of refrigeration on meat
quality. First of all the microbiology of refrigerated meat is explained including factors affecting the shelf-life of refrigerated meat such as initial microbial levels, parame-ters like temperature and relative humidity but also other considerations such as bone taint, cold and hot deboning. Then drip production in meat refrigeration with chapters on biochemistry of meat (structure of muscle, changes after slaughter, water relationships in meat, ice formation in muscle tissue), measurement of drip and factors affect-ing the amount of drip (animal factors, refrigeration fac-tors, chilled storage) follows. The influence of refrigera-tion on texture of meat (muscle shortening, development of ageing, influence of chilling, freezing and thawing) is described in chapter 3 of part 1. In the last two chapters an overview on colour changes in chilling, freezing and storage of meat is given and the influence of refrigeration on evaporative weight loss from meat is explained.
Part 2 examines the best practice in managing the cold
chain from carcass to consumer. The authors discuss pri-mary chilling of red meat, freezing systems, tempering and crust freezing, thawing, transportation of meat, chilled and frozen storage, chilled and frozen retail display of wrapped and unwrapped meat and meat products including overall cabinet design and, finally, consumer handling.
The last part of this book summarizes the most
important aspects of process control with chapters on thermophysical properties of meat (chilling: thermal conductivity, specific heat, enthalpies, freezing, thawing and tempering: ice content, heat extraction, thermal conductivity, density), temperature measurements (instru-mentation, calibration, measuring and interpretation), specifying, designing and optimising of refrigeration systems (Process: throughput, temperature requirements, weight loss, plant design; Engineering: Environmental conditions, room size, refrigeration loads and plant capac-ity, relative humidity, ambient design, defrosts; plant de-sign and process definition) and secondary chilling of meat and meat products (cooked meat, pastry products, solid/liquid mixtures, process cooling, cook-chill).
At the end of each of the 16 chapters a comprehensive
list of references is included to give the interested reader the possibility to get to know further details.

© by PSP Volume 24 – No 3. 2002 Advances in Food Sciences
130
Food and Nutritional Supplements – Their Role in Health and Disease.
J. K. Ransley, J.K. Donnelly, N. W. Read (Eds.)
197 pages, 13 figures, 24 tables; Springer-Verlag Berlin � Heidelberg � New York � Barcelona � Hong Kong � Lon-don � Milan � Paris � Singapore � Tokyo, 2001; ISBN 3-540-41737-0; Hardcover GBP 48.00, US $ 74.95.
It is estimated that about 40% of people take nutri-tional supplements. This trend has risen dramatically in recent years and is expected to increase further over the next five years. In Western Europe the market for these products is growing because consumers have been en-couraged to take more responsibility for their own health. Therefore, the purpose of this book is to elucidate the phenomenon of self-medication with nutritional supple-ments from both a biological and psychological point of view. Pharmacies, drug stores,health food shops but also supermarkets stock a vast array of preparations including vitamins, minerals, oils derived from flowers and fish, tonics and herbal products which are also readily avail-able by mail order and purchase over the Internet. What are the reasons why so many people feel the need to take these products?
The book is divided into three main sections. In sec-
tion 1 the phenomenal growth in the market for food and nutritional supplements over the recent years is outlined. It is explained why the body´s need for nutrients varies over the lifecycle and during the course of an illness or trauma. Other chapters deal with extending of the knowl-edge base of health professionals in the scientific field of nutrition, feeling the need to self medicate with supple-ments (placebos) which can relieve suffering of patients.
The second part examines the scientific aspects be-
hind the role key nutrients and components in food and their role in prevention and treatment of disease. Vita-mins, antioaxidants, phytoestrogens and probiotics are considered in detail.
The last section practically evaluates two common
disease states for which nutrients may play a role in pre-vention and also treatment � coronary heart disease and rheumatoid arthritis.
This book is recommended because each of the con-
tributors has provided a concise but comprehensive cov-erage of the latest developments in our understanding of nutrition in relation to food and nutritional supplements. Therefore, an informed view has been created by the editors as a basis when making decisions about healthy eating or the use of dietary supplements.
Prüfmethoden für Chemikalien
Ulrich Schlottmann (Hrsg.)
unter Mitarbeit von R. Arndt, D. Kayser, R. Kanne, E. Bruns, D. Brasse, B. Brumhard, N. Caspers, E. Cremer-Schlede, C. Haas, M. Liebsch, S. Madle und H.-B. Rich-ter-Reichhelm Grundwerk + 3. Ergänzungslieferung zur 1. Auflage, Stand: Januar 2002; 1326 Seiten.; S. Hirzel Verlag Stuttgart - Leipzig, Wissenschaftl. Verlaggesellschaft mbH Stuttgart, 2002; ISBN 3-7776-1151-4; Loseblattsammlung, 2 Ring-ordner - Fortsetzungswerk € 148.00.
Erstmalig sind hier in einer Loseblattsammlung
Prüfmethoden für Chemikalien (offizielle Texte der Me-thoden) sowie erläuternde Kommentare, Rechtsvorschrif-ten (national und EU) einschließlich GLP und Risikobe-wertung zusammengestellt. Außerdem ist eine Einführung ins Umfeld der Prüfmethoden (z. B. Chemikaliengesetz, Verhältnis zu EU und OECD, Tierversuche, Erarbeitung der Prüfmethoden) mit aufgenommen. Diese Methoden werden weltweit zur Bestimmung der physikalisch-chemischen Eigenschaften, der Toxizität und der Ökoto-xizität bei Prüfung und Anmeldung neuer Stoffe und bei der Aufarbeitung von Altstoffen eingesetzt. Diese neuge-fasste und ergänzte Auflage umfasst 200 Seiten mehr als die 1. Auflage. Es sind neue und revidierte Prüfmethoden enthalten, weil inzwischen eine Anpassung der Richtlinie Gefährliche Stoffe (67/548/EWG) - abgekürzt 22. AnpRL erfolgte. Das Kapitel �Weitere Vorschriften� wurde auf den neuesten Stand gebracht und der Einfachheit halber insgesamt ausgetauscht.
Diese Loseblattsammlung ist besonders für die Che-
mische Industrie, den Chemikalienhandel sowie für Che-mische und Toxikologische Prüflabors bestimmt. Für Chemiker und Toxikologen an Universitäten und Behör-den sind diese kommentierten Texte unentbehrlich.
Grenzflächen und kolloid-disperse Systeme – Physik und Chemie
Hans-Dieter Dörfler
989 Seiten, 579 Abbildungen, 88 Tabellen; Springer-Verlag Berlin � Heidelberg � New York � Barcelona � Hong Kong � London � Milan � Paris � Singapore � To-kyo, 2002; ISBN 3-540-42547-0; Gebunden € 89.95 (gül-tig in Deutschland).
Endlich ein komprimiertes Lehrbuch für fortgeschrit-tene Studenten, Diplomanden und Doktoranden, aber auch für Mitarbeiter in der einschlägigen Industrie, die

© by PSP Volume 24 – No 3. 2002 Advances in Food Sciences
131
alle über die erforderlichen Grundkenntnisse verfügen, um sich einführend mit den komplizierten Phänomenen der Physik und Chemie der Grenzflächen und kolloid-dispersen Systeme befassen zu können.
In den ersten 7 Kapiteln werden zunächst die wesent-
lichsten Eigenschaften der verschiedenen Grenzflächen-typen behandelt. Erfreulicherweise ist dies eingebunden in die messmethodischen Entwicklungen und Verfahren, die von den behandelten Oberflächen und dabei auftre-tenden Grenzflächenphänomenen abgeleitet wurden.
In den folgenden Kapiteln 8-13 wird auf die Eigen-
schaften der grenzflächenaktiven Stoffe (Tensidchemie: Adsorption, Mizellbildung, Bildung lyotroper Flüssigkris-talle, Mikroemulsionen, Mechanismus des Waschprozes-ses) eingegangen. Auch hier ist die theoretische Beschrei-bung der auftretenden Phänomene mit den Anwendungen derartiger Tensidsysteme in der chemischen Praxis ver-bunden. Besonders hervorzuheben ist hier die Beschrei-bung der Mizellbildung in Verbindung mit den Eigen-schaften lyotroper Flüssigkristalle, weil die Struktur-Eigenschaftsbeziehungen der thermotropen Flüssigkristal-le integriert wurden.
+ Die Kapitel 16-25 umfassen die praxisorientierte Dar-
stellung der methodischen und theoretischen Aspekte, die in der Grenzflächen- und Kolloidchemie eine Rolle spie-len. In Kapitel 23 werden die rheologischen Messungen vertieft, die bei der in den Kapiteln 8 und 15 vorgestellten Struktur, Funktion und Anwendung von Membransyste-men sowie Hydro- und Aerogelen zur näheren Ermittlung der Eigenschaften dienen.
Insgesamt ein gelungenes Fachbuch, das durch Quer-
verweise in den separat verständlichen einzelnen Kapiteln den Bezug zu den anderen Kapiteln herstellt und das Gesamtverständnis wesentlich erleichtert. Am Ende jedes Kapitels kann der interessierte und kritische Leser anhand eines zu beantwortenden Fragenkataloges überprüfen, ob er die wichtigsten Aspekte auch verstanden hat. Der Au-tor hat, nicht zuletzt durch Einbeziehung von Fachkolle-gen, ein empfehlenswertes Lehrbuch auf dem neuesten Stand der Forschung geschaffen.
DGF-Einheitsmethoden - Deutsche Einheits-methoden zur Untersuchung von Fetten, Fett-produkten, Tensiden und verwandten Stoffen
Deutsche Gesellschaft für Fettwissenschaft (DGF) e.V. (Hrsg.)
2. Aufl. einschließlich 8. Lieferung 2002; ca. 2300 Seiten; Wissenschaftl. Ver-lagsgesellschaft mbH Stuttgart, 2002; ISBN 3-8047-1938-4; Loseblattausgabe - 3 Ringord-ner/ Fortsetzungswerk € 158.00/sFr 252.80 (Vorzugs-preis für DGF-Mitglieder und Mitglieder von Euro-FedLipid: € 110.60/ sFr 177.00)
Die DGF-Einheitsmethoden brauchen nicht mehr ei-gens vorgestellt werden, da sie sich zu einem geschätzten Standardwerk im Bereich der Fettanalytik entwickelt haben und wegen ihrer Verständlichkeit und starken Ori-entierung an die Laborpraxis in Laboralltag, an Uni-versitäten und Untersuchungsämtern allgemein durchge-setzt haben und genutzt werden. Die Verfahren sind viel-fach in Ringtests geprüft und von namhaften Experten entwickelt worden. Es wird hier der ständigen Weiterent-wicklung in der Analytik durch jährliche und regelmäßige Aktualisierung Rechnung getragen. International disku-tierte und zur Zeit bereits normierte Verfahren werden bei der Methodenerstellung berücksichtigt. Neben den mehr als 350 analytischen Untersuchungsverfahren sind auch statistische Methoden zur Überprüfung und Validierung der ermittelten Meßdaten aufgenommen.
AUS DEM INHALT
Abt. A: Allgemeine Angaben; Abt. B: Fett-Rohstoffe; Abt. C: Fette; Abt. D: Technische Fettsäuren; Abt. E: Glycerin; Abt. F: Fettbegleitstoffe; Abt. G: Seifen und Seifenerzeugnisse; Abt. H: Tenside; Abt. K: Fettreiche Nahrungsmittel und Abt. M: Wachse.
Alles Bio oder was? – Der schöne Traum vom natürlichen Essen
Hans-Ulrich Grimm 200 Seiten; S. Hirzel Verlag GmbH & Co., Stuttgart 2002; ISBN 3-7776-1170-0; Kartoniert € 22.00.
In dieser völlig neu bearbeiteten, aktualisierten und er-gänzten Ausgabe des 1999 erschienenen Werkes �Der Bio-Bluff� bezieht der Autor erneut Stellung zur Welt der in Mode gekommenen Bio-Nahrung. Es ist natürlich auch für Wissenschaftler einschlägiger Bereiche interessant, wie ein früherer Journalist und Spiegel-Korrespondent, der heute als freier Autor lebt und ein erklärter Anhänger von Biokost ist, seine Erfahrungen, die er in zahlreichen Recherchen ge-sammelt hat, in diesem Buch kritisch aufarbeitet. In insge-samt 11 Kapiteln berichtet er über seine Entdeckungen in Landwirtschaft und Industrie: Die Vorzüge der Naturkost � Die Schattenseite des Bio-Booms: Konjunktur für Betrüger � Legal, illegal: In den Grauzonen der Lebensmittelproduk-tion � Die Hochrisiko-Landwirtschaft � Der weltweite Bio-Boom � Blendende Geschäfte für Etikettenschwindler � Zoff in der Szene � Das große Bio-Business � Die Industria-lisierung der Biokost � Bio-Bluff in der Bäckerei � Der Kampf um die Zukunft. In diesen Kapiteln beleuchtet er nicht nur die Schattenseiten, sondern auch die Bio-Siegel, auf die man sich unbedingt verlassen kann und die den Traum vom natürlichen Essen Wirklichkeit werden lassen. Das Buch wird schließlich nach dem Literaturverzeichnis abgerundet durch einen Anhang mit dem Titel �Echt bio. Was ist was im Bio-Land?�

© by PSP Volume 24 – No 3. 2002 Advances in Food Sciences
132
Foodborne pathogens – Hazards, risk analysis and control
Clive de W. Blackburn and Peter J. McClure (Eds.)
Woodhead Publishing in Food Science and Technology
with contributions of Clive Blackburn, Peter McClure, Roy Betts, David Legan, Mark Vandeven, Cynthia Stew-art, Martin Cole, Tom Ross, Tom McMeekin, Mac Johns-ton, John Holah, Richard Thorpe, Martyn Brown, Sara Mortimore, Tony Mayes, Chris Griffith, Chris Bell, Alec Kyriakides, Jane Sutherland, Alan Varnam, Paul Gbbs, Marion Koopmans, Rosely Nichols, Huw Smith, Maurice Moss, Mansel Griffiths, Yasmine Motarjemi. 400 pages, numerous tables and figures; CRC Press Boca Raton � Boston � New York � Washington D.C., pub-lished in Europe by Woodhead Publisihing Ltd, Abington Hall, Abington, Cambridge, CB1 6AH, UK, Aug. 2002; ISBN 1-85573-454-0; hardback £ 135.00/€ 235.00 + P&P
In the last years trends in foodborne disease continue to rise. Therefore, the identification and control of patho-gens becomes more important for the food industry. The editors have created an authoritive and practical guide together with an international teams of experts in this field which helps the practitioner to effective the control mechanisms of individual food pathogens.
Part I deals with general techniques in assessing and
managing microbiological hazards beginning with a re-view of analytical methods. The following chapters de-scribe pathogen behaviour and carrying out risk assess-ment, both a necessary basis for an effective food safety management. Then good manufacturing practice in the supply chain beginning with farm production is explained. Details such as hygienic plant design, sanitation, safe process design and operation are also discussed as impor-tant parts of the HACCP concept. The first part ends with a chapter on safe practices for the consumers and also food trade in the sectors of retail and catering.
In Part II the most important pathogens such as E.
coli, Salmonella, Listeria, Campylobacter, Aerobacter, and enterotoxin-producing Staphylococcus, Shigella, Yersinia, Vibrio, Aeromonas and Plesiomonas species are characterized including their risk factors, detection meth-ods and control procedures. This part is finished with a chapter on spore-forming bacteria, e.g. Clostridium botulinum or perfringens and Bacillus spp.
In the third part non-bacterial (viruses, parasites, toxi-
genic fungi) and emerging foodborne pathogens (e.g. My-cobacterium paratuberculosis) are introduced and de-scribed as the afore-mentioned bacteria. This part is con-cluded with an increasingly important chapter on chronic
disease. Microorganisms such as Aeromonas, Brucella spp., Campylobacter spp., enterohaemorrhagic E. coli, Enterobacter sakazakii, Helicobacter pylori, Listeria monocytogenes, Mycobacterium paratuberculosis, nano-bacteria, non-thypi Salmonella, Vibrio vulnificus, Yersinia enterocolitica, Toxoplasma gondii, trematodes, Taenia solium, Trichinella spiralis, and viral hepatitis A virus play here an important role and some of them have contributed to food- or water-borne outbreaks in the last years.
Meat processing – Improving quality
Joseph Kerry, John Kerry and David Ledward (Eds.)
Woodhead Publishing in Food Science and Technology with contributions of David Ledward, Tilman Becker, R. K. Miller, Jennette Higgs, Feridoon Shahidi, Marianne Jakobsen and Grete Bertelson, A. P. Moloney, Margit Dall Aaslyng, Geoffrey R. Nute, H. J. Swatland, Peter McClure, K. G. Rickert, Christian James, K. B. Madsen and Jens Ulrich, Stephen J. James, Marie de Lamballerie-Anton, Peter Sheard, Ir Daniel Demeyer, A. M. Mullen and H. M. Walsh. 464 pages, numerous tables and figures; CRC Press Boca Raton � Boston � New York � Washington D.C., pub-lished in Europe by Woodhead Publisihing Ltd, Abington Hall, Abington, Cambridge, CB1 6AH, UK, 2002; ISBN 1-85573-583-0; hardback £ 135.00/€ 210.00 + P&P
Meat has long been a central component of human
diet, both as major food in its own right and as an essen-tial ingredient in many other food products. Concerns such as safety have led to declining consumption of some types of red meat, especially in regions such as the EU. Therefore, this volume addresses questions of defining meat quality in the mind of the consumers and of quality enhancement during processing.
Part 1 considers the various aspects of meat quality.
There are chapters on what determines the quality of raw meat, changing views of the nutritional quality of meat and the factors determining such quality attributes as colour and flavour.
Part 2 discusses how these aspects of quality are
measured, beginning with the identification of appropriate quality indicators. It also includes chapters on both sen-sory analysis and instrumental methods including on-line monitoring and microbiological analysis.
Part 3 reviews the range of new processing tech-
niques that have been deployed at various stages in the supply chain. Chapters include the use of modelling tech-niques to improve quality and productivity in beef cattle

© by PSP Volume 24 – No 3. 2002 Advances in Food Sciences
133
production, new decontamination techniques after slaugh-ter, automation of carcass processing, high pressure proc-essing of meat, developments in modified atmosphere packaging and chilling and freezing. There are also chap-ters on particular products such as restructured meat and fermented meat products.
This new collection Meat Processing is recommend-
able to all interested practitioners in meat industry and also scientists engaged in the field of food technology and chemistry.
FROM THE CONTENTS
Chapter 1: Introduction; Chapter 2: Defining meat quality (Introduction: what is quality? - Consumer percep-tions of quality - Supplier perceptions of quality � Com-bining consumer and supplier perceptions: the quality circle - Regulatory definitions of quality - Improving meat and meat product quality � References)
Part 1: Analysing meat quality - Chapter 3: Factors
affecting the quality of raw meat (Introduction - Quality, meat composition and structure - Breed and genetic ef-fects on meat quality - Dietary influences on meat quality- Rearing and meat quality - Slaughtering and meat quality - Other influences on meat quality - Summary: ensuring consistency in raw meat quality - Future trends - Sources of further information and advice � References); Chapter 4: The nutritional quality of meat (Introduction - Meat and cancer - Meat, fat content and disease - Fatty acids in meat - Protein in meat - Meat as a functional food - Meat and micronutrients - Future trends - Conclusion �References); Chapter 5: Lipid-derived flavours in meat products (Introduction - The role of lipids in generating meaty flavours - Lipid autoxidation and meat flavour deterioration - The effect of ingredients on the flavour quality of meat - The evaluation of aroma compounds and flavour quality - Summary �References); Chapter 6: Modelling colour stability in meat (Introduction - Exter-nal factors affecting colour stability during packaging and storage - Modelling dynamic changes in headspace com-position - Modelling in practice: fresh beef - Modelling in practice: cured ham - Internal factors affecting colour stability - Validation of models - Future trends � Refer-ences); Chapter 7: Maximising texture quality in meat (Introduction - Pre-slaughter influences on texture - Post-slaughter influences on texture - Measuring meat texture - Future trends - Sources of further information and advice �References).
Part 2: Measuring quality - Chapter 8: Quality indica-
tors for raw meat (Introduction - Technological quality - Eating quality - Determining eating quality - Sampling procedures - Future trends - Acknowledgement � Refer-ences); Chapter 9: Sensory analysis of meat (Introduction- The sensory panel - Sensory tests - Category scales -
Sensory profile methods and comparisons with instru-mental measurements - Comparisons between countries - Conclusions � References); Chapter 10: On-line monitor-ing of meat quality (Introduction - Measuring electrical impedance - Measuring pH - Analysing meat properties using NIR spectrophotometry - Measuring meat colour and other properties - Water-holding capacity - Sarcomere length - Connective tissue - Marbling and fat content - Meat flavour - Boar taint - Emulsions - Measuring changes during cooking - Conclusions - Sources of further information and advice � References); Chapter 11: Meth-ods for the microbiological examination of meat and meat products (Introduction - Sampling - Microbiological methods - Quality assurance - Microbiological specifica-tions - Future trends - Sources of further information and advice � References).
Part 3: New techniques for improving quality - Chapter
12: Modelling beef cattle production to improve quality (Introduction - Elements of beef cattle production - Chal-lenges for modellers - Simple model of herd structure - Future developments � References); Chapter 13: New developments in decontaminating raw meat (Introduction - Current decontamination techniques and their limitations - Washing - The use of chemicals - New methods: steam - Other new methods - Future trends � References); Chap-ter 14: Automated meat processing (Introduction - Cur-rent developments in robotics in the meat industry - Automation in pig slaughtering - Case study: the eviscera-tion process - Automation of secondary processes - Future trends - References and further reading); Chapter 15: New developments in the chilling and freezing of meat (Intro-duction - The impact of chilling and freezing on texture - The impact of chilling and freezing on colour - The im-pact of chilling and freezing on drip loss and evaporative weight loss - The cold chain - Temperature monitoring - Optimising the design and operation of meat refrigeration - Sources of further information and advice � References); Chapter 16: High pressure processing of meat (Introduc-tion: the principles of high pressure (HP) processing - The effect of HP on food components - Effects on meat struc-ture - Effects on enzyme release and activity - Effects on texture and colour - Effects on lipid oxidation - Effects on functional properties of meat proteins - Effects on micro-flora - Current applications and future developments - Conclusions � References); Chapter 17: Processing and quality control of restructured meat (Introduction - Prod-uct manufacture - Factors affecting product quality: tem-perature, ice content, particle size and mechanical proper-ties - Factors affecting product quality: protein solubility and related factors - Factors affecting product quality: cooking distortion - Sensory and consumer testing - Fu-ture trends - Sources of further information and advice � References); Chapter 18: Quality control of fermented meat products (Introduction: the product - The quality concept - Sensory quality and its measurement - Appear-ance and colour: measurement and development - Tex-ture: measurement and development - Flavour: measure-

© by PSP Volume 24 – No 3. 2002 Advances in Food Sciences
134
ment and development Taste and aroma: measurement and development - The control and improvement of qual-ity Future trends in quality development); Chapter 19: The fat content of meat and meat products (Introduction - Fat and the consumer - The fat content of meat - Animal effects on the fat content and composition of meat - Die-tary effects on the fat content and composition of meat - Future trends - Sources of information and advice � Ref-erences); Chapter 20: Quality control of low-fat meat products (Introduction - The influence of fat on product quality - Current trends in product development - Tech-niques for fat reduction in processed meats - Functional ingredients used in low fat meat products - Other factors influencing product quality - Future trends - Sources of further information and advice �References); Chapter 21: Packaging (Introduction - The use of modified atmosphere packaging (MAP) - Developments in MAP systems - Ac-tive packaging - Future trends - Sources of further infor-mation and advice � References).

© by PSP Volume 24 – No 3. 2002 Advances in Food Sciences
135
SUBJECT INDEX
A aglycones 106 alcoholic fermantation 116 Aspergillus niger 121 Aspergillus terreus 121
B biosorption 121 book reviews 128
C cassava peels 94 cobalt 121
E enzymatic hydrolysis 106
F fungi 121 fungicides 94
G glycosides 106 glycosidically bound volatiles 106
H honey 125 hop flavour 106 Humulus lupulus L. 106
I insecticides 94
L lead 121
M manganese 121 marula 116 metal ions 121 mukumbi 116
N nickel 121
O olive fruits 99 olive leaves 99
P Phanerochaete chrysosporium 121 physico-chemical analysis 125 Pleurotus sajor-caju 94 polyphenols 99
S sunflower oil 99
Q quality assurance tests 99
R rancidity 99
T Tokat 125 Trichoderma reesei 121 Turkey 125
W wine 116
Y yeasts 116
subject-index

© by PSP Volume 24 – No 3. 2002 Advances in Food Sciences
136
AUTHOR INDEX
A Abd-Elmoien, N. M. 99 Adenipekun, C. O. 94
E Emtiazi, G. 121
F Farag, R. S. 99 Fasidi, I. O 94
H Habibi, M. H. 121 Haghighipour, M. A. 121
K Khalesi, Z. 121 Kollmannsberger, H. 106
L Leupold, G. 128
M Mahmoud, E. A. 99 Mpofu, A. 116
N Nitz, S. 106
T Tüzen, M. 125
Z Zvauya, R. 116
author-index

© by PSP Volume 24 – No 3. 2002 Advances in Food Sciences
137
, AFS - ORDER FORM
Yes, I wish to order AFS starting with Volume 24/ 2002
��Printed journal 120 EURO plus postage/ handling
(Germany 15 EURO/ Europe 30 EURO/ International 60 EURO)
� Online journal 96 EURO
Minimum subscription period: 1 year Cancellation must be generally effected 3 months before end of subscription period.
� Will be paid in full
� 50% will be paid (postage/ handling full) because�
� member of MESAEP/ SECOTOX � contributor from developing country � student
Special-Offer to Subscribers- back issues at reduced rates! Subscribers in 2002 are entitled to receive back issues at reduced rates (while stocks last). (3 double issues/ less 50%:Euro 60,00 + postage and handling). To take advantage of this offer please tick the boxes below when ordering a subscription to AFS for 2002.
� 1996 � 1997 � 1998
� 1999 � 2000
Invoice address
Name:...................................................................
Position:...................................................................
Organization:...................................................................
Address:...................................................................
...................................................................
...................................................................
e-mail:...................................................................
Delivery address (if different)
Name: ...................................................................
Position: ...................................................................
Organization: ...................................................................
Address: ...................................................................
...................................................................
...................................................................
e-mail: ................................................................
Methods of Payment
� Please send me a pre-payment invoice
� I enclose a cheque made payable to PSP
Value Added Tax In certain circumstances we may be obliged to charge
Value Added Tax (VAT) on sales to other EU member countries. To avoid this, it is therefore essential to provide us your VAT number if you have one.
� I am not registered for VAT � My VAT number is Signature:���������������.
Date:������������������
Please complete this form and return to: AFS – Advances in Food Sciences c/o PSP – Parlar Scientific Publications Angerstr. 12 - 85354 Freising – GERMANY Phone: ++ 49 (0) 8161 48420 Fax: ++ 49 (0) 8161 484248 e-mail: [email protected]