AFRICA’S SEED SYSTEMS PROGRAMS Evaluation Report
130
END OF PROGRAM EVALUATION FOR AGRA AFRICA’S SEED SYSTEMS PROGRAMS Evaluation Report Submitted to: Alliance for a Green Revolution in Africa P.O. Box 66773 Westlands 00800 by Natural Resources Institute University of Greenwich Dr Kate Wellard, Dr James Onsando, Dr Hannington Odame, Dr Daimon Kambewa, Dr Robert Aidoo, Dr Pamela Katic, Dr Dawit Alemu, Dr Amadou Sidibe, Barbara Bamanya, Dr Omari Mponda July 2019
Transcript of AFRICA’S SEED SYSTEMS PROGRAMS Evaluation Report
END OF PROGRAM EVALUATION FOR AGRA
AFRICA’S SEED SYSTEMS PROGRAMS
Evaluation Report
Submitted to:
Alliance for a Green Revolution in Africa
P.O. Box 66773
Westlands 00800
by
Natural Resources Institute
University of Greenwich
Dr Kate Wellard, Dr James Onsando, Dr Hannington Odame, Dr Daimon Kambewa,
Dr Robert Aidoo, Dr Pamela Katic, Dr Dawit Alemu, Dr Amadou Sidibe, Barbara Bamanya,
Dr Omari Mponda
July 2019

2
EVALUATION OF AGRA AFRICA’S SEED SYSTEMS PROGRAM FINAL REPORT
Contents 1. EXECUTIVE SUMMARY ......................................................................................................................... 8
1.1 Background to the evaluation ................................................................................................................. 8
1.2 Evaluation purpose .................................................................................................................................. 8
1.3 Methodology ........................................................................................................................................... 9
1.4 Developing African Plant Breeders .......................................................................................................... 9
1.5 Development of New Improved Crop Technologies .............................................................................. 11
1.6 Private sector seed production .............................................................................................................. 13
1.7 Agro-dealer development for technology distribution .......................................................................... 15
1.8 Program impact at household level ....................................................................................................... 17
1.9 Creating an enabling environment ........................................................................................................ 18
2. EVALUATION BACKGROUND AND OBJECTIVES ................................................................................ 20
2.1. Background ......................................................................................................................................... 20
2.2. Evaluation purpose and objectives..................................................................................................... 21
2.3. Scope of the evaluation ...................................................................................................................... 23
2.4. Outline of the report .......................................................................................................................... 24
3. EVALUATION APPROACH AND METHODS ........................................................................................ 25
3.1. Approach ............................................................................................................................................ 25
3.2. Study design ....................................................................................................................................... 25
3.3. Indicator analysis framework ............................................................................................................. 26
3.4. Evaluation methodology..................................................................................................................... 27
3.5. Secondary data collection .................................................................................................................. 27
3.6. Primary data collection ....................................................................................................................... 28
3.7. Data analysis ....................................................................................................................................... 29
3.8. Quality assurance ............................................................................................................................... 29
4. Developing African Plant Breeders ................................................................................................... 31
4.1 Program rationale .................................................................................................................................. 31
4.2 Methodology ...................................................................................................................................... 31
4.3 EACI sub-program outputs ..................................................................................................................... 32
4.4 EACI Impacts: improving the functionality of national research systems ............................................. 33
4.5 EACI impacts: improving capacity of AGRA-trained breeders to produce, release, commercialise varieties ....................................................................................................................................................... 35
4.6 EACI impact: reviving university curriculum and infrastructure ............................................................ 36
4.7 Sustainability of EACI ............................................................................................................................. 37
4.8 Conclusions and recommendations on developing African Plant Breeders .......................................... 38
5 Development of New Improved Crop Technologies ......................................................................... 40
5.1 Background ............................................................................................................................................ 40
5.2 FIAAC Breeding achievements ............................................................................................................... 41
5.3 Varieties released and commercialised ................................................................................................. 42

3
EVALUATION OF AGRA AFRICA’S SEED SYSTEMS PROGRAM FINAL REPORT
5.3.1 Varieties released 42
5.3.2 Varieties commercialised 43
5.4 Factors supporting and constraining commercialisation ....................................................................... 44
5.5 Capacity strengthening of plant breeding ............................................................................................. 46
5.6 Conclusions and Recommendations ...................................................................................................... 48
6 Private Sector Seed Production ......................................................................................................... 51
6.4 Production and sales of seed by AGRA-supported companies .............................................................. 53
7.5 Scaling up of production and features of scaling ............................................................................... 61
6.6 Opportunities, challenges and risks ....................................................................................................... 63
6.7 Conclusions ............................................................................................................................................ 65
6.8 Recommendations ................................................................................................................................. 66
7 Agro-dealer Development for Technology Distribution ................................................................... 69
7.1 Overview ................................................................................................................................................ 69
7.2 Methods ................................................................................................................................................. 69
7.2 Farmer access to improved inputs......................................................................................................... 70
7.3 Source of farm inputs ............................................................................................................................ 71
7.4 Demand creation activities .................................................................................................................... 73
7.5 Agro-dealer capacity .............................................................................................................................. 74
7.6 Impact of Agro-dealer Business Activities ............................................................................................. 76
7.7 Challenges and opportunities for Agro-dealer development ................................................................ 80
7.8 Conclusions and lessons ........................................................................................................................ 82
7.9 Recommendations ................................................................................................................................. 82
8 PASS Impact at Farmer Level ............................................................................................................. 84
8.1 Approach ............................................................................................................................................... 84
8.2 Poverty Index ......................................................................................................................................... 84
8.3 Yields of key food crops ......................................................................................................................... 85
8.4 Gross Margins of key crops .................................................................................................................... 88
8.5 Farmers applying improved technologies varieties ............................................................................... 89
8.6 Area under improved technologies ....................................................................................................... 90
8.7 Awareness of AGRA-supported varieties ............................................................................................... 90
8.8 Gendered impacts at household level ................................................................................................... 93
8.9 Impact on poverty at household level ................................................................................................... 94
9 Creating an Enabling Environment .................................................................................................... 96
9.1 Introduction ........................................................................................................................................ 96
9.2 Uganda ............................................................................................................................................... 98
9.3 Ghana ............................................................................................................................................... 101
9.4 Tanzania ............................................................................................................................................ 105
9.5 Mali ................................................................................................................................................... 106
4
EVALUATION OF AGRA AFRICA’S SEED SYSTEMS PROGRAM FINAL REPORT
9.6 Ethiopia ............................................................................................................................................. 107
9.7 Enabling Environment Synthesis and Recommendations ................................................................ 109
References ................................................................................................................................................. 111
10 Appendices ....................................................................................................................................... 113
Appendix 1: Evaluation approach .............................................................................................................. 113
Appendix 2: Evaluation Design Matrix ....................................................................................................... 114
Appendix 3 PASS output targets and achievements 2007-2018 ............................................................... 117
Appendix 4 SSTP Achievements against targets ........................................................................................ 118
Appendix 5: Farmer-preferred traits for AGRA-supported varieties ......................................................... 119
Appendix 6: Traits in AGRA-supported varieties disliked by surveyed farmers ........................................ 121
Appendix 7: TASAI Breeding scores for selected countries ....................................................................... 123
Appendix 8 Integration between Formal and Informal Seed Systems ...................................................... 124
Appendix 9 Key Informants Interviewed ................................................................................................... 125

5
EVALUATION OF AGRA AFRICA’S SEED SYSTEMS PROGRAM FINAL REPORT
Acknowledgements
The NRI evaluation team would like to thank AGRA staff for the assistance and feedback received during
the assignment: from the President, Dr Agnes Kalibata; Head, M&E and Knowledge Management, Daudi
Sumba; former PASS Director, Dr Joe DeVries and Program Officers: Dr George Bigirwa (now VP Program
Design and Innovation), Dr Rufaro Madakadze and Dr Jane Ininda; SSTP staff and AGRA country staff in
Ghana, Tanzania, Uganda, Mali and Ethiopia. We would also like to thank all PASS grantees and other
stakeholders visited during the course of the study for sharing their time and knowledge to inform the
evaluation: policy-makers, government officials, university lecturers, graduates, researchers, extension
staff, seed companies, agro-dealers and farmers across the PASS countries.
6
EVALUATION OF AGRA AFRICA’S SEED SYSTEMS PROGRAM FINAL REPORT
Acronyms
ACCI African Centre for Crop Improvement, University of KwaZulu Natal
ADP Agro-Dealer Development Program
AGRA Alliance for a Green Revolution in Africa
ARIPO Africa Regional Intellectual Property Organisation
ASIF Agricultural Sector Investment Fund
ATA Agricultural Transformation Agency
AU African Union
BMGF Bill and Melinda Gates Foundation
CAADP Comprehensive Africa Agriculture Development Programme
CGIAR Consultative Group on International Agricultural Research
CIAT International Center for Tropical Agriculture
CIMMYT International Center for Maize and Wheat Improvement
CNFA Citizens Network for Foreign Affairs
COMESA Common Market for Eastern and Southern Africa
EACI Education for African Crop Improvement
ECOWAS Economic Community of West African States
EGS Early Generation Seed
FAO Food and Agriculture Organisation
FIAAC Fund for the Improvement and Adoption of African Crops
FtF Feed the Future
GM Gross Margin
HDI Human Development Index
ICRISAT International Centre for Tropical Agriculture
ISTA International Seed Testing Association
KALRO Kenya Agricultural and Livestock Research Organisation
KSC Kenya Seed Company
M&E Monitoring and Evaluation
MIRA Micro Reforms for African Agribusiness
MSc Master of Science
MNC Multinational Company
MTR Mid Term Review
MT Metric Tonne (1000 kg)
NAADS National Agricultural Advisory Services
NAFSN New Alliance for Food Security and Nutrition
NARS National Agricultural Research System
NEPAD New Partnership for Africa’s Development
NGO Non-Governmental Organisation
NMB National Microfinance Bank
NPGRC National Plant Genetic Resources Centre
NPT National Performance Trial
NRI Natural Resources Institute
OPV Open Pollinated Variety
PASS Program for Africa’s Seed System
PhD Doctor of Philosophy

7
EVALUATION OF AGRA AFRICA’S SEED SYSTEMS PROGRAM FINAL REPORT
PVS Participatory Variety Selection
QDS Quality Declared Seed
RUFORUM Regional Universities Forum for Capacity Development in Agriculture
SADC Southern Africa Development Community
SEPA Seed Production for Africa
SME Small and Medium Enterprises
SSA Sub Saharan Africa
SSTP Scaling Seeds and Technologies Partnership
TAGMARK Tanzania Agricultural Market Development Trust
TASP Tanzania Agro Dealers Strengthening Program
TASAI The African Seed Access Index
TASTA Tanzania Seed Traders Association
TOSCI Tanzania Official Seed Certification Institute
UKZN University of KwaZulu Natal
UNADA Uganda National Agro Dealers Association
UPOV Union for Protection of Plant Varieties
USAID United States Agency for International Development
WAAIF West African Agricultural Investment Fund
WACCI West African Centre for Crop Improvement, University of Ghana

8
EVALUATION OF AGRA AFRICA’S SEED SYSTEMS PROGRAM FINAL REPORT
1. EXECUTIVE SUMMARY
1.1 Background to the evaluation
The Program for Africa’s Seed Systems (PASS) was the first program of the Alliance for a Green
Revolution in Africa (AGRA). It began in 2007 with an investment of $150 million over five years from The
Rockefeller Foundation ($50 million) and the Bill and Melinda Gates Foundation ($100 million) for work in
13 target countries. Subsequent contributions from the Howard G Buffett Foundation, USAID, and the
Dutch Government brought the total support for PASS to $285 million over a period of 10 years for seed
systems development work in 17 African countries. The PASS goal was to develop sustainable, mostly
private sector-based seed systems in Africa that would increase access for smallholder farmers to
improved crop varieties that produce higher crop yields resulting in increased income, improved food
security and reduced poverty. PASS supported agro-ecology based crop breeding by national and local
research programs; coordinated with the CGIAR system to rapidly disseminate existing improved seed
varieties; nurtured the development of a vibrant, competitive seed sector; supported the development of
national agro-dealer networks; partnered with African universities to train the next generation of African
agricultural scientists; and advocates for seeds regulatory frameworks that make high quality, affordable
seed available to smallholder farmers. PASS’s four sub-programs focused on different aspects of the input
supply chain: Education for African Crop Improvement (EACI), the Fund for the Improvement and
Adoption of African Crops (FIAAC), the Seed Production for Africa Initiative (SEPA) and the Agro-Dealer
Development Program (ADP).
The Scaling Seeds and Technologies Partnership (SSTP) in Africa was established under PASS with support
from USAID on behalf of the Group of 8 (G8) as part of its commitment under the New Alliance for Food
Security and Nutrition (NAFSN). The goal of SSTP was to improve food security and reduce poverty among
smallholder farmers by taking to scale seed and other technologies relevant to smallholder farmers
focusing on 6 countries (Ghana, Senegal, Ethiopia, Malawi, Mozambique and Tanzania). SSTP was
expected to help countries transition from state-dominated seed systems to systems that allow for private
sector including local businesses and non-profit organizations to provide key services and strengthen the
capacity of the state to carry out critical regulatory functions. SSTP also attained significant achievements
over the five - year period,
PASS ended in December 2017 and SSTP implementation was completed in June 2018. AGRA procured
the services of the Natural Resources Institute (NRI) to conduct a combined evaluation of the seeds
systems work implemented through the second phase of PASS and SSTP to determine the success and
impact of the intervention in the seed systems and draw lessons that should inform AGRA seeds work for
the future.
1.2 Evaluation purpose
The purpose of the combined evaluation was to measure and provide robust empirical evidence on the
success and impact of the AGRA seeds systems in developing and scaling up seed systems in Africa that
should inform future investments in seed systems in the 2017-2021 AGRA Integrated Strategy and
beyond. The evaluation explored the extent to which AGRA seeds systems work through PASS and SSTP
achieved stated goals, objectives and demonstrated impact. It also assessed any unintended impacts that
resulted from the programs. It assessed the mechanisms that delivered the observed changes and the key

9
EVALUATION OF AGRA AFRICA’S SEED SYSTEMS PROGRAM FINAL REPORT
features of these mechanisms. Lastly, it recommends how the evidence should be used to inform future
AGRA investments. A set of evaluation questions guided the evaluation.
The evaluation focus was AGRA seed systems from 2012 to 2017 for PASS and from 2013 to 2018 for SSTP.
However, the previous phase of PASS is referenced to attribute for the results that are reported. The
evaluation covered the whole program with site visits in five key countries – Ghana, Uganda, Tanzania,
Mali and Ethiopia. A statistically representative sample of PASS and SSTP grants/projects, seed companies
and beneficiary smallholder farmers was selected and assessed through site visits across the focus
countries. Major crops addressed were maize, cassava, rice, beans, Irish potatoes, cowpea.
1.3 Methodology
The study design is based upon the evaluation questions. An Indicator Analysis Framework was drawn up
with indicators, data sources and analytical methods. The evaluation used a mixed methods approach
combining qualitative and quantitative data to provide insights into the changes brought about by AGRA’s
seeds systems programs. Methods included: 1. Secondary data collection from program documents and
official sources including national statistics, and literature reviews on seeds systems to inform how they
respond to evaluation questions and measure changes. 2. Key informant interviews with seed companies,
breeders, universities, national research stations, agro-dealers and policymakers to collect qualitative
information using structured and semi-structured interviews on key evaluation questions to complement
quantitative analysis. 3. Household surveys with 2220 farmers to assess changes occurring as a result of
the program. 4. Focus group discussions and interviews with agrodealers to understand activities and
outreach. 5. e-survey with 70 EACI graduates.
KEY FINDINGS
1.4 Developing African Plant Breeders
Evaluation question: To what extent have AGRA trained breeders been absorbed in country research
systems and funded by governments to continue crop research?
The Education for African Crop Improvement (EACI) subprogram was intended to improve functioning of
country research systems by training breeders. Fellowships were provided to African scientists and African
universities were supported to strengthen curricula and facilities.
Key findings on training breeders
70% of surveyed graduates are currently working in national agricultural research organizations; a further 24% graduates are employed in international research organizations and agriculture-related fields.
AGRA trained breeders comprise an estimated 37% of national breeders in Kenya, 47% in Ethiopia, 50% in Tanzania and 70% in Rwanda.
35% of AGRA trained breeders have secured funding for breeding: only 17% through FIAAC
20% of AGRA trained breeders have successfully developed, released and commercialized crop varieties.
Recommendations on training breeders
Human capacity building in agriculture in Africa has been a concern of governments and donors (FAO,
USAID, CIDA, World Bank, Rockefeller Foundation and others) for over twenty years. This strategy has had

10
EVALUATION OF AGRA AFRICA’S SEED SYSTEMS PROGRAM FINAL REPORT
success but – apart from Rockefeller Foundation – there was no crop breeding focus. AGRA has posted an
impressive performance in training of crop breeders in African target countries within a short timeframe
resulting in a rapid build-up of a world class population of breeders. This is evidenced by the varieties
released in the staple food crops and quality of publications in international journals.
The AGRA education model, with fellowships to train African scientists and support to African
universities to strengthen curricula and facilities, has been successful. With 160 PhDs and 341
MScs, this is a significant contribution to the pool of national breeders on whom the seed system
depends. Building 2 PhD programs within the region is a considerable achievement; together with
support for 13 national MSc programs. Building on foundations laid by Rockefeller Foundation,
AGRA have been the leading supporter of capacity building of breeders in Africa. However, there
is a continuing need to train new breeders to build national capacity and replace retiring staff.
We recommend support for universities through different funding models, including
involvement of AU/NEPAD and partnerships with African governments.
The focus of the trainee breeders’ research has been staple crops: maize, rice, and beans. A
handful of breeders have been trained in orphan crops: millet, pigeonpea, round potato,
vegetables. There remains a major shortage of varieties and breeders for these crops which are
important for food and nutrition security.
It is recommended that increased priority is given to funding of orphan crops breeding through
alternative funding sources such as government, regional economic blocs.
Increasing breeders’ capacity to write bankable research proposals is key to resource
mobilisation.
It is recommended that breeders are trained in resource mobilisation including research concept
notes and proposals for funding to development partners and regional and continental
economic blocs
What model of training breeders should AGRA adopt for sustainability?
Training of breeders needs to be sustained to cope with agricultural growth and succession. Given the
level of government funding to the public research facilities, the momentum created by AGRA may not be
sustained. This makes the issue of sustainability of the training program critical. Potential options:
The triple helix of universities-governments-industry linkages. This model can work sustainably if it
is ingrained in a formal legal/policy framework that compels governments to commit to training a
number of breeders per year, sourcing some of the funding from development partners if necessary.
The existing continental scientific platform to operationalize this is AU/NEPAD. For this to be
formalized through AU/NEPAD, high level policy advocacy is critical. To drive the process there will be
need for a consortium of development partners to work together in the advocacy agenda. AGRA can
play a key role in driving this consortium, for example through AGRF. The private sector will
participate in this space of training breeders if they see that not doing so harms their commercial
interests. However, evidence that the genetics being produced by the breeders are critical for
business may be difficult to demonstrate. This makes the private sector the weakest link in the model.
Development of an integrated capacity building approach. This combines long-term training (MSc
and PhD), short term training, experience-sharing through visits and scientist exchange programmes.
An example is CIMMYT which has worked with national agricultural research institutions such as the
11
EVALUATION OF AGRA AFRICA’S SEED SYSTEMS PROGRAM FINAL REPORT
Ethiopian Institute of Agricultural Research (EIAR) to co-create national maize and wheat breeding
programmes. Most Ethiopian breeders and technicians are CIMMYT trained either in-country or
outside (Mexico). This creates a forum for CIMMYT breeders to work closely with Ethiopian breeders,
and some are stationed in Ethiopia. This model has worked well in Ethiopia and elsewhere and could
be replicated across other international research centers (CGIAR) and commodities. For this
integrated intervention to be sustainable there should be a policy mechanism to incentivise
government to co-finance the process.
1.5 Development of New Improved Crop Technologies
Evaluation question: Have AGRA-trained and funded breeders resulted in improved functioning of the
National Agricultural Research System? To what extent have varieties produced by AGRA-supported
breeders been commercialized by seed companies?
The Fund for the Improvement and Adoption of African Crops (FIAAC) subprogram aimed to support crop
breeding teams to develop and release improved crop varieties, increase farmer awareness and demand
for the varieties through participatory breeding, and to link breeders to seed producers to improve supply
of improved seed.
Key findings on crop development
The PASS breeding program has produced impressive results with over 665 varieties released by
breeders. 431 of these varieties have been commercialised: A commercialization rate of over 60%.
The main focus is maize (26%), rice, cassava, beans plus other staples and legumes.
Varieties are adapted to agroecological contexts and environments including drought tolerance,
disease resistance
Human capacity development was rated highly by breeders; The African Seed Access Index (TASAI) gives high approval ratings for Ethiopia, Ghana and Mozambique.
Investment in capital development was limited. Notable exception is support for irrigation in Ghana which has significantly enhanced the national breeding programme.
Recommendations on crop development
Adoption of the varieties by farmers is generally good; but turnover is low. Initial adoption of an
improved crop variety does not guarantee a continuous process of varietal turnover in
subsequent years. For impact at farmer and national level, varietal turnover must be strong and
sustained. The concept of varietal turnover appears new to the breeders and yet this is how
sustained farmer uptake is engrained.
Breeders must ensure that preferred traits are visible to farmers so they are willing to replace
their older varieties to gain the benefits displayed by the newer varieties. Varietal turnover
needs to be promoted by breeders working closely with seed companies and agro-dealers to
ensure sustained farmer uptake of improved varieties.
Although the breeder training program was excellent across the countries visited, the majority
of current breeders were trained under earlier programs (pre-PASS). The training focus was on
technical aspects at the expense of business training, particularly in the area of product
development and product launch for commercialization, which would enable breeders to treat

12
EVALUATION OF AGRA AFRICA’S SEED SYSTEMS PROGRAM FINAL REPORT
crop varieties as commercial products with appropriate profiling to engage the farmer psyche
and willingness to invest in the new genetics.
Breeders need to access business training – including business development and product
launch - in addition to technical training to improve commercialisation and understanding of
farmer demand.
Infrastructural support for breeding was given a rather low profile under PASS. An exception is
the investment in an irrigation facility in Ghana which has fast-tracked the crop improvement
agenda. Similar investments elsewhere would have a significant impact on the crop
improvement strategy. Investment in irrigation and cold storage is not cheap but the value
addition in enhancing breeders’ seed volumes and advancing varietal commercialization is high.
Support for infrastructural development including irrigation and cold storage is needed to
enhance breeder seed volumes and fast track commercialisation.
AGRA has taken important steps in the direction of climate-smart agriculture through breeding
for drought, waterlogging and pests and diseases. Moving forward, resilient and diversified
agricultural systems are likely to be even more important, and should remain central to AGRA
programming, alongside market-oriented goals.
AGRA should maintain its focus on crops and varieties for diverse ecologies and household
preferences to deliver options to farmers which address their climate, soils, pest and diseases
contexts, and food and market preferences.
The gains made in breeding personnel and institutional capacity can be sustained - but only if
the AGRA grants are complemented by government sustained funding of operations, not just
salaries.
To guarantee sustainability AGRA should:
Lobby policy makers to support breeding operations including maintenance and
registration of varieties and production of breeder seed to ensure gains from the program
are sustained.
Support capacity building of breeders in writing successful concept notes and proposals
for funding to both donors and industry.
Raise the research and breeding agenda at AU/NEPAD level in order to develop policies
that will encourage countries to implement the commitment on investment of 10% of
GDP in agriculture.
The current breeding focus is on farmer traits which tend to promote food security agriculture
rather than processing and value addition agriculture where the value in creating a market pull
is larger.
Breeding for commercial/processing traits should have a higher profile which will create a
dual line breeding strategy. A market pull from processing of primary material will incentivize
farmers to plant more and create a self-sustaining agri-system.
What model of breeding for new varieties should AGRA adopt to support breeding work on a
sustainable basis?
A successful model in the private sector (used by bakeries in wheat improvement in the UK) is analysis of
existing varieties in the market to determine their popularity and attributes which make them popular -
covering farmer and consumer traits and processing traits. AGRA’s focus is farmer adoption of varieties

13
EVALUATION OF AGRA AFRICA’S SEED SYSTEMS PROGRAM FINAL REPORT
which tends to narrow the focus to farmer traits. With the private sector model, farmers identify
additional traits which are missing in existing commercial varieties. If this model is adopted and it delivers,
the seed companies will grow the varieties because they make business sense and farmers will plant the
varieties for food security and livelihoods. This model drives varietal turn-over even without extensive
promotions.
Implementation of this model will require re-tooling of breeders:
A mindset change to treat a new variety as a commercial product with a commercial value
tag emanating from the farmer/consumer or market.
Appreciation of the dynamics of the seed value chain, recognising that their role is critical
because it is at the beginning, driving the chain.
Training in product development and differentiation to meet market requirements.
1.6 Private sector seed production
Evaluation question: How many companies started by PASS are financially viable and selling
meaningful amounts of seed? To what extent have AGRA supported seed companies been
successful in crops other than maize? How can we adapt this model to other crops in future? Did
the AGRA supported companies scale up production and operations? What were the key features
of scaling and how can this be replicated in future?
The Seed Production for Africa (SEPA) subprogram was designed to ensure that improved crop varieties
are produced and distributed so farmers can access improved varieties and complementary inputs. SSTP
was launched to scale uptake of PASS-supported crop varieties and other complementary technologies.
Findings on seed production
Seed companies’ annual sales averaged 11,000 MT in Ethiopia, 2800 MT in Uganda and 440 MT in Mali
50% of surveyed seed companies were assessed as viable; 25% as in transition and 20% as unviable.
57% of varieties produced by surveyed seed companies are from AGRA-supported breeders: two-thirds for Ethiopia and Uganda; one-third for Ghana and Tanzania
The share of maize in total seed production was 37% in 2017 (down from 52% in 2012); wheat, rice, barley and legumes increased shares - indicating increased diversification.
Recommendations on seed production
AGRA has performed well against its targets for certified seed production and variety commercialization.
It has provided grants to seed companies, trained seed companies, created market linkages and advocated
an enabling environment. Focus needs to shift to:
Address delays in seed regulation and certification process. AGRA needs to coordinate and
increase advocacy activities to influence government policy on seed regulation and certification
process.
Address financial constraints faced by seed companies. An innovative financing mechanism is
required to balance the provision of working capital with physical investment on facilities, such

14
EVALUATION OF AGRA AFRICA’S SEED SYSTEMS PROGRAM FINAL REPORT
as: credit guarantees, matching grant schemes, agricultural insurance, and warehouse finance.
Existing agricultural companies would require minimal financial support to diversify into seed
production plus mentoring on seed quality assurance.
Use digitized information system to address seed production and marketing problem. An
effective digitized seed information system is needed to trace and provide stakeholders with
information on Early Generation Seeds, certified seed prices, demand estimates, crop forecasts,
and feedback from farming groups and companies.
Improve extension services to deliver quality services to farmers. Agro-dealers often do not have
time or expertise to provide extension services. Capacity building and resources to support
extension services could significantly enhance uptake of recommended farming practices. AGRA
should initiate high level advocacy for governments to commit extension staff to support seed
systems. Extension staff should receive training mentorship from AGRA and basic extension
materials.
Explore different seed production models. Informal seed systems continue to play an important
role in food security and biodiversity of smallholder farmers in Africa – along with formal seed
systems. AGRA should consider how its programs and policies integrate with informal seed
systems to secure resilient and accessible seed systems.
Pilot market-led multi-stakeholder seed systems in different AGRA countries. The innovation
model developed by CIAT under SSTP is an example of an innovation system which has built
capacity and linkages across the bean seed value chain and resulted in scaling of production in
northern Tanzania. Effective facilitation is required for success. Similar approaches and models should
be adapted and tested for other crops and contexts.
What model of supporting seed companies should AGRA adopt? What financing mechanisms would
lead to viability of AGRA-supporting seed companies?
AGRA has played a critical role in supporting small to medium size seed companies in the target
countries. The feedback from these companies were extremely positive. In Tanzania and Uganda more
than half of companies indicated profitability. In Ghana cassava, groundnuts and cowpea are gaining
commercial profile at the marketplace and proving resilient food security and farmer livelihood crops.
Going forward, we propose several funding models:
Co-financing the development of infrastructure such as irrigation and cold storage for those
companies which are already profitable will fast-track their growth. This will involve raising
capital through cost-sharing with AGRA or other development partner to procure machinery
or irrigation system approved by AGRA, with the AGRA component paid directly to the
supplier.
Support in-country seed quality control through capacity building of seed regulatory bodies
to enforce seed quality regulations. This should move side by side with support for in-house
company quality assurance mechanisms to guarantee high quality seed so farmers can see
the difference between planting grain and planting certified seed. A one-off seed quality
consultancy with seed money to help fill existing gaps can deliver this.
In West Africa (such as Ghana) the calibre of seed companies is low. Supporting investment
in existing successful agro-input businesses (fertilizers and agrochemicals) to diversify into
15
EVALUATION OF AGRA AFRICA’S SEED SYSTEMS PROGRAM FINAL REPORT
seed enterprises could give faster results, so long as the businesses have access to land. These
are already business savvy and will not need training in doing business. Secondly, they already
have some bank connections and could potentially borrow to support their business. This will
make AGRA seed money go further to support seed business growth.
Use of innovative financing mechanisms such as provision of bank guarantees to ease access
to loans to seed companies for purchase of required facilities from commercial banks. AGRA
should only engage where they have identified the infrastructural gaps, and where the
infrastructure could be sourced and at what price, in order to deal with integrity issues in the
investments.
1.7 Agro-dealer development for technology distribution
The Agrodealer Development Program (ADP) aimed to improve the functioning of input markets by
increasing access to farm inputs among poor smallholder farmers through the development of agro-dealer
networks.
Evaluation question: Has AGRA’s approach of agro-dealer development resulted in improved
access and uptake of improved inputs by farmers in target areas? Are agro-dealers that were
supported by AGRA still functional, financially viable and selling viable amounts of seed to
smallholder farmers?
Findings on Agro-dealer development
In most countries where ADP was implemented, access to seed, fertilizer and agrochemicals has greatly improved with the targeted mean 10km maximum distance being achieved, owing to the robust network of agrodealers trained and certified. However, many farmers still travel long distances to access inputs.
Despite the perceived importance in introducing agricultural technologies, the traditional demand creation activities (demo plots and field days) have not gained much traction for agro-dealers beyond program funding.
Most farmers source their improved inputs from other farmers, seed companies and farmer
associations; in Tanzania and Uganda they are more likely to use agro-dealers.
Despite the huge strides in training in business management and establishment of an agricultural credit fund, access to credit remains a significant challenge for agro-dealers. However, linkages to seed suppliers have enhanced access to commercial credit for hub (wholesale) agro-dealers and extended rural outreach to retail agro-dealers, often at no additional cost.
Several agro-dealer associations were formed and existing ones strengthened as a collective to advocate for an enabling business environment from the grassroots to national level but many of them remain ineffective.
Recommendations on Agro-dealer development
Support agro-dealers through incentives to play multiple roles such as technology transfer,
knowledge dissemination and feedback loop to suppliers.
Strengthen linkages with financial service providers to enhance access to credit especially for
growth stage agro-dealers.

16
EVALUATION OF AGRA AFRICA’S SEED SYSTEMS PROGRAM FINAL REPORT
Digitalize stock-keeping to eliminate traditional methods of record keeping. These records are
vital in the assessment of the creditworthiness of a potential borrower.
Build the capacity of agro-dealers and their associations on customer database management to
forecast demand for inputs in order to minimize the challenge of low seasonal demand.
Strengthen agro-dealer associations to act as entry points in training and certification, bulk
procurement of inputs and implementation of seed subsidy schemes.
Support linkages between seed companies and agro-dealers in the dissemination of information
on improved inputs, sustaining agro-dealer-led demos and creating a feedback loop for farmers.
What model of agro-dealership should AGRA adopt? What financing mechanisms would lead to
viability of agro-dealers in Africa?
AGRA should continue to link input supply companies with hub agro-dealers that have creditworthiness
as a middleman for onward linkages with retail agro-dealer outlets, as well as facilitate them to broker
deals for profit-sharing and credit arrangement to improve accessibility of inputs. Possible areas of
intervention include:
Strengthen rural agro-dealers to reduce the distances that many smallholder farmers in Sub-
Saharan Africa travel to procure inputs, which are often only available in large, costly and
unmanageable bags.
Strengthen credibility of business by building trust of suppliers to farmers which enables hub
agro-dealer to buy into the knowledge part of the business and not just selling seeds and
fertilizers.
Branding agro-dealers in the form of signage and training to be considered direct distributors that
comes with benefits such as access to credit.
AGRA needs to think of an innovative financing model - a mix of public and private funding - for
each of these sub-sectors
There is no single innovative financing model that could provide a magic solution. Proposals for
consideration include: Development of an MoU with governments for a graduated co-funding
arrangement, paying a proportion of the grant upfront to support breeding operational costs in
specific agreed cases. This can also be done with private seed companies which are seeking to
improve a certain variety with additional and predetermined genetic traits on condition that the
company enjoys variety protection for a stipulated period. This graduated co-funding starts with
a lower government contribution and higher AGRA contribution. Over time the government
proportion increases while AGRA’s decreases, until the government graduates from the
programme (e.g. over a 10-year period).

17
EVALUATION OF AGRA AFRICA’S SEED SYSTEMS PROGRAM FINAL REPORT
Time period Identified breeding programs/breeder training
Government contribution proportion
AGRA contribution proportion
Year 1 to 3 1St Program 0.25 0.75
Year 4 to 6 2nd Program 0.50 0.50
Year 7 to 10 3rd Program 0.75 0.25
Subsequent years Continuation or emerging programs 1.00 -
Provision of collateral support to the banks by AGRA to fast-track specific infrastructural
development projects prepared by seed companies with a clear business case for AGRA to
interrogate and assess. AGRA stands surety only after approving a project. The project has to fulfil
a company infrastructural gap with financial projections to show that meeting the gap will unleash
potential for higher volumes and profitability.
1.8 Program impact at household level
Evaluation question: To what extent did AGRA work increase the use of improved seeds and
technologies by smallholder farmers at scale in the target countries, and how did this impact
change of yield levels in the respective countries?
Findings on household impact
Over 80 percent of farmers surveyed in PASS countries are using improved crop varieties, fertiliser and
crop rotation indicating high uptake of technologies. Improved post-harvest practices and soil and
water conservation technologies had the lowest uptake, putting harvested crops and soils at risk.
Average area under improved crop varieties ranged from 3 ha in Mali to 1 ha in Tanzania and Ethiopia,
and 0.75ha in Uganda and Ghana. Hectarage under improved pest management and soil and water
conservation technologies was slightly lower.
Households from non-targeted areas have similar levels of uptake to AGRA targeted areas, indicating
strong spillover effects and/or presence of other actors promoting the technologies
Average maize yields were highest in Ethiopia and Tanzania and lowest in Ghana and Uganda – due to
a combination of climate factors, pest and disease, and availability of improved technologies.
Gross margin estimates for key crops varied widely between country and crop, but were generally
positive and confirm SSTP findings.
Households who tried out AGRA-supported varieties rated most as good or very good: teff and wheat
in Ethiopia; maize and rice in Ghana; maize, cowpea and sorghum in Mali; maize, cowpea, rice, beans
and cassava in Uganda.
The traits farmers preferred in AGRA-supported varieties were: high yields, followed by drought or
flood tolerance, marketability, early maturation and taste. This indicates the continuing need to
address the diverse market, food security and climate-related needs in breeding programmes.

18
EVALUATION OF AGRA AFRICA’S SEED SYSTEMS PROGRAM FINAL REPORT
AGRA has been successful in engaging women in project activities at all levels, including female
farmers. Levels of empowerment remain low amongst women farmer participants. There were no
specific gender targets or gender-focused activities which are likely contributory factors to ongoing
low levels of empowerment of women participants.
1.9 Creating an enabling environment
Evaluation questions: What country level and regional policy and regulatory reforms did AGRA
support/facilitate that increased production, delivery and uptake of improved seeds and
technologies? What reforms still need to be supported in focus countries and regions to improve
scaling up of seed production, delivery and uptake?
PASS/SSTP have supported policy and regulatory reforms to facilitate increased production, delivery and
uptake of improved seeds and technologies.
Ghana: AGRA, through SSTP and Micro Reforms for African Agribusiness (MIRA) project, has worked closely with public sector stakeholders on national and regional policy and regulatory reforms. The key policy intervention was the domestication of COMESA seed laws and regulations, now awaiting enactment by Parliament. However, a full policy landscape analysis is needed to identify specific constraints and priority intervention areas. These are likely to include: restructuring of the Plant Protection and Regulatory Services Directorate as a stand-alone institution; enforcement of seed laws and regulations which is difficult given low capacity of Ghana Seed Inspection Division (GSID); capacity building of GSID; third party accreditation of non-GSID staff; facilitation of ISTA accreditation to GSID seed laboratory to spur cross-border deed trade; facilitation of the accession of Ghana to UPOV 1974.
Tanzania: also a SSTP and MIRA project country, AGRA has contributed significantly to the seed reform process. Policies and regulations supported include: private sector access to public varieties; harmonization with COMESA and SADC; country accreditation with ATF; breeder royalties; Quality Declared Seed guidelines. Further support is required for: maintenance of public varieties; combatting Maize Lethal Necrosis Disease (all AGRA varieties are susceptible); monitoring of implementation of regional agreements; seed price reforms; National Plant Genetic Resources Centre.
Uganda: not an SSTP country so AGRA policy interventions are less visible. A notable achievement was AGRA’s work with the Economic Research Centre of Makerere University, carrying out a rapid appraisal of the impacts of a seed tax along the value chain: this resulted in a petition by the Uganda Seed Trade Association and reversal of the tax by the president. Outstanding areas requiring support include: enforcement of seed laws and regulations; capacity building of the National Seed Certificate Service; ISTA accreditation of the NSCS laboratory; third party training and accreditation of seed company inspectors; passing of the National Seed Policy; accession to UPOV 1914; and operationalization of the COMESA harmonized seed regulations.
Mali: AGRA has supported: the harmonization process of the inputs regulatory framework with ECOWAS; improved mechanisms for input distribution and subsidy; a stakeholder review of seed policy and regulation. These processes and activities are ongoing and may require further support.
Ethiopia: limited engagement was seen in Ethiopia where AGRA is hosted by the Agricultural Transformation Agency (ATA), limiting its independent operation. AGRA, through the MIRA coordinator, has been engaged in the complex process of developing a National Seed Policy, which is expected to be incorporated into the National Agricultural Policy. AGRA needs to secure an

19
EVALUATION OF AGRA AFRICA’S SEED SYSTEMS PROGRAM FINAL REPORT
independent status in Ethiopia so that it can effectively support reforms on scaling seed production, delivery and uptake.
Recommendations on policy
AGRA’s strategy of addressing policy gaps through grants to Hubs and Nodal points, is being delivered in
Ghana. However, there is need to focus on specific country policy issues in a prioritized manner. This
requires a thorough policy analysis within the countries of operation to flag up policy intervention for
maximum impact on the ground.
Detailed seed policy and regulations analysis is needed to determine gaps which are slowing down crop
varietal turnover and a strategy developed with clear priorities so that limited resources can be targeted
at improving quality and smooth flow of seed through the value chain and hence make seed business
viable.
Seed regulation: there is an urgent need to improve the autonomy of the regulatory function including
the leadership structure to enhance speed and precision of service delivery. This calls for removal of this
function from the mainstream Ministry of Agriculture structure to an independent Agency
In all countries the regulatory body has a critically low number of inspectors: Uganda has 13 seed
inspectors; Ghana 27 working in 9 regions which translates to 3 per region; Tanzania has 47 working
through the expansive agricultural ecologies of the country; Ethiopia has around 30. There is urgent need
to get third party support to operationalize the private seed inspection accreditation by the
directorates. This requires support for development of a training package to ensure standards.
Seed regulatory decisions are mostly based on laboratory analytical data but laboratory capacity is
generally extremely weak. To restore this function and the accruing benefits to the seed sub-sector, the
necessary equipment must be bought or repaired.

20
EVALUATION OF AGRA AFRICA’S SEED SYSTEMS PROGRAM FINAL REPORT
2. EVALUATION BACKGROUND AND OBJECTIVES
2.1. Background
AGRA was founded in 2006 with a mission to trigger a uniquely African Green Revolution that transforms smallholder agriculture into a highly productive, efficient, competitive, and sustainable system to promote food security and lift millions out of poverty. It began in 2007 with an investment of $150 million over five years from The Rockefeller Foundation ($50 million) and the Bill and Melinda Gates Foundation ($100 million) for work in 13 target countries. Subsequent contributions from the Howard G Buffett Foundation, USAID, and the Dutch Government brought the total support for PASS to $285 million over a period of 10 years for seed systems development work in 17 African countries.
AGRA’s first Strategy (2007-2015) was anchored around four integrated programmatic areas, namely Soil Health Program, Program for Africa’s Seed Systems (PASS), Market Access Program and Policy and Partnerships. AGRA invested over $700 million in these programs which helped to develop tools and systems for an African agricultural transformation. The lessons and experiences of this phase have helped shape the new strategic focus of AGRA for 2017-2021 that aims to Catalyze and Sustain an Inclusive Agricultural Transformation in Africa to increase Incomes and improve Food Security of at least 30 million smallholder farming households with a set of targeted catalytic downstream and systemic investments coupled with government engagement made through its alliance of partners.
The Program for Africa’s Seed Systems (PASS) was central to AGRA’s work towards agricultural transformation. PASS started in 2007 with the goal to develop sustainable, mostly private sector-based seed systems in Africa that would increase access for smallholder farmers to improved crop varieties that produce higher crop yields that would their increase income, improve food security and reduce poverty. PASS sought to address the problem of lack of plant breeders, limited funding to develop new high- yielding seed varieties, and weak seed production and distribution systems.
PASS consisted of four sub-programs that focused on different aspects of the input supply chain. These were Education for African Crop Improvement (EACI), the Fund for the Improvement and Adoption of African Crops (FIAAC), the Seed Production for Africa Initiative (SEPA) and the Agro-Dealer Development Program (ADP). Program objectives were as follows:
To train a new generation of crop breeders and agricultural scientists upon which seed systems depend for growth and productivity.
To support crop breeding in Africa to improve African crop varieties and promote their adoption by smallholder farmers.
To ensure that quality seeds of improved crop varieties are produced and distributed through private and public channels (including private, “SME” seed companies, publicly-supported seed programs, and public extension) so that farmers can adopt these varieties.
To establish and support the growth of small agro-dealers, who are a primary conduit of seeds, fertilizers, and knowledge of their proper use, to smallholder farmers to increase their productivity and incomes.
Overall, PASS invested over $200 million in 18 target countries (Burkina Faso, Ghana, Mali, Niger, Nigeria, Kenya, Tanzania, Malawi, Liberia, Sierra Leone, Senegal, South Sudan, DR Congo, Ethiopia, Rwanda, Mozambique, Uganda, Zambia and Zimbabwe). PASS was implemented in two phases. Phase I laid the foundations for sustainable seed systems by developing new varieties of seeds, training African crop scientists in plant breeding and strengthening/retooling seed distribution systems. The second phase invested about $60 million in 13 sub Saharan African countries and aimed to build on the achievements

21
EVALUATION OF AGRA AFRICA’S SEED SYSTEMS PROGRAM FINAL REPORT
of Phase I in developing an efficient and sustainable seed system that delivers improved seed varieties to target farmers across Sub-Saharan Africa.
Successive PASS performance reviews (Mid-Term review 2010; End of Phase I evaluation 2012; and Variety Traceability Study 2013) all found that PASS has achieved success in its objectives although some challenges still remained e.g. weak linkages among stakeholders.
Following the initial success of PASS, several donors sought to significantly scale up its interventions for seed systems to drive transformation across Africa – a trend that continues up to the present day. AGRA was contracted by the USAID on behalf of the Group of 8 (G8) as part of its commitment under the New Alliance for Food Security and Nutrition (NAFSN) to implement the Scaling Seeds and Technologies Partnership (SSTP) in Africa. This was in line with the commitment of the NAFSN to catalyze private sector investment across African agriculture value chains by taking innovations to scale and provided an opportunity for AGRA to scale up the work of PASS. The aim of SSTP was to take to scale seed and other technologies relevant to smallholder farmers. Hence, SSTP did not include funds for post-graduate training of plant breeders or crop breeding. STTP focused on 6 countries (Ghana, Senegal, Ethiopia, Malawi, Mozambique and Tanzania) and sought to support Alliance countries to coordinate country, donor-financed and private sector programs to strengthen the inputs sector and to promote the commercialization, availability and adoption of technologies at scale. SSTP was expected to help countries transition from state-dominated seed systems to systems that allow for private sector including local businesses and non-profit organizations to provide key services but also strengthen the capacity of the state to carry out critical regulatory functions. The goal of SSTP is to improve food security and reduce poverty among smallholder farmers in targeted areas within selected sub-Saharan African countries. Specific objectives of SSTP were to:
Improve capacity of public and private sector groups to deliver quality seeds and other technologies to smallholder farmers.
To increase use of quality seeds and other technologies by smallholder farmers;
To improve regional and country level policy and regulation mechanisms for the production and delivery of quality seeds and technologies to smallholder farmers.
PASS phase II ended in December 2017 and SSTP implementation was completed in June 2018. An evaluation team from the Natural Resources Institute, University of Greenwich was engaged to conduct a combined evaluation of the seeds systems work implemented through the second phase of PASS and SSTP to determine the success and impact of the intervention in the seed systems and draw lessons that should inform AGRA seeds work for the future.
2.2. Evaluation purpose and objectives
The purpose of the combined evaluation was to measure and provide robust empirical evidence on the success and impact of the AGRA seeds systems in developing and scaling up seed systems in Africa that should inform future investments in seed systems in the 2017-2021 AGRA Integrated Strategy and beyond. Impact is understood to mean the wider effects of the programs on farmers, input systems and overall food systems. The evaluation was to assess the changes or outcomes observed as a result of the programs and to what extent these changes or outcomes can be attributed to the programs. It also assesses any unintended impacts that resulted from the programs. It assesses the mechanisms that delivered the observed changes and the key features of these mechanisms. Lastly, it recommends how the evidence should be used to inform future AGRA investments.

22
EVALUATION OF AGRA AFRICA’S SEED SYSTEMS PROGRAM FINAL REPORT
The results of the evaluation will be used by AGRA to generate knowledge and learning that should inform future seeds systems work in AGRA as well as in governments, private sector and other players to help catalyze continental efforts for agricultural transformation. Findings will be shared broadly with focus countries for PASS and SSTP, AU-CAADP institutions, private sector agribusiness, non-government organizations, academic institutions among others. Findings will also be shared with funding partners such as Bill and Melinda Gates Foundation, Rockefeller Foundation, USAID and other key partners. The evaluation will also provide learning to inform implementation of AGRA’s strategy for 2017-2021.
Evaluation questions
The evaluation was expected to address the following questions:
Developing African plant breeders
To what extent have AGRA trained breeders been absorbed in country research systems and funded by governments to continue crop research? Has this resulted in improvement in functioning of National Research Stations?
Development of new improved crop technologies
To what extent have varieties produced by AGRA supported breeders been commercialized by
seed companies and up-taken by smallholder farmers? Private sector seed production
Did the approach of starting seed companies result in improved uptake of new improved
varieties and technologies? How many of the companies started by PASS are financially viable today (without subsidies
or donor support) and selling meaningful amounts of seed? Did the AGRA supported companies scale up production and operations and crowd out the
national, regional and international seed companies? What were the key features of scaling and how can this be replicated in future? To what extent have AGRA supported seed companies been successful in crops other than maize?
How can we adapt this model to other crops in future?
Agro-dealer development for technology distribution
Has the AGRA approach of agro-dealer development resulted in improved access and uptake of
improved inputs by farmers in target areas?
Are agro-dealers that were supported by AGRA still functional, financially viable and selling viable amounts of seed to smallholder farmers?
Scaling and adoption of technologies
To what extent did AGRA work increase the use of improved seeds and technologies by smallholder farmers at scale in the target countries, and how did this impact change of yield levels
in the respective countries?
Which improved seeds and technologies were developed by PASS and scaled up by SSTP? What
were the key enablers and/or barriers to scaling up efforts? Creating an enabling environment
What country level and regional policy and regulatory reforms did AGRA support/facilitate that increased production, delivery and uptake of improved seeds and technologies? What reforms still need to be supported in focus countries and regions to improve scaling up of seed production, delivery and uptake?
Program performance

23
EVALUATION OF AGRA AFRICA’S SEED SYSTEMS PROGRAM FINAL REPORT
To what extent did the PASS and SSTP achieve expected program outputs, outcomes and impacts at all levels? What were the positive and negative, direct and indirect, planned and unplanned results of the program;
Specifically, for SSTP, assess indicator progress towards achieving targets for the following indicators: o Poverty index - percent of people living on less than $1.25/day in the focus areas through the
analysis of LSMS data as defined in the SSTP Performance Indicator Reference Sheets (PIRS). This will be calculated from secondary sources e.g. LSMS and applied to target area.
o Gross margins per hectare of focus crops in the focus countries - an analysis of yield and Gross Margin trends over three years across the focus countries from the SSTP annual survey reports shall be conducted, complemented with results from the findings of mid-term evaluation and limited household surveys/Focus Group Discussions (FGDs) that may be
integrated in the final evaluation. o Farmers applying improved technologies and the resultant area under improved technologies
- technology application/use trends for three years across the focus countries from the SSTP
annual survey reports will be analyzed, complemented with findings from the mid-term
evaluation and limited household surveys/FGDs that may be integrated in the final evaluation, and;
o New private sector investment in agriculture in the focus countries over the
implementation period as a result of SSTP implementation. Cross-cutting question
What lessons can be learnt from the work of PASS and SSTP across the key questions outlined above that should inform AGRA’s new integrated approach?
The evaluation was also to examine how gender as a cross cutting theme was mainstreamed into the seed
systems work and how evidence from past work shall be used to inform future investments in seeds
systems.
2.3. Scope of the evaluation
The evaluation explored the extent to which AGRA seeds systems work through PASS and SSTP achieved stated goals, objectives and demonstrated impact. The evaluation focused on the work of AGRA seed systems from 2012 to 2017 for PASS and from 2013 to 2018 for SSTP. However, it also recognized that PASS has been under implementation since 2007 and therefore referenced the previous phase in order to attribute for the results that are reported.
The evaluation focused on the whole program and with site visits conducted and data collected in five key countries – Ghana, Uganda, Tanzania, Mali and Ethiopia. A statistically representative sample of PASS and SSTP grants/projects, seed companies and beneficiary smallholder farmers was selected and assessed through site visits across the focus countries. The major crops addressed included maize, cassava, rice, beans, Irish potatoes, cowpea (Table 2.1). The evaluation also considered program and implementation conditions in each country and the influence these may have had on program success.
Table 2.1 Focus PASS/SSTP countries and crops in the evaluation:
Evaluation focus
Focus countries Ethiopia*, Ghana*, Mali, Tanzania*, Uganda
Focus crops Maize, rice, beans, cassava, cowpea, Irish potato * SSTP countries.

24
EVALUATION OF AGRA AFRICA’S SEED SYSTEMS PROGRAM FINAL REPORT
2.4. Outline of the report
Section 3 discusses methods used during the evaluation. Sections 4-7 present findings on the different
sub-programs of PASS and SSTP: 4. Developing African Plant Breeders; 5. Development of New Improved
Crop Technologies; 6. Private Sector Seed Production; 7. Agro-dealer Development for Technology
Distribution. Section 8 assesses Program performance against expected program outputs, outcomes and
impacts, including direct and indirect results of the program. Section 9 examines AGRA activities on
Creating an Enabling Environment.

25
EVALUATION OF AGRA AFRICA’S SEED SYSTEMS PROGRAM FINAL REPORT
3. EVALUATION APPROACH AND METHODS
3.1. Approach
The evaluation aimed to measure and provide robust empirical evidence on the success and impact of the AGRA’s second phase of PASS and SSTP programs specifically assessing the wider effects of the programs on plant breeders, farmers, input systems and policy and regulatory reforms. It assesses and documents the overall difference that AGRA seed systems work has made, how effective it was against set outcomes, whether outcomes of the systems work are sustainable and lessons that can be learnt for future programming. Evaluation objectives and the overall evaluation approach are shown in Table 3.1.
Table 3.1 Study objectives and approach
Study objective Approach
To measure and provide robust empirical evidence on the success and impact of the AGRA seeds systems in developing and scaling up seed systems in Africa that should inform future investments in seed systems in the 2017-2021 AGRA Integrated Strategy and beyond.
Review the AGRA’s seed system’s vision of success and results framework targets and use this as a basis for assessing the extent to which these were attained.
Assess the intended and unintended benefits that arose from the seed systems development efforts.
Assess the wider effects of PASS and SSTP on farmers, input systems and overall agricultural systems.
Quasi-experimental approach to assess impact of the seeds systems initiatives: identifying program participants and non-participants and comparing their status for the outcome indicators.
Assess the changes or outcomes observed as a result of the programs and to what extent these changes or outcomes can be attributed to the programs
Participatory ranking with key stakeholders focusing on the PASS and SSTP outcome results. We also assess the role of other players in the seeds sector.
Assess mechanisms that delivered the observed changes and the key features of these mechanisms
Theory of change analysis to link outputs to outcomes while recognizing the multiple, non-linear events looking at the logical links between interventions and behavioral changes.
Generate knowledge and learning that should inform future seeds systems work in AGRA as well as in governments, private sector and other players to help catalyze continental efforts for agricultural transformation.
Lessons learned and best practices are used to inform recommendations for consideration for future seed systems investments.
3.2. Study design
The study design is based on the evaluation questions proposed in the ToR. Using the impact matrix, and
after discussions with the AGRA team, the evaluation questions were refined (Appendix 2).
The evaluation has is its reference frame the OECD evaluation criteria – relevance, effectiveness,
efficiency, impact and sustainability (Table 3.2).

26
EVALUATION OF AGRA AFRICA’S SEED SYSTEMS PROGRAM FINAL REPORT
Table 3.2 OECD evaluation criteria
Relevance: The extent to which the stated objectives and programme components of the second phase of PASS and of SSTP correctly address the identified problems and real needs of its target groups.
Effectiveness: What difference the programmes made in practice, as measured by the extent to which the intended beneficiaries really benefitted from the products or services it made available.
Efficiency: The extent to which the various activities have transformed the available resources (inputs) into the intended results (outputs) in terms of quantity, quality and timeliness (value for money).
Impact: The longer-term positive and negative economic, social and environmental changes produced by the supported activities, directly or indirectly, intended or unintended, as well as an understanding the impact pathways.
Sustainability: The likelihood of continued, long-term benefits from PASS and SSTP after donor funding has been withdrawn.
3.3. Indicator analysis framework The Indicator Analysis Framework captures key indicators and identifies the most cost-effective source of data, analytical methods to produce the indicator values, and the most appropriate way to interpret the values generated for each indicator (Table 3.3). PASS and SSTP objectives at their different levels (outcomes and impacts) will provide the basis of analysis.
Table 3.3 Key indicators and sources of data
Indicator Source of Data Data collection instruments
Percent of people living on less than
$1.25 a day
LSMS/UNDP Human
development report
Data extraction matrices
Documentary Review
Gross margins per hectare of maize, rice,
beans
Farmers/PASS&SSTP annual
survey reports, Baseline survey
Evaluation HH Survey
Data extraction matrices
Documentary Review
Structured interview
Number of farmers applying improved
technologies
Farmers/PASS&SSTP annual
survey reports, Baseline survey
Evaluation HH Survey
Data extraction matrices
Documentary Review
Structured interview
New private sector investment in
agriculture as a result of SSTP
interventions
SSTP reports/Private sector
verification, Evaluation SSTP KII:
Seed Companies
Data extraction matrices
Documentary Review
Semi-structured interviews
Number of new crop varieties adapted to
local farmer conditions
National Crop Research Institute
Private Seed houses
PASS Database
Evaluation KII: Researchers
Data extraction matrices
Topic list semi structured
interviews
Annual volume of seed produced by
AGRA- supported seed companies
PASS/SSTP Database
Evaluation KII: Seed cos
Structured interviews

27
EVALUATION OF AGRA AFRICA’S SEED SYSTEMS PROGRAM FINAL REPORT
3.4. Evaluation methodology
The evaluation used a mixed methods approach combining qualitative and quantitative data to provide insights into the changes brought about by AGRA’s seeds systems programs. The evaluation collected data from a wide range of stakeholders including smallholder farmers that benefitted directly or indirectly, seed companies, breeders, universities, national research stations, agro-dealers and policymakers to identify the changes that have occurred.
Methods used by the evaluation team for data collection:
Secondary data collection from program documents and official sources including national statistics, and literature reviews on seeds systems to inform how they respond to evaluation
questions and measure changes. Key informant interviews to collect qualitative information using structured and semi-structured
interviews on key evaluation questions to complement quantitative analysis.
Farm household sample surveys across different categories of farmers to assess changes occurring as a result of the programs.
Focus group discussions and interviews to collect information from agro-dealers to understand
activities and outreach. E-survey with PASS graduates to collect quantitative data on outcomes in research capacity as a
result of programmes.
Data gathering approaches were based on proven tools and standardized methods to ensure adequate treatment of qualitative and quantitative data. The sampling strategy allowed AGRA to establish changes in indicators with a high degree of confidence. After consultation with AGRA and examination of existing M&E data available for analysis, an appropriate and statistically representative sample of beneficiaries was selected, as well as focus crops based on selection criteria agreed with AGRA.
The evaluation used various methods to analyze the data collected from different sources with triangulation of data to improve validity of results. The evaluation developed a data quality assurance mechanism to ensure results can be clearly interpreted. In addition, the team secured informed consent from stakeholders and implemented rigorous data systems to safeguard personal data.
3.5. Secondary data collection Secondary data was collected from program and policy documents, national statistics and seed systems literature (Appendix: Bibliography). Key sources included: sector policies, strategies, AGRA progress reports, PASS M&E reports baseline studies, earlier evaluations including the SSTP mid-term evaluation, the PASS phase I evaluation. Document and dataset review against a structured checklist was used to analyze key documents and secondary data for information on the indicators. Document review checklists ensured comprehensive coverage of the indicator information being sought. Information from secondary data sources was used to inform our evaluation design and to triangulate information collected from different sources. Data extraction matrices facilitated the extraction of indicator information from monitoring systems and MIS databases including indicators from government, development partners’ and other databases.

28
EVALUATION OF AGRA AFRICA’S SEED SYSTEMS PROGRAM FINAL REPORT
3.6. Primary data collection The main forms of primary data collection were key informant interviews, focus group discussions and sample surveys of households and agrodealers. Key informant interviews. Key informants interviewed included: PASS/SSTP grantees, university personnel, breeders, seed company owners/managers, agro-dealers, farmer group leaders, community leaders, government officials, policy makers and value chain players. Checklists were developed prior to interviews to ensure systematic coverage of questions and issues by the study team. These were developed around the evaluation questions and indicators, grouped and targeted according to the category of organizations or individuals being interviewed. These were semi-structured allowing interviewers to explore unforeseen avenues of enquiry. The key informant interviews were designed to elicit detailed information on program impacts and processes. Purposive sampling has been employed to ensure effective and efficient coverage of key Informants by country, region and type of stakeholder. A minimum target of 50 percent of SSTP/PASS funded seed companies and breeders will be sampled in the 5 countries visited. EACI funded institutions in each of the countries will be interviewed. Household survey. Structured interviews with farmer households were conducted to collect primary data for key outcome level indicators and to assess gross margins of key commodities. Both intervention and control households were interviewed and differences assessed. We used multi-stage stratified sampling. The first stage was to first identify AGRA/SSTP target districts/ counties/woredas for seed dissemination by seed companies and other agents e.g. agrodealers, We then used agroecological/geographical clustering to maximise resource efficiency: 2 regions per country and 2 districts/subcounty/woreda per region. Subcounties/wards/parishes within the target area were then selected at random. Areas with matching agroecological and socioeconomic profiles were identified where AGRA-supported seed companies and agrodealers are not operating, to act as a control. Farm households were then selected randomly within each of the target areas. The sample size able to detect an effect of AGRA interventions of certain minimum size was estimated
using the formula: 𝑛 =(𝑡𝛼/2+𝑡1−𝛽)
2𝜎𝑦2
𝑀𝐸𝑆2𝑃(1−𝑃). The required sample size depends upon the significance level (𝛼),
the chosen level of power (𝛽), the standard error of the outcome variable (𝜎𝑦2), the proportion of the
sample in the treatment group (P) and the minimum effect size (MES). Assuming that the MES is a third of the standard error of the outcome variable, for a balanced sample (P=0.5), significance level of 95% and power level of 80%, our required sample size would be 263. Thus, having a total sample size of 400 households per country allow us to detect an effect on each outcome variable of at least a third of the size of its standard deviation. The total actual sample was 2222 households: 1230 intervention and 992 control, which exceeded the target by 11 percent (Table 3.4).
Table 3.4 Sample frame for farm household survey
Household type
Country
Ethiopia Ghana Mali Tanzania Uganda Total PASS/SSTP intervention households
214 236 299 231 250 1230
Control households
188 243 195 216 150 992
Total households
400 479 494 447 400 2222

29
EVALUATION OF AGRA AFRICA’S SEED SYSTEMS PROGRAM FINAL REPORT
Sources of information for the sample frame for the smallholder farmer, seed company and agro-dealer target populations are shown in Table 3.5
Table 3.5 Sources of information for the sampling frame
Target Type of information Use Source of information
Smallholder farmers
Definition of smallholder farmer Staple food crops grown in high potential regions Key variable driving farmer household food security, income, poverty rates
Determining sample sizes
National surveys e.g. food security surveys, Demographic Health Surveys, Multiple Indicator Cluster Surveys, LSMS
Agro-ecological maps Population densities of smallholder farmers by agro-ecological region Population of small holder famers per agro-ecological region
Determining Survey area
Ministry of Agriculture, farmer associations
Seed companies
Seed companies and their distribution
Determining sample sizes Survey area
Seed associations, PASS records
Agro-dealers Population of agro-dealers and their distribution AGRA Agro-dealer Development Programme geographic implementation areas
Determining sample sizes Determining Survey area
Country Partners of the AGRA Agro-dealer Development Sub-program and agro-dealer networks (Agro- Dealers Association)
PASS graduates
MSc and PhD graduates on PASS-sponsored programs
Determining Survey population
PASS list of EACI graduates
3.7. Data analysis Tools to analyze both quantitative and qualitative information included:
Policy timeline – to record and present key events in the evolution and implementation of a policy. Appreciative enquiry – to explore successes in dialogue with individuals and groups of people to strengthen understanding of why something works well, and how success might be replicated. Data descriptive analysis and analysis of difference - to show current status of key indicators, derive trends, and define causal relationships. The descriptive analysis included computation of means, medians and variances of the key indicators for all households. Statistical tests including t-test and Chi-squared tests were used to compare means of intervention and non-intervention households. Analysis was carried out using SPSS and STATA.
3.8. Quality assurance Our data quality assurance process involved:
Use of experienced enumerators who are conversant with the specific countries and contexts.
Standardization of interpretation of the interview questions by both team leaders and enumerators through translation of instruments into the local languages.
Team leaders and the field supervisors review all questionnaires and focus group discussion reports

30
EVALUATION OF AGRA AFRICA’S SEED SYSTEMS PROGRAM FINAL REPORT
A feedback session after the pre-test to address errors and inconsistencies in the data collection instruments.
A supervisor/team leader in each country to oversee the process and quality of data collection.
All questionnaires were reviewed in the field to ensure consistency and identify potential errors.
Data analysis and interpretation following a logical flow and plan: coding, entering, and cleaning; analysing; interpreting and reflecting.
Training enumerators: Data was collected by experienced enumerators and supervisors in each country. In most cases these were teams we have worked with on previous surveys. The recruited field staff in each country underwent a centralized training including: classroom training on the instruments, mock interviews, role plays, practice and refinement of tools. Pilot testing of the data collection tool was undertaken with farmers in a selected area near the training venue. The tools will be checked for consistency before data collection. Confidentiality: Prior Informed Consent to partcipate in the survey was sought from all farmer respondents (verbal) and their response recorded on the questionnaires. Protection of the confidentality of respondents during the exercise was emphasized during the training of enumerators so that they assure respondents at the start of any discussion. All questionnaires and data are stored securely with non-identifable indicators. Data entry Quantitative data from the survey was coded, entered, cleaned and analyzed using the Statistical Package for Social Sciences (SPSS). Qualitative data from key informant interviews and focus group discussions was be transcribed, manually coded and thematically analyzed. Data from document reviews was summarized to supplement results from qualitative and quantitative data. Descriptive statistics (frequencies, percentages and means) were used for data analysis together with statistical tests (t-tests and chi-squared) for difference between AGRA intervention and control populations.

31
EVALUATION OF AGRA AFRICA’S SEED SYSTEMS PROGRAM FINAL REPORT
4. Developing African Plant Breeders
Evaluation questions: To what extent have AGRA trained breeders been absorbed in country research
systems and funded by governments to continue crop research? Did the sub-program create a new
generation of competent crop breeders in Africa? Did the sub-program revive university curricula in the
critical field of plant breeding?
4.1 Program rationale The Education for African Crop Improvement (EACI) sub-program sought to address the problem of lack
of plant breeders by providing training to crop breeders and agricultural scientists. The rationale was to
train a generation of researchers who would generate new improved crop varieties, a pre-requisite for a
functioning seed system. These breeders and scientists were expected to contribute to improvement of
crop productivity through the development of new and locally adapted crop varieties. EACI therefore
funded three areas of activities:
Providing PhD and MSc fellowships to African agricultural scientists.
Strengthening of African university curricula and facilities.
In-service training for breeders, other crop scientists and technicians in research institutions.
PhD fellowships started in 2002 with the Rockefeller Foundation establishing the African Centre for Crop
Improvement (ACCI) at the University of KwaZulu Natal (UKZN), South Africa to train African plant
breeders to PhD level. The first phase, up to 2007, was funded by a grant from Rockefeller and a second
phase for another five years by AGRA. The West African Centre for Crop Improvement (WACCI) at the
University of Ghana at Legon was established in 2007 to cater for students from West and Central Africa.
With regards to MSc fellowships, the courses were offered at 13 African Universities including Ahmadu
Bello University, Bunda College, Eduardo Mondlane University, Haramaya University, Ibadan University,
Kwame Nkrumah University of Science and Technology (KNUST), Makerere University, Moi University,
Sokoine University, University of Ougadougou and University of Zambia.
4.2 Methodology In evaluating the EACI sub-program, the evaluation studied the AGRA seed systems from 2007 to capture
the work of the PASS program. An electronic survey was used to collect data from breeders who graduated
under the program and institutions that participated in the training. The AGRA data base (EACI: PASS PhD
& MSc. Students Supported; 2007 - May 2018) was used to develop a sampling frame. A questionnaire
was emailed to 349 PhD and MSc graduates (90 PhD and 259 MSc) with follow-up reminders. Seventy-
one responses were received (38 PhD and 33 MSc). This represents a response rate of 42% for PhDs which
is very respectable for an e-survey; the response rate for MSc was 13%.
Another questionnaire was sent to 2 coordinators for the PhD program and 11 coordinators for MSc
program at the universities that participated in the training. These included ACCI and WACCI for PhD
training and Ahmadu Bello University, Bunda College, Eduardo Mondlane University, Haramaya
University, Ibadan University, Kwame Nkrumah University of Science and Technology (KNUST), Makerere
University, Moi University, Sokoine University, University of Ougadougou and University of Zambia for
MSc training. Out of the 13 university, only KNUST responded to the questionnaire. Visits were also made
to training institutions in 6 PASS countries.

32
EVALUATION OF AGRA AFRICA’S SEED SYSTEMS PROGRAM FINAL REPORT
4.3 EACI sub-program outputs Table 4.1 summarises the main outputs of the EACI subprogram: PhD and MSc graduates and their
published research. Over a period of 10 years the program has enrolled 160 PhD candidates, a 100%
achievement against target. Of the PhD candidates, 139 have graduated. This represents a strong
performance and a significant contribution to crop development capacity in AGRA countries.
Table 4.1 EACI outputs, targets and achievements 2007-2018
Outputs Targets LOA LOA met against 10-year target 2007 PASS Business Plan 2009 PASS M&E plan
10-year 5-year 5 – year 5-year 10-year
PhD Programs 2 2 2 2 2 100%
MSc Programs 10 10 9 9 13 130%
PhDs 80 80 enrolled 8 graduated 72 enrolled
graduated 78 enrolled
160 100%
MScs 170 170 graduated 136 graduated 34 in progress
graduated 175 enrolled
341 100%
Research technicians
- - 64 152 -
Number of publications
- - 64 19 published 3 accepted
200+ 200%+
Sources: Compiled from PASS Business Plan, 2007; PASS M&E Plan, 2009; AGRA grant memos and AGRA Grant
Narrative Reports 2007-12; PASS Close out Report, 2017
Thirty-one percent of PhD graduates are females. The majority of women were from Kenya, Ethiopia,
Nigeria, Ghana and Cameroon which had a larger pool of female MSc graduates at the beginning of the
program. Initially the low numbers of women graduating from MSc programmes resulted in a lack of
eligible candidates for PhD. The program has made commendable efforts to recruit and support women
and this has resulted in an increased proportion on PhD programmes from 20% in 2006 (ACCI) to 31% by
2017.
The PhD students came from 17 countries, the largest number being from Kenya (22) followed by Uganda
(18), and Ethiopia (16). The end of Phase I Evaluation report noticed some imbalances across the
countries. The program has made efforts to address these imbalances, with no AGRA-supported country
seeing less than 6 breeders trained to PhD level.
All the PhD candidates studied plant breeding, covering 16 crops between them (Table 4.2). Most of the
focus has been on food security crops - cereals, including maize (36), sorghum (20), rice (18), followed by
cowpea, cassava and sweet potato. For most legumes, as well as wheat, millet and teff, there have been
5 or less PhD students supported. Thus, although the program is promoting orphan crops such as legumes,
the number of supported PhD students specialising in a particular crop remains low across AGRA
countries.

33
EVALUATION OF AGRA AFRICA’S SEED SYSTEMS PROGRAM FINAL REPORT
Table 4.2 Crop focus by PhD students
Crop No. Percent Crop No. Percent
Maize 36 23 Wheat 5 3
Sorghum 20 13 Pearl millet 5 3
Rice 18 12 Pigeon pea 4 3
Cowpea 15 10 Irish potato 3 2
Cassava 14 9 Soybean 2 1
Sweet potato 12 8 Tef 2 1
Groundnuts 8 5 Banana 1 1
Bean (P.vulgaris.) 8 5 Faba bean 1 1
Source: AGRA archives - EACI: PASS Students Supported; 2007 - May 2018
On the MSc programs, a total of 341 students enrolled. Forty percent of students are female. The students
came from 18 countries: Ethiopia had the highest number (40), followed by Ghana (33). Other nationalities
had a relatively equitable share of support, given populations and initial breeding capacity. There have
been some challenges in recruiting students from francophone countries: the program has provided
support for English refresher courses, which has helped address the problem. The program was successful
in recruiting female students from all countries. Most MSc students studied plant breeding (78%) followed
by seed science (15%) and agronomy (7%). Of the students enrolled, 211 (62%) have graduated, while 107
are continuing with their studies and 3 have dropped out. AGRA has therefore built significant capacity of
breeders to MSc level in participating countries.
4.4 EACI Impacts: improving the functionality of national research systems
A key evaluation question was whether PASS has left a mark in the national agricultural research
institutions (NARI). To determine this impact, information was sought on past and current breeders in
NARI. This information is not held centrally by most NARIs so data was derived from various primary and
secondary sources: PASS Baseline data (2006) and ASTI/IFPRI data for 2016 (and 2014), the latest
available. FAO is currently undertaking a plant breeding and related biotechnology capacity (PBBC)
assessment which will provide a foundation for designing comprehensive strategies by national
governments, the research and development community, and donors. This survey is concluded in several
countries and is still ongoing for many others, and will be an important resource once available.
Table 4.3 shows numbers of MSc and PhD trained plant breeders (2006 and 2016, 2014); breeders
supported by AGRA (2007-2017); and percent of AGRA-supported breeders in national breeders (2016)
for selected PASS countries. The national breeder data needs to be treated with caution as data collection
methods and coverage varied between the two sets (researchers in academic institutions and parastatals
were excluded in some ASTI study countries). For countries where 2016 data is available, the number of
AGRA-supported breeders as percentage of 2016 total national breeders has been estimated. This ranges
from around one-third in Burkina Faso and Kenya; to half in Ethiopia, Nigeria and Tanzania; to 70 percent
in Rwanda and up to 90% in Mozambique and Uganda. This indicates the very significant contribution by
PASS to building capacity of researchers in AGRA-supported countries. It is supported by testimonies from
interviewed breeders and researchers, confirming the importance of AGRA’s capacity building
intervention to crop improvement in Africa.

34
EVALUATION OF AGRA AFRICA’S SEED SYSTEMS PROGRAM FINAL REPORT
Table 4.3 Number of MSc and PhD trained plant breeders (2006 and 2016, 2014); breeders supported by AGRA (2007-2017); and percent of AGRA-supported breeders against total breeders (2016)
Total national breeders 2006a
Total national breeders 2016; 2014b
Breeders supported by AGRA (2007-2017)c
AGRA-supported breeders as % of 2016 total
MSc PhD MSc PhD MSc PhD PhD
Burkina Faso 6 12 15 21 17 7 33%
Ethiopia 144 52 137 34 40 16 47%
Ghana 25 12 34 22 33 13 59%
Kenya 30 53 73 59 21 22 37%
Malawi 15 3 na na 21 8 na
Mozambique 9 2 23 7 25 6 86%
Nigeria 14 25 42 28 26 14 50%
Rwanda - 15 9 10 15 7 70%
Tanzania 18 14 73 26 23 13 50%
Uganda 10 9 24 20 28 18 90% Sources: a PASS Country studies (2006); b ASTI/IFPRI (2016) (2014); c PASS Database
The PASS II Final Narrative Report (2017) shows a total of 259 MSc and PhD graduates trained through
PASS fellowships are working as full-time breeders with agricultural research organisations. This is
confirmed by the Evaluation e-survey which found the majority (68%) of the 71 graduates surveyed (38
PhD and 33 MSc) are currently employed in national agricultural research institutes (NARI) (Figure 4.1). A
further 21% (15) graduates are carrying out breeding work in international research organisations (CGIAR),
parastatals, higher education, NGOs and seed companies. An overwhelming 96% of AGRA-supported
graduates are working in agriculture-related fields in African institutions, the majority in breeding.
Figure 4.1 Current employment of surveyed EACI graduates
Source: Evaluation e-survey, 2018
0%
10%
20%
30%
40%
50%
60%
70%
80%
NARI CGIAR Higher education Other seed Other agriculture Non-agriculture
Male Female

35
EVALUATION OF AGRA AFRICA’S SEED SYSTEMS PROGRAM FINAL REPORT
In Ghana, for instance, all breeders trained by AGRA have been absorbed into the key research institutes
(Crops Research Institute-CRI and Savannah Agricultural Research Institute-SARI). Key informant
interviews with senior breeders in these institutes indicate that in a recent recruitment round (2019) for
breeders, NARIs in Ghana recruited AGRA-sponsored PhD students who were about to complete their
programs. The fact that NARIs had employed all trained breeders and had to resort to recruiting yet-to-
complete AGRA-supported PhD students into the national research system indicates that breeders remain
in short supply and that AGRA training at both PhD and MSc levels is significantly resourcing the national
research institutes.
4.5 EACI impacts: improving capacity of AGRA-trained breeders to produce, release,
commercialise varieties The continued flow of improved crop varieties depends on the ability of trained breeders to continue their
breeding work. The e-survey of graduates was used to assess the progress of new graduates in developing,
releasing and commercializing crop varieties. Table 4.4 shows that 14 PhD (37%) and 1 MSc graduate pf
those surveyed have successfully developed new varieties (MSc graduates would not normally be
expected to release varieties without further breeding training). These graduates have developed 93
varieties between them, of which 88 have been released with 38 varieties commercialized.
Table 4.4. Number of crop varieties developed, released and commercialized by surveyed graduates
PhD graduates (n=38)
MSc graduates (n=33)
Total (n=71)
Number of AGRA-supported graduates who have developed new crop varieties
14 1 13
No. varieties developed 79 14 93
No. varieties released 74 14 88
No. varieties commercialized 38 14 52
Source: E-survey, 2018
The e-survey shows that most of the focus has been on cereals including maize (23%), sorghum (14%),
rice (12%) followed by cowpea, cassava and sweet potato. Other legumes, plus wheat, millet and teff have
received 5% or less each.
Several PhD graduates received grants from AGRA to continue with their breeding work following the end
of the PhD Program. However, access to resources to maintain research activities is a challenge.
The main reason cited AGRA-supported graduates for being unable to continue and complete breeding
work post-PhD is their inability to attract funding (Table 4.5). Out of the 34 PhD graduates who responded
only 6 received FIAAC grants from AGRA, and another 6 were involved in grants from other organizations
including: USAID (5), Borlaug LEAP Foundation (2), World Bank (2), BMGF (3) and the African Union
Commission. No respondents mentioned funding from government alone or the private sector. This
indicates that governments are allocating few resources to funding crop development. Seed companies
are also unable or willing to fund breeding work, particularly for crops such as legumes, cassava, sweet
potato, because of the small market size of so-called orphan crops. The survey results indicate that access
to grants from AGRA or government or other organizations remains a limiting factor in improving breeding
work and flow of improved crop varieties in the seed system. A recommendation from breeders was that
they should be trained in proposal writing so that they can successfully apply for funding (See Chapter 5
for a detailed discussion of breeding accomplishments and challenges).

36
EVALUATION OF AGRA AFRICA’S SEED SYSTEMS PROGRAM FINAL REPORT
Table 4.5. Challenges faced by breeders
Challenge Frequency Percent
Lack of funding 40 56 Lack of facilities 8 11 Limited capacity / knowledge 9 12 Other challenges 8 11 Lack of well-developed seed system 6 8
Source: e-survey, 2018
Lack of funding is affecting development of crop varieties as breeders fail to evaluate materials across
their countries to generate the needed data for the release committee to certify the new breeding lines
for release to farmers. Developing crop varieties is also affected by lack of facilities such as irrigation
systems, vehicles, cold room to store germplasm, glass houses which are important in advancing
segregating generations. Also limited are laboratory facilities for molecular screening, plant pathology,
plant entomology and for plant physiology. Some breeders point out they have limited capacity to
implement molecular breeding, which is an increasingly important breeding tool. In some countries there
is lack of well-trained field and laboratory support staff in the field of genetic improvement to assist in
breeding work.
Variety release is affected by lack of funds for entering material (including hybrids) into National
Performance Trials (NPT). The costs for NPT and Distinctiveness, Uniformity and Stability (DUS) testing are
quite high in many countries and this could slow variety entry by researchers for testing. For example, in
Kenya, DUS testing costs US$600 and NPT US$1200; in Tanzania DUS is US$300 and NPT US$1000; in Mali
the NPT also is over $1800; whilst in Uganda costs for both tests are about $500. The evaluation team met
breeders who were not able to access funds from their research organisation or projects and were trying
to raise funds through private resources.
A further challenge in some countries (e.g. Mozambique) is the failure of Variety Release Committees to
sit and assess submissions from breeders, which can delay the release process by months or even years.
Although variety release duration is being harmonized within the respective regional economic blocs, in
countries such as Ghana, Mail and Ethiopia this still takes more than 2 years. This affects variety release
across AGRA countries.
Breeders also face the challenge of maintaining and bulking breeder seed as they do not have facilities for
cold storage of funds for maintaining breeding plots.
Commercialization of crop varieties is limited given low adoption of improved varieties by the farmers.
Funds are limited for promotion and commercialization of the varieties. In some countries there is lack of
well-developed seed systems to create awareness and publicity for new varieties and at the same time
ensure that newly developed varieties are made accessible to the farmers. There are also restrictive
statutory, legal and regulatory issues in the variety release and commercialization processes (Section 9).
Some breeders are failing to commercialize because they are struggling to combine breeding work with
product development. This situation makes variety profiling for the specific market niches difficult
resulting into low adoption by farmers and other users such as processors.
4.6 EACI impact: reviving university curriculum and infrastructure The universities that participated in MSc and PhD training programs received support from PASS to
improve curricula, scholarships to students, and research support such as laboratory refurbishment,

37
EVALUATION OF AGRA AFRICA’S SEED SYSTEMS PROGRAM FINAL REPORT
screenhouses, computers, printers, office chairs, wireless internet. The support fitted very well with the
national capacity building agenda for skilled manpower. Where programmes were already running, AGRA
support was provided to the existing training programs. The support helped to improve existing curricula
with introduction of key courses and breeding pipeline activities and internship in the seed industry.
PASS support has enhanced research collaboration with National Agricultural Research Institutions,
whereby National Plant Breeders have co-supervised student projects. Where universities have lacked
capacity in specific courses, such as Quantitative Methods and Genetics, it has supported links with
international universities, including Iowa State University, and regionally, such as with the University of
Ibadan. The support has further helped universities to link with AGRA-supported seed companies and
national plant breeders for student internships.
Publications
Publications are key outputs from the research process. EACI graduates have published over 200 papers
since the start of the program: this represents over 200% above target.
The evaluators found strong interest in publishing among AGRA-funded training institutions,
demonstrating the importance that graduates and their advisors as well as AGRA place on communicating
findings with others.
Out of 66 respondents to the e-survey, 37 (28 PhD and 9 MSc holders) indicated that they have published
123 papers in refereed journals. The number of papers ranged from 1 to 9 papers per individual. A few
are still in preparation. The high number of publications is a good indicator of the robustness of the
capacity built through the EACI training.
4.7 Sustainability of EACI
Sustainability is viewed here in terms of: 1) capacity of universities to continue with training; 2)
maintaining the input of new breeders into national research institutions to continue the flow of new,
improved varieties in the seed system, thereby offering small farmers in Africa reliable access to improved
crop varieties. This form of sustainability depends on several factors including: the linkages the
universities have with other public and private and institutions; how the program has supported existing
programs undertaken by the universities; the improvements that have been made to the universities and
the programs; and how the training programs have been internalised or now being supported.
Sustainability also depends on capacity to address challenges and leveraging on the support provided.
Support for training institutions. EACI aimed to strengthen curricula and facilities for the participating African universities. In most cases this was support for existing programs. AGRA provided support for upgrading teaching facilities such as laboratories and internet, as well as providing direct support to students. All the programs are continuing to run some 6 years after the ending of AGRA support, with students enrolling for the programs securing funding from other donors and government: however, this is at reduced levels.
Linkages with other institutions. To build the capacity to offer PhD and MSc training, universities have
established regional and international linkages and contacts that contribute to teaching, research and
funding. For example, WACCI has partnered with organizations including the World Bank, German
Academic Exchange Service (DAAD), Borlaug Higher Education for Agricultural Research and
Development (BHEARD) Program, West Africa Agricultural Productivity Program (WAAPP) Senegal,

38
EVALUATION OF AGRA AFRICA’S SEED SYSTEMS PROGRAM FINAL REPORT
Cornell University, Syngenta Seeds BV and USAID to provide scholarships and funding for the students
not covered under the AGRA grant. The Centre has raised over $27 million over the 10-year period to
support student training and research and practical breeding programs. Other partnerships in kind
include IITA for students’ research placement and supervision. In Uganda, the World Bank provided a
grant to Makerere University to train plant breeders at PhD from East and Central African countries.
AGRA has supported and, in some cases, facilitated these linkages which are a significant step towards
making the training programmes sustainable.
4.8 Conclusions and recommendations on developing African Plant Breeders
Human capacity building in agriculture in Africa has been a preoccupation of governments and donors
(FAO, USAID, CIDA, World Bank, Rockefeller Foundation and others) for over twenty-five years. This
strategy has shown success but – apart from Rockefeller Foundation – they did not have a crop breeding
focus. AGRA has posted an impressive performance in training of crop breeders in Africa target countries
within a short timespan resulting in a quick build-up of a world class population of breeders. This is
evidenced by the varieties released in the staple food crops and quality of publications in international
journals. It is evident that without this very timely and critical AGRA input, breeding programmes in the
target countries would be further behind. The focus now needs to be on sustainability.
The AGRA education model, with fellowships to train African scientists and support to African
universities to strengthen curricula and facilities, has been successful. With 160 PhDs and 341
MScs, this is a significant contribution to the pool of national breeders on whom the seed system
depends. Building 2 PhD programs within the region is a considerable achievement; together with
support for 13 national MSc programs. Whilst other development organisations such as
Rockefeller Foundation have provided important contributions, AGRA have been the leading
supporter of capacity building of breeders in Africa. However, there is a continuing need to train
new breeders to build national capacity and replace retiring staff.
We recommend support for universities through different funding models, including
involvement of AU/NEPAD and partnerships with African governments.
The focus of the trainee breeders’ research has been staple crops: maize, rice, and beans. A
handful of breeders have been trained in orphan crops: millet, pigeonpea, round potato,
vegetables. There remains a major shortage of varieties and breeders for these crops which are
important for food and nutrition security.
It is recommended that increased priority is given to funding of orphan crops breeding through
alternative funding sources such as government, regional economic blocs.
Increasing breeders’ capacity to write bankable research proposals is key to resource
mobilisation.
It is recommended that breeders are trained in in resource mobilisation including research
concept notes and proposals for funding to development partners and regional and continental
economic blocs

39
EVALUATION OF AGRA AFRICA’S SEED SYSTEMS PROGRAM FINAL REPORT
What model of training breeders should AGRA adopt for sustainability? Training of breeders needs to be sustained to cope with agricultural growth and succession. Given the level of government funding to the public research facilities, the momentum created by AGRA may not be sustained. This makes the issue of sustainability of the training program critical. Options to consider:
Triple helix of universities-governments-industry linkages. This model can work sustainably if it is ingrained in a formal legal/policy framework that compels governments to commit to training a number of breeders per year, sourcing some of the funding from development partners if necessary. The existing continental scientific platform to operationalize this is AU/NEPAD. For this to be formalized through AU/NEPAD, high level policy advocacy is critical. To drive the process there will be need for a consortium of development partners to work together in the advocacy agenda. AGRA can play a key role in driving this consortium, for example through AGRF. The private sector will participate in this space of training breeders if they see that not doing so harm their commercial interests. However, evidence that the genetics being produced by the breeders is critical for business may be difficult to demonstrate. This makes the private sector the weak link in the model.
Development of an integrated capacity building approach, which combines long-term training (MSc and PhD), short term training, experience-sharing through visits and scientist exchange programmes. An example is the national maize and wheat breeding programs in Ethiopia that are co-creations of EIAR and CIMMYT. Most Ethiopian breeders and technicians are CIMMYT trained either in-country or outside (Mexico). This creates a forum for CIMMYT breeders to work closely with Ethiopian breeders, and some are stationed in Ethiopia. This model has worked well in Ethiopia and could be replicated and scaled elsewhere. For this integrated intervention to be sustainable there should be a policy mechanism to incentivise government to co-finance the process.

40
EVALUATION OF AGRA AFRICA’S SEED SYSTEMS PROGRAM FINAL REPORT
5 Development of New Improved Crop Technologies
Evaluation Questions: Have AGRA trained breeders been absorbed and funded within national research
systems - and has this resulted in improved functioning of the National Agricultural Research System?
To what extent have varieties produced by AGRA-supported breeders been commercialized by seed
companies?
5.1 Background
The Fund for the Improvement and Adoption of African Crops (FIAAC) is the second sub-program in the PASS value chain. It aimed to: support crop breeding teams to develop and release improved crop varieties; increase farmer awareness and demand for the varieties through participatory breeding; and to link breeders to seed producers to improve supply of improved seed. The overall focus has been on key food crops. Specific crops vary from country to country according to national priorities and gaps.
FIAAC was conceived in the context of declining funding to public agricultural research – particularly plant
breeding – with few new varieties being released over a long period. Table 5.1 shows the number of
varieties released in SSA by decade, pre-1970 to 2010/11 (ISPC 2014). This shows that releases have been
almost doubling each decade. The CGIAR centres funded by Rockefeller Foundation and other
development partners have made a major contribution to these releases. AGRA contributions started in
the last decade shown (2000s). The highest number of releases were for staples: maize (935) and rice
(428) followed by wheat, bean, cassava, soybean, cowpea, sorghum, groundnut, pearl millet and potato
(Table 5.2). The lowest releases were of banana, lentils and other legumes.
Table 5.1. Frequency of cultivar release by decade in SSA
Crop
Released varieties and hybrids by decade
Pre-1970 1970s 1980s 1990s 2000s
Banana 0 0 0 0 6 Barley 0 3 3 4 31 Bean 1 6 22 73 130
Cassava 0 2 31 61 113 Chickpea 0 3 2 9 12 Cowpea 3 8 49 65 32
Faba bean 0 3 2 8 15 Field pea 0 2 2 10 12 Groundnut 20 21 25 21 48
Lentil 7 0 4 5 5 Maize–E/S Africa 7 10 34 159 455
Maize–W/C Africa 12 25 75 76 82
Pearl millet 1 7 46 28 38 Pigeonpea 0 0 3 2 12
Potato 37 18 29 24 43 Rice 27 53 133 138 77 Sorghum 2 25 36 63 54
Soybean 2 13 32 52 57 Sweet potato 0 0 9 20 60 Wheat 20 43 43 40 97
Yam 0 0 0 5 30
Total 98 244 580 863 1409
Source: Calculated from ISPC (2014)

41
EVALUATION OF AGRA AFRICA’S SEED SYSTEMS PROGRAM FINAL REPORT
5.2 FIAAC Breeding achievements
Table 5.2 summarises the main targets and achievements of the FIAAC subprogram: grants
awarded/projects funded; varieties released and commercialised.
Table 5.2 FIAAC Outputs, targets and achievements (2007-2018)
Sub-program
Outputs Targets LOA LOA met against 10-year target 2007 PASS Business
Plan 2009 PASS M&E plan
10-year 5-year 5 year 5-year 10-year
FIACC Grants awarded
92 105 161 -
Varieties released
1250 0 447 333 665 55%
Varieties commercialised
- - 271 208 431 159%
Source: Compiled from PASS Business Plan, 2007; PASS M&E Plan, 2009; AGRA grant memos and AGRA Grant
Narrative Reports 2007-12; PASS Close out Report, 2017
More than 20 different crops were supported through 161 FIAAC grants. The highest number of grants
went to supporting maize breeding programs (47 grants; 27% of total): including hybrid and open-
pollinated varieties. Other priority crops were staple grains (rice, sorghum); and roots (cassava, sweet
potato); followed by pulses and legumes. The lowest priority crop - grown in many PASS countries - was
pigeonpea. The dominance of maize in the breeding programme was justified in terms of national food
security priorities and low breeding intensity ratios. It is also the leading crop in terms of seed marketed
and therefore seen as a desired crop by many seed companies (Section 6). However, AGRA has supported
a wider set of crops under PASS II in line with food and nutrition diversification objectives and diverse
country agroecological contexts and farmer socioeconomic preferences.
Breeders from 18 countries were supported by FIAAC (Figure 5.1). The largest recipients were Uganda
(22), Kenya (21), Mali (20), Ghana (18). These were followed by Tanzania (14), Nigeria (12), Burkina Faso
and Ethiopia (9 each). Malawi, Rwanda, South Sudan, DRC, Zambia, Niger, Sierra Leone and Liberia were
awarded 8 or less. The high funding share partly reflects the allocation under PASS Phase I: PASS II saw
some rebalancing of grants, with Ethiopia, Burkina Faso and Mozambique increasing their share of funding
slightly, reflecting increased capacity to conduct breeding programs.
In terms of allocation of grants, the crop focus was determined by a number of factors including country
priorities and investments by national programs and development organisations. In most cases the FIAAC
grant focus reflected the most important national food crops by production (Table 5.3). Notable
exceptions are banana and plantains in Kenya, Rwanda and Tanzania, and potato in Malawi, Kenya and
Rwanda, which are important crops in specific agroecologies. Additions to the FIAAC portfolio in PASS
Phase II include: sorghum in Burkina Faso; teff in Ethiopia; cassava in Mozambique and Zambia; millet in
Niger; banana and sweet potato in Uganda; and groundnuts in Zambia. This has helped expand the focus
beyond maize and other staple crops.

42
EVALUATION OF AGRA AFRICA’S SEED SYSTEMS PROGRAM FINAL REPORT
Table 5.3 FIAAC grant crop focus compared to most important crops by country
Country FIAAC grant crop focus Most important food crops by production
Burkina Faso Pearl millet, cowpea, sorghum, maize, rice, sweet potato
Sorghum, maize, pearl millet, cowpeas, groundnut
Ethiopia Sorghum, wheat, maize, teff, soybean Maize, sorghum, wheat, teff, beans, barley Ghana Maize, cassava, cowpea, groundnut, rice,
soybean, sweet potato Yams, cassava, plantains, taro, maize, groundnut, rice
Kenya Cassava, sorghum, sweet potato, maize, finger millet, rice, beans, pigeonpea
Maize, potatoes, beans, bananas
Malawi Cassava, sweet potato, beans, maize, rice Potatoes, maize, cassava, beans, groundnut
Mali Rice, sorghum, maize, cowpea, pearl millet Rice, pearl millet, sorghum, maize, groundnut
Mozambique Maize, sorghum, rice, sweet potato, cassava, groundnut, cowpea
Cassava, maize, sorghum, sweet potato, rice
Niger Sorghum, millet Millet, cowpea, groundnut, sorghum Nigeria Rice, cassava, sweet potato, sorghum, cowpea,
pearl millet, maize Yams, cassava, groundnut, rice, maize, sorghum
Rwanda Maize, beans, sweet potato, rice Plantains, potatoes, cassava, beans, maize, sweet potato
Sierra Leone Maize, cassava Rice, cassava, groundnuts Tanzania Maize, beans, cassava, soybean, sweet potato,
rice Bananas, rice, maize, cassava, beans
Uganda Beans, cowpea, maize, soybean, groundnut, banana, rice, sweet potato
Banana, cassava, maize, beans, sweet potato, finger millet
Zambia Maize, rice, sweet potato, cassava, groundnut Maize, cassava, groundnut, wheat
Source: Compiled from PASS Target Reports 2009; PASS Database
Note: Bold indicates national priority crops which were not included in FIAAC. Italics indicates crops introduced in
PASS Phase II
5.3 Varieties released and commercialised
5.3.1 Varieties released
To date 665 varieties have been released by breeders under FIAAC-supported programs over the 10-year
period of PASS (Figure 5.3). This represents 55% of the 10-year program targeted figure of 1200 (an
extremely high target). This is an impressive achievement by the program. Although some of the releases
can be partially attributed to varieties in the pipeline before the PASS investment, a significant effort and
impact by AGRA is visible.
The releases broadly reflect the allocation of funding across different crops. Most are staple food crops.
Maize had the highest number of varieties by a large margin: 177 varieties or 26 percent of total releases.
Ninety rice varieties were released (leading countries were Mali and Nigeria); 86 cassava varieties (the
most coming from Ghana) and 81 varieties of beans. These were followed by sweet potato (65); cowpea
(46), sorghum (36), groundnut (26). The lowest number of releases were for banana, wheat, chickpea,
faba bean, millets and teff. Some of these crops are grown within a limited set and agroecologies and
markets, and are important in specific countries. However, crops such as millet, are important for food
security in dry areas and have not been prioritised in breeding programmes to date.

43
EVALUATION OF AGRA AFRICA’S SEED SYSTEMS PROGRAM FINAL REPORT
5.3.2 Varieties commercialised
Seed commercialisation involves delivery of high-quality seed to the marketplace so that farmers have the
best possible chance of consistently producing high yielding, valuable crops. The degree of
commercialisation is a key indicator of the success of breeding programmes.
PASS records show that of the 665 varieties released over the 10-year period since PASS inception, 431
have been commercialised by seed companies: indicating a success rate of 65 percent. This exceeds the
PASS target by 50%, indicating an excellent commercialisation rate. Although there are variations between
countries, overall commercialisation has increased steadily over the program period.
The evaluation team surveyed around seventy AGRA-supported breeders in 5 countries to determine the
numbers of varieties released and commercialised and estimate commercialisation rates (Figure 5.1).
Findings show that 4 of the countries surpassed the 50% commercialisation rate: Tanzania had an
impressive 85%; followed by Uganda 74%; Ghana 60%; Ethiopia 55%. Only in Mali were breeders unable
to secure satisfactory commercialisation, despite their high number of releases. For Ethiopia, both
number of varieties released and commercialised were quite low.
Differences in commercialisation rates may be attributable to several factors including:
1. The formal seed systems in Tanzania and Uganda are more developed than Mali, Ethiopia and
Ghana; while in the West African Region Ghana has a more developed seed system than Mali.
2. The seed regulatory, variety registration and protection law which facilitates variety release and
deployment is more progressive in Tanzania followed by Uganda, Ghana, Mali and Ethiopia.
3. Large and medium seed companies are more prevalent in Tanzania whilst countries such as Ghana
have more seed multipliers as companies.
4. The seed regulatory, variety registration and deployment capacity is highest in Tanzania and with
Ethiopia having the lowest.
The mean commercialisation rate across the 5 countries surveyed was 61 percent. This broadly agrees
with PASS findings and is an indication of the impact created by breeders on national seed systems.

44
EVALUATION OF AGRA AFRICA’S SEED SYSTEMS PROGRAM FINAL REPORT
Figure 5.1 Number of AGRA-supported varieties released and commercialised in surveyed countries
Source: Evaluation study (2018)
5.4 Factors supporting and constraining commercialisation
To meet PASS criteria for funding, breeders need to ensure that varieties are both high yielding and
preferred by farmers through participatory variety selection (PVS). This is also increasingly required by
national release committees to complement national performance trial (NPTs) in PASS countries. Farmers
require varieties which are well-adapted to their specific agroecological and socioeconomic contexts. To
a large extent, breeders are responding to these demands and contexts, for example:
Resistance to disease, in the context of epidemics in major crops, is an important driver of farmer behaviour. Cassava mosaic disease (CMD)-resistant high-yielding varieties have been developed in Ghana and are being multiplied by a seed company and bought by farmers. In Tanzania, varieties resistant to CMD and Cassava Brown Streak Disease have been released and are being multiplied by farmer groups and sold to other farmers. In Ethiopia, wheat varieties resistant to yellow rust were released by the Ethiopian Institute of Agricultural Research (EIAR) from CIMMYT lines and multiplied to replace susceptible varieties. Striga-resistant large-sized cowpea varieties preferred by farmers have been released and commercialised by seed companies in several countries.
Drought tolerance, given increasingly variable rainfall, is a preferred trait in an increasing number of crops and contexts and is driving the development and successful commercialisation of early and extra-early maize varieties.
Produce markets are important drivers of demand, for example: rice in Tanzania, sorghum for brewing companies in Kenya and Uganda, and beans in Tanzania. Demand-led breeding is being
84
67
52
22
84
62
4044
12
30
0
10
20
30
40
50
60
70
80
90
Uganda Ghana Tanzania Ethiopia Mali
Number of Varieties Released Number of Varieties Commercialized

45
EVALUATION OF AGRA AFRICA’S SEED SYSTEMS PROGRAM FINAL REPORT
promoted by EACI and WACCI which combines the best practices in market-led new variety design with innovative plant breeding methods and integrates these with best practices in business to deliver benefits (CABI, 2017). The experience of CIAT in market-led bean seed production in Tanzania is presented in Section 7.
Awareness promotion of new varieties
Involving farmers in PVS is the main way in which breeders are directly involved in awareness-raising of
new varieties and traits with farmers. Male and female farmers and farmers from different agroecological
zones are involved in the selection process. Breeders in most countries reported that PVS as an approach
was established some time before the advent of PASS. However, breeders in Ethiopia consider the
requirement for farmer participation in variety selection to be directly attributable to PASS. This is being
felt beyond the PASS program across plant breeding in Ethiopia.
Although PVS can enable a good understanding of the improved material, the numbers of farmers
involved are quite small. PASS therefore actively supports promotion of new varieties by seed companies
and other seed producers through field days, demonstrations and media promotion. The success of this
strategy in terms of linkages between AGRA-supported lines and seed company varieties and farmer
awareness is not yet fully realised (see Section 10).
Linkages with seed companies
PASS emphasises linkages between breeders and seed companies as a key component of the seed value
chain. Almost all of the breeders consulted in the course of the evaluation said they have linkages with
seed companies or farmer seed producers to multiply their varieties. Although seed companies are
generally in agreement with this statement, they would like to see the linkages further strengthened.
Further consultations with seed companies show that many are not actually producing AGRA-supported
varieties. The reasons for this are a complex set of inter-related factors including:
Seed companies’ need to produce a limited set of varieties to achieve efficiency, given their generally small scale of production. Thus, they may have little incentive to produce additional varieties from breeders.
Preference is to focus on well-known established varieties, especially hybrids, for which there is an established market demand. New varieties released by breeders are often considered high risk.
Preference is to source varieties from CGIAR centers given the challenges of obtaining licenses for NARS varieties (including AGRA-supported varieties)
Restricted demand for self-pollinators OPV maize and legume seed, which do not need to be purchased every year
Lack of cash by farmers to purchase farm inputs depresses overall demand for seed.
Adaptation for agroecological and socioeconomic context
AGRA has promoted the concept of a uniquely African Green Revolution: supporting crops and varieties
adapted for specific agroecological contexts and smallholder farmer contexts, including markets and food.
This is particularly important in the context of variability in climate, market and government policies: for
example, maize export bans in Malawi and Tanzania due to poor harvests; highly cyclical world market
prices for pigeon pea depending on harvests in India, the largest producer.

46
EVALUATION OF AGRA AFRICA’S SEED SYSTEMS PROGRAM FINAL REPORT
Smallholder farmers are by necessity risk-minimisers and aim to increase variation and diversity on their
farmers, rather than increase concentration on particular crops and varieties (Future Agricultures, 2011).
PASS has responded by supporting breeding for increased crop diversity and resilience. For example, many
of the PhD students at ACCI have focused on drought-tolerant traits for staple crops. Others have been
working on heat tolerance, waterlogging and pest and disease tolerance, depending on the needs in their
location.
The AGRA approach of breeding for specific African ecologies was augmented by the fact that the
distribution of crop institutes in the target countries is already focused on different ecologies in the
respective countries such as high rainfall, medium rainfall, semi-arid and arid ecologies.
These are important steps in the direction of climate smart agriculture and support for the poorest
farmers. Moving forward, resilient and diversified agricultural systems are likely to become even more
important and should therefore continue at the centre of AGRA programming, alongside market-oriented
goals.
Varietal turnover
Adoption of the varieties by farmers is generally good; but turnover is low. The focus should have been
more on varietal turnover which ensures there are mechanisms for sustained replacement of older
varieties for newer ones. Varietal turnover means the replacement by farmers of an improved variety with
a more recently developed/improved one (Spielman and Smale, 2017). Initial adoption of an improved
crop variety does not guarantee a continuous process of varietal turnover in subsequent seasons or years.
For impact at farmer and national level, varietal turnover must be strong and sustained. For a farmer
incremental yield is important but cannot on its own drive a strong varietal turn over. It is important that
the farmer is able to observe the other crop gains such as tolerance to diseases and insect pests, lodging
in case of strong winds, cookability, aroma, mouth feel and other organoleptic characteristics. Similarly,
farmers who have limited access to seed markets or credit facilities may forgo purchase of seed of newly
released variety and recycle the seed of an already adopted variety. The breeding must ensure the farmer-
preferred traits are visible so farmers are willing to replace the older varieties to capitalize on the benefits
displayed by the newer varieties. The concept of varietal turnover appears new to the breeders and yet
this is where the farmer uptake sustainability is engrained.
5.5 Capacity strengthening of plant breeding
Capacity building for plant breeding was assessed from secondary and primary sources. The African Seed
Access Index, TASAI (2018), shows approval ratings for breeders in 2016 (Appendix 7). PASS-supported
countries and commodities range from 54-58 percent for Kenya, Tanzania and Malawi to 70 percent or
more for Ethiopia, Ghana and Mozambique. These are interesting findings given that Kenya and Tanzania
have traditionally been associated with a strong breeding reputation. Support from PASS for breeding in
Ethiopia and Mozambique is likely to have contributed to their strong performance.
Support for capacity building by AGRA was also rated by breeders from national research institutions in
surveyed countries (Table 5.4). The highest rating was for capacity development of breeders.
Capital support for large items such as laboratory equipment was generally not prioritised under the
project and was given a low rating by researchers. A notable exception was CSIR-Crops Research Institute
in Ghana where PASS supported a $500,000 investment in a large irrigation facility covering 3000 acres.

47
EVALUATION OF AGRA AFRICA’S SEED SYSTEMS PROGRAM FINAL REPORT
This investment was given a high rating by researchers and has significantly increased breeding capacity
at the Institute. Other important contributions cited by national breeding institutions were training for
technicians and transportation equipment.
Table 5.4 Breeder assessment of value added from AGRA support for capacity strengthening
Capacity strengthening Uganda Ghana Tanzania
Irrigation facilities 1.5 4.3 1
Laboratory Equipment 1.5 1.8 1.3
Capacity development of breeders 4 4 4.3
Source: Evaluation interviews (2018)
Note: Rating scale: 1 – lowest; 5 – highest.
The breeders interviewed were unanimous in their assessment that the value AGRA adds is unique and
impressive. Capacity building through the postgraduate training significantly enhanced the in-country
breeding capacity. The strategy of farmer involvement particularly in Tanzania, Uganda and Ghana is one
attribute that has almost doubled the new variety uptake particularly for maize and beans. Grants by
AGRA further functionalized the breeding dynamics in the countries visited. This was exemplified by the
quality and numbers of publications in international journals such as American Crop science, African Crop
Science Journal, Journal of Agronomy, Crop Improvement Journal, Archives of virology, Medica,
Professional Journal of Agriculture, Euphitica, journal of Plant Breeding, International journal of Plant and
Soil Science, International Journal of Pathology etc. This publication track record demonstrates the
development of a population of world class plant breeders in Africa courtesy of AGRA.
AGRA also organized training of technicians. For example, in Uganda technicians received tailor-made
training on cassava breeding nationally. This training not only enhanced the motivation of the technicians
but their competencies as well.
A number of re-tooling initiatives of breeders and technicians were mentioned. AGRA achieved this
through support for benchmarking visits, attendance of scientific conferences and workshops by breeders.
The other areas of value addition is infrastructural support such as irrigation in Ghana which has
transformed the turn round of variety development as breeders are able to test the new varieties all year
round (Table 5.4). The investment in laboratory equipment and purchase of vehicles was also reported
but clearly the focus on this by AGRA was not as robust.
Sustainability of the Breeding Effort by EACI
AGRA operates in the space of delivering functional and sustainable breeding capacity and institutional
capacity with other development partners. Sustainability of the gains made is threatened by the low level
of government public research funding in many AGRA countries. The public R&D funding weaning off
strategy by AGRA and other players was not clearly stated from the onset. This could have included
commitment from government to sustain funding at an agreed level after the PASS and SSTP programs
phased out.
It is evident from the interviews that the breeders are very well trained in the art and science of breeding
and development of varieties. The skills of product development, launching and commercializing are not

48
EVALUATION OF AGRA AFRICA’S SEED SYSTEMS PROGRAM FINAL REPORT
as robust. The implication of this is confusing official variety release as an end in itself and not packaging
the varieties well enough to propel themselves in the marketplace to seed companies and farmers.
The breeding focus is on farmer traits which are to a large extent organoleptic. This tends to promote food
security agriculture rather than processing and value addition agriculture where the value in creating a
market pull is larger. Breeding for commercial/processing traits should have a higher profile than the case
currently and this will result into dual line breeding strategy. A market pull due to processing of primary
material will incentivize farmers to plant more and create a self-sustaining agri-system which will function
after AGRA and others exit the stage.
Post-EACI support needed
Maintenance, multiplication and promotion of new and existing AGRA-supported and other varieties
receive limited support from government in most African countries. This makes the breeding function
after AGRA exits the scene unsustainable. To guarantee sustainability, a number of options need to be
pursued, such as:
High level government advocacy to fund not only salaries at that national research stations but
also operations.
The research and the breeding agenda to be raised at the level of AU/NEPAD level in order to
develop policies that will encourage individual countries to implement the 10% of the GDP
investment in agriculture as stipulated in the CAADP agenda.
Deliberate capacity building of breeders in writing successful concept notes and proposals for
funding not only to donors but also to industry.
5.6 Conclusions and Recommendations
The PASS breeding program has produced impressive results with over 665 varieties released and 431
commercialised.
Adoption of the varieties by farmers is generally good; but turnover is low. Initial adoption of an
improved crop variety does not guarantee a continuous process of varietal turnover in subsequent
years. For impact at farmer and national level, varietal turnover must be strong and sustained.
The concept of varietal turnover appears new to the breeders and yet this is where the farmer
uptake sustainability is ingrained.
Breeders must ensure that preferred traits are visible to farmers so they are willing to replace
their older varieties to gain the benefits displayed by the newer varieties. Varietal turnover
needs to be promoted by breeders to ensure sustained farmer uptake of improved varieties.
Although the breeder training program was excellent across the countries visited, the majority of
current breeders supported were trained under earlier programs (pre-PASS). The training focus
was on technical aspects at the expense of business training, particularly in the area of product
development and product launch for commercialization, which would enable breeders to treat
crop varieties as commercial products with appropriate profiling to engage the farmer psyche and
willingness to invest in the new genetics. Breeders need to access business training – including business development and product launch - in
addition to technical training to improve commercialisation and understanding of farmer demand.

49
EVALUATION OF AGRA AFRICA’S SEED SYSTEMS PROGRAM FINAL REPORT
Infrastructural support for breeding was given a rather low profile under PASS. An exception is
the investment in an irrigation facility in Ghana which has fast-tracked the crop improvement
agenda. Similar investments elsewhere would have a significant impact on the crop improvement
strategy. Investment in irrigation and cold storage is not cheap but the value addition in enhancing
breeders’ seed volumes in order to fast-track varietal commercialization is high. Support for
infrastructural development including irrigation and cold storage is needed to enhance breeder seed
volumes and fast track commercialisation.
AGRA has taken important steps in the direction of climate smart agriculture through breeding
for drought, waterlogging and pests and diseases. Moving forward, resilient and diversified
agricultural systems are likely to be even more important, and should remain central to AGRA
programming, alongside market-oriented goals.
AGRA should strengthen its focus on crops and varieties for diverse ecologies and household
preferences to deliver options to farmers which address their climate, soils, pest and diseases contexts,
and food and market preferences.
The gains made in breeding personnel and institutional capacity can be sustained, but only if the
AGRA grants are complemented by government sustained funding of operations and not just
salaries.
To guarantee sustainability AGRA should:
Lobby policy makers to support breeding operations including maintenance and
registration of varieties and production of breeder seed to ensure gains from the program
are sustained.
Support capacity building of breeders in writing successful concept notes and proposals for
funding not only to donors but also to industry.
Raise the research and the breeding agenda at AU/NEPAD level in order to develop policies
that will encourage individual countries to implement the 10% GDP investment in
agriculture as stipulated in the CAADP agenda
The current breeding focus is on farmer traits which tend to promote food security agriculture
rather than processing and value addition agriculture where the value in creating a market pull is
larger.
Breeding for commercial/processing traits should have a higher profile and this will result into
dual line breeding strategy. A market pull from processing of primary material will incentivize
farmers to plant more and create a self-sustaining agri-system which will function after AGRA
and others exit the stage.
What model of breeding for new varieties should AGRA adopt to support breeding work on a
sustainable basis?
The model which works in the private sector is analysis of existing varieties in the market in order to
determine their popularity and attributes which make them popular. These include both farmer and
consumer traits and processing traits. The AGRA focus is farmer adoption of varieties which tends to
narrow the model focus to farmer traits. With the farmer and market model, farmers identify
additional traits which are missing in existing commercial varieties. Breeders then focus on filling the
gaps without losing the existing positive attributes. Rice development in Tanzania, for example, was
driven by both aroma and stickiness – farmer and commercial traits. With rice breeding addressing
the two traits, rice production and consumption has increased significantly. Another example of this

50
EVALUATION OF AGRA AFRICA’S SEED SYSTEMS PROGRAM FINAL REPORT
approach is the Plant Breeding Institute in UK, owned by Unilever, which kept the baking industry
moving on to new and better varieties of wheat by uniquely addressing both the baking qualities for
industry and consumer preferences. The company made money by charging a small premium for the
newer varieties because they delivered value every time. If this model is adopted and it delivers, the
seed companies will grow the varieties because they make business sense and farmers will plant the
varieties for food security and livelihoods. This model drives varietal turn-over even without extensive
promotions.
Implementation of this model will require re-tooling of breeders in the following areas:
A mindset change to treat a new variety as a commercial product with a commercial value
tag emanating from the farmer/consumer or market.
Appreciation of the dynamics of the seed value chain and recognising that their role is
critical because it is at the beginning of the chain, driving the chain.
Training in the areas of product development and differentiation to meet market
requirements. Formal studies (not just consultations) are required to understand different
market preferences so breeders are able to determine the market they are serving and
whether it is a mass or niche market. A niche market will require particularly rigorous studies
since the volume uptake is lower. The type of market will determine the type of product
profiling necessary to make the variety commercially robust.

51
EVALUATION OF AGRA AFRICA’S SEED SYSTEMS PROGRAM FINAL REPORT
6 Private Sector Seed Production 6.1 Overview
Seed Production for Africa (SEPA) was the third sub-program of PASS. It was designed to ensure that
improved crop varieties are produced and distributed to help solve smallholder farmer problems in
accessing improved varieties. This was a response to the vacuum left by the public sector after
privatization and downsizing in many countries, and by multi-national companies whose focus was mainly
commercial farmers.
The Scaling Seeds and Technologies Partnership (SSTP) was launched in 2013 to scale uptake of PASS-
supported crop varieties and other complementary technologies. SSTP objectives were to: 1) improve the
production and delivery of quality seeds and other technologies to smallholder farmers; 2) improve
adoption of quality seeds and technologies by smallholder farmers; and 3) improve the policy and
regulatory mechanisms for the delivery of quality seeds and technologies to smallholder farmers.
6.2 SEPA Outputs
SEPA supported 114 seed companies to produce and market seed to smallholder farmers over 10 years
(2007-2018). It also supported 7 public companies, 10 National Agricultural Research Institutions, and 14
Famer Associations, Co-operatives and NGOs. As shown in Table 6.1, this was an impressive achievement
from a very low base, in terms of both numbers and capacity of companies. The number of private seed
companies exceeded targets by almost 50 percent – with an overall achievement of 77 percent annual
seed production.
Table 6.1 SEPA Outputs, targets and achievements (2007-2018)
Sub-program
Outputs Targets LOA LOA met against 10-year target 2007 PASS Business
Plan 2009 PASS M&E plan
10-year 5-year 5 year 5-year 10-year
SEPA Seed companies
40 38 107 80 114 146%
Annual seed production (MT)
186,000 15,500 46,149 10,794 140,000 77%
Source: Compiled from PASS Business Plan, 2007; PASS M&E Plan, 2009; AGRA grant memos and AGRA Grant
Narrative Reports 2007-12; PASS Close out Report, 2017
6. 3 Commercialization of AGRA supported varieties by seed companies
Evaluation question: To what extent have varieties produced by AGRA supported breeders been
commercialized by seed companies, and taken-up by smallholder farmers?
To date 182 different crop varieties have been grown by PASS/SSTP-supported seed companies in the
evaluation countries visited (Table 6.2). Of these, 108 were identified as varieties released by AGRA-
supported breeders. This gives an average of about 59 percent of the total varieties produced by seed
companies. However, some countries have posted better results than others. For instance, Mali, Ethiopia
and Uganda have achieved around 69 percent while Tanzania and Ghana have contributed 35 and 32
percent respectively.

52
EVALUATION OF AGRA AFRICA’S SEED SYSTEMS PROGRAM FINAL REPORT
Table 6.2 Seed companies producing AGRA-supported crop varieties in selected countries
Country No. of companies
interviewed
No. of varieties
produced
AGRA-supported
varieties produced
AGRA-supported
varieties as share of
total (%)
Ethiopia 7 37 25 68
Ghana 5 20 7 35
Tanzania 4 28 9 32
Mali 4 32 22 69
Uganda 4 65 45 69
Total 24 182 108 59
Source: Evaluation Seed Company Key Informant Interviews (2018)
Reasons cited by seed companies for growing AGRA-supported varieties relate to different characteristics
preferred by their smallholder farmer clientele. These include yields, drought tolerance and early
maturity, pest and disease resistance; farmer traits i.e., palatability, colour, cookability, flatulence for
beans, aroma and stickiness for rice (particularly in Tanzania); adaptability to medium altitude for maize
in Uganda, Ghana and Tanzania; availability of market for all crops and varieties; striga tolerance for
sorghum and maize; and nitrogen use efficiency beans and rice. However, some companies cited the
following concerns about AGRA-supported varieties:
Low demand for Open Pollinated Varieties (OPVs) in the case of maize and legumes. For
example, in Tanzania, Agricultural Seed Company (ASA), which is a state-owned company, is
the major producer of OPV maize and bean varieties.
Limited access to AGRA supported varieties. This was commonly reported in Ghana and this
situation was attributed to either unavailability or restrictive licensing process for varieties
from public research institutions. Seed companies in Tanzania pointed to the availability of
varieties from international research centres (e.g. hybrid maize from CIMMYT)
Uncertain demand for new varieties either due to low awareness by farmers or varieties
lacking in one or two farmer preferred traits.
Overall, inadequate land for seed production. This is critical for genetic purity that requires
adequate isolation distance.
The interviewed seed companies particularly in Ethiopia, Ghana and Uganda also cited long delays in
releasing new varieties by regulatory agencies. Most seed companies access Early Generation Seed (EGS)
for certified seed production from public research. However, there is a weak link between EGS source
(research) and seed companies which leads to mismatch between EGS demand and supply. The research
institutes and seed companies have limited capacity (finance, land, and human resources) to produce
adequate EGSs. At the same time, it is difficult for seed companies to predict the quantities of EGS to
produce because many of them have no production forecasts. This results in shortages and sometimes
carryover stocks in both EGS and certified seed.

53
EVALUATION OF AGRA AFRICA’S SEED SYSTEMS PROGRAM FINAL REPORT
In summary, seed companies are producing varieties bred by AGRA-supported researchers where these
have been recognised by farmers as meeting their productivity, market, taste and agronomic
requirements and where the varieties are readily available. However, lack of demand for the new
improved varieties and restrictive licensing processes are constraining their commercialization.
6.4 Production and sales of seed by AGRA-supported companies
Evaluation question: How many of the companies started by PASS are financially viable today (without
subsidies or donor support) and selling meaningful amounts of seed?
PASS Business Plans (2007, 2009) set a 10-year target for annual seed production from PASS-supported companies at 186,000 MT. This works out to an average of around 2,400 MT per company. Actual total seed produced by AGRA companies by 2018 was 140,000 MT per year (Table 6.1) - making an average seed production of 1,200 MT per see company a year. Sales of 1,000 MT per annum by a company would be considered meaningful.
In order to understand the situation at company level, the evaluation team sought to collect data on seed production, sales and costs from seed companies. However, we experienced serious challenges in accessing such data from the respondent seed companies, particularly data on costs and finances. The sample size for the assessment is therefore small. Company viability was therefore determined by use of non-financial parameters (see Table 6.4 below).
Mean production and sales of seed by AGRA-supported companies in Ethiopia, Ghana, Mali and Uganda for the period 2015-2017 are shown in Figure 6.1. These figures reveal fluctuations in in both production and sales. In Mali and Ethiopia average volumes of production and sales have fallen slightly over the past 3 years (i.e., 2015-2017). In Ghana, average volumes of production have fluctuated with a significant reduction in 2016. In Uganda, average volume of production has increased, but sales have fallen from a 2015 high (when carryover stocks from the previous year(s) were sold). Year-on-year variations in production were driven by a number of factors including government subsidies, the effects of weather and Fall Army Worm.
The gap between sales and production is generally around +/- 10 percent across the countries, with the
widest variation seen in Uganda. Production generally exceeded sales by a small margin (except for
Uganda in 2015). The relatively small gap between volumes of certified seed produced and sales over a
3-year period shows that surveyed seed companies were able to sell what they produced which is a good
indicator of business robustness.

54
EVALUATION OF AGRA AFRICA’S SEED SYSTEMS PROGRAM FINAL REPORT
Figure 6.1 Mean certified seed produced and sold (MT) by AGRA-supported companies 2015-2017
Source: Evaluation Seed company survey (2018)
Mean annual seed sales by AGRA-supported companies for the period 2015-2018 were 11608 MT in
Ethiopia, 2824 MT in Uganda, 1217 MT in Ghana and 438 MT in Mali (Table 6.3). There is considerable
variation between company sales within a country, with different scales of company. Overall, the data
indicates that on average seed companies surveyed in Ethiopia and Uganda are currently selling
meaningful amounts of seed. In Mali mean sales are lower, though some individual companies are selling
significant quantities of seed.
Table 6.3 Mean seed sales by sampled seed companies (MT) 2015-17
Country No. of
companies
interviewed
Average sales per seed company (MT)
2015 2016 2017 2015-2017
average
Ethiopia 7 12,838 12,429 9,556 11,608
Ghana 5 1,233 888 1,531 1,217
Mali 4 455 453 407 438
Uganda 4 4,538 1,824 2,110 2,824
Source: PASS/SSTP Evaluation Survey, 2018
2015 2016 2017
0
5000
10000
15000
20000
Ethiopia
2015 2016 2017
0
2000
4000
6000
8000
10000
12000
Ghana
0
100
200
300
400
500
600
Mali
produced sold 2015 2016 2017
0
1000
2000
3000
4000
5000
Uganda

55
EVALUATION OF AGRA AFRICA’S SEED SYSTEMS PROGRAM FINAL REPORT
6.4 Viability of seed companies
The viability of the seed companies was evaluated considering the number of full time employees, the
experience in terms of years of operation, the diversity of seed production models employed, ownership
of own varieties and associated extent of engagement in seed value chain activities (Table 6.4).
There is considerable size difference in the number of fulltime employees across the countries and type
of Seed Company. The use of diversified seed production model often is considered as a mechanism of
production risk management and seed companies in Ethiopia and Uganda are engaged in all the three
models of seed production.
Variety ownership is one of the strategies of promoting viable seed business as the seed company with its
own variety can invest in demand creation. For instance, the major disincentive for seed companies to
invest in demand creation for crop varieties is the lack of own variety as many of the seed companies
depend on public varieties. Of the AGRA supported seed companies, only one seed company, a parastatal,
is engaged in own breeding program.
The engagement of seed companies across the seed value chain from variety development up to
marketing clearly indicates the viability. The AGRA-supported seed companies reported the possibility of
engagement across the seed value chain except breeding and basic seed production, where some of the
seed companies were not engaged.
The AGRA support in enhancing the engagement of seed companies in: i) varietal promotion and quality
seed use, ii) engagement in seed processing and iii) marketing, has relatively boosted the position of
AGRA-supported seed companies in the seed business.
Table 6.4 Indicators of viability of surveyed seed companies
Indicators Ghana Ethiopia Uganda
Average number of full-time employees
Private seed company 13 42 26
Parastatal 703
Years of operation Average 15 15 14
Business organization model for seed production
Own farm 100 86 75
Out grower model with farmers 40 86 100
Out grower with commercial farms 57 50
Ownership of own variety Private seed company No No 3
Parastatal 1
Activity engagement Breeding 14 1
Basic seed production 20 57 100
Certified seed production 100 100 100
Seed processing 60 100 100
Seed marketing 100 100 100
Source: PASS/SSTP Evaluation Survey, 2018

56
EVALUATION OF AGRA AFRICA’S SEED SYSTEMS PROGRAM FINAL REPORT
The evaluation team then developed a non-financial tool to assess company viability categorized as: not viable, transition and viable) using a set of weighted indicators (Table 6.5) and each company was scored against these criteria.
Table 6.5 Seed company viability indicators and points
Indicator Score
1. Human capital (breeder, agronomist) 2
2. Quality Assurance System 2
3. Seed processor 2
4. Land ownership/access 2
5. Out-grower scheme 1
6. Irrigation capacity 3
7. Insurance 1
8. In-house business skills 2
9. Cold storage 2
10. Age of business (years) <5=2, 5-10=3, >10=4
Source: Evaluation Team (2018)
The scores were then used to assign companies 3 levels of viability: unviable (scoring 0-30%), transitional (30-50%) and viable (50-100%) (Table 6.6). Of the 20respondent seed companies, 11were assessed as viable (55%), 4 as transitional (35%) and 3 as unviable (15%). The highest proportion of viable companies were in Ethiopia, followed by Tanzania. The lowest was Ghana.
The findings indicate that although there are a good number of success stories by AGRA-supported seed companies (over 50 percent of this sample rated viable), many small and medium-sized seed companies continue to struggle with low human and infrastructural capacity, low in-house quality assurance and land size (see Section 6.6).
Table 6.6 Seed company viability levels (surveyed companies)
Country Number of seed companies
Viability level (number of companies)
Unviable Transitional Viable
Ethiopia 7 1 1 5 Ghana 5 2 1 1 Tanzania 4 0 1 3 Uganda 4 0 2 2
Total 20 3 7 11 Source: Evaluation (2018)
Training and capacity building for seed companies
PASS-supported training by the Seed Enterprise Management Institute (SEMIs) at the University of Nairobi and other capacity building support has contributed significantly to the success of seed companies. Respondents in Ethiopia stated the training had increased their understanding of seed business, and as a result some companies have become financially eligible to borrow from banks and other financial institutions (see Box 2). In Ghana, a former seed technician founded the Legacy Crop Improvement Centre (LCIC) after the training and is now producing foundation seed for research institutes and seed companies in Ghana and Burkina Faso (Box 3).

57
EVALUATION OF AGRA AFRICA’S SEED SYSTEMS PROGRAM FINAL REPORT
Box 2: Capacity training of seed companies
The Seed Enterprise Management Institute (SEMIs) at the University of Nairobi has trained 817 personnel from 21 countries from PASS phase 1 and 2. The participants learned both the practical and theoretical aspects of seed business. These training courses and other capacity building initiatives targeting African seed companies, have contributed to the growth of four seed companies (Maslaha Seed Ltd, Nigeria; Oromia Seed Company, Ethiopia; Amhara Seed Company, Ethiopia and Equator Seed Company, Uganda) reaching 10,000 MT of seed in 2016, plus 30 companies exceeding 1,000 MT in annual production and sales, thus graduating from SMEs.
In Ethiopia, AGRA support to Haramaya University to provide long-term training on seed science has been one of the most important interventions that have contributed to seed human capital in the country. As a result, some universities like Mekelle have started PhD specialization on seed science. This impressive seed and seed systems expertise prepares Ethiopia for an offtake in the seed sector.
Sources: Key informants from Evaluation of PASS II (2018)
Box 3: Development of Legacy Crop Improvement Centre (LCIC) in Ghana
Amos Azinu, initially worked on the WACCI breeder farm as a part-time technician. This heightened his interest in plant breeding and Mr. Azinu enrolled in the MPhil (Plant breeding and genetics) at the University of Ghana from 2012-14 as a self-sponsored student. After his Masters he was sponsored by AGRA for a short course on hybrid seed production and seed enterprise management at the University of Nairobi, Kenya. Here, lack of foundation seed was highlighted by other Ghanaian participants as the key challenge to hybrid seed production in Ghana. From that training workshop, he was inspired to examine the viability of foundation seed production in Ghana.
In 2015, Mr. Azinu established his own seed business and consulting firm Legacy Crop Improvement Centre (LCIC) in the Eastern region of Ghana. Activities of this seed company were boosted through strategic linkage to AGRA grantees months and later through an SSTP grant received from AGRA in 2016 (US$179000) to support the production of foundation seed. LCIC is currently the only private company in the country that is engaged in hybrid foundation seed production and marketing, targeting maize, cowpea and rice. Under the SSTP project, they produced almost 2 MT of seeds in 2016 and 4.2 MT in 2017. In 2018, the company produced 4.2 MT of foundation seed for maize.
The company has a 15-acre drip irrigation farm for all-year round seed production and their foundation seeds are produced on contract for institutions like Savanna Agricultural Research Institute (SARI), Wienco/RMG and local seed companies. So far, RMG bought 1MT of foundation seed from LCIC in 2017 and the company multiplied almost 2Mt of foundation seed for RMG using their own (RMG’s) breeder seeds. In January 2019, LCIC sold about 50kg of foundation seed to Faso Kaba in Mali and is looking to expand this in coming years.
Students from WACCI (University of Ghana) and University of Ibadan, Nigeria have been using LCIC’s irrigated field for their breeding activities. LCIC also has a 30-MT capacity gene bank to store seeds produced for market as well as germplasm from private and public institutions like WIENCO/RMG and SARI for future use. In addition to commercial production of foundation seed, LCIC is involved in breeding/varietal development activities. The breeding program is aimed at developing hybrid maize varieties (white corn, yellow corn and sweetcorn) that are high yielding, drought resilient, disease resistant and have high Pro-Vitamin A content. Apart from providing consultancy services to seed industry players, LCIC also plays a technical backstopping role for commercial seed companies through training and field demonstrations. In 2016, the CEO of the company was part of a team of consultants that conducted a study on Early Generation Seeds (EGS) in Ghana for a USAID project.
Sources: Key informant; https://www.lcicgh.org/

58
EVALUATION OF AGRA AFRICA’S SEED SYSTEMS PROGRAM FINAL REPORT
Evaluation question: To what extent have AGRA-supported seed companies been successful in crops
other than maize? How can we adapt this model to other crops in future?
6.5 Diversification of crop and varietal coverages
The support provided by AGRA in terms of enhancing seed commercialization had three dimensions:
increased crop coverage, varietal coverage, and increased volume of production and marketing.
Crop coverage
The support provided allowed private seed companies to expand seed production from maize into other
crops. For instance, private seed companies were able to produce certified seeds for teff and wheat
among cereals and haricot beans and chickpea among pulse crops in Ethiopia, rice and cassava in Ghana,
and haricot bean and soya in Uganda in addition to maize. In case of Ethiopia, private seed companies
were totally engaged only in maize seed production highly linked with the high demand created for maize
varieties. Through AGRA support, private seed companies supported by AGRA were able to produce seed
for other crops linked with enhanced capacity to created demand for seeds of other crops.
Varietal coverage
The support of AGRA has expanded the varietal coverage that private seed companies were engaged. As
indicated in the Figure 6.2, supported seed companies were able to engage with more varieties providing
wider options for farmers.
Figure 6.2 Coverage of AGRA-varieties in respondent seed companies
Source: Evaluation Seed company survey (2018)
Ethiopia Maize
Ethiopia Teff
Ethiopia wheat
Ethiopia Haricot beans
Ethiopia chickpea
Ghana Maize
Ghana Rice
Ghana Cassava
Uganda Maize
Uganda Haricot beans
Uganda Soya bean
0 1 2 3 4 5 6 7 8 9 10
Number of varieties

59
EVALUATION OF AGRA AFRICA’S SEED SYSTEMS PROGRAM FINAL REPORT
Crop diversity
Crop share of AGRA-supported seed companies in 2012 and 2018 is shown in Figure 6.3. Maize seed
continues to be the principal commodity produced at more than 50% crop share in both years. However,
there was increased volume of production in wheat and beans. The introduced crops in Phase 2 include:
cassava, teff and potato and sesame. The increased crop diversity enhancement in support of smart
agriculture could be attributed to a number of players such as CGIAR, government seed companies,
universities, NGOs. However, AGRA is seen as a flag bearer by most key informants in this space.
Figure 6.3 Certified seed production by AGRA-supported companies by crop share: 2012 and respondent
seed companies in 2017
Source: Final Evaluation PASS I (2012) Source: Final Evaluation PASS II (2018)
SSTP focused on diversifying and scaling seeds for different crops beyond maize (Figure 6.4). Drought-
tolerant maize is the leading crop among SSTP-supported seed enterprises – together with standard maize
accounting for 38 percent of seed produced. However, SSTP supported enterprises have also been
successful in producing significant amounts of planting material for roots and tubers (12,700 MT), beans
and legumes (11,277 MT).
Figure 6.4 Share of improved seeds of crops produced by SSTP-supported enterprises (%)
Source: Calculated from SSTP Final Report
Beans5%
Chickpea0%
Cowpea0%
Groundnut1%
Maize59%
Millet0%
Okra0%
potato0%
Rice2% Sesame
0%
Sorghum1%
Soybean0%
Teff8%
Wheat16%
cassava8%
Beans3%
Cassava12%
Chickpea1%
Cowpeas5%
Groundnuts6%
Irish potato5%
Maize31%
Drought tolerant maize
7%
Millet1%
Pigeonpea3%
Rice8%
Soybean5%
OFS potato1%
Teff3%
Wheat1%
Yam9%

60
EVALUATION OF AGRA AFRICA’S SEED SYSTEMS PROGRAM FINAL REPORT
Interviews by the evaluation team with seed companies show that many are successfully expanding their crop portfolio. In Ethiopia, whilst maize remains the leading crop, very significant quantities of bean, wheat and teff seed are now being produced and sold. Similarly in Uganda, maize takes the leading share but groundnut, beans, rice and sorghum sales are very significant. In Mali, rice seed is the leading crop, followed by maize (Table 6.7).
Table 6.7 Mean certified seed sold by AGRA-supported seed companies by crop (2015-17)
Country Crop
Quantity of seed sold (MT)
2015 2016 2017 Average 2015-17
Ethiopia
Maize 476.5 388.6 451.6 438.9
Teff 179.4 140.5 216.6 178.8
Wheat 179.4 140.5 216.6 178.8
Beans 243.1 199.9 345.5 262.8
Chickpea 49 85 41 58.31.6
Mali
Maize 110.3 128.4 162.8 133.8
Rice 408.6 430.8 334.4 391.3
Potato 17.9 30.7 33.7 27.4
Cowpea 34.4 40 29.6 34.7
Ground nuts 14.4 30.5 18 21.0
Millet 108.4 38 25.6 57.3
Sesame 1.1 1.8 1.9 1.6
Sorghum 60.5 37.9 19.1 39.2
Okra 0.4 0.6 0.4 0.5
Uganda
Maize 720.3 249.6 296.2 422.0
Beans 137.4 120.3 116.8 124.8
Rice 220 54.1 69.4 114.5
Soybean 29.3 26.3 23.3 26.3
Sorghum 76.4 123.9 141.7 114.0
Ground nuts 137 130 497 254.7
Source: Evaluation Company survey (2018)
For ecological diversity compliance, agricultural research institutes in all AGRA-supported countries are
positioned to meet geographic, ecologic criteria to service the respective regions. For example, high
altitude crop varieties such as maize and beans are generally bred in research institutions located in high
potential areas which also have high elevation. Institutions which breed drought resilient crops such as
sorghums and millets are located in semi-arid geographies of each country. The AGRA strategy, therefore,
of supporting these institutions was inherently compliant and synergistic with the development of crop
varieties suited to the specific geographies.

61
EVALUATION OF AGRA AFRICA’S SEED SYSTEMS PROGRAM FINAL REPORT
Evaluation question: Did the AGRA supported companies scale up production and operations?
What were the key features of scaling and how can this be replicated in future?
7.5 Scaling up of production and features of scaling
Scaling is understood as expanding, adapting and sustaining successful policies, programs or projects in
different places and over time to reach a greater number of people (Hartmann and Lin, 2008).
Commercialization is defined as multiplication of a technology for commercial purposes in a country for
the first time. The SSTP approach to scaling involves 3 steps:
Technology and zone identification;
Value chain diagnostics; and
Investments in specific value chains.
By the end of the program, SSTP had supported the commercialization of 67 crop varieties and
complementary technologies, significantly exceeding the target of 50. Examples of technologies
supported in the six target countries are:
Malawi: Improved bean varieties developed by plant breeding teams at Chitedze Research station
in Malawi, and produced by Multi-Seed Company Ltd.
Mozambique: Promotion of Clone 3 and Clone 4 of cassava.
Ghana: Promotion of new maize hybrid ‘Kpari Faako’, Orange Fleshed Sweet Potato varieties CRI-
Apomudem, CRI-Patron, CRI-Otoo, and CRI-Bohye.
Senegal: Promotion of hybrid maize in Komsaya and Bondafa.
Tanzania: BioScience Solutions has strengthened capacity of their tissue culture lab for production
of Early Generation Seed (EGS) of round potatoes in Babati.
Ethiopia: Six seed companies and a cooperative union received grants in 2014 to scale uptake of
improved crop seed varieties and other technologies (Box 7.1).
Box 3: Scaling of farm tools, bio-fertilizers and blended fertilizers in Ethiopia
In Ethiopia SSTP provided grants for promotion of bio-fertilizer linked with promotion of chickpea
production and promotion of blended fertilizer in three regions: Oromia, Amhara and Southern
Nations, Nationalities, and Peoples' Region (SNNPR). The support used two different models. It
enabled a private company producing and marketing bio-fertilizers in the country, to popularize
its products and create demand. AGRA’s support to an international NGO, SG-2000 has helped in
demonstrating blended fertilizers in four regions covering 64 districts in collaboration with the
Ministry of Agriculture and Natural Resources (MoANR) and Agricultural Transformation Agency
(ATA). Overall, SSTP support has created demand for improved inputs. However, there is no
example of models for scaling through the public sector under the program.
Sources: Evaluation of PASS II Key informant Interviews (2018)

62
EVALUATION OF AGRA AFRICA’S SEED SYSTEMS PROGRAM FINAL REPORT
Case study: Development of a bean seed innovation system in Northern Tanzania1
The International Centre for Tropical Agriculture (CIAT) received an SSTP grant of $500K in 2014 for
‘’Unlocking the potential of seed companies to reach smallholders with quality seed of new bean varieties
in northern Tanzania’’. Tanzania is the world’s 7th largest common bean producer and common bean is
second to maize in area cultivated in Tanzania. Beans are a staple food and major cash crop in the country,
supplying more than 10 countries in the region.
Situation Analysis: The growth of the seed system has been constrained by various challenges:
Many seed companies did not consider beans a viable business since farmers recycle seeds
Inadequate farmer knowledge and access to improved bean seed varieties
Limited interaction between seed companies and research institutions
Centralization of seed marketing
Public sector Agriculture Seed Agency (ASA) and seed companies sold bean seed to NGOs or government seed operations rather than to farmers directly, increasing cost of seed
Seed companies unaware of farmer demand – both preferred traits and quantities - due to limited interactions with farmers.
Interventions: To address these challenges, CIAT has developed a system-wide framework (Figure 6.3) connecting all the stakeholders into a market-led bean seed system (innovation system).
Figure 6.5 Stakeholder linkages in market-led bean seed system, Tanzania, supported by SSTP (CIAT)
1 CIAT: How to establish market-led bean seed system?

63
EVALUATION OF AGRA AFRICA’S SEED SYSTEMS PROGRAM FINAL REPORT
Outcomes: The approach has led to improved access of quality bean seed in small packs sold through agro-dealer shops and mobile suppliers; development of private bean seed companies (6); increased bean seed production and improved linkages between actors.
Steps involved 1. Identify a few varieties with preferred market traits 2. Select, build and sustain partnerships – seed companies, regulatory agencies (TOSCI), research,
district extension agents and farmers - through shared interest and commitment 3. Create demand through agro-dealer based demo plots demonstrating several technologies; field
days, radio, posters 4. Building capacity of seed companies through business training, exchange visits, soil analysis 5. Capacity building for agro-dealers in seed business management 6. Breeder seed production based on demand for certified seed 7. Link seed companies to agro-dealers 8. Innovative marketing and commercialization – small packs, well dressed seed, radio.
Setbacks 1. Limited capacity of NARS to create sufficient breeders seed to meet the demand created 2. Limited capacity of ASA to produce sufficient basic seed for seed companies. 3. Cumbersome NARS procedures for working with seed companies.
Lessons Learnt
Good facilitation is critical. Allow seed companies to take the lead in creating direct linkages with other value chain actors to create a sustainable seed value chain
Engage potential seed companies on testing technologies and scaling approaches to get their buy in and investment in legume seed business
Technical assistance on production and commercialisation is needed for emerging seed companies
Involve different value chain actors in demos and field days to build backward and forward linkages and technology scaling
Focus on farmer preferred and market traits. The market pull will create incentives to grow more resulting in higher demand for seed.
6.6 Opportunities, challenges and risks
Opportunities
The respondent seed companies believe AGRA’s support has created opportunities for their businesses to
expand and grow. They highlighted the following:
Training of seed companies through Business Development Services (BDS) has improved efficiency
of seed companies, training of out growers has contributed to increased seed production while
training farmers in agronomy has potential to increase demand of seed and technologies.
Opening up of regional markets through AGRA policy interventions can increase markets for their
seeds.
Membership of Seed Trade Associations has strengthened the capacity of seed companies to
voice concerns and influence policy making

64
EVALUATION OF AGRA AFRICA’S SEED SYSTEMS PROGRAM FINAL REPORT
Diversification of seed companies by venturing into vegetable markets and value addition through
aggregation and processing.
Enhanced capacity of seed companies as a result of AGRA’s intervention has positioned them to
take advantage of the government initiatives, for example Planting for Food and Jobs (PFJ) in
Ghana.
Challenges and risks
AGRA-supported seed companies are in early stages of development and face the following challenges:
Access to Early Generation seed (EGS): Most of the certified seed produced is accessed from the EGS
produced by public research institutes. These research institutes have limited capacity (finance, land, and
human resources) resulting in a mismatch between EGS demand and supply; and annual shortages
leftover in EGS due to low legal accountability of the relationship between EGS suppliers (research) and
demanders (seed companies). The information flow between the two simply is weak. It is difficult for
seed companies to know the quantities of EGS to produce because many of them have no production
forecast to share. Furthermore, none of the interviewed firms had a cold storage facility for EGS.
Lack of finance: The financial capacity of both small to medium private seed companies and parastatals is
very weak. As a result, most of them operate using rented facilities like warehousing and seed processing
facilities. The renting arrangement of such facilities is faced with low trust and delays in seed processing
due to queuing. Seed companies fail to acquire their own facilities because they lack capital, face high
prices due to high taxes levied on imported machinery, equipment and vehicles. Interest rates on business
loans are affecting their capacity to borrow. In terms of facilities, the parastatals are generally in a better
situation due to earlier government investment (such as ESE, Ethiopia Seed Enterprise). PASS/SSTP
facilitated linkages to finance companies such as Pearl Capital (ASIF) Njaro Capital, benefitting 20 out 114
companies supported.
Limited land ownership and access: Most of the seed companies (including the parastatals) have limited
owned land that can be used for breeding, seed production and establishment of facilities such as
warehouses and processing plants. This is associated with the overall policy weakness that land allocation
for seed business is not considered a priority.
Lack of skilled manpower and limited internal human capacity: Most of the private seed companies
particularly in Ghana lack skilled manpower in production, management and marketing of seed. This is
associated with the limited capacity of seed companies to hire professionals and also the limited
availability of skilled personnel in the labor market. Most of the seed companies reported limited ability
to hire and maintain breeders. In Ethiopia, the parastatals suffer from the same problem compounded by
high staff turnover.
Seed marketing problem: This is a challenge linked with the existing seed marketing policy and also the
limited investment in seed marketing by the seed companies themselves. In countries such as Ethiopia
the seed policy provides an incentive for seed companies to transfer all the marketing risk to the public
sector given the centralized seed distribution system. This has discouraged seed companies to invest in
seed marketing system (including investing in seed marketing professionals and seed distribution system).
Weak implementation and enforcement of policies and regulations: The government regulators
approach of resolving the problem of counterfeit agro inputs has been to tighten the rules of introducing
new inputs. In reality the reverse is true. In a competitive market where there are a few barriers to the

65
EVALUATION OF AGRA AFRICA’S SEED SYSTEMS PROGRAM FINAL REPORT
introduction of new products, firms selling adulterated products are likely to lose their customer base in
subsequent farming seasons. However the chance of adulterated products being sold is likely to increase
if the market field is interfered by regulations that place high hurdles of entering or remaining in the
market.
Biotic and abiotic risks: Drought, floods and infestation by army worms in 2015 and 2016 affected seed
production. Finding practical solutions to this risk is difficult. Pesticides can be an effective short-term
measure whereas breeding resistance can provide more protection but these can be expensive for uptake
by smallholder farmers. A more practical solution would be to integrate both traditional and modern
approaches to suit local ecological and economic conditions and fully involve farmers in finding
sustainable solutions.
Size of the seed companies: Many of the AGRA supported seed companies in West Africa and in particular
Ghana are too small to be sustainably viable. There is need to support existing agricultural business to
grow seed with the objective of mentoring the very small companies.
6.7 Conclusions
AGRA has performed well against its targets for certified seed production and variety
commercialization. It has provided grants to seed companies, trained seed companies, created
market linkages and advocated for an enabling environment by supporting formulation of seed
related policies (See Chapter 10). However, access to credit for capital investment remains a
challenge.
The supported companies reported that they have gradually increased certified seed production
and sales, crop coverage, number of employees, and have also improved their financial viability.
As a result, some of the seed companies have managed to invest in facilities like seed processors,
warehouse and transport.
AGRA strengthened the capacity of seed companies to multiply and distribute seeds, and create
demand through demonstrations, field days, dissemination of manuals and media. This has raised
awareness, visibility and demand of their products that have resulted into better uptake of
improved varieties and increased certified seed production.
Although maize has continued to be a dominant crop across all crops in AGRA supported
countries, AGRA supported seed companies have started to engage in the production of certified
seed of pulses, tubers, and cereals other than hybrid maize and with sales starting to increase
across all crops indicating increase in awareness by the farmers. These diversified crops will meet
nutrition, cash crop and market needs of various niches; thus increasing sales of seed companies.
Seed quality assurance is weak particularly with the small seed companies in Ghana supported by
AGRA. Because of the weak quality assurance, these companies’ market maize seed which is very
close to grain and the seed may not attract further farmer investment as the yield is likely to be
similar to farmers saved seed. This threatens their sustainability after the AGRA funding.

66
EVALUATION OF AGRA AFRICA’S SEED SYSTEMS PROGRAM FINAL REPORT
Lessons
AGRA grants for seed companies focused on provision of working capital and seed production.
Funding towards purchase of facilities required for seed production was minimal. This calls for a
focus on high level advocacy through existing instruments such as AU/NEPAD to develop policies
which support credit to companies to improve seed production infrastructure. Seed companies
would benefit immensely from legal and financial instruments which allow them to borrow to
support infrastructure investment.
A clear strategy of development of seed varieties for farmer traits (taste, color, cookability, aroma)
and market traits such as non-sticky aromatic rice for the Kenyan market but aromatic and sticky
for the Tanzanian consumers would have created two incentives for farmers, one purely for own
consumption and local sales and the other for markets other than local. The wider market can
drive the need for higher volumes to support the demand
AGRA could consider funding existing agricultural companies in West Africa to diversify into seed
production. This way the companies would not be totally dependent on AGRA funding, would not
require business capacity building, judicious management of finances and assets, infrastructural
support, product quality assurance, performance management and a customer focus. Otherwise,
for existing small-scale companies in Ghana, for example, intense capacity building will be
required not only in agronomy, crop protection and quality control but business as a discipline.
The market-led multi-stakeholder bean seed system developed by CIAT under SSTP is an example
of an innovation system which has built capacity and linkages across the bean seed value chain
and resulted in scaling of production in northern Tanzania. This model can be adapted for use for
other crops and contexts. Good facilitation is key to developing such successful multi-stakeholder
initiatives.
6.8 Recommendations
AGRA has performed well against its targets for certified seed production and variety commercialization.
It has provided grants to seed companies, trained seed companies, created market linkages and advocated
an enabling environment with difference across the target countries. To achieve wider and sustained
scaling the following issues need to be addressed:
Address financial constraints faced by seed companies. An innovative financing mechanism is
required to balance the provision of working capital with physical investment on facilities.
Targeted interventions required for facilitating access of seed companies to financial services
include: credit guarantees, matching grant schemes, agricultural insurance, and warehouse
finance. This could be mitigated by scouting for companies in the field of agriculture which are
already operational and profitable and giving then a minimal financial support to diversify into
seed production. Such companies will only need mentoring on seed quality assurance.
Use digitized information system to address seed production and marketing problems. There is
need to develop and maintain an effective – preferably digitized - seed information system to
trace and provide stakeholders with information on EGSs, certified seed prices, demand
estimates, crop forecasts, and feedback from farming groups and companies. An effective and
independently administered traceability seed information system would minimize the

67
EVALUATION OF AGRA AFRICA’S SEED SYSTEMS PROGRAM FINAL REPORT
opportunities for introducing fake seeds into the market and enable enforcement agencies to
identify counterfeiters across the seed value chains. An alternative which is cost effective is to
train all stakeholders in seed value chain in seed demand forecasting and working backwards to
establish volumes of foundation seed to meet the demand for seed companies. Big seed
companies do this routinely with very good outcomes.
Improve extension services to better serve farmers. AGRA support focused largely on agro-
dealers with limited involvement of extension workers and lead farmers. However, agro-dealers
do not often have enough time to provide extension messages to farmers. As a result, farmers
access seed and other inputs from agro-dealers but have little knowledge on how to use them.
There is need for AGRA and other in this space to collectively engage in high level advocacy
through AU/NEPAD to encourage governments to operationalise extension services: this could
significantly enhance uptake of recommended farming practices. This includes integrating local
and modern approaches to suit local ecological and economic conditions to address climate and
pest risks. The use of digital extension methods via cell phones could also be explored to increase
reach and coverage, especially in the face of dwindling financial resources for public extension
services delivery. AGRA should initiate high level advocacy for governments to commit teams of
extension staff to support seed companies. The extension staff should receive training mentorship
from AGRA and be provided with basic extension materials and ideally transport.
Explore different seed production models. PASS focus was on support for small- and medium-
sized private companies with a focus on certified seed for maize, other staples and legumes. Other
models supported were: parastatals, research institutions, university, farmer organizations and
NGOs. Informal seed systems play an important role in food security and biodiversity of
smallholder farmers in Africa – along with formal seed systems (Appendix 6). AGRA should
consider how its programs and policies integrate with informal seed systems to secure resilient
and accessible seed systems.
Pilot market-led multi-stakeholder seed systems in different AGRA countries. The innovation
model developed by CIAT under SSTP is an example of an innovation system which has built
capacity and linkages across the bean seed value chain and resulted in scaling of production in
northern Tanzania. Effective facilitation is required for success. Similar approaches and models
should be adapted and tested for other crops and contexts.
What model of supporting seed companies should AGRA adopt? What financing mechanisms would
lead to viability of AGRA-supporting seed companies?
AGRA has played a critical role in supporting small to medium size seed companies in the target countries. The feedback from these companies were extremely positive: ”this company will not be where it is without AGRA intervention”. In Tanzania and Uganda, more than half of companies indicated profitability, although they were unwilling to share financial figures. In Ghana, cassava, groundnuts and cowpea - all orphan crops - are gaining commercial profile at the marketplace and proving extremely resilient food security and farmer livelihood crops. Going forward, we propose several funding models for consideration:
In Eastern Africa, co-financing the development of infrastructure such as irrigation and cold storage for those companies which are already profitable will fast-track their growth. This will

68
EVALUATION OF AGRA AFRICA’S SEED SYSTEMS PROGRAM FINAL REPORT
involve raising capital through cost sharing with AGRA or other development partner to procure machinery or irrigation system which is approved by AGRA, with the AGRA component paid directly to the supplier.
Support of in-country seed quality control through capacity building of seed regulatory outfits/agencies to be able to enforce seed quality regulations. This should move side by side with support for in-house company quality assurance mechanisms to guarantee high quality seed so that farmers can visualize the difference between planting grain and planting certified seed. A one-off seed quality consultancy with seed money to help fill existing gaps can deliver this.
In West Africa (such as Ghana) the calibre of seed companies is low. A support system that will invest in an existing agricultural inputs (fertilizers and pesticides) businesses to diversify into seed business will give faster results so long as the businesses have access to land. These are already business savvy and will not need training in doing business. Secondly, they already have some bank connections and so they could borrow to support their business. This will make AGRA seed money go a long way to support seed business growth.
Use of innovative financing mechanism such as provision of bank guarantees to ease access to
loans to seed companies for purchase of required facilities from commercial banks. AGRA should
only engage if they already know the infrastructural gaps, where the infrastructure could be
sourced and at what price, in order to deal with integrity issues in the investments.

69
EVALUATION OF AGRA AFRICA’S SEED SYSTEMS PROGRAM FINAL REPORT
7 Agro-dealer Development for Technology Distribution
7.1 Overview
The goal of the PASS Agro-dealer Development Program (ADP), the fourth PASS sub-program, was to
improve the functioning of input markets by increasing access to farm inputs among poor smallholder
farmers through the development of agro-dealer networks. Efficiently functioning agro-dealer retail and
distribution systems are considered key elements in the flow of improved crop varieties to farmers. Hence,
strengthening ADP initiatives is a key function in both PASS and AGRA’s wider initiatives. The main
components of ADP were: Identifying service providers; Establishing grant support; Overseeing credit
guarantee and training, and; Linking agro-dealers to seed companies and to farmers.
The aim was to: i) increase the capacity of service delivery, ii) increase financial leveraging, iii) create
awareness and demand, and vi) strengthen institutions.
By 2017, ADP had partnered with 18 service providers including three international and 11 local Non-
Governmental Organisations, two financial institutions and one government institution. The service
providers - wholesale and retail businesses dealing in farm inputs - received 25 grants amounting to
$35,793,417 in 14 African countries. Most of these grants (19 grants) were given in PASS I (2007-2012)
with only 6 given in PASS II. ADP trained 20,038 agro-dealers in business and technical knowledge. This
represented 222% achievement of its target of 9,000 agro-dealers envisaged in the 2009 Business Plan.
By end of 2017, agro-dealers had established 7,679 demonstration plots and organized 4,264 field days
across the 15 countries in which it works. The net result of these activities has been an improvement in
volumes of seeds and fertilizers sold by agro-dealers, which almost quadrupled from 386,000 MT in 2007
to 1,525,689 MT in 2017. About 5,404 agro-dealers accessed loans amounting to $2,654,379 (PASS
reports).
7.2 Methods
The Evaluation used both primary and secondary data to assess the impact and viability of ADP. Primary
data were sourced from the household survey in five countries and a survey of 118 wholesale and retail
agro-dealers in Tanzania, Uganda and Ghana (Table 7.1). In Uganda, agro-dealer data collection was in 3
districts: Lira, Mbale and Kampala. In Tanzania it was 5 districts: Babati, Mbeya, Namtumbo, Ruvuma and
Songea. In Ghana it was also 5 districts: Ejura-Sekyedumasi, Kumasi Metropolis, Kumbungu, Tamale
Metropolis and Tolon. All the surveyed agro-dealers had participated in ADP. In Mali and Ethiopia key
informant interviews were conducted with agro-dealers. Grant countries under ADP I included Tanzania,
Mali, Uganda Ethiopia.
Only two grants were given to surveyed countries under PASS II: Ethiopia and Tanzania. In Ethiopia, one
grant was given to a consultancy company to provide capacity building for cooperatives that are engaged
in seed distribution (not marketing as they only distribute seed based on the set procedure of price
setting). Ethiopia has not had agro-dealers because seed distribution is done centrally through
cooperatives. In recent years, following the piloting of direct seed marketing (DSM), the notion of seed
agents is becoming an option. However, the DSM is still under piloting stage. The seed agents act as
distributors of seed on behalf of the seed producers participating in the piloting of DSM.

70
EVALUATION OF AGRA AFRICA’S SEED SYSTEMS PROGRAM FINAL REPORT
Table 7.1 PASS Evaluation sampled agro-dealers
Type of agro-dealer business
Wholesale Retail Total
Tanzania 7 32 39
Uganda 32 16 48
Ghana 15 16 31
Total 54 64 118
Source: Evaluation survey data
Evaluation question: Has the AGRA approach of agro-dealer development resulted in improved access
and uptake of improved inputs by farmers in target areas?
7.2 Farmer access to improved inputs
AGRA investment in agro-dealer development aimed at improving access to and uptake of improved
inputs by farmers in target areas. Distance from household to agro-dealer is a key indicator of access to
under PASS/SSTP.
In the Evaluation Household survey farmers estimated the distances to their nearest supplier of fertiliser,
seeds and agrochemicals; and also whether the distances had changed over the past 5 years (Table 7.2).
Ethiopia had the shortest estimated distances for all agro-inputs (less than 4km); followed by Uganda
(average of 5km); Mali and Ghana (average of 7km). Tanzania had the longest distances: 10km for fertiliser
and agrochemicals and 16.6km for seeds. Findings suggest that targeted regions in 4 of the 5 countries
surveyed have met the 10km maximum distance target set by AGRA; while Ethiopia and Uganda have met
the 6km target. Only in Tanzania are average distances outside both targets.
On changes in distance to the nearest agro-input supplier, less than 25 percent of households surveyed in
Ethiopia, Ghana, Mali and Tanzania reported that distances have reduced over the past 5 years; whilst
only 5 percent reported this in Uganda. Sources of agro-inputs have not changed significantly in the
surveyed areas over the past 5 years of PASS II and SSTP operations. This is in contrast to the more
significant reductions in distances reported at the end of PASS Phase I.

71
EVALUATION OF AGRA AFRICA’S SEED SYSTEMS PROGRAM FINAL REPORT
Table 7.2 Distance to nearest agro-input supplier (km) and change over the past 5 years (% households)
Country Input Average distance to
input source (km)
Households where distance has
reduced over past 5 years (%)
Ethiopia
Fertilizer 3.10 16
Seeds 2.73 19
Agrochemicals 3.87 15
Ghana
Fertilizer 7.02 22
Seeds 5.84 22
Agrochemicals 8.04 21
Mali
Fertilizer 6.46 24
Seeds 8.89 19
Agrochemicals 6.39 22
Uganda
Fertilizer 4.75 3
Seeds 5.57 1
Agrochemicals 5.11 0
Tanzania
Fertilizer 10.48 19
Seeds 16.59 19
Agrochemicals 10.44 19
Source: PASS/SSTP Evaluation household survey
7.3 Source of farm inputs PASS focused on supporting agro-dealers for distribution of improved seed, including that of AGRA-
supported varieties, along with seed companies, and farmer organisations for particular crops (e.g.
cassava) and contexts (e.g. Ethiopia). Data from the Evaluation Household Survey shows the different
sources which households have used to obtain seed of AGRA-supported varieties (Table 7.3). The main
finding is that to date few farmers are accessing their AGRA-supported varieties through agro-dealers:
those who do are mostly in Uganda and Tanzania: of the countries surveyed, these have the longest
established agro-dealer programs. Seed companies are an important source of AGRA varieties for farmers
in Ethiopia and Mali, along with farmer associations (Ethiopia). Other farmers remain an important source
- indicating the continuing reliance of smallholder farmers on informal sources for improved and non-
improved seed.
In Ethiopia, farmers sourced most teff (87% of households) and some wheat seeds (33%) from seed
companies; whilst maize (88%) and wheat (62%) seeds were mainly obtained through farmer associations.
Very few farmers used agro-dealers as these have only recently been promoted in Ethiopia. Households
in villages not supported by AGRA interventions sourced most of their maize (92%) and wheat (74%) seeds
from farmer associations, whilst teff seeds were mainly from other farmers. In Ghana, farmers sourced
seed of AGRA varieties of maize, rice and cassava from other farmers, their own harvest or NGOs. Only 6
percent got them directly from seed companies and 13 percent from agro-dealers (mainly maize). The
most common sources of the seed were recycled from their own harvest of from other farmers. In Mali,
few farmers have sourced seed of AGRA-varieties from seed companies (27%) or agro-dealers (4%). NGOs
are the most common source of maize, sorghum and cowpea seed). Agro-dealers were the most common
source of AGRA varieties of maize and beans for farmers in Uganda (33 and 30 percent respectively).
Similar numbers bought their seed from the market. In Tanzania, agro-dealers were the most important
source seed for AGRA-supported varieties – for 43% farmers in PASS/SSTP intervention areas and 46% in
non-intervention areas – demonstrating the reach of agro- dealers in the country. Other farmers were the

72
EVALUATION OF AGRA AFRICA’S SEED SYSTEMS PROGRAM FINAL REPORT
second most important source of seed for AGRA varieties – for 29% and 42% of AGRA intervention and
control farmers respectively.
Table 7.3 Sources of seed for AGRA varieties by households (% households)
Source: PASS/SSTP Evaluation household survey. Note: Includes multiple responses
Country House-
hold
category
Crop Source of seed for AGRA varieties by households (%)
Own
harvest
Other
farmers
Agro-
dealers
NGOs Market Seed
company
Farmer
Associations
Ethiopia
AGRA Maize 0.9 2 4 3 0 2 88
Teff 2 5 0 3 0 87 3
Wheat 2 1 0 1 0 33 62
Any crop 4 7 2 3 0 41 50
Control Maize 2 4 0.8 0 0 0.8 92
Teff 14 44 0 0 6 14 22
Wheat 7 14 0 2 0 5 74
Any crop 8 20 0.7 0.7 2 5 80
Ghana
AGRA Maize 18 26 15 8 3 6 0.9
Rice 51 0 8 26 4 8 13
Cassava 23 18 0 9 0 0 9
All crops 32 20 13 14 3 6 15
Control Maize 31 38 9 12 6 5 0
Rice 67 0 13 11 22 7 4
Cassava 0 0 0 100 0 0 0
All crops 48 26 12 14 5 5 2
Mali
AGRA Maize 0 13 3 61 0 24 0
Cowpea 0 28 4 39 4 15 4
Sorghum 0 12 2 61 1 23 1
Any crop 0 20 4 58 2 27 3
Control Maize 0 25 12 12 12 50 0
Cowpea 9 45 0 23 9 14 5
Sorghum 0 36 0 27 0.9 27 0
Any crop 5 40 2 20 10 25 2
Uganda
AGRA Maize 20 18 33 9 30 5 3
Beans 12 21 30 9 21 7 5
All crops 21 21 34 10 31 7 5
Control Maize 6 26 32 8 32 2 4
Beans 12 22 20 6 25 12 2
All crops 11 31 31 8 33 8 4
Tanzania AGRA Maize 5 17 47 4 5 15 3
Rice 18 50 18 3 0 12 3
Beans 4 25 21 8 2 8 6
Cassava 0 44 6 6 0 0 6
All crops 7 29 43 6 5 16 4
Control Maize 2 27 49 6 4 9 1
Rice 9 41 27 5 0 0 0
Beans 10 35 20 2 20 7 5
Cassava 13 52 0 13 0 0 9
All crops 7 42 46 8 6 9 3

73
EVALUATION OF AGRA AFRICA’S SEED SYSTEMS PROGRAM FINAL REPORT
Findings on uptake of improved inputs by smallholder farmers are presented in Chapter 8.
7.4 Demand creation activities To disseminate information on improved inputs and create demand, agro-dealers collaborated with seed
suppliers, public extension advisory services and selected local farmers to establish demonstrations and
organization of field days. These demonstration farms were managed by farmers selected by agro-dealers
with seed companies supporting agro-dealers with inputs for the demonstrations.
PASS program cumulatively funded over 500,000 on-farm demos and hosted about 5,000 farmer field
days (Close-out narrative, 2017). Uganda and Tanzania were two of the countries hosting large numbers
of demonstrations. In Ghana, agro-dealers were minimally involved in demos. However, the sustainability
of agro-dealer-led demonstrations as an avenue for information dissemination seems tied to project
funding as seen in the sharp decline in number of agro-dealers establishing demos in Tanzania and Uganda
in 2018 (Table 7.4).
Table 7.4 Agro-dealer led crop demonstrations by surveyed agrodealers, 2013-2018
Source: Evaluation Agro-dealer survey (2018)
A further challenge is farmer preferences for information on new technologies, including seeds (Table
7.5). Farmers prefer to source information from extension workers or other farmers, NGOs (Mali) or
radio/TV (Ghana and Uganda). Less than 10 percent of farmers surveyed mentioned agrodealers as their
preferred source of information. Similarly, few farmers prefer demos and field days as the main source of
learning. This has implications for the strategy of using agrodealers to promote new varieties: a stronger
partnership with extension workers or NGOs may be needed to improve their acceptability by farmers.
Table 7.5 Farmer preferred sources of information about new technologies
Country Household category
Percentage of farmers who mentioned this source as their preferred source
Other farmer
Exten-sion service
Agro-dealer
NGO Radio/ TV
Seed company
Demo Field day
Learning plot
Phone/ ICT
Ghana AGRA 26 40 4 4 20 0 2 1 0 0
Control 29 39 4 4 18 0 5 1 0.4 0
Ethiopia AGRA 8 69 0 2 0 14 5 0 0 0
Control 22 66 1 0 0 5 4 0 0 0
Mali AGRA 24 20 4 21 7 7 4 7 3 2
Control 14 26 1 16 9 6 15 7 4 3
Tanzania AGRA 23 42 8 0 3 2 6 1 8 2
Control 21 41 5 1 9 2 7 1 9 3
Uganda AGRA 25 16 8 5 30 2 4 0 6 0
Control 21 10 10 5 34 0 3 0 10 1
Source: Evaluation Household survey (2018)
Number of agro-dealer-led crop demonstration plots by year
Country 2013 2014 2015 2016 2017 2018
Uganda 2 5 9 11 15 5
Tanzania - - 6 7 10 0

74
EVALUATION OF AGRA AFRICA’S SEED SYSTEMS PROGRAM FINAL REPORT
One of the strategic activities in PASS was to develop and disseminate information and knowledge on
improved seed. This knowledge was mainly developed in the other sub-program components and
packaged into information that could guide farmers in adopting improved farming technologies. ADP
provided the opportunity to facilitate input supply and technology transfer (AGRA 2014-Final evaluation
of PASS).
Following the agro-dealer trainings and their participation in demand creation activities described above,
the agro-dealers surveyed reported increased demand for information on improved varieties. In the case
of Uganda, Ghana and Tanzania, buyers of improved seed sought information mainly on maize seed. The
information included availability of new certified varieties, days to maturity and price of seed,
susceptibility to pests and diseases and suitable certified varieties for the area. Figure 7.1 illustrates
information demanded on crop seeds in Uganda. Most of the agro-dealers reported that information
sought on crop seeds was provided through input demonstration – particularly in Uganda and Tanzania.
As noted above, participation of agro-dealers in demos was minimal in Ghana.
Figure 7.1: Information sought from agro-dealers by buyers in Uganda
Source: Evaluation Agro-dealer Survey (2018)
Evaluation question: Are agro dealers that were supported by AGRA still functional, financially viable
and selling viable amounts of seed to smallholder farmers?
7.5 Agro-dealer capacity
PASS made a very considerable investment in building capacity of agro-dealers in targeted countries. Tanzania had the highest number of agro-dealers trained of the countries where ADP was implemented (Figure 7.2). Requests from governments, notably Malawi, Kenya and Tanzania, for additional support for agro-dealers both for implementing governments’ inputs subsidy schemes and to cover larger geographical areas than originally envisaged contributed to the high number of agro-dealers trained in those countries (PASS Phase 1 final report, 2013).
0
2
4
6
8
10
12
14
16
18
20
Maize (n=67) Rice (=30) Beans (n=29)
Availability of new certifiedvarieties
Suitable certified varieties forthe area
Price of seed
Days to maturity
Rainfall requirement

75
EVALUATION OF AGRA AFRICA’S SEED SYSTEMS PROGRAM FINAL REPORT
Figure 7.2 Number of agro-dealers trained by country (2007-2017)
Source: Compiled from AGRA Annual report, 2017
Evaluation survey data of agro-dealers from Uganda, Ghana and Tanzania, indicates the three main types
of training attended in the last 12 months were: business management, seed/fertilizer usage and fertilizer
handling (Figure 7.3). Business management training was provided by several actors including AGRA
consultants, national Ministries of Agriculture, seed companies, NGOs, National Agro-dealer Development
Associations (e.g. UNADA in Uganda) and research institutes (e.g. Tropical Pesticide Research Institute
(TPRI) in Tanzania). As a result of the training, the agro-dealers generally reported they were able to
manage their businesses better, have recorded increased sales, and now have the ability to offer better
advice to customers.
Figure 7.3 Type of training received by agro-dealers
Source: Evaluation Agro-dealer Survey data (2018)
0
5
10
15
20
25
Uganda Ghana Tanzania
Business management Seed/Fertilizer usage Fertilizer handling

76
EVALUATION OF AGRA AFRICA’S SEED SYSTEMS PROGRAM FINAL REPORT
Access to capital
Under PASS Phase II only 27 agro-dealers benefitted from matching grants (Close-out narrative, 2017).
Despite the huge strides in training, access to credit remained a significant challenge among agro-dealers.
Only 14% of trained agro-dealers accessed credit, mainly from the AGRA Credit guarantee fund to support
them (Table 7.6). Tanzania, Kenya and Uganda recorded the highest number of agro-dealers accessing
credit during implementation of PASS (over 5,000 per country)) while Zambia had the lowest (430).
Relative to numbers trained, Kenya and Uganda had the highest proportion of agro-dealers accessing
loans (31%) whilst Ghana and Malawi had the lowest (2% and 4% respectively).
The limited access to credit by agro-dealers has persisted over the years and is confirmed by the
Evaluation Survey data:
In Uganda, 28% of surveyed agro-dealers in Uganda accessed credit averaging USD1176
In Ghana, 29% of agro-dealers had accessed credit with a mean value of USD1556
In Tanzania, 49% of agro-dealers had obtained credit with a mean value of USD3195.
The main purpose of accessing credit was to stock new varieties and increase stock levels. The average
amount of credit accessed in Uganda and Ghana is not significantly different from the mean initial
investment for the surveyed agro-dealers: USD1262. This implies that credit is an important element in
acquiring start-up capital for an agro-dealership business.
As envisioned in PASS Phase 1, linkages to seed suppliers have enabled increased input credit in several
countries. Seventy-one percent of the surveyed agro-dealers in Ghana and 62% of agro-dealers in
Tanzania had a marketing arrangement with suppliers in the form of input credit. In Uganda, 30 percent
of agro-dealers surveyed accessed credit from suppliers. Other marketing arrangements with seed
suppliers, particularly transport arrangements, were more common (50%). Although access to credit for
agro-dealers is still low, linkages to seed suppliers has enhanced access to input credit.
7.6 Impact of Agro-dealer Business Activities
Operations and size
There has been a significant increase in the number of agro-dealer businesses in PASS countries over the
last 10 years. Their increasing capacity and viability is indicated by End of Program evaluation data on the
number of businesses which are now operating all year round rather than merely seasonal operations and
the number of employees (see Table 7.7). In Tanzania, for example, 92% of surveyed agro-dealers
operated all year round whilst the remaining 8% were seasonal (i.e., operated during peak cropping
seasons only). In Ghana 65% were year-round operations and for Uganda the figure was 58%.
In terms of business size, most agro-dealerships tend to be small, employing 1-3 people. However, in
Tanzania and Ghana, 30% and 40% respectively of agro-dealer businesses interviewed are employing 7 or
more staff on an all-year round basis. These findings indicate that in countries where there have been
long-term ADP investment, growing numbers of agro-dealer businesses are maturing as viable operations.

77
EVALUATION OF AGRA AFRICA’S SEED SYSTEMS PROGRAM FINAL REPORT
Table 7.7 Nature of operations and staffing levels of agro-dealer businesses
Nature of operations
Agro-dealers staffing levels
1-3people 4-6people 7 & above Total Percent
Ghana Seasonal sales 9 0 2 11 35%
All year 11 1 8 20 65%
Tanzania Seasonal sales 9 0 0 9 8%
All year 33 37 28 98 92%
Uganda Seasonal sales 15 4 0 19 42%
All year 21 4 1 26 58%
Total 98 46 39 183 _
Source: Evaluation Agro-dealer Survey data
Agro-dealer reach
Most agro-dealers in the survey have attracted buyers from a wide geographical area. For instance, agro-
dealers reported that the average maximum distance (radius) they draw customers for improved seed
and other inputs was 46km for Ghana, 50km for Uganda and 34km in Tanzania. The average number of
farmers buying improved seed served in the main season per agro-dealer was found to be 513 in Ghana,
127 in Uganda and 1,073 in Tanzania. The distances covered and the number of customers served indicate
the highest market concentration to be in Tanzania and the lowest in Uganda. This reflects different levels
of market maturity across the countries.
Seed sales
Since the establishment of PASS in 2007, over 600,000 MT of high-quality, high-yielding seeds have been
produced and distributed to an estimated 15 million farmers through a network of about 20,000 private,
village-based agro-dealers (AGRA annual report, 2017). These agro-dealers sell seed supplied from seed
companies that are supported by PASS, as well as seed from national and multinational companies.
Maize was stocked by almost all agro-dealers who participated in the survey and took up the largest share
(in terms of volume) of crop seed sold in 2017 (see 7.8 Uganda). This was followed by rice seed and bean
seed sales respectively. In Ghana, the mean volume of maize seed sold by agro-dealers surveyed was
41,812kgs in 2017.
Table 7.8 Crop seed sales by sampled agro-dealers in 2017 (Uganda)
Sample (n) Sum (Kg) Mean (Kg)
Volume of Maize Sold 47 222580 4736
Volume of Rice Sold 17 181550 10679
Volume of Beans Sold 20 153600 7680
Source: Evaluation Agro-dealer Survey (2018)
Agro-dealers also sold seed through subsidy programs. For example, between 18-35% of agro-dealers in
the 3 countries had participated in a seed subsidy program supported by the government. However, there
were a number of challenges in participating in subsidy program. In Uganda, a key challenge was the late
supply of coupons, which often was inadequate. In addition, for some agro-dealers, the coupons led to

78
EVALUATION OF AGRA AFRICA’S SEED SYSTEMS PROGRAM FINAL REPORT
reduced income since transportation of the seed to branches was not catered for by the value of the
coupon. In Tanzania, agro-dealers and seed companies who participated in the agricultural input subsidy
program in 2015 have suffered serious financial losses through continuing non-repayment by the
government and a number of those interviewed indicated that it was their PASS grant that had enabled
them to keep trading. In Ghana, seed companies and agro-dealers involved in the government’s Planting
for Food and Jobs (PFJ) flagship program have suffered long delays in payment but are more confident of
being repaid and some see an opportunity for scaling of AGRA varieties through PFJ.
Hub Agro-dealer and Franchising model
The hub agro-dealer and franchising model has been promoted by ADP to build reach and sustainability.
(Box 5). The model was developed by African Fertilizer and Agribusiness Partnership (AFAP) in partnership
with the Agriculture Market Development Trust (AGMARK), a Service Provider (SP) in PASS Phase 1. The
hub agro-dealers become the focal point for input suppliers introducing products onto the market, like
newly- released crop varieties. Sorghum Pioneer Agencies, Kenya, is a notable success story (Box 5).
Box 5: Hub-Agro-dealer and Franchising Model
Photo credit: K. Rogers
Sorghum Pioneers Agencies (SPA) was started by Ms Elizabeth Nkatha as a tailoring shop in Mukothima
market, Tharaka Nthi County, Kenya. In 2009, Ms Nkatha converted it into an agro-shop, stocking high
quality seeds, fertilizer and other farm inputs, through EUCORD’s East Africa Sorghum Value Chain
Development Project which linked her with input suppliers and financiers through input loans and
finances. These addressed her operational capital challenges and helped her enhance her relationship
with farmers by providing them with seed loans. SPA now has machinery, including a ploughing tractor,
rippers and threshing machines, and over 20 cereal aggregation centres. AGRA’s support to SPA
through Strengthening Agricultural Input and Output Markets in Africa (SAIOMA) has enabled it to
provide holistic services to the farmer at the rural level by supplying improved inputs and also buying
back their produce. This required strengthening SPA’s link to input supply companies and retail agro-
dealer outlets who serve as aggregation points. Training on best practices enhanced its business skills
not only to sell products but also to be able to offer demonstrations and training on how and when to
use seed, fertilizer and agro-chemicals.

79
EVALUATION OF AGRA AFRICA’S SEED SYSTEMS PROGRAM FINAL REPORT
Achievements
SPA enables farmers to access agricultural inputs through a network of agro-dealers who also
serve as cereal aggregation points.
It offers loan credit to farmers for ploughing, threshing, and education (school fees to many
children) to enable farmers to focus on farming activities.
It markets farmers’ produce by buying from smallholder farmers, bulking and transporting to
processors.
It has added credibility to SPA and built trust relations with suppliers.
In 2011 the Government of Kenya and FAO recognized the efforts made by SPA. In 2012 it was
ranked the BEST Supplier of sorghum tonnage to East Africa Breweries Limited and also as the
most improved agency.
Lessons Learnt
Farmers were encouraged to embrace collective action in farming, where training, seeds and
other inputs were offered procured and offered collectively, giving them bargaining power.
Development partners were supportive in providing grants to build capacity of SPA and its
network of farmers, linking it to other farmers, identifying best machine and equipment
(tractor, thresher, etc), helping it secure a bank loan.
Engaging in farming has helped SPA to understand the dynamics affecting farmers and to use
that rapport to effectively mobilise farmers to adopt farming innovations.
Challenges and opportunities
As with other crops, sorghum production and marketing policies affect consumption, markets
and contribution to rural economies and overall growth: notably the reintroduction of a 50%
excise duty on beer from sorghum, cassava and millet). This fiscal policy instrument led to price
increases of beer and related products and depressed demand for sorghum as an input in the
brewing process.
To address this, SPA was assisted to implement strategies to increase consumption at
household and community level such as schools, hospitals, and special diets for diabetics.
Engaging with various development partners has leveraged its social enterprise position in the
community.

80
EVALUATION OF AGRA AFRICA’S SEED SYSTEMS PROGRAM FINAL REPORT
Partnering with governments in input support programmes In countries where PASS has made a long-term investment in ADP, agro-dealer businesses are maturing as viable operations. The Zambia electronic Farmer Input Support Programme (e-FISP) is an example of high potential for strengthening agro-dealer businesses and employment creation (Box 6).
7.7 Challenges and opportunities for Agro-dealer development
Challenges
The most important constraint faced in running seed business by agro-dealers in evaluation countries was
found to be low or seasonal demand by farmers as illustrated in Figure 7.4. This calls for more concerted
efforts in supporting demand-creation activities and technologies which complement improved seed, as
well as integration with other business opportunities such as produce aggregation during the off-season.
Box 6 Agro-dealers leveraging business opportunities with electronic-Farmer Input Support Programme (e-FISP)
The Zambian Government fully rolled out the electronic-Farmer Input Support Programme (e-FISP) in the 2017/18 farming season, benefitting about 900,000 farmers. The e-FISP is touted to be a much more efficient and cost- effective means of providing input subsidies to farmers, addressing most challenges experienced in the traditional input subsidy programs implemented in Zambia (from 2002/2003) and cognizant of lessons from other countries in SSA (Chishimba, 2018 and Kasoma, 2018). The e-FISP offers an opportunity to encourage growth of agro-dealers at both local and national levels, bringing in investments and job creation in rural areas. For instance, It is forecast that e-FISPP will create around 3,000 new agro-dealer jobs in marketing and sales, storage, transportation & logistics (IAPRI, 2019). The e-voucher system has promoted competition among agro-dealers and input suppliers, providing them an incentive to improve their services. It has also made the input sector attractive to private investors, thus promoting private sector-led input distribution and marketing (Chikobola & Tembo, 2018). However, the Zambian government and partners should address barriers to growth in agro-dealership, notably poor local infrastructure, limited access to finances and delayed payments of vouchers which affected business cash flow and operations. It is envisaged that increased private sector participation in government subsidy programs will reduce government expenditure and public service delivery.

81
EVALUATION OF AGRA AFRICA’S SEED SYSTEMS PROGRAM FINAL REPORT
Figure 7.4 Main constraints in running seed businesses reported by surveyed agro-dealers
Source: Evaluation Agro-dealer Survey
In Ghana, the most important constraint faced in running seed business by agro-dealers was low season
demand by farmers (33%), high product prices (23%) and inadequate knowledge of seed varieties (16%).
In Tanzania, the most important constraints reported were inadequate capital (51%), high transportation
costs (8%) and low profit margins (8%).
Opportunities
Opportunities to take agro-dealership to a higher level in the seed supply chain:
Seed companies should strengthen linkages with the pool of trained and certified agro-dealers
through market and demand creation arrangements to enhance penetration of new technologies
and minimize the marketing of counterfeit seed.
Offer support services to farmers in terms of knowledge dissemination and development of agro-
machinery hiring services during the pre-production, production and post-harvest management
of grains.
In the case of Uganda, Tanzania, and Ghana, the survey identified specifc opportunities:
Uganda - the main opportunity lies in expanding areas of operation by opening more outlets to
meet the demand in high season and undertake more demand-creation activities to enhance
business relations with customers and in doing so, increase the customer base.
Tanzania- strengthening of the agro-dealer association to enhance access to capital for its
members and undertake bulk procurement and transportation of inputs to cut the costs thereby
increasing profit margins.
Ghana- committed participation in demand creation activities to increase demand for inputs and
also offer private extension/advisory services to farmers, which builds networks with customers
and thus driving more sales.

82
EVALUATION OF AGRA AFRICA’S SEED SYSTEMS PROGRAM FINAL REPORT
7.8 Conclusions and lessons
ADP succeeded in establishing and growing agro-dealer businesses in Africa. Its strength was training and certification of a pool of agro-dealers, linking them to input suppliers and credit and creating agrodealer institutions that would lobby for an enabling business environment.
In most countries where ADP was implemented, access to inputs has greatly improved with the targeted 10km maximum distance being achieved, owing to the robust network of agrodealers trained and certified.
Despite the perceived importance in introducing agricultural technologies, the traditional demand creation activities (demo plots and field days) have not gained much traction for agro-dealers beyond program funding.
Maize seed dominates the business of agro-dealers. However, there is an urgent need to enhance uptake of improved varieties of other crops such as rice, beans, and cowpeas through agro-dealers to enhance food security crops and incomes, particularly in the face of climate change and growing world population.
Despite the huge strides in training in business management and establishment of an agricultural credit fund, access to credit remains a significant challenge among agro-dealers. However, linkages to seed suppliers has enhanced access to commercial credit for hub agro-dealers and extended rural outreach to the spokes, often at no additional cost.
Several agrodealer associations were formed and existing ones strengthened as a collective to advocate for an enabling business environment from the grassroots to national level: however, most have low capacity and are ineffective.
7.9 Recommendations
Agrodealers can play a key role in collecting big data which will be important in designing tailored products and services - be it farmer educational content, insurance and financial products or services. There is need to support agro-dealers by offering incentives to play multiple roles such as technology transfer, knowledge dissemination and feedback loop to suppliers.
Innovative financing is needed for agro-dealer businesses to grow and seize emerging opportunities in agriculture and rural areas, beyond the sale of farm inputs. These funds are more critical for start-up and growth stage agro-dealers.
Build the capacity of agro-dealers and their associations on customer database management to forecast demand for inputs in order to minimize the challenge of low seasonal demand.
Strengthen agro-dealer associations to act as entry points in training and certification, bulk procurement of inputs and implementation of seed subsidy schemes.
AGRA should continue to strengthen linkages between input supply companies, financial institutions and market agencies with hub agro-dealers that have creditworthiness as a middleman for onward linkages with retail agro-dealer outlets, as well as facilitate them to improve farmers’ access to inputs and complimentary services.

83
EVALUATION OF AGRA AFRICA’S SEED SYSTEMS PROGRAM FINAL REPORT
What model of agro-dealership should AGRA adopt? What financing mechanisms would lead to
viability of agro-dealers in Africa?
AGRA should continue to link input supply companies with hub agro-dealers that have creditworthiness
as the link for onward linkages with retail agro-dealer outlets, as well as facilitating them to broker deals
for profit-sharing and credit arrangement to improve accessibility of inputs. Areas where intervention is
needed include:
Strengthening rural agro-dealers to reduce the distances that many smallholder farmers in Sub-
Saharan Africa continue to travel to procure inputs, which are often only available in large, costly
and unmanageable bags.
Strengthening credibility of business by building trust of suppliers to farmers which enables hub
agro-dealers to buy into the knowledge part of the business and not just selling seeds and
fertilizers.
Branding agro-dealers in the form of signage and training to be considered direct distributors that
comes with benefits such as access to credit.

84
EVALUATION OF AGRA AFRICA’S SEED SYSTEMS PROGRAM FINAL REPORT
8 PASS Impact at Farmer Level
Evaluation question: To what extent did AGRA work increase the use of improved seeds and
technologies by smallholder farmers at scale in the target countries, and how did this impact change of
yield levels in the respective countries?
Assess indicator progress towards achieving targets for the following indicators (for SSTP): o Poverty index. o Gross margins per hectare o Farmers applying improved technologies and the resultant area under improved technologies
8.1 Approach To assess achievement of program outputs, outcomes and impacts at household level, the evaluation
combined data from secondary sources, including PASS and SSTP reports, international datasets and
official reports, with primary data collection involving 2200 households in 5 countries – Ethiopia, Ghana,
Mali, Tanzania, Uganda.
8.2 Poverty Index The Poverty Index is defined in SSTP Performance Indicator Reference Sheets (PIRS) as the percent of
people living on less than $1.25/day in the focus areas, with data sourced through analysis of LSMS data.
The World Bank PovcalNet Poverty Index uses poverty estimates computed from nationally representative
household sample surveys. Data from the PovcalNet 2015/16 Poverty Index for AGRA countries are shown
in Figure 8.1. The index shows that Malawi, Zambia and Mozambique had the highest proportions of their
population living on less than US$1.25 a day. Only Ghana had less than 10% of her population living on
less than US$1.25. However, it is noted that there are multiple factors driving income and poverty levels
across the countries so Poverty Index levels cannot be attributed to AGRA interventions.
Figure 8.1 Population living on less than US$1.25 per day 2016 (%)
Source: World Bank PovcalNet
0 5 10 15 20 25 30 35 40 45 50
Burkina Faso
Ethiopia
Ghana
Kenya
Malawi
Mali
Mozambique
Niger
Nigeria
Rwanda
Tanzania
Uganda
Zambia

85
EVALUATION OF AGRA AFRICA’S SEED SYSTEMS PROGRAM FINAL REPORT
The Human Development Index (HDI) measures a country’s life expectancy, education and per capita income. The HDI for selected AGRA countries is shown in Figure 8.2 below. This shows a steady improvement in Human Development indicators 2007-2017. This is a positive development in AGRA program countries. However, as with the Poverty Index, there are multiple factors driving the HDI: therefore it is not possible to attribute Human Development Index levels to PASS/SSTP interventions. Figure 8.2 Human Development Index for AGRA countries 2007-2017
Source: Calculated from http://hdr.undp.org/en/composite/HDI
8.3 Yields of key food crops
National yields
National maize yields for the 5 AGRA Evaluation focus countries for 2008-2017 are shown in Figure 8.3. Mean yields have fluctuated over the decade, however the overall trend is increasing yields for all countries. The greatest improvement has been achieved by Ethiopia which has secured a national average of over 3.7 MT/ha over the past 3 years. Uganda, Mali and Ghana have national mean yields of around 2-2.5 MT/ha. Tanzania yields have lagged behind at around 1.5MT/ha. Key challenges faced by maize farmers include: erratic rainfall; pests and diseases (e.g. Fall Army Worm and Maize Lethal Necrosis Disease); low producer prices; and limited access to improved inputs in parts of the country.
0.25
0.3
0.35
0.4
0.45
0.5
0.55
0.6
2007 2008 2009 2010 2011 2012 2013 2014 2015 2016 2017
Burkina Faso Ethiopia Ghana Kenya Malawi
Mali Mozambique Niger Nigeria Rwanda
Tanzania Uganda Zambia

86
EVALUATION OF AGRA AFRICA’S SEED SYSTEMS PROGRAM FINAL REPORT
Figure 8.3 National maize yields in selected AGRA countries (2008-2017) Kg/Ha
Source: Calculated from http://www.fao.org/faostat/en/#data
Evaluation survey estimates
Average yields for maize and rice for farmers in AGRA supported areas and control areas for 2017/18 from Evaluation survey data are presented in Table 8.1. Data is based on farmer estimates.
Maize yields varied across the countries with Ethiopia achieving the highest at 5526kg/ha in the AGRA intervention areas and 4,864kg/ha by control farmers. This reflects high uptake of improved technologies via SSTP-supported cooperatives. In Tanzania, maize farmers in AGRA intervention areas recorded 3613 kg/ha compared to 3059kg/ha for non-AGRA areas. In Mali mean yields were 2385kg/ha in AGRA areas and 1499 in non-AGRA areas. Average yields of farmers in both AGRA and control areas was lower in Ghana and Uganda where seed companies are yet to make a wide impact. Mean yields of AGRA intervention households were higher than control households in all countries, but the differences were not statistically significant due to the high variation in yields experienced by farmers in each country. Thus, whilst a good proportion of farmers in AGRA-supported areas are achieving higher yields than those in control areas, many farmers are recording yields well below the mean. The similarity in yields also indicates that there are spillover effects occurring from AGRA intervention areas to neighbouring control areas.
For rice, in Ghana yields of farmers in AGRA-supported areas were 3185 kg/ha compared to 1973 kg/ha in non-AGRA areas. In Tanzania yields of farmers in both AGRA-supported areas and control areas were similar at around 2800-2900 kg/ha.
0
500
1000
1500
2000
2500
3000
3500
4000
2007 2008 2009 2010 2011 2012 2013 2014 2015 2016 2017
Ethiopia Ghana Mali Uganda Tanzania

87
EVALUATION OF AGRA AFRICA’S SEED SYSTEMS PROGRAM FINAL REPORT
Table 8.1 Mean yield of key crops 2017/18
Maize Rice
AGRA Control AGRA Control
n Yield (Kg/ha) n Yield (Kg/Ha) n Yield (Kg/Ha) n Yield (Kg/Ha)
Ethiopia 234 5526 168 4864
Ghana 118 1385 98 1153 71 3185 90 1973
Mali 12 2385 185 1499
Tanzania 207 3613 20 3059 52 2836 2891
Uganda 219 1341 139 1259
Source: AGRA PASS SSTP Evaluation Household survey 2018. Note: n is farmers who grew AGRA varieties
National and Evaluation survey yields compared
Figure 8.4 compares maize yield data for 2017/18 from FAO National data and yields of surveyed farmers in AGRA-supported areas from the Evaluation survey. PASS area farmers’ yields are higher than national yield data in Ethiopia and Tanzania; and similar in Mali. The higher PASS yields may partially be explained by the fact that AGRA-supported farmers were in higher potential areas. In Ethiopia the channelling of inputs through cooperative associations appears to be making a significant difference to farmer yields. Farmers in AGRA-supported areas in Ghana and Uganda reported lower yields than national means. These differences may be attributable to site-specific factors affecting the surveyed farmers, particularly pest and disease infestations which supressed yields and low levels of rainfall experienced during 2017/18, particularly in parts of Uganda.
Figure 8.4 Maize yields 2017/18 (Kg/ha): National data and Evaluation data PASS-supported areas
Source: Evaluation survey and FAOStat
0
1000
2000
3000
4000
5000
6000
Ethiopia Ghana Mali Uganda Tanzania
National PASS

88
EVALUATION OF AGRA AFRICA’S SEED SYSTEMS PROGRAM FINAL REPORT
8.4 Gross Margins of key crops
Gross margins (GM) per hectare of key crops were calculated using the USAID formula defined in the FtF Indicator Handbook as follows:
GMha =(TPxVS/QS)−IC
UP
Where:
TP is total production of direct beneficiaries during reporting period
VS is total value of sales (USD) by direct beneficiaries during reporting period
QS is total quantity (volume) of sales by direct beneficiaries during reporting period
IC is total recurrent cash input costs of direct beneficiaries during reporting period
UP is total units of production for direct beneficiaries during the production period, i.e. total hectares of land cultivated (ha) in the case of crops.
For the three evaluation focus countries that were under SSTP the value of gross margins fluctuated every year for the different crops as can been seen in Table 8.2. Maize which was the common crop across the three countries had gross margins worse than the baseline line year except for Tanzania. However, the baseline gross margins for maize in Tanzania were extremely low at less than US$1 in 2015. Pests and diseases such as Maize Lethal Necrosis (MLN) and Fall Army Worm (FAW) which were rampant in 2017 may have affected total production volumes. Round potatoes and beans in Tanzania also had higher gross margins than the baseline year. For the rest of the crops in the different countries farmers’ gross margins were generally lower than the first year of SSTP implementation. This may be due to a complex set of factors including yields, crop losses, market prices and policies on imports and subsidies.
Table 8.2 Gross Margins 2015-2017 US$ per Ha
Crops Ghana Tanzania Ethiopia
2015 2016 2017 2015 2016 2017 2015 2016 2017
Beans na na na 13 18 689 na na
Cassava -277 118 -17 32 na na na na na
Maize 223 319 159 1 490 407 1,334 826 641
Round Potatoes
na na na 1 845 1148 na na na
Rice 555 748 558 na na na na na na
Teff na na na na na na 704 7 -22
Wheat na na na na na na 1,211 15 6
Source: SSTP Final Report 2018
Gross margins for key crops per hectare calculated from the Household survey conducted for this
evaluation for 2017/18 cropping year are shown in Table 8.3. Mean GMs for maize were highest for
Tanzania (US$1326) and Ethiopia (US$9000, followed by Ghana ($331). Rice GMs averaged US$840 for
Tanzania and US$657 for Ghana. In Ethiopia GM for teff were US$675 and US$1953 for wheat. Variation
between country and crop occurs with different input and output prices and crop yields. It is noted that
the calculations are based on farmer estimates which are subject to recall and estimation error.
There are differences in cropping period (calendar and cropping years) and sample size across the SSTP
and Evaluation survey farmers which make a direct comparison of their GM estimates difficult. However,
estimates are broadly similar for crops in Ethiopia and Ghana. For Tanzania, the evaluation GM are higher
than SSTP estimates: this may reflect the slightly different period covered.

89
EVALUATION OF AGRA AFRICA’S SEED SYSTEMS PROGRAM FINAL REPORT
Table 8.3 Gross Margins US$ per Ha for key crops
Crops Maize Rice Teff Wheat
n GM n GM n GM n GM
Ethiopia 169 900 na 114 675 169 1053
Ghana 61 331 30 657 na na
Tanzania 158 1327 48 840 na na
Source: AGRA PASS SSTP Evaluation Household survey 2018
8.5 Farmers applying improved technologies varieties The SSTP annual survey conducted in 2017 established that 761,756 farmers were applying improved
technologies or management practices surpassing the target of 684,000 by about 11%. The total areas
under improved technologies was found at 978,082 ha during the same survey, an achievement of 31%
of the set target of 3,129,744ha for the six SSTP focus countries. Based on those findings, on average,
approximately each farmer had 1.3ha under improved technologies. This was below target and the reason
for this deviation was because of over targeting based on a wrong assumption that each household would
have an average of 5ha under improved technologies. The implication for AGRA’s future strategic planning
is that targets should be based on accurate baselines or using evidence-based data.
The main improved technologies and management practices promoted included: Crop genetics; Cultural
practices; pest and disease management; Soil-related fertility and conservation; Post-harvest handling
and storage. From the evaluation household survey, a high proportion of farmers reported using fertiliser,
herbicides and crop rotation technologies (Table 8.4). Control farmers recorded similar levels of uptake –
indicating multiple technology promoters and spill-over effects between communities. On average
fertilizer blends were the least used, followed by post-harvest technologies (in Ethiopia and Ghana) and
soil and water conservation (all countries). With low use of post-harvest technologies, farmers continue
to lose a considerable proportion of their produce2. High losses inevitably affect gross margins and the
value of incremental sales for smallholder farmers. Similarly, low use of soil and water conservation
technologies, risks soil degradation, particularly in sloping areas.
Table 8.4 Percentage of households using improved technologies
Technology Mali Ethiopia Ghana Uganda Tanzania
AGRA n=299
Control n=195
AGRA n=241
Control n=188
AGRA n=236
Control n=246
AGRA n=250
Control n=150
AGRA n=231
Control n=216
Improved varieties
58 43 96 79 76 43 75 64 93 93
Fertiliser 88 98 100 99 98 94 90 100 87 92
Fertiliser blends
62 63 44 39 38 30 50 48 44
Herbicide 66 65 95 95 97 97 79 80 81
Pesticide 80 91 55 56 73 62 96 100 88 90
Crop rotation 82 93 97 97 80 66 100 74 83
Soil & water conservation
58 66 80 77 31 34 80 69 61
Post harvest technology
80 72 46 30 42 38 97 100 78 87
Source: AGRA PASS/SSTP Evaluation Household survey, 2018
2 Losses vary between commodity. African Post-harvest Losses Information System (APHLIS) estimate is 10-12%

90
EVALUATION OF AGRA AFRICA’S SEED SYSTEMS PROGRAM FINAL REPORT
8.6 Area under improved technologies Average area under improved technologies is shown in Table 8.5. For improved varieties (crop genetics), Malian farmers surveyed had 3 ha on average – a very impressive achievement. Tanzania and Ethiopia had 1 ha on average and Uganda and Ghana around 0.75 ha. Hectarage under improved pest management and soil and water conservation technologies followed a similar pattern, though the areas were slightly lower. Surveyed farmers in locations directly targeted by AGRA interventions had slightly higher hectarages of improved technologies in all countries except Uganda. However, no significant differences were found between the intervention and comparison areas. This may be a result of spillover effects with farmers and agrodealers moving across neighbouring areas.
Table 8.5 Average area (Ha) under improved technologies
Technology
Mali Uganda Tanzania Ghana Ethiopia
AGRA Control AGRA Control AGRA Control AGRA Control AGRA Control
Crop genetics
3.06 2.96 0.76 0.79 1.17 1.05 0.78 0.51 1.1 0.89
Pest management
2.45 2.49 0.68 0.76 1.14 1.08 0.76 0.53 0.64 0.49
Soil & water conservation
2.55 2.8 0.56 0.87 1.12 0.91 0.26 0.23 0.84 0.78
Source: AGRA PASS/SSTP Evaluation Household survey, 2018
To what extent have varieties produced by AGRA supported breeders been commercialized by seed
companies and taken up by smallholder farmers?
8.7 Awareness of AGRA-supported varieties The evaluation examined household awareness of AGRA-supported crop varieties of crops in intervention
and control areas as well as households who have tried AGRA varieties (Table 8.6). Farmer awareness of
AGRA-supported varieties of maize was found to be moderate to high – around half of farmers in AGRA-
intervention areas in Ethiopia, Ghana and Mali and three-quarters in Uganda and Tanzania. Awareness of
AGRA-supported varieties was also moderate at around 40-50% for teff and wheat in Ethiopia and
sorghum and cowpea in Mali. In households in areas not directly targeted by PASS/SSTP-supported
agrodealers and seed companies, awareness for most crops was generally lower but not significantly so
(except for maize in Ghana and Uganda; and in Ethiopia where control households were found to have
higher or similar awareness). This indicates high levels of spillovers of information from AGRA-targeted
areas to other communities in the same district/county/woreda.
The gap between awareness of AGRA-supported varieties and trying them is narrow for most households
in AGRA intervention areas in Ethiopia, Ghana, Tanzania and Uganda (10 percentage points or less). This
indicates that farmers have been willing and able to access seeds of improved varieties they are aware of.
However, for households in non-intervention areas, the gap is much larger. In Mali there is a wide gap
between awareness and trying out varieties by households in both AGRA intervention and control areas.

91
EVALUATION OF AGRA AFRICA’S SEED SYSTEMS PROGRAM FINAL REPORT
Table 8.6 Households who are aware of and have tried AGRA-supported crop varieties (%)
Country Crop % Households aware of AGRA varieties
% Households who have tried AGRA varieties
AGRA Control AGRA Control Ethiopia Maize 48 65** 47 60
Teff 52 51 45 19**
Wheat 45 45 43 31**
Ghana Maize 57 46* 47 28**
Rice 29 23 22 19
Cassava 14 5** 9 0.4**
Mali Maize 46 40 21 4**
Cowpea 39 33 15 11
Sorghum 47 39 30 6**
Uganda Maize 76 65* 66 54*
Rice 6.5 9 3 7
Beans 36 32 28 26
Tanzania Maize 77 76 74 73
Rice 15 11 14 9
Beans 25 22 21 17
Cassava 8 12 7 10
Source: PASS/SSTP Evaluation household survey. Note: **Highly significant difference; *Significant difference
Households’ reasons for not trying out AGRA-supported varieties are shown in Table. 8.7. Non-availability
of improved inputs is a major reason for households in AGRA-target and non-target areas. Other
frequently cited reasons were: insufficient information and lack of interest across all crops in Mali, and
lack of land in Ethiopia. Interestingly, lack of information and cost of inputs were not generally cited
reasons for not trying out improved varieties. The findings indicate that more investment is needed in
input delivery at community level. They also suggest that more attention is needed to understanding why
farmers are not interested in taking up AGRA varieties, despite information being available.
Table 8.7 Households reasons for not trying out AGRA-supported varieties (% households)
Country Crop Reasons for not trying AGRA varieties (% Households)
Lack of information
Inputs unavailable
Too expensive
Not interested
No benefits
Land unavailable
Ethiopia AGRA 5 47 5 16 0 37
Control 16 40 2 13 17 17
Ghana AGRA 3 24 15 22 15 33
Control 7 33 9 32 3 20
Mali AGRA 33 28 5 68 6 9
Control 31 30 5 59 7 3
Uganda AGRA 4 58 16 23 14 32
Control 5 49 27 15 2 20
Tanzania AGRA 0 48 13 17 0 9
Control 0 21 27 30 15 12
Source: PASS/SSTP Evaluation household survey
Farmers who have tried AGRA-supported varieties were asked to explain what they liked about them.
These results are shown in Appendix 5. High yields were the most commonly cited trait: by 90% of

92
EVALUATION OF AGRA AFRICA’S SEED SYSTEMS PROGRAM FINAL REPORT
surveyed farmers in Ethiopia; 70% in Mali, Tanzania and Uganda; and by 50% in Ghana. Other preferred
traits were: drought or flood tolerance, marketability, early maturation and taste.
Farmers were also asked if there were any characteristics which they did not like about AGRA-supported
varieties (Appendix 6).. Low yields were cited for teff and wheat by 15% and 10% of farmers in Ethiopia,
respectively; and 11% of rice farmers in Ghana and 12% in Tanzania. Poor marketability of AGRA varieties
of cassava was cited by 70% of farmers surveyed in Ghana. Other traits disliked by farmers were low
drought and flood tolerance (maize and rice in Ghana: 20% and 15% respectively); poor pest and disease
resistance (maize in Ghana, Ethiopia and Uganda: 23%; wheat in Ethiopia: 26%).
Farmers who have tried AGRA-supported varieties were then asked to give them an overall rating on a
scale of 1 to 5, with 1 being very poor and 5 being very good (Table 8.8). Many varieties were rated good
or very good including: teff and wheat in Ethiopia; maize and rice in Ghana; maize, cowpea and sorghum
in Mali; maize, cowpea, rice, beans and cassava in Uganda. Other crops were rated moderate. No varieties
were rated as poor or very poor by the farmers surveyed. There were no significant differences in ratings
between households in AGRA-supported villages and non-intervention areas.
The implication is that technologies promoted by the programme are generally acceptable to farmers and
spontaneous dissemination across the areas is starting to occur, through agro-dealers and seed
companies, as well as farmer sharing of seed.
Table 8.8 Rating of AGRA-supported crop varieties by farmers using (% households)
Country Varieties Average rating by AGRA households
Average rating by control households
Mali Maize 3.79 3.90
Teff 4.60 4.12
Wheat 4.15 3.86
All crops 4.17 3.95
Ghana Maize 4.43 4.25
Rice 4.14 4.31
Cassava 3.43 na
All crops 4.24 4.28
Mali Maize 3.99 4.07
Cowpea 4.14 3.91
Sorghum 4.28 4.05
All crops 4.29 3.97
Uganda Maize 3.79 3.82
Beans 3.9 3.63
All crops 3.79 3.83
Tanzania Maize 4.01 4.01
Cowpea 5 4.1
Rice 4.1 4.05
Beans 4.16 4.15
Cassava 4.16 3.71
All crops 4.04 3.97
Source: PASS/SSTP Evaluation household survey. Note: Rating 1 – very poor, 2- poor, 3- moderate, 4 – good, 5 – very good

93
EVALUATION OF AGRA AFRICA’S SEED SYSTEMS PROGRAM FINAL REPORT
8.8 Gendered impacts at household level
PASS/SSTP interventions have undoubtedly reached large numbers of women farmers, evidenced by the
high attendance of women at trainings, demonstrations, field days and other activities in many of the
participating countries. However, quantifying impact of program activities on women and men at
household level faces several challenges. In terms of intra-household decision-making and access to
resources, there is considerable variation in practices. For example, in some areas husbands and wives
farm separately, in others together, with differences within each scenario over who makes decisions over,
and has access to, inputs and income from crops. Thus, differentiation of farmer participants by gender
was not deemed appropriate. An alternative classification used here was by sex of head of household
(Table 8.9). The challenge was limited data points across the sampled countries and crops.
The table presents selected indicators on area, production, costs, sales and gross margin for which data
was available. In Ghana, average area grown of cassava and rice was lower for female-headed households
than male-headed households in AGRA intervention areas. For rice, most of the indicators show male-
headed households performing better than female-headed households in AGRA intervention and control
areas – production, yields, sales, costs. However, Gross Margins are estimated to be higher for female-
headed households. This appears to be because their costs are lower – reflecting lower purchases of
improved inputs. For Uganda, differences between male- and female-headed households are smaller.
Again, Gross Margins are actually higher for female-headed households. However, these findings are not
statistically significant due to the small number of female-headed households and should be treated with
caution.
Table 8.9 Selected crop indicators for male- and female-headed households
Country Crop Variable Male-headed households
Female-headed households
AGRA Control AGRA Control
Ghana
Cassava Average area grown (ha) 1.15 0.41 0.41 0.81
Rice
Average area grown (ha) 1.03 1.36 0.61 0.81
Average total production (kg) 2992 2507 1160 400
Average yield (kg/ha) 3217 2077 2864 494
Average value of sales (US$) 684 409 539 70
Average total costs (US$) 329 265 179 125
Average gross margins (US$/ha) 133 52 832 -37
Uganda
Maize
Average area grown (Ha) 0.63 0.73 0.47 0.42
Average total production (kg) 840 731 839 370
Average yield (kg/ha) 1316 1277 1541 1165
Average value of sales (US$) 114 141 183 78
Average total costs (US$) 107 136 92 46
Average gross margins (US$/ha) 74 79 198 188
Source: PASS/SSTP Evaluation Household Survey
Decision-making by women (wife or senior woman) was assessed at household level in terms of decisions
over trying out new varieties, purchasing seed and fertiliser, and sales of crop (Table 8.10). There has been
a slight increase over the past 5 years in women reporting involvement in decision-making in most
countries but this is not statistically significant. Women in Tanzania, Uganda and Ethiopia had the highest
control over decision-making, but it remains low at less than 20%. Women in Mali had low control over
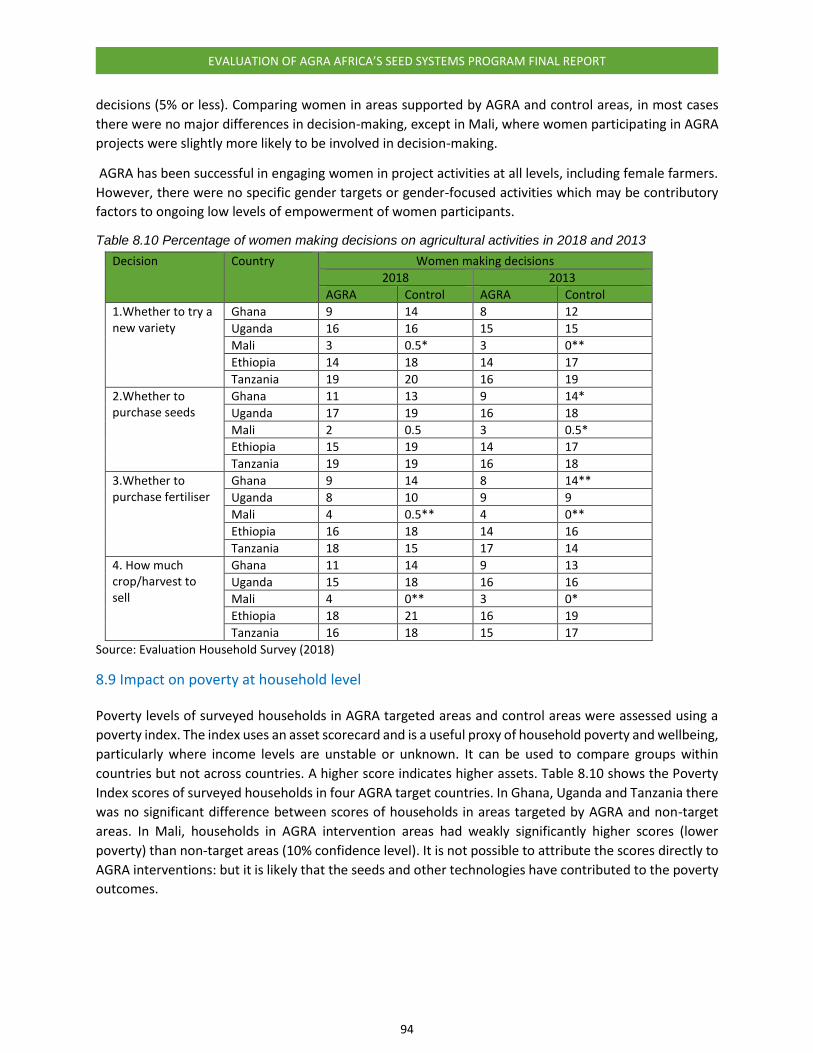
94
EVALUATION OF AGRA AFRICA’S SEED SYSTEMS PROGRAM FINAL REPORT
decisions (5% or less). Comparing women in areas supported by AGRA and control areas, in most cases
there were no major differences in decision-making, except in Mali, where women participating in AGRA
projects were slightly more likely to be involved in decision-making.
AGRA has been successful in engaging women in project activities at all levels, including female farmers.
However, there were no specific gender targets or gender-focused activities which may be contributory
factors to ongoing low levels of empowerment of women participants.
Table 8.10 Percentage of women making decisions on agricultural activities in 2018 and 2013
Decision Country Women making decisions
2018 2013
AGRA Control AGRA Control
1.Whether to try a new variety
Ghana 9 14 8 12
Uganda 16 16 15 15
Mali 3 0.5* 3 0**
Ethiopia 14 18 14 17
Tanzania 19 20 16 19
2.Whether to purchase seeds
Ghana 11 13 9 14*
Uganda 17 19 16 18
Mali 2 0.5 3 0.5*
Ethiopia 15 19 14 17
Tanzania 19 19 16 18
3.Whether to purchase fertiliser
Ghana 9 14 8 14**
Uganda 8 10 9 9
Mali 4 0.5** 4 0**
Ethiopia 16 18 14 16
Tanzania 18 15 17 14
4. How much crop/harvest to sell
Ghana 11 14 9 13
Uganda 15 18 16 16
Mali 4 0** 3 0*
Ethiopia 18 21 16 19
Tanzania 16 18 15 17
Source: Evaluation Household Survey (2018)
8.9 Impact on poverty at household level
Poverty levels of surveyed households in AGRA targeted areas and control areas were assessed using a
poverty index. The index uses an asset scorecard and is a useful proxy of household poverty and wellbeing,
particularly where income levels are unstable or unknown. It can be used to compare groups within
countries but not across countries. A higher score indicates higher assets. Table 8.10 shows the Poverty
Index scores of surveyed households in four AGRA target countries. In Ghana, Uganda and Tanzania there
was no significant difference between scores of households in areas targeted by AGRA and non-target
areas. In Mali, households in AGRA intervention areas had weakly significantly higher scores (lower
poverty) than non-target areas (10% confidence level). It is not possible to attribute the scores directly to
AGRA interventions: but it is likely that the seeds and other technologies have contributed to the poverty
outcomes.

95
EVALUATION OF AGRA AFRICA’S SEED SYSTEMS PROGRAM FINAL REPORT
Table 8.11 Poverty scores of surveyed households
Poverty Index score
Country AGRA areas Control T-test
Mali 5831 5818 0.0295*
Ghana 1976 1803 1.3769
Uganda 1001 952 0.8051
Tanzania 1256 1219 0.3638
Source: Evaluation Household Survey (2018)

96
EVALUATION OF AGRA AFRICA’S SEED SYSTEMS PROGRAM FINAL REPORT
9 Creating an Enabling Environment
Evaluation questions: What country level and regional policy and regulatory reforms did AGRA
support/facilitate that increased production, delivery and uptake of improved seeds and technologies?
What reforms still need to be supported in focus countries and regions to improve scaling up of seed
production, delivery and uptake?
9.1 Introduction Policy and regulatory reforms have been supported on the basis that these will facilitate increased
production, delivery and uptake of improved seeds and technologies. A facilitative seed policy and
regulations climate is critical in fast-tracking varietal turnover with farmers. Unfortunately influencing
government agencies to initiate the enactment of these kinds of laws, policies and regulations needs a
multiple-facetted approach which involves very many stakeholders (seed companies, regulatory agencies,
parliament, agricultural technical groups, government policy directorates, public and private research
agencies, seed associations and politicians). To succeed the strategy must involve political, economic,
technical, net-working and advocacy levers. Because of the complex nature of this area, driving positive
change in Sub-Saharan Africa is a very slow process indeed.
Even with the most robust breeding initiatives, the gains made will not be fully realized in a retrogressive
policy, legal and regulatory environment. The relevant policy options are therefore those which can
accelerate varietal turnover/sustained farmer uptake. Policy by definition includes laws, regulations and
guidelines as well as taxes, subsidies, market interventions and public investments designed and executed
by government to achieve some social or economic goal. The progressive/facilitative policy options are
those which incentivize farmers to continuously replace and benefit from the replacement of improved
varieties with newer releases in a sustainable manner while ensuring that the quality and integrity of the
seed is without reproach.
The facilitative policies must revolve around the following principles:
Accelerating varietal registration and release
Improving quality assurance systems
Increasing access to early generation seed and improved genetics
Leveraging transparent and professional subsidy programs
Strengthening seed enterprises’ marketing capacities
Leveraging facilitative policies and regulations
AGRA, through PASS and SSTP, proposed a number of interventions to influence the transition of some of
the retrogressive seed policies to the more progressive ones to support high and sustainable varietal turn
over for the benefit of African farmers. The interventions include:
De-bottlenecking access of foundation seed by seed companies
Tax incentives by government to encourage investments in processing equipment, irrigation
technology and other seed production infrastructure
To identify and deal with the regional harmonization of seed laws, policies and regulations issues
in order to accelerate the harmonization of the protocols
Award grants to deal with specific bottlenecks in order to improve the seed policy, legal and
regulatory climate.

97
EVALUATION OF AGRA AFRICA’S SEED SYSTEMS PROGRAM FINAL REPORT
Capacity building of regulatory agencies/departments and seed associations by:
1. Training seed companies in seed inspection and other aspects of quality control
2. Strengthening and professionalization of seed trade associations to effectively hold their
association members accountable and to be respected and trusted allies of governments
Third party accreditation of inspectors in order to enhance the constrained regulatory capacities
in the target countries.
To develop a consensus with Seed Regulatory Agencies in all six SSTP countries to implement
quality assurance systems. This will be done by i) providing training to interested seed companies
in developing internal quality control systems (seed quality manuals), ii) developing a training
curriculum for seed inspectors and seed samplers, and then licensing trained seed inspectors and
samplers who have demonstrated technical competence in these respective areas, and iii)
implementing an ICT Platform that will allow Seed Regulatory Agencies to establish a traceability
system for all certified seed.
To support a complementary investment being made by the Bill and Melinda Gates Foundation
(BMGF) through AGRA to develop the capacity of National Seed Trade Associations (NSTAs) to
carry out effective advocacy in collaboration with the African Seed Trade Association (AFSTA).
To also support the development of NSTAs to provide a range of fee-based services to members
as a way of improving seed quality control by member companies and ensuring the sustainability
of NSTAs.
Bringing about policy change involves a number of steps including: policy analysis, stakeholder
consultations and public debate; drafting or revision of existing legislation or regulations; approval and
full implementation of policy changes. This evaluation was seeking to determine the effects of AGRA
interventions in terms of influencing legislation itself i.e. the actual policies or regulations or enhancing
enforcement of the existing laws, regulations and policies through capacity, efficiency and quality
enhancement.
Below we review implementation and outcomes of PASS and SSTP seed policy support in selected
countries. A summary of achievements to date is shown in Table 10.1. Overall the greatest impact to date
has been in Tanzania and Mali. Ghana has also seen progress in several areas. The lowest impact is seen
in Ethiopia which faced challenges in implementation of the policy components, and Uganda, which was
not supported under SSTP.

98
EVALUATION OF AGRA AFRICA’S SEED SYSTEMS PROGRAM FINAL REPORT
Table 9.1 Policy efforts supported by AGRA in selected countries
Policy process/step Number of agricultural policies completing the processes or steps of
development because of AGRA per country
Ethiopia Ghana Mali Uganda Tanzania Total
Analysis 0 2 5 1 8 16
Stakeholder consultation/public
debate
1 2 3 1 8 15
Drafting or revision 0 1 2 0 6 9
Approval (legislative or regulatory) 0 1 2 10 5 9
Full and effective implementation 0 1 3 0 8 12
Source: SSTP and PASS reports; Evaluation team interviews
9.2 Uganda
Policy context
The Seeds and Plant Variety Act of 2006 is the main law governing the seed industry. The law establishes
the National Seed Certification Service, NSCS. Under the current constitutional arrangement, NSCS is
under the Department for Crop Inspection and Certification, DCIC within the ministry of Agriculture. The
Seeds and Plant Regulations of 2017 were developed as the implementing instruments for the Act. The
Regulations provide details related to plant breeding, variety release, seed multiplication, seed marketing,
seed importation and exportation and quality assurance of seeds and other planting materials.
Uganda is a member of both the Common Market for Eastern and Southern Africa, COMESA and the East
Africa Community, EAC. Uganda’s seed regulations have been aligned to the COMESA harmonized seed
regulations with the objective of facilitating cross border trade within the region.
The general in-country opinion is that the seed regulations in Uganda are good. The biggest concern is the
capacity to enforce the regulations and the actual enforcement itself and this directly correlated with a
generally incapacitated regulatory function.
The National Seed Certification Service is a young department of about 4 years old. In addition to seed
inspection and certification the department has the mandate on phytosanitary and pesticides. On paper
it is clear that this outfit has the necessary legal instruments to regulate the seed industry in Uganda. This
is however not happening as the industry would like to see. Reasons include: 1. Low capacity in terms of
numbers of inspectors (13) and immobility (1 vehicle). 2. Infrastructural incapacity including no functional
seed laboratory; no irrigation capacity and so they can only carry out their post control tests under rain-
fed conditions; no cold storage and so they cannot keep the laboratory seed lots for testing for long. 3.
Serious budgetary constraints and they can only raise 10% of their budget through the levies they charge
for services. Serious financial inflexibility as their money is controlled centrally by the government. 4. Lack
of international accreditations like the International Seed Testing Association, ISTA which is critical for
international seed trade and the Union for Protection of Plant Varieties, UPOV which is necessary for
access and export of elite germplasm to other countries that have accession to UPOV, 1914.

99
EVALUATION OF AGRA AFRICA’S SEED SYSTEMS PROGRAM FINAL REPORT
Policy analysis
AGRA baseline policy analysis with stakeholders to determine gaps
In Uganda, the key informants interviewed - seed companies, Uganda Seed Association, Seed Inspection
and Certification Service, a private seed consultant, the Ministry of Agriculture Policy Directorate,
Integrated Seed Sector Development Project, ISSD – were not aware of a baseline policy analysis with
stakeholders to determine gaps nor seen a documented report on this. One respondent indicated
awareness of such an analysis within a consortium of AGRA and other development partners. However,
this was not done formally with a stand-alone report. There was also no prioritized list of policy
interventions for Uganda seed industry to achieve maximum impact.
Stakeholder consultation/public debate
Limited consultations have been carried out with stakeholders in Uganda to date. On a scale of 1 to 5 (1
being weakly involved and 5 being strongly involved), all the key informants gave this a rating of 1 except
one who gave a score of 2 (Table 10.2).
Table 9.2 Stakeholder rating of involvement in policy consultations
Stakeholder class Extent of involvement
Ministry of Agriculture Policy Unit 1
NSICS 1
Seed Companies 1
Seed Consultant 2
ISSD 1
USTAS 1
Breeders 1
Source: Evaluation interviews. Note: On a scale of 1-5, 1 is weakly involved; 5 is strongly involved
Drafting or revision of legislation/approval/implementation
Two interventions were assessed as successful. AGRA played a role in influencing the decision of the
Government of Uganda to reverse VAT taxes on seed and other agricultural inputs. In this intervention,
AGRA with EPRC carried out a rapid appraisal and analysis of the impacts of the tax, produced a policy
brief which assisted the Uganda Seed Trade Association to engage and dialogue with the President
resulting in the reversal of the decision. The other intervention identified is harmonization of seed laws
within COMESA and EAC. This effort was described as joint with other programs like Feed the Future. SSTP
participated in a workshop organized by COMESA secretariat that resulted in the development of the
COMESA: Seed Harmonization Implementation Plan (COM-SHIP) that was held in Addis Ababa from April
7-11, 2014. SSTP in this meeting committed to support the design and development of the COMESA
Variety Catalog and Database. The Seed Harmonisation plan and regulations are yet to be operationalized.
Impacts of the policy interventions
Overall, the rate of success and impact on the ground according to the respondents to date has been low
(see table 10.3). However, the reversal of VAT on seed and other farm inputs did impact positively on the
profitability of seed companies and hence more vibrant delivery of improved seed to the farmers.

100
EVALUATION OF AGRA AFRICA’S SEED SYSTEMS PROGRAM FINAL REPORT
Table 9.3 Assessment of success of seed policy interventions by stakeholder groups: Uganda
Stakeholder class Success Rating
Ministry of Agriculture Policy 15%
NSICS Low
Seed Companies Low
Seed Consultant 20%
ISSD Low
USTAS 20%
Breeders Low
Source: Evaluation stakeholder interviews (2018)
Quality of Regulations and Enforcement Companies are most affected by the quality of regulations and
enforcement efficiency. Interviews with the seed company executives in Uganda were unanimous that
the regulations cannot be faulted. The sticking issue is enforcement of the regulations and this was
attributable to the incapacity of the NSICS.
Capacity Intervention on the Regulatory Department. Interviews with NSICS leadership team did not
identify specific interventions by AGRA to enhance capacity of the service. The Uganda Seed Traders
Association in this general theme of capacity building did not report any grant or specific capacity building
activities to enhance its service to the members. Third party accreditation of inspectors other than the
employees of the NSICS is provided for in the Ugandan Seed Regulations. This is a key intervention by
AGRA in its policy work plans. The operationalization of this strategy is at its infancy. It has a long way to
being operational. The effort on the ground in this regard is attributable to a stalled company called Ag-
verify which was funded by USAID.
Reforms which need Support
AGRA interventions at country level and regional policy and regulatory reforms in Uganda are not easily
visible. There is a lot of work still to be done in this regard. The list of reforms to be done is very long but
in terms of priority the focus should be around capacity building of NSCS as this will strengthen the
enforcement of the seed laws and regulations hence unleashing the seed subsector transformation effort
by both the Ugandan Government and AGRA.
Capacity building of the NSCS which is critically incapacitated
Enforcement of the seed laws and regulations which is a factor of the incapacity of NSCS
Facilitating the ISTA accreditation of the NSCS seed laboratory to spur cross boarder seed trade
Thirty party training, testing and accreditation of company inspectors. With a critically low
capacity of NSCS, there is critical need to seek for an external support in this regard to help NSCS
to be in apposition to do this
Facilitation of the passing of the Uganda’s national seed policy 2016 by the cabinet
Facilitation of the accession of Uganda to UPOV 1914
Operationalization of the Ugandan COMESA harmonized seed regulations

101
EVALUATION OF AGRA AFRICA’S SEED SYSTEMS PROGRAM FINAL REPORT
9.3 Ghana
Policy context
The Ghana seed policy, the Plants and Fertilizer Act 2010 (ACT 803) is fully operational. The Act is in three
technical parts and it provides for Plant Protection (Part I), Seeds (Part II) and Fertilizer Control (Part III).
Ghana’s seed regulations have been aligned with the seed regulations of the Economic Community of
West Africa States (ECOWAS) but this covered only seed certification. A new alignment which also
contains quality control, certification and marketing has been completed. The more comprehensive seed
regulations are still awaiting parliamentary enactment. The role of AGRA in the harmonization process
was significant and extremely well received. The harmonization process which was hugely successful
required several consultative meetings of all the stakeholders and a number of sittings of parliament
which were all supported by AGRA through their policy hub and node system.
Seed companies consulted are generally satisfied with the quality of seed law and regulations. Their
biggest concern is enforcement. In fact the TASAI survey of 2017 puts the companies’ certification at 78%
but enforcement at 56% agreeing with the observations of this report.
The Ghana Seed Inspection Division (GSID) has 35 seed inspectors distributed in nine regions which
represent all the agro-ecologies in Ghana. If you remove 10 laboratory analysts working at 4 different
satellite laboratories and one at the main laboratory, then the average per region is 2.7. USAID under the
Agriculture Policy Project has given support on training of 20 new inspectors and review of the
certification and the thirty party accreditation manual. However this division has critically low human,
financial and infrastructural capital. The TASAI survey of 2017, reports the seed companies’ certification
with the seed services at 49%, further supporting the incapacity noted. They also lack international
accreditations which are critical for international trade:
The International Seed Testing Association, ISTA
The Union for Protection of Plant Varieties UPOV
Africa Regional Intellectual Property Organization, ARIPO
The support of AGRA together with ARIPO to fast-track the UPOV accreditation of the division is evident
on the ground.
Policy analysis
The key informants namely, Seed Companies, Plant Protection and Regulatory Services Directorate,
PPRSD, ICRISAT, Ministry of Agriculture – Policy, Planning & Monitoring and Evaluation Directorate,
National Research System and National Seed Association of Ghana recalled the AGRA policy landscape
analysis in Ghana being part of the agenda in a number of meetings but could not locate the report to this
analysis. The analysis seems to have been informal and carried out with public sector players than the
private sector. Seed companies interviewed did not appreciate the role of policy in their business let alone
AGRA’s footprint. The regulatory and planning directorates were aware of a number of meetings where
such analysis was part of the agenda but they could not name the policy gaps identified for intervention
and the priority order for maximum Ghanaian seed sub-sector transformative impact.

102
EVALUATION OF AGRA AFRICA’S SEED SYSTEMS PROGRAM FINAL REPORT
Stakeholder consultation/public debate
In Ghana, all stakeholders reported involvement in consultations except seed companies. On a scale of 1
to 5 (1 being lowest and 5 being highest(, the key public organizations gave a mean rating of 3.8 while the
seed traders organization gave 3 (Table 10.4). Clearly the AGRA footprint on the policy reforms in Ghana
is evident. What is lacking however is the list of identified and prioritized policy gaps for action to impact
the subsector transformative agenda.
Table 9.4 Stakeholder assessment of involvement in policy consultations, Ghana
Stakeholder class Extent of involvement
Ministry of Agriculture Policy unit 4
GSID 4
Crop Services Directorate Seed Unit 4
Seed Companies 1
GSTAS 3
Breeders 3
Source: Evaluation stakeholder interviews (2018)
Drafting or revision of legislation/approval/implementation
AGRA Intervention on Regional (COMESA) Harmonization of Seed laws & Policies.
The AGRA intervention in this regard was significant. All the work that resulted in the alignment of the
Ghana seed law and regulations including the write up, requisite stakeholders meetings including the
validation meeting, the parliamentary agriculture committee sittings to scrutinize the document for the
plenary debates on the floor of the house was supported by AGRA through the MIRA (Micro Reforms for
African Agribusiness) project. This document is now awaiting enactment by parliament.
Extent of AGRA intervention on seed laws, policies and regulations
A number of policy interventions were identified as follows;
The National seed regulations harmonization with the ECOWAS regulations started with
stakeholders meetings, drafting, validation meetings, meetings with parliamentary agricultural
committee, office of the Attorney general, cabinet approval, final draft for plenary parliamentary
debate and enactment.
The National seed plan stakeholders meetings, validation meeting and subsequent approvals
resulting in the delivery of the plan.
Support of the inauguration of the National Seed Council, Plant Protection Council and Fertilizer
Council
Capacity building of private and public institutions in the production of foundation seed. This
particularly benefited from the Micro Reforms for African Agribusiness, MIRA project. The project
worked to build capacity of African governments to re-view and reform regulations which slow
down private sector investment in seed and other Agri-inputs.
Development of the National Catalogue of crop varieties

103
EVALUATION OF AGRA AFRICA’S SEED SYSTEMS PROGRAM FINAL REPORT
The success rate of AGRA-supported initiatives on policy ranged from medium to high. Again this was
responded to by public sector organizations with examples (Table 10.5).
Table 9.5 Rating of success of AGRA-supported policy initiatives: Ghana
Stakeholder class
Rating of success of AGRA-
supported interventions on policy
Ministry of Agriculture Policy Unit High
GSID Medium
Seed Companies N/A
GSTAS Medium
Breeders Medium
Source: Evaluation stakeholder interviews (2018)
AGRA support for linkages between public policy analysts and private sector is having significant impact
on the ground and this best demonstrated by the harmonization of seed regulations of Ghana with
ECOWAS. The most wanting policy issue in Ghana however is on enforcement of the seed law and
regulations. Policy intervention in this regard is critical in order to spur growth of the seed subsector.
Companies are most affected by the quality of regulations and enforcement efficiency of the same. The
interviews with the key informants in Ghana were unanimous that the regulations to a large extent are
good. Enforcement of the regulations was seen to be only fair and this was attributable to the incapacity
the GSID.
Overall, it was too early to link seed productivity and delivery to the policy interventions in Ghana. The
general feeling however is that the harmonization of the national seed regulations to those of ECOWAS
has huge potential for Ghanaian future seed trade within the economic block.
Reforms and regulations requiring further support
AGRA interventions at country level and regional policy and regulatory reforms in Ghana are visible. There
are however a lot more specific and targeted policy interventions yet to be done in this regard.
Interviews with the GSID leadership team, revealed specific interventions by AGRA to enhance capacity
of the service in training, grant awards and meetings facilitation. The interventions however are spread
too thinly to have a positive impact on the industry. The best approach would be to focus on most critical
interventions directly and not through hubs. Having hubs between AGRA and GSID reduces focus and
speed of restoration of the directorate as a seed regulatory outfit including its removal from the ministry
to be a stand-alone institution.
The Ghana Seed Traders Association in this general theme of capacity building did not report any grant or
specific capacity building activities to enhance its service to the members.
Third party accreditation of inspectors other than those who are employees of the GSID is provided for in
the Ghanaian Seed Regulations. This is a key intervention by AGRA in its policy work plans. The
operationalization of this strategy is at its infancy. It has a long way to being operational. The effort on the

104
EVALUATION OF AGRA AFRICA’S SEED SYSTEMS PROGRAM FINAL REPORT
ground in this regard is attributable to USAID. This is a low hanging fruit for AGRA to fix in only one
consultancy.
The reforms which need support are quite a number but the way forward is to do a robust policy landscape
analysis to establish priority areas. The focus for now should be around capacity building of GSID as this
will strengthen the enforcement of the seed laws and regulations hence unleash the seed subsector
transformation effort by both the Ghanaian Government and AGRA. The specifics are as follows:
Capacity building of the GSID which is critically incapacitated
Enforcement of the seed laws and regulations which is difficult for now given the current
incapacity of the seed regulatory function
Facilitating the ISTA accreditation of the GSID seed laboratory to spur cross boarder seed trade
Third party training, testing and accreditation of private inspectors. With a critically low capacity
of GSID, there is critical need to seek for external reinforcement. The operationalization of third
party seed inspection accreditation will require external support as the skills within country are
lacking.
Facilitation of the accession of Ghana to UPOV 1914
Policies frustrating seed scaling up efforts
Key policies which exist but are frustrating the seed scaling up efforts are:
Seed subsidies without a vetting process or regulations of seed companies which supply the seed
to the governments and then to the farmers. This encourages briefcase seed companies to win
tenders to supply seed which they don’t have and cannot procure. Farmers then end up receiving
grain for seed hence poor crop performance due to varieties that were only on the bag label. This
has frustrated serious seed companies because they cannot sell to this market and farmers for
poor yields. This is not incentive to private companies, the farmers, the food security agenda nor
the farmer livelihoods enhancement agenda.
Unconcluded and poorly enforced seed Harmonization regulations, resulting in slow to zero cross
boarder seed trade. This frustrates the seed companies because of the reduced market size for
their seed.
Pitiful seed regulatory capacity in terms of personnel numbers, training, infrastructure and
autonomy (see and conclusion).
Partial to complete lack of enforcement of laws, policies and regulations. This gives companies
which are not professional and with low integrity an opportunity to cut corners and hence
compromise seed quality at the expense of the more professional companies and farmers.

105
EVALUATION OF AGRA AFRICA’S SEED SYSTEMS PROGRAM FINAL REPORT
9.4 Tanzania
AGRA, through the MIRA project, has made significant contributions to national seed policy reforms in
Tanzania. Specifically, AGRA has provided support in form of technical, financial, facilitation of meetings
and capacity building.
Stakeholder consultation/public debate, Drafting or revision, Approval, Full and effective
implementation
The key informants have indicated that the policies and regulations have undergone meetings and
discussions with relevant stakeholders, drafting and validation and cabinet approval. The level of their
involvement is rated 5, indicating that stakeholders are strongly involved in the process. AGRA has
contributed significantly to the seed reform process whereby bills have been drafted for parliamentary
adoption and they have been gazetted. The policies and regulations supported include:
Private sector access to public varieties
Amendment of variety legislation to comply with SADC and East Africa
Review of regulatory fees
Harmonization of COMESA and SADC
Country accreditation with ATF
Modalities for royalties for breeders
Amendment of regulation on price for labels
Quality Declared Seed guidelines
Impacts of the reforms
Policies, laws and regulations have gone through the review process and are now operational. The key
informants indicated that it is too soon to see the impacts of the reforms but it is expected that the seed
sector will function better once there is full implementation.
Reforms still need to be supported in Tanzania to improve scaling up of seed production, delivery and
uptake
Several reforms are still required in Tanzania including:
Seed price reforms. There is need to investigate price control by government or politicians as this
is negatively affecting seed companies.
Conservation of NPGRC national plant genetic resources for storage of public bred varieties
Access to non-protected varieties by private sector seed companies. Currently, seed companies
have limited access to protected material and they depend on government for access to
foundation seed.
No funding for variety maintenance hence public varieties become contaminated and need
cleaning as local seed companies do not have their own varieties but depend on public varieties
Need support to combat Maize Lethal Necrosis Disease MLND as this is a threating disease for
maize sub-sector need support from Government and Donors as all AGRA varieties are susceptible
Need support to monitor implementation of regional agreements: SADC has no officers,
SADC/EAC seed Act does not supersede national laws it helps those countries without laws

106
EVALUATION OF AGRA AFRICA’S SEED SYSTEMS PROGRAM FINAL REPORT
9.5 Mali
Policy analysis
The policy reform process in Mali is underway. AGRA has supported the identification of the challenges in
the inputs sector and provided grants to support the following reforms:
Policy reform
Identification of the challenges to seed system
Support to the harmonisation of Mali regulatory framework to the one of ECOWAS
Reform of the subsidy program in Mali
Support to the Ministry of Agriculture for improved subsidy program and distribution of inputs
Value chain analysis for 6 crops (Irish potato, sweet potato, tiger nuts, cassava and fonio)
Stakeholder consultation/public debate
AGRA has conducted meetings and discussions with relevant stakeholders. The validation of the draft
policy and regulation review document with stakeholders is in progress. An input program has been
developed with AGRA support. The level of involvement is rated 5 on the scale of 1 to 5 to say that all
stakeholders interviewed are fully involved in the process.
Drafting or revision of policies/approval/Full and effective implementation
In Mali, AGRA supported the ongoing harmonization process of the inputs regulatory framework with
those of ECOWAS. It also provided support for an adequate mechanism of inputs distribution and subsidy
to better secure the distribution channels. AGRA also supported the dissemination of the outcomes of the
study on inputs subsidy in Mali.
The institutional reform of the Ministry of Agriculture and the national extension system has been
supported by AGRA. Three consortia of groups of NGOs, private sector and state have been created in
Koulikoro, Segou and Sikassoto to implement extension services with specific role delegated to each actor
of the consortia.

107
EVALUATION OF AGRA AFRICA’S SEED SYSTEMS PROGRAM FINAL REPORT
9.6 Ethiopia
Context
Policy work in Ethiopia has been problematic. Even interviews on policy engagement were not easy as the
key informants - including policy makers, MoALR (the then MoANR) and implementing partner
organizations - wanted to respond anonymously. It is clear that policy work has been challenging because
of major strategic issues related to the overall legal status of AGRA program in the country, the weak
balance between direct AGRA implementation and implementation through partners, and the extent and
evidence of demonstration of policy engagement is low. On the legal status for AGRA operation in
Ethiopia, the program did not succeed in securing independent legal status and opted to be hosted by
another organization - Agricultural Transformation Agency (ATA).
In part, this has undermined its independent operation in the country and led to it being viewed by some
policy makers as part of ATA. These challenges also forced AGRA to mainly operate directly from Nairobi
with limited decision-making power of local AGRA office and staff. This situation may also have played a
crucial role in limiting its visibility at national level and influence at policy level3.
Policy activities and impacts
Over the past few years the Ethiopian seed industry has seen the strengthening of seed systems and
market development. These include:
establishment of Regional Seed Enterprises in 2008/9 which have resulted in a dramatic increase
in supply of certified seed;
the growth of the private sector in seed production which reduced the burden on the public
system;
the development and deployment of new improved varieties and technologies by Federal and
Regional research institutions which continue to improve productivity and livelihoods of farmers;
and
Innovations and experiments in direct marketing, community-based production systems and
multi stakeholder governance which influenced these changes.
Despite these successes most farmers are still not accessing improved varieties that could dramatically
increase their agricultural productivity. To improve the seed regulatory environment, the House of
Peoples’ Representatives passed a new Seed Proclamation in 2013, the Council of Ministers enacted a
Seed Regulation in February 2016, and MoANR adopted a Seed Sector Strategy to support the
development of the seed system in 2017.
3 In Ethiopia, there are four legal status operation options: public, private, NGO (Civil society), or bilateral/multilateral legal status. In many cases, projects or programs are registered as NGOs (many USAID programs) or bilateral. Short-term projects often opt to be hosted by an organization that has legal status either as a public or private entity as AGRA tried to do. This has resulted in management of much of the AGRA seed program activities directly from the Nairobi AGRA headquarters along with limited engagement at policy level. Experts interviewed recommend that AGRA establish a clear legal status that allows it to operate independently.

108
EVALUATION OF AGRA AFRICA’S SEED SYSTEMS PROGRAM FINAL REPORT
However, the seed regulatory environment was incomplete without Ministry of Agriculture and Rural
Development (MoANR) and Regional Bureaus of Agriculture issuing directives and procedures as per their
respective mandate outlined in the Proclamation and the Regulation. The country also lacked a national
and overarching seed policy framework that clearly articulates how the Government planned to develop
the sector. Elements of the Government’s seed policy were stated in several documents of national
development policies, strategies and plans including the Rural Development Policy and Strategies,
Agricultural Sector Policy and Investment Framework (PI) and the Growth and Transformation Plan II
(GTPII). Therefore there was a need to design and implement an overarching and comprehensive national
seed policy. Consultations with stakeholders recommended that there would add value if it supported the
development, validation and approval of overarching national seed policy. As in Tanzania, AGRA, through
the MIRA project, has made significant contributions to this seed policy development process.
AGRA’s strategic approach and achievements
It was difficult to undertake policy analysis and reform in Ethiopia especially targeted at expanding
private sector investment until recently because the government did not believe that the private
sector had adequate capacity to take over these functions in the seed industry.
AGRA adopted a strategy of embedding the MIRA Coordinator in ATA instead of setting up typical
policy hubs and nodes. The one-person Node and Hub coordinator rose to become a Systems
Director and influenced policies from inside the government. This approach overcame the initial
fear of pushing too hard on policy reforms for fear of antagonizing government.
AGRA helped ATA set up the policy position to undertake more policy analysis.
The Secretary of the ATIC (ATA Implementation Council) played a critical role in championing the
draft national seed policy. The council, chaired by the Prime Minister, fast-tracks approved
reforms approved through the House of Representatives to move on straight to implementation.
Therefore, AGRA’s direct policy intervention was related to ATA’s engagement in promoting direct
seed marketing (DSM) using the AGRA grant and facilitation and support of the drafting of the
national seed policy together with other partners.
Challenges and lessons learnt
As mentioned above, the main policy related activity was scaling up of direct seed marketing
(DSM). This is a direct result of the modality of implementation whereby AGRA seed programs in
Ethiopia focused on capacitating seed actors to scale up their interventions for improved uptake
of seeds of improved crop varieties, rather than addressing systemic policy challenges and
bottlenecks in the seed sector.
Regarding national seed policy, there was an ownership struggle between the National
Agricultural Research Council (NARC) and The Policy Research Center in the policy document
preparation. Initially, it was the MOA together with partners (MIRA, ATA, ISSD and other) who
developed the first draft seed policy, then it was decided by the Minister that the responsibility
of developing such policy lies with NARC. At a later stage, the Policy Research Center in the Office
the Prime Minister’s (PM) Office asserted it was their mandate and took over the draft.
During this stage, there was a political change in the government leading to the document
returned to MoA.

109
EVALUATION OF AGRA AFRICA’S SEED SYSTEMS PROGRAM FINAL REPORT
The MOA (new Minister) decided that the draft seed policy document should be part of the
National Agricultural Policy, which is now under preparation.
Conclusion and recommendations
The MIRA coordinator through AGRA support has been engaged in the development of the National Seed
Policy. The current status is that, following a decision by the Minister, the draft seed policy is to be
incorporated in the upcoming National Agricultural Policy so that it will be part of the agricultural policy.
Thus, the document is still not official.
Overall, AGRA’s seed program in Ethiopia appears to have had limited direct policy engagement, despite
Ethiopia being a MIRA project country. The lack of legal status for AGRA which would allow independent
operation in the country has limited the visibility of the program.
The program has focused on capacity building of grantees and interventions to scale up engagement of
activities with no interventions directed at systemic policy bottlenecks. The AGRA seed program in
Ethiopia needs a balance of interventions aimed at addressing systemic policy challenges and seed actors’
specific challenges. This implies there is need for AGRA to directly engage in policy reviews, stakeholder
consultations and implementation of priority interventions to address systemic bottlenecks.
AGRA should establish an independent status in Ethiopia so that reforms can be effectively supported
to improve scaling up of seed production, delivery and uptake.
9.7 Enabling Environment Synthesis and Recommendations
The AGRA strategy of addressing policy gaps through grants to Hubs and Nodal points, is being
delivered to some extent particularly in Ghana. The robustness of the strategy was impaired by
being generic and therefore not focusing on specific country policy issues in a prioritized manner.
The approach of country specific focus would benefit from a thorough policy analysis within the
countries of operation to flag up the lower hanging policy intervention/fruits for maximum
impact on the ground. This policy is either missing or misplaced because it was not produced
anywhere. It is on the ground where the impact is most urgent in order to modernize and
transform the seed sector in the target countries for the benefit of farmer livelihoods food
security and country economic growth.
A detailed seed policy and regulations analysis is needed to determine gaps which are slowing
down crop varietal turnover and a strategy developed with clear priorities so that limited
resources can be targeted at improving quality and smooth flow of seed through the value
chain and hence make seed business viable. This is particularly the case in Ghana where seed
companies are more of seed growing farms without the much-needed infrastructure and
personnel to process, package and brand seed varieties for the market.
Seed regulation including crop variety protection is generally domiciled within the Ministry of
Agriculture as a directorate or department. They have very little influence as departments on
either budget making or disbursement. This is a huge operational impediment to a function
whose delivery is based on precise timing of inspections linked very closely to the crop
phenology, robust mobility and speed to cover large areas of seed crop and laboratory analytical

110
EVALUATION OF AGRA AFRICA’S SEED SYSTEMS PROGRAM FINAL REPORT
competence and capacity to generate data on which decisions are based. To reverse this, there
is an urgent need to radically improve the autonomy of the regulatory function including the
leadership structure to enhance speed and precision of service delivery. This calls for removal
of this function from the mainstream Ministry of Agriculture structure to an independent
Agency reporting to the board but seeking concurrence of the Ministry on key policy issues.
In all countries the regulatory function has a critically low number of inspectors. To mitigate
against this there is urgent need to get third party support to operationalize the private seed
inspection accreditation by the directorates. This will call for development of the curriculum,
mode of delivery, duration of the training, mode of examinations and certification, sample
size random audits of their work by the regulatory directorate personnel to ensure standards
are kept and the threshold for dismissal of a certified inspector, in case of incompetency or
lack of integrity.
Seed regulatory decisions are mostly based on laboratory analytical results or data. However,
the much-needed laboratory capacity is generally extremely weak to absent (except Tanzania).
To restore this function and the accruing benefits to the seed sub-sectors, the necessary
equipment must be bought, repaired and in some cases commissioned. This will add even
bigger value if the laboratory analysts in both cases undergo a re-tooling program to enhance
their analytical competency to world-class levels.

111
EVALUATION OF AGRA AFRICA’S SEED SYSTEMS PROGRAM FINAL REPORT
References Abrahams P., Beale, T., Cock, M. Corniani, N., Day, R., Godwin, J., Murphy, S. Richards G. and Vos, J.
(2017). Fall Armyworm Status Impacts and control options in Africa: Preliminary Evidence Note.
CABE
Access to Seed Index (2018). Landscaping study on the rise of the seed-producing cooperative in
Western and Central Africa
AGRA (2018). Africa Agriculture Status Report: Catalyzing Government Capacity to Drive Agricultural
Transformation (Issue 6). Nairobi, Kenya: Alliance for a Green Revolution in Africa (AGRA)
AGRA (2018). Scaling Seed and Technologies Partnership in Africa, Final Report July 2, 2013 – September
30, 2018
AGRA (2017) Seeding an African Green Revolution: The PASS Journey. Nairobi, Kenya: AGRA.
Barnett, C., Chisvo, M and Pinto, Y (2011) East Africa synthesis report (Kenya, Tanzania, Uganda) Country
case studies on the pass value chain strategy/ approach and its impact/ effect on smallholder
farmer yields in Africa.
Chikobola, M.M & Tembo, G,.2018. Gaps in the implementation of the e-voucher system in Zambia:
Implications for strategies to make the model efficient and effective. Policy brief. African Journal
of Agricultural and Resource Economics Volume 13 Number 2 pages 193-197.
Chishimba, B. 2018. The Effectiveness of E-Voucher on Agriculture in Zambia. The Case of Kafue,
Munich, GRIN Verlag, https://www.grin.com/document/418640.
Elliot, A. Tanzania, Registering & Certifying Inputs: Updated Assessment of Key Constraints &
Recommendations for Change.
Ellis-Jones, J., Hella, J., Stenhouse, J., Gridley, H., Amaza P. and Kambewa, D. (2010) Mid-Term Review of
the Program for Africa’s Seed Systems.
Food and Agriculture Organization of the United Nations (FAO) Program Evaluation Report 2017:
http://www.fao.org/evaluation
Food and Agriculture Organization of the United Nations (FAO) Crop Prospects and Food Situation
Quarterly Global Report March 2018: www.fao.org/giews/
Kambewa, D., Wellard, K., Amaza, P., Odame, H., Gridley, H., Stenhouse, J., Mponda, O., Alemu, D., and
Tapsoba, H. (2013) Final Evaluation of the Program for Africa’s Seed Systems PASS Phase I.
Kasoma, A.C. 2018. Implementation of the E-Voucher in Zambia; Challenges And Opportunities. The PMRC e-voucher research report 2017/2018. https://www.researchgate.net/publication/330281011.
Louwaars, N and de Boef, W (2012) Integrated Seed Sector Development in Africa: A basis for seed policy and law. Crop Improvement 26:29-59.
Osei,R.D., Osei-Akoto,I., Fenny,A.P., Adu,P and Hodey, L. (2016). The Impact of Agro-dealer Training on
Input Adoption and Farmers’ Productivity in Niger: Has the Investment in Agro-dealer Networks
Worked? Institute of Statistical, Social and Economic Research, University of Ghana

112
EVALUATION OF AGRA AFRICA’S SEED SYSTEMS PROGRAM FINAL REPORT
Walker, T., Alene, A., Ndjeunga, J., Labarta, R., Yigezu, Y., Diagne, D., Andrade, R., Muthoni, R.,
Andriatsitohaina, De Groote, H., Mausch, K., Yirga, C., Simtowe, F., Katungi, E., Jogo, W., Jaleta,
M., Pandey, S. (2014) Measuring the Effectiveness of Crop Improvement Research in Sub-
Saharan Africa. Synthesis Report for the Diffusion and Impact of Improved Varieties in Africa
(DIIVA) Project. Independent Science and Partnership Council (ISPC), CGIAR.
Wellard, K. (ed) (2011) Pathways to Commercialisation: Supporting Smallholder Farmers. CAADP Policy
Brief 02. Future Agricultures Consortium.

113
EVALUATION OF AGRA AFRICA’S SEED SYSTEMS PROGRAM FINAL REPORT
10 Appendices
Appendix 1: Evaluation approach
Prepare for the study
Review the hypothesis/theory of change/results chain
Review the proposed indicators and select and
finalize the indicators
Operationalize the study
design
Choose the study design
Confirm the study team
Train data collection
teams
Choose the sample
Decide on the sample size
Confirm the sampling strategy
Data collectionDetermine the type of data to
be collected
Develop the data collection
tools and protocols
Pilot test the instruments
Conduct field work
Process and validate data
Produce and disseminate
findingsAnalyze the data Write reports
Validate findings with key
stakeholders
Disseminate findings
Review literature to inform sample and identify key
issues: AGRA reports, seconday data

114
EVALUATION OF AGRA AFRICA’S SEED SYSTEMS PROGRAM FINAL REPORT
Appendix 2: Evaluation Design Matrix
Evaluation criteria
Evaluation questions Method of data collection
Sources of data Selection of respondents
Data analysis and reporting
Design/ relevance
Did PASS and SSTP investments adequately reflect the development agenda and agricultural transformation strategies in focus countries?
Document review using a structured framework
Agriculture strategy and plans, seed policies, PASS & SSTP design documents & reports
Consultations with AGRA team and country ministry of Agriculture staff
Narrative/thematic analysis to establish the degree of coherence with national plans, strategies with interventions
To what extent does the PASS & SSTP intervention design support the AGRA strategy and goals?
Document review using a structured framework
PASS & SSTP design documents and reports
Consultations with AGRA team
Narrative/thematic analysis mapping AGRA goals, achievements against targets
Effectiveness Did PASS and SSTP stimulate private sector investments?
Data extraction matrices Stakeholder mapping Key informant interviews with private sector players Document review using a structured framework
Progress reports Data from key informant interviews
Private sector stakeholder mapping and consultations with AGRA team
Narrative/thematic analysis of secondary data and causal analysis of data from interviews to assess private sector investments and cause-effect relationship with PASS&SSTP investments
What country level and regional policy and regulatory reforms did AGRA support/facilitate that increased production, delivery and uptake of improved seeds and technologies? What reforms still need to be supported in focus countries and regions to improve scaling up of seed production, delivery and uptake?
Key informant interview with ministry representatives Policy timeline Document review using a structured framework
Data from key informants Progress reports Government policies and regulatory reform papers
Consultations with AGRA team and country ministry of Agriculture staff
Narrative/thematic analysis to establish the supported policies and regulatory reforms Causal analysis Gap analysis to find out the reforms that still need to be supported.
Did the approach of starting seed companies result in improved uptake of new improved varieties and technologies?
Key informant interviews of seed company managers/owners Document review
Seed companies Farmers Progress reports
Non-probability sampling based on availability Random sampling
Discourse analysis of primary data from the interviews Causal analysis
Has the AGRA approach of agro-dealer development resulted in improved access and uptake of improved inputs by farmers in target areas?
Key informant interviews of agro-dealers, seed cos managers/owners Document review
Agro-dealers Seed companies Farmers Progress reports
Non-probability sampling based on availability Random sampling
Discourse analysis of primary data Causal analysis

115
EVALUATION OF AGRA AFRICA’S SEED SYSTEMS PROGRAM FINAL REPORT
Did the AGRA supported companies scale up production and operations and crowd out the national, regional and international seed companies? What were the key features of scaling and how can this be replicated in future?
Key informant interviews Document review using a structured framework
Agro-dealers and seed company managers/owners, seed inspection organizations, seed trade associations Progress reports
Non-probability sampling
Discourse analysis of primary data from the interviews Causal analysis
To what extent have AGRA supported seed companies been successful in crops other than maize? How can we adapt this model to other crops in future?
Key informant interviews Document review using a structured framework
Agro-dealers and seed company managers/owners, seed inspection organizations, seed trade associations Progress reports
Non-probability sampling
Discourse analysis of primary data from the interviews
Which improved seeds and technologies were developed by PASS and scaled up by SSTP? What were the key enablers/ barriers to scaling up efforts?
Document review using a structured framework Key informant interviews
PASS & SSTP physical progress reports PASS & SSTP staff Ministry of agriculture staff
Consultations with AGRA team
Discourse analysis of primary data from the interviews
Efficiency To what scale did the financial resources respond to the PASS & SSTP intended objectives?
Document review using a structured framework
PASS & SSTP design documents and financial & physical progress reports
Consultations with AGRA team
Cost-benefit analysis
To what extent was the grant making commensurate with PASS & SSTP plans and country priorities?
Document review using a structured framework/data extraction matrix
PASS & SSTP design documents and financial & physical progress reports Country agriculture strategies & plans
Consultations with AGRA team
Narrative/thematic analysis of secondary data
Impact To what extent did AGRA work increase the use of improved seeds and technologies by smallholder farmers at scale in the target countries, and how did this impact change of yield levels in the respective countries?
Structured interviews Focus group discussions Document review
Data from structured interviews with farmers Progress reports
Random sampling Causal analysis of primary data from the interviews and focus group discussion Gender disaggregation Crop disaggregation Agroecological zone disaggregation
What are the major changes- direct/indirect, positive/negative, intended/unintended?
Structured interviews Key informant interviews Focus group discussions Document review using a structured framework
Data from structured interviews with farmers PASS & SSTP physical progress reports PASS & SSTP staff Ministry of agriculture staff
Random sampling Causal analysis Narrative/thematic analysis of secondary data
How have the gross margins obtained from maize, cassava, beans and Irish
Structured interviews
Data from structured interviews with farmers
Random sampling
Causal analysis

116
EVALUATION OF AGRA AFRICA’S SEED SYSTEMS PROGRAM FINAL REPORT
Potatoes changed over the implementation period?
Document review using a structured framework
progress reports
Consultations with AGRA team-SSTP
Narrative/thematic analysis of secondary data
What is the degree of attribution of changes, outcomes and impacts to PASS & SSTP interventions?
Structured interviews Key informant interviews Focus group discussions Document review
Data from structured interviews with farmers PASS & SSTP physical progress reports PASS & SSTP staff Ministry of agriculture staff
Random sampling Consultations with AGRA team-SSTP
Causal analysis Narrative/thematic analysis of secondary data
Sustainability To what extent have varieties produced by AGRA supported breeders been commercialized by seed companies and adopted by farmers?
Key informant interviews Document review using a structured framework
Seed company managers/owners, seed inspection organizations, breeders PASS & SSTP physical progress reports
Non-probability sampling
Discourse analysis of primary data from the interviews Causal analysis
Are agro-dealers that were supported by AGRA still functional, financially viable and selling viable amounts of seed to smallholder farmers?
Key informant interviews Focus group discussions (farmers) Document review
Agro-dealers Agro-dealer records Smallholder farmers
Non-probability sampling Random sampling of farmers
Discourse analysis of primary data from the interviews and focus group discussions
How many of the seed companies started by PASS are financially viable today and selling meaningful quantities of seed?
Key informant interviews Document review using a structured framework
Seed company managers/owners, seed inspection organizations, breeders Seed company records PASS & SSTP physical progress reports
Non-probability sampling
Discourse analysis of primary data from the interviews
To what extent have AGRA trained breeders been absorbed in country research systems and has this resulted in improved functioning of national research stations?
Document review using a structured framework Key informant interviews
National research station records Trained breeders Progress reports
Consultations with AGRA team and national research station personnel Random sampling of trained breeders
Discourse analysis of primary data from the interviews Data disaggregation by gender
Other key areas
How were gender considerations incorporated into the implementation processes?
Key informant interviews Document review using a structured framework
PASS & SSTP progress reports Grantee proposals & reports
Consultations with AGRA team
Narrative/thematic analysis of secondary data
For the study focus crops i.e. maize, cassava, beans, potatoes, were interventions based on value chain analysis? What were the key aspects?
Key informant interviews Document review
PASS & SSTP design docs physical progress reports Grantee proposals & reports
Consultations with AGRA team
Narrative/thematic analysis of secondary data

117
EVALUATION OF AGRA AFRICA’S SEED SYSTEMS PROGRAM FINAL REPORT
Appendix 3 PASS output targets and achievements 2007-2018 Sub-program
Outputs Targets LOA Level of achievement met against 10-year target
2007 PASS Business Plan 2009 PASS M&E plan
10-year 5-year 5 year 5-year 10-year
EACI PhD Programs 2 2 2 2 2 100%
MSc Programs 10 10 9 9 13 130%
PhDs 80 80 enrolled 8 graduated 72 enrolled
graduated 78 enrolled
160 100%
MScs 170 170 graduated
136 graduated 34 in progress
graduated 175 enrolled
341 100%
Research technicians
- - 64 152 -
Number of publications
- - 64 19 published 3 accepted
200+ -
FIACC Grants awarded/ projects funded
92 105 161 -
Varieties released 1250 0 447 333 665 55%
Varieties commercialised
- - 271 208 431 159%
SEPA Seed companies 40 38 107 80 114 146%
Annual seed production (MT)
186,000 15,500 46,149 10,794 140,000 77%
Agro-dealers recruited
- - 4,905 na
ADP No. of agro-dealers 9,000 in 13 countries
4,600 in 9 countries
5,150 new agro-dealer shops
na 19,174 trained
213%
No. of agro-dealers accessing GF
- - 5,645 na
No. of agro-dealer associations
183 na
Program level
Yield increase of improved varieties
20%
Source: PASS Business Plan, 2007; PASS M&E Plan, 2009; AGRA Grant Narrative Reports 2007-12; PASS Close out report, 2017

118
EVALUATION OF AGRA AFRICA’S SEED SYSTEMS PROGRAM FINAL REPORT
Appendix 4 SSTP Achievements against targets Country Ethiopia Ghana Malawi Mozambique Senegal Tanzania Total to
date Project Target
Level of achiev-ement v target
Quantity of improved seed produced by SSTP supported enterprises
5,066 17,902 6,030 4,710 7,626 7,986 49,319
43,698 113%
Number of new seed or technology enterprises, established, owned, led by women supported through SSTP
4 0 4 0 0 18 26 12 216%
Number targeted seed varieties/technologies commercialized with SSTP support
4 22 11 8 13 9 67 50 134%
Number targeted seed varieties/technologies Scaled with SSTP support
7 19 10 27 30 20 113 -
Number of infrastructure and equipment sub-activities completed as a result of SSTP
1 0 3 24 0 42 70 -
Average distance (km) from farmers to agro dealers
6 17 8 9 15 6 10 6 167%
Number of public-private partnerships formed as a result of SSTP
4 0 1 1 0 1 7 12 58%
Number of hectares of land under improved technologies/management practices as result of SSTP
114,141 101,674 286,408 103,369 78,484 258,521 978,082 3,129,744 31%
Number of farmers who applied improved technologies/management practices as result of SSTP
165,190 63,682 342,269 64,288 68,711 134,897 761,756 684,000 111%
Number of private enterprises, CBOs that applied improved technologies/ managemt practices as result of SSTP
196 164 32 47 76 128 643 250 257%
Number of stakeholder consultations
as a result of USG assistance
0 2 0 0 0 68 70 14 500%
Number of agricultural and nutritional
enabling environment policies drafted
or revised as a result of USG assistance
2 0 0 0 0 1 3 11 27%
Number of agricultural and nutritional
enabling environment policies
implemented as a result of USG
assistance
0 0 0 0 0 0 0 0 -

119
EVALUATION OF AGRA AFRICA’S SEED SYSTEMS PROGRAM FINAL REPORT
Appendix 5: Farmer-preferred traits for AGRA-supported varieties
Country House-
hold
category
Crop Of those that tried the varieties, percentage that mentioned the following characteristics (%)
High
yields
Market-
ability
Drought/
Flood
resistant
Good
taste
Pest/
disease
resistant
Color/
appear-
ance
Good
size
Stor-
ability
Cooking
time
Early
matur-
ing
Ethiopia
AGRA Maize 86 3 6 0 0 0 0 0 0 0
Teff 89 7 0 0 1 2 0 0 0 1
Wheat 82 2 10 0 3 1 0 0 0 1
All crops 90 5 7 0 2 2 0 0 0 0
Control Maize 93 2 2 2 0 0 0 0 0 0
Teff 92 3 0 0 0 0 0 0 0 0
Wheat 83 3 3 0 3 7 2 0 0 0
All crops 94 3 3 2 1 3 0 0 0 0
Ghana
AGRA Maize 41 11 6 3 0 2 11 0 0 24
Rice 41 26 0 13 0 4 2 0 0 2
Cassava 90 0 0 0 0 5 5 0 0 0
All crops 50 15 3 6 0 3 7 0 0 14
Control Maize 42 23 10 13 0 0 3 3 0 0
Rice 60 29 2 0 2 2 2 0 0 0
All crops 54 29 6 6 1 1 3 1 0 0
Mali
AGRA Maize 66 10 3 10 0 0 2 0 0 21
Cowpea 57 7 0 0 2 9 4 0 2 17
Sorghum 77 4 7 6 0 4 2 1 0 11
All crops 71 10 6 7 0 6 4 0 0 21
Control Maize 75 0 0 0 0 0 0 0 0 0
Cowpea 55 9 0 14 0 5 5 0 5 5
Sorghum 73 0 0 9 0 9 9 0 0 0
All crops 65 5 0 10 0 5 5 0 2 2
Uganda
AGRA Maize 60 3 10 4 5 0 5 0 0 6
Beans 39 21 0 16 2 0 0 0 5 2
All crops 62 10 9 10 5 0 4 0 3 6
Control Maize 70 3 8 5 2 0 1 0 0 4
Beans 35 16 2 16 6 0 2 0 6 4

120
EVALUATION OF AGRA AFRICA’S SEED SYSTEMS PROGRAM FINAL REPORT
Source: Evaluation household survey, 2018
All crops 68 9 8 10 3 0 2 0 2 5
Tanzania AGRA Maize 69 3 9 3 2 3 3 2 0 9
Rice 53 18 18 12 0 6 0 0 0 0
Beans 54 13 6 2 0 0 0 0 0 0
Cassava 63 0 5 5 0 0 0 5 0 0
All crops 74 8 11 6 1 3 3 2 0 8
Control Maize 66 5 12 6 4 0 4 0 0 3
Rice 68 23 5 5 0 0 0 0 5 9
Beans 62 10 2 5 5 0 0 0 2 5
Cassava 43 4 0 26 4 0 0 4 0 9
All crops 70 8 11 10 5 0 4 1 2 5

121
EVALUATION OF AGRA AFRICA’S SEED SYSTEMS PROGRAM FINAL REPORT
Appendix 6: Traits in AGRA-supported varieties disliked by surveyed farmers
Country House-
hold
category
Crop Of the households that tried the varieties, percentage that mentioned the following characteristics (%)
Low
yields
Poor
markets
Poor
Drought/
Flood
resistance
Bad
taste
Pest/
disease
resistan
ce
Color/
appear-
ance
Size Stor-
ability
Cooking
time
Culture/
unfamiliar
Ethiopia
AGRA Maize 0 2 6 0 23 0 6 6 0 3
Teff 15 1 18 0 1 1 2 0 0 1
Wheat 10 0 8 0 26 0 0 0 0 0
Any crop 9 1 14 0 21 0 4 3 0 2
Control Maize 8 2 4 2 29 0 5 2 0 0
Teff 31 8 14 0 3 0 0 0 0 0
Wheat 5 2 10 2 19 0 0 2 0 2
Any crop 14 3 19 2 29 0 4 2 0 1
Ghana
AGRA Maize 5 0 20 3 15 2 2 2 0 0
Rice 11 11 15 2 7 0 4 0 0 0
Cassava 0 71 0 0 0 0 0 0 0 0
All crops 6 16 16 2 10 1 2 2 0 0
Control Maize 6 10 13 0 23 0 0 3 0 0
Rice 20 4 24 0 7 2 0 0 4 0
Cassava 0 0 0 0 0 0 0 0 0 0
All crops 16 7 20 0 13 1 0 1 3 0
Mali
AGRA Maize 8 0 3 2 2 0 3 5 0 3
Cowpea 4 2 4 0 6 2 9 11 0 2
Sorghum 4 0 0 6 6 3 2 11 7 2
Any crop 7 0 3 4 7 3 6 13 4 3
Control Maize 0 0 12 0 0 0 0 0 0 0
Cowpea 9 0 5 4 18 9 5 14 5 0
Sorghum 0 0 9 0 9 9 9 0 0 0
Any crop 5 0 7 2 12 7 5 7 2 0
AGRA Maize 3 9 9 4 25 0 3 6 0 0
Beans 2 5 23 2 12 0 4 0 0 0

122
EVALUATION OF AGRA AFRICA’S SEED SYSTEMS PROGRAM FINAL REPORT
Source: Evaluation household survey, 2018
Uganda
All crops 3 8 15 4 24 0 4 6 0 0
Control Maize 3 10 7 2 24 0 2 5 0 0
Beans 4 6 20 2 10 0 4 2 0 0
All crops 4 9 13 2 23 0 3 5 0 0
Tanzania AGRA Maize 5 0 4 0 10 0 2 1 0 0
Rice 12 3 3 12 6 0 6 6 0 0
Beans 2 4 2 4 2 0 2 2 2 0
Cassava 0 10 0 5 10 0 0 10 0 0
All crops 6 3 5 4 11 0 3 3 0 0
Control Maize 8 2 9 3 17 0 2 4 0 0
Rice 4 9 9 5 9 0 0 5 0 0
Beans 5 2 0 0 5 0 0 0 0 0
Cassava 0 4 4 13 4 0 4 0 0 0
All crops 8 4 10 5 16 0 2 4 0 0

123
EVALUATION OF AGRA AFRICA’S SEED SYSTEMS PROGRAM FINAL REPORT
Appendix 7: TASAI Breeding scores for selected countries
ETHIOPIA
GHANA
KENYA
MALAWI
MOZAMBIQUE TANZANIA
UGANDA
ZAMBIA
Number of active breeders
Maize 23 Maize 10 Maize 34 Maize 4 Maize 6 Maize 28 Maize 7 Maize 17
Wheat 20 Rice 5 Sorghum 7 Beans 3 Rice 8 Sorghum 7 Sorghum 2 Rice 5
Teff 10 Soybean 5 Beans 17 Groundnut 2 Cowpea 4 Beans 7 Beans 4 Groundnut 3
Sorghum 16 Cowpea 6 Cowpea 5 Soybean 2 Soybean 2 Pigeonpea 4 Millet 2 Beans 1
Total 74
26
63
11
20
46
15
26
Adequacy of breeders (score out of 100)
Maize 75 Maize 83 Maize 68 Maize 71 Maize 90 Maize 63 Maize 72 Maize 64
Wheat - Rice 70 Sorghum 48 Beans 46 Rice 90 Sorghum 54 Sorghum 55 Rice 80
Teff 100 Soybean 60 Beans 57 Groundnut 56 Cowpea 63 Beans 54 Beans 80 Groundnut 55
Sorghum 10 Cowpea 80 Cowpea 48 Soy bean 54 Soybean 68 Pigeonpea 37 Millet 40 Beans 60
Mean 70
72
54
58
77
57
69
66
Number of varieties released in last 3years
Maize 12 Maize 17 Maize 61 Maize 17 Maize 5 Maize 44 Maize 26 Maize 37
Wheat 15 Rice 0 Sorghum 3 Beans 0 Rice 3 Sorghum 2 Sorghum 4 Rice 3
Teff 3 Soybean 0 Beans 14 Groundnut 0 Cowpea 0 Beans 0 Beans 5 Groundnut 2
Sorghum 7 Cowpea 0 Cowpea 2 Soy bean 0 Soybean 0 Pigeonpea 4 Millet 5 Beans 2
Total 37
17
80
17
8
50
40
44

124
EVALUATION OF AGRA AFRICA’S SEED SYSTEMS PROGRAM FINAL REPORT
Appendix 8 Integration between Formal and Informal Seed Systems
Source: Louwaars, N and de Boef, W (2013)
Note: Circled domain depicts the Informal seed system: Seed selection, production, diffusion. Outer elements
show the Formal system: Genetic resources, breeding, release, multiplication, marketing. Dashed arrows show
linkages between the formal and informal seed systems. Examples of interaction are shown in the white boxes.

125
EVALUATION OF AGRA AFRICA’S SEED SYSTEMS PROGRAM FINAL REPORT
Appendix 9 Key Informants Interviewed
Name Position Organization
UGANDA
Crop Development
Dr. Charles Lwanga Kasozi Senior Research Officer NACCRI-Namulonge
Dr. Phinehas Tukamuhabwa Professor Makerere University
Mr. Ebiyau Jonnie Breeder NARO-Serere
Dr. K Kagoda Breeder NARO-Buginyanya
Dr. Gorrrettie Ssemakula Principal Research Officer NARO-Mulonge
Dr. Stanley Nkalubo Bean Breeder NARO/ NaRL
Dr. Godfrey Asea Cereal Breeder Cereal breeder NARO/NaCCRI
Dr. Lamo Jimmy Rice Breeder NARO - Namulonge
Dr. Kauki Robert Cassava Breeder NARO - Namulonge
Seed Company
Mr. Eugine Luzige General Manager Masindi limited
Mr. Masagazi Cliff Richard Managing Director Pearl seeds limited
Mr. Peter Otim Odoch Executive Director Otis Garden Seed Limited
Mr. Narcis Tumushabe
Chief Executive Officer
Farm Inputs Care Centre (FICA)
Limited
Kasaija P.W Banage Chief Executive Officer Seed Co Ltd
Nicolai Rodeyns Chief Executive Officer SESACO (1996) Ltd
Kasaija P. w. Bange Country Rep SeedCo Seed Company
Nicolai Rodeyns MD Naseco Seed Company
Policy
Paul Mwambu Comm. Regulations, Certification
& Crop Protection
Ministry of Agriculture MAAIF
Edward Moses Erongu Comm. Regulations, Certification
& Crop Protection
MAAIF
Joseph Bazaale Seed Inspection MAAIF
Mr. Okiror Ass. Comm. Policy Dep’t- MAAIF
Dicolai Rodeyns Managing Director NASECO Seed Company
Kasaija P. W. Bange Country Rep SEED.CO Seed Company
Chris Ibyisintabyo Seed Consultant Independent Seed Consultant,
Kampala
Joseph Bazaale Assistant Commissioner Ministry of Agriculture, Entebbe
Other
Nelson Masereka Chief Executive Officer Uganda Seed Traders Association

126
EVALUATION OF AGRA AFRICA’S SEED SYSTEMS PROGRAM FINAL REPORT
ETHIOPIA
Adefris T Wold (PhD) Former Director for Crops
Research
Ethiopian Institute of Agricultural
Research (EIAR)
Taye Tadesse (PhD) Director for Crops Research Ethiopian Institute of Agricultural
Research (EIAR)
Legesse Wolde (PhD AGRA project coordinator Bako Agricultural Research Center, EIAR
Bedada Girma (PhD) AGRA project coordinator (wheat) Kulumsa Agricultural Research center,
EIAR
Adam Bekele (PhD) Director, Planning, Monitoring and
Evaluation
Ethiopian Institute of Agricultural
Research (EIAR)
Kindie Tesfaye (PhD)
AGRA Project coordinator,
Masters Training in Seed Science
and Technology
College of Agriculture and
Environmental Sciences, Haramaya
University,
Bobe Bedadi (PhD)
AGRA project coordinator,
Masters Training in Seed Science
and Technology
College of Agriculture and
Environmental Sciences, Haramaya
University,
Abebe Atilaw (PhD)
Director, Technology
Multiplication & Seed Research
Directorate
Ethiopian Institute Of Agricultural
Research (EIAR)
Getachew Birru Center Director
Bako Agricultural Research Center,
Ethiopian Institute Of Agricultural
Research (EIAR)
Yitbarek Simane (PhD)
Director, Inputs & Plant Protection
Program and AGRA project
coordinator
Ethiopian Agricultural Transformation
Agency
Yonas Sahlu AGRA Coordinator AGRA Ethiopia Office
Gezahegn Ayele (PhD) AGRA Deputy coordinator AGRA Ethiopia Office
Woldehawariat Assefa Director General Plant Health and regulatory director
Daniel Mekonnen Director Plant Variety Release, Protection and
Seed Quality Control Directorate
Seifu Abebe Director Inputs Marketing Directorate
Tesfaye Kumsa (PhD) Manager and AGRA grant
coordinator
Nono Agricultural Development PLC
Melese Temesgen (PhD) Manager and AGRA grant
coordinator
Aybar Engineering PLC
Tesfaye Shimber (PhD) Director, Soil and water Research
directorate
Ethiopian Institute Of Agricultural
Research (EIAR)
Ameha Abraham Manager Amuari
Abera Beyene Director Inputs Marketing Directorate, Oromia
Regional Bureau of Agriculture
Belay Hariso Manager South Seed Enterprise
Feleke Gezahegn Manager Ethiopian Seed Enterprise
Astrid Mastenbroek Chief of Party Integrated Seed Sector Development (ISSD) SSD
Chris Ibyisintabyo Consultant Ex USTA (seed sector consultant)

127
EVALUATION OF AGRA AFRICA’S SEED SYSTEMS PROGRAM FINAL REPORT
GHANA
Crop Development
Dr. Stella A. Enning Director Crops Research Institute, Council for
Scientific and Industrial Research (CSIR)
Prof. Joe Manu-Aduening Cassava Breeder Crops Research Institute, CSIR
Prof. Hans Adu-Dapaah Cowpea Breeder/Former Director Crops Research Institute, CSIR
Dr. Maxwell D. Asante Rice Breeder Crops Research Institute, CSIR
Dr. Ernest Baafi Sweet Potato Breeder Crops Research Institute, CSIR
Dr. James Y. Asibuo Groundnut Breeder Crops Research Institute, CSIR
Dr. Stephen Amaoh Cowpea Breeder Crops Research Institute, CSIR
Dr. Allen Oppong Maize Breeder Crops Research Institute, CSIR
Dr. Kwadwo Adofo Sweetpotato Breeder Crops Research Institute, CSIR
Mad. Gloria Adu
Boakyewaa
Maize Breeder Savanna Agricultural Research Institute
(SARI)
Seed Companies
Nana Odiasempa Antwi
Obugyei
CEO/Owner Sparkx SM Ghana Ltd.
Hon. Martha Bruckner CEO/Owner Bruckner Farms
Mr. A. Kassim Production manager Bruckner Farms
Kwaku Asare Farm Manager Pee Farms Ltd.
Hon. Pangabu Mohammed
Issifu
CEO/Owner Pee Farms Ltd.
Mrs. Janet Gyima-Kessie CEO Josma Agro-Industry Ltd.
Mr. Oppong M&E Officer Josma Agro-industry Ltd.
Amos Rutherford Azinu CEO Legacy Crop Improvement Center (LCIC)
M. Iddrisu Production Manager Heritage Seeds, Tamale
Juliet Biney CEO Agric Support (AGS) and More
Resources Ltd.
Mrs. Afua Ansre CEO Innovation Village Seed Company Ltd.
Mr. E. Amoako Production Manager Innovation Village Seed Company Ltd.
Knowledge Institutions
Prof. Richard Akromah Plant Breeder/Principal
Investigator for AGRA MSc
(Cultivar Development)
Kwame Nkrumah University of Science
and Technology (KNUST), Kumasi
Prof. R. C. Abaidoo Director Office of Grants and Research, KNUST-
Kumasi
Prof. Eric Y. Danquah Director West Africa Center for Crop
Improvement (WACCI), University of
Ghana, Legon-Accra
Ministry of Food and Agriculture
Mr. Eric Quaye Head, Seed Section and Secretary
to Ghana Seed Council
Plant Protection Regulatory Services
Division (PPRSD) of Ministry of Food
and Agriculture (MoFA)
Dr. Solomon G. Ansah Head, Seed Unit Crop Services Directorate, MoFA
Josephine Ivy Quagraine Head Policy Planning, Monitoring and
Evaluation Division (PPMED), MoFA

128
EVALUATION OF AGRA AFRICA’S SEED SYSTEMS PROGRAM FINAL REPORT
Others
Evelyn Ama Denchern Program Coordinator for ECOSIB
Project
Agri Impact Consult, Accra
Juliana Asante-Dartey Partner Agri Impact Consult, Accra
Mr Thomas W. Havor President National Seed Trade Association of
Ghana (NASTAG)
Mrs. Augusta Clottey Executive secretary National Seed Trade Association of
Ghana (NASTAG)
Iddrisu Yakubu Technical Advisor on policies National Seed Trade Association of
Ghana (NASTAG)
MALI
Breeders
Mr Fousseyni Traoré Rice breeder IER Sikasso
Dr Abdoulaye Diallo Sorghum breeder IER Bamako
Dr Niaba Teme Biotechnoligy/breeder IER Bamako
Dr Mamdou Mory Coulibaly Maize breeder IER Bamako
Policy
Mr Mahamadou Keïta Program officer/focal point AGRA National directorate of Agriculture
Bamako
Agrodealers
Seydou Koné Business partner Diakité & fils Bamako
Seydou Traoré Head of Enterprise B19 Bamako
Drissa Coulibaly Business partner Agrimega SARL
Ousmane Kayentao Employee AGRIPlus Bamako
Mamadou Konaré Head of Enterprise CAPAMA Bamako
Koumba Traoré Shareholder Senebulon
Seed Companies
Mme Coulibaly Maïmouna
Sidibé
Director FASO KABA SARL Bamako
Soumaïla Maïga Director Société Nakoshi-SARL Bamako
Karim Mallé Director ZAMONO Koutiala
Mamadou Kayentao Director AGRIPlus Bamako
Others
Dr Aboubacar Touré Breeder former PASS program
lead AGRA
ICRISAT Bamako
N’Tji Coulibaly Former breeder IER Bamako (retired)

129
EVALUATION OF AGRA AFRICA’S SEED SYSTEMS PROGRAM FINAL REPORT
TANZANIA
Breeders/Research
Dr. Eveline Lukonge Director of Research and
Innovation
Tanzania Agricultural Research
Institute-Ukiriguru (TARI) Mwanza
Dr. Rose Mongi Plant Breeder TARI Uyole Mbeya
Dr. Arnold Mushongi Principal Agricultural Research
Officer
TARI-ILONGA, Morogoro
Dr Director
Selian Agricultural Research Institute
(SARI), Arusha
Godfrey Kessy Researcher SARI, Arusha
Jean-Claude Rubyogo Seed Systems Specialist
International Center of Tropical
Agriculture (CIAT), Arusha
Lazaro Tango Administrator ICRISAT, Arusha
Seed companies
Wilfred Mushobozi CEO Crop-Bio Science Solutions
Sophia Kashenge – Killenga CEO
Agricultural Seed Agency (ASA),
Morogoro
Musa Mbegu Field Officer Agricultural Seed Agency, Arusha
Charles Levi Extension lead Agricultural Seed Agency, Morogoro
Chacha W. G Managing Director MERU Agro-Tours & Consultants Co.
Happy Kalengo CEO MERU Agro-Tours & Consultants
Dilip Gokhale Director Africasia Seed Company
Zebron Mbwaga CEO BEULA Seed Co.
Policy and Other Official
Vianey Rweyendela Lead Program Officer AGRA Tanzania
Bob Shuma Executive Director
Tanzania Seed Trade Association
(TASTA)
Khomba Canuth National Seed Coordinator
Seed Section Unit, Ministry of
Agriculture, Livestock and Fisheries
Dr Swella Acting Director
Tanzania Official Seed Certification
Institute (TOSCI)
Dr Matengia NPT In-charge TOSCI
Violet Muweso District Executive Officer (acting) Bagamoyo District Council
Daniel Luther
District Agriculture, Irrigation and
Cooperative Officer Babati District Council
Education
Prof Cornel Rweyemamu
(M) Professor of Crop Physiology
Crop Science Department, Sokoine
University of Agriculture

130
EVALUATION OF AGRA AFRICA’S SEED SYSTEMS PROGRAM FINAL REPORT