African Cities and the Structural Transformation: Evidence from Ghana ... · African Cities and the...
59
African Cities and the Structural Transformation: Evidence from Ghana and Ivory Coast R´ emi Jedwab ∗ Draft Version: January 8th 2010. Abstract Africa has recently known dramatic urban growth, which is good news if urbaniza- tion drives growth. Yet, the agglomeration effects story was built on manufacturing and tradable services, two sectors under-represented in Africa. We develop another story where urbanization is pushed by rural windfalls, with a case study on cocoa production and cities in Ivory Coast and Ghana. Combining decadal district-level data on cocoa production and cities from 1901 to 2000, we show how cities fol- low the cocoa front. Indeed, we use the fact that cocoa is produced by ”eating” the virgin forest: (a) only forested areas are suitable to cocoa, i.e. the south of both countries, (b) for agronomic reasons, cocoa farmers move to a new forest every 25 years, thus causing regional cycles, and (c) the cocoa front has started from the (South-)East of both countries. The cocoa front had to move westward, within the South. We can instrument cocoa production with a westward wave. We find that cocoa production explains more than half of urbanization in both coun- tries. We give evidence for the channels underlying this relationship, emphasizing consumption linkages that create consumption cities. We discuss whether such a specialization can make African cities powerful engines of growth. JEL classification codes: N97, O12, O18, R11, R12. Keywords: Urbanization, Cash Crops, Resource Curse, Africa. ∗ Paris School of Economics (e-mail: [email protected]). I am extremely grateful to De- nis Cogneau and Guy Michaels for their encouragement and support. I would like to thank Sylvie Lambert, Thomas Piketty, Robin Burgess, Douglas Gollin, William Masters, Stefan Der- con, Marcel Fafchamps, Francis Teal, Jean-Philippe Platteau, Catherine Guirkinger, Alexander Moradi, Gareth Austin, Henry Overman, James Fenske, and seminar audiences at PSE, LSE, Namur, Oxford, Paris (EUDN) and Mombasa (IGC) for very helpful comments. I thank the Ivo- rian National Institute for Statistics and the Ghanaian Statistical Service for giving me access to the surveys. I am also grateful to Fran¸ cois Moriconi-Ebrard and Eric Denis from GEOPO- LIS, Vincent Anchirinah, Francis Baah and Frederick Amon-Armah from CRIG, and Sandrine Mesple-Somps from DIAL-IRD for their help with data collection. This work was supported by the Economic and Social Research Council [RES-167-25-0214].
Transcript of African Cities and the Structural Transformation: Evidence from Ghana ... · African Cities and the...

African Cities and the Structural Transformation:Evidence from Ghana and Ivory Coast
Remi Jedwab∗
Draft Version: January 8th 2010.
Abstract
Africa has recently known dramatic urban growth, which is good news if urbaniza-tion drives growth. Yet, the agglomeration effects story was built on manufacturingand tradable services, two sectors under-represented in Africa. We develop anotherstory where urbanization is pushed by rural windfalls, with a case study on cocoaproduction and cities in Ivory Coast and Ghana. Combining decadal district-leveldata on cocoa production and cities from 1901 to 2000, we show how cities fol-low the cocoa front. Indeed, we use the fact that cocoa is produced by ”eating”the virgin forest: (a) only forested areas are suitable to cocoa, i.e. the south ofboth countries, (b) for agronomic reasons, cocoa farmers move to a new forestevery 25 years, thus causing regional cycles, and (c) the cocoa front has startedfrom the (South-)East of both countries. The cocoa front had to move westward,within the South. We can instrument cocoa production with a westward wave. Wefind that cocoa production explains more than half of urbanization in both coun-tries. We give evidence for the channels underlying this relationship, emphasizingconsumption linkages that create consumption cities. We discuss whether such aspecialization can make African cities powerful engines of growth.
JEL classification codes: N97, O12, O18, R11, R12.Keywords: Urbanization, Cash Crops, Resource Curse, Africa.
∗Paris School of Economics (e-mail: [email protected]). I am extremely grateful to De-nis Cogneau and Guy Michaels for their encouragement and support. I would like to thankSylvie Lambert, Thomas Piketty, Robin Burgess, Douglas Gollin, William Masters, Stefan Der-con, Marcel Fafchamps, Francis Teal, Jean-Philippe Platteau, Catherine Guirkinger, AlexanderMoradi, Gareth Austin, Henry Overman, James Fenske, and seminar audiences at PSE, LSE,Namur, Oxford, Paris (EUDN) and Mombasa (IGC) for very helpful comments. I thank the Ivo-rian National Institute for Statistics and the Ghanaian Statistical Service for giving me accessto the surveys. I am also grateful to Francois Moriconi-Ebrard and Eric Denis from GEOPO-LIS, Vincent Anchirinah, Francis Baah and Frederick Amon-Armah from CRIG, and SandrineMesple-Somps from DIAL-IRD for their help with data collection. This work was supported bythe Economic and Social Research Council [RES-167-25-0214].

”I had a marvellous dream [...]. Close to a castle, I have seen a man all dressed in
white who told me: several years ago, this region was covered with forests. It was
only missing hands to work. Compassionately, some men have come. [...] The
forest has been gradually disappearing in front of labourers, tractors have replaced
the daba [hoe] and beautiful cities, beautiful villages, beautiful roads have replaced
the tracks only practicable during the dry season.”
Houphouet-Boigny’s Presidential Address, 25 March 1974.
”Africa’s long-term growth also will increasingly reflect interrelated social and de-
mographic trends that are creating new engines of domestic growth. Chief among
these are urbanization and the rise of the middle-class African consumer. [...]
In many African countries, urbanization is boosting productivity (which rises as
workers move from agricultural work into urban jobs), demand and investment.”
Lions on the Move: The Progress and Potential of African Economies, McKinsey 2010.
1 Introduction
While Sub-Saharan Africa was unurbanized at the turn of the 20th century, it
has recently known dramatic urban growth and it has now a larger urban pop-
ulation than Northern America or Western Europe (Satterthwaite 2007, WDR
2009).1 Surprisingly, African countries are on average more urbanized than India
and almost as urbanized as China. The urbanization rate is estimated at 30.0%
in India, 37.2% in Sub-Saharan Africa, and 47.0% in China in 2010 (WUP 2009).
It is respectively 51.5% and 50.6% for Ghana and Ivory Coast, the two countries
we study in this paper.2 Taking Sub-Saharan Africa as a whole, it has also less
megacities than China, but more than India.3 If Africa is certainly lagging in
terms of economic growth, it is not lagging in terms of urbanization. This is all
1The urbanization rate of Sub-Saharan Africa is estimated at 5% around 1900 (Bairoch 1988),11% in 1950 and 37.2% in 2010 (WUP 2009). Post-1950 Africa has thus experienced amongstthe highest rates of urban change ever registered in the history of mankind (Satterwhaite 2007).
2These results are subject to national differences in the definition of urbanization. Defining asurban all the localities with more than 5000 inhabitants, we estimate the following urbanizationrates using census data: 27.7% in India (2001), 43.8% in Ghana (2000) and 55.2% in IvoryCoast (1998). Unfortunately, the Chinese 2000 Population Census does not directly report thepopulation in towns with more than 5000 inhabitants.
3Sattherwaite (2007) reports that Africa has 37 ”million” cities in 2000, while China has 86and India 32. Africa has 8 of the world’s largest 100 cities, while China has 17 and India 8. ButAfrica has 25 of the world’s fastest-growing large cities, against 15 in China and 8 in India.
2

the more puzzling if development is highly correlated with urbanization, as shown
in Acemoglu, Johnson and Robinson (2002) and Henderson (2010).
Development is indeed associated to the structural transformation, the eco-
nomic transition from rural-based agriculture to city-based manufacturing and ser-
vices (Caselli and Coleman II 2001, Gollin, Parente and Rogerson 2002, Michaels,
Rauch and Redding 2010). This is the path borrowed by developed nations more
than one century ago (Bairoch 1988, Williamson 1990, Kim 2007, WDR 2009).
This is the path explored by China and India today (Satterwhaite 2007, Bosworth
and Collins 2008, Deng et al. 2008). Comparing all those countries, manufac-
turing and tradable services have always been at the heart of their urbanization
process. Yet, those two sectors are ”missing” in Africa and primary exports seem
to be the main drivers of urbanization there. Figure 1 plots the urbanization rate
and the GDP share from manufacturing and services for developing countries in
2000. We find a strong and positive correlation in America and Asia, but no cor-
relation in Africa. Figure 2 plots the urbanization rate and the GDP share from
the export of primary commodities in Africa, whether mineral products or cash
crops. We use the GDP share in 2000 (subfigure a.) and the average GDP share
between 1960 and 2000 (subfigure b.), which is less sensitive to recent oil discov-
eries. In both cases, we observe a positive relationship between urbanization and
primary exports. Lastly, figure 3 maps cities, regional cash crop production and
main oil/mining producing areas in 2000 for West African countries.4 Excluding
”princely cities” such as national and regional capitals, there appears a strong
spatial correlation between urbanization and proximity to cash crops and mineral
resources.5 African cities are thus intimately linked to cash crop, oil and mining
windfalls, whether as producing, trade or administrative centers.
We document this specific urbanization process in Africa with a case study on
the role of cocoa production on cities in Ivory Coast and Ghana, two leaders of
the African ”cash crop revolution” (Tosh 1980, Austin 2008). Cocoa has been the
main motor of their economic development (Teal 2002, Cogneau and Mesple-Somps
2002, Austin 2007). Production boomed after the 1920s in Ghana and the 1960s
in Ivory Coast (see figure 4). In Ivory Coast, the cocoa boom was accompanied by
a coffee boom, as cocoa farmers also produce coffee. We thus consider cocoa and
coffee altogether in that country.6 Then, while both countries were unurbanized at4We define as urban all the localities with more than 5000 inhabitants. This rather arbitrary
definition is consistent with previous comparative studies of urbanization (Bairoch 1988).5Except for Nigeria, there were very few cities one century ago. Therefore, cities in 2000
almost represent the change in urbanization since 1900.6Between 1948 and 2000, cocoa and coffee have accounted for 60.2% of exports and 20.6% of
3

the turn of the 20th century, their respective urbanization rate (using the localities
with more than 5000 inhabitants) is 43.8% and 55.2% around 2000, making them
two of the most urbanized countries in Africa.7 As figure 5 shows, the total and
urban populations of both countries have dramatically increased after World War
II. Figure 6 displays the urbanization rate of both countries and their primacy
rate, which we calculate as the size of the largest city (Accra for Ghana, Abidjan
for Ivory Coast) over total population. Ghana started its urban transition earlier
than Ivory Coast, but both experienced spectacular urbanization after 1948. Then,
most of post-1948 urbanization was driven by more secondary cities.
We combine decadal district-level data on cocoa production and cities from
1901 to 2000, and we document how cities follow the cocoa front. Our identification
strategy uses the fact that cocoa is produced by ”eating” the virgin forest: (a)
only forested areas are suitable to cocoa, i.e. the south of both countries, (b)
for agronomic reasons, cocoa farmers move to a new forest every 25 years, thus
causing regional cycles, and (c) the cocoa front has started from the (South-)East
of both countries. This forced the cocoa front to move westward, within the
South. We can instrument cocoa production with a westward wave. Our results
suggest that local cocoa production has a large impact on local urbanization,
whether one considers new cities or already existing cities growing further. In
total, we find that cocoa production explains more than half of urbanization in
both countries. Second, we give evidence for the various channels behind this
relationship. We find that cash crop production has mostly consumption linkages,
which causes the rise of ”consumption” cities consisting of farmers, traders and
employees of the personal services industry. As cities keep growing in old cocoa-
producing districts, we also document the long-term impact of better infrastructure
and natural demographic growth. Third, we discuss whether those cities could be
powerful engines of growth. Limited evidence indicates that cities in old cocoa-
producing regions do not exhibit any structural transformation, as they have less
manufacturing and are less economically diversified. To conclude, in the African
context, primary exports can drive urbanization through consumption linkages,
but they do not give rise to ”production” cities based on manufacturing or tradable
services. Thus, the structural transformation is very unusual in Africa.
GDP in Ivory Coast, and cocoa has amounted to 56.9% of exports and 12.1% of GDP in Ghana.7Ghana had nine cities of more than 5000 inhabitants in 1901 and its two largest cities were
Cape Coast (28,948 inhabitants) and Accra (14,842). Ivory Coast did not have any such city,and Abidjan was then a small fishing village with less than 1000 inhabitants. The population ofAccra and Abidjan were respectively estimated at 2,527,014 in 2000 and 2,955,578 in 1998.
4

In addition to the literature on the structural transformation, this paper is re-
lated to a large body of work on the relationship between urbanization and growth.
It can be argued that cities improve efficiency and promote growth in developing
countries (Duranton 2008, Venables 2010). Those works are based on previous
studies showing there are agglomeration economies, both within sectors (localiza-
tion economies) and across sectors (urbanization economies), in both developed
countries (Rosenthal and Strange 2004, Henderson 2005, Combes, Duranton, Go-
billon and Roux 2011) and developing countries (see Overman and Venables 2005,
Henderson 2010 and Venables 2010 for references). This potential role of cities
as engines of African growth has been lately highlighted by public policy publi-
cations (WDR 2009, McKinsey 2010). Yet, an optimistic view of urbanization in
developing countries could be contradicted by empirical evidence on Africa. ”Ex-
plosive urbanization”, ”overurbanization” or ”urbanization without growth” are
expressions frequently read in the literature on African cities (Bairoch 1988, Fay
and Opal 2000). They imply that Africa has urbanized without it being fully
explained by economic development, unlike developed countries. This excessive
urbanization is attributed to pull and push factors feeding rural exodus. First,
cities are associated to a parasital public sector, that feeds itself on the taxation
of rural farmers (Bates 1981, Bairoch 1988). An extreme version of the urban bias
story is primacy, when the largest city is oversized compared to the rest of the
urban population (Davis and Henderson 2003). Henderson (2003) and Duranton
(2008) show that primacy is detrimental to growth. Second, land scarcity and rural
shocks can encourage rural exodus (Becker and Morrison 1988, Barrios, Bertinelli
and Strobl 2006, Poelhekke 2011). Lastly, the ”classical” structural transformation
is based on manufacturing and tradable services, two sectors with large returns-
to-scale, strong backward and forward production linkages, and directly benefiting
from localization and urbanization economies (Glaeser and Gottlieb 2009). But
the African structural transformation is driven by primary exports, which may dis-
play smaller agglomeration economies (Fafchamps 2003). African cities are mostly
consumption cities based on agriculture, non-tradable services and trade. Whether
such sectors can be sources of sustained growth is difficult to say, given the lack of
related research. Yet, there has been a long debate regarding the role of agricul-
ture in development (Hirschman 1958, Mellor 1995, WDR 2008, Gollin 2010). In
particular, a few studies have argued that the current linkages observed in African
agriculture are rather small (Dercon and Zeitlin 2009, Collier and Dercon 2009).
My focus on cocoa and cities in Ivory Coast and Ghana also connects with the
study of cash crop windfalls, as they have been highly relevant to the economic
5
history of developing countries. Using FAO data, we calculate that agricultural
exports contributed to 53.4% of total exports for least developed countries in the
1960s, while it decreased to 21.4% in the 1990s as more countries specialized in
mineral exports. Many countries are still dependent upon one agricultural com-
modity. Amongst 125 developing countries in 2000, agricultural exports represent
more than 50% of total exports for 20 countries, and more than 20% for 50 of
them.8 Then, while mining windfalls have been extensively studied by the re-
source curse literature (Sachs and Warner 1999, Caselli and Michaels 2009, Vicente
2010, Michaels 2010), there are few studies on the economic effects of cash crop
windfalls (Bevan, Collier and Gunning 1987, Maxwell and Fernando 1989, Angrist
and Kugler 2008, Collier and Goderis 2009). Although the cash crop sector can
be taxed by the state (Bates 1981), one might expect a large share of sectoral
profits to go to those producing regions and households, thus having large devel-
opment effects. Considering urbanization as a valid development outcome, our
study informs on the local benefits of cash crop production. One can also use our
framework to see if those effects might hold in the long run. African countries
have highly benefited from their primary exports till the early 1980s, but the sub-
sequent period has been characterized by macroeconomic disequilibria, social and
political unrest and general impoverishment. Growth and poverty reduction have
now resumed (Miguel 2009, Young 2010, Pinkovskiy and Sala-i-Martin 2010), but
one can wonder whether this result is due to temporarily high terms of trade for
African countries. Cash crop windfalls might then be subject to a resource curse
in the form of ”failed intertemporal redistribution”.
Finally, both the development and economic geography literatures have won-
dered about the respective roles of randomness, inherited (physical) geography
and built-in (economic) geography in spatial inequality. According to Davis and
Weinstein (2002), three theories of the spatial distribution of economic activity
have emerged: random growth, locational fundamentals and increasing returns.
The random growth theory stipulates that cities emerge from stochastic processes,
thus accounting for Zipf’s Law (Gabaix 1999, Eeckhout 2004). The locational
fundamentals theory argues that locations differ in their geographical endowments
and this explains the spatial pattern of economic activity (Davis and Weinstein
2002). Within the development literature, several studies have highlighted the
8Most of them are in Sub-Saharan Africa, with well-known stories such as cocoa in Ghanaand Ivory Coast, tea and coffee in Kenya, Rwanda and Uganda, coffee in Burundi and Ethiopia,tobacco in Malawi, groundnut oil and groundnuts shelled in Senegal and Gambia, cashew nutsin Guinea-Bissau, or cotton in Benin, Burkina-Faso or Mali.
6
role of physical geography in shaping economic development (Gallup, Mellinger
and Sachs 1998, Engerman and Sokoloff 2000, Nunn and Puga 2009, Nunn and
Qian 2010). Lastly, the increasing returns theory explains that population den-
sity has a positive effect on economic activity, as a result of better infrastructure,
proximity to suppliers and consumers, labor pooling, localization and urbanization
economies (Rosenthal and Strange 2004, Henderson 2005, Combes, Duranton, Go-
billon and Roux 2011). The truth certainly lies between those three theories. Till
the advent of slave and colonial trades, the Northern parts of Ghana and Ivory
Coast have been relatively more densely populated. The economic potential of the
Southern tropical forests was only discovered when cocoa could be produced there.
As in Nunn and Qian 2010, it is the return to existing geographical endowments
that has changed. Cocoa production has then launched an urbanization process
which has become self-reinforcing. In new cocoa-producing regions, agglomeration
economies have not arisen yet, and we can study the role of geographical endow-
ments on development. In old cocoa-producing regions, geographical endowments
are ”lost”, but agglomeration economies are realized.
The remainder of this paper is organized as follows. Section 2 details a the-
oretical discussion of rural-urban linkages when the rural-based cash crop sector
booms and busts. Section 3 presents the agronomic and historical background of
cocoa production in Ghana and Ivory Coast, while section 4 introduces the data
and exhibits a graphic analysis of cocoa and urbanization. Section 5 explains our
econometric framework. Section 6 displays our main results. Section 7 gives evi-
dence for the various rural-urban linkages. Section 8 discusses the role of African
cities as engines of growth, and section 9 concludes.
2 Theoretical Discussion
The country can be divided into districts with specific locational fundamentals.
Those districts suitable to cocoa (the forested areas) urbanize when cocoa is pro-
duced (if the cocoa front has reached that district). Why would cocoa production
lead to more urbanization? We need to develop a sequential model of urban settle-
ment in a forest. In phase 1, which we label no cocoa production, a forested district
is untouched and settlement is limited because it is difficult: land is not cleared
yet, trees can be 80 meters tall, vegetation is thick, and humidity and mortality
are high. In phase 2, which we label new cocoa-producing area, cocoa farmers settle
there, the land is deforested and planted with cocoa trees, then cocoa production
booms. The wealth and population of the district increase, but we need this in-
7

crease to be spatially concentrated for cities to appear and to grow. In phase 3,
which we label old cocoa-producing area, cocoa trees are old, income decreases, but
cities do not collapse, on the contrary. This asks two questions: (i) What makes
cities grow when cocoa booms? (ii) What makes cities resist when cocoa busts?
There are six interdependent channels through which cash crop production
could drive urbanization. First, when cocoa farmers move to new areas, they set-
tle in the few existing settlements or fund new settlements, to use them for the
colonization of surrounding forests. Since some of those settlements are already
urban or naturally evolve into cities, more cocoa farmers means a larger urban
population. Second, production linkages could favor urban-based activities such
as manufacturing or the collection and transportation of cocoa beans to be ex-
ported. Third, cocoa farmers spend their rising income on non-essential consump-
tion goods. If those goods are produced in or distributed through the cities, then
more cocoa income means more local opportunities in the cities. This can create
a thriving trade sector. Those consumption linkages can also translate into pro-
duction linkages if increased consumption is matched by domestic supply. Fourth,
cocoa-producing districts can pay the fixed costs of the primitive accumulation of
physical capital (basic amenities such as roads, schools, health centres, etc.), and
this has a positive long-term effect on the size of those cities. Fifth, improved
living standards and better infrastructure in those cities means reduced mortality
and natural growth can quickly surpass rural-to-urban migration as the first source
of urban growth. Sixth, the state can tax the profits of the cocoa sector to fund its
own consumption, basically city-based civil servants. Yet, as the state might sub-
sidize national and regional capitals and backward regions, we expect this public
sector channel to influence urbanization in regions not producing cocoa.
When cocoa booms, all those effects can materialize. When cocoa busts, the
settlement effect and consumption linkages are likely to vanish, while intersectoral
production linkages, infrastructure and demographic growth are likely to explain
urban resilience. Then, whether urban per capita income decreases or not is of
utmost importance to know whether those cities can be engines of growth. On
the one side, production linkages and infrastructure increase labor productivity.
On the other side, decreased incomes in the cocoa sector and demographic growth
reduce labor productivity. If labor productivity decreases when the cocoa wave has
passed, cities pauperize and cash crop production is subject to a resource curse in
the form of ”failed intertemporal redistribution”. In the very long run, the stock
of virgin forest is exhausted and cocoa is no longer produced. All the districts that
were suitable to cocoa production are in phase 3, where urban per capita income
8

might be decreasing, stable or increasing, following which scenario is realized.
3 Agronomic and Historical Background
3.1 Agronomic Background
Cocoa is produced by ”eating” the forest. Cocoa farmers go to a patch of virgin
forest and replace forest trees with cocoa trees. Pod production starts after 5 years,
peaks after 10 and continues up to 50 years. When cocoa trees are too old, cocoa
farmers have no choice but to start a new cycle in a new forest. Indeed, removing
forest trees alters the original environmental conditions and replanted cocoa trees
are much less productive (Ruf 1991, Ruf 1995, Balac 2002).9 That is why cocoa is
a ”migrant culture”. Cocoa-producing countries have all experienced deforestation
through regional cycles. When the forest rent is over, cocoa production moves to
another country or continent10. The forested surface of Ivory Coast has decreased
from 9 millions hectares in 1965 to 2.5 millions in 2000, while it has decreased
from 8.2 millions in 1900 to 1.6 million in 2001 in Ghana. Recent studies have
more generally emphasized the role of agricultural trade in deforestation (De Fries
et al. 2010). Then, economic and political factors can accelerate or decelerate
those cycles. Both countries have extracted almost the same quantity of cocoa
throughout the 20th century (see fig. 4): 24 million tons in Ghana vs. 22.1 million
tons in Ivory Coast. But, this amount has been extracted within a much shorter
time period in Ivory Coast. In Ghana, three regional cycles did not overlap because
the first two cycles were decelerated by extraordinary events and poor economic
policy, which we describe just thereafter. In Ivory Coast, those regional cycles have
been perfectly imbricated as no decelerating factor showed up during the period.
9By removing forest trees to plant cocoa trees, farmers change the environmental conditionsthat are essential to the long-term profitability of their cocoa farms. Cocoa trees are affected by:(i) spreading heliophile weeds, (ii) reduced pluviometry, (iii) a lower protection against winds,(iv) repeated attacks by new insects and diseases, (v) decreased soil fertility (the fertility ofrainforests is contained in the trees and not the ground), and (vi) erosion. When cocoa trees aredying, cocoa farmers can plant new cocoa trees but the mortality rate of young cocoa trees is highwhile yields of those surviving trees are low. Discussions with agronomists have confirmed thanreplanting is twice more expensive than planting in a new forest. Here are two interesting quotesin Ruf 1991: ”Before, cocoa plantations were productive; it’s difficult now, young cocoa treesdie...” (p.105), and ”An old plantation is like an old dying wife. Medicine would be too expensiveto keep her alive. It’s better to keep the money for a younger woman [a new plantation]” (p.107).
10Cocoa production was dominated by Caribbean and South American countries till the early20th century, then moved to Africa and is now spreading in Asia.
9

3.2 Historical Background
Cocoa was introduced to Ghana by missionaries in 1859, and reintroduced in 1878
by a Ghanaian blacksmith coming back from Equatorial Guinea. But it took 30
years before seeing cocoa being widely grown in Ghana, making it the world’s
largest exporter as soon as 1911. Cocoa production spread out in the Eastern
province from Aburi Botanical Gardens, where the British sold cocoa seedlings
at a very low price. Figure 7 shows the provinces of Ghana, the area suitable to
cocoa production (basically, those regions with virgin forest one century ago) as
well as Accra and Aburi (the historical starting point). Production peaked in the
Eastern province in 1931, before plummeting as a result of both the Cocoa Swollen
Shoot Disease and World War II which reduced international demand.11 A second
cycle started after the war in the Ashanti province. But low producer prices after
1958, restrictive migratory policies after 1969 and frequent droughts precipitated
the end of this cycle.12 Higher producer prices after 1983 pushed cocoa farmers to
launch a third cycle in the Western province, the last forested region of Ghana.
Cocoa was first planted in Ivory Coast in 1888 by two French farmers not far
from Abidjan. But it was not till 1910-1912 that the French governor decided to
seriously promote cocoa production, thus trying to replicate the Ghanaian success
story. Ivorians were originally reluctant to grow cocoa instead of food crops, except
in Indenie (Abengourou) where local farmers heard of the increasing wealth of
Ghanaian cocoa farmers (see figure 7, which exhibits Ivorian provinces, the area
suitable to cocoa production and Abidjan and Abengourou). However, Ivorian
production did not boom before the 1960s.13 Cocoa moved from the Eastern
forest to the Western Forest. Due to mounting deficits of the Caistab, the producer
11The Cocoa Swollen Shoot Disease was first recorded in 1938 in the Eastern region. Becauseno attempt could be made to control the disease until after World War II, millions of trees werekilled and more millions had to be removed to try to control it (Thresh and Owusu 1986).
12First, Ghana after 1948 and Ivory Coast after 1960 fixed the producer price to protect farmersagainst fluctuant international prices. The Ghana Cocoa Marketing Board (COCOBOD) was incharge with cocoa in Ghana and the Caisse de stabilisation et de soutien des prix des productionsagricoles (CSSPPA, or ”Caistab”) was its Ivorian equivalent. Yet, since the producer price wasbelow the international price, this served as a taxation mechanism of the sector (Bates 1981).Second, the government enacted in 1969 the Aliens Compliance Order, which led to the massiveexodus of laborers from neighboring countries and created labor shortages in the cocoa sector.Third, the 1982-1983 drought was the worse in fifty years and many cocoa farms were burnt.
13Two factors account for this Ivorian ”lateness”. First, cocoa did not reach the Ghanaianborder before the 1910s. Ivorian production then increased but this boom was short-lived due tothe Great Depression and World War II. Second, Ivorians had to provide the corvee (mandatorylabour) for the colonial government, which forced them to grow food crops and coffee.
10

price was halved in 1989 and remained low thereafter, but this did not stop the
colonization process as profits were still quite substantial.
Thus, in both countries, cocoa production was confined to the Southern (forested)
areas and historically started in the South-East, for rather exogenous reasons. Co-
coa being a ”migrant culture”, it moved to the West and within the South of both
countries (as it could not move anywhere else). It is like a pacman game, except
that the number of players have increased with time. As population growth was
high and cocoa remained more profitable than other crops, more and more indi-
viduals specialized in cocoa production and participated to the colonization of the
forest, thus accelerating the westward movement. Yet, in Ghana, the colonization
of the forest has not been as linear as in Ivory Coast, due to natural events and
more economic and political factors. As the forest rent is about to disappear, so
will cocoa production, unless innovations increase yields in deforested land.
4 Data and Mapping
4.1 Data
To study the effects of cash crop production on urbanization in Ghana and Ivory
Coast, we combine district-level data on cocoa production and cities over the
period 1901-2000. We briefly describe the data here but the full methodology
and the numerous sources used can be found in the data appendix. Cocoa and
coffee production data mainly comes from reports published by the government
agencies responsible for the organization of the cocoa production system in each
country: the Caisse de stabilisation et de soutien des prix des productions agricoles
(CSSPPA, or ”Caistab”) in Ivory Coast, and the Ghana Cocoa Marketing Board
(COCOBOD) in Ghana. Our cash crop production data is available at the level of
administrative districts in Ivory Coast, and at the level of cocoa districts in Ghana.
Then, from census reports and administrative counts, we obtain the size of each
locality of more than 5000 inhabitants for various years. We then geocode this
data and we use GIS to extract urban population for any spatial decomposition
we want. In Ivory Coast, we recreate urban and rural population data using the
administrative districts. In Ghana, since cocoa districts significantly differ from
administrative districts, we are only able to recreate urban population data. In the
end, in our regression framework, we use a panel of 46 districts × 6 years (1948,
1955, 1965, 1975, 1988, 1998) = 276 observations in Ivory Coast, and 79 districts ×7 years (1901, 1911, 1921, 1931, 1948, 1960, 1970, 1984, 2000) = 711 observations in
11

Ghana. Between each district-year observation, we know how many tons of cocoa
and coffee beans have been extracted and how many more urban inhabitants live
there. Since we have a series of national cocoa and coffee producer prices, we
work on the effect of the value of cash crop production (in 2000$) on urbanization.
Figure 8 shows the value of cocoa production going to farmers between 1900 and
2000. Lastly, we use various Ivorian and Ghanaian household surveys and census
data sets to discuss and give evidence for the various channels underlying this
relationship: the 1985-88 Living Standards Measurement Study (LSMS), and the
1998 and 2002 Enquetes sur le Niveau de Vie des Menages (ENV) for Ivory Coast,
and the 1987-88 and 2005 Ghana Living Standard Surveys (GLSS) and the 2000
Population and Housing Census IPUMS sample for Ghana.
4.2 Cash Crop Production and Cities: Mapping
Figure 9 relates the district density of cash crop production value throughout
the 20th century (in thousand 2000$ per sq.km.) and cities in 2000. As both
countries had very few cities in 1900, cities in 2000 can be interpreted as the
change in urbanization during the same period. The comparison of figures 7 and
9 confirms that cocoa and coffee can only be produced in forested areas. Then,
figure 9 displays a strong spatial correlation between cash crop production and
urbanization. Figures 10 to 15 show district density of cocoa production (in tons
per sq.km.) and cities every ten years or so (the first date is for Ghana, the second
for Ivory Coast): 1948 (fig. 10), 1960-1965 (fig. 11), 1970-1975 (fig. 12), 1984-
1988 (fig. 13), 2000-1998 (fig. 14) and 2009 (fig. 15). As no census was performed
yet during the 21st century, the 2009 map only reports cocoa production. Similar
maps are created for previous years but are not reproduced. In 1948 (fig. 10),
Ghanaian cocoa production has boomed in the Eastern province and is about to
boom in the Ashanti province. Cocoa is also spreading to Ivory Coast. Most of
Ghanaian cities are coastal cities, administrative centers or towns in the cocoa-
producing areas. The Ivorian urban structure is mostly the result of the colonial
administrative system. We then see cocoa production moving westward in both
countries. In Ghana, the main cocoa-producing province is Ashanti in the 1960s
and 1970s (fig. 11 and 12), and Western in the 1990s and 2000s (fig. 14 and 15).
In Ivory Coast, production rapidly moves from the Eastern forest (fig. 10 and
11) to the Western forest (fig. 12, 13, 14 and 15). This mapping shows that the
correlation between cash crop production and urbanization is also spatio-temporal.
12

5 Econometric Framework
5.1 Introductory Results: Long-Differences OLS Model
The main hypothesis we test is whether cash crop (cocoa and coffee) production
drives urbanization. We focus on 1901-2000 Ghana and 1948-1998 Ivory Coast.
We first run the following long-differences model for districts d:
�Ud = α + δCd + φXd + ud (1)
where our dependent variable is the change in urban population (in inhabitants)
of district d between the first and last years (e.g., 1901 and 2000 in Ghana). Our
variable of interest Cd is the total value of cash crop production (in million 2000$)
during the same period. Xd is a set of district-level controls that we include to
account for potentially contaminating factors. First, the Southern and Northern
parts of each country differ as regards their economic, political and cultural history.
As all the districts suitable to cocoa production are Southern districts, a dummy
for being suitable should control for those regional characteristics. Second, we
include dummies for having a national city (capital city and/or largest city) or a
regional capital. Third, we also control for economic geography factors by inserting
dummies for whether the district has a paved road, a railway or an international
port in 2000, as well as Euclidean distance (in kms) to the coast. Fourth, we
add the 1900-2006 average annual precipitations (in mms) and average maximal
temperature (in C) to control for food production and pre-existing settlement
patterns. Lastly, as Ghana exports mining products (gold, manganese, diamond,
bauxite), we include the total value of mineral production between 1901 and 2000.
Table 1 presents our results for 1948-1998 Ivory Coast (col. (1) and (2)) and
1901-2000 Ghana (col. (3) and (4)). Regressions in columns (1) and (3) only
include a district dummy for having a national city, as those districts experience
dramatic urban growth uncorrelated with cash crop production. Regressions in
columns (2) and (4) include all the above-mentioned controls and give higher
point estimates. As political and geographical factors cause some urbanization
which cannot be explained by local cocoa production, omitting them plays as a
downward bias. If we believe our estimates of columns (2) and (4), one million
2000$ of cash crop production between the first and last years respectively creates
143.9 and 106.3 urban inhabitants in Ivory Coast and Ghana. The development
effect of mineral production is much lower, at 24.5 urban inhabitants per million
13

2000$. We calculate the magnitude of this effect, that is to say how much of
national urban growth between our first and last periods can be explained by this
sole effect.14 We find that cash crop production explains 84.5% of urban growth
in Ivory Coast between 1948 and 1998 and 33.8% in Ghana between 1901 and
2000. Yet, the long-differences model does not identify the true effect of cash crop
production on urbanization if some unobservable factors still contaminate their
relationship. That is why we now investigate a fixed effects IV model.
5.2 Identification Strategy: Fixed Effects IV Model
We now run panel data regressions for districts d and years t of the following form:
Ud,t = αd + βt + δCd,t + γUd,t−1 + φtXd + ud,t (2)
where αd and βt are district and year fixed effects, and our dependent variable is
urban population (in inhabitants) of district d at time t (Ud,t), controlling for urban
population at time t−1 (Ud,t−1). Since urban dependency varies across time, given
agglomeration economies for instance, we allow the effect of Ud,t−1 to be period-
specific (γt). Our variable of interest Cd,t is the value of cocoa and coffee (in million
2000$) produced between time t− 1 and time t. Xd is the same set of controls as
in the previous subsection, but their coefficients are now time-varying. Otherwise,
they are included in the district fixed effect. ud,t are individual disturbances that
are clustered at the district level. We have 46 districts and 6 time periods in Ivory
Coast, hence 276 observations. We have 79 districts and 9 time periods in Ghana,
hence 711 observations. Since we include lagged urban population, we drop one
round and obtain respectively 230 and 632 observations.
The causality is unlikely to run from urbanization to cash crop production.
Human settlement is difficult in rainforests. Farmers are just willing to overcome
this constraint when they get a high income, which is the case with cocoa and cof-
fee.15 Then, cities constrain potential land for cash crop production. Additionally,
cities are not useful to cash crop production, since it involves little technology.
14If δ is the impact of the value of cocoa production on urban population and if the totalchanges in urban population and cash crop production over our period are respectively φ andτ , the total magnitude of this effect is τ×δ
φ ∗ 100. This gives us how many percents of the totalchange in urban population can be attributed to this sole effect.
15One could argue that farmers and logging companies work hand in hand to cut forest trees.Since district wood production data does not exist, our cash crop effect would then account forcocoa, coffee and wood production altogether. But this would not alter the message of our paper.
14

Yet, omitted factors such as transportation networks or rainfall could drive both
production and urbanization. Although we add controls for political economy
and geography, there might still be unobservable contaminating factors. Lastly,
random measurement errors on cash crop production could downward bias our
coefficient. This cannot be solved unless we instrument cash crop production.
Our instrumentation strategy is based on the fact that cocoa production is
confined to suitable (forested) areas and is moving westward in both countries,
as a result of historical factors. We first create a dummy equal to one if more
than 50% of district area is suitable to cocoa production. Figure 16 displays those
districts that are suitable using this cut-off. We then arbitrarily divide the territory
into longitude bands of one degree, using the centroid of each district. Figure 17
reproduces those longitude bands. We assume the cocoa front is moving one degree
westward every X time period. We take X = 2 for Ghana and X = 1 for Ivory
Coast. Indeed, regional cycles were not imbricated in Ghana, contrary to Ivory
Coast, as explained in section 3.2. The instrument is the dummy ”being suitable
to cocoa production” interacted with a dummy ”being on the cocoa front”. Then,
cocoa production is high both at the cocoa frontier and in the adjacent longitude
bands. The right band is the cocoa frontier at time t− 1 and production does not
immediately collapse. The left band is the next cocoa frontier (at time t + 1) and
production is already increasing. Thus, comparing the sole cocoa frontier to the
other longitude bands gives a less powerful instrument than considering the cocoa
frontier plus the two adjacent bands. The new instrument is then the dummy
”being suitable to cocoa production” interacted with a dummy ”being close to the
cocoa front”. We test both. Here is the full IV model:
Ud,t = α�d + β�
t + δ�Cd,t + λFd,t + γ�Ud,t−1 + φ�tXd + vd,t (3)
Cd,t = �d + �
t + ΠSd ∗ Fd,t + λ�Fd,t + γ�Ud,t−1 + φ��t Xd + wd,t (4)
with Sd a dummy equal to one if the district is suitable to cocoa and Fd,t a dummy
equal to one if the district happens to be on or close to the cocoa front, depending
on which IV we use. The other variables are defined as above (see (2)). The
coefficients of interest are δ from equation (1) and δ� from equation (2), the OLS
and IV estimated impacts of the value of cash crop production on urbanization.
To conclude, we instrument cash crop production by just saying ”it has to move
westward, within the South, as it cannot go anywhere else”. Then, whether it is
going North-Westward or South-Westward, e.g. due to transportation networks,
is irrelevant since the IV permits us to get rid of those contaminating factors.
15

6 The Effect of Rural Windfalls on Urbanization
6.1 Local Cash Crop Production and Local Urbanization
Tables 2 presents the results for the fixed effects models (with controls), for 1948-
1998 Ivory Coast and 1901-2000 Ghana. For each country, we show in panel A the
OLS estimate in column (1), the IV estimate in column (2), and the IV estimate
dropping the largest city (Abidjan in Ivory Coast, Accra in Ghana) in column (3).
As their urbanization process is disconnected from the local context (and thus
local cocoa production), dropping them should improve our estimates. We report
in panel B the first stage of our IV regressions. We privilege the IV estimates using
the instrument ”suitable to cocoa production” * ”being close to the cocoa front” as
the instrument is then powerful enough for both countries (see the Kleibergen-Paap
rk Wald F stat which we report). The instrument ”suitable to cocoa production”
* ”being on the cocoa front” is more powerful for Ivory Coast but much weaker
for Ghana. Hopefully for us, the wave has no independent positive impact on cash
crop production or urbanization (see the coefficients of ”Close to the cocoa front”).
Only its interaction with cocoa suitability has a positive impact on the value of
cash crop production (see the coefficients of ”Suitable * Close to the cocoa front”).
The IV estimates are higher than the OLS estimates, especially when dropping
the main city. This discrepancy could be explained by measurement errors or
downward omission biases. If we believe our estimates from columns (3) and
(6), one million 2000$ of cash crop production increases urbanization by 89.6
inhabitants in Ivory Coast and 83.1 inhabitants in Ghana. The two effects are not
significantly different, which is comforting for our strategy. Those two effects are
lower than those found in the long-differences model, where one million 2000$ of
cash crop production increases urbanization by 143.9 inhabitants in Ivory Coast
and 106.3 inhabitants in Ghana. First, long-differences models are less sensitive
to measurement errors than fixed effects model (Griliches and Hausman 1986,
McKinnish 2008), but the IV should correct for this. Second, long-differences
models estimates long-term effects. Cash crop production at time t (Cd,t) increases
urbanization at time t (Ud,t), which has then a more than proportional impact
on urbanization at time t + 1 (Ud,t+1). Thus, by collapsing all the periods, we
also capture this long-term effect which goes to through agglomeration economies.
By comparison, in the fixed effects IV model, we explain short-term variations
in urbanization with short-term variations in the value of cash crop production.
Third, the long-differences model could be subject to upward omission biases,
16

which we correct with the fixed effects IV model. To conclude, the true effect
could be in between the estimated short-term and long-term effects.
Regarding magnitude, and accounting for the fact that the IV estimate might
be upward biased by 15% for Ivory Coast (given a lower IV F-stat), we find that
local cash crop production respectively explains 38.2% and 69.4% of non-primate
urbanization (excluding the main city) in Ghana and Ivory Coast. Dropping other
national cities such as Bouake (the second largest city) and Yamoussoukro (the
capital city from 1983) in Ivory Coast and Kumasi (the second largest city) in
Ghana does not alter the coefficients, but the magnitude increases to 47.4% in
Ghana and 80.6% in Ivory Coast. Lastly, using those coefficients to estimate the
magnitude of the cash crop effect in suitable districts only, we find that cash crop
production explains 58.8% and 89% of urbanization in Ghana and Ivory Coast.
Those magnitudes are lower for Ghana, the reason being that the production of co-
coa has been less concentrated in time, causing short-term effects to be lower than
long-term effects.16 In the end, we believe that our Ghanaian estimates constitute
a lower bound of the true impact of cash crop production on urbanization.
6.2 Specification and Robustness Checks
In table 3, we show that those IV results are robust to specification checks, with
Ivory Coast in columns (1) to (4) and Ghana in columns (5) to (8). Columns
(1) and (5) respectively report those results from columns (1) and (4) in table 2.
As our panel data model includes a lag of the dependent variable, our estimates
are subject to a dynamic panel bias (Nickell 1981). We therefore estimate in
columns (2) and (6) a model where we consider the change in urban population as
the outcome without including any lag of the dependent variable. Coefficients are
almost unaffected. In columns (3) and (7), we explain urban density (district urban
population per sq.km.) by value density (district value of cash crop production
per sq.km.) but this does not alter our message. Lastly, in columns (4) and (8),
our variable of interest is cocoa and coffee production in volume (tons).
We now run a battery of checks. First, we verify that the periodicity of our data
does not impact our results. We run the same model, but we divide the change
in urban population and the value of cocoa production between t − 1 and t by
the number of years between t− 1 and t, so that we consider annualized changes.
Results are the same. Second, we try other suitability cut-off (25, 50 or 75%) for
16This is confirmed by the fact that the dependency rates of urbanization, the coefficients γ�
of Ud,t−1 in model (3), are significantly higher for Ghana than for Ivory Coast.
17

our IV strategy, but the results are unaffected. Third, we test that our results
are not driven by a specific period. Fourth, in a regression discontinuity design
spirit, we restrict our sample to those districts whose centroid are less than X km
from the physical border between forested and savannah regions. We try different
bandwidths, such as 300 and 400 km (respectively 150 and 200 km on each side of
the border). Results are unaltered. Fifth, we wonder whether local urbanization
is influenced by ”neighboring” urbanization and/or cash crop production. We run
the same model, this time also including regional urbanization at time t−1 and/or
regional value of cash crop production between t− 1 and t. The main results are
unchanged, and the coefficients of those variables are small and insignificant. Cash
crop production has no regional externalities. We also account for spatially auto-
correlated standard errors by testing clustering at the regional level instead. Lastly,
some Ivorian districts neighboring Ghana might have benefited from smuggling,
as the producer price was slightly higher on the Ivorian side for most of the post-
independence period. We drop those districts and results are unaffected. They are
also unaffected if we drop the Ghanaian districts bordering Ivory Coast.
6.3 Decomposing the Population Effect of Cash Crops
In table 4, we investigate whether this urbanization effect is part of a more gen-
eral population effect where cash crop production increases both urban and rural
densities. As our Ghanaian cocoa production data uses the spatial decomposition
of cocoa districts and not administrative districts, we have no total population
data. We focus on Ivory Coast 1965-1998, for which we have both urban and rural
population data. We study the impact of cash crop production value on total,
urban and rural populations (respectively col. (1), (2) and (3)), and on the urban-
ization rate (in %) (col. (4)). We only report the OLS (see equation (1)) as the
instrument is too weak for the rural population regression, making the estimated
coefficient unreliable. We find that one million 2000$ increases population by 62.8
inhabitants and that this population effect is concentrated in city as no significant
impact is found for rural population (see col. (3)). This is true if we consider rural
density instead. This is again confirmed by the fact that cash crop production has
increased the urbanization rates of those producing districts (col.(4)).
We then decompose urban growth (col. (2)) into the urban growth of cities
already existing at time t− 1 (col. (5)) and the urban growth of new cities, those
passing the 5000 threshold between t − 1 and t (col.(6)). We find a slightly but
not significantly higher effect for new cities. Cash crop production thus reinforces
18

the power of pre-existing urban settlements. It also has a strong ”city formation”
power. Since the urban growth associated to each new city is small (from less than
5000 to more than 5000 between t − 1 and t), such a strong urban growth effect
of new cities must result from many new cities. This is confirmed by column (7),
where 1 billion 2000$ is giving 7 new cities. Given the total value of cash crop
production between 1965 and 1998, this gives 281 new cities, while there have been
313 new cities over the period. Thus, cash crop production explains 89% of city
formation. Results for Ghana are not shown but give rather similar results.
6.4 Urban Growth in New vs. Old Cocoa-Producing Areas
We distinguish what happens in new and old-cocoa producing districts vs. the
non cocoa-producing districts. We create a dummy equal to one if per capita
cocoa production increases between t−1 and t and 0 otherwise (those districts are
located in new cocoa-producing areas). Then, we create a dummy equal to one if
per capita cocoa production decreases between t− 1 and t and 0 otherwise (those
districts are located in old cocoa-producing areas). We consider as an outcome
total urban growth (col. (1) of table 5), urban growth in existing cities (col. (2)),
urban growth in new cities (col. (3)) and the number of cities (col. (4)). As we do
not have district population data for Ghana, we are unable to calculate per capita
production. We nevertheless have regional population data for Ghana, so we use
regional per capita production to create the same set of dummies. Results being
very similar in both countries, we only show those results for Ivory Coast.
Results from column (1) indicate that old cocoa-producing regions experience
higher urban growth: each old cocoa-producing district is receiving 84,600 urban
inhabitants, while it is 66,100 for each new cocoa-producing district. Yet, as there
are much fewer old cocoa-producing districts, new cocoa-producing districts are
the main contributors to urban growth. Nevertheless, this indicates that cities
in old cocoa-producing regions do not collapse, on the contrary. They grow even
further, as if cash crops just launch a self-reinforcing urbanization process. Since
no difference is noticeable as regards urban growth of existing cities (col. (2)), this
difference between old and new cocoa-producing regions come from new cities, as
confirmed by columns (3) and (4). This could be due to urban decentralization.
As the existing cities become more congested, there are strong incentives for other
centers to appear. But this could also result from a cocoa front within the district.
As land close to the already existing cities is fully exploited, the latest cocoa
farmers entering the district colonize the more remote forests where no settlement
19

can be found. Those remote settlements become cities the next generation, when
aggregate district per capita production is already decreasing.
7 Rural-Urban Linkages
Results of subsection 6.1 indicate that cash crop production respectively explains
58.8% and 89.9% of urbanization in the forested areas of Ghana and Ivory Coast.
If the Ghanaian magnitude is a lower bound estimate given the discrepancy be-
tween short-term and long-term effects, we can take the Ivorian magnitude as a
benchmark and we need to explain why cash crop production explains around 90%
of urban growth in forested regions. We now use our household survey and census
data to give evidence for the channels behind this relationship.
7.1 Economic Sectors and Urbanization in Forested Areas
Table 6 shows that a large share of the urban workforce belongs to the primary
sector in the forested areas of Ivory Coast and Ghana (more than one third in the
late 1980s), many of them being cocoa farmers. But this share has been decreasing
with time to the benefit of the secondary sector in Ghana, and the tertiary sector in
both countries. Yet, it is noticeable that the share of the secondary sector is quite
low. Then, to get a better understanding of the mechanisms behind the relation-
ship between cash crops and cities, we take as an example the Centre-Ouest region
of Ivory Coast (see fig. 7), which was the main cocoa-producing area of Ivory Coast
in the 1990s. There have been 460 thousand additional urban inhabitants between
1988 and 1998. From table 7, we learn that 35.6% of this urban growth is due
to an increase in the urban workforce, the rest (64.4%) corresponding mostly to
children, housewives or young adults searching for work. We find a similar pattern
in other regions. Thus, for every urban inhabitant who works, we mechanically
get two more inhabitants. To understand total urban growth, we thus need to
explain the growth of the urban workforce. Decomposing the growth of urban
employment across the three economic sectors, we find that 56.5% of this growth
is driven by the primary sector, and 52.6% by the tertiary sector. People have
left the secondary sector over time, as its contribution is negative (-9.1%). Cocoa
farmers have notably contributed to this primary sector effect, as they explain
34.4% of total employment growth. Those main sectors behind the tertiary sector
effect are trade (24.3% of total employment growth), personal services (17.6%),
transport and communications (8.8%), education and health (2.7%), business ser-
20
vices and banking (2%). The number of civil servants has decreased over time, as
the contribution of administration is negative (-2.8%). We now use these results
to analyze individually the various mechanisms at stake.
7.2 The Settlement of Cash Crop Farmers
When cocoa farmers move to new areas, they settle in the few existing settlements
or fund new settlements, to use them for the colonization of surrounding forests.
Then, some of those settlements where cocoa farmers settle are urban or naturally
evolve into cities. We thus expect a high share of urban inhabitants to be cocoa
farmers in new cocoa regions. This is confirmed by the fact that the settlement
of cocoa farmers explain 34.4% of total employment growth in the cities of the
Centre-Ouest region in Ivory Coast. We could also calculate that those cocoa
farmers living in city are wealthier than those living in countryside. Their urban
residency could represent a preference for an urban way of life.
7.3 Production Linkages
Cocoa production has few backward production linkages. It has remained tra-
ditional, with a low level of mechanization and a low adoption of fertilizers and
insecticides. Then, it has few forward production linkages. First, cocoa beans
are not processed locally but directly exported abroad. Second, we could imag-
ine that the profits associated to cocoa production serve to fund investments in
other sectors. Yet, the cocoa sector is dominated by a myriad of smallholders
and it is rather unlikely that they deposit their savings in banks of the formal
sector and fund large-scale projects. They could still use that money to run small
business, such as shops or textile workshops. Nonetheless, we find that the size
of the urban secondary sector has been reduced by 32.0% over the period in the
Centre-Ouest region of Ivory Coast. Third, cocoa beans must be transported from
cocoa-producing areas to the ports for export. The logistics of cocoa beans export
involves local and regional depots, transportation companies and port administra-
tion. Since their activity is mostly urban-based, we could wonder whether this
translates into more urbanization. But we find that people working directly into
the export of cash crops only represent 0.8% of the tertiary sector. In the end,
cash crop production has few production linkages in our context.
21
7.4 Consumption Linkages
To study consumption linkages, we keep taking as an example the Centre-Ouest re-
gion of Ivory Coast. First, the influx of cocoa-producing households has accounted
for 76.5% of total (urban plus rural) population change in this region between 1985-
88 and 1998. By comparison, the influx of cocoa farmers has accounted for 61.5%
of total population change in the Western province of Ghana (the last regional
cycle). Second, cocoa farmers are much wealthier than the non-cocoa farmers of
the same region. Using household survey data, we regress household expenditure
on a dummy equal to one if the household produces cocoa and we include village
fixed effects so as to compare cocoa producers and non-cocoa farmers within the
same village. Cocoa farmers are respectively 31.3% and 28.4% wealthier than their
non-cocoa counterparts in the forested areas of Ivory Coast in 1985-88 and 2002.
In the forest regions of Ghana, they are respectively 22.1% and 20.2% relatively
wealthier in 1987-88 and 2005. Third, we look at the structure of household ex-
penditure for cocoa and non-cocoa farmers in the forest regions of each country.
Table 8 displays this allocation for the cocoa farmers in Ivory Coast (1985-88 and
2002) and Ghana (1987-88 and 2005). Total consumption is divided into three
consumption aggregates: home production, food expenses and other (non-food)
expenses (in % of total consumption). We then divide each consumption aggre-
gate into six consumption subaggregates (in % of the consumption aggregate).
The whole structure is rather stable through space and time. If we look at the
structure of household expenditure in 1985-88 Ivory Coast, food represents 32.1%
(home production) plus 25.8% (food expenses) = 57.9% of household expenditure.
Although we cannot identify which good is urbanizing, we guess that food and
non-food expenses imply the growth of the urban-based trade sector.17 We then
find that non-cocoa farmers have almost the same consumption structure (not re-
produced here), although they are 20-30% poorer. This is in line with Dercon
and Zeitlin (2009) who explain that the Engel’s curve can be invalidated for low
levels of income. Nonetheless, as cocoa farmers are 20-30% wealthier than their
non-cocoa counterparts, they still spend 20-30% more on urbanizing goods.18
17Dercon and Hoddinott (2005) show on Ethiopian data that rural households go to the nearestmarket town to: (i) buy 47% of crop inputs, (ii) sell a large share of crop production, (iii) get non-agricultural income by selling artisanal products, and (iv) purchase 55% of their consumables.
18We also find that cocoa farmers own more durable goods that non-cocoa farmers. For eachgood, we regress a dummy equal to one if the household owns this good on a dummy equal toone if the household produces cocoa, including village fixed effects. Results not reproduced hereshow that cocoa producers more often owns a fan, a radio, a TV, a bicycle, a bike and a car.
22
To summarize, cocoa farmers have accounted for 76.5% of population change
in the Centre-Ouest region of Ivory Coast between 1985-88 and 1998. Those
cocoa farmers are around 30% wealthier than non-cocoa farmers, and both cocoa-
producing and other farming households spend 57.9% of their income on urbanizing
goods. Back-of-the-envelope calculations suggest the aggregate income spent on
urban goods has increased by 23.0% compared to a situation where the region had
been counter-factually colonized by non-cocoa farmers only. This increase reaches
61.2% compared to a situation where only half of cocoa farmers could have been
replaced by non-cocoa farmers, which is a more plausible hypothesis given the
fixed costs of deforestation. We can relate those magnitudes to the contribution of
the tertiary sector to urban employment growth over the same period (52.6%). A
61.2% increase in urban expenditure would then give a 52.6% increase in tertiary
employment, thus showing small returns to scale in this sector. The fact that
employment decreases in the secondary sector, although local supply must have
increased to match rising incomes, implies that goods were brought from other
regions or from abroad. Cash crop production might then have had production
linkages at the national level. But this is not the case if increased consumption is
matched by imports, which macroeconomic data seems to suggest.
7.5 Infrastructure Investments
From table 7, we learn that ”transport and communications” and ”education and
health” have respectively contributed to 8.8% and 2.7% of urban employment
growth in the Centre-Ouest region of Ivory Coast. This in line with cash crop
farmers willing to spend a high share of their income on those goods. This also in-
dicates that infrastructure investments (roads, schools, health centers, etc.) might
have followed cash crop production. We now use various data sets to show that
infrastructure today is spatially correlated with cocoa production in the past, for
both rural and urban settlements. Cities of the cocoa-producing regions could have
better infrastructure, which makes them grow relatively more. Or rural settlements
of those regions could have better infrastructure, which helps their urbanization.
We first build an original GIS data set of paved roads for Ivory Coast for those
years 1965, 1975, 1988 and 1998 (to be consistent with our population data). We
estimate for each district-year the total length of paved roads (in kms). In a similar
spirit to equation (2) (see subsection 5.2), we regress the length of paved roads at
time t on the value of cocoa production between t − 1 and t, controlling for the
length of paved roads at time t−1 and including district and time fixed effects. We
23
find that cocoa production explains at least 50% of paved road building between
1965 and 1998 (results not reported but available upon request).
Second, using household survey data for Ivory Coast, we estimate the share of
rural and urban inhabitants with access to electricity, private tap water and toilet
in 1998-2002. We drop those observations corresponding to Abidjan and Bouake.
We regress those shares on a dummy equal to 1 if per capita production decreases
between 1965 and 1998 (the old cocoa-producing districts) and a dummy equal
to one if it increases (the new cocoa-producing districts). Northern districts are
taken as a control group. We expect residents of the old cocoa-producing regions
to have a better access to infrastructure. Results are reported in table 9. We do
not notice any significant difference across cities of each group of districts (see col.
(2), (4) and (6)). But villagers of the old cocoa-producing areas have a higher
access to electricity (col. (1)), private tap water (col. (2)) and toilet (col. (3)).
Considering the share of children attending school (col. (5) to (8)), this share is
higher in the old cocoa-producing region than in the new cocoa-producing region
where it is higher than in the Northern districts. We also have at our disposal
administrative data on the number of primary and secondary schools in 1994 and
the number of hospitals and health centers in 2003. This data does not distinguish
rural and urban settlements, but it indicates that old cocoa-producing districts
have more secondary schools and health centers per capita (results not shown but
available upon request). No difference is noticed for primary schools and hospitals.
Third, we use the 2000 Ghanaian Facility Census to test whether cocoa pro-
duction has permitted infrastructure investments. For each administrative district
and each type of settlement (rural/urban), we estimate the share of inhabitants
less than 10 kms away from various facilities: primary school, junior secondary
school (JSS), senior secondary school (SSS), health center, hospital, post office,
telephone. We then use 2000 Population and Housing Census data to calculate
for each district and type of settlement the share of inhabitants with access to
electricity, private tap water and toilet. We create a dummy equal to one if this
district belongs to a region where cocoa production boomed in the 1930s (the very
old cocoa-producing districts), one dummy equal to one if it belongs to a region
where cocoa production boomed in 1960s (the old cocoa-producing districts) and
a dummy equal to one if it belongs to a region where cocoa production boomed
in the 1990s (the new cocoa-producing districts). Northern districts are taken as
a control group. We expect very old cocoa-producing districts to be better en-
dowed than old cocoa-producing districts, themselves better endowed than new
cocoa-producing districts and non-producing districts. We drop observations cor-
24

responding to Accra and Kumasi. Results from table 10 show that both cities and
villages of the very old and old cocoa-producing areas have a better infrastructure.
To conclude, although we cannot definitively prove that cocoa production
causes infrastructure, the previous analysis illustrates that the old cocoa-producing
regions are relatively more well-endowed in infrastructure than the other regions,
and this is true along several dimensions: road, electricity, water, hygiene, educa-
tion, health and communications. This is important for explaining why cities keep
growing and rural settlements urbanize in old cocoa-producing regions.
7.6 Natural Increase and Urban Growth
In countries of the First Industrial Revolution, mortality was much higher in city
than in countryside (Bairoch 1988, Clark and Cummins 2009). As a result, cities
could not grow without massive influx of rural migrants. As both the rural-urban
mortality gap and the urban-rural income differential were closing, natural increase
became the main contributor to urban growth (Williamson 1990, Voigtlander and
Voth 2010). In the Third World, mortality has always been much lower in city,
making natural increase a strong factor of urbanization. To study this issue, we
look at the urban and rural dimensions of the demographic transition in Ivory
Coast and Ghana. Following Williamson (1990), we know that:
Ut − Ut−1 = (UCRBt−1 − UCRDt−1) ∗ Ut−1 + IMt−1 + UEMt−1 (5)
Rt −Rt−1 = (RCRBt−1 −RCRDt−1) ∗Rt−1 − IMt−1 + REMt−1 (6)
where Ut and Rt are urban and rural population at time t, Ut − Ut−1 is urban
population change between t − 1 and t, and Rt − Rt−1 rural population change
between t − 1 and t. CRB and CRD are crude rate of birth and crude rate of
death in city (U) and countryside (R). IM is the number of internal migrants, i.e.
rural-to-urban migrants. UEM and REM are the number of external (foreign)
migrants going to the cities and the countryside. For the model to be valid, the
internal migration estimates (Mt−1) in the urban and rural equations must be
consistent. For each inter-census subperiod in Ivory Coast (1965-1975, 1975-1988
and 1988-1998) and Ghana (1960-1970, 1970-1984 and 1984-2000), we know urban
and rural growth, and the urban and rural crude rates of birth and death (the
difference between the two being the crude rate of natural increase CRNI). Since
we have separate data for Abidjan/Accra and other cities, our model has one rural
equation, one equation for other cities and one equation for the main city.
25

We first look at the evolution of urban/rural crude rates of birth, death and
natural increase between the 1960s and the 1980s (see table 11). At independence,
there is no urban-rural natality differential. Yet, we observe a strong reduction in
urban natality after 1960 in Ghana and 1975 in Ivory Coast. Regarding mortality
in 1965, it was lower in Abidjan/Accra than in the other cities, where it was lower
than in the countryside. Throughout the period, it has been decreasing across all
places of residence, but this evolution was more impressive in countryside. In Ivory
Coast, natural increase in Abidjan and the other cities peaked in 1975, while rural
natural increase peaked in 1988. In Ghana, natural increase had already peaked
in Accra and the other cities in 1960, while it remained high in countryside. This
confirms that the demographic transition is first ”urban” then ”rural”.
We then use equations (4) and (5) to gauge the contribution of natural in-
crease to urban/rural growth. For each intercensal subperiod, we estimate the
urban/rural population change that can be explained by natural increase. We
then compare it with the observed population change. The difference between
both population changes is necessarily explained by either internal or external
migration. Results are reported in table 12. In Ivory Coast, the contribution of
natural increase has risen from 31% in 1965-75 to 80% 1988-98 in Abidjan and from
20% in 1965-75 to 45% in 1988-98 in the other cities. In Ghana, the contribution
of natural increase to urban growth has peaked during the 1970-84 period. For
instance, in the other cities, it increased from 56% in 1960-70 to 90% in 1970-84.
Most of urban growth at that time was fed by newborns and not rural migrants.
Then, with the end of the political and economic crisis and a new cocoa boom
in the Western region, migration has become again the main contributor to ur-
ban growth. If one considers the last period for both countries, natural increase
explains around 45% of urban growth in non-capital cities.
To conclude, natural increase has become a determining factor of urban growth,
thus making urbanization a self-reinforcing process. By permitting household and
community investments in physical and human capital (better housing conditions,
education, health), cocoa production has contributed to long-term urban growth.
8 Discussion [To be completed]
8.1 Mid-Conclusion
Sections 5 and 6 have demonstrated that local cash crop production could re-
spectively explains 47.7% and 80.6% of urbanization (excluding national cities) in
26

Ghana and Ivory Coast. Thus, a large share of urbanization in our two African
countries is driven by agriculture, and not by manufacturing or tradable services.
Section 7 has then shown that for every urban inhabitant who works, there are two
urban inhabitants that do not work, mostly because they are too young to work
or because they are uninterested in working. Understanding urban growth means
understanding the growth of urban employment. We find that most of this growth
is explained by the primary sector (mostly the settlement of cocoa farmers in city)
and the tertiary sector (mostly workers involved in the trade and transportation
of goods and the personal services industry). Indeed, cocoa production has strong
consumption linkages, which could explain the development of this latter sector.
But we could not find evidence for local production linkages. It is striking that
the size of the secondary sector shrinks when cocoa booms. Therefore, cash crop
windfalls create cities, but those cities have a specific economic composition con-
sisting of farmers, traders and service employees. Although we cannot prove that
this specialization is not growth-enhancing in the long run, we think that such
cities only thrive as long as the cash crop windfall has not ended. If cash crop
production busts, those cities are ”demographically” resilient as we observe that
cities keep growing. But income data could reveal that per capita income then
decreases, which would mean that cities pauperize.
8.2 An Urban Dutch Disease
Using census data from Ghana, we now study whether cities of the old cocoa-
producing regions produce more manufactured goods and are more economically
diversified. For each individual aged between 25 and 60, we regress a dummy equal
to one if she has a job on a set of dummies for whether she lives in a very old / old
/ new cocoa-producing area vs. non-producing area (see col. (1) of table 13). We
find that the participation rate is only slightly higher in those cities of the cocoa-
producing areas (+ 3/4% compared to a national average of 0.86). We then regress
a dummy for whether she works in the primary, secondary or tertiary sector (see
col. (2)). Logically, we find that the primary sector is disproportionately repre-
sented in the new cocoa-producing areas. But it is striking to find that this sector
is still over-represented in old and very old cocoa-producing areas (compared to
the secondary and tertiary sectors), as if the economic composition of those regions
had only slightly changed in a few decades. We then compute district Hirschman-
Herfindahl diversity indices, and we find that the very and old cocoa-producing
districts are actually less economically diversified than Northern cities (see col.
27

(3)). If anything, this confirms that cash crop production has had few production
linkages. Otherwise, we would expect those cities to be more diversified when
cash crop production disappears. Then, the fact that old cocoa-producing regions
produce less manufactured goods and are less economically diversified indicates
that economic resources are absorbed by the primary sector when it booms. This
is rather similar to the labor effect of a Dutch disease. Lastly, we do not have
income data yet. But our prediction is that per capita income is not higher in old
cocoa-producing districts than in new cocoa-producing districts or even Northern
non-producing districts.
8.3 The Potential Effects of Resource Exhaustion on Cities
Whether cash crop production can create growth-enhancing cities and have a posi-
tive long-term impact on per capita income is an essential issue as cocoa production
is doomed to vanish in both Ivory Coast and Ghana in a few decades. Cocoa is
produced by ”eating” the forest, and both countries are eating their last available
forests (see fig. 15). Their entire southern territory will then be in phase 3, with
old cocoa farms. Beyond the microeconomic effects already discussed above, re-
source exhaustion will have a huge macroeconomic impact via a collapse of govern-
ment revenue and spending. By fixing the producer price below the international
price and overvaluing their exchange rate, these governments have captured a large
share of the cocoa windfalls to fund their own consumption and investments (Bates
1981). For the period 1961-2006, the average taxation rate is 43.8% in Ivory Coast
and 49.5% in Ghana. Figures not reproduced here show that post-independence
government consumption and investment are highly correlated with the cocoa tax
in both Ivory Coast and Ghana.
As we do not have data on the spatial distribution of government spending,
we use household survey and census data to guess who might be affected by a fall
in government spending. First, as most state employees are concentrated in city,
this fall would harm the urban sector. We calculate that 80.4% of Ivorian public
employees and 70% of Ghanaian public employees live in city. They respectively
represent 10.8% and 11.1% of urban labor force in Ivory Coast and Ghana. Second,
in line with the primacy literature (Davis and Henderson 2003), we expect the
main city to be disproportionately favored by the central government. Then, since
governments also adopt redistributive regional policies, we expect the state to be
more represented per capita in the poorest regions of the country, i.e. the North.
In Ivory Coast, the number of public employees per thousand inhabitants is 54.9
28
in the main city, 36.2 in Northern Cities and 18.1 in Southern Cities. In Ghana,
those figures are respectively 58.7, 43 and 40.7. A cut in government spending
would affect more the main city and Northern cities.
9 Conclusion
We look at the effect of cash crop (cocoa and coffee) production on urbaniza-
tion in two African countries, Ghana and Ivory Coast, during the 20th century.
First, we find that cash crop production explains more than half of urbanization
(excluding national cities) in both countries. Thus, a large share of African urban-
ization might come from agriculture. Second, agricultural windfalls create cities
with a specific economic composition, consisting of farmers, traders and service
employees. Third, those cities of the old cocoa-producing regions have a smaller
manufacturing sector and are less economically diversified, as if those cities were
stuck with their agricultural origin. Yet, more evidence needs to be provided to
illustrate an urban Dutch disease (especially on per capita income). Fourth, this
makes those cities and those countries still highly dependent upon the production
and price of primary commodities. Current African growth is then not sustainable
if it is due to temporarily high terms of trade. Fifth, this might suggest African
cities are unlikely to be powerful engines of growth in the long run. Sixth, we can
wonder why manufacturing and tradable services are ”missing” in Africa. Lastly,
the urban demographic transition might be a curse if future newborns cannot find
employment. African cities would then be doomed to pauperize.
29

References
[1] Acemoglu, Daron, Simon Johson, and James Robinson. 2002. ”Reversal of Fortune: Geog-raphy and Institutions in the Making of the Modern World Income Distribution.” QuarterlyJournal of Economics 117(4): 1231-1294.
[2] Angrist, Joshua, and Adriana Kugler. 2008. ”Rural Windfall or a New Resource Curse?Coca, Income, and Civil Conflict in Colombia.” Review of Economics and Statistics 90(2):191-215.
[3] Austin, Gareth. 2007. ”Labour and Land in Ghana, 1874-1939: A Shifting Ratio and anInstitutional Revolution.” Australian Economic History Review 47(1): 95-120.
[4] Austin, Gareth. 2008. ”Resources, Techniques and Strategies South of the Sahara: Revis-ing the Factor Endowments Perspective on African Economic Development, 1500-20001.”Economic History Review 61(3): 587-624.
[5] Bairoch, Paul. 1988. Cities and Economic Development: Frow the Dawn of History to thePresent. The University of Chicago Press.
[6] Balac, Ronan. 2002. ”Dynamiques migratoires et economie de plantation.” In La Coted’Ivoire a l’aube du 21eme siecle : defis demographiques et developpement durable, ed. byEditions Karthala, Paris.
[7] Barrios, Salvador, Luisito Bertinelli, and Eric Strobl. 2006. ”Climatic Change and Rural-Urban Migration: The Case of Sub-Saharan Africa.” Journal of Urban Economics 60(3):360-371.
[8] Bates, Robert. 1981. Markets and States in Tropical Africa: The Political Basis of Agri-cultural Policies. Berkeley: University of California Press.
[9] Becker, Charles, and Andrew Morrison. 1988. ”The Determinants of Urban PopulationGrowth in Sub-Saharan Africa.” Economic Development and Cultural Change 36(2): 259-278.
[10] Bevan, David, Paul Collier, and Jan Willem Gunning. 1987. ”Consequences of a CommodityBoom in a Controlled Economy: Accumulation and Redistribution in Kenya 1975-83.”World Bank Economic Review 1(3): 489-513.
[11] Bosworth, Barry, and Susan M. Collins. 2008. ”Accounting for Growth: Comparing Chinaand India.” Journal of Economic Perspectives 22(1): 45-66.
[12] Caselli, Francisco and Wilbor John Coleman II. 2001 ”The U.S. Structural Transformationand Regional Convergence: A Reinterpretation.” Journal of Political Economy 109(3):584-616.
[13] Caselli, Francesco, and Guy Michaels. 2009. ”Do Oil Windfalls Improve Living Standards?Evidence from Brazil.” NBER Working Paper no 15550.
[14] Chen, Shaohua, Martin Ravaillon and Prem Sangraula. 2007. ”New Evidence on the Ur-banization of Global Poverty.” Population and Development Review 33(4): 667-701.
30

[15] Clark, Gregory, and Neil Cummins. 2009. ”Urbanization, Mortality and Fertility in Malthu-sian England.” American Eonomic Review 99(2): 242-247.
[16] Cogneau, Denis et Sandrine Mesple-Somps. 2002. ”Cote d’Ivoire : la fin du mirage ?” DIALDT no 2002/18.
[17] Collier, Paul, and Benedikt Goderis. 2009. ”Commodity Prices, Growth, and the NaturalResource Curse: Reconciling a Conundrum.” CSAE Working Paper no 2007-15.
[18] Collier, Paul, and Stefan Dercon. 2009. ”African Agriculture in 50 Years: Smallholders ina Rapidly Changing World?” Paper prepared for the FAO Expert Meeting on How to Feedthe World in 2050, FAO.
[19] Combes, Pierre-Philippe, Gilles Duranton, Laurent Gobillon, and Sebastien Roux. 2011.”Estimating Agglomeration Economies with History, Geology, and Worker Effects.” in TheEconomics of Agglomeration, edited by E. L. Glaeser, NBER and University of ChicagoPress.
[20] Davis, Donald and David Weinstein. 2002. ”Bones, Bombs, and Break Points: The Geog-raphy of Economic Activity .” American Economic Review 92(5): 1269-1289.
[21] Davis, James and J. Vernon Henderson. 2003. ”Evidence on the Political Economy of theUrbanization Process.” Journal of Urban Economics 53: 98-125.
[22] De Fries, Ruth, Thomas Rudel, Maria Uriarte, and Matthew Hansen. 2010. ”DeforestationDriven by Urban Population Growth and Agricultural Trade in the Twenty-First Century.”Nature Geoscience 3: 178-181.
[23] Deng, Xiangzheng, Jikun Huanga, Scott Rozelle, and Emi Uchida. 2008. ”Growth, Pop-ulation and Industrialization, and Urban Land Expansion of China.” Journal of UrbanEconomics 63(1): 96-115.
[24] Dercon, Stefan, and John Hoddinott. 2005. ”Livelihoods, Growth, and Links to MarketTowns in 15 Ethiopian Villages.” FCND discussion papers no 194, IFPRI.
[25] Dercon, Stefan, and Andrew Zeitlin. 2009. ”Rethinking Agriculture and Growth in Ethiopia:A Conceptual Discussion.” Paper prepared as part of a study on Agriculture and Growthin Ethiopia.
[26] Duranton, Gilles. 2007. ”Urban Evolutions: The Fast, the Slow, and the Still.” AmericanEconomic Review 97(1): 197-221.
[27] Eeckhout, Jan. 2004. ”Gibrat’s Law for (All) Cities.” American Economic Review 94(5):1429-1451.
[28] Engerman, Stanley, and Kenneth Sokoloff. 2000. ”History Lessons: Institutions, Factor En-dowments, and Paths of Development in the New World.” Journal of Economic Perspectives14(3): 217-232.
[29] Fafchamps, Marcel. 2003. ”Engines of Growth and Africa’s Economic Performance.” InEmmanuel Nnadozie, African Economic Development, Academic Press, New York, pp.65-98.
31

[30] Fay, Marianne, and Charlotte Opal. 2000. ”Urbanization Without Growth: A Not-So-Uncommon Phenomenon.” World Bank Policy Research Working Paper 2412.
[31] Gabaix, Xavier. 1999. ”Zipf’s Law for Cities: An Explanation.” Quarterly Journal of Eco-nomics 114(3): 739-67.
[32] Gallup, John Luke, Jeffrey Sachs and Andrew Mellinger. 1998. ”Geography and EconomicDevelopment.” NBER Working Paper no W6849.
[33] Glaeser, Edward, and Joshua Gottlieb. 2009. ”The Wealth of Cities: AgglomerationEconomies and Spatial Equilibrium in the United States.” Journal of Economic Litera-ture 47(4): 983-1028.
[34] Gollin, Douglas, Stephen Parente and Richard Rogerson. 2002. ”The Role of Agriculturein Development.” American Economic Review Papers and Proceedings 92(2): 160-164.
[35] Gollin, Douglas. 2010. ”Agriculture as an Engine of Growth and Poverty Reduction: WhatWe Know and What We Need to Know.” A Framework Paper for the African Economic Re-search Consortium Project on Understanding Links between Growth and Poverty Reductionin Africa.
[36] Griliches, Zvi, and Jerry A. Hausman. 1986. ”Errors in Variables in Panel Data.” Journalof Econometrics 31:93-118.
[37] Henderson, J. Vernon. 2003. ”The Urbanization Process and Economic Growth: The So-What Question.” Journal of Economic Growth 8: 47-71.
[38] Henderson, J. Vernon. 2005. ”Urbanization and Growth.” in (eds) Philippe Aghion andSteven Durlauf, Handbook of Economic Growth, North Holland.
[39] Henderson, J. Vernon, Adam Storeygard, and David Weil. 2009. ”Measuring EconomicGrowth from Outer Space.” NBER Working Paper no 15199.
[40] Henderson, J. Vernon. 2010. ”Cities and Development.” Journal of Regional Science 50(1):515-540.
[41] Hirschman, Albert. 1958. The Strategy of Economic Development. Yale University Press,New Haven.
[42] Kim, Sukkoo. 2007. ”Immigration, Industrial Revolution and Urban Growth in the UnitedStates, 1820-1920: Factor Endowments, Technology and Geography.” NBER Working Pa-per 12900.
[43] Maxwell, Simon, and Adrian Fernando. 1989. ”Cash Crops in Developing Countries: TheIssues, the Facts, the Policies.” World Development 17(11): 1677-1708.
[44] McKinnish, Terra. 2008. ”Panel Data Models and Transitory Fluctuations in the Explana-tory Variable.” Advances in Econometrics 21: 335-358.
[45] McKinsey. 2010. Lions on the Move: The Progress and Potential of African Economies.Mc Kinsey Global Institute.
32
[46] Mellor, John. 1995. ”Introduction,” in Agriculture on the Road to Industrialization, J.W.Mellor, Ed. John Hopkins University Press, Baltimore.
[47] Michaels, Guy. 2010. ”The Long Term Consequences of Resource Based Specialization.”Forthocming in Economic Journal.
[48] Michaels, Guy, Ferdinand Rauch and Stephen Redding. 2008. ”Urbanization and StructuralTransformation.” CEPR DP 7016.
[49] Miguel, Edward. 2009. ”Africa’s Turn?” Cambridge: the MIT Press.
[50] Nickell, Stephen. 1981. ”Biases in Dynamic Models with Fixed Effects.” Econometrica49(6): 1417-1426.
[51] Nunn, Nathan, and Diego Puga. 2009. ”Ruggedness: The Blessing of Bad Geography inAfrica.” NBER Working Paper 14918.
[52] Nunn, Nathan, and Nancy Qian. 2010. ”The Potato’s Contribution to Population and Ur-banization: Evidence from an Historical Experiment.” Unpublished manuscript, Depart-ment of Economics, Harvard University.
[53] Overman, Henry, and Anthony Venables. 2005. ”Cities in the Developing World.” CEPDiscussion Paper dp0695.
[54] Pinkovskiy, Maxim, and Xavier Sala-i-Martin. 2010. ”Africa Poverty is Falling... MuchFaster than You Think!” Unpublished manuscript, Massachussets Institute of Technology,Departement of Economics.
[55] Poelhekke, Steven. 2011. ”Urban Growth and Uninsured Rural Risk: Booming Towns inBust Times.” Journal of Development Economics, Forthcoming.
[56] Rosenthal, Stuart S. and William C. Strange. 2004 ”Evidence on the Nature and Sources ofAgglomeration Economies,” Handbook of Urban and Regional Economics, (eds) J. VernonHenderson and Jacques-Francois Thisse.
[57] Ruf, Francois. 1991. ”Les crises cacaoyeres. La malediction des ages d’or ?” Cahiers d’etudesafricaines 31(121): 83-134.
[58] Ruf, Francois. 1995. Booms et crises du cacao: Les vertiges de l’or brun. Ministere de laCooperation, CIRAD-SAR and Karthala.
[59] Sachs, Jeffrey, and Andrew Warner. 2001. ”The Curse of Natural Resources.” EuropeanEconomic Review 45: 827-838.
[60] Satterthwaite, David. 2007. ”The Transition to a Predominantly Urban World and ItsUnderpinnings.” Paper presented at the UNU-WIDER International Workshop on Beyondthe Tipping Point: Development in an Urban World, London, October 19.
[61] Teal, Francis. 2002. ”Export Growth and Trade Policy in Ghana in the Twentieth Century.”The World Economy 25: 1319-1337.
33

[62] Thresh, John M., and Maxwell Owusu. 1986. ”The Control of Cocoa Swollen Shoot Diseasein Ghana: An Evaluation of Eradication Procedures.” Crop Protection 5: 41-52.
[63] Tiffin, Richard, and Xavier Irz. 2006. ”Is Agriculture the Engine of Growth?” AgriculturalEconomics 35(1): 79-89.
[64] Tosh, John. 1980. ”The Cash Crop Revolution in Tropical Africa: An Agricultural Reap-praisal.” African Affairs 79, 314: 79-94.
[65] Venables, Anthony J. 2010. ”Economic Geography and African Development.” Journal ofRegional Science 89(3): 469-483.
[66] Vicente, Pedro. 2010. ”Does Oil Corrupt? Evidence from a Natural Experiment in WestAfrica.” Journal of Development Economics 92(1): 28-38.
[67] Voigtlander, Nico, and Hans-Joachim Voth. 2010. ”The Three Horsemen of Riches: Plague,War, and Urbanization in Early Modern Europe.” Unpublished manuscript, UCLA, De-partment of Economics.
[68] Williamson, Jeffrey. 1990.Coping with City Growth During the British Industrial Revolu-tion. Cambridge University Press.
[69] WDR. 2008. World Development Report: Agriculture for Development. Washington, DC,The World Bank.
[70] WDR. 2009. World Development Report: Reshaping Economic Geography. Washington,DC, The World Bank.
[71] WUP. 2009. World Urbanization Prospects: The 2009 Revision Population Database. NewYork, The United Nations.
[72] Young, Alwyn. 2010. ”The African Growth Miracle.” Unpublished manuscript, LondonSchool of Economics, Department of Economics.
34

Data Appendix
Urban Data
Population data on Ivory Coast comes from the following documents: (i) Annuaire Statistiquede l’A.O.F. 1949-1951 & 1950-1954, (ii) Rapports periodiques des gouverneurs et chefs des ser-vices 1895-1940 and Rapports Statistiques 1818-1920, collections of the French colonial archives,(iii) Population de l’A.O.F. par canton et groupe ethnique 1950-1951, Haut-Commissariat del’A.O.F., Service de la statistique generale, (iv) Repertoire des villages de la Cote d’Ivoire 1955,Service de la statistique generale et de la mecanographie, Territoire de Cote d’Ivoire, (v) In-ventaire Economique de la Cote d’Ivoire 1947-1958, (vi) Cote d’Ivoire 1965: Population, Etudesregionales 1962-1965, Synthese, Ministere du Plan de Cote d’Ivoire, (vii) Recensement generalde la population 1975, (viii) Population de la Cote d’Ivoire, Analyse des donnees demographiquesdisponibles 1984, Ministere de l’Economie et des Finances de Cote d’Ivoire, Direction de la statis-tique, (ix) Recensement general de la population et de l’habitat 1988, (x) Recensement general dela population et de l’habitation 1998. Given changes in administrative boundaries, we are onlyable to get a consistent district sample of total population for the 1965-1998 period. As regardsurban data, we know the size and the geographical coordinates of any locality with more than5000 inhabitants for the period 1901-1998. Using GIS, we are then able to recalculate districturban population for any spatial decomposition. Since we have cocoa production for 46 districts,we use those boundaries to estimate total and urban populations.
Population data on Ghana comes from the reports of the following Population and HousingCensuses: 1901, 1911, 1921, 1931, 1948, 1960, 1970, 1984 and 2000. As regards total populationdata, administrative boundaries have changed with time and we cannot get a consistent sample.As regards urban data, we know the size and the geographical coordinates of any locality withmore than 5000 inhabitants for the whole period. Using GIS, we are able to recalculate districturban population for any spatial decomposition. Since we have cocoa production for 79 cocoadistricts, we use those boundaries to estimate urban population.
Cash Crop Production Data
Cocoa and coffee production data on Ivory Coast is obtained by crossing the informationcontained in different sources. For the pre-independence period, our major sources are: (i) An-nuaire Statistique de l’A.O.F. 1949-1951, and (ii) Inventaire Economique de la Cote d’Ivoire1947-1958. They list cocoa production at the colonial district level for the 1945-1958 period. Wethen use more minor sources to obtain data for the pre-1945 period as well as more refined spatialdata for the post-1944 period: (i) Documentary Material on Cacao for the Use of the SpecialCommittee on Cacao of the Inter-American Social and Economic Council, 1947, Pan Amer-ican Union, (ii) Felix Houphouet-Boigny: Biographie, Frederic Grah Mel (2003), Editions duCERAP, Maisonneuve & Larose, (iii) Problemes de l’economie rurale en A.O.F., Ch. Robequain(1937), Annales de Geographie 46 (260): 137-163, (iv) ”Immigration, Land Transfer and TenureChanges in Divo, Ivory Coast, 1940-80”, Robert Hecht (1985), Africa: Journal of the Interna-tional African Institute 55(3): 319-336, and (v) ”Immigration et economie de plantation dansla region de Vavoua (Centre-Ouest Ivoirien)”, P. Brady (1983), unpublished thesis Universityof Paris 10. For the post-independence period, our major sources are: (i) Annuaire retrospectifde statistiques agricoles et forestieres 1900-1983, Ministere de l’agriculture et des eaux et desforets de Cote d’Ivoire, 1983, (ii) Caisse de stabilisation et de soutien des prix des productionsagricoles (CSSPPA), the agricultural marketing board of Ivory Coast till its dismantling in 1999,
35

and (iii) ”Pesage systematique du cafe et du cacao a l’entree des usines de conditionnement etde transformation”, 2008-2009, Audit, Control & Expertise. They list cocoa production at thedistrict level for the 1959-2008 period. Those major sources were then complemented with morerefined spatial data from: (i) La boucle du cacao en Cote d’Ivoire, Etude regionale des circuitsde transport ,P. Benveniste (1974), Travaux et Documents de l’ORSTOM, and (ii) Atlas de Coted’Ivoire, 1971-1979, Ministere du Plan de Cote d’Ivoire. In the end, we obtain cocoa and coffeeproduction in tons for 46 districts for the 1948-2008 period. We calculate how much tons of cocoaand coffee production were produced between each census year for each district. We then usethe following sources to obtain the producer prices (in CFA Francs) for the period 1948-2006:(i) Annuaire Statistique de l’A.O.F. 1949-1951 & 1950-1954, and (ii) FAOSTAT. We obtainCFAF/$ exchange rate data and $ deflator data from: (i) UN 2010, (ii) IFS 2010, World Bank,(iii) Teal 2002. By multiplying cocoa and coffee productions and the corresponding deflatedproducer price (in 2000$), we get the annual deflated total value (also in 2000$) of cash cropproduction going to farmers. Likewise, we calculate how much 2000$ of cash crop productionwere earned between each census year for each district.
Cocoa production data on Ghana is obtained similarly, although only for the main crop,which extends from October to July. But this is not an issue as the main crop amounts to 94.7%of the total crop on average during the period 1948-2000. For the pre-independence period,we use the following documents: (i) 1927 Yearbook of the Gold Coast Department of Agricul-ture, Government of Ghana, (ii) A Historical Geography of Ghana, Dickson (1968), (iii) Reporton the Cocoa Industry in Sierra Leone, and Notes on the Cocoa Industry of the Gold Coast,Cadbury (1955). Those documents respectively display a very detailed map of cocoa produc-tion for the years 1926, 1936 and 1950. We can then use GIS to recalculate cocoa productionusing any district boundaries. We obtain national and regional data from the following docu-ments: (i) The Gold Coast Cocoa Farmer, by Polly Hill (1956), Oxford University Press, (ii)The Gold Coast Cocoa Industry: Prices, Production and Structural Change, Christer Gunnarson(1978), Economic History Association, Lund, Sweden, (iii) Annual Reports and Accounts of theGhana Marketing Board 1957-1962, 1965, 1970, (iii) Enquiry into the Gold Coast Cocoa Industry,1918-1919, W.S. Tudhope (1919), (iv) Reports of the Department of Botanical and AgriculturalDepartment 1904-1955, Government of the Gold Coast, and (v) The Economics of Cocoa Produc-tion and Marketing, Proceedings of Cocoa Economics Research Conference in Legon, April 1973,University of Ghana. For the post-independence period, all the following documents list cocoaproduction at the cocoa district level for their respective year: (i) Analysis of Cocoa Purchasesby Societies, Districts and Regions are repots edited by the Produce Department of the GhanaCocoa Marketing Board and available for the following years: 1961-1975, 1989 and 1994-1999,(ii) Ghana Cocoa Marketing Board Newsletter 1966-1974, (iii) Ghana Cocoa Marketing BoardMonthly Progress Reports 1972-1985, and (iv) a summary of 2001-2009 district cocoa purchaseswhich was obtained from the Ghana Cocoa Marketing Board. Since district boundaries changefrom year to year, we use GIS to reaggregate our data so as to get a consistent sample of dis-trict cocoa production. In the end, we obtain cocoa production for districts for the followingyears: 1926, 1936, 1950, 1961-1982, 1989, 2001. We use linear interpolation to recalculate co-coa production for the missing years. Lastly, we calculate how much tons of cocoa productionwere produced between each census year for each district. We then use the following sources toobtain the producer price (in 2000 Ghanaian 2nd Cedi) for the period 1900-2006: (i) Cocoa inthe Ghanaian Economy, Merryl Bateman (1965), unpublished thesis, MIT, (ii) FAOSTAT, (iii)”Export Growth and Trade Policy in Ghana in the Twentieth Century”, Teal (2002), The WorldEconomy 25: 1919-1937. We obtain Cedi/$ official and parallel exchange rate data and $ deflatordata from: (i) Dordunoo, Cletus. 1994. ”The Foreign Exchange Market and the Dutch AuctionSystem in Ghana.” AERC Research Paper no 24, (ii) Lawrence H. Officer. 2009. ”Exchange
36

Rates Between the United States Dollar and Forty-one Currencies.” Measuring Worth, (iii) Teal2002, and (iv) UN 2010. We use parallel exchange rate data when the black market premium issignificantly different from 0. By multiplying cocoa production and the deflated producer price(in 2000$), we get the annual deflated total value (also in 2000$) of cocoa production going tofarmers. Likewise, we calculate how much 2000$ of cocoa production were earned between eachcensus year for each district.
Other Data
We collect data on other characteristics of Ivory Coast and Ghana. Forest data comes fromland cover GIS data compiled by Globcover 2009. The data displays those areas with virgin forestor mixed virgin forest/croplands, which were areas with virgin forest before it was cleared for cashcrop production. Then, climate data comes from Terrestrial Air Temperature and Precipitation:1900-2006 Gridded Monthly Time Series, Version 1.01, 2007, University of Delaware.
For Ivory Coast, we first use three household surveys to calculate a range of statistics thatwe use for our empirical analysis: (i) the 1985-1988 Living Standards and Measurement Study(LSMS), and (ii) the 1998 and 2002 Enquetes sur le niveau de vie des menages (ENV). Third, inaddition to the household surveys, we use the following infrastructure datasets: (i) a GIS data seton paved roads in 1955, 1965, 1975, 1988 and 1998 using information from Michelin road maps andthe book Elephants d’Afrique 1995-2000, (ii) the 1988 urban infrastructure census (Recensementdes Infrastructures des Communes Urbaines), (iii) allocation maps of primary and secondaryschools in 1992 from the book Elephants d’Afrique 1995-2000, (iv) allocation map of health fa-cilities in 2003 from the WHO website (http://gamapserver.who.int/mapLibrary/default.aspx).Fourth, demographic transition data is compiled crossing information from the following docu-ments: (i) reports of Recensement general de la population et de l’habitation 1998, (ii) Tempsdes villes, temps des vivres : L’Essor du vivrier marchand en Cote-d’Ivoire, by Jean-LouisChaleard (2000), Karthala, (iii) La Cote d’Ivoire a l’aube du XXIe siecle : Defis demographiqueset developpement durable, by Georges Tapinos, Philippe Hugon and Patrice Vimard (2003),Karthala, (iv) Donnees demographiques sur la croissance des villes en Cote d’Ivoire, by Jean-PaulDuchemin et Jean-Pierre Trouchaud (1969), Cahiers de l’ORSTOM, Serie Sciences Humaines,1-1969. Fifth, the cocoa tax is estimated using annual FAO data on the international price indollars of cocoa beans and exchange rate UN data. Sixth, data on government total spending,consumption and investment comes from the African Development Indicators dataset (WB).
For Ghana, we first use three household surveys and two censuses to calculate a range ofstatistics that we use for our empirical analysis: (i) the 1987-88 and 2005 Ghana Living StandardSurvey, (ii) the 2000 Population and Housing Census IPUMS sample, and (iii) the 2000 FacilityCensus. Second, mining data is collected from the following documents: (i) The Mineral Industryof the British Empire and Foreign Countries 1913-1919, Imperial Mineral Resources Bureau, (ii)Reports of the Mines Department of the Gold Coast 1931-1958, and (iii) The Mineral Industry ofGhana 1963-2000, USGS Reports. Third, demographic transition data is compiled crossing in-formation from the following documents: (i) Patterson, David. 1979. ”Health in Urban Ghana:the Case of Accra 1900-1940.” Social Science and Medicine 13B: 251-268, (ii) Caldwell, J.C.1967. ”Fertility Differentials as Evidence of Incipient Fertility Decline in a Developing Country:The Case of Ghana.” Population Studies 21(1): 5-21, (iii) The Population of Ghana 1974, CI-CRED Report, (iv) Demographic and Household Survey 1988, (v) Agyei-Mensah, Samuel. 2005.”The Fertility Transition in Ghana Revisited.” Paper prepared for the 25th IUSSP InternationalPopulation Conference, Tours, and (vi) Ghana’s Development Agenda and Population Growth:The Unmet Need for Family Planning, National Population Council 2006.
37

Table 1: Cash Crop Production and Urbanization, Long-Differences Model, OLS.
Dependent Variable: Change in District Urban Population(Pop. in ≥5000 Localities)
Ivory Coast, 1948-1998 Ghana, 1901-2000OLS OLS + Ctrls OLS OLS + Ctrls
(1) (2) (3) (4)
District value of cocoa + coffee production 103.8*** 143.9*** 63.4*** 106.3***(between t0 and T , millions of 2000$) [37.7] [46.9] [15.8] [31.6]
District value of mineral production 24.5*(between t0 and T , millions of 2000$) [12.9]
Observations 46 46 79 79R-squared 0.47 0.79 0.85 0.90All Controls N Y N Y
Note: Standard errors in parentheses. * significant at 10%; ** significant at 5%; *** significant at 1%. Standard errors areclustered at the regional level. We add the following controls: (a) political economy: dummies for being suitable to cocoaproduction (= Southern district), for having a national city (capital city and/or largest city) or a regional capital, (b) economicgeography: dummies for whether the district has a paved road, a railway or an international port in 1965, as well as Euclideandistance (in km) to the coast, (iii) physical geography: 1900-2006 average annual precipitations (in mms) and average maximaltemperature (in C), and (iv) value of mineral production between t− 1 and t for Ghana.

Table 2: Cash Crop Production and Urbanization, Fixed Effects Model, IV.
Dependent Variable: District Urban Population(Pop. in ≥5000 Localities)
Ivory Coast, 1948-1998 Ghana, 1901-2000OLS IV IV, Excl.
Abidjan
OLS IV IV, Excl.
Accra
(1) (2) (3) (4) (5) (6)Panel A: Main Equation
District value of cocoa + coffee prod. 57.1*** 70.5*** 89.6*** 32.4* 78.9*** 83.1***(between t− 1 and t, millions of 2000$) [14.2] [21.7] [21.1] [16.8] [29.7] [28.2]
Close to the cocoa front 2,932.7 2,594.4 -136.9 -1,150.3[3,324.1] [2,897.7] [1,462.3] [1,269.7]
Panel B: 1st Stage
Suitable * Close to the cocoa front 199.7*** 166.3*** 86.5*** 86.4***[69.3] [59.6] [17.4] [18.2]
Close to the cocoa front 6.5 11.4 -4.3 -4.5[38.0] [36.5] [5.6] [6.2]
Kleibergen-Paap rk Wald F stat 7.2 7.8 22.6 22.6Observations 230 230 225 632 632 624R-squared 0.99 0.99 0.95 0.99 0.99 0.96Year Fixed Effects Y Y Y Y Y YDistrict Fixed Effects Y Y Y Y Y YYear Dummies * Lag of Dep. Var. Y Y Y Y Y YAll Controls Y Y Y Y Y Y
Note: Standard errors in parentheses. * significant at 10%; ** significant at 5%; *** significant at 1%. Standard errors areclustered at the district level. We add the following controls whose coefficient is time-varying: (a) political economy: dummiesfor being suitable to cocoa production (= Southern district), for having a national city (capital city and/or largest city) or aregional capital, (b) economic geography: dummies for whether the district has a paved road, a railway or an international portin 1965, as well as Euclidean distance (in km) to the coast, (iii) physical geography: 1900-2006 average annual precipitations (inmms) and average maximal temperature (in C), and (iv) value of mineral production between t− 1 and t for Ghana.

Table 3: Cash Crop Production and Urbanization, IV, Specification Checks.
Dependent Variable: District Urban Population(Pop. in ≥5000 Localities, Excl. Abidjan and Accra)
Ivory Coast, 1948-1998 Ghana, 1901-2000
Level � Density Level Level � Density Level(1) (2) (3) (4) (5) (6) (7) (8)
Main Equation
District value of cocoa + coffee prod. 89.6*** 97.2*** 78.9*** 99.7*(between t− 1 and t, millions of 2000$) [21.1] [20.7] [29.7] [51.5]
District value density of cocoa + coffee 70.6*** 78.5(between t− 1 and t, millions of 2000$/sq.km.) [22.2] [70.3]
District cocoa + coffee production 0.13*** 0.08**(between t− 1 and t, tons) [0.03] [0.03]
Kleibergen-Paap rk Wald F stat 7.8 6.3 9.5 9.7 22.4 21.8 22.7 18.2Observations 225 225 225 225 632 632 632 632R-squared 0.95 0.97 0.96 0.96 0.99 0.69 0.99 0.99Year Fixed Effects Y Y Y Y Y Y Y YDistrict Fixed Effects Y Y Y Y Y Y Y YYear Dummies * Lag of Dep. Var. Y N Y Y Y N Y YAll Controls Y Y Y Y Y Y Y Y
Note: Standard errors in parentheses. * significant at 10%; ** significant at 5%; *** significant at 1%. Standard errors areclustered at the district level. All the regressions include year and district fixed effects. Except in columns (2) and (5) wherethe outcome is the change variable, we also include year dummies interacted with the lag of the dependent variable. We addthe following controls whose coefficient is time-varying: (a) political economy: dummies for being suitable to cocoa production(= Southern district), for having a national city (capital city and/or largest city) or a regional capital, (b) economic geography:dummies for whether the district has a paved road, a railway or an international port in 1965, as well as Euclidean distance (inkm) to the coast, (iii) physical geography: 1900-2006 average annual precipitations (in mms) and average maximal temperature(in C), and (iv) value of mineral production between t− 1 and t for Ghana.

Table 4: Cash Crop Production and Total, Urban and Rural Populations, Ivory Coast, 1965-1998.
Dependent Variable: Population Urban Population
Total Urban Rural Urban.Rate
In OldCities
In NewCities
Numberof Cities
(1) (2) (3) (4) (5) (6) (7)
District value of cocoa + coffee prod. 61.5** 62.8*** 4.5 0.01*** 33.7*** 44.3*** 0.007***(between t− 1 and t, millions of 2000$) [24.2] [13.4] [23.1] [0.00] [11.4] [12.7] [0.002]
Observations 135 135 135 135 135 135 135R-squared 0.94 0.92 0.85 0.78 0.90 0.56 0.79Year Fixed Effects Y Y Y Y Y Y YDistrict Fixed Effects Y Y Y Y Y Y YYear Dummies * Lag of Dep. Var. Y Y Y Y Y Y YAll Controls Y Y Y Y Y Y Y
Note: Standard errors in parentheses. * significant at 10%; ** significant at 5%; *** significant at 1%. Standard errors areclustered at the district level. We add the following controls whose coefficient is time-varying: (a) political economy: dummiesfor being suitable to cocoa production (= Southern district), for having a national city (capital city and/or largest city) or aregional capital, (b) economic geography: dummies for whether the district has a paved road, a railway or an international portin 1965, as well as Euclidean distance (in km) to the coast, (iii) physical geography: 1900-2006 average annual precipitations (inmms) and average maximal temperature (in C), and (iv) value of mineral production between t− 1 and t for Ghana.

Table 5: Population Change in Old vs. New Cocoa-Producing Areas, Ivory Coast 1965-1998, OLS.
Dependent Variable: District Urban Population(Thousands of Inhabitants)
All Cities In OldCities
In NewCities
Number ofCities
(1) (2) (3) (4)
Old Cocoa Area 84.6*** 57.2*** 56.5*** 7.0***[10.5] [7.6] [11.5] [1.7]
New Cocoa Area 66.1*** 59.3*** 39.9*** 4.6***[13.6] [5.1] [6.8] [0.9]
Observations 135 135 135 135R-squared 85.3 88.2 56.5 70.3Year Fixed Effects Y Y Y YDistrict Fixed Effects Y Y Y YYear Dummies * Lag of Dep. Var. Y Y Y YAll Controls Y Y Y Y
Note: Standard errors in parentheses. * significant at 10%; ** significant at 5%; *** significant at 1%. Standard errors areclustered at the district level. We add the following controls whose coefficient is time-varying: (a) political economy: dummiesfor being suitable to cocoa production (= Southern district), for having a national city (capital city and/or largest city) or aregional capital, (b) economic geography: dummies for whether the district has a paved road, a railway or an international portin 1965, as well as Euclidean distance (in km) to the coast, (iii) physical geography: 1900-2006 average annual precipitations (inmms) and average maximal temperature (in C), and (iv) value of mineral production between t− 1 and t for Ghana.
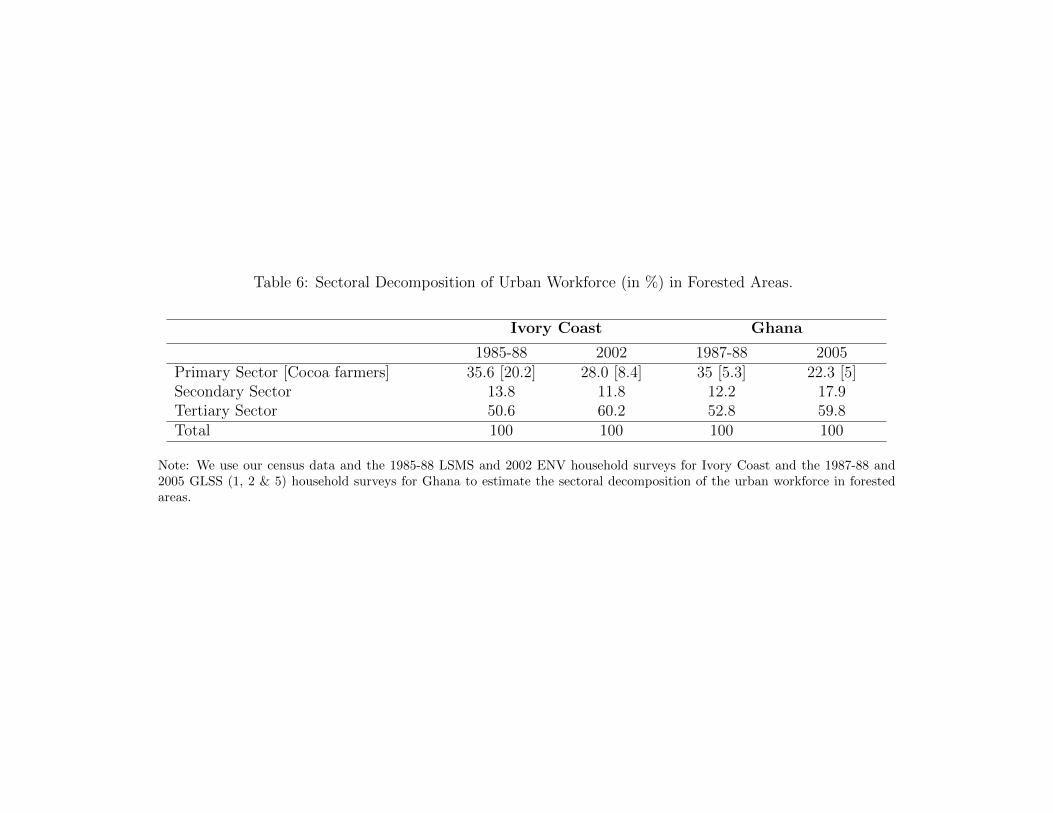
Table 6: Sectoral Decomposition of Urban Workforce (in %) in Forested Areas.
Ivory Coast Ghana
1985-88 2002 1987-88 2005Primary Sector [Cocoa farmers] 35.6 [20.2] 28.0 [8.4] 35 [5.3] 22.3 [5]Secondary Sector 13.8 11.8 12.2 17.9Tertiary Sector 50.6 60.2 52.8 59.8Total 100 100 100 100
Note: We use our census data and the 1985-88 LSMS and 2002 ENV household surveys for Ivory Coast and the 1987-88 and2005 GLSS (1, 2 & 5) household surveys for Ghana to estimate the sectoral decomposition of the urban workforce in forestedareas.

Table 7: Sectoral Decomposition of Urban Growth in Centre-Ouest Region, Ivory Coast.
Center-Ouest Region, 1985-88 - 2002
% of urban growth due to:
Non-Workforce 64.4Workforce 35.6% of change in urban workforce due to:
Primary Sector [Cocoa farmers] 56.5 [34.4]Secondary Sector -9.1Tertiary Sector 52.6Of which:
- Trade 24.3- Personal Services 17.6- Transport & Communications 8.8- Education & Health 2.7- Business Services & Banking 2- Administration -2.8Total 52.6
Note: We use the 1985-88 LSMS and 2002 ENV household surveys to estimate the sectoral decomposition of urban growth inthe Centre-Ouest region of Ivory Coast.

Table 8: Allocation of Household Expenditures for Cocoa-Producing Households (in %).
Ivory Coast, Forest, 1985-1988 and 2002
1988 2002 1988 2002 1988 2002Home Production 32.1 28.9 Food Expenses 25.8 27.9 Other Expenses 42 43.2
Of which (%): Of which (%): Of which (%):
Starchy roots 51.7 40.1 Seafood 30.0 29.0 Clothing 22.9 21.7Cereals 25.2 24.5 Cereals 16.1 22.3 Transfers & Events 15.0 14.3Vegetables 10.1 11.9 Sweets 13.9 8.6 Health & Hygiene 14.0 23.6Meat 5.8 6.3 Alcohol 9.3 3.1 Housing 14.0 17.4Oils 5.2 9.1 Meat 8.6 8.5 Education 12.2 6.6Fruits 1.3 5.8 Oils 8.0 8.0 Bills & Fuel 9.1 11.3
Ghana, Forest, 1987-1988 and 2005
1988 2005 1988 2005 1988 2005Home Production 36.3 18.5 Food Expenses 33.3 37.2 Other Expenses 30.1 44.3
Of which (%): Of which (%): Of which (%):
Starchy roots 59.5 67.5 Seafood 35.8 35.1 Clothing 26.6 19.4Vegetables 10.9 8.8 Starchy roots 17.5 6.0 Health & Hygiene 20.5 16.3Cereals 9.9 6.7 Vegetables 11.0 12.1 Housing 9.4 10.6Fruits 7.8 4.2 Cereals 9.1 17.5 Transfers & Events 11.9 10.9Meat 6.2 4.0 Meat 8.0 7.4 Education 6.9 15.2Oils 5 6 Oils 6 5 Bills & Fuel 8.9 11.3
Note: We use the 1985-88 LSMS and 2002 ENV household surveys for Ivory Coast and the 1987-88 and 2005 GLSS (1, 2 & 5)household surveys for Ghana to estimate the allocation (in %) of total household expenditure for cocoa-producing householdsin the Forest regions of both countries. We first show the allocation across three consumption aggregates: home production,food expenses and other expenses. Second, for each of those consumption aggregates, we show the six main consumptionsubaggregates and their contribution (in %) to the value of the consumption aggregate.
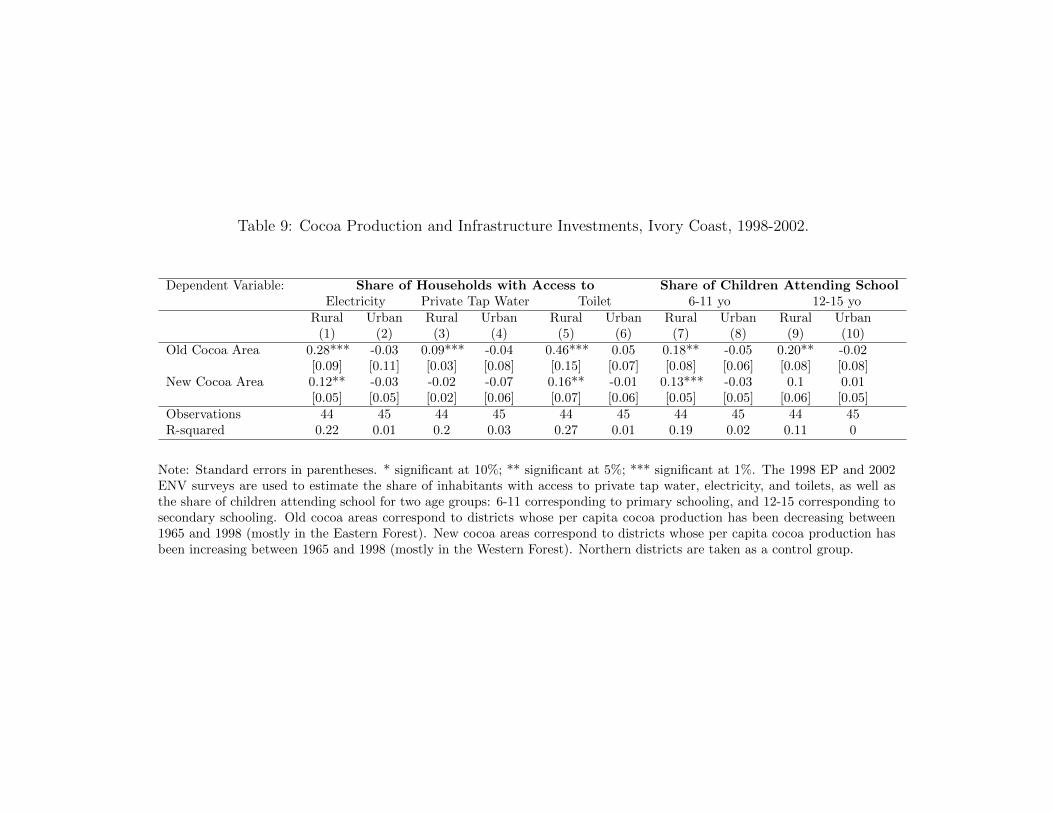
Table 9: Cocoa Production and Infrastructure Investments, Ivory Coast, 1998-2002.
Dependent Variable: Share of Households with Access to Share of Children Attending School
Electricity Private Tap Water Toilet 6-11 yo 12-15 yoRural Urban Rural Urban Rural Urban Rural Urban Rural Urban(1) (2) (3) (4) (5) (6) (7) (8) (9) (10)
Old Cocoa Area 0.28*** -0.03 0.09*** -0.04 0.46*** 0.05 0.18** -0.05 0.20** -0.02[0.09] [0.11] [0.03] [0.08] [0.15] [0.07] [0.08] [0.06] [0.08] [0.08]
New Cocoa Area 0.12** -0.03 -0.02 -0.07 0.16** -0.01 0.13*** -0.03 0.1 0.01[0.05] [0.05] [0.02] [0.06] [0.07] [0.06] [0.05] [0.05] [0.06] [0.05]
Observations 44 45 44 45 44 45 44 45 44 45R-squared 0.22 0.01 0.2 0.03 0.27 0.01 0.19 0.02 0.11 0
Note: Standard errors in parentheses. * significant at 10%; ** significant at 5%; *** significant at 1%. The 1998 EP and 2002ENV surveys are used to estimate the share of inhabitants with access to private tap water, electricity, and toilets, as well asthe share of children attending school for two age groups: 6-11 corresponding to primary schooling, and 12-15 corresponding tosecondary schooling. Old cocoa areas correspond to districts whose per capita cocoa production has been decreasing between1965 and 1998 (mostly in the Eastern Forest). New cocoa areas correspond to districts whose per capita cocoa production hasbeen increasing between 1965 and 1998 (mostly in the Western Forest). Northern districts are taken as a control group.

Table 10: Cocoa Production and Infrastructure Investments, Ghana, 2000.
Dependent Variable: Share of Inhabitants ≤ 10 Kms From
Primary School JSS SSS Health Centre HospitalRural Urban Rural Urban Rural Urban Rural Urban Rural Urban(1) (2) (3) (4) (5) (6) (7) (8) (9) (10)
Very Old Cocoa Area 0.04* 0.00 0.13* 0.00 0.16* 0.07* 0.14* 0.02** 0.12* 0.10[0.01] [0.00] [0.05] [0.00] [0.07] [0.03] [0.05] [0.01] [0.05] [0.06]
Old Cocoa Area 0.04* 0.00 0.12 0.00 0.18 0.02 0.14* 0.01 0.17* 0.09[0.01] [0.00] [0.05] [0.00] [0.08] [0.03] [0.06] [0.01] [0.06] [0.07]
New Cocoa Area 0.03 0.00 0.10 0.00 0.00 0.00 0.00 0.01 0.09 -0.02[0.01] [0.00] [0.05] [0.00] [0.07] [0.03] [0.05] [0.01] [0.05] [0.06]
Observations 104 100 104 100 104 100 104 100 104 100R-squared 0.27 0.00 0.30 0.00 0.13 0.04 0.19 0.02 0.13 0.03
Dependent Variable: Share of Inhabitants ≤ 10 Kms From Share of Inhabitants with Access to
Post Office Telephone Electricity Private Tap ToiletRural Urban Rural Urban Rural Urban Rural Urban Rural Urban(11) (12) (13) (14) (15) (16) (17) (18) (19) (20)
Very Old Cocoa Area 0.36** 0.11* 0.33** 0.17** 0.11** 0.12** 0.02** 0.07** 0.60** 0.27*[0.06] [0.04] [0.04] [0.04] [0.02] [0.02] [0.00] [0.02] [0.14] [0.08]
Old Cocoa Area 0.30* 0.10* 0.25* 0.12* 0.15** 0.14** 0.01 0.01 0.55** 0.25*[0.09] [0.04] [0.08] [0.04] [0.03] [0.02] [0.01] [0.03] [0.14] [0.09]
New Cocoa Area 0.12 0.01 0.13* 0.05 0.12** 0.18** 0 0 0.42* 0.21*[0.06] [0.04] [0.04] [0.04] [0.02] [0.02] [0.00] [0.02] [0.14] [0.08]
Observations 104 100 104 100 104 100 104 100 104 100R-squared 0.33 0.15 0.24 0.08 0.29 0.2 0.07 0.05 0.61 0.39
Note: Standard errors in parentheses. * significant at 10%; ** significant at 5%; *** significant at 1%. Standard errors areclustered at the region level. The 2000 Facility Census is used to calculate the average distance (in km) to various types offacility. JSS and SSS are junior and senior secondary schools. The 2000 Population and Housing Census is used to estimate theshare of inhabitants with access to electricity, private tap water and toilets. Observations corresponding to Accra and Kumasiare dropped. Very old cocoa areas correspond to districts whose maximum cocoa production was reached during the 1930s. Oldcocoa areas correspond to districts whose maximum cocoa production was reached in the 1960s. New cocoa areas correspond todistricts whose maximum cocoa production was reached in the 1990s. Northern districts are taken as a control group.

Table 11: Crude Rates of Birth, Death and Natural Increase per Place of Residence.
Ivory Coast 1965-1998 Ghana 1960-2000Crude Rate of (%o) Crude Rate of (%o)
Birth Death Naturalincrease
Birth Death Naturalincrease
Rural Rural1965 50 30 20 1960 52 23 291975 48 20 28 1970 51 21 301988 52 15 37 1984 48 17 31Urban Urban1965 46 26 20 1960 49 20 291975 51 14 37 1970 45 14 311988 42 13 29 1984 37 14 23Abidjan Accra1965 47 14 33 1960 43 14 301975 50 9 41 1970 36 7 281988 42 9 33 1984 34 11 23
Note: see data appendix for details.
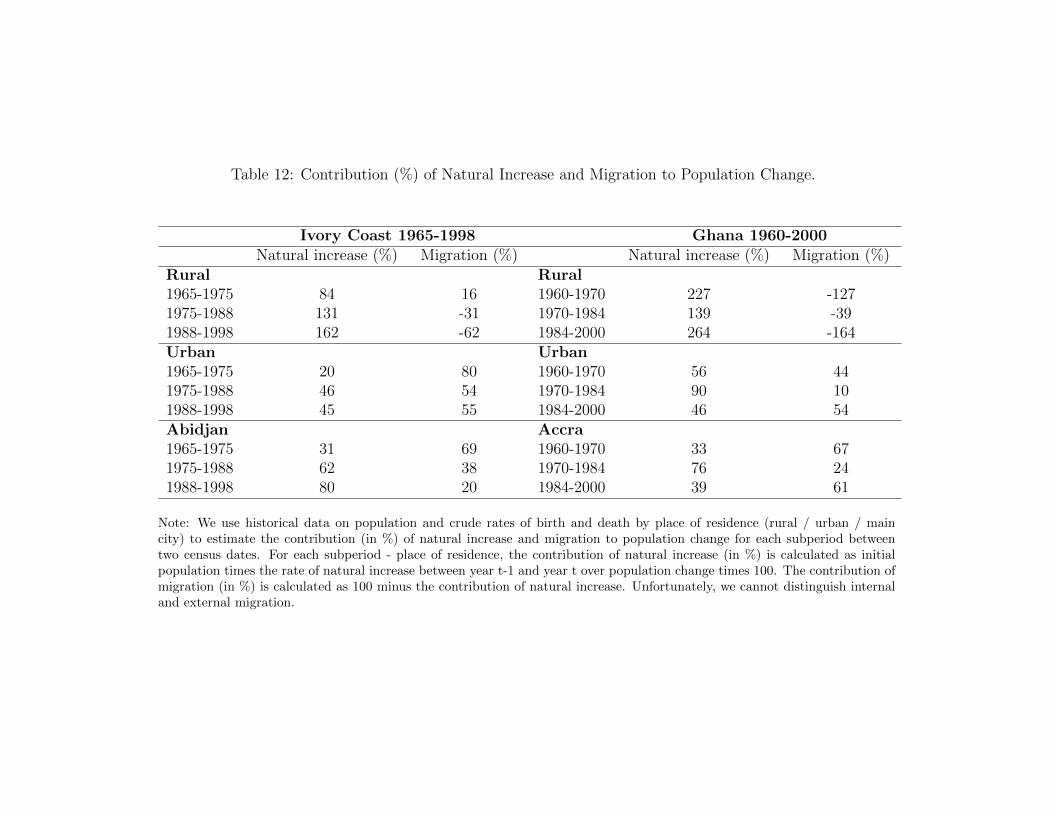
Table 12: Contribution (%) of Natural Increase and Migration to Population Change.
Ivory Coast 1965-1998 Ghana 1960-2000Natural increase (%) Migration (%) Natural increase (%) Migration (%)
Rural Rural1965-1975 84 16 1960-1970 227 -1271975-1988 131 -31 1970-1984 139 -391988-1998 162 -62 1984-2000 264 -164Urban Urban1965-1975 20 80 1960-1970 56 441975-1988 46 54 1970-1984 90 101988-1998 45 55 1984-2000 46 54Abidjan Accra1965-1975 31 69 1960-1970 33 671975-1988 62 38 1970-1984 76 241988-1998 80 20 1984-2000 39 61
Note: We use historical data on population and crude rates of birth and death by place of residence (rural / urban / maincity) to estimate the contribution (in %) of natural increase and migration to population change for each subperiod betweentwo census dates. For each subperiod - place of residence, the contribution of natural increase (in %) is calculated as initialpopulation times the rate of natural increase between year t-1 and year t over population change times 100. The contribution ofmigration (in %) is calculated as 100 minus the contribution of natural increase. Unfortunately, we cannot distinguish internaland external migration.

Table 13: Urban Labor Force in Ghana (2000): Participation, Composition and Diversification.
Dependent Variable: Is Employed Is Employed in Sector: Diversity Index
Primary Secondary Tertiary Hirschman-Herfindahl(3) (1) (2) (6) (7)
Very Old Cocoa Area 0.03* 0.08* -0.04** -0.04 0.04**[0.02] [0.04] [0.01] [0.02] [0.02]
Old Cocoa Area 0.04** 0.07** -0.01 -0.06*** 0.02*[0.02] [0.03] [0.01] [0.02] [0.01]
New Cocoa Area 0.03*** 0.20*** -0.04*** -0.16*** 0.04***[0.01] [0.03] [0.01] [0.02] [0.01]
National Average 0.86 0.23 0.22 0.55 0.23Observations 300392 257439 257439 257439 257439R-squared 0.01 0.13 0.01 0.05 0.44Controls Y Y Y Y Y
Note: Standard errors in parentheses. * significant at 10%; ** significant at 5%; *** significant at 1%. Standard errors areclustered at the region level. The 2000 Population and Housing Census is used to create dummies equal to one if a 25-60 year-old individual has an occupation and whether she is employed in the primary/secondary/tertiary sector. We also estimate aHirschman-Herfindahl diversification index using a classification with 11 sectors. Results are robust to a diversity index based ona classification with 63 subsectors. Very old cocoa areas correspond to districts whose maximum cocoa production was reachedduring the 1930s. Old cocoa areas correspond to districts whose maximum cocoa production was reached in the 1960s. Newcocoa areas correspond to districts whose maximum cocoa production was reached in the 1990s. Northern districts are takenas a control group. Controlling variables are: age-sex dummies, district dummies for having a national city (Accra, Kumasi), aregional capital, a port, a paved road, a railway, being a coastal district, and distance to the coast (in km).

Figure 1: Manufacturing and Service Sectors and Urbanization in DevelopingCountries in 2000.
Sources: WUP 2009, WDI 2010, Author’s Calculations. America-Asia includes developing coun-
tries from Caribbean (4), Central America (8), South America (12), Eastern Asia (2), South and
Central Asia (7) and South-Eastern Asia (9). Africa includes countries from Sub-Saharan Africa
(39). Small island and enclave countries are intentionally excluded from this analysis.
Figure 2: Primary Exports and Urbanization in Africa in 2000.
Sources: WUP 2009, WDI 2010, USGS 1960-2000, Author’s Calculations. Our sample consists
of 39 Sub-Saharan African countries. Primary exports include mining and cash crop exports.
Subfigure a. uses their contribution (in %) to GDP in 2000, while subfigure b. uses their averagecontribution to GDP (in %) between 1960 and 2000, using a 5-year panel I constructed.
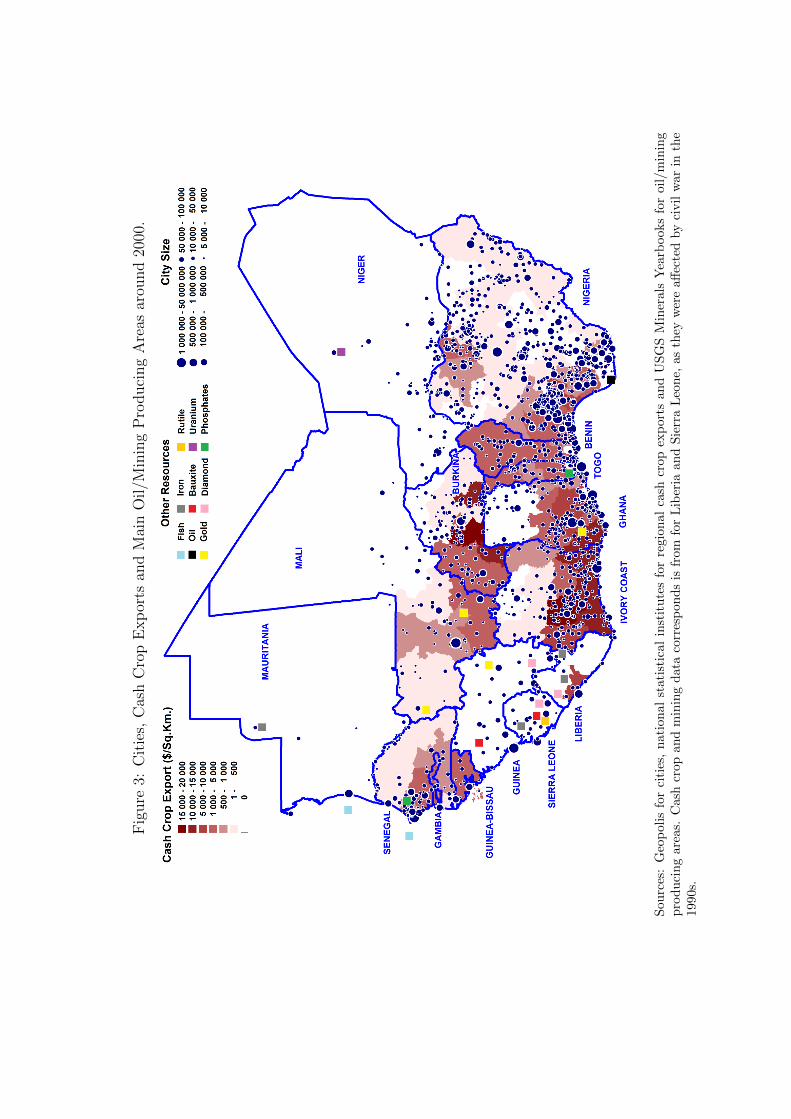
Figure
3:Cities,CashCropExp
orts
andMainOil/M
iningProducingAreas
arou
nd2000.
Sources:Geopolisforcities,nationalstatisticalinstitutesforregionalcashcropexportsandUSGSMinerals
Yearbooksforoil/mining
producingareas.Cashcropandminingdatacorrespondsis
from
forLiberia
andSierraLeone,astheywereaffectedbycivilwarin
the
1990s.

Figure 4: Cocoa Production (in Thousand Tons), 1890-2007.
Sources: see data appendix for more details.
Figure 5: Total and Urban Populations, 1900-2000.
Sources: see data appendix for more details.

Figure 6: Urbanization and Primacy Rates, 1900-2000.
Sources: see data appendix for more details. The urbanization rate is defined as urban population
over total population * 100, and the primacy rate is the size of the capital city over total
population * 100.
Figure 7: Former Forested Areas, Regions and Historical Starting Points.
Sources: see data appendix for more details. Former forested areas were virgin forests one century
ago, before cocoa production started. Aburi is the historical starting point of Ghanaian cocoa
production. Abengourou is the historical starting point of Ivorian cocoa production.

Figure 8: Value of Cocoa Production Going to Cocoa Farmers, 1900-2000.
Sources: see data appendix for more details. The value of cocoa production in year t is calculatedas the quantity produced that year (in tons) multiplied by the price per ton (in 2000$) that year.
Figure 9: Value of Cash Crop Production (1900-2000) and Cities (2000).
Note: The value of cash crop production includes the total district value (in thousand 2000$ per
sq.km.) of cocoa production in Ghana from 1900 to 2000, and cocoa and coffee production in
Ivory Coast from 1948 to 2000 (not much was produced before 1948).
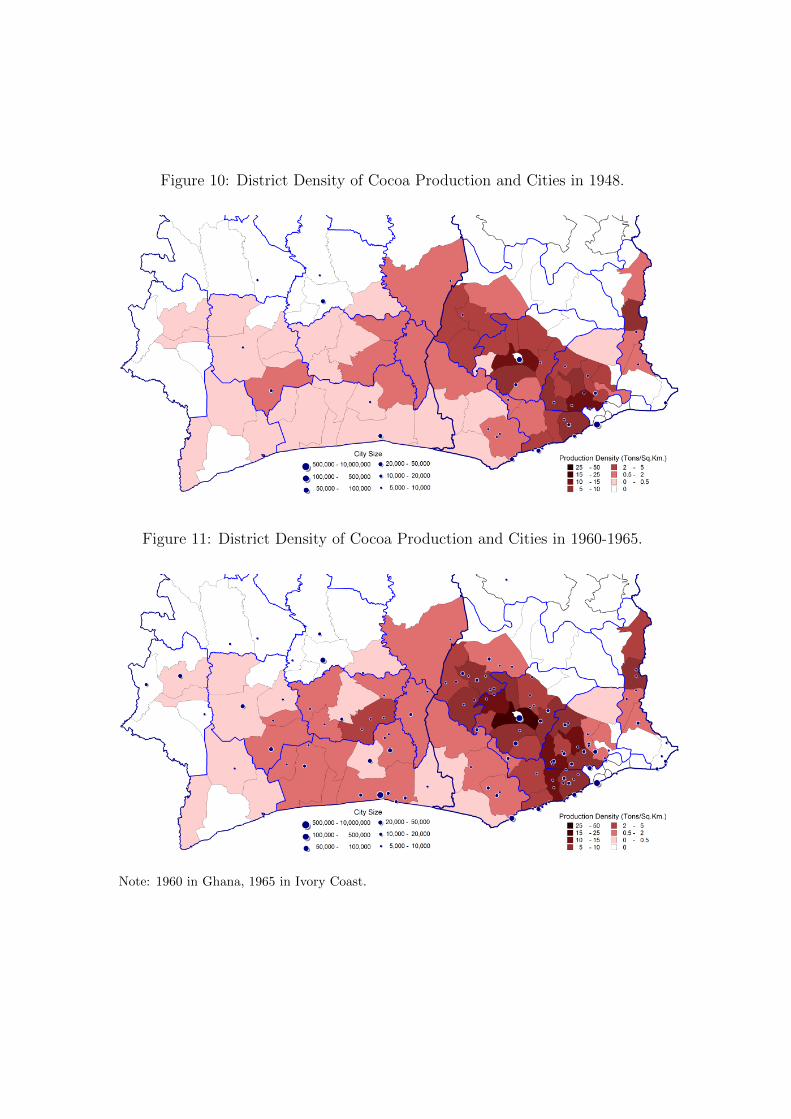
Figure 10: District Density of Cocoa Production and Cities in 1948.
Figure 11: District Density of Cocoa Production and Cities in 1960-1965.
Note: 1960 in Ghana, 1965 in Ivory Coast.

Figure 12: District Density of Cocoa Production and Cities in 1970-1975.
Note: 1970 in Ghana, 1975 in Ivory Coast.
Figure 13: District Density of Cocoa Production and Cities in 1984-1988.
Note: 1984 in Ghana, 1988 in Ivory Coast.
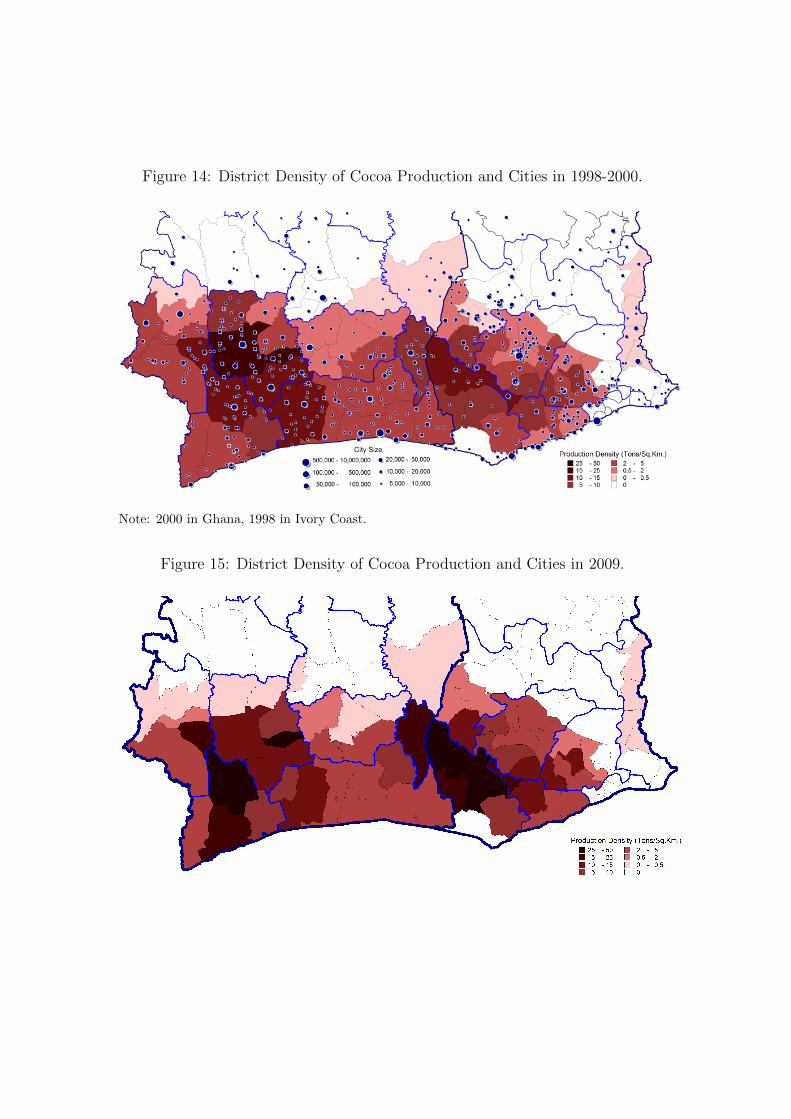
Figure 14: District Density of Cocoa Production and Cities in 1998-2000.
Note: 2000 in Ghana, 1998 in Ivory Coast.
Figure 15: District Density of Cocoa Production and Cities in 2009.

Figure 16: Share of District Area Suitable to Cocoa Production.
Sources: see data appendix for more details.
Figure 17: Centroids and Longitude Bands of One Degree.