AFRICAN AMERICAN COLLEGE STUDENTS’ PERCEPTIONS OF ...
143
AFRICAN AMERICAN COLLEGE STUDENTS’ PERCEPTIONS OF PROFESSIONAL DRESS by EMILY CAROL BLALOCK (Under the Direction of Jan Hathcote) ABSTRACT The purpose of this study was to survey African American college students to identify their perceptions of female professional dress. The variables of self-esteem, the importance of clothing, fashion innovativeness, and the type of Land Grant institution or the geographic location of the university the student attended were tested as possible influencers of perception. A total of 251 surveys were completed by African Americans enrolled in two Historically Black Colleges and Universities (HBCU) and two predominantly white institutions (PWI) located in Mississippi and Louisiana. Results indicated that there was a significant difference between Mississippi and Louisiana samples, HBCU and PWI subsamples, fashion innovator and fashion follower subsamples, and male and female subsamples in their perception of professional dress. Mean scores indicated that the overall African American sample had a fair understanding of female professional dress, though the entire sample perceived inappropriate fashion-oriented suits as appropriate professional interview attire. INDEX WORDS: African American, Perception, Professional Dress, Self- Esteem, Fashion Innovativeness
Transcript of AFRICAN AMERICAN COLLEGE STUDENTS’ PERCEPTIONS OF ...

AFRICAN AMERICAN COLLEGE STUDENTS’ PERCEPTIONS OF
PROFESSIONAL DRESS
by
EMILY CAROL BLALOCK
(Under the Direction of Jan Hathcote)
ABSTRACT
The purpose of this study was to survey African American college students to identify
their perceptions of female professional dress. The variables of self-esteem, the importance of
clothing, fashion innovativeness, and the type of Land Grant institution or the geographic
location of the university the student attended were tested as possible influencers of perception.
A total of 251 surveys were completed by African Americans enrolled in two Historically Black
Colleges and Universities (HBCU) and two predominantly white institutions (PWI) located in
Mississippi and Louisiana. Results indicated that there was a significant difference between
Mississippi and Louisiana samples, HBCU and PWI subsamples, fashion innovator and fashion
follower subsamples, and male and female subsamples in their perception of professional dress.
Mean scores indicated that the overall African American sample had a fair understanding of
female professional dress, though the entire sample perceived inappropriate fashion-oriented
suits as appropriate professional interview attire.
INDEX WORDS: African American, Perception, Professional Dress, Self-Esteem, Fashion Innovativeness

AFRICAN AMERICAN COLLEGE STUDENTS’ PERCEPTIONS OF
PROFESSIONAL DRESS
by
EMILY CAROL BLALOCK
B.S., The University of Southern Mississippi
A Thesis Submitted to the Graduate Faculty of the University of Georgia in Partial
Fulfillment of the Requirements for the Degree
MASTER OF SCIENCE
ATHENS, GEORGIA
2006

© 2006
Emily Carol Blalock
All Rights Reserved

AFRICAN AMERICAN COLLEGE STUDENTS’ PERCEPTIONS OF
PROFESSIONAL DRESS
by
EMILY CAROL BLALOCK
Major Professor: Jan Hathcote
Committee: Soyoung Kim Patricia Hunt-Hurst
Electronic Version Approved:
Maureen GrassoDean of the Graduate SchoolThe University of GeorgiaAugust 2006
v
ACKNOWLEDGEMENTS
I would like for everyone who reads this research to know that the Lord Jesus Christ
is the reason for its inspiration and completion. I would like to thank my Major Professor,
Jan Hathcote, for having the patience to answer my constant stream of questions and for the
wisdom and resources to provide all the answers. I would like to thank the members of my
committee, Soyoung Kim and Patricia Hunt-Hurst, for the encouragement and kindness they
have bestowed upon me during my graduate career at the University of Georgia. I want to
thank Helen Epps for enriching my life with wisdom and the beauty of travel. I would like to
thank Diane Batts Morrow for teaching me how to question American history and for
enticing my hunger for knowledge. I would like to thank Professor Brian Glaser for his
enthusiasm to share his knowledge of SPSS to new acquaintances.
I would especially like to thank my best friend and husband, Brent, for providing
daily encouragement and understanding during the past two years. And to my mom, thank
you for all your sacrifices and for shaping me into the woman I am today.

vi
TABLE OF CONTENTS
Page
ACKNOWLEDGMENTS ...............................................................................................................v
LIST OF TABLES......................................................................................................................... ix
CHAPTER
1 INTRODUCTION .........................................................................................................1
African American Consumers...................................................................................1
African American Professionals ...............................................................................2
African Americans and Racism ................................................................................4
African Americans in the Workplace .......................................................................6
African Americans and Professional Dress ..............................................................8
Purpose...................................................................................................................10
Objectives ..............................................................................................................11
Hypotheses.............................................................................................................11
Significance of Study.............................................................................................12
Conceptual Definitions ..........................................................................................12
Operational Definitions..........................................................................................14
2 REVIEW OF LITERATURE ......................................................................................18
African American Aesthetics of Dress ..................................................................18
Identity Through Dress ..........................................................................................20
African American Self-Esteem..............................................................................22

vii
Perception and Culture.............................................................................................27
Adoption Cycle ........................................................................................................29
Professional Dress....................................................................................................33
Dressing Women in the Workplace .........................................................................39
African American Professional Dress......................................................................43
3 METHODOLOGY ......................................................................................................46
Sample...................................................................................................................46
The Preliminary Focus Group...............................................................................48
Description of Instrument .....................................................................................50
Administration of the Instrument..........................................................................54
4 RESULTS ....................................................................................................................56
Participant Demographics.....................................................................................56
Descriptive Findings .............................................................................................61
Correlations...........................................................................................................73
5 DISCUSSION..............................................................................................................75
Hypotheses............................................................................................................75
Implications...........................................................................................................89
Future Research ....................................................................................................93
Limitations ............................................................................................................94
REFERENCES ..............................................................................................................................95
APPENDICES .............................................................................................................................112
A Research Survey......................................................................................................112
B Focus Group Questions ...........................................................................................121

viii
C Focus Group Survey...............................................................................................122
D Focus Group Information Sheet.............................................................................123
E Frequency Tables...................................................................................................125
Table One..............................................................................................................125
Table Two .............................................................................................................126
Table Three ...........................................................................................................127
Table Four.............................................................................................................130
Table Five .............................................................................................................131
Table Six ...............................................................................................................132
F Survey Distribution................................................................................................134

ix
LIST OF TABLES
Page
Table 1: Survey Description ........................................................................................................57
Table 2: Demographic Characteristics of the Four Universities..................................................59
Table 3: Results of the Cronbach Alpha Test for the Survey Sections........................................61
Table 4: Descriptive Statistics for HBCU and PWI Subsamples ................................................64
Table 5: Descriptive Statistics for Mississippi and Louisiana Samples ......................................66
Table 6: Descriptive Statistics for Male and Female Subsamples...............................................69
Table 7: Descriptive Statistics for Fashion Innovator and Fashion Follower Subsamples..........71
Table 8: Descriptive Statistics for Fashion Innovator and Fashion Follower Subsamples............72
Table 9: Correlations for HBCU and PWI Subsamples.................................................................74

1
CHAPTER I
INTRODUCTION
African American Consumers
Caucasian consumers from the nineteen-eighties fashionably coined the phrase shop till
you drop, but currently, African Americans have taken prideful ownership in the slogan (Good
Looks, Good Food, 2002). American Demographics’ analyzed the 2001 Census and reported the
top priority in the African American household budget is buying clothes to establish and enhance
one’s identity (Good Looks, Good Food, 2002). Earlier, Kochman (1981) found clothing and
adornment practices were used by African Americans to be the most “powerful statement” about
their identity. African American households devote more than the average amount of their
income on children’s clothing; African American men spend more than any other cultural group
on clothing; and African American families spend 47% more than average on personal care
products (Good Looks, Good Food, 2002). The University of Georgia’s Selig Center for
Economic Growth (2002) projected the African American buying power of 2009 to be the
highest of all minorities, topping at $965 billion dollars.
Yankelovich Partners and the Consumer Expenditure Survey show that retailers who do
not target the African American consumer market may be missing a significant opportunity
(Fisher, 1996). Many companies revealed that they don’t invest heavily in African Americans
due to their low median household incomes of $29,645 in 2003 which is well below U.S. median
$43,318 (Cleveland, 2003), but African American consumers are willing to spend large amounts
of their income on clothing to enhance their image or identity (Fisher, 1996).

2
African American households spend more than average on hosiery, women’s accessories,
and jewelry (Fisher, 1996). Sara Lee Hosiery found that African American women buy more
hosiery and the better quality lines of hosiery than other consumers. Sara Lee Hosiery’s research
found “Black women are less likely to wear casual clothes for work, and overall they have fewer
casual days, or bare-leg occasions” (Fisher, 1996, p.55). Consumer Expenditure Survey verified
Sara Lee Hosiery’s assertion by reporting those African American households who did spend
money on hosiery, spent 13% more than the average household in 1994 (Fisher, 1996).
African American professionals are not the only market that needs to be tapped. College
students represent a consumer market primed to shop. With 16.5 million enrolled college
students, 78% are employed. The third annual Alloy College Explorer Study showed female
college students are spending 75% more on apparel items than males. African American men and
women spend more than Caucasians, averaging $46 per month where others consumed $31 per
month (Seckler, 2005). Retailers should cater to African American female consumer tastes
because they spend much more than Caucasian men and women on clothing and personal care
items. African American purchasing power, personal income, and social mobility are
consistently on the rise (Macguire, 1998), and retailers are losing money not advertising to this
high-spending market.
African American Professionals
Retailers are persistently ignoring the millions of middle-class and upper-class African
American households that have discretionary money to spend (Fisher, 1996). Women’s Wear
Daily reports the verbal frustrations of African American professionals who are familiar with
“difficult, inconvenient shopping experiences” (Lee, 2005, p.10). An analysis of the U.S. Census
2000 data found thirty percent of African American households have achieved middle to upper

3
income status (Frey, 2003). It was also noted that African American households that fall in the
$25,000 to $74,000 bracket represent 44.6 % of the population which is more than those that fall
below $25,000 (42.9%) (Good Looks, Good Food, 2002).
Most retailers and marketing campaigns have neglected the preferences of African
American professionals. Women’s Wear Daily reported in August 2005 that African American
middle aged, middle class women have sophisticated clothing tastes and the money to back it up,
but not enough retailers fulfill their fashion needs. The sudden increase of urban fashion brands
like Baby Phat, Rocawear, Enyce, Fubu and Sean John get the attention of the younger fashion-
forward females, but these fashions do not lure in the African American professional niche
market. African American women are attracted to brands and will invest in work apparel ranging
from traditional to updated suits, shoes, and accessories. African American females desire
“diverse skirt lengths, double breasted jackets, bolder print patterns, and a greater color variety
outside the basic black, navy, brown or gray” (Lee, 2005, p.10). “The women said they and
many of their contemporaries have been largely ignored by the fashion industry and retailers,
which have never fully addressed their needs for fit, wider size ranges or preference for dressier,
more put together looks” (Lee, 2005, p.10). Mass marketers including Sears Roebuck & Co. and
Macy’s have attempted to reach African American consumers through celebrating Black History
Month and adding more African American designers, but consumers are still left wanting apparel
designed with their preferences in mind. It is clear that retailers in the African American and in
the Caucasian communities do not have products or services to address this demographic’s needs
and wants (Lee, 2005).

4
African Americans and Racism
African Americans did not begin their history in America with equal rights as did
Caucasian Americans. For several centuries the African American people were oppressed by the
slave trade, colonization, segregation, and racism. These advanced strategies to weaken the race
mentally and emotionally have had huge political and economic implications for the African
American race and culture (Allen, 2001; White and White, 1998).
When the first ship packed with dying and beaten slaves arrived in America, so too did
the supremacist notion that God the creator damned all people of black color. The Western
world accepted the inaccurate interpretation of the Christian Bible that “Noah’s curse of Ham”
was a curse that transformed Ham and his descendants into the African race, and which claimed
all persons with black skin should remain in slavery indefinitely (Felder, 2005). This ignorant
bigotry left no room for equality, justice, or humane treatment for persons of color for years to
come.
Despite Caucasians’ attempts to manipulate African Americans’ perceptions of the world
and their self image, African Americans survived with a thriving culture rich with colorful
aesthetics, divergent from the popular Caucasian culture today. W.E.B. DuBois, a noted African
American scholar, sociologist, author, and civil rights leader, became prominent with his
writings on the African American tension filled “double consciousness.” DuBois (1898, 2005)
explained
this sense of always looking at one’s self through the eyes of others, of measuring
one’s soul by the tape of a world that looks on in amused contempt and pity. One
ever feels his two-ness and American, a Negro two souls, two thoughts, two
unreconciled strivings, two warring ideals in one dark body, whose dogged

5
strength alone keeps it from being torn asunder. The history of the American
Negro is the history of this strife this longing to attain self conscious manhood, to
merge his double self into a better and true self” (p.16-17).
W.E.B. DuBois (1898, 2005) explained the internal conflict between desiring African
American self and the self of Caucasian American society. DuBois focused on the psychological
realities of oppression and how the African American culture triumphed. His assumption was
groundbreaking to the Caucasian assumption that African Americans have and had no culture of
their own. His writings also suggested that despite the constant attack of the African American
identity, the culture remains a shelter for developing a sense of identity and for enhancing
positive self-esteem (DuBois, 1898, 2005).
What DuBois (1898, 2005) described as two selves under tension fighting for dominance
could be similar to what African American students experience in predominantly white
institutions (PWI) if they choose to cross racial boundaries to compare themselves to the
majority Caucasian group. African American college students functioning on a predominantly
white campus often feel they must battle negative stereotypes of African Americans by hiding
their true personalities under an identity they want to present to Caucasians (Guiffrida, 2003).
Guiffrida (2003) termed “code switching” as when African American students develop two
opposing persons: one reserved for Caucasians, and their true self only for meetings with fellow
African Americans. Present day code switching mirrors DuBois (1898, 2005) stressors of the
African American double consciousness. It is debated whether code switching or double
consciousness maintains assimilation or conflict (Holt, 1995; Lewis, 1993; Sundquist, 1993;
Allen, 2001).

6
African Americans in the Workplace
History maintains that African Americans have been beaten and stressed by racial
discrimination, and as a result they have experienced large gaps in economic and educational
successes (Allen, 2001; Marbley, 2003). Even today, racial discrimination and unfair practices
have a common place in most professional work settings. African American professionals do not
only have to combat open racism in the workplace, but also hidden aversive racism (Thomas,
2005). Aversive racism is subtle prejudice in organizational settings where Caucasian
employees view themselves as non-prejudice, but who have actually digested racist stereotypes
of African Americans and overtly hold negative feelings towards their African American peers
(Dovidio & Gaertner, 1999). Relational demography is a type of hidden racism that negatively
affects hiring and promotion decisions affecting African American professionals (Thomas,
2005). Past research reports that African American professionals are aware of the hidden racism
and combat its negative influence on their job success by dressing conservatively and
professionally (McLeod, 1999; Russell & Reynolds 1992; Schneider, 1998).
Past and present research show there is much racism against African American men and
women in the workplace. In the 1990s Caucasian women held 40 % of middle management
positions in the United States, compared to black women representing 5 % of middle
management positions, and African American males hold even less (Hemmons, 1996).
Hemmons (1996) also provided reasons for the inadequate representation of African American
females in executive administrative and managerial positions representing 7.2% in 1996. He
maintained that African American females earn less due to inadequate job mentors that do not
promote “white male job-ladder progress” for African American co-workers (p.80). Historically,

7
when African American females acquire a suitable mentor, the relationship is often brief and
insincere (Hemmons, 1996; Thomas, 2005).
Hemmons (1996) determined that Caucasian males’ median income was three times
greater than African American females’ income. The earning-gaps for African American men
are tremendous. Dortch (1994) affirmed, Black men working full time, twenty-five years and
older who held jobs in executive, administrative, and managerial positions, had mean earnings of
81% of that of Caucasian men in similar positions ($34,200 compared to $42,400) (Dortch,
1994). Under the same circumstances, African American female professionals earn about the
same as Caucasian female professionals figuring a median of $27,500. African American
women face the most injustice; they must combat earning-gaps based on race and gender.
Hacker (1995) reported that as education raises so do earnings of African Americans; in
particular, the women. African American women with Masters Degrees make relatively $70
more than African American men with the same education (Hacker, 1995).
Dortch (1994) reported in American Demographics, that the reason African Americans of
the same education level earned less than their Caucasian peers in white-collar jobs is for two
reasons: African Americans work in industries that pay lower wages like government and
education (Hacker, 1995; Hemmons, 1996), and “Companies do not want them” (Dortch, 1994,
p.19). Currently, African American working females have more median years of education than
African American men (Lynn & Mau, 2002). National reports show African American career
women represent a larger proportion of the female professional community, and African
American women represent a larger proportion of the African American labor force (Marbley,
2003). Although African American women have surpassed African American men in education
8
and professional employment, more men are in prestige careers (Doctors, Lawyers, and College
Professors).
The U.S. Census Bureau reports that having black skin means less income for employees
(Dortch, 1994; Ryan, 2005). Ryan (2005) reported African Americans earned less than
Caucasians at every education level including college graduates, and even if education level was
equal there would still be a 71% earning gap. Dortch (1994) found African American women
earned more than African American men in comparison to Caucasians of the same gender, and
that African American women typically earn more than Caucasian women. The projection for
the 21st century did not look much better. Thomas (2005) reported in the Occupational Outlook
Quarterly that African Americans will represent a mere 12% of the labor force by 2012;
compared to Caucasian employment of 80 percent.
African Americans and Professional Dress
It is common knowledge that society depends on appearances to communicate how others
should perceive the wearer’s personality, style, and status (Roach-Higgins & Eicher, 1992). This
has been proven in the workplace (Damhorst, 1984,1985; Forsythe, Drake & Cox, 1984; Lennon
& Miller, 1984). Clothing choices and other adornment practices reflect ways individuals take
part in inventing and mirroring the dominant culture (Franklin, 2001). Society and corporate
America do not encourage women to create a unique look for themselves. Women are expected
to consume what is considered appropriate by dominant culture whether or not they are members
in that group (Franklin, 2001; Watkins, 1996). Watkins (1996) emphasized as women learn to
compete successfully in the male dominated work force, they soon realize that men and fellow
female co-workers consider appearance as the most important display of authority. Watkins
(1996) also alleged that mass media is the most suitable medium for spreading respectable,
9
authoritative professional dress for females. In addition, Ebony magazine identified the top
female managers in the workplace as fashion templates for appropriate workplace attire (Power-
dressing For Professionals, 2005). Watkins (1996) ignored any reference to African American
females or other minority groups in her study. She critically analyzed major periodicals for
appropriate hair, clothes, figure, facial expression, and age for the most appropriate appearance
of powerful women in the workplace. The study’s findings represent traditionally Caucasian
traits and culture as the most suitable and professional look for females in the workforce. Where
does this leave African American female professionals?
Franklin (2001) declared “it can be a challenge for Black women in the west to assemble
a look that makes them feel as beautiful, intelligent and capable as they are without some
reference to their identity as Black women” (p.139). She claimed that African American women
frequently scrutinize what they wear to predominantly White settings in order not to draw
attention to their cultural heritage. Franklin defended her remark by affirming that African
American women in the workplace dress conservatively to keep their jobs, not to “look white.”
Franklin’s assertion mirrors Guiffrida (2003) idea of code switching, and DuBois (1898, 2005)
double consciousness by nurturing two opposing personas, one reserved for Caucasians and the
other for fellow African Americans. Deciding which aesthetics of clothing to wear for work is a
double edge sword for African Americans. African Americans take the risk of being acquainted
with the “desire to be White” stereotype, or getting accused of an even more disliked or
professionally inappropriate image (Franklin, 2001). It is argued that the idea of two opposing
identities causes internal tension (Allen, 2001; Lewis, 1993; Sundquist, 1993).
Proshansky and Newton (1968) argued that African Americans who dislike their own
racial culture are communicating aversion for themselves. The study alleged when African

10
Americans live in a Caucasian supremacist country, they are oppressed with disapproving
feelings about themselves. However, evidence has been collected which empirically suggests
that personal identity and group identification may be separated (Cross, 1991; Jackson,
McCullough, Gurin, and Broman, 1981).
Traditionally ethnic hairstyles can be a sensitive spot in the work environment. Afros,
braids in African inspired styles, and dreadlocks are considered taboo by the non-Black work
force. These styles are translated by individuals outside the culture as “too ethnic, too angry-
looking, too butch to avoid censure….” (Franklin, 2001, p.146). Franklin (2001) argued that
African American employees may avoid wearing opposing aesthetic hairstyles out of fear of
exposing racism in predominantly white work environments. Franklin also noted that Caucasian
co-workers may be ignorant to their racist remarks about African American hair. There are
many differences in African American and Caucasian American culture, but one element
remains the same regardless of race; all persons use appearance to communicate who they are as
individuals, their personality, and their status.
Purpose
The purpose of this research was to obtain information regarding African American male
and female college students’ perception of female professional dress. Specifically, the research
identified if African American females incorporated fashion-oriented garments into the standard
definition of traditional professional dress. In addition, this research sought to determine self-
esteem differences or similarities in African American students enrolled in two Predominantly
White Institutions (PWI) and two Historically Black Colleges and Universities (HBCU), and to
determine if self-esteem influences fashion innovativeness.

11
Objectives
The main objectives of this study were:
1. To understand African American college students’ perceptions of female professional
dress.
2. To compare a sample of African American college students’ opinions of professional
dress.
3. To examine the relationship between self-esteem and fashion innovativeness on a sample
of African American college students.
Hypotheses
The following hypotheses were tested:
Ho1: There will not be a significant difference in their perceptions of female professional
dress between African American college students enrolled in Predominantly White Institutions
(PWI) and Historically Black Colleges and Universities (HBCU).
Ho2: There will not be a significant difference in perceptions of female professional dress
between Louisiana and Mississippi African American college students.
H3: There will be a significant difference between African American male and female
perceptions of female professional dress.
Ho4: There will not be a significant difference in their level of self-esteem between
African American college students enrolled in PWI and HBCU.
H5: There will be a significant difference in their level of self-esteem and fashion
behavioral variables between fashion innovators and fashion followers.
H6: There will be a significant difference in their perception of female professional dress
between fashion innovators and fashion followers.

12
Significance of Study
This study will provide retailers, manufacturers, and academia with African American
college students’ perceptions of female professional dress identified through the review of
literature and verified through an analytical survey. This will reduce the possibility of
stereotypes and racial biases between African Americans’ beliefs and outsiders’ judgments of
African American beliefs. Also, this study will add to the body of knowledge in African
American self-esteem differences in PWI and HBCU, and African Americans’ degree of
innovativeness in clothing for the professional workplace. Understanding the clothing habits
reported by African American consumers will allow retailers and manufacturers to better market
merchandise to the Black professional niche market.
Conceptual Definitions
1862 Land Grant Institutions are defined as institutions that have been designated by their state
legislature or Congress to receive the benefits of the Morrill Act of 1862 which supplied federal
land to each state to teach agriculture, military tactics, and the mechanic arts in addition to the
classical studies, so that members of the working class could obtain a practical education
(National Association of State Universities and Land Grant Colleges, 1999).
1890 Land Grant Institutions are defined as institutions predominantly in the South that had
been designated by their state legislature or Congress to receive the benefits of the Morrill Act of
1890 which supplied federal land to each state for segregated black institutions to teach
agriculture, military tactics, and the mechanic arts so that African American members of the
working class could obtain a practical education (National Association of State Universities and
Land Grant Colleges, 1999).

13
Aesthetics is defined as the study of human responses through creating, perceiving,
comprehending, and being influenced by art (O’Neal, 1994).
Fashion Adoption Cycle is defined as classifications of the members in a social group on the
basis of their innovativeness (Rogers, 1983). These include: Fashion Innovators, Fashion
Opinion Leaders (early adopters), Mass Market Consumers (early majority), Late Fashion
Followers (late majority), and Fashion Laggards (Cholachatpinyo, Padgett, Crocker, & Fletcher,
2002; Rogers, 1983).
Dress is defined as body modifications and supplements to the body (Roach-Higgins & Eicher,
1992).
Business Casual is defined as workplace dress that maintains individual professionalism, but
with causal fabric choices such as cotton, linen, corduroy, rayon, and denim; in addition to more
variety in color and cut. Athletic wear and high fashion garments are not elements of business
casual (Ball State University Career Center, 2003). Business Casual dress is often appropriate
for an on-site interview or the second interview and consists of matching separates (Louisiana
State University Career Services, 2006).
Fashion-oriented professional dress is defined as: workplace clothing with very low cut
necklines, skirts several inches above the knee, Capri pants, busy texture or bold stripes or prints,
matching leather jacket and pants, embroidery that highly contrasts with the base fabric, high
contrast trim on pant legs or pant legs with slits, and skirts with slip up to mid-thigh (Damhorst,
Jondle, & Youngberg, 2002).
HBCU (Historically Black Colleges and Universities) are defined as institutions established
prior to 1964 whose principal mission is the education of black Americans. HBCU must be

14
accredited by a nationally recognized accrediting agency or association determined by the
Secretary of Education (Eagan McAllister Associates, 2005).
Fashion Innovativeness is defined as the degree to which an individual is relatively earlier in
adopting new adornment practices than other members of the same social group (Rogers, 1983).
Perception is defined as the process by which individuals organize and interpret their sensory
impressions in order to give meaning to their environment (Robbins, 2005).
PWI (Predominantly White Institutions) are defined as institutions where Caucasian students
and faculty are the majority, and African American students (and other cultural backgrounds) are
the minority (Guiffrida, 2003).
Self –esteem is defined as the individual’s sense of his or her worth, or the extent to which a
person values, approves of, appreciates, prizes, or likes him or herself (Blascovich and Tomaka,
1991).
Traditional professional dress is defined as the traditional conservative interview attire for
business and other highly professional fields. Traditional professional dress is a suit classic and
conservative in style, consisting of matching jacket and pants and/or skirt with neutral button up
shirt. Suits should be fabricated in a solid neutral color. Black or brown closed toe shoes with a
slight heel are appropriate (Louisiana State University Career Services, 2006; Southern
University and A&M College Career Services, 2005; Mississippi State University Career Center,
2005).
Operational Definitions
1862 Land Grant Institutions used in this study are Mississippi State University and Louisiana
State University, and will be called PWI (predominantly white institutions). The two 1862 Land
Grant Institutions will be used in this study to identify if African Americans attending these

15
schools refer outside their cultural group for standards of professional dress, and identify what
these African American students perceive as professional dress.
PWI (predominantly white institutions) in this study will be Mississippi State University in
Starkville, Mississippi, and Louisiana State University in Baton Rouge, Louisiana.
1890 Land Grant Institutions used in this study are Alcorn State University and Southern
University Systems and A&M College, and will be defined as HBCU (Historically Black
Colleges and Universities). The two 1890 Land Grant Institutions will be used in this study to
determine what the African American students perceive as professional dress.
HBCU (Historically Black Colleges and Universities) in this study are defined as Alcorn State
University in Alcorn State, Mississippi, and Southern University Systems and A&M College in
Baton Rouge, Louisiana.
Aesthetics of dress in this study is defined as an individual’s response to dress or dressing,
influenced by their culture’s perception of beauty and art.
Dress in this study is defined as a word that is used in place of clothing, appearance, adornment,
cosmetics, hair style, and costume in terms of professionalism.
Traditional professional dress in this study is defined as any body supplements (clothing) and
body modifications (hair style) that are appropriate and respectable for a professional workplace
setting as described by professional literature and research. Perceptions of Traditional
professional dress will be determined using an adaptation of Franz and Norton’s (2004) study
that classified individual female garments found in the workplace as Business Professional,
Fashion-Oriented Dress, Business Casual Dress, or Casual Dress.
Fashion-oriented professional dress in this study is defined as informal business professional
dress that ignores conservative rules of professionalism and replaces the traditional suit with

16
more color and fashionable fabrics. Perceptions of Fashion-oriented professional dress will be
determined using an adaptation of Franz and Norton’s (2004) study that classified individual
female garments found in the workplace as Business Professional, Fashion-Oriented Dress,
Business Casual Dress, or Casual Dress.
Business Casual in this study is defined as workplace clothing that maintains a professional
appearance while wearing comfortable fabrics, brighter colors, and more stylish fabrics.
Perceptions of Business Casual Dress will be determined using an adaptation of Franz and
Norton’s (2004) study that classified individual female garments found in the workplace as
Business Professional, Fashion-Oriented Dress, Business Casual Dress, or Casual Dress.
Causal Dress in this study is defined as inappropriate workplace clothing that maintains a
informal and relaxed appearance. Perceptions of Casual Dress will be determined using an
adaptation of Franz and Norton’s (2004) study that classified individual female garments found
in the workplace as Business Professional, Fashion-Oriented Dress, Business Casual Dress, or
Casual Dress.
Perception in this study is defined as the belief that individuals from different cultures look at
garments found in the workplace and perceive their appropriateness differently.
Fashion Adoption Cycle in this study is defined as the rate African American consumers adopt
new fashions. This study is solely interested in testing for Fashion Innovators and Fashion
Followers.
Fashion Followers in this study are defined by the degree to which individuals in a group are the
last to adopt new adornment practices. Fashion followers will be separated from fashion
innovators using an adaptation of Kwon and Workman’s (1996) study using eight questions
addressing fashion leadership and five questions addressing the importance of clothing. Fashion
17
followers have a low degree of innovativeness and represent the majority of consumers. This
study will use a four point Likert-type scale, ranging from “strongly agree” to “strongly
disagree.”
Fashion Innovators in this study are defined by the degree to which individuals in a group are
the first to adopt new adornment practices. Fashion leaders will be separated from later adopters
using an adaptation of Kwon and Workman’s (1996) study using eight questions addressing
fashion leadership and five questions addressing the importance of clothing. Fashion Innovators
have a high degree of innovativeness, and represent the minority of consumers. This study will
use a four point Likert-type scale, ranging from “strongly agree” to “strongly disagree.”
Self-esteem in this study will assess African American self-esteem using Rosenberg’s Self-
Esteem Scale (1989) in a 4-point Likert-type scale, ranging from one of strongly agree to four
indicating strongly disagree.
18
CHAPTER 2
REVIEW OF LITERATURE
Clothing is worn daily, used to get ahead, used as a way of expressing individuality or
conformity, and used for enhancing self-esteem. Because clothing is worn for symbolic reasons;
dress is used to define identity (Kwon & Workman, 1996; Feinberg, Mataro & Burroughs, 1992).
Yet, before assuming the perceptions or identity of African American college students based on
the results of the survey, it is necessary to review other findings and explanations for an African
American aesthetic of dress.
African American Aesthetics of Dress
Aesthetics are commonly defined as the study of human responses through creating,
perceiving, comprehending, and being influenced by art (Child, 1968; O’Neal, 1994;).
Aesthetics are often thought to be the sum of one particular group’s desires or values (Kaiser,
1990). Cultural norms do transform, but the ingrained values and structure remain constant and
are passed down through generations (McCracken, 1988). It is consistent in the African
American culture to embellish the aesthetics of dress, because it is not what is worn, but how it is
worn and with what attitude (Kaiser, Rabine, Hall & Ketchum, 2004). Style, like aesthetics,
influences every facet of life. Style is a norm accepted by a culture to express an attitude or
appearance (Kochman, 1981). Semmes (1992) declared that African Americans establish “style”
at the foundation of their culture “…artfully embellishing movement, speech, and
appearance….One must inject beauty, heightened emotion or feeling, and idiosyncratic
expression into a product or action” (p.131). Kochman (1981) noted that style (cultural
19
aesthetics) does not remain invisible; rather it is a constant form that nourishes admiration,
imitation and resentment. As mentioned, clothing and adornment practices are employed by
African Americans to be the most “powerful statement” about their identity (Kochman, 1981;
Semmes, 1992; Kaiser, et al., 2004). Research does not mention the same for other cultural
groups. If this assertion is correct, then one might expect to find differences in Caucasian and
African American aesthetic judgments of professional dress.
Too often, society insists on ignoring cultural differences, Caucasians create a cultural
system, and they automatically assume African Americans are operating with identical speech
and cultural conventions (Kochman, 1981). During the 20th century is was accepted by a few in
the Caucasian society that African Americans have no culture, and “The Negro is only an
American and nothing else…he has no values and culture to guard and protect” (Glazer &
Moynihan, 1963, p.53). Yet, for decades, scholars have proved the existence of and the
flourishing of African traditions in the aesthetics of dress in African American culture (Nobles,
1980; Semmes, 1992).
African Americans and Caucasians alike both recognize that the preference for loud
colors and large expressive patterns is an African American stereotype (O’Neal, 1994; Thomas,
2005). Conflicting studies have both refuted and maintained the stereotype of African
Americans preferring loud “high affect” colors. Kaiser (1990) stressed that African American
females do not favor flashier outfits, but opposing studies argued that African Americans females
fancy brighter hues and bold colors (Lee, 2005; Hood, 1993; White and White, 1998; Williams,
Arbaugh, & Rucker, 1980) and that blue and red were favorable colors (Liebman, 1987). O’Neal
(1994) argued that even when African American educated professionals prefer “high affect”
colors, they must hide or quiet their preferences to appropriately assimilate into a dominate

20
corporate culture. It has been argued that loud flamboyant hues imply lower social and
economic classes (O’Neal, 1994; White & White, 1998).
In the early 1990s, retailers began to understand that African American females’
preferences of dress differed greatly from Caucasian females. J.C. Penny created an exclusive
African American catalog about the same time Spiegel and Ebony magazine developed E-Style, a
catalog for African American women (O’Neal, 1994). E-Style’s spokeswoman maintained that
African American females desired a wide assortment of colors like bold yellows, oranges, gold,
fuchsia, and purple to complement their skin, and that they desired garments with large scale
patterns to reflect their African heritage (Hood, 1993).
Identity through Dress
Literature has proved clothing to be the determining factor for initial judgments in others.
Dress has been used as a means to indicate social status and personality (Behling, 1995;
Feinberg, Mataro, & Burroughs, 1992; Kwon, 1994; Molloy, 1975, 1996). Others perceived
appropriateness and attractiveness of clothing to affect perceptions of competence (Kwon, 1994),
managerial abilities (Forsythe, 1988), intelligence and expected scholastic achievement (Behling,
1995).
Beginning in the 1960s, research has suggested that African Americans spend more on
clothing than Caucasians at comparable income levels (Alexis, 1962), African American women
place a greater emphasis on fashion than Caucasian women (Portis, 1966), and that African
American females perceive themselves as more fashion conscious and innovative than Caucasian
women (Bauer, Cunningham, & Wortzel, 1965). The answer given for African Americans’
focus on fashion is that they have been politically and economically prevented in spending
freely, and dress is the major mechanism for achieving status (Goldsmith, Stith, & White, 1987;

21
Portis, 1966). Goldsmith, Stith & White (1987) surveyed a small sample of African American
and Caucasian college students and middle class professionals on their fashion innovativeness.
Goldsmith, et al. (1987) reported, “Although…barriers still exist, more recent developments such
as anti-discrimination laws, affirmative action programs, educational opportunity, and
occupational mobility have broadened the options of many Blacks so that fashion clothing may
have become less important” (p.412). However, McLeod (1999), Russell and Reynolds (1992),
and Schneider (1998) interviewed African Americans who reported an extra burden of dressing
professionally in order to combat racism in the workplace. Goldsmith et al. (1987) compared
African Americans and Caucasians on age, income, and education to discover that middle class
African Americans were no more innovative or fashion conscious than middle class Caucasians.
Kwon (1994) studied male and female perceptions of the role of clothing in enhancing
ten occupational attributes: responsibility, competence, knowledgeability, professionalism,
honesty, reliability, intelligence, trustworthiness, willingness to work hard, and efficiency.
Perceptions were based on two dress modes (properly dressed and improperly dressed), subjects’
self perceptions of their own attributes, and subjects’ clothing interests. One hundred and thirty-
two males found proper clothing generally enhanced self perception of occupational attributes,
and 190 females did not believe many attributes could be enhanced by clothing. The study found
a significant difference in all 10 occupational attributes between both modes of dress for the
sample. What does this mean for African Americans attempting to fit into a corporate
environment through dress? Are African American women hampering their chances of success
and upward mobility because they devalue the importance of professional clothing on one’s
perceived work ethic?
22
African American Self-Esteem
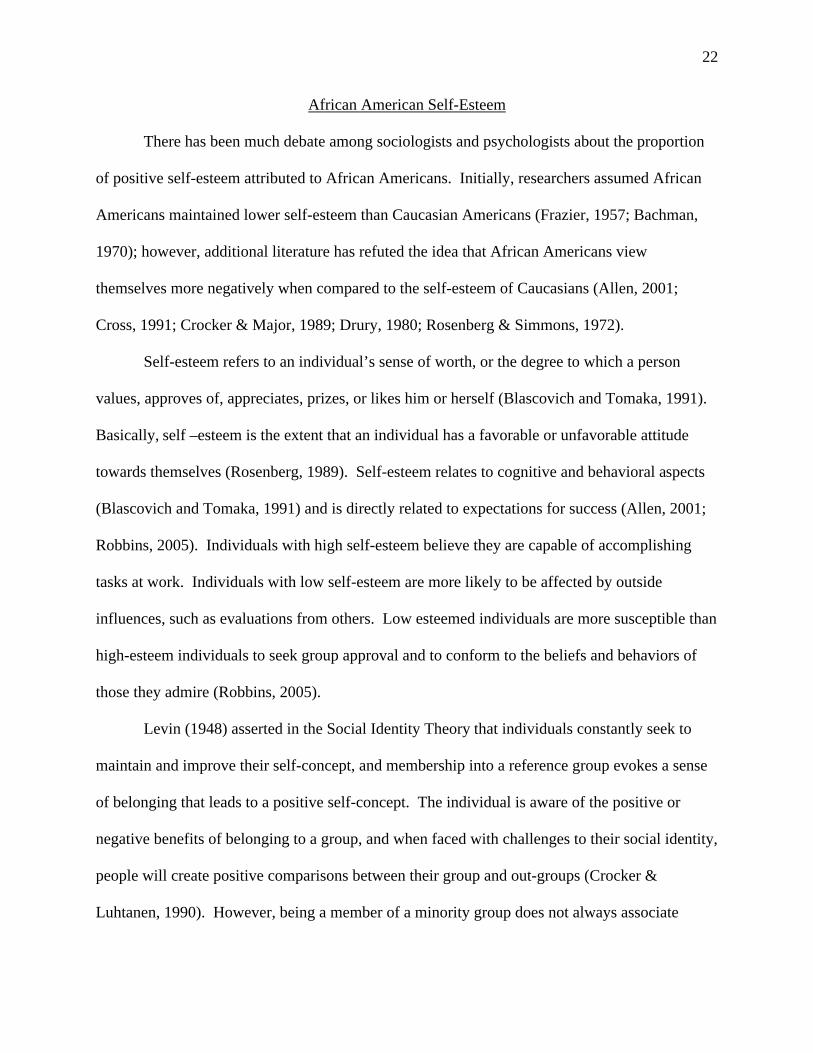
There has been much debate among sociologists and psychologists about the proportion
of positive self-esteem attributed to African Americans. Initially, researchers assumed African
Americans maintained lower self-esteem than Caucasian Americans (Frazier, 1957; Bachman,
1970); however, additional literature has refuted the idea that African Americans view
themselves more negatively when compared to the self-esteem of Caucasians (Allen, 2001;
Cross, 1991; Crocker & Major, 1989; Drury, 1980; Rosenberg & Simmons, 1972).
Self-esteem refers to an individual’s sense of worth, or the degree to which a person
values, approves of, appreciates, prizes, or likes him or herself (Blascovich and Tomaka, 1991).
Basically, self –esteem is the extent that an individual has a favorable or unfavorable attitude
towards themselves (Rosenberg, 1989). Self-esteem relates to cognitive and behavioral aspects
(Blascovich and Tomaka, 1991) and is directly related to expectations for success (Allen, 2001;
Robbins, 2005). Individuals with high self-esteem believe they are capable of accomplishing
tasks at work. Individuals with low self-esteem are more likely to be affected by outside
influences, such as evaluations from others. Low esteemed individuals are more susceptible than
high-esteem individuals to seek group approval and to conform to the beliefs and behaviors of
those they admire (Robbins, 2005).
Levin (1948) asserted in the Social Identity Theory that individuals constantly seek to
maintain and improve their self-concept, and membership into a reference group evokes a sense
of belonging that leads to a positive self-concept. The individual is aware of the positive or
negative benefits of belonging to a group, and when faced with challenges to their social identity,
people will create positive comparisons between their group and out-groups (Crocker &
Luhtanen, 1990). However, being a member of a minority group does not always associate

23
positive identity with group membership (Phinney, 1990). If the dominant group holding
societal power looks down on the minority group with prejudice, there is a chance for members
of a minority group to posses a negative identity (Allen, 2001). Allen (2001) believed this was
the situation for African Americans until recently. A major problem of social identity theory is
an individual existing in two membership groups where one overpowers the other causing
confusion of identity (Allen, 2001; DuBois, 1868, 2005; Phinney, 1990). In recent years studies
show personal identity and group identification can be separated (Cross, 1991; Jackson et al.,
1981).
Traditionally, it was believed that segregation caused severe harm to the self-esteem of
African Americans (Ausubel, 1958). However, increasing evidence suggests segregated African
Americans demonstrate significantly higher self-esteem than their desegregated African
American cohorts (Allen, 2001; Bachman, 1970; Drury 1980; Porter & Washington, 1993).
Bachman (1970) surveyed tenth grade males in segregated and desegregated schools and found
those educated in desegregated institutions scored higher in self-esteem evaluations. Two years
later, Rosenberg & Simmons (1972) surveyed urban high schools to discover that African
American students do not have lower self-esteem levels than their Caucasian counterparts.
Nearly a decade later Drury (1980) conducted a quantitative analysis of 194 southern high
schools to study the self-esteem of young African Americans. He discovered African
American’s mean self-esteem was significantly higher for African Americans than for Caucasian
when school mean achievement was controlled. In addition, self-esteem of African American
students in racially balanced schools was lower than their Caucasian counterparts, but
surprisingly higher in predominantly White schools. Drury suggested this was because
minorities are inclined to stick together when outnumbered by the dominant culture.

24
Caucasians have a privileged status in U.S. society and they perceive their identity as the
“norm” to which outside groups in society are measured (Martin, Krizek, Nakayama, &
Bradford, 1999). Theoretically, Caucasians are unaware of their color or believe it to be
invisible, and Caucasians do not comprehend the profound effect their race has on their daily
lives and livelihoods (Lipsitz, 1998; Martin, Krizek, Nakayama, & Bradford, 1999; Thomas,
2005).
Powell & Fuller (1970) propositioned the idea of Caucasian (conscious or subconscious)
resistance to integration and racial discrimination to be a possible answer to the lower esteem
levels in African American students in interracial environments. They attributed the movement
in African American Nationalism as a factor for lifting African American self-esteem. Since the
1960s Black Pride and Black is Beautiful has been successfully marketed throughout the African
American population (Kaiser, et al., 2004; Walker, 2001).
While the resurgence of Black Nationalism may be true, there are many arguments that
contradict Powell and Fuller’s assumption. Rosenberg & Simmons (1972) investigated how
discrimination in desegregated schools associated with African American self-esteem. They
found the relationship between racial context and African American self evaluations to be poorly
represented. Also, Porter & Washington (1993), and Allen (2001) declared that African
Americans as a whole compare themselves with their African American peers instead of cross-
racial comparisons.
Tinto (1993) maintained that many African American students who transfer or dropout of
desegregated universities do so because of a lack of fit between the students’ perception of
norms, values, and ideas, and those perceptions of the dominant group of an institution. If the
values are similar, then the students will become academically and socially integrated into the
25
college (Tinto, 1993; Guiffrida, 2003). African American students are at a disadvantage when
attempting to academically and socially integrate in PWI due to diverging norms and values with
the Caucasian majority (Guiffrida, 2003; Padilla, Trevino, Gonzalez, and Trivno 1997; Tinto,
1993).
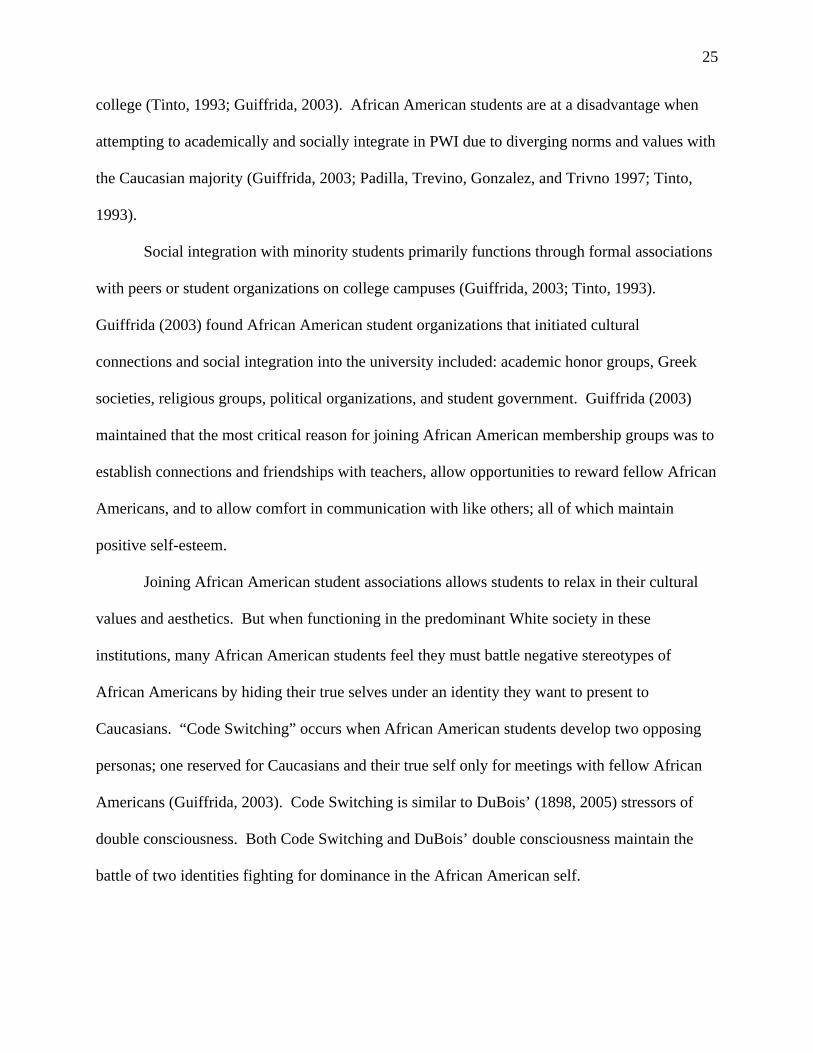
Social integration with minority students primarily functions through formal associations
with peers or student organizations on college campuses (Guiffrida, 2003; Tinto, 1993).
Guiffrida (2003) found African American student organizations that initiated cultural
connections and social integration into the university included: academic honor groups, Greek
societies, religious groups, political organizations, and student government. Guiffrida (2003)
maintained that the most critical reason for joining African American membership groups was to
establish connections and friendships with teachers, allow opportunities to reward fellow African
Americans, and to allow comfort in communication with like others; all of which maintain
positive self-esteem.
Joining African American student associations allows students to relax in their cultural
values and aesthetics. But when functioning in the predominant White society in these
institutions, many African American students feel they must battle negative stereotypes of
African Americans by hiding their true selves under an identity they want to present to
Caucasians. “Code Switching” occurs when African American students develop two opposing
personas; one reserved for Caucasians and their true self only for meetings with fellow African
Americans (Guiffrida, 2003). Code Switching is similar to DuBois’ (1898, 2005) stressors of
double consciousness. Both Code Switching and DuBois’ double consciousness maintain the
battle of two identities fighting for dominance in the African American self.

26
Dress is the predominant form of Code Switching. One male subject from Guiffrida’s
study suggests having to compromise his dress while at school “I sort of took a different route.
Instead of getting rid of the boots, I hide them. I’ll get baggy jeans but not too baggy. I dress…a
little bit preppy with the hip-hop thing. I just make sure I don’t go too far” (Guiffrida, 2003,
p.311). Other male students stated when at home they dress in loose pants and shirts, lugs and
do-rags, but when in class on predominantly White campuses they adorn their bodies differently
to steer clear of the gangster stereotype (Guiffrida, 2003). Code Switching can become stressful
and eventually cause confusion of identity and lower self-esteem (Guiffrida, 2003).
Guiffrida (2003) noted it is possible for African American students to socially integrate in
PWI without joining African American student organizations. Those African Americans from
predominantly White high schools and neighborhoods find social integration easy. These
students have previously learned to function in the Caucasian educational system and consider
the Caucasian students their peers. However, Guiffrida (2003) noted these as exceptions.
The present research referred to Rudd and Lennon’s (1994) assumption that African
American women may not rely on the dominant cultural aesthetic standard of the United States,
but one of an in-group standard. Rudd and Lennon’s (1994) model explains individual response
to the ideal appearance based on cultural aesthetics. The model’s assumptions are that all
cultures have a primary appearance that is internalized as the aesthetic standard people use to
adorn their bodies and to compare that created appearance. Self-esteem is enhanced when others
evaluate the individual’s appearance as socially ideal. Positive evaluations lead to positive social
and personal identity. When self or others’ evaluations deviate from the accepted aesthetic
appearance, the individual is motivated to alter his or her appearance to more closely mirror the
aesthetic ideal.

27
Perception and Culture
Shibutani (1968) mentioned that perception is selective and the experience is reliant on
what is expected and what is taken for granted. Individuals with dissimilar outlooks label similar
contexts differently. Shibutani’s affirmation was supported by Warren, Orbe, & Greer-Williams
(2003) study which analyzed the differences in the perception of male and female Latinos,
African Americans, and European Americans. The study presented the subjects with a movie
clip of a black male and white female in an argument, and then asked them to respond to the
reason for the conflict. The study showed that African American females, most African
American men and Latinos perceived race as a continual issue of conflict, while European
American females primarily perceived the conflict in terms of gender, and European American
males could not see race or gender as an issue in the conflict. Understanding both Shibutani’s
theory and Warren et al. case study, could persons with different cultural backgrounds perceive
professional dress differently?
Culture allows individuals in a particular group to perceive from a similar lens. Culture
is defined in many ways, but African American Studies sociologist, Abdul Alkalimat, defines
culture as the “sum of values and behavioral preferences that make up a person’s lifestyle and
approach to the activities of everyday life” (Swindel, 1993, p. 176). Swindel (1993) explains
that the root of culture lies in the everyday activities “such as talking and communicating,
childrearing, cooking, dressing and recreation” (p. 176). This notion reinforces the idea that
African Americans and their culture are different from traditional Anglo American culture.
African American culture nurtures a separate way of thinking and developing, which inspires a
separate set of experiences (Cross, 1991; Kaiser, et al., 2004; Kochman, 1981; Lee, 2005). Thus,
if fashion reflects life’s journey and experiences, and African American experiences are

28
different; then the aesthetic principles of dress too would be dissimilar (Myeres, 1993; Schneider
A., 1999; Swindel, 1993).
Shibutani (1968) stated culture is not stagnate, but a continual process or creating and
recreating norms through social interactions. Those taking part in a culture view, others with a
set of expectations, and that prospect strengthens their perspectives. Thus, African Americans
that refer to their culture are constantly sustaining their fellow group members’ perspectives by
responding to the others in a predictable way. When African American college students attend
HBCU, are their perceptions of professional dress reinforced? When African American students
attend PWI and are submerged in a culture unlike their own, is their perspective of professional
dress challenged? Shibutani believed so. He affirmed, after an individual has digested a specific
viewpoint from a reference group, that outlook forms his or her perspective of the world and all
new situations.
Differences in viewpoints develop due to disparities in contact and affiliation. Shibutani
(1968) maintained that the preservation of social distance due to segregation, tensions, and
divergent education forms dissimilar cultures. Individuals in dissimilar cultural groups have
their own culture due to isolated interactions in order to preserve their way of life and separate
themselves from outsiders (Shibutani, 1968). Swindel (2001) stated, “Culture determines
whether or not the group survives, and if it survives, to a great extent, it determines the
survivor’s quality of life” (p. 22).
Shibutani (1968) found in an integrated society, where every individual absorbs several
perspectives there must be some internal disagreement of viewpoints. Most people are members
of several reference groups and shift from one social world to the next (Hyman & Singer, 1968;
Shibutani, 1968. Porter and Washington (1979) maintain African Americans refer to

29
Caucasians for comparisons of economic and social status, but refer to African Americans for
personal issues. “For most African Americans, it is the African American community that
provides them with a frame of reference, and thus their sense of self-esteem or worth” (Allen,
2001, p.70).
Understanding how perspectives change as one moves up in social classes could be one
explanation for the transition of fashionable professional dress to conservative professional dress
as individuals climb the corporate ladder. As employees assimilate into the culture of the
workplace, they slowly change their outlook for a more conservative perspective (Johnson,
Crutsinger, & Workman, 1994; Kimle & Damhorst, 1997; Molloy, 1996; Russell & Reynolds,
1992; Solomon & Douglas, 1987). Solomon and Douglas (1987) suggested that individuals
will adopt new forms of dress to help simulate in to new roles. Other research makes it clear that
if an employee does not dress the part, then they will be denied opportunities (McLeod, 1999;
Schneider, 1998; Russell & Reynolds, 1992; Johnson & Roach-Higgins, 1987; Lennon et al.,
1999; Workman & Johnson, 1989).
In conclusion, perception is selective, and the experience is reliant on what is expected
and what is taken for granted. Individuals with dissimilar outlooks or dissimilar culture label
similar contexts differently. Hence, perception of appropriate dress for the workplace is relative
to an individual’s culture.
Adoption Cycle
Fashion retailing is extremely competitive, and the success of each brand depends heavily
on effective management strategies. These strategies are based on providing the right products at
the right time, to the right target consumer. “Different types of fashion consumers have to be
matched with styles of commodities” (Cholachatpinyo, Padgett, Crocker, & Fletcher, 2002, p.

30
24). As mentioned before, African American consumers desire different products, fit, and
fashions than the general Caucasian American (Holloman, 1997; Kaiser, Rabine, Hall, &
Ketchum, 2004; Lee, 2005; O’Neal, 1994; 1998). Market research is crucial for manufacturers’
and retailers’ marketing departments wishing to target the African American professional niche
market by aiding them in identifying and understanding the African American fashion cycle as
applied to professional attire (Goldsmith, Flynn, and Moore, 1996; Cholachatpinyo, Padgett,
Crocker, & Fletcher, 2002).
E. M. Rogers is considered the founding father of the adoption process and consumer
innovativeness. Rogers (1983) established that consumers have different rates or cycles of
adoption of a particular product or idea. Classification into the fashion adoption cycle is based
on consumers’ approval of a specific style during a length of time. The classification is
graphically represented by the bell curve (Rogers, 1983). The curve indicates length of diffusion
time, speed rate, and acceptance level of that fashion cycle. Adopter categories include:
Innovators representing 2.5% of the population which, Rogers (1983) describes their purchasing
decisions as venturesome; Early Adopters represent 13.5% of the population with their
purchasing decisions characterized by respect; Early Majority maintains 34% of consumers
characterized by making deliberate purchasing decisions; Late Majority also represents 34% of
the population, but purchasing decisions are usually skeptical; and Laggards maintaining 16% of
consumers which make purchase selections based on efficient cost or pressure to fit in.
Marketing functions are based on stages or correlations of behaviors of consumers for
adopting new fashions. As mentioned, the fashion adoption cycle includes: Fashion Innovators,
Fashion Opinion Leaders (early adopters), Mass Market Consumers (early majority), Late
Fashion Followers (late majority), and Fashion Laggards (Cholachatpinyo, Padgett, Crocker, &

31
Fletcher, 2002; Rogers, 1983). The fashion adoption cycle correlates with retailers’ marketing
strategies. Commercial introduction and high fashion promotion targets the Fashion Innovators;
rising retail inventories and local promotion focuses on the Fashion Opinion Leaders; mass
merchandising attracts Mass Market Consumers; and lastly, clearance and obsolescence
marketing strategies target Late Fashion Followers and Fashion Laggards (Cholachatpinyo,
Padgett, Crocker, & Fletcher, 2002). It is in retailers’ best interests to identify the fashion
innovators in each reference group in order to capture the group’s purchasing power.
Studies show that fashion innovators and fashion followers’ patterns for deciding to
change to a new fashion are extremely different. Cholachatpinyo et al. surveyed 40 subjects, 20
being from innovators and 20 from followers. Fashion followers’ decision making process
began with “the need to be up to date;” however, fashion innovators began their process with
“the need to feel different.” Fashion innovators are described as overly confident in their
standpoints, styles, and preferences. Cholachatpinyo et al. (2002) and Baugarten (1975) found
fashion leaders felt uncomfortable when adorned in similar fashions as their surrounding peers,
and that unpleasant feeling inspired them to replace the established fashion with a more
whimsical fashion. Contrarily, fashion followers are influenced by their reference groups and
media, and represent the largest group of consumers (Studak & Workman, 2004).
Self concept, are the perceptions and attitudes individuals have of themselves that are
learned through interactions with the external environment (Goldsmith et al., 1996; Solomon,
1994). Goldsmith et al. was the first to distinguish between fashion laggards and fashion
adopters, while other research focused on demographics, psychographics, and personality
variables. Also, Goldsmith el al. found that fashion leaders expressed an exclusive self-concept
that was described as “more excitable, indulgent, contemporary, formal, colorful, and vain than

32
followers” (p.242). Studies show that different types of clothing mirror an individual’s self
concept (Goldsmith el al., 1996; Kaiser, 1990).
Gender, when put into the fashion adoption mix, causes many complications. Kaiser
(1997) found that women during childhood were socialized to enjoy and discern fashionable
styles, where men were taught to be uninterested in shopping and up-to-date fashions. In
addition, research found females to be more innovative, to be more fashion conscious, and to
spend more on new fashions than their male counterparts (Goldsmith, Stith, and White, 1987).
Female fashion leaders embodied positive attitudes toward risk and change and use more sources
of fashion information than non-leaders (Chowdhary and Dickey, 1988). Goldsmith, Stith &
White (1987) attributed African American and Caucasian women of the same age with spending
more income on new fashions, were more innovative, and more conscious of fashions than men.
However, Kwon and Workman (1996) found there was no significant difference between males
and females on the importance of clothing. This finding represents both males and females
“using clothing to get ahead, key to the good life, as a way of expressing individuality and self
concept” (Kwon and Workman, 1996, p. 254).
Fashion innovators do exactly what their name suggests; they are the first members in a
reference group to learn about and to dress in a new fashion when it emerges in the market
(Goldsmith, Flynn, and Moore, 1996; Cholachatpinyo et al., 2002; Rogers, 1983). “Identifying
and understanding fashion leaders helps manufactures market new clothing styles more
effectively” (Goldsmith et al., 1996, p. 242). These leaders of fashion are imperative for
retailers. They promote new fashion items to fashion followers who look to them for guidance
about new adornment practices, and leaders provide profit to retailers for costly new items that
are deemed fashion forward (Kaiser, 1990; Goldsmith, et al., 1996). Understanding what

33
motivates fashion leaders to the purchase will advance both marketers and consumer researchers
in targeting the professional African American niche market.
Professional Dress
Throughout history, dress has defined an individual’s role. Police officers wear law
enforcement uniforms, farmers traditionally wear over-alls, surgeons wear hospital scrubs, and
priests wear robes. Research confirms, if one looks the part through corresponding dress,
observers will assume that he or she is deserving of that role or identity the individual claims
(Damhorst, 1990; Franz and Norton, 2001; Rafaeli, Dutton, Harquail, and Mackie-Lewis, 1997).
Likewise, research shows dress can be a factor for perceiving the attributes of an individual’s
occupation (Kwon, 1994; Johnson, Schofield, Yurchisin, 2002). Research also has revealed the
connection between clothing and the individual’s self perception (Franz and Norton, 2001), in
that, clothing affects the way people view themselves. Other research shows dress expresses an
individual’s characteristics and emotions (Kwon, 1994; Miller, 1997; Pratt and Rafaeli, 1997).
Dress is the vehicle to identity (Damhorst, 1984-1985; Eicher, 1995). Dress
communicates without speaking words. Dress defines what roles we will play that day.
Currently, work dress is the most worn garments in the wardrobe and most of a career person’s
income goes toward business clothing (Miller, 1999). Miller (1999) declared most adults spend
forty to sixty hours at work and additional hours are spent commuting and preparing for work.
Professional dress manages an employee’s work identity (Kimle & Damhorst, 1997), but lately
dressing for work is not as clear of a routine. During the late 1980s, corporate dress was
bombarded with a more relaxed look and feel; consequently blurring the lines of appropriate or
standard professional dress.

34
Casual Fridays quietly slipped into the traditional workweek causing conflict in the
traditional company dress code. Miller (1999) explained that casual dress’ emergence into the
corporate world was due to the overwhelming occurrence of downsizing in companies. Upper
management wanted to give employees an incentive for hard-work, hoping to boost morale
among anxious employees (Miller, 1999).
Some companies ignored the style as just a fad while others embraced a full week of
causal dress (Miller, 1999). Due to incongruent feelings across the corporate dimension, old
company rules were challenged, and individuals openly violated strict-traditional policies
(Kaiser, Nagasawa, and Hutton, 1991). Snyder (2004) declared that the professional look was
merging its way back into the corporate dress code of companies in order to gain advantage over
their competitors. To ensure the best impression possible, industries have begun “out-dressing”
the competition due to lack of jobs and intense competition (Snyder, 2004).
Dress codes can sometimes be formally written in employee manuals, but most often
there are informal codes of dress that are assumed and rarely discussed (Miller, 1999; Power-
dressing for Professionals, 2005). Employers assume that employees will observe what upper
management is wearing and reflect those adornment practices in their own dress (Samson, 2005;
Power-dressing for Professionals, 2005; Miller, 1999). Without a written dress code, individuals
determine for themselves what they perceive as appropriate types of clothing for various work
places. It is common for perceptions of proper or improper dress for each job to differ from
person to person (Kwon, 1994). Schneider (1973) determined the implicit personality theory,
which suggests that persons possess individual mental constructs of proper dress for each job
setting, and when employees perceive themselves as dressed properly, they believe that they
embody responsibility, competency and other attributes.

35
Russell & Reynold (1992) spoke specifically to African American professionals, and
explained if an employee’s image does not mirror the protocol dress of the employer, it
negatively affects the employee, the superiors and the company. They wanted African
Americans to understand that incongruent appearance between employees and their employer
could limit their career opportunities. Male and female African American managers face many
racial barriers toward upward mobility, and appearance should not be one of those barriers
(Russell & Reynolds, 1992; Johnson-Elie, 2004). In addition, Molloy (1996) believed women
must dress professionally in every situation regardless of casual dress codes. He recommended
conservative colors and avoidance of sexy clothing.
Determining the degree of professionalism in an employer’s everyday attire can often
present great challenges for employees. Causal dress falls between the traditional business suit
and active sportswear, causing employees to become confused on what is appropriate clothing.
Research reported men to be more perplexed over appropriate attire for causal work days than
female employees (Miller, 1999). In addition, Rafaeli et al. (1997) found women have abundant
skills in negotiating dress in the workplace.
Ebony magazine stressed to their readers that everyday the employee should be polished
and office-friendly. Power-dressing For Professionals (2005) contended there were two types of
business attire: business professional and informal business professional. Informal business
professional, which is similar to fashion-oriented professional dress, allows for more color and
fashionable fabrics in the traditional suit. The article identifies casual and chic as the other
options for dress in the workplace and advises females to steer clear of “sandals, disco boots,
jungle prints, leather miniskirts, tattered blue jeans” (Power-dressing For Professionals, 2005,
p.90), and other party clothes. The article strictly advises black females to wear business

36
professional for job interviews and their description of interview clothing resembles that of
clothing presented on college career websites.
Three of the career center websites from the four Land Grant Institutions chosen for this
study dedicate several pages of instructions for professional dress for job interviews (LSU Career
Services, 2006; MSU Career Center, 2005; Southern University Systems and A&M College
Career Services, 2005). University Career Centers are quick to remind students that it only takes
twelve to fifteen seconds for a first impression to form, and that one’s dress should not be a
detracting factor (Ball State University Career Center, 2003). All of the college websites give
specific guidelines for choosing a professional interview suit for women.
Women are directed to purchase a conservative, classic style skirt suit fabricated of
lightweight fabric (Southern University Systems and A&M College Career Services, 2005).
Career counselors advocate neutral colors such as navy, dark gray, black, or camel. The skirt
should be no shorter than two inches above the knee (LSU Career Services, 2006), though
human resource hiring managers maintain the most inappropriate suits are those that have skirt
lengths several inches above the knee (Damhorst, Jondle, & Youngberg, 2002). Ironically,
Mississippi State University’s Career Center suggests pantsuits are acceptable for interview
attire, but Southern University’s Career Services, Louisiana State University’s Career Services,
and Damhorst et al. (2002) adamantly oppose wearing pants to a professional interview. A solid
light colored blouse is preferred, and a low neck line is prohibited (Damhorst el al., 2002;
Mississippi State University Career Center, 2005; Southern University Systems and A&M
College Career Services, 2005; Louisiana State University Career Services, 2006). Shoes should
be pumps with medium heel in black or other dark colors, and hosiery is a must (Southern
University Systems and A&M College Career Services, 2005). LSU Career Services (2005) is

37
the only college to detail no backless or toeless shoe. All Career Centers strictly forbid flashy or
fashionable jewelry and accessories. The sites stressed to students that employers should
remember their message, not their appearance.
John Molloy (1975), the author of Dress For Success, stressed that upward mobility at
work depends on intelligence and ability, but even more important, on how one dresses. Molloy
(1975) devoted 245 pages to professional dress advice on how clothes can make a man succeed
and become more likeable at work. Molloy stressed that men should always dress in
conservative colors, patterns, and combinations of cloth. He believed that familiar conservative
dress initiates acceptance, not contempt. In addition, Molloy and Bixler (1997) believed more
than any other garment in the professional dress genre, the business jacket produces the most
professional look (Bixler, 1997).
More recently, Molloy (1996) has written a book suggesting what is appropriate for
women to wear in the workplace. He stressed the importance of wearing a jacket over any outfit
to increase authority. The business jacket has been declared the hallmark of American
businesswomen, serving the same functions for women as they do for men (Molloy, 1996).
According to Molloy’s survey, 93 percent of business men and 94 percent of business women
assumed that females adorn in jackets outranked those without jackets. Molloy (1996) believed
that women’s dress choices have greater consequences in terms of upward mobility and respect
than they do for men. Molloy believed corporate casual dress has negatively impacted the
female workforce.
Adornment practices have a larger influence than physical attractiveness on hiring
decisions (Johnson and Roach-Higgins, 1987). Yet, it was Kwon (1994) who was the first to
examine the types of occupational attributes enhanced by proper or appropriate dress in a work
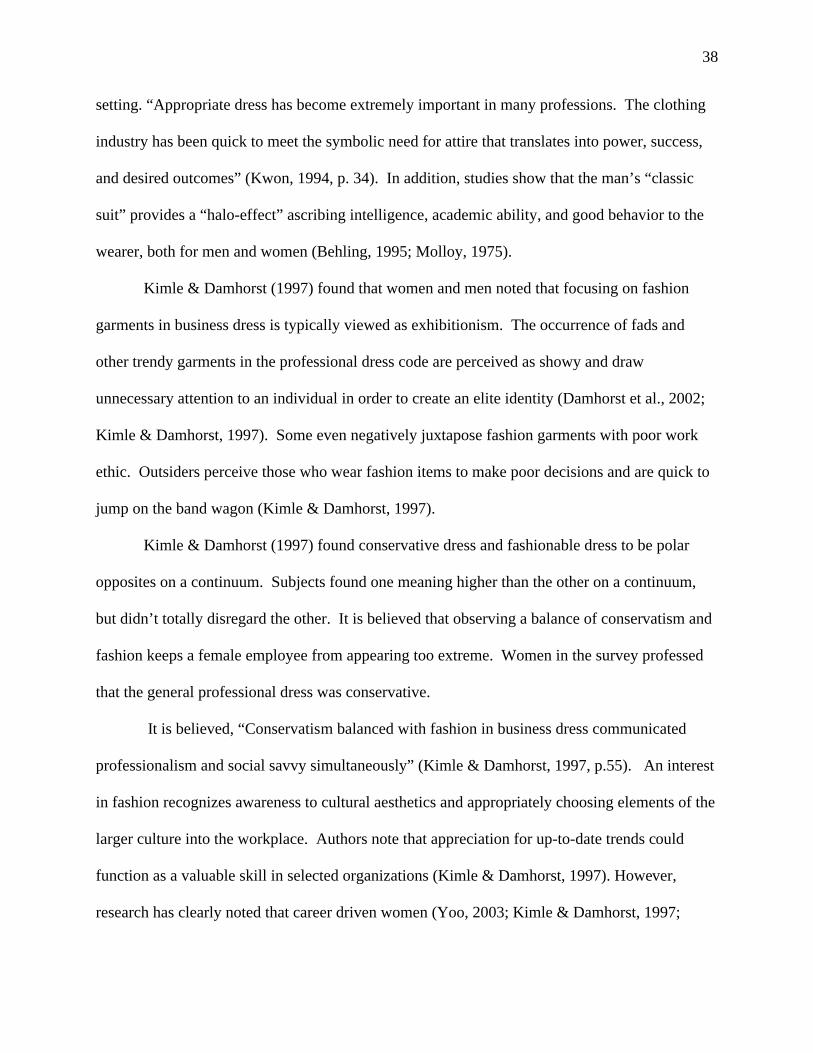
38
setting. “Appropriate dress has become extremely important in many professions. The clothing
industry has been quick to meet the symbolic need for attire that translates into power, success,
and desired outcomes” (Kwon, 1994, p. 34). In addition, studies show that the man’s “classic
suit” provides a “halo-effect” ascribing intelligence, academic ability, and good behavior to the
wearer, both for men and women (Behling, 1995; Molloy, 1975).
Kimle & Damhorst (1997) found that women and men noted that focusing on fashion
garments in business dress is typically viewed as exhibitionism. The occurrence of fads and
other trendy garments in the professional dress code are perceived as showy and draw
unnecessary attention to an individual in order to create an elite identity (Damhorst et al., 2002;
Kimle & Damhorst, 1997). Some even negatively juxtapose fashion garments with poor work
ethic. Outsiders perceive those who wear fashion items to make poor decisions and are quick to
jump on the band wagon (Kimle & Damhorst, 1997).
Kimle & Damhorst (1997) found conservative dress and fashionable dress to be polar
opposites on a continuum. Subjects found one meaning higher than the other on a continuum,
but didn’t totally disregard the other. It is believed that observing a balance of conservatism and
fashion keeps a female employee from appearing too extreme. Women in the survey professed
that the general professional dress was conservative.
It is believed, “Conservatism balanced with fashion in business dress communicated
professionalism and social savvy simultaneously” (Kimle & Damhorst, 1997, p.55). An interest
in fashion recognizes awareness to cultural aesthetics and appropriately choosing elements of the
larger culture into the workplace. Authors note that appreciation for up-to-date trends could
function as a valuable skill in selected organizations (Kimle & Damhorst, 1997). However,
research has clearly noted that career driven women (Yoo, 2003; Kimle & Damhorst, 1997;

39
Johnson & Roach-Higgins, 1987; Workman & Johnson, 1989) and African American
professionals (Schneider, 1998; McLeod, 1999) place a greater importance on appropriateness of
professional garments than do “just-a-job” employees.
Though academia has conducted numerous studies on appropriate dress for the
workplace, industry has conducted their own research. Gardyn and Fetto (2002) reported the
“American Industry Dress Code Survey,” which was a national poll of 201 senior executives at
corporations that take in over $500 million in annual sales. They discovered that 56% of those
businesses surved followed a strict dress code policy including a suit and tie, and or dress. The
New York based, Men’s Apparel Alliance revealed in 2001 senior executives’ perceptions of
employees who dress professional versus those that dress corporate causal. These included: 70%
believed professional business attire projects a better image, 60% believed suits to command
more respect, 46% expressed that individuals appear more organized when wearing corporate
dress, and 22% of senior executives stated individuals are more likely to get promoted when
adorned in professional business attire (Gardyn & Fetto, 2002). Damhorst, Jondle, & Youngberg
(2002) affirmed the American Industry Dress Code Survey, by noting from 1991 to 2001 there
was a return to conservative interview dress that did not leave room for the fashionable or
feminine aesthetic code.
Dressing Women in the Workplace
In 1970 the U.S. Department of Commerce verified that women held 16.7% of
management and administrative roles, but by 2001 women maintained 46% of the executive,
administrative, and managerial roles. Although women are gaining representation and power in
lower level management positions, females are still disproportional in representation in higher
management positions (Kimle & Damhorst, 1997; Thomas, 2005). Many professional women

40
are aware of this fact and do not allow lack of professionalism in dress to be a factor (Kimble &
Damhorst, 1997; Schneider, 1998; Thomas, 2005). Due to the disproportionate level of respect
and authority provided to women at work, Molloy (1996) stressed that a suit jacket should be
worn everyday with professional work attire.
Since the 1970s, there has been a rise in females in higher education causing an increase
of women in traditional male dominated professions (Clarke & Weismantle, 2003; Cleveland,
2003). Image consultants and clothing researchers past and present have recommended working
females to dress for success by fashioning their bodies in a professional skirt suit (Franz and
Norton, 2001; Power-dressing For Professionals, 2005; Rafaeli, Dutton, Harquail, and Mackie-
Lewis, 1997; Yoo, 2003). However, in the 1990s the push for business causal became the
dominant policy while the professional suit took a short rest (Kate, 1998; Kimble & Dahmorst,
1997; Miller, 1999). U.S. companies found it too hard to manage the relaxed corporate dress,
inspiring the current rebirth of a conservative dress code.
Beginning in the 1980s, researchers began to suggest female professionals adopt a more
unified business appearance like that of the men’s business suit. To symbolize success,
researchers suggested a uniform comprised of a matching skirt and jacket with a quiet blouse
(Cash, 1985; Forsythe, Drake, & Cox, 1984; Johnson & Roach-Higgins, 1987).
Extensive research has been conducted on perceptions of female dress in upper
management positions. Molloy (1996) found when females dress casually, their authority,
professionalism, and competence can be challenged. Favorable opinions about a person are
influenced by positive appearance (Molloy, 1975; Molloy, 1996; Johnson & Roach-Higgins,
1987). In addition, Bixler (1997) found professional interview appearance influences a higher
starting salary and career advancement. Damhorst, Jondle, & Youngberg (2002) emphasized

41
that some young female professionals flaunted their sexual attractiveness through their business
dress, and they attribute some of their success to their provocative dress, despite hiring managers
insisting that sexy and fashionable dress are not acceptable for interviews or the workplace
(Molloy, 1996; Damhorst et al., 2002).
Research has examined how the dress of an applicant affects the interviewer’s perception
of his or her characteristics (Damhorst & Reed, 1986; Johnson and Roach-Higgins, 1987;
Lennon & Miller, 1984-85) and the perception of the applicant’s competencies (Forsythe, 1988;
Thurston, Lennon, and Clayton, 1990). Collectively, studies showed that whether a woman will
advance through the corporate ladder and succeed is determined by observer’s perceptions of the
female’s adherence to the traditional professional dress code.
Some studies found traditionally feminine garments, when integrated into professional
dress, negatively influence others’ perceptions of women’s credibility and equality to men
(Faludi, 1991). Molloy (1996) suggested that working women should purchase their clothing in
a traditional men’s store that has a women’s professional dress section. Following the push for
masculine appearance in professional dress, the question was proposed if women could appear
too masculine, thus hurting their professional appearance and chances for promotion.
Johnson, Crutsinger, & Workman (1994) found that accessories such as women wearing
a scarf around the neck was perceived more likely to possess managerial skills than when
wearing an open collared shirt, but these adornment practices must follow traditional gender
roles. Neckties fashioned like those of men were reported as masculine symbols, violating
expectations of feminine appearance, thus hurting chances for promotion (Johnson el al., 1994).
Similarly, Kimle & Damhorst (1997) discovered female subjects believed women should not
appear too masculine in business dress for fear of gender norm violation. Women in the study

42
viewed extremely masculine dress as a devaluation to femininity and gender, thus causing
resentment from female co-workers. There is a fine line for women to discern between
masculinity and femininity, but Damhorst et al. (2002) established findings on the appropriate
business dress for women. The ideal interview suit was classic tailoring like that of a man’s suit,
but allowed pants and skirts.
Some researchers suggest that women have a greater variety of professional clothing to
choose from than do men. One study found female business wear selections include a wide
range of silhouettes, patterns, textures, and colors (Kimle & Damhorst, 1997). Kaiser (1990),
and Solomon & Douglas (1985) both believed that for the past two hundred years societies have
toyed in and around women’s fashions, creating whimsical colors, fabrics, and styles. Kimle &
Damhorst (1997) entertained the idea that if women are welcoming a variety of business dress,
then their assigned meanings would become unclear. However, the higher the position, the more
conservative and traditional a woman’s suit should look (Kimle & Damhorst, 1997; Yoo, 2003;
Johnson & Roach-Higgins, 1987; Workman & Johnson, 1989).
Damhorst et al. study conducted from 1991 to 2002, found that personnel interviewers
upheld the same standards for appropriate female professional interview dress. The ideal
interview suit was classic tailoring like that of a man’s suit and was equally represented by pants
and skirts. In their study, 69 male and female human resource managers, recruiters, and
employment interviewers deemed the following qualities problematic dress for interviews: “1)
deeper neckline exposure or shirt left open at the neck with collar casually rumpled to expose a
narrow view of the neck and upper chest; 2) three quarter length sleeves; 3) high contrast trim,
large buttons, or unusual collars that brought too much visual interest to the outfit; (4) open toe

43
shoes or sandals; (5) a one piece “coat” dress; (6) a knee length jacket; and (7) large jewelry,
such as a large pearl necklace” (p.7).
Respondents in the professional field claimed collarless jackets worn buttoned to the
neck, boot-cut pants and A-line skirts to be too trendy in style. Damhorst et al. found that some
colored suits with the appropriate cut are acceptable. Bright red, magenta, and light beige suits
were accepted, but pink or purple suits were not. Conservative plaids or checks were voted
professional, but prints were believed inappropriate. The study found that skirts shorter than the
knee were not approved.
Studies show that males’ view of womens’ professional dress were more critical than
females’ (Damhorst et al., 2002; Kwon, 1994). Females are more eager to approve fashionable
items such as tweed fabrics, A-line skirts, and a variety of collar styling (Damhorst et al., 2002).
However, Molloy (1996) found female superiors to be more critical than men in their judgments
of improperly dressed female employees.
Understanding professional African American consumers’ aesthetic preferences of
professional dress is essential to retailers wishing to target this growing niche market. Not only
is it important to African American consumers, but it is financially rewarding for those retailers
that target this market.
African American Professional Dress
Individuals and groups use clothing to carve out a place in society and to create an
identity. This identity is used to express one’s culture and ideals of the group that authorized it.
An individual’s cultural background or race has been found to affect the individual’s clothing
preferences (Hood, 1993; Yoo, 2003; Lee, 2005). Walker (2006) reported that more products
and services are being promoted for the growing cultural markets because the markets are mostly

44
untapped. Many researchers have explored cultural differences in consumer behavior (Doran,
1994; Fisher, 1993; Miller, 1993), but very few researchers have focused on the African
American population.
Appearance is used as a tool to determine how well an employee can adapt to the
corporate culture and understand the values of the company. Russell and Reynolds (1992)
interviewed an African American vice president of purchasing in a Massachusetts firm who
believed African American managers must invest extra time in their professional appearance and
training because, “Blacks have to prove themselves for admission to the inner circles of
corporate America. Whites have to disprove themselves to be kicked out” (p. 72). Watkins
(1996) confirmed this assertion by proving that an individual’s membership in different groups
can be achieved by manipulating appearance.
Other studies have confirmed appropriate dress for minorities is one key element for
success into the inner circles of the corporate workplace. Schneider (1998) interviewed
academia in the United States and found a vast difference in perceptions of appropriate dress for
the classroom setting. The majority did not agree, but frumpy, causal, or fashionable was the
standard informal dress code for a Caucasian professor. This code was greatly different from
African American professors who maintained the traditional professional dress. Informal dress
codes for companies depict the power of normative influence on an employee’s purchase
selection (Mowen & Minor, 1998). Schneider’s (1998) study of African American professors
used Caucasian professors’ informal dress codes as a comparative reference or as a checkpoint to
ensure their own dress maintained a greater professionalism. The African Americans
interviewed noted that dressing professionally in the workplace is an extra burden for minorities
working in academia. One African American professor noted that dressing in Afrocentric

45
garments or causal dress “makes the other parts of you invisible- your scholarship, your intellect,
your seriousness” (Schneider, 1998, p.14). In addition to the previous studies, McLeod (1999)
also reported African American men working in corporate America declined to dress down even
on company recommended Causal Fridays due to fear of a negative perception from Caucasian
coworkers. McLeod (1999), Schneider (1998), and Russell and Reynolds (1992) maintain
cultural identity holds a more powerful influence over perception in professional dress than does
assimilation into the majority’s casual aesthetic code.
It is a common assumption in diversity management literature that the same rules for
Caucasians do not apply to African Americans in today’s society (McLeod, 1999; Thomas, 2005;
Cleveland, 2003). In addition, McLeod (1999) found “Casual dress may be seen by some
African Americans as a rule or dress code practiced in Caucasian corporate America, but it does
not apply to them” (p.272).
Even though African American professionals spend more of their income on work
clothing (Miller, 1999), it is not clear what African American employees consider appropriate
professional dress. It may seem easy for retailers and manufacturers to cash in on the African
American professional niche market, but have these industries studied the perceptions of these
consumers? Do they understand the wants, needs, and desires of the African American
consumer? Have retailers identified the source of influence for African American perceptions of
dress for the workplace?

46
CHAPTER 3
METHODOLOGY
Sample
The population for this study will consist of African American students attending Land
Grant universities in Mississippi and Louisiana; two 1862 Land Grant colleges (PWI) and two
1890 Land Grant colleges (HBCU). The population for this research was obtained by
researching African American demographic and psychographic statistics in the United States.
The U.S. Census Bureau divides the nation into four Regions and nine Districts for data
reporting purposes. These boundaries are formed to include “areas with comparable social,
economic, and housing characteristics” (Lavin, 1996). The highest percent of the African
American population live in the South region of the United States at 55.3 percent which
represents 19.8 percent of the South’s total population (U.S. Census Bureau, 2000). Because the
South region holds the highest percent of African Americans, its four districts were examined in
greater detail. State Census statistics of districts of West South Central, East South Central, and
South Atlantic were studied to uncover similarities. Percent Black or African Americans of total
state population, and percent minority owned firms were chosen for comparison. Percent
minority owned firms exhibits the high degree of professionalism and integrity that African
Americans bring into the workplace. Louisiana, Arkansas, Mississippi, Alabama, Georgia,
Florida, Tennessee, Kentucky, South Carolina and North Carolina provided parallel figures for
these two criteria. Mississippi and Louisiana had the highest percent Black or African American

47
population (MS 36.3%, LA 32.5%) in the South and in the United States, and had corresponding
percentages for minority owned firms (MS 13.1%, LA 14.1%) (U.S. Census, 2000).
Mississippi and Louisiana were chosen as host states due to similar enrollment of African
Americans attending Land-Grant Universities. Four universities in the two states were selected
based on the historical intentions of the Land-Grant Morrill Acts of 1862 and 1890: two Land-
Grant Universities of 1862 (Louisiana State University, Baton Rouge; and Mississippi State
University, Starkville, MS) and two 1890 Land-Grant Institutions (Southern University and
A&M College of Baton Rouge, LA; and Alcorn State University, Alcorn State, MS).
The Morrill Land-Grant Act of 1862 designated federal land grants and money in
exchange to teach classical studies along with agriculture, military tactics, and the mechanical
arts. This was to insure that any member of the working class, regardless of income could obtain
a liberal, practical education. This was extremely important because higher education was largely
unavailable to many agricultural and industrial workers. Social and legal segregation prohibited
African Americans from attending these schools. As a result in 1890 a second Morrill Act was
passed to prohibit distribution of federal funding to southern states that regarded race as an
admission standard. However, the Morrill Act of 1890 allowed southern states that provided a
separate land-grant institution for African Americans to receive the funds. As a result, the 1890
Land-Grants became African American colleges that were federally funded (NASULGC, 1999).
The method of selection depended on what type of university (PWI or HBCU) the
researcher contacted. To obtain the greatest concentration of African American students at PWI,
the researcher contacted all minority student organizations by emailing or telephoning the
presiding president for the Spring 2006 term. Of the organizations that responded, eight contact
persons agreed to administer the survey to its members and mail the completed surveys back to

48
the researcher within two weeks. At the Historically Black Colleges and Universities the
researcher contacted professors of various subjects through the method of snowball sampling.
Snowball sampling occurs when the first contact person recommends a friend to the researcher
and that friend recommends a friend, and so on. Of the professors that responded from the
HBCU, three agreed to allow the survey to be administered by the researcher in their classes.
The Preliminary Focus Group
After the researcher developed the preliminary survey, a focus group was formulated to
detect any problems or additional questions the research should address. Pre-planned, open-
ended questions were discussed with a panel of seven African American college students (four
undergraduates and three graduates) (see Appendix B). The questions were broadly worded in
order to allow the group members to use their own language to describe their opinions and
experiences. These participants were chosen by convenience, but represented ages 20 through
26, both sexes (four women and three men), and diverse areas of study including: History,
Psychology, Child and Family Development, and Fashion Merchandising. The meeting was
scheduled at a convenient location on campus one month prior to survey distribution. Food was
served and name badges were worn to allow an informal atmosphere. Originally the meeting was
to last forty-five minutes, but because of unexpected enthusiasm from the group, the members
chose to discuss for one hour and 40 minutes. Thirty minutes was devoted to evaluation of the
survey including: selection of suit photographs to include in Section 4, opinions of garments
listed in Section 3 with garment additions, length, wording, and organization (see Appendix A
for Survey).
The group participated in selection of the professional suit photographs by rating 33
photographs the researcher had previously selected from Overstock.com based on past

49
researchers’ descriptions of appropriate suits for corporate interviews (Damhorst et al., 2002).
The group unanimously agreed that the pale color of the headless mannequins did not affect their
opinion of the suits. One female participant went as far to say “I am used to seeing White
mannequins. (laugh). It doesn’t bother me anymore.” Of the 33 suits, the group suggested 10
that were easy to see and that met the descriptions of each category. Of the 10 photographs
selected, the researcher then narrowed the selection to six suits, two absolute appropriate, two
maybe, and two absolute inappropriate.
Focus groups are commonly suggested for the initial method of exploring a theoretical
idea that has not warranted any empirical research (Franz and Norton, 2001). Due to the lack of
empirical research examining African American college students and their views of professional
dress, the first step was a qualitative assessment of African American perceptions of traditional
professional dress and that of non-traditional/ fashion professional dress. This one-time interview
was used to validate the developed survey and create new questions, but not to make
generalizations about the population. The researcher understood that a small group of African
Americans could not possibly represent the entire population’s perception and beliefs. Because
the focus group will not be part of the sample, these students were identified through
convenience.
Grounded theory approach developed by Glaser and Strauss (1968) is conducted by
reading and re-reading a data set or database and discovering variables called categories,
concepts and properties and their relationships. For the present study the researcher observed
behavior, examined personal field notes and questionnaires completed by participants (see
Appendix D), and keenly listened to the recorded tapes over and over until a pattern developed.

50
The open coding identified, named, categorized, and described the important topics
mentioned in the focus group discussion. The initial codes were based on a broad set of
questions and topical areas guiding the discussion, but were expanded to include unexpected
information that could emerge from the focus group (See Appendix B). As suggested by past
research each sentence and topic was sensitively reviewed in search of hidden meanings
(Krueger & Casey, 2000). Possible codes or categories that the researcher speculated to be
uncovered were nouns such as work activities, social behaviors, fashion and topics of race.
Properties of these categories revealed code words such as unique body size, patronizing
marketing campaigns, mentoring, coordinating outfits, personal satisfaction from dress, reference
group, self-esteem, code switching, and fashion leadership. The important topics were then
incorporated into the survey to authenticate the instrument.
Description of Instrument
The researcher received permission from the University of Georgia’s Institutional Review
Board to begin the study November 2005 and received permission to implement the survey
March 2006. The data for this research was collected using a survey questionnaire (see
Appendix A). As previously mentioned, the survey sections were created from past research, in
collaboration with the focus group. The survey contained five sections which related to the
respondent’s self-esteem, overall fashion behavior, perception of professional dress, and
demographic questions (Table 1).

51
Table 1
Survey Description
Variable Questions
Rosenberg Self-Esteem Scale Section 1 (10 questions)
Importance of Clothing Section 2.1 (8 questions)
Fashion Innovativeness Section 2.2 (5 questions)
Traditional Professional Dress or Section 3.1 (44 garments)
Fashion Oriented Dress
Business Casual Dress or Section 3.2 (46 garments)
Casual Dress
Professional Interview Dress Section 4 (6 pictures)
Demographic Information Section 5 (6 questions)
For the purposes of this empirical study, self-esteem was assessed by a self-report
questionnaire yielding a quantitative result. The first section was used to measure the subject’s
self-esteem level using Rosenberg’s Self-Esteem Scale (1986) (see Appendix A). The validity
and reliability of Rosenberg’s scale used for minority research had been established by previous
research prior to use (Crocker & Luhtanen, 2003; Phiney, Cantu, & Kurtz, 1997; Robins,
Hendin, & Trzesniewski, 2001). Originally, Rosenberg’s scale was developed to measure
children’s global feelings of self-worth. It is now considered the standard for self-esteem
measurement. The 10 item scale is easy for the respondent to read and complete. As suggested
by past literature (Kuhnert, 2005; the University of Maryland, 2005) a four-point response
ranging from one, indicating “strongly agree” to four, indicating “strongly disagree” was used.
The survey asked each subject to assess their own self-esteem using both positively and
negatively worded items; for example: “I feel that I have a number of good qualities” and “I feel
that I do not have much to be proud of.” The negatively worded items 3, 5, 8, 9, & 10 were
reverse scored using SPSS before averaging the total score for each participant. The range of

52
possible scores for the respondents was 10 through 40. The purpose of using a four point system
and omitting the ‘neutral’ fifth answer box is to force respondents to have an opinion on the
subject and to eliminate any researcher bias. Karl Kuhnert, professor of Organizational
Psychology at the University of Georgia believes, “because the neutral answer box allows the
respondent to ignore the survey question, investigators often misinterpret the data to view a more
positive relationship than the sample’s true opinion” (lecture, 2005).
The second section of the survey consisted of Fashion Behavior Measures dealing with
fashion innovativeness and importance of clothing to the individual. This scale was adapted
from Kwon and Workman (1996) with permission. Eight questions addressed fashion
innovativeness and five questions addressed the importance of clothing. As suggested by
psychologist Kuhnert (2005) a 4-point scale ranging from one, indicating “strongly agree” to
four, indicating “strongly disagree” was used. Fashion innovators were separated from fashion
followers based on previous research that established fashion leaders are the minority of
consumers (Goldsmith, Flynn, & Moore, 1996; Solomon, 1994) and only the top 15% of
participant scores should be considered as fashion innovators (Forsythe, Butler, & Kim, 1991;
Goldsmith, Flynn, & Moore, 1996).
Section 3 of the survey is divided into two parts; both evaluating perceptions of
professional dress (see Appendix A). Section 3.1 consisted of 44 specific garments found in
female work attire. For each garment listed, respondents were asked to rate the female garment
on a five-point scale ranging from one, indicating “Business Professional,” three indicating
“Neither,” to five, indicating “Fashion-Oriented.” Section 3.2 consisted of 46 specific garments
found in female work attire. A five-point response ranging from one, indicating “Business
Casual,” three, indicating “Neither” to five, indicating “Casual” was used. This section was

53
adapted from Franz and Norton’s (2004) study which surveyed 95 college students with 82% of
subjects claiming Caucasian ancestry to determine their perception of male and female degree of
professionalism in dress. The survey provided female articles of clothing for male and female
respondents to assess the professional appearance of each garment.
Survey Section four asked the respondents to look at six photographs of female
professional suits found in the workplace (see Appendix A). Respondents were asked to indicate
whether each suit would be appropriate for an interview for a middle management position as an
executive assistant in a law firm or accounting firm. For each suit pictured, respondents were
asked to rate the suit on a five-point scale ranging from one, indicating “Absolute Appropriate
Suit,” three indicating “Maybe Suits,” to five, indicating “Most Inappropriate Suits.” Once
again, male and female respondents were asked to rate female work dress and its degree of
professionalism. This section was adapted from Damhorst et al. which assessed how human
resource managers, recruiters, and employment interviewers viewed women’s job interview
dress. Damhorst et al. used 113 controlled and tested photographs taken from mail order
catalogs to rate the three categories based on appropriateness. This study based its initial
selection of photographs on Damhorst et al. study using their detailed descriptions of
appropriate, maybe, and inappropriate suits. Thirty-three suits were selected from
Overstock.com and presented to the focus group for evaluation. Of the 10 selected, six were
chosen by the researcher to be included in the survey based on previous studies and the focus
group discussion.
Section five of the survey addressed the respondent’s demographic characteristics (see
Appendix A). These included: Age, Sex, Race, Current education level, College major, and for
the respondent to List the student organizations that you hold membership. Participants

54
responded by two methods: by placing a mark beside the category that was most suitable to their
situation or by writing in the answer.
Administration of the Instrument
Specific sampling procedures varied, depending on which type of Land-Grant College
was sampled. The researcher surveyed undergraduate and graduate students of various ages by
using a convenience sample on PWI and the snowball method on HBCU (see Appendix F). The
universities surveyed were Louisiana State University, Southern University, Mississippi State
University, and Alcorn State University. There were no incentives offered to participants of the
survey, however, of the eight contact persons from PWI, two were awarded a one year
subscription to an African American magazine/ journal of their choice. The selection criteria for
the incentive awards were based on the volume of completed and returned surveys to the
researcher.
Louisiana State University had a total enrollment of 28,423 (Spring 2006) with 2,647
students reporting African American ancestry. Accordingly, Mississippi State University
reported enrollment of 14,395 (Fall 2005) with 2,843 African American students. LSU is
considerably larger in enrollment, but ironically relatively equal in African American presence.
The small percentage of African Americans enrolled in LSU could be due to the fact that
Southern University (HBCU) is located within a few miles in the same city. Both HBCU,
Alcorn State University and Southern University have enrollment of approximately 95% of
African American students; ASU enrolled 3,100 in Fall 2004, and SU-BR enrolled 9,438 in Fall
2004.
The subjects for this research were selected by two different methods depending on the
type of Land Grant Institution. The subjects from HBCU were obtained by surveying students
55
during regularly scheduled class times taught by professors that had given the researcher
permission to administer the survey. Because both Alcorn State University and Southern
University have 95 percent African American students, there was no problem surveying entire
classrooms. The researcher spent one day at each university administering the survey to students
(see Appendix F).
The subjects from PWI were obtained by surveying students in African American student
organizations (see Appendix F). Surveying entire classrooms at PWI would not have been
feasible due to the high enrollment of non-African American students per classroom. Due to this
limitation, all African American student organizations and fraternities were contacted by email
or telephone on both MSU and LSU campuses for participation in the study. The researcher
initially intended to attend actual club meetings to survey the members, but time and finances did
not permit. The researcher scheduled a meeting with each contact person at a convenient
location on their campus. The researcher introduced herself, the research topic, and why this
research is important to African Americans. In addition, the surveys were left with a self
stamped envelop for the contact person of each organization to mail back after completion.
During both campus visits, a total of eight appointments were held with contact persons
explaining the research and answering the questions they had about the survey.

56
CHAPTER 4
RESULTS
Of the 311 surveys distributed, 251 were completed and returned resulting in an 80.71%
overall response rate. Biemer and Lyberg (2003) reported several interviewer characteristics that
facilitate high response rates including: gender, interviewer’s voice, accent, positive expectations
and confidence. In addition to the researcher’s characteristics, the high response rate was due to
two different collection methods depending on which university was the host site. HBCU
allowed a higher response rate of 99.12% due to the distribution and collection of the survey by
the researcher, within the same time period. PWI allowed a lower, but still sufficient response
rate of 80.20% due to lag time between the distribution of the surveys to each contact person and
the actual completion of each survey administered by the contact person. Among the returned
surveys, none were discarded, but several surveys were not completed in their entirety.
However, the incomplete surveys were utilized for several of the hypotheses. The results from
the survey are as follows.
Participant Demographics
Table 2 shows a summary of the participants’ demographic characteristics. All of the
respondents were African American. This was assured by the fact that the survey cover-letter
stated “Please note that I am only interested in African American respondents, therefore, other
ethnicities may wish not to participate in this research.” In addition to the written request, the
researcher verbally discussed the instructions to each contact person and survey participants at
HBCU. All of the respondents were college students from four major universities in Mississippi

57
and Louisiana. The survey was distributed and collected in HBCU classrooms and distributed to
student organization presidents during a meeting held on PWI campuses. More than two thirds
of the total respondents (73.3%) were female, and for each individual school all respondents
were more than two thirds female except for Mississippi State University (57.1%). The female
demographic characteristic of Mississippi State University is lower in comparison to the other
universities sampled due to MSU enrolling only 47.59% females (Mississippi State University
Office of Institutional Research, Fall, 2005). Almost all the respondents (81.6%) were between
the ages 18-24, which is representative of the student body at Mississippi State University
(76.35%) (MSU Office of Institutional Research, Fall, 2005) and Southern University (77%)
(Southern University and A&M College Office of Budget and Planning, Spring, 2006). The
current education level varied for the total sample allowing for a greater range of reliable data.
College majors of the respondents varied from university to university.
The high percentages in specific majors at HBCU can be explained due to the fact that
entire classrooms of students were surveyed. At Southern University a marketing course (56.9%
Business Related) and two Fashion Merchandising courses (25.9% Family and Consumer
Science) were surveyed. At Alcorn State University two Nutrition courses (70.9% Health
Related) were surveyed. However, at the PWI surveys were distributed to contact persons who
acted as presidents to minority student organization. Mississippi State University respondents
reported 30.9% Engineer/ Computer majors which can be explained since the student chapter of
the National Society of Black Engineers (NSBE) were surveyed. Minorities in Agriculture,
Resources, and Related Sciences (MARRS) accounted for 18.6% of science majors at MSU.
Kappa Alpha Psi Fraternity and Holmes Cultural Diversity Center were the other two
organizations represented and neither are professional organizations in a specific field of study.
58
Louisiana State University respondents reported a greater diversity of majors due to the fact only
two professional minority student organizations that cater to specific majors were surveyed. The
National Society of Black Engineers (NSBE) accounts for 20.6% of Engineer/ Computer majors
and the National Association of Black Social Workers (NABSW) accounted for 14.7% of Family
and Consumer Science majors. Both MSU 22.9% and LSU 19.1% reported significant
percentages in Business majors. Respondents from ASU 63.6% and SU-BR 63.8% were not
members of student organizations or they chose to skip the question. This is expected due to the
fact entire classrooms were surveyed at both HBCU and not student organizations. However,
respondents 14.3% from MSU and 20.9% from LSU reported not belonging to a minority student
organization. This is problematic because only organizations were asked to participate. It could
be assumed the participant did not want to disclose the information.
Table 3 shows the results for the Cronbach’s alpha coefficients of each survey section for
the overall sample. Reliability coefficient for Section 1, Rosenberg’s self-esteem Scale
(Cronbach’s alpha .83) mirrors that of previous studies with African American samples
(Whiteside-Mansell and Corwyn, 2003). Rosenberg Self-Esteem Scale (Rosenberg, 1965) is the
most widely used scale to measure global self-esteem because it maintains a high internal
consistency across research (Whiteside-Mansell and Corwyn, 2003). The original research of the
Fashion Behavior Scale reported a high level of internal consistency of alpha = .88 for the
overall scale, Fashion Leadership was alpha = .89, and Importance of Clothing was alpha = .76
(Kwon and Workman, 1996). Table 3 shows that the study’s reliability is similar to the original
study that developed the Fashion Behavior Scale. Section 3.1 and 3.2 were adapted from
previous studies (Damhorst, Jondle, & Youngberg, 2002; Franz & Norton, 2001) and no
statistics on reliability
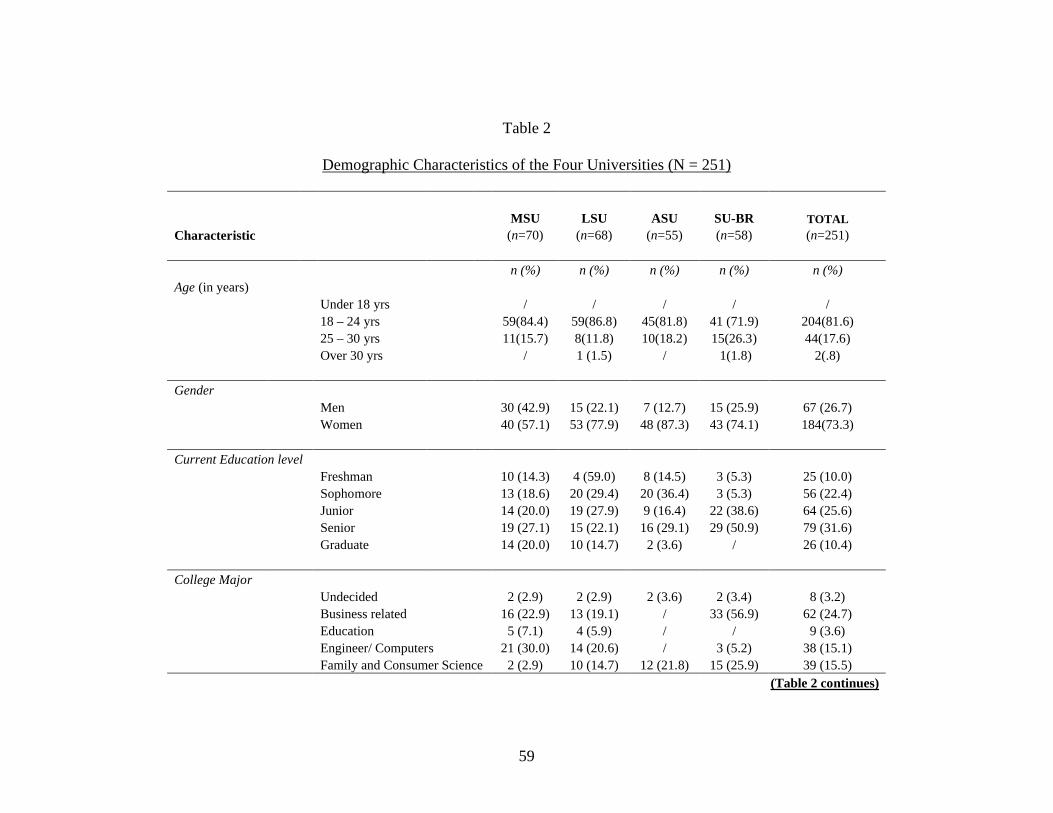
59
Table 2
Demographic Characteristics of the Four Universities (N = 251)
MSU LSU ASU SU-BR TOTAL
Characteristic (n=70) (n=68) (n=55) (n=58) (n=251)
n (%) n (%) n (%) n (%) n (%)Age (in years)
Under 18 yrs / / / / /18 – 24 yrs 59(84.4) 59(86.8) 45(81.8) 41 (71.9) 204(81.6)25 – 30 yrs 11(15.7) 8(11.8) 10(18.2) 15(26.3) 44(17.6)Over 30 yrs / 1 (1.5) / 1(1.8) 2(.8)
GenderMen 30 (42.9) 15 (22.1) 7 (12.7) 15 (25.9) 67 (26.7)Women 40 (57.1) 53 (77.9) 48 (87.3) 43 (74.1) 184(73.3)
Current Education levelFreshman 10 (14.3) 4 (59.0) 8 (14.5) 3 (5.3) 25 (10.0)Sophomore 13 (18.6) 20 (29.4) 20 (36.4) 3 (5.3) 56 (22.4)Junior 14 (20.0) 19 (27.9) 9 (16.4) 22 (38.6) 64 (25.6)Senior 19 (27.1) 15 (22.1) 16 (29.1) 29 (50.9) 79 (31.6)Graduate 14 (20.0) 10 (14.7) 2 (3.6) / 26 (10.4)
College MajorUndecided 2 (2.9) 2 (2.9) 2 (3.6) 2 (3.4) 8 (3.2)Business related 16 (22.9) 13 (19.1) / 33 (56.9) 62 (24.7)Education 5 (7.1) 4 (5.9) / / 9 (3.6)Engineer/ Computers 21 (30.0) 14 (20.6) / 3 (5.2) 38 (15.1)Family and Consumer Science 2 (2.9) 10 (14.7) 12 (21.8) 15 (25.9) 39 (15.5)
(Table 2 continues)

60
(Table 2 continued)
MSU LSU ASU SU-BR TOTAL
Characteristic (n=70) (n=68) (n=55) (n=58) (n=251)
n (%) n (%) n (%) n (%)
Health Related 3 (4.3) 7 (10.3) 39 (70.9) / 49 (19.5)Journalism related 1 (1.4) 3 (4.4) / 2 (3.4) 6 (2.4)Liberal Arts 7 (10.0) 8 (11.8) / 2 (3.4) 17 (6.8)Sciences 13 (18.6) 7 (10.3) 2 (3.6) 1 (1.7) 23 (9.2)
Member of a student organization?Yes 60 (85.7) 53 (79.1) 20 (36.4) 21 (36.2) 154 (61.6)No 10 (14.3) 14 (20.9) 35 (63.6) 37 (63.8) 96 (38.4)

61
were provided for comparison. The original study Section 4 was adapted and therefore, did not
report a measure of reliability.
Table 3
Results of the Cronbach Alpha Test For the Survey Sections
Variable Items Reliability
Section 1 Self-Esteem 10 .83
Section 2.1 Fashion Leadership 8 .90
Section 2.2 Importance of Clothing 5 .73
Section 2.1-2.2 Fashion Behavior 13 .87
Section 3.1 Traditional Professional Dress 44 .77
Section 3.2 Business Casual Dress 46 .73
Section 4 Appropriate Professional Dress 6 .63
Note. N = 251.
Descriptive Findings
The data for the variables of Sections 3.1 Traditional Professional Dress or Fashion-
Oriented Dress, 3.2 Business Casual Dress or Casual Dress, and 4 Appropriate Professional
Dress were condensed by reporting the variables that maintained a significant difference for the
subsamples in question. The subsamples used for comparison within the overall African
American college student sample were a) HBCU and PWI, b) Louisiana and Mississippi, c) men
and women, and d) fashion innovators and fashion followers. Pearson Correlation tests were

62
used to analyze any correlation between self-esteem and any aspect of fashion behavior within
the subsamples. Descriptive statistics were generated using SPSS for each variable and are
found in Tables 2 through 10.
Due to respondents skipping random questions on the survey, the total responses from
HBCU and PWI differ for each variable. The range of subjects that responded to each question
comprising the valid percent was between 109 and 113 from HBCU, and 130 and 132 from PWI.
It is important to note for Section 3.1 Traditional Professional Dress or Fashion-Oriented Dress,
a mean score closer to five indicates that the respondent perceives the garment to be fashion-
oriented, likewise the lower the mean score the more the respondent perceives the garment to be
traditional professional dress. Section 3.2 Business Casual Dress or Casual Dress is on a
different scale. The closer the mean score is to one, the respondent believes the garment to be
business casual dress, and the closer the mean score is to five, the respondent perceives the
garment to be casual dress. There was not a significant difference found in Section 4 between
students enrolled in HBCU and PWI.
Section 3.1 in Table 4 revealed that two out of 44 items had a significant difference at a
.05 level. Using the t-test for independent samples, there was a significant difference between
HBCU and PWI in their perception of garment 1: suits with embroidered jackets (p<0.05), and in
garment 2: loafers (p< 0.05). The mean score (with standard deviations in parentheses) of
garment one for HBCU was 2.99 (1.47), and 3.35 (1.28) for PWI. Therefore the mean score
suggests that African American students enrolled in PWI are less accepting of suits with
embroidered jackets into the standard definition of traditional professional dress. In addition
African American students enrolled in HBCU perceive embroidered jackets as acceptable attire
for the traditional professional dress. After examining the SPSS frequency output found in Table

63
1 of Appendix E, 46% students enrolled in HBCU considered suits with embroidered jackets as
traditional professional dress and 27% students enrolled in PWI considered it to be traditional
professional dress.
Section 3.2 in Table 4 revealed that five out of 46 items had a significant difference at a
(p < .05) or (p < .01) level. Using the t-test for independent samples, there was a significant
difference between the two subsamples in their perception of garment 3: dress pants/ slacks (t =
2.71, df = 205, p< 0.01), garment 4: dress pants wide-leg (p< 0.05), garment 5: short sleeve
blouses (not sheer) (p< 0.05), garment 6: t-shirts (no collar) (p< 0.05), and garment 7: tank tops
(p< 0.05). The mean score (with standard deviations in parentheses) for garment 3: dress pants/
slacks for HBCU was 2.33 (1.50), and for PWI was 1.85 (1.20). Therefore the mean score
suggests that students enrolled in PWI perceive dress pants/ slacks more as business casual dress
than their HBCU counterparts. After examining the SPSS frequency output found in Table 1 of
Appendix E, 78% students enrolled in PWI believe dress pants/ slacks as business casual dress
and 65% students enrolled in HBCU believe it to be business casual dress. Based on previous
studies (Damhorst, et al., 2002; Franz and Norton, 1997) and University publications (Ball State
University Career Center, 2003; Louisiana State University Career Services, 2006; Mississippi
State University Career Center, 2005), the male and female African American students enrolled
in the PWI had a more accurate perception of the garments than did the students enrolled in
HBCU. Using independent t-tests, there was not a significant difference between HBCU and
PWI in response to the Rosenberg’s Self-Esteem Scale.

64
Table 4
Descriptive Statistics for HBCU and PWI Subsamples
HBCU PWIVariables
M (SD) M (SD)t
Section 3.1 Traditional Professional Dress (1),Fashion Oriented Professional Dress (5)1. Suits with Embroidered Jackets 2.99 (1.47) 3.35 (1.28) -2.10*2. Loafers (no laces) 2.75(1.473) 2.40 (1.24) 1.99*
Section 3.2 Business Casual Dress (1),Casual Dress (5)3. Dress pants/ slacks 2.33 (1.50) 1.85 (1.20) 2.71**4. Dress pants- wide leg 3.23 (1.50) 2.85 (1.37) 2.02*5. Short-sleeve blouses (not sheer) 2.77 (1.32) 2.42 (1.17) 2.21*6. T-shirts (no collar) 3.96 (1.06) 4.23 (1.08) -1.97*7. Tank tops 4.07 (1.00) 4.34 (1.01) -2.06*
Note. *p < .05. **p < .01. Item mean scores reflect the following
response choices for Section 3.1: 1 = Traditional Professional Dress,
2 = Semi Traditional Professional Dress, 3 = Neither, 4 = Semi
Fashion-Oriented Professional Dress, 5 = Fashion-Oriented
Professional Dress. Item mean scores reflect the following response
choices for Section 3.2: 1 = Business Casual Dress, 2 = Semi
Business Casual Dress, 3 = Neither, 4 = Semi Casual Dress, 5 =
Casual Dress.
Table 5 represents the descriptive data for the sample of Mississippi and Louisiana. Due
to missing data the total responses from Mississippi and Louisiana differ for each variable in
question. The range of subjects that responded to each question comprising the valid percent
was between 76 and 125 from MS, and 115 and 122 from LA. It is important to remember the

65
same rules follow in Table 5 as in Table 4 in regards to section 3.1 and section 3.2. Section 4
asks the respondent to evaluate the appropriateness of a female business suit to a professional
interview. The higher the mean score the more inappropriate the respondent perceives the suit to
be, in contrast, the lower the mean score the more the respondent perceives the suit to be
absolute appropriate for a professional interview.
Section 3.1 Traditional Professional Dress or Fashion-Oriented Dress, revealed that 14
out of 44 items had significant differences, Section 3.2 Business Casual Dress or Casual Dress,
revealed that 16 out of 46 items had significant differences, and Section 4 Appropriate
Professional Dress, revealed that two out of six items had significant differences. Using the t-
test for independent samples, there was a significant difference between MS and LA in their
perception of garment 1: suits with embroidered jackets (p<0.05), garment 2: suits with jacket
hem above waist (p< 0.05), garment 3: pink suits with skirt (p< 0.05) , garment 4: suits with high
contrast trim (p< 0.05), garment 5: suits with dress pants- wide leg (p< 0.001), garment 6: suits
with Bermuda shorts (p< 0.001), garment 7: suits with Capri pants (p< 0.001), garment 8:suits
with turtlenecks (p< 0.05), garment 9: suits with halter tops (p< 0.001), garment 10: leather shoes
(2-3” heels) (p< 0.05), garment 11: Sandals (p< 0.001), garment 12: chandelier/ medium earrings
(p< 0.05), garment 13: cultural head wrap (p< 0.05), garment 14: broach/ pin (p< 0.05).
Using the t-test for independent samples, there was a significant difference between MS
and LA in their perception of garments found in Section 3.2 Business Casual Dress or Casual
Dress, including: 15: dresses (p<0.05), garment 16: jeans/ denim pants (p< 0.05), garment 17:
Bermuda/ walking shorts (p< 0.001) , garment 18: fitted Capri pants (p< 0.01), garment 19: long-
sleeve blouses (not sheer) (p< 0.001), garment 20: long sleeve blouses (sheer) (p< 0.001),
garment 21: three-quarter sleeve blouse (p< 0.05), garment 22:short sleeve blouses (sheer) (p<

66
0.001), garment 23: t-shirts (no collar) (p< 0.01), garment 24: tank tops (p< 0.001), garment 25:
Halter tops (p< 0.01), garment 26: sleeveless blouses (p< 0.01), garment 27: mules/ backless
shoes (p< 0.05), garment 28: canvas shoes (p< 0.001), garment 29: Athletic shoes (p< 0.01), and
garment 30: white athletic socks (p< 0.01).
Section 4 Appropriate Professional Dress, in Table 5 revealed two items with a
significant difference using the t-test for independent samples, item 31 (p< 0.05), and item 32
(p< 0.01). Overall the male and female African American students enrolled in the Louisiana
schools had a more accurate perception of the garments than did the students enrolled in
Mississippi schools.
Table 5
Descriptive Statistics for the Mississippi and Louisiana Samples
MS LAVariables
M (SD) M (SD)t
Section 3.1 Traditional Professional Dress (1), Fashion Oriented Professional Dress (5)
1. Suits with Embroidered Jackets 3.00(13.85) 3.39 (1.35) -2.20*2. Suits with jacket hem above waist 3.06 (1.47) 3.72 (1.38) -3.65*3. Pink suits with skirts 3.60 (1.29) 3.94 (1.12) -2.23*4. Suits with high contrast trim 3.45 (1.08) 3.92 (1.02) -3.46*5. Suits with dress pants-wide leg 3.12 (1.42) 3.79 (1.24) -3.95***6. suits with bermuda shorts 3.79 (1.23) 4.47 (.84) -5.06***7. Suits with capri pants 3.72 (1.26) 4.39 (.91) -4.78***8. Suits with turtlenecks 2.63 (1.12) 2.93 (1.18) -2.07*9. Suits with halter tops 3.72 (1.22) 4.21 (.92) -3.48***10. Leather shoes (2-3" heels) 2.38 (1.40) 2.03 (1.20) 2.12*11. Sandals 3.63 (1.25) 4.04 (.88) -3.00**12. Chandelier/ medium earrings 3.37 (1.23) 3.76 (1.23) -2.39*13. Cultural headwrap 3.50 (1.25) 3.81 (1.11) -2.05*14. Scarf around neck 2.69 (1.26) 3.06 (1.39) -2.20*
Section 3.2 Business Casual Dress (1), Casual Dress (5)
15. Dresses 2.49 (1.30) 2.91 (1.39) -2.41*16. Jeans/ denim pants 4.18 (1.13) 4.46 (.88) -2.134*17. Bermuda/ walking shorts 3.98 (1.13) 4.42 (.91) -3.36***
(Table 5 continues)

67
(Table 5 continued)
MS LAVariables
M (SD) M (SD)t
Section 3.2 Business Casual Dress (1), Casual Dress (5)
18. Fitted capri pants 4.06(1.15) 4.47(.84) -3.19** 19. Long-sleeve blouses (not sheer) 2.25(1.22) 1.77(.99) 3.32***20. Long-sleeve blouses (sheer) 2.85 (1.24) 3.44 (1.38) -3.57***21. Three-quarter sleeve blouses 2.71 (1.25) 2.38 (1.26) 2.04*22. Short-sleeve blouses (sheer) 3.08 (1.24) 3.63 (1.22) -3.47***23. T-shirts (no collar) 3.97 (1.13) 4.26 (.99) -2.15*24. Tank tops 4.00 (1.10) 4.45 (.86) -3.53***25. Halter tops 3.97 (1.06) 4.36 (.91) -3.07**26. Sleeveless blouses 3.60 (1.19) 4.03 (1.13) -2.83**27. Mules (backless shoes) 3.43 (1.27) 3.74 (1.22) -1.93*28. Canvas shoes 3.56 (1.23) 4.15 (1.01) -4.01***29. Athletic shoes 4.03 (1.11) 4.44 (.90) -3.15**30. White athletic socks 4.01 (1.11) 4.38 (.90) -2.89**
Section 4 Absolute Appropriate Dress (1), Absolute Inappropriate Dress (5)
31. Black skirt suit with lace trim 2.32 (1.09) 2.99 (1.02) -4.38*32. Black pants suit with long jacket 2.41 (1.31) 2.92 (1.32) -3.05**
Note. *p < .05. **p < .01. ***p < .001. Item mean scores reflect the
following response choices for Section 3.1: 1 = Traditional Professional
Dress, 2 = Semi Traditional Professional Dress, 3 = Neither, 4 = Semi
Fashion-Oriented Professional Dress, 5 = Fashion-Oriented Professional
Dress. Item mean scores reflect the following response choices for
Section 3.2: 1 = Business Casual Dress, 2 = Semi Business Casual
Dress, 3 = Neither, 4 = Semi Casual Dress, 5 = Casual Dress. Item
mean scores reflect the following response choices for Section 4: 1 =
Absolute Appropriate, 2 = Semi Appropriate, 3 = Maybe, 4 = Semi
Inappropriate, 5 = Absolute Inappropriate.

68
Table 6 represents the descriptive data for the subsamples of men and women. Due to
missing data the total responses from men and women differ for each variable in question. The
range of subjects that responded to each question comprising the valid percent found in Table 2
of Appendix E was between 176 and 183 for women, and 60 and 64 for men. It is important to
remember the same rules follow in Table 6 as in the previous tables in regards to Section 3.1,
Section 3.2 and Section 4.
Section 3.1 Traditional Professional Dress or Fashion-Oriented Dress revealed that 10
out of 44 items had significant differences, Section 3.2 Business Casual Dress or Casual Dress
revealed that 15 out of 46 items had significant differences, and Section 4 Appropriate
Professional Dress revealed that one out of six items had a significant difference. Using the t-
test for independent samples, there was a significant difference between men and women in their
perception of garments listed in Section 3.1 including: 1: suits with skirts (p<0.05), garment 2:
suits with jacket hem above waist (p< 0.05), garment 3: suits with high contrast trim (p< 0.01) ,
garment 4: suits with dress pants- wide leg (p< 0.05), garment 5: suits with Bermuda shorts (p<
0.05), garment 6: Loafers (no laces) (p< 0.05), garment 7: leather shoes (3-5” heels) (p< 0.01),
garment 8: leather flats. Shoes (no heels) (p< 0.001), garment 9: Open-toed dress shoes (p<
0.001), and garment 10: chandelier/ medium earrings (p< 0.001).
Using the t-test for independent samples, there was a significant difference between men
and women in their perception of garments listed in Section 3.2 including: 11: jacket/ blazer,
with skirts (p< 0.05), 12: dresses (p<0.05), garment 13: jeans/ denim pants (p< 0.001), garment
14: Khakis (p< 0.05), garment 15: long-sleeve blouses (not sheer) (p< 0.05), garment 16: long
sleeve blouses (sheer) (p< 0.05), garment 17:short sleeve blouses (sheer) (p< 0.01), garment 18:
Polo/ knit shirts with a collar (p< 0.05), garment 19: v-neck low cut blouse (p< 0.05), garment

69
20: tank tops (p< 0.05), garment 21: Halter tops (p< 0.01), garment 22: sleeveless blouses (p<
0.001), garment 23: leather shoes (2-3” heels) (p< 0.05), garment 24: leather shoes (3-5” heels)
(p< 0.05), and garment 25: open-toed dress shoes (p< 0.01).
Section 4 in Table 6 revealed one item with a significant difference using the t-test for
independent samples, the black skirt suit with lace trim (p< 0.05). The mean scores for the two
subsamples suggest the African American female sample had a more accurate perception of the
garments listed in Sections 3 and Section 4.
Table 6
Descriptive Statistics for the Male and Female Subsamples
Women MenVariables
M (SD) M (SD)t
Section 3.1 Traditional Professional Dress (1), Fashion Oriented Professional Dress (5)
1. Suits with Skirts 1.27 (.77) 1.52 (.69) -2.28*2. Suits with jacket hem above waist 3.49 (1.50) 3.08(1.32) 2.06*3. Suits with high contrast trim 3.80 (1.09) 3.35 (.97) 2.81**4. Suits with dress pants-wide leg 3.57 (1.37) 3.10 (1.34) 2.40*5. suits with bermuda shorts 4.21 (1.08) 3.87 (1.16) 2.08*6. Loafers (no laces) 2.46 (1.36) 2.85 (1.32) -1.98*7. Leather shoes (3-5" heels) 3.90 (1.29) 3.35 (1.30) 2.90**8. Leather flats. (no heels) 2.15 (1.13) 2.73 (1.18) -3.44***9. Open-toed dress shoes 3.96 (1.14) 3.32 (1.11) 3.80***10. Chandelier/ medium earrings 3.74 (1.28) 3.07 (1.18) 3.61***
Section 3.2 Business Casual Dress (1), Casual Dress (5)
11. Jacket/ Blazer with skirt 1.35 (.89) 1.68 (1.20) -2.29*12. Dresses 2.79 (1.41) 2.41 (1.17) 1.89*13. Jeans/ denim pants 4.46 (.88) 3.89 (1.28) 3.26***14. Khakis 3.83 (1.34) 3.39 (1.39) 2.16*15. Long-sleeve blouses (not sheer) 1.93 (1.82) 2.25 (.96) -1.87*16. Long-sleeve blouses (sheer) 3.25 (1.36) 2.80 (1.15) 2.50*17. Short-sleeve blouses (sheer) 3.47 (1.28) 2.98 (1.13) 2.83**18. Polo/ knit shirts with a collar 3.80 (1.24) 3.39 (1.32) 2.25*19. V-neck low cut blouse 3.90 (1.08) 3.55 (1.08) 2.17*20. Tank tops 4.31 (.96) 3.95 (1.12) 2.25*
(Table 6 continues)
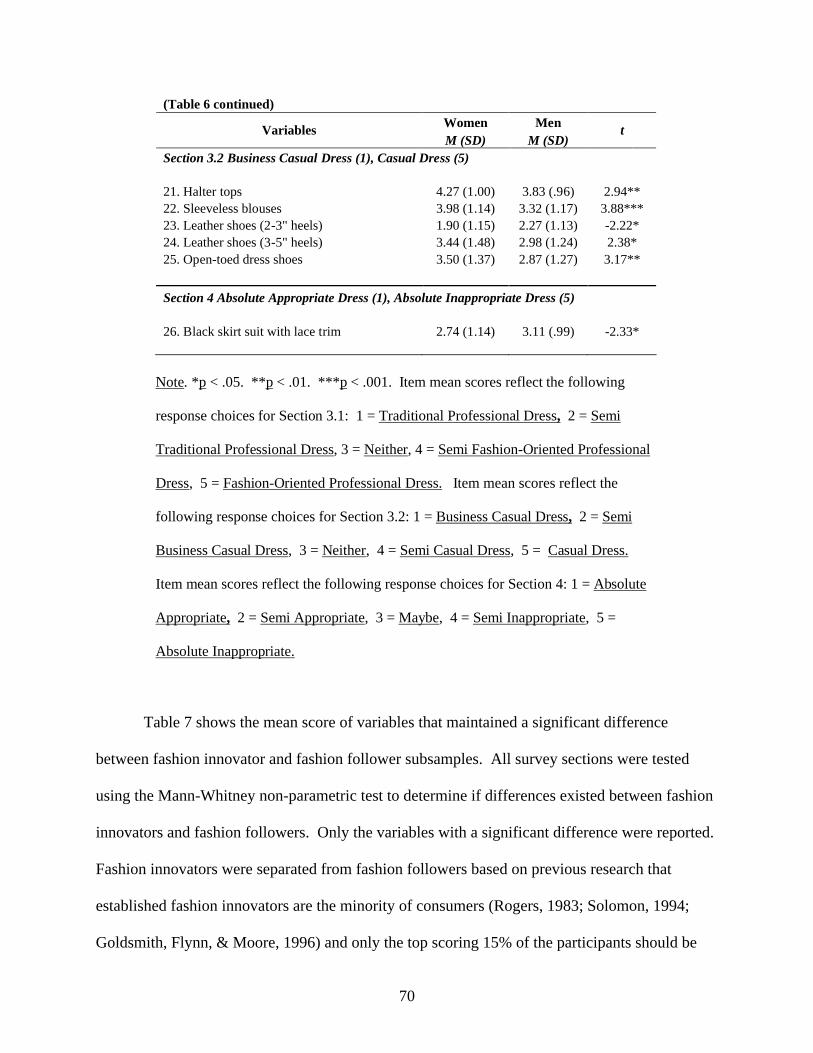
70
(Table 6 continued)
Women MenVariables
M (SD) M (SD)t
Section 3.2 Business Casual Dress (1), Casual Dress (5)
21. Halter tops 4.27 (1.00) 3.83 (.96) 2.94**22. Sleeveless blouses 3.98 (1.14) 3.32 (1.17) 3.88***23. Leather shoes (2-3" heels) 1.90 (1.15) 2.27 (1.13) -2.22*24. Leather shoes (3-5" heels) 3.44 (1.48) 2.98 (1.24) 2.38*25. Open-toed dress shoes 3.50 (1.37) 2.87 (1.27) 3.17**
Section 4 Absolute Appropriate Dress (1), Absolute Inappropriate Dress (5)
26. Black skirt suit with lace trim 2.74 (1.14) 3.11 (.99) -2.33*
Note. *p < .05. **p < .01. ***p < .001. Item mean scores reflect the following
response choices for Section 3.1: 1 = Traditional Professional Dress, 2 = Semi
Traditional Professional Dress, 3 = Neither, 4 = Semi Fashion-Oriented Professional
Dress, 5 = Fashion-Oriented Professional Dress. Item mean scores reflect the
following response choices for Section 3.2: 1 = Business Casual Dress, 2 = Semi
Business Casual Dress, 3 = Neither, 4 = Semi Casual Dress, 5 = Casual Dress.
Item mean scores reflect the following response choices for Section 4: 1 = Absolute
Appropriate, 2 = Semi Appropriate, 3 = Maybe, 4 = Semi Inappropriate, 5 =
Absolute Inappropriate.
Table 7 shows the mean score of variables that maintained a significant difference
between fashion innovator and fashion follower subsamples. All survey sections were tested
using the Mann-Whitney non-parametric test to determine if differences existed between fashion
innovators and fashion followers. Only the variables with a significant difference were reported.
Fashion innovators were separated from fashion followers based on previous research that
established fashion innovators are the minority of consumers (Rogers, 1983; Solomon, 1994;
Goldsmith, Flynn, & Moore, 1996) and only the top scoring 15% of the participants should be

71
considered as fashion innovators (Goldsmith, Flynn, & Moore, 1996; Forsythe, Butler, & Kim,
1991). However, based on distribution of scores, the African American sample was split by the
top 18.4% reflecting a score of 47 and higher out of a perfect score of 52. This yielded 46
innovators (37 women and nine men) and 203 others. Those who scored 47 and higher
represented 20.2% of women and in the same distribution represented 13.5% of men.
Table 7 shows four of the survey’s variables indicated a statistically significant (p <
0.001) mean difference between innovators and followers. Using SPSS to compare the Mann-
Whitney non-parametric version of the independent samples t-test, there was a significant
difference between fashion innovators and fashion followers in the importance of clothing in
their lives (p< 0.001), the influence of fashion trends over their friends (p< 0.001), overall
fashion behavior (p< 0.001), and self-esteem (p< 0.001).
Table 7
Descriptive Statistics for the Fashion Innovatorand Fashion Follower Subsamples (1)
Variables Z
Importance of Clothing 7.19***Fashion Leadership 10.58***Fashion Behavior 10.27***Self -Esteem 3.37***
Note. ***p < .001. Fashion innovators (n) = 46.
Fashion followers (n) = 203. Table indicates a
significant difference using Mann-Whitney non-
parametric tests.

72
Table 8 represents the descriptive data for the subsamples of fashion innovators and
fashion followers. There are no missing data; all respondents in this subsample completed this
portion of the survey. Forty-six respondents were classified as fashion innovators while 203
were classified as fashion followers. Table 8 reveals that three of the survey’s 96 garments had a
statistically significant (p < 0.05) or (p < 0.01) mean difference between fashion innovators and
followers. Using SPSS, the Mann-Whitney non-parametric tests showed there was a significant
difference between fashion innovators and fashion followers in garments found in Section 3.1
Traditional Professional Dress or Fashion Oriented Dress: 1: suits with medium size prints
(p<0.01), garment 2: jacket/ blazer with skirts (p< 0.05), garment 3: sandals (p< 0.05). It is
important to remember the same rules follow in Table 10 as in the previous tables in regards to
section 3.1. Section 4 was compared for mean differences at (p< 0.05), but none were found
significant. After examining the output for the selected samples, fashion innovators classified
the garments much like the previous research.
Table 8
Descriptive Statistics for Fashion Innovator and Fashion Follower Subsamples (2)
Variables z
1. Suits with Medium size prints 2.65**2. Jacket/ blazer with skirts -1.58*3. Sandals 2.14*
(Table 8 continues)

73
(Table 8 continued)
Note. *p < .05. *p < .01. Fashion innovators (n) = 46. Fashion
followers (n) = 203. Table indicates a significant difference using
Mann-Whitney non-parametric tests. Item mean scores reflect the
following response choices for Section 3.1: 1 = Traditional
Professional Dress, 2 = Semi Traditional Professional Dress, 3 =
Neither, 4 = Semi Fashion-Oriented Professional Dress, 5 = Fashion-
Oriented Professional Dress.
Correlations
Pearson Correlation tests were used to determine whether relationships between self-
esteem and the different types of fashion behavior existed for the HBCU and PWI samples. Past
quantitative research shows that the strength of the Pearson r relationship follows specific rules
(Muijs, 2004). If the effect size is over .8 it is very strong, between .79 and .6 is strong, between
.4 and .59 is moderate, between .2 and .39 is modest, and any number below .19 is considered
weak (Muijs, 2004).
Table 9 shows the results of the Pearson Correlation test and confirms there are
significant relationships common to both subsamples at (p < .05) and (p < .01). Table 9 revealed
a modest positive relationship between self-esteem and fashion leadership within the HBCU
sample at (p < .01). The correlation value is .293, which is the highest correlation among the
independent variables and self-esteem. There is a modest positive correlation (.284) between
self-esteem and overall fashion behavior within the HBCU sample at (p < .01). The results show
a modest negative relationship between self-esteem and fashion innovativeness within the HBCU

74
sample at (p < .05). In addition, the results indicate that self-esteem is not a good predictor of the
importance of clothing. It is important to note, Table 9 confirms no significant relationship
between self-esteem and the other fashion behavioral variables within the PWI sample.
Table 9
Correlations for HBCU and PWI Subsamples
Self- Fashion Importance Fashion FashionEsteem Leadership of Clothing Behavior Innovativeness
Self-Esteem:HBCU .293** .136 .284** -.220*
PWI .113 .133 .145 -.124Fashion Leadership
HBCU - .364** .933** -.737**PWI .395** .922** -.616**
Importance of ClothingHBCU - .674** -.459**
PWI .720** -.405Fashion Behavior
HBCU - -.762**PWI -.636**
Fashion Innovativeness
HBCU -PWI
Note. HBCU N = 115. PWI N = 136. *p < .05. **p < .01.

75
CHAPTER 5
DISCUSSION
The present study had six hypotheses. This chapter will discuss and elaborate upon the
current research findings as they pertain to each of the six hypotheses. A conclusion will be
discussed, as well as, suggestions for future research, the implications, and limitations of the
study.
Hypotheses
Ho1: There will not be a significant difference in their perceptions of female professional
dress between African American college students enrolled in Predominantly White
Institutions (PWI) and Historically Black Colleges and Universities (HBCU).
The researcher originally assumed that African American college students enrolled in
HBCU and PWI would perceive professional dress in the same manner due to findings that
cultural heritage has been found to be a key factor in affecting an individual’s clothing
preferences (Lavin, 1996; Yoo, 2003; Lee, 2005). As noted in the previous chapter there was a
significant difference between the two subsamples at .05 level of suits with embroidered jackets,
loafers without laces, dress pants/ slacks, wide-leg dress pants, short-sleeve blouses (not sheer),
t-shirts (no collar), and tank tops. Based on previous research (Damhorst, et al., 2002; Franz and
Norton, 2001) and University publications (Mississippi State University Career Center, 2005;
Southern University Systems and A&M College Career Services, 2005; Louisiana State
University Career Services, 2006), male and female African American students from PWI had a
better understanding of the classification of each garment in workplace attire (see Table 4).

76
Suits with embroidered jackets have been classified by past researchers as fashion-
oriented dress, but 46% of survey participants from HBCU believed they are traditional
professional dress (see Table 4). This represents almost half of the survey participants that
responded to this question compared to 27% of African American students from PWI that
believed the garment to be traditional professional dress.
The researcher purposefully surveyed members of minority student organizations due to
research that suggested joining African American student groups at Predominantly White
Institutions allow comfort and support through weekly communication with like peers (Guiffrida,
2003), maintain a positive self-esteem (Allen, 2001; Guiffrida, 2003), and teaches the individual
what is socially acceptable (Feldman & Newcomb, 1969). It has been suggested, “For most
African Americans, it is the African American community that provides them with a frame of
reference….” (Allen, 2001, p.70). In addition, Shibutani (1968) believed individuals from a
specific group or culture digest the perspective of that group which shapes their view of the
world. If this is true, why did African American students from predominantly white institutions
have a better understanding of professional dress than did the students enrolled in Historically
Black Universities and Colleges?
Porter and Washington (1979) maintained that African Americans refer to Caucasians for
comparisons of economic and social status, but refer to African Americans for personal issues.
For this study’s purposes, the African American subsample from PWI could consider
professional dress a determinant of social status, and not an issue of personal or group culture.
Professional dress is outside the realm of everyday cultural dress because it is the vehicle that
can be attributed to corporate success or social status. Past research reports African American
professionals are aware of hidden racism and combat its negative influence on their job success

77
or upward mobility by dressing professionally to work (McLeod, 1999; Schneider, 1998;
Thomas, 1995; Russell & Reynolds. 1992). Franklin (2001) claimed that African American
women frequently scrutinize what they wear to predominantly Caucasian settings in order to not
draw attention to their cultural heritage. African Americans in the PWI and in the workplace
dress more conservatively than their HBCU cohorts to compete with the majority for social
status and to not “look White” (Franklin, 2001; McLeod, 1999; Russell & Reynolds, 1992;
Schneider, 1998). This idea mirrors Guiffrida’s (2003) idea of code switching, the nurturing of
two opposing personas, one reserved for Caucasians and the other for fellow African Americans.
The African American students from Predominantly White Institutions appear to have crossed
racial boundaries to refer themselves to the majority group. Code switching does not occur on
HBCU because the African American culture is the dominating culture on those campuses, and
the non-Black population percentage at the schools is less than 10%. This study can only
speculate that the differences of dress between the students from PWI and HBCU can be
influenced by the majority Caucasian population at PWI. The study of Caucasian’s perception of
professional dress is beyond this study’s focus, however, it is a valid explanation based on past
research.
Another possibility as to the differences in perception of professional dress of African
American students enrolled in PWI and HBCU could be the varying levels of attention each
university places of their Career Center services. Mississippi State University Career Center
(2005) devoted multiple web pages to tips for dressing for success. The page devoted to female
dress for success included color photographs of an African American female dressed in correct
traditional professional dress and incorrect professional dress. The written text provided
descriptive information on the perfect suit, blouse, shoes, accessories, and personal grooming on

78
appropriate interview attire. The other PWI, Louisiana State University Career Services (2006)
places the same emphasis on appropriate professional dress. Not only did LSU provide written
text descriptions, but provides pictures of actual garments for appropriate professional dress and
business casual dress.
Contrary to PWI, HBCU career centers do not place as high an importance on female
professional dress. Southern University Career Services (2005) allows one page of professional
dress advice for women and three pages of text for men. Alcorn State University in Mississippi
did not have a career service webpage or professional dress advice located on ASU’s homepage.
The lack of importance Historically Black Colleges and Universities places on advising its
female students on how to dress professionally in the workplace is a possible explanation for the
significant difference in perception between the HBCU and PWI college student samples.
Ho2: There will not be a significant difference in perceptions of female professional dress
between Louisiana and Mississippi African American college students.
The researcher originally hypothesized that African American college students enrolled
in universities in Mississippi and Louisiana would perceive professional dress in the same
manner due to Fiore and Kimle (1997) findings that geographic locations in combination with
temperature and cultural heritage can influence clothing preferences of an individual. In
addition, the population for this research was obtained by researching African American
demographic and psychographic statistics in the United States. The U.S. Census Bureau divided
the nation into four Regions and nine Districts for data reporting purposes. These boundaries
were formed to include “areas with comparable social, economic, and housing characteristics”
79
(Lavin, 1996). Mississippi and Louisiana are both found in the Southern Region and both in the
South Central Divisions.
As noted in the previous chapter there was a significant difference between the two
subsamples of garments listed in Section 3.1(Traditional Professional Dress or Fashion-
Oriented Dress), Section 3.2 (Business Casual Dress or Casual Dress), and Section 4
(Appropriate Interview Dress). Significant differences were found in fashion-oriented garments
from Section 3.1 (Traditional Professional Dress or Fashion-Oriented Dress) which included
suits with embroidered jackets, suits with jacket hem above waist, pink suits with skirt, suits with
high contrast trim, suits with dress pants- wide leg, suits with Bermuda shorts, suits with Capri
pants, suits with turtlenecks, suits with halter tops, sandals, chandelier/ medium earrings, cultural
head wrap (see Table 5). Of the garments listed, all were considered fashion-oriented dress.
Based on previous research (Damhorst, et al., 2002; Franz and Norton, 2001) and University
publications (Mississippi State University Career Center, 2005; Southern University Systems and
A&M College Career Services, 2005; Louisiana State University Career Services, 2006), the
results imply that the African American students from Louisiana had a significantly better
understanding of fashion-oriented dress and the appropriateness of workplace attire (See Table
5). The data did not show a significant difference using independent t-tests between the
Mississippi and Louisiana students in the amount of fashion innovators, or the fashion leadership
and importance of clothing variables. The Mississippi sample was not more fashion innovative,
rather, the sample clearly has not been educated on traditional professional dress. The
Mississippi sample’s inability to understand appropriate professional dress could affect their
occupational success. Research found that co-workers and employers judge employee
competence based on the appropriateness and attractiveness of their clothing (Forsythe, 1988;

80
Molloy; 1996; Bixler, 1997). In addition, the occurrence of fads and other trendy garments in
the professional dress code are perceived as showy and drawing unnecessary attention to an
individual in order to create an elite identity (Damhorst et al., 2002; Kimle & Damhorst, 1997).
Some even negatively juxtapose fashion garments with poor work ethic. In addition, outsiders
perceive others who wear fashion items to make poor decisions and hasty judgments (Kimle &
Damhorst, 1997).
Based on previous research (Damhorst, et al., 2002; Franz and Norton, 2001) and
University publications (Mississippi State University Career Center, 2005; Southern University
Systems and A&M College Career Services, 2005; Louisiana State University Career Services,
2006), it was evident from the results of Section 3.2 (Business Casual Dress or Casual Dress)
that the Louisiana sample understood what garments were considered female business casual
dress and which should be considered causal dress. Ironically, both LA and MS students
perceived the two absolute inappropriate suits as absolute appropriate for a professional
interview. Section 4 revealed two suits that had a significant difference in means. Garment 31:
black skirt suit with lace trim, and garment 32: black pants suit with long jacket were both
labeled absolute inappropriate dress for a professional interview (Damhorst, Jondle, &
Youngberg, 2002) (see Appendix A). Over half of the MS and LA samples answered incorrectly
in comparison to past research, though there is a significant difference between the means.
Regardless, LA students were 17% less accepting of garment 31, the black skirt suit with lace
trim, and 20% less accepting of garment 32, the black pants suit with a long jacket (see Table 6
in Appendix E). It is interesting to note the overall African American sample accepted the two
absolute inappropriate suits as appropriate. The components which made the suits inappropriate
stem from fashion-oriented mechanisms. Garment 31 pictured a straight knee length skirt that

81
revealed approximately 2 ½ inches of leg above the knee due to a chiffon ruffle with black
sparkle beading. The same see-through ruffle was shown in place of a traditional sleeve cuff.
Garment 32 pictured a pants suit with a long jacket that stopped at mid thigh with a revealing
neckline and bright red buttons. Previous findings suggest African Americans are more fashion
conscious and that 34% of African Americans stay informed on fashion trends compared to 25%
of Whites (Gardyn & Fetto, 2003). In addition, the focus group participants preferred dressier
more fashion-oriented workplace attire. This could be why both samples were eager to accept
the fashionable suits as interview attire. Another explanation could be that the respondents could
not distinguish the photograph’s detail, but this is unlikely due to the internal reliability of (alpha
= .63) (see Table 3), and the suit had been previously tested on the study’s focus group. Two of
the focus group’s seven participants (one male and one female) agreed that garment 31 would be
appropriate even after discussion of the garment’s fashion oriented components. Both focus
group participants believed the suit would allow the female interviewee to show her personality
and give her a competitive edge. In addition, focus group participants in unison approved of
long suit jackets shown in garment 32, however, several members did not approve of the low
neck line.
The notable difference in perception between the MS and LA African American students
could be explained by the college town’s geographic location. Both universities surveyed in
Louisiana are located in Baton Rouge, which the U.S. Census Bureau (2000) defines as a
metropolitan area. Metropolitan areas must have a large population center city with at least
100,000 inhabitants with surrounding communities having high economic interaction with the
core city. Metropolitan areas offer greater work opportunities, a greater depth and breadth of
shopping, and more current and advanced media. Baton Rouge has 178,626 persons over sixteen

82
years of age. Contrarily, the two cities that host the campuses of MSU (18,041) and ASU
(3,351) have a combined total of 21,392 over sixteen years of age (U.S. Census Bureau, 2000).
MSU and ASU are located in rural areas of Mississippi without the access of U.S. interstate
system. Contrarily, Baton Rouge is located on a major interstate system. In addition, Baton
Rouge has a lower household poverty rate 27% compared to MSU’s Starkville, MS 36%, and
ASU, MS 43%. All of the geographic disadvantages found near the MS schools play a major
role in the lack of opportunities and information available to these college students.
H3: There will be a significant difference between African American male and female
perceptions of female professional dress.
The researcher originally assumed that there would be a difference between African
American male and female college students’ perception of female professional dress due to
findings that men are less accepting of fashion forward garments in the workplace and more
accepting of sexuality in dress (Damhorst, Jondle, & Youngberg, 2002; Kwon, 1994). As noted
in the previous chapter there was a significant difference in section 3.1 (Traditional Professional
Dress or Fashion-Oriented Dress) between the two subsamples in suits with skirts, suits with
jacket hem above waist, suits with high contrast trim, suits with dress pants-wide leg, suits with
Bermuda shorts, loafers (no laces), leather shoes (3-5” heels), leather flats (no heels), open-toed
dress shoes, and chandelier/ medium earrings. Only one garment listed in section 3.1 with
significantly different means was considered traditional professional dress, the other nine were
fashion-oriented garments.
Studies show that males view women’s professional dress more critically than females
(Damhorst et al., 2002; Kwon, 1994), but this was not the case with the study’s African

83
American male sample. Damhorst et al. (2002) found females were more eager to approve
fashionable items, but this study did not confirm those results. The African American male
sample was more accepting of the fashion-oriented garments than were the women. The findings
of this study do not support past research that suggests females tend to be more innovative
(Kwon & Workman, 1996) and more fashion conscious than males (Goldsmith, Stith, and White,
1987). However, the findings do support Molloy’s (1996) assertion that women are more critical
of other female coworker’s professional dress.
As noted in the previous chapter there was a significant difference among 15 garments
found in Section 3.2 (Business Casual Dress or Casual Dress) (see Table 8). Overall, women
understood appropriate business casual and casual dress, and were more conservative than the
African American men. This supports research from Kwon (1994) that found women are taught
to pay closer attention to clothing and appearance than men. Men were more accepting than
females of tank tops, halter tops, and v-neck low cut blouses as business casual dress, which
supports Damhorst et al. (2002) findings that male human resource managers and recruiters were
overall more positive than their women cohorts toward sexual display in professional dress.
Section 4 revealed one suit that had a significant difference in means. Garment 26:
black skirt suit with lace trim was labeled absolute inappropriate dress for a professional
interview (Damhorst, Jondle, & Youngberg, 2002) (see Appendix A). It is interesting to note the
overall African American sample accepted the absolute inappropriate suit as appropriate dress
for a professional interview. The components which made the suit inappropriate stem from
fashion-oriented mechanisms. Garment 26 pictured a straight knee length skirt that revealed
approximately 2 ½ inches of leg above the knee due to a chiffon ruffle with black sparkle
beading. The same see-through ruffle was shown in place of a traditional sleeve cuff. The

84
acceptance of the inappropriate garment was not due to poor visibility of the suit. Section 4 had
a moderate internal reliability rate (see Table 3) and as mentioned, the suit had been previously
tested on the study’s focus group. Previous findings suggest African Americans are more
fashion conscious and that 34% of African Americans stay informed of fashion trends compared
to 25% of Caucasians (Gardyn & Fetto, 2003). This could be why both men and women were
eager to accept the fashionable suits as interview attire.
One possible explanation for the significant difference between the male and female
samples’ perception of professional dress could be explained by reexamining the focus group
discussion. Of the three African American men who participated in the focus group, one slowed
the conversation considerably to ask for descriptions of the garments listed in Section 3. The
other two men in the group were not confused as to the garments meanings. However, this does
support the common assumption that females are socialized to pay closer attention to clothing
and new fashions than men (Kwon, 1994).
Ho4: There will not be a significant difference in their level of self-esteem between African
American college students enrolled in PWI and HBCU.
After examining past research on the self-esteem of African American college students,
the researcher believed students enrolled in PWI and HBCU would not have a significant
difference in self-esteem. The Rosenberg Self-Esteem Scale proved this true. This could be
explained by the fact that most of the respondents from PWI were members of minority student
organizations, and studies show that the membership in minority student organizations helps
African American students to maintain a positive self-esteem (Allen, 2001; Guiffrida, 2003). In
addition, Drury (1980) suggested that minorities are inclined to stick together when outnumbered

85
by the dominant culture. Other research has maintained that African American students are at a
disadvantage when attempting to academically and socially integrate in PWI. Therefore, formal
associations with peers in minority student organizations are essential to social integration and
consequently retention at PWI (DeSousa & Kuh, 1996; Guiffrida, 2003; Tinto, 1993). Perhaps
the close bonds formed in the minority student organizations at PWI are more for support and
survival than other ordinary causal friendships. As mentioned, 63.6% of respondents from ASU
and 63.8% from SU-BR were not members of student organizations; however, the HBCU in this
study enrolled less than 10% non-African American students. The need for support and group
identity that minority student organizations provide on predominantly white campuses is not as
important at HBCU.
The mean self-esteem score for the entire sample is (35.12) on a scale from 10 to 40.
While there is not a definite cut-off point to separate subjects with high self-esteem and those
with low self-esteem (University of Maryland, 2005), it has been suggested that any score over
the mean is relatively high self-esteem and anything below is considered low self-esteem
(Antonio, 2004). The present study reported an overall 66.3% of respondents scoring higher
than the average of the study. This study revealed 60.8% of respondents from HBCU and 69%
of respondents from PWI scored higher than sample average.
H5: There will be a significant difference in their level of self-esteem and fashion
behavioral variables between fashion innovators and fashion followers.
The researcher originally assumed that there would be a difference between African
American fashion innovators and fashion followers in their level of self-esteem and of fashion
behavioral variables. As reported in the previous chapter there was a significant difference

86
between fashion innovators and fashion followers in variables: importance of clothing, fashion
leadership, fashion behavior, and self-esteem (see Table 7).
To date, past research did not examine the relationship between self-esteem and fashion
innovativeness, though there has been much focus on self-concept (Goldsmith et al., 1996).
Although there is lack of research in the area of self-esteem and innovativeness, the findings of
the current study show (m = 36.66) fashion innovators have a significantly higher self-esteem
than do (m = 34.75) fashion followers at (p < .01) (see Table 7). The findings were not
surprising due to research that shows fashion followers use clothing to demonstrate group
belonging, disregarding identity to fit in socially (Workman & Kidd, 2000). Seeking approval
and conforming to a group’s typical behavior or dress are characteristic of individuals with low
self-esteem.
Table 7 reported a significant difference in fashion innovators and fashion followers’
level of self-esteem. An explanation for the significant difference could have been because
fashion innovators describe themselves (self-concept) as contemporary, vain and indulgent
(Goldsmith, Flynn, & Moore, 1996). Individuals pay more attention to variables that enhance
their actual or ideal self-concept (Malhotra, 1988), and it could be assumed that fashion
innovators’ vanity or indulgent behavior stimulated a more positive ranking of themselves in
order to preserve their ideal self-concept. In addition, innovators’ need to feel and look different
could have motivated their positive response.
The present study’s findings showed there is a significant difference between the
subsample on the importance of clothing (see Table 7). The findings showed that fashion
innovators believe clothing is more important for social status, social mobility, and a way of
expressing individuality than do fashion followers. What is interesting to note, but wasn’t

87
involved in the hypothesis, is that there was no significant difference between men and women
on the importance of clothing. This supports Kwon and Workman’s (1996) study that found
there was no significant difference between male and female college students on the importance
of clothing (study does not report race/ ethnicity). In addition, fashion innovators believe they
are the leaders in new fashions and influence their friends’ clothing decisions more than did the
fashion follower sample. In this study 80% of fashion innovators were women and 20% were
men. This mirrors past research that maintains female college students are more fashion
conscious and innovative than male college students (Goldsmith et al., 1987; Kwon & Workman,
1996). Past research (Goldsmith et al., 1987; Kwon & Workman, 1996) has primarily focused
on Caucasian male and female college students, so it is interesting to note that African American
females are more fashion conscious than their male counterparts. The research supports that
regardless of race, women pay more attention to new fashions and to maintain appearance more
than men (Kwon, 1994; Kwon & Workman, 1996).
It is important to note that 58.7% of the fashion innovators are enrolled in HBCU which
is not the majority, but should be noted. The large number of innovators being enrolled in
HBCU did not occur by chance. As mentioned before African Americans are more fashion
conscious (Good Looks, Good Food, 2002; Kochman, 1981) and 34% of African Americans stay
informed on fashion trends compared to 25% of Caucasians (Gardyn & Fetto, 2003). Rudd and
Lennon (1994) stated that every culture has a primary appearance that is internalized as the
standard aesthetic people use to adorn their bodies and to compare the created appearance. It can
be assumed based on current literature on reference groups that African American students
enrolled in HBCU are constantly surrounded by one unified culture, which happens to be the

88
most fashion conscious culture (Gardyn and Fetto, 2003), and therefore includes more fashion
innovators.
It is interesting to note of the fashion innovators, less than half 43.5% are in minority
student organizations. These results coincide with past research that suggest fashion innovators
are less likely to be influenced by reference groups (student organizations) and media
(Cholachatpinyo, Padgett, Crocker, & Fletcher, 2002). Most research suggests fashion
innovators do not desire conformity into particular groups, but enjoy autonomy from formal
associations.
H6: There will be a significant difference in their perception of female professional dress
between fashion innovators and fashion followers.
The present study hypothesized fashion innovators and fashion followers would have a
significant difference in perceptions of professional dress due to findings that support innovators
are more involved and knowledgeable about new fashions, and shop more for new clothes than
fashion followers (Goldsmith, Flynn, & Moore, 1996). As noted in the previous chapter there
was a significant difference between the two subsamples in three garments at (p < .05). Due to
the lack of research on this topic, the researcher originally assumed there would be additional
garments that would provide significant differences. The results are a little disappointing, but
provide a sturdy foundation for the similarities of fashion innovators and fashion followers in
their understanding of garments found in professional dress. Based on previous research
(Damhorst, et al., 2002; Franz and Norton, 2001) and University publications (Mississippi State
University Career Center, 2005; Southern University Systems and A&M College Career
Services, 2005; Louisiana State University Career Services, 2006), fashion innovators had a

89
better understanding of the true meaning of professional dress than did followers. This supports
Goldsmith et al. (1996) findings that fashion innovators are more knowledgeable about new
fashions. The study shows that innovators in the African American sample understood what
garments are considered Traditional Professional Dress, Fashion-Oriented Dress, Business
Causal Dress, and Casual Dress, but the study did not test what fashion innovators would
actually wear to a professional interview. In the future, it would be interesting to research if
fashion innovators compromise their need to feel and look different in order to fit in and remain
professional during a career interview.
In conclusion, within the sample of African American college students the current study
examined relationships between the subsamples: HBCU and PWI, Louisiana and Mississippi,
men and women, and fashion innovators and followers. All of the findings were supported with
past research, and several of the results provide new information for academia to build upon.
Overall, the African American college student sample had high self-esteem, an above average
percentage of fashion innovators, and a unique perception of professional garments found in the
workplace.
Implications
The results of the current study imply that even in today’s career driven world the
meanings of professional dress and business causal are still unclear. This could cause great
obstacles for the African American sample when interviewing for a professional career. Based
on the results, some African Americans sample from the study are not ready for professional
interviews. Incongruent appearance between employees and their employer could limit their
career opportunities for African Americans fresh out of college. Employers assume if you do not
dress the part then you do not want the job. In addition, male and female black employees face

90
many racial barriers toward upward mobility and appearance should not be one of those barriers
(Dortch, 1994; Ryan, 2005).
It is extremely important that professors, career counselors, and mentors at HBCU stress
the importance of understanding the meaning of professional dress. It is not enough for
universities to define professional dress on a website; all of Academia should emphasis the
importance of appropriate dress for interviews and in the workplace. With the vast amount of
overt racism and competition in the workplace today, it is imperative that African Americans
college graduates do not give employers the opportunity to discredit them because of
inappropriate dress.
Numerous reports prove that it is not just employees fresh out of college who do not
understand appropriate professional dress. It would be beneficial for employers to write specific
guidelines for professional dress for each work setting. Research shows that dress codes are
rarely formally written in employee manuals and are most often informal codes that are assumed
and rarely discussed (Miller, 1999; Power-dressing for Professionals, 2005). Employers assume
that employees will observe what upper management is wearing and reflect those adornment
practices in their own dress. Without a written dress code, individuals determine for themselves
what they perceive as appropriate types of clothing for various work places. It is common for
perceptions of proper or improper dress for each job to differ from person to person (Kwon,
1994); in this study it was different from HBCU to PWI, MS to LA, fashion innovators to
fashion followers, and men to women.
The findings of this research imply that there is an outside factor influencing the
perceptions of dress of African American college student enrolled in predominantly white
institutions. It is important for sociologists and psychologists to determine what reference

91
groups are impacting the African American population’s perception of professional dress at the
predominantly white institutions and causing an unequal standard within the African American
college student culture. Swindel (2001) stated, “Culture determines whether or not the group
survives, and if it survives, to a great extent, it determines the survivor’s quality of life” (p. 22).
Individuals in dissimilar cultural groups have their own aesthetic because of separating
themselves from outsiders, and the differences in viewpoints within a culture occur due to
disparity in contact and affiliation. Likewise, HBCU maintained a unified rich culture by
preserving their social distance with the non-Black community. However, African American
students enrolled in PWI are surrounded daily with a culture that is dissimilar to their own.
Often, individuals will adopt new forms of dress to adopt to roles in a new culture. This
contradiction can lead to incongruent beliefs and perceptions within the African American
community allowing for differences in dress and behavior.
This information is not only important to academia, but retailers and marketers need to be
aware of the outside influences impacting African American perceptions of professional dress
and purchasing decisions. It is evident from the research that African Americans perceive
professional work attire in differently, so it would not be accurate to assume that the lifestyle-
oriented appeal and affirming African Americans’ sense of Black pride as Holloman (1997)
suggested would always persuade African Americans to frequent a particular retailer. However,
Caucasian retailers have primarily focused on Caucasian consumers, ignoring African American
markets (Miller, 1993; Walker, 2003), despite evidence that proves African Americans spend a
larger percentage of their income on adornment practices than Caucasians (Miller, 1993; Stith &
Goldsmith, 1989; Walker, 2003). American Demographics’ analysis of the U.S. Census
Bureau’s Population Survey Data 2001, reported “the top priority in the African American

92
household budget is buying clothes to establish and enhance one’s identity” (Good Looks, Good
Food, 2002; Kochman, 1981). In addition to this, the University of Georgia’s Selig Center for
Economic Growth (2002) projected that African American buying power of 2009 to be the
highest of all minorities, topping at $965 billion dollars. It is evident that retailers who do not
target the African American consumer market may be missing a significant opportunity.
Marketers should study the population in greater detail to better understand their desires and
perceptions.
The results of the current research imply that retailers should not always rely on
geography to market merchandise to a specific population in the area. This is evident because
African American college students from Louisiana perceived professional dress differently than
did the college students from Mississippi. This is striking information due to the fact that the
states share a border in the Southern United States, and the universities in the study are within
distance of 330 miles. Since these two states are quite similar in geography, demographics, and
psychographics, it is hard to assume that African American students throughout the United States
perceive professional dress in the same manner. Fiore and Kimle (1997) reported that
geographic locations in combination with temperature can influence clothing preferences of an
individual. Traditionally, consumers on the West coast preferred a more causal relaxed look,
while consumers located on the East coast were more conservative in dress. Retailers usually
market different fashions of the same brand depending on the geographic location (Yoo, 2003),
also called geographic segmentation (Mowen & Minor, 1998). Geographic Segmentation occurs
when marketers divide up the market into groups of consumers with similar needs and wants
based on geographic location; however, based on the current study’s results, this would be a
financially problematic decision for retailers. Instead of focusing on the overall geographic

93
divisions like the North, South, East, West, and Central, retailers and marketers should focus on
the psychographics and infrastructure of individual areas. Retailers should observe the major
interstates, populations of surrounding cities, and employment statistics before assuming to
implement any product assortment for a particular niche market. Based on the survey, it is
evident that African Americans enrolled in the Mississippi schools will purchase more fashion-
oriented garments to wear to the professional workplace juxtapose, Louisiana college students
lean toward a more traditional professional appearance.
Future Research
Results of this study suggest that future research regarding the influence of reference
groups on perceptions would be beneficial in understanding why African American students
enrolled in PWI have a significant difference in perception of professional dress than African
American students enrolled in HBCU. It would be interesting to research if African American
men and women at PWI refer to their Caucasian peers or to fellow African Americans. Another
possible avenue to build upon this research is to incorporate Caucasian college students’
perception of the professional garments found in the survey.
Past research found African American females to be more fashion conscious (Gardyn &
Fetto, 2003), and have higher self-esteem levels than any other female racial group (Akan &
Grilo, 1995; Lennon, Rudd, Sloan, & Kim, 1999). It would be interesting to verify if there is a
difference between African American and Caucasian women from the same universities in terms
of fashion innovativeness and self-esteem. While the study was not focused on whether the
students would wear the professional dress, Section 4 did ask what the respondent thought was
appropriate for a professional interview. In addition, none of the subsamples perceived the suits
in Section 4 accurately. The present study did not actually test what African American female

94
college students would wear to a professional interview, however it did test their understanding
of professional dress. In the future, it would be interesting to determine what specific garments
African American men and women would actually wear themselves to a professional interview.
Limitations
The current research has the following limitations:
1. Due to time and financial restraints only four universities in two southern states were
surveyed. In addition, the researcher relied on contact persons from PWI to administer
the survey to their minority student organization during a regularly scheduled meeting.
2. Depending on which university surveyed, the sample of college students was limited to
the class or the minority student organization that the researcher had permission to
survey.
3. The researcher’s racial identity (Caucasian) may have hindered the willingness and
objectivity of African American participants.
4. It could be assumed that not all participants were aware of the meaning of the fashion-
oriented garments listed in Section 3.1 and 3.2.
5. The results cannot be generalized to all African American college students living in the
southern portion of the United States.

95
REFERENCES
Akan, G. E., & Grilo, C. M. (1995). Sociocultural influences on eating attitudes and
behaviors, body image, and psychological functioning: A comparison of African-
American, Asian-American, and Caucasian college women. International Journal of
Eating Disorders, 18(2), 181-187.
Alexis, M. (1962). Some negro-white differences in consumption. American Journal of
Economics and Sociology, 21, 11-28.
Allen, R. L. (2001). The concept of self: A study of black identity and self-esteem.
Detroit: Wayne State University Press.
Antonio, A. L. (2004). The influence of friendship groups on intellectual self-
confidence and educational aspirations in college. The Journal of Higher Education,
75(4), 446-471.
Ausubel, D. P. (1958). Ego development among segregated negro children. Mental
Hygiene, 42, 362-369.
Bachman, J. G. (1970). Youth in transition, Volume II: The Impact of family
background and intelligence on tenth-grade boys. Ann Arbor, Michigan: Survey
Research Center, Institute for Social Research.
Ball State University Career Center. (2003). Dressing for professional success. Retrieved
October 13, 2005, from Ball State University, Career Center Web site:
http://www.bsu.edu.students.careers/media/pdf/thejobsearch.pdf.
Bauer, R. A., Cunningham, S. M., & Wortzel, L.H. (1965). The Marketing dilemma of
negroes. Journal of Marketing, 29, 1-6.
Baumgarten, S. A. (1975). The innovative communicator in the diffusion process.
96
Journal of Marketing Research, 12(1), 12-18.
Behling, D. (1995). Influence of dress on perception of intelligence and scholastic
achievement in urban schools with minority populations. Clothing and Textiles Research
Journal, 13(1), 11-16.
Biemer, P. P., & Lyberg, L. E. (2003). Introduction to survey quality. Hoboken, NJ: John Wiley
& Sons, Inc.
Bixler, S. (1997). The new professional image. Holbrook, MA: Adams Media
Corporation.
Blascovich, J., & Tomaka, J. (1991). Measures of self-esteem. In J. P. Robinson, P. R.
Shaver, & L. S. Wrightsman (Eds.), Measures of personality and social psychological
attitudes. Volume I. San Diego, CA: Academic Press.
Burns, L. D., & Lennon, S. J. (1993). Effect of clothing on the use of person information
categories in first impressions. Clothing and Textiles Research Journal,
12(1), 9-15.
Cash, T. (1985). The impact of grooming style on the evaluation of women in
management. In M. R. Solomon (Ed.), Psychology of Fashion. (pp. 343-355). Lexington,
KY: D.C. Health Company.
Child, E. (1968). Aesthetics. In D. Stills (Ed.), International encyclopedia of the social
sciences Vol1. (pp. 116-121). New York: MacMillian Company.
Cholachatpinyo, A., Padgett, I., Crocker, M., & Fletcher, B. (2002). A Conceptual model
of the fashion process part two: An Empirical investigation of the micro-subjective level.
Journal of Fashion Marketing and Management, 6(1). 24-34.
Chowdhary, U., & Dickey, L. E. (1988). Fashion opinion leadership and media exposure among

97
college women in India. Home Economics Research Journal, 16, 183-194.
Clarke, S. L., & Weismantle, M. (Aug, 2003). Employment status: 2000 brief. U.S. Census
Bureau. Retrieved January 9, 2006, from
http://www.census.gov/prod/2003pubs/c2kbr-18.pdf.
Cleveland, R. W. (June, 2003). Current population reports: Alternative income estimates
in the United States: 2003. U.S. Census Bureau.. Retrieved January 9, 2006, from
http://www.census.gov/prod/2005pubs/p60-228.pdf
Crocker, J., & Luhtanen, R. (1990). Collective self-esteem and ingroup bias. Journal
of Personality and Social Psychology, 58, 60-67.
Crocker, J., & Luhtanen, R. (June 2003). Level of self-esteem and contingencies of self-
worth: unique effects on academic, social, and financial problems in college students.
Personality and Social Psychology Bulletin, 29(6), 701-712.
Crocker, J., & Major, B. (1989). Social stigma and self-esteem: The Self protective
properties of stigma. Psychological Review, 94, 608-630.
Cross, W. E. (1991). Shades of black: Diversity in African American identity.
Philadelphia: Temple University Press.
Damhorst, M. L. (1984-85). Meanings of clothing cues in social context. Clothing and
Textiles Research Journal, 3(2), 39-48.
Damhorst, M. L. (1990). In search of a common thread: Classification of information
communicated through dress. Clothing and Textiles Research Journal, 8(2), 1-12.
Damhorst, M. L., Jondle, K., & Youngberg, C. (2002). How personnel interviewers see
women’s job interview dress, A 2002 update. In M. L. Damhorst, K. A. Miller, & S. O.
Michelman (Eds.), The Meanings of Dress. New York: Fairchild Publications

98
Damhorst, M. L., & Reed, A. P. (1986). Clothing color value and facial expression
effects on evaluations of female job applicants. Social behavior and Personality, 14, 89-
98.
Darden, W. R., & Reynolds, F. D. (1974). Backward profiling of male innovators.
Journal of Marketing Research, 11, 79-85.
Davis, L. L. (1987). Fashion innovativeness, fashion opinion leadership and
purchasing involvement. ACPTC Combined Proceedings (pp.128). Association of
College Professors of Textiles and Clothing, Monument, CO.
DeSousa, D. J., & Kuh, G. D. (1996). Does institutional racial composition make a
difference in what Black students gain from college? Journal of College Student
Development, 37, 259-267.
Doran, K. B. (1994). Exploring cultural differences in consumer decision making:
Chinese consumers. In C. Allen & D. R. John (Eds.), Advances in Consumer Research
(Vol. 21, pp. 318-322). Provo, UT: Association for Consumer Research.
Dortch, S. (April, 1994). The Earnings gap in black and white. American Demographics,
16(4), 18.
Dovidio, J. F., & Gaertner, S. L. (2000). Aversive racism and selection decisions: 1989-
1999. Psychological Science, 11, 315-319.
Drury, D. W. (1980). Black self-esteem and desegregated schools. Sociology
of Education, 53, 88-103
DuBois, W. E. B. (2005). Souls of black folk. New York: Pocket Classics. (Original work
published 1898).
Eagan McAllister Associates. (2005). Small business connections (n.d.). Glossary of

99
Federal Acquisition Regulation (FAR) terms used throughout EMA's Procurement Policy
& Subcontracting Plans. Retrieved February 5, 2006, from
http://www.emainc.com/connections/smallglossary.asp
Eicher, J. B. (1995). Dress and Ethnicity. Oxford and Washington, DC: Berg.
Faludi, S. (1991). Backlash: The Undeclared war against American women. New York:
Crown Publishers.
Feinberg, R. A., Mataro, L. & Burroughs, W. J. (1992). Clothing and social identity.
Clothing and Textile Research Journal, 11(1), 18-23.
Felder, C. H., (2005). KJV The original African heritage study bible. NY: World Publishing.
Feldman, K. A., & Newcomb, T. M. (1969). The Impact of college on students. San
Francisco: Jossey-Bass.
Festinger, L. (1954). A theory of social comparison processes. Human Relations, 7, 117-
140.
Fisher, C. (1993, February 15). Poll: Hispanics stick to brands. Advertising Age, 6.
Fisher, C. (1996). Black, hip, and primed to shop. American Demographics, 18(9), 52-
59.
Fiore, A. M., & Kimle, P. A. (1997). Understanding aesthetics for the merchandising
and design professional. New York: Fairchild
Form, W. H. & Stone, G. P. (1955). The Social significance of clothing in occupational
life. Technical Bulletin, 247. East Lansing: Michigan State College Agricultural
Experiment Station.
Forsythe, S. (1988). Effect of clothing masculinity on perceptions of managerial traits:
100
Does gender of the perceiver make a difference? Clothing and Textiles research Journal.
6, 10-16.
Forsythe, S., Butler, S., & Kim, M. S. (1991). Fashion adoption: Theory and
pragmatics. Clothing and Textile Research Journal, 9, 8-15.
Forsythe, S., Drake, M., & Cox, C. A. (1984). Dress as an influence on the
perceptions of management characteristics in women. Home Economics Research
Journal, 13(2), 112-121.
Franklin, A. (2001). Black women and self-presentation. In A. Guy, E. Green, & M.
Banim (Eds.), Through the wardrobe: Women’s relationships with their clothes (pp.137-
150). New York: Berg Publishing.
Franz, T. M., & Norton, S. D. (2001). Investing business casual dress policies:
Questionnaire development and exploratory research. Applied HRM Research, 6(2), 79-
94.
Frazier, E. F. (1957). Black bourgeoisie. New York: Free Press.
Frey, W. H. (2003). Revival. American Demographics, 25(8), 26-31.
Gardyn, R., & Fetto, J. (May, 2002). Dress Code. American Demographics, 24(5), 13.
Gardyn, R., & Fetto, J. (February, 2003). Race, ethnicity and the way we shop. American
Demographics, 25(1), 30.
Glazer, B. G., & Strauss, A. L. (1968). The Discovery of grounded theory: Strategies for
qualitative research. Chicago: Aldine Publishing Co.
Glazer, N., & Moynihan, D. P. (1963). Beyond the melting pot. Cambridge: M.I.T. Press.
Goldsmith, R. E., Flynn, L. R., & Moore, M. A. (1996). The Self-concept of fashion
leaders. Clothing and Textile Research Journal, 14(4), 242-248.

101
Goldsmith, R. E., Stith, M. T., & White, J. D. (1987). Race and sex differences in self-
identified innovativeness and opinion leadership. Journal of Retailing, 63(4), 411 425.
Good looks, good food. (2002). American Demographics, 24(10), S6.
Greenbaum, T. L. (2000). Moderating focus groups: A Practical guide for group
facilitation. Thousand Oaks, California: Sage Publications, Inc.
Guiffrida, D. A. (2003). African American student organizations as agents of social
integration. Journal of College Student Development, 44(3), 304-319.
Hacker, A. (1995). Two nations: Black and White, separate, hostile, unequal. New
York: Ballantine Books.
Hamilton, J. A. (1993). Dress and the dynamics of culture: Implications for theory,
method, and content. In S. J. Lennon & L. D. Burns (Eds.), Social science aspects of
dress: New directions (pp. 48-56). Monument, CO: ITAA.
Hemmons, W. M. (1996). Black women in the new world order: Social justice and the
African American female. Connecticut: Praeger Publishing.
Holloman, L. O. (Winter 1997). Catalog retailing that targets African Americans.
Journal of Family and Consumer Sciences, 13-19.
Holt, T. C. (1995). Marking: Race, race-making, and the writing of history. American
Historical Review, 100, 1-20.
Hood, M. (1993). Colors that complement. The Columbus Dispatch, (pp. C 1-2).
Hyman, H. H. (1942). The psychology of status. Archives of Psychology, No. 269.
Hyman, H. H., & Singer, E. (1968). Introduction. In H. H. Hyman, & E. Singer (Eds.),
Readings in reference group theory and research (pp. 3-22). New York: The Free Press.
Jackson, J. S., McCullough, W. R., Gurin, G., & Broman, C. L. (1981). Group identity

102
development within Black families. In H. P. McAdoo (Ed.), Black Families. (pp.253-
263). Newbury Park, GA: Sage.
Johnson, K. K. P., Crutsinger, C., & Workman, J. E. (Winter, 1994). Can professional
women appear too masculine? The case of the necktie. Clothing and Textile Research
Journal, 12(2), 27-31.
Johnson, K., & Roach-Higgins, M. (1987). Dress and physical attractiveness of
women in job interviews. Clothing and Textiles Research Journal, 5, 1-8.
Johnson, K. K. P., Schofield, N. A., & Yurchinsin, J. (2002). Appearances and dress as a
source of information: A Qualitative approach to data collection. Clothing and
Textiles Research Journal, 20(3), 125-137.
Johnson-Elie, T. (December 1, 2004). Attire matters hip-hop fashions don’t always
translate in the workplace. Milwaukee Journal Sentinel, (Business p.1).
Kaiser, S. B. (1990). The Social psychology of clothing: Symbolic appearances in
context. New York: Macmillan.
Kaiser, S. B., Nagasawa, R. H., & Hutton, S. S. (1991). Fashion, postmodernity and
personal appearance: A Symbolic interactionist formulation. Symbolic Interaction, 142,
165-185.
Kaiser, S. B. (1997). The Social psychology of clothing: Symbolic appearances in
context. NY: Fairchild Publications.
Kaiser, S., Rabine, L., Hall, C., & Ketchum, K. (2004). Beyond binaries: Respecting the
improvisation in African-American style. In Tulloch (Ed.), Black Style. (p. 48-67).
London: V & A Publications.
Kate, N. T. (1998). Lose the suit. American Demographics, 20(4), 31-32.

103
Kimble, P. A., & Damhorst, M. L. (1997). A Grounded theory model of the ideal business
image for women. Symbolic Interaction, 20(1), 45-68.
Kochman, T. (1981). Black and White styles in conflict. Chicago: The University of
Chicago Press.
Krueger, R. A., & Casey, M. A. (2000). Focus groups: A Practical guide for applied
research. Thousand Oaks, California: Sage Publications, Inc.
Kuhnert, K. (Spring 2005). Organizational psychology lecture.
Kwon, Y. H. (1994). The Influence of appropriateness of dress and gender on the self-
perception of occupational attributes. Clothing and Textiles Research Journal, 12(3), 33-
39.
Kwon, Y. H., & Workman, J. E. (1996). Relationship of optimum stimulation level
to fashion behavior. Clothing and Textiles Research Journal, 14(4) 249-256.
Lavin, M. (1996). Ethnic/ racial segmentation: Insights from theory and practice. Journal
of Retailing and Consumer Services. 3(2), 99-105.
Lee, G. (2005, August 23) African American woman lament lack of fashion choices.
Women’s Wear Daily, (pp. 10-11).
Lennon, S. J., & Miller, F. G. (1984-85). Attire, physical appearance, and first
impressions: More is less. Clothing and Textiles Research Journal, 3, 1-8.
Lennon, S. J., Rudd, N. A., Sloan, B., & Dim, J. S. (1999). Attitudes toward gender roles,
self-esteem, and body image: Application of a model. Clothing and Textiles
Research Journal, 17(4), 191-202.
Levin, K. (1948). Resolving social conflicts. New York: Harper.
Lewis, D. L. (1993). W. E. B. DuBois: Biography of a race. New York: Henry Holt.

104
Liebman, M. M. (1987). A Conceptual framework for examining color preferences,
Importance, and categorization in a multiattribute context among blacks. In R. L. King
(Ed.), Minority Marketing: Issues and Prospects. (pp.57-63). Charleston: Academy of
Marketing Sciences.
Lipsitz, G. (1998). The Possessive investment in whiteness: How people profit from
identity politics. Philadelphia: Temple University Press.
Louisiana State University Career Services. (2006). Career services: opens a world of
opportunity, Dress for the interview. Retrieved February 5, 2006 from
http://appl003.lsu.edu/slas/career/cstudentsweb.nsf/index
Lynn, R., & Mau, W. (2002). Why do black American males earn less than black
American women? An examination of four hypotheses. The Journal of Social, Political,
and Economic Studies, 27(3), 307-313.
Macguire, T. (Dec 1998). Ethnics outspend in areas. American Demographics. 1, 1.
Malhotra, N. (1988). Self concept and product choice: An integrated perspective.
Journal of Economic Psychology, 9, 1-28.
Marbley, A. F. (2003). Hey there Ms. Jones!: A Qualitative study of professional
African American males’ perceptions of the selection of African American females as
partners. Journal of African American Studies, 7(3), 15-30.
Martin, J. N., Krizek, R. L., Nakayama, T. L., & Bradford, L. (1999). What do white
people want to be called? In T. K. Nakayama & J. N. Martin (Eds.), Whiteness: The
Communication of social identity (pp.27-50). Thousand Oaks, CA: Sage.
McCracken, G. (1988). Culture and consumption. Bloomington: Indiana University
Press.

105
McLeod, H. (1999). Business casual dress: An African American male perspective. In
Damhorst, Miller, & Michelman (Eds.), The Meanings of dress (pp. 272-274). New York:
Fairchild Publications.
Miller, C. (1993, May 10). Researchers say U.S. is more of a bowl than a pot. Marketing
News, 6.
Miller, K. A. (1997). Dress: Private and secret self expression. Clothing and Textiles
Research Journal, 15(4), 223-234.
Miller, K. A. (1999). Dress in the workplace. In Damhorst, Miller & Michelman (Eds.),
The Meanings of dress. (pp. 238-245). New York: Fairchild Publications.
Mississippi State University Career Center. (2005, October 12). Career Center
Handbook, “Everything you need to know,” Dress for success. Retrieved February 5,
2006, from http://www.career.msstate.edu/students/handbook/contents.php
Mississippi State Office of Institutional Research Site Index. (Fall, 2005). Retrieved May
17, 2006, from http://www.msstate.edu/dept/oir/oir_site_index.htm
Molloy, J. T. (1975). Dress for success. New York: Peter H. Wyden Publisher.
Molloy, J. T. (1996). New women’s dress for success. New York: Warner Books.
Mowen, J. C. & Minor, M. (1998). Consumer Behavior. New Jersey: Prentice-
Hall.
Myeres, L. J. (1993). The African American aesthetic as optimal consciousness. In
Welsh-Asante (Ed.), The African aesthetic: Keeper of the traditions (pp. 21-29).
Westport: Greenwood Press.
National Association of State Universities and Land Grant Colleges. (1999). The land-

106
grant tradition: What is a land-grant college? Retrieved February 5, 2006, from
http://www.nasulgc.org/publications/land_grant/land.htm.
Nobles, W. (1980). African philosophy: Foundations for black psychology. In R. L.
Jones (Ed.), Black Psychology (pp. 23-36). New York: Harper and Row Publishers.
O’Neal, G. S. (1994). African American aesthetic of dress: symmetry through
diversity. International Textile and Apparel Association Special Publication, 7, 212-223.
O’Neal, G. S. (Spring, 1998). African American women’s professional dress as
expression of ethnicity. Journal of Family and Consumer Sciences, 28-33.
Padilla, R. V., Trevino, J., Gonzalez, K., & Trvino, J. (1997). Developing local models of
minority student success. Journal of College Student Development, 38, 125-135.
Pharr, S. (1988). Homophobia: A weapon of sexism. The Common element of
oppressions. 53-64. Little Rock, AR: Chardon.
Phinney, J. (1990). Ethnic identity in adolescents and adults; Review of research.
Psychological Bulletin, 108, 499-514.
Phinney, J. S., Cantu, C. L., & Kurtz, D. A. (1997). Ethnic and American identity as
predictors of self-esteem among African American, Latino, and White adolescents.
Journal of Youth and Adolescence, 26(2), 165-185.
Porter, J. R., & Washington, R. E. (1979). Black identity and self-esteem: A review of studies of
black self-concept, 1968-1978. Annual Review of Sociology, 5, 53-74.
Portis, B. (1966). Negroes and fashion interest. Journal of Business, 39, 314-323.
Power-dressing for professionals: Corporate, causal and chic. (January 2005). Ebony,
(Beauty & Style; p.90)
Pratt, M. G., & Rafaeli, A. (1997). Organizational dress as a symbol of multilayerd

107
social identities. Academy of Management Journal, 40, 862-898.
Proshansky, H., & Newton, P. (1968). The nature and meaning of negro self-identity. In
M. Deutsch, B. Katz, & A. Jensen (Eds.), Social class, race and psychological
development. (pp. 178-218). New York: Holt, Rinehart, Winston.
Rafaeli, A., Dutton, J., Harquail, C., & Mackie-Lewis, C. (1997). Navigating by attire:
The use of dress by female employees. Academy of Management Journal, 40(1), 9-45.
Roach-Higgins, M. E., & Eicher, J. B. (1992). Dress and identity. Clothing and Textiles
Research Journal, 10(4), 1-8.
Robins, R. W., Hendin, H. M., & Trzesniewski, K. H. (2001). Measuring global self-
esteem: Construct validation of single item measure and the Rosenberg self-esteem scale.
Personality and Social Psychology Bulletin, 27(2), 151-161.
Robbins, S. P. (2005). Essentials of organizational behavior. New Jersey:
Prentice Hall.
Rogers, E. M., (1983). Diffusion of innovations. New York: The Free Press.
Rosenberg, M. (1989). Society and the adolescent self-image. Revised edition. Middletown,
CT: Wesleyan University Press.
Rosenberg, M., & Simmons, R .G. (1972). Black and white self-esteem: the Urban
school child. Washington, D. C.: Rose Monograph Series.
Rudd, N. A., & Lennon, S. J. (1994). Aesthetics of the body and social identity theory.
In M. DeLong & A. M. Fiore (Eds.), Aesthetics of textiles and clothing: Advancing
multidisciplinary perspectives. (pp. 163-175). Monument, Co: ITAA.
Russell, A., & Reynolds, R. (May, 1992). Fine-tuning your corporate image. Black
Enterprise, 22(10), 72.

108
Ryan, C. L. (Sept, 2005). What it’s worth: Field of training and economic status in
2001. U. S. Census Bureau. (pp. 1-16). Retrieved January 9, 2006, from
http://www.census.gov/prod/2005pubs/p70-98.pdf.
Schneider, A. (1998). Frumpy or chic? Tweed or kente? Sometimes clothes make the
professor. The Chronicle of Higher Education, A, 12-14.
Schneider, B. (1973). The perception of organizational climate: The customer’s view. Journal of
Applied Psychology. 57, 248-256.
Seckler, V. (2005, September 21). Why college students keep spending more.
Women’s Wear Daily, 10.
Semmes, C. E. (1992). Cultural hegemony and African American development.
Westport, Connecticut: Praeger.
Selig Center for Economic Growth. (2002). The Multicultural economy 2002: Minority
buying power in the new century. Georgia Business and Economic Conditions, 62(2), 10.
Shibutani, T. (1968). Reference groups as perspectives. In H. H. Hyman, and E. Singer
(Eds.), Readings in reference group theory and research (pp. 103-113).
New York: The Free Press.
Snyder, G. (2004, October 1). At your service. Stitches Magazine, (p.11).
Solomon, M. R., & Douglas, S. P. (1985). The female Clotheshorse: From aesthetics to
tactics. In M. R. Solomon (Ed.), The psychology of fashion. (pp. 387-401). Lexington,
MA: C. C. Health.
Solomon, M. R. (1994). Consumer behavior: Buying, having, and being (2nd Ed.). Boston:
Allyn and Bacon.
Solomon, M. R. & Douglas, S. P. (1987). Diversity in product symbolism: The Case of

109
female executive clothing. Psychology and Marketing, 4, 198-212.
Southern University Systems and A&M College Career Services. (2005). Dressing For
Success. Retrieved February 5, 2006, from
http://www.subr.edu/careerservices/dressing_for_success.htm
Southern University Systems and A&M Office of Budget and Planning. (Spring, 2006). Fact
Book. Retrieved February 5, 2006, from http://www.subr.edu/pair/factbook.htm
Sproles, G. B. & Burns, L. S. (1994). Changing appearances: Understanding dress in
contemporary society. New York: Fairchild Publications.
Sundquist, E. J. (1993). To wake the nations: Race in the making of American
literature. London: Harvard University Press.
Studak, C. M. & Workman, J. E. (2004). Fashion groups, gender, and boredom
proneness. International Journal of Consumer Studies. 28(1), 66-74.
Swindel, W. (1993). Aesthetics and African American musical expression. In Welsh-
Asante (Ed.), The African aesthetic: Keeper of the traditions (pp.175-194) Westport:
Greenwood Press.
Tajfel, H. (1981). Human groups and social categories : studies in social psychology.
New York: Cambridge University Press.
Tinto, V. (1993). Leaving college: Rethinking the causes and cures of student
attrition. Chicago: The University of Chicago Press.
Thomas, K. M. (2005). Diversity dynamics in the workplace. Canada: Wadsworth
Thurston, J., Lennon, S., & Clayton, R. (1990). Influences of age, body type,
fashion and garment type on women’s professional image. Home Economics Research
Journal, 19(2), 139-150.

110
United States Census Bureau. (2000). FactFinder. Retrieved December, 4, 2005, from
http://www.census.gov
University of Maryland. (November, 2005). The Rosenberg self-esteem scale. Retrieved
February 5, 2006, from http://www.bsos.umd.edu/socy/grad/socpsy_rosenberg.html
Walker, M. (2003, May 1). The last frontier: Minority markets. Retail Traffic. Retrieved July
14, 2006, from
http://www.retailtrafficmag.com/mag/retail_last_frontier_minority/index.html.
Walker, S. (2001). Black is profitable: The commodification of the afro, 1960-1975. In
Scranton (Ed.), Beauty and business: commerce, gender, and culture in modern America
(pp. 254-277). New York: Routledge
Warren, K. T., Orbe, M. P., & Greer-Williams, N. (2003). Perceiving conflict:
Similarities and differences between and among Latino/as, African Americans,
and European Americans. In D. I. Rios & Mohamed, A. N. (Eds.), Brown and
black communication: Latino and African American conflict and convergence in
mass media. Westport, Connecticut: Praeger Publishers.
Watkins, P. G. (1996). Women in the work force in non-traditional jobs. In P.
M. Lester (Eds.), Images that injure: Pictorial stereotypes in the media
(pp. 69-74). Connecticut: Praeger Publications.
White, S., & White, G. (1998). Stylin’: African American expressive culture from its
beginnings to the zoot suit. Ithaca: Cornell University Press.
Whiteside-Mansell, L., & Corwyn, R. F. (2003). Mean and covariance structures
analyses: An examination of the Rosenberg self-esteem scale among adolescents and
adults. Educational and Psychological Measurement, 63 (1), 163-173.
111
Willhelm, S. M. (1971). Who needs the negro? Garden City, NY: Doubleday.
Williams, J., Arbaugh, J., & Rucker, M. (1980). Clothing color preferences of adolescent
females. Home Economics Research Journal, 9, 57-63.
Workman, J. E., & Johnson, K. K. P. (1989). The Role of clothing in extended
inferences. Home Economics Research Journal, 18(2), 164-169.
Workman, J. E., & Kidd, L. K. (2000). Use of the need for uniqueness scale to
characterize fashion consumer groups. Clothing and Textiles Research Journal, 18(4),
227-235.
Yoo, S. (2003). Design elements and consumer characteristics relating to design
preferences of working females. Clothing and Textiles Research Journal, 21(2), 49-62.
112
APPENDICES
APPENDIX A
RESEARCH SURVEY
University of Georgia
presents
African American College Students’ Perceptions of Professional Dress

113
(APPENDIX A continued)
Section 1
1.1 Below is a list of statements dealing with your general feelings about yourself. If you STRONGLY AGREE, circle SA. If you AGREE with the statement, circle A. If you DISAGREE, circle D. If you STRONGLY DISAGREE, circle SD.
Strongly Agree Disagree Strongly Agree Disagree
1. I feel that I’m a person of worth, at SA A D SDleast on an equal plane with others.
2. I feel that I have a number of good SA A D SDqualities.
3. All in all, I am inclined to feel that I SA A D SDam a failure.
4. I am able to do things as well as most SA A D SDother people.
5. I feel I do not have much to be proud of. SA A D SD
6. I take a positive attitude toward myself. SA A D SD
7. On the whole, I am satisfied with myself. SA A D SD
8. I wish I could have more respect for SA A D SDmyself.
9. I certainly feel useless at times. SA A D SD
10. At times I think I am no good at all. SA A D SD

114
(APPENDIX A continued)
Section 2
2.1 These eight items ask how innovative you are or whether you are one of those consumers who is the first to buy a new item when it appears in the marketplace. Please respond by circling the letter(s) that describes whether you agree or disagree with each statement.
Strongly Agree Disagree Strongly Agree Disagree
1. My friends and neighbors often ask SA A D SDmy advice about clothing fashions.
2. I feel that I am generally regarded SA A D SDby my friends and neighbors as a goodsource of advice about clothing fashions.
3. My friends come to me more than often SA A D SDthan I go to them for advice about clothes.
4. I sometimes influence the types of SA A D SDclothes my friends buy.
5. I can think of at least two people whom SA A D SD I have told about some clothing fashion in the last 6 months.
6. I am the first to try new fashions; SA A D SD therefore, many people regard me as being a fashion leader.
7. I am aware of fashion trends and want SA A D SD to be one of the first to try them.
8. I am confident in my ability to recognize SA A D SDfashion trends.

115
(APPENDIX A continued)
2.2 These five items ask how important it is to you to be well dressed or whether you are one of those consumers who believe clothing expresses who you are. Please respond by circling the letter(s) that describes whether you agree or disagree with each statement.
Strongly Agree Disagree Strongly Agree Disagree
1. If you want to get ahead you have SA A D SDto dress the part.
2. It is important to be well dressed. SA A D SD
3. What you think of yourself is SA A D SDreflected by what you wear.
4. Wearing good clothes is part of SA A D SDleading a good life.
5. Clothes are one of the most important SA A D SD ways I have of expressing my individuality.
Section 3
3.1 Below is a list of garments found on women in the workplace. Beside each female garmentplease indicate if you think the clothing is considered Traditional Professional Dress, orFashion-Oriented Dress. If you believe the garment is considered Traditional Professional Dress, circle a number from the far left side of the scale. If you feel the garment is Fashion-Oriented Dress, circle a number on the far right, and if you feel the appropriateness of the garment falls between these extremes, circle a number in the middle of the scale to show your opinion.
Traditional Fashion- Professional Neither Oriented
Dress Dress
1. Suits with skirts 1 2 3 4 52. Suits with pleated skirts 1 2 3 4 53. Suits with embroidered jackets 1 2 3 4 5 4. Suits buttoned to the neck 1 2 3 4 55. Suits with medium size prints 1 2 3 4 56. Suits with jacket hem above waist 1 2 3 4 57. Plaid suits with skirts 1 2 3 4 5
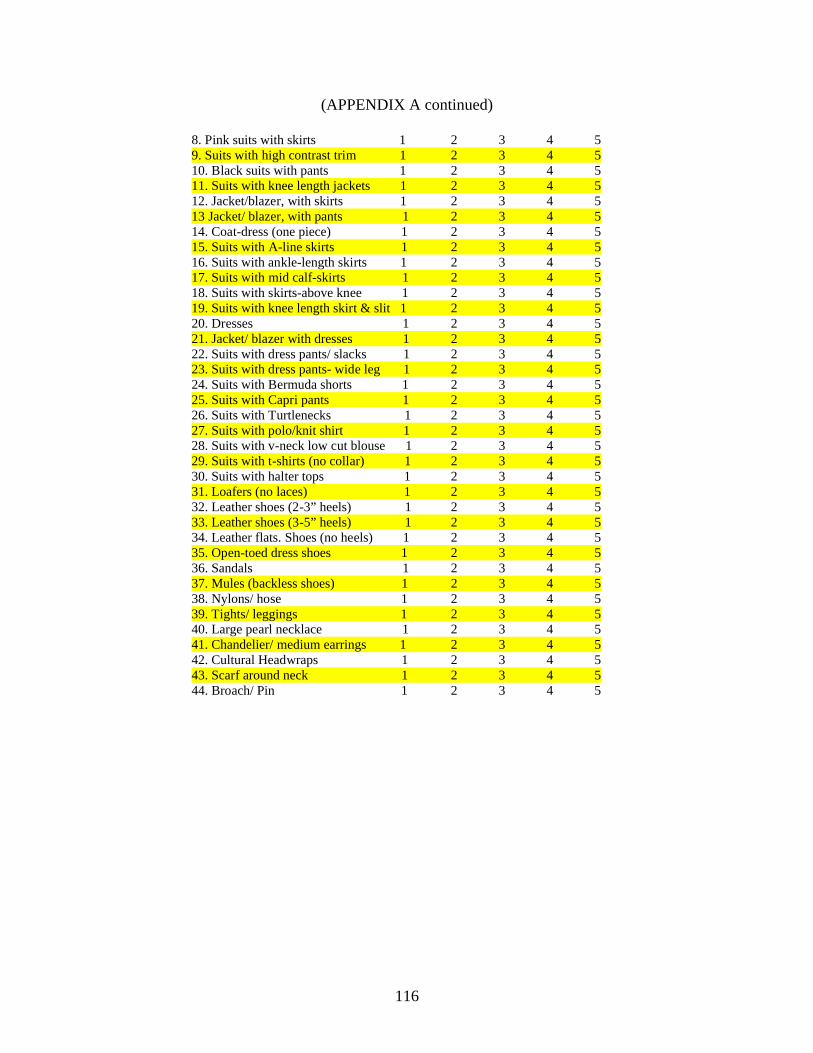
116
(APPENDIX A continued)
8. Pink suits with skirts 1 2 3 4 59. Suits with high contrast trim 1 2 3 4 510. Black suits with pants 1 2 3 4 511. Suits with knee length jackets 1 2 3 4 512. Jacket/blazer, with skirts 1 2 3 4 513 Jacket/ blazer, with pants 1 2 3 4 514. Coat-dress (one piece) 1 2 3 4 515. Suits with A-line skirts 1 2 3 4 516. Suits with ankle-length skirts 1 2 3 4 517. Suits with mid calf-skirts 1 2 3 4 518. Suits with skirts-above knee 1 2 3 4 519. Suits with knee length skirt & slit 1 2 3 4 520. Dresses 1 2 3 4 521. Jacket/ blazer with dresses 1 2 3 4 522. Suits with dress pants/ slacks 1 2 3 4 523. Suits with dress pants- wide leg 1 2 3 4 524. Suits with Bermuda shorts 1 2 3 4 525. Suits with Capri pants 1 2 3 4 526. Suits with Turtlenecks 1 2 3 4 527. Suits with polo/knit shirt 1 2 3 4 528. Suits with v-neck low cut blouse 1 2 3 4 529. Suits with t-shirts (no collar) 1 2 3 4 530. Suits with halter tops 1 2 3 4 531. Loafers (no laces) 1 2 3 4 532. Leather shoes (2-3” heels) 1 2 3 4 533. Leather shoes (3-5” heels) 1 2 3 4 534. Leather flats. Shoes (no heels) 1 2 3 4 535. Open-toed dress shoes 1 2 3 4 536. Sandals 1 2 3 4 537. Mules (backless shoes) 1 2 3 4 538. Nylons/ hose 1 2 3 4 539. Tights/ leggings 1 2 3 4 540. Large pearl necklace 1 2 3 4 541. Chandelier/ medium earrings 1 2 3 4 542. Cultural Headwraps 1 2 3 4 543. Scarf around neck 1 2 3 4 544. Broach/ Pin 1 2 3 4 5
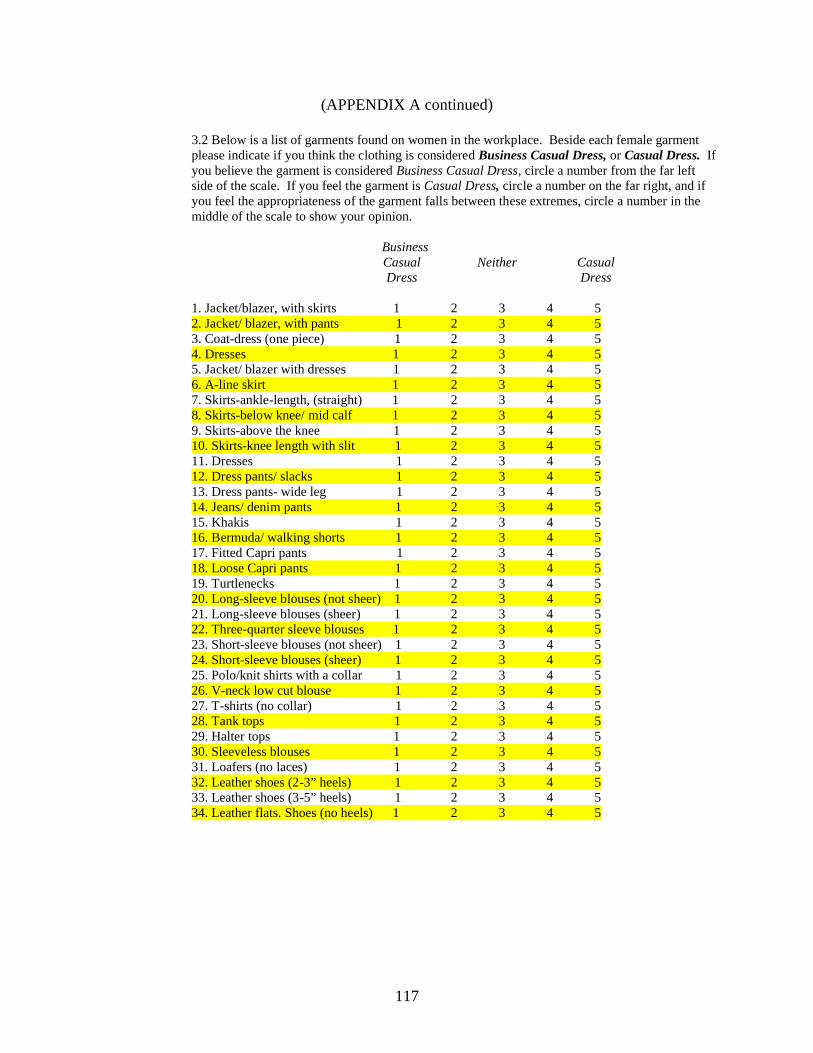
117
(APPENDIX A continued)
3.2 Below is a list of garments found on women in the workplace. Beside each female garment please indicate if you think the clothing is considered Business Casual Dress, or Casual Dress. If you believe the garment is considered Business Casual Dress, circle a number from the far left side of the scale. If you feel the garment is Casual Dress, circle a number on the far right, and if you feel the appropriateness of the garment falls between these extremes, circle a number in the middle of the scale to show your opinion.
Business Casual Neither Casual
Dress Dress
1. Jacket/blazer, with skirts 1 2 3 4 52. Jacket/ blazer, with pants 1 2 3 4 53. Coat-dress (one piece) 1 2 3 4 54. Dresses 1 2 3 4 55. Jacket/ blazer with dresses 1 2 3 4 56. A-line skirt 1 2 3 4 57. Skirts-ankle-length, (straight) 1 2 3 4 58. Skirts-below knee/ mid calf 1 2 3 4 59. Skirts-above the knee 1 2 3 4 510. Skirts-knee length with slit 1 2 3 4 5 11. Dresses 1 2 3 4 512. Dress pants/ slacks 1 2 3 4 513. Dress pants- wide leg 1 2 3 4 514. Jeans/ denim pants 1 2 3 4 515. Khakis 1 2 3 4 516. Bermuda/ walking shorts 1 2 3 4 517. Fitted Capri pants 1 2 3 4 518. Loose Capri pants 1 2 3 4 519. Turtlenecks 1 2 3 4 520. Long-sleeve blouses (not sheer) 1 2 3 4 521. Long-sleeve blouses (sheer) 1 2 3 4 522. Three-quarter sleeve blouses 1 2 3 4 523. Short-sleeve blouses (not sheer) 1 2 3 4 524. Short-sleeve blouses (sheer) 1 2 3 4 525. Polo/knit shirts with a collar 1 2 3 4 526. V-neck low cut blouse 1 2 3 4 527. T-shirts (no collar) 1 2 3 4 528. Tank tops 1 2 3 4 529. Halter tops 1 2 3 4 530. Sleeveless blouses 1 2 3 4 531. Loafers (no laces) 1 2 3 4 532. Leather shoes (2-3” heels) 1 2 3 4 533. Leather shoes (3-5” heels) 1 2 3 4 534. Leather flats. Shoes (no heels) 1 2 3 4 5

118
(APPENDIX A continued)
35. Open-toed dress shoes 1 2 3 4 536. Rubber soled shoes/ loafers 1 2 3 4 537. Sandals 1 2 3 4 538. Mules (backless shoes) 1 2 3 4 539. Canvas shoes 1 2 3 4 540. Athletic shoes 1 2 3 4 541. Nylons/ hose 1 2 3 4 542. Tights/ leggings 1 2 3 4 543. White athletic socks 1 2 3 4 544. Large necklace 1 2 3 4 545. Chandelier/medium earrings 1 2 3 4 546. Cultural Headwrap 1 2 3 4 5
Section 4
4.1 On the insert are six pictures of women’s professional clothing found in the workplace. Please indicate if you think pictures 1-6 are appropriate for a middle management employment interview as an Executive Assistant in a Law firm or Accounting firm. Circle one if you believe the suit is Absolute Appropriate; circle five if you believe the suit is Most Inappropriate. If you feel the appropriateness of the garment falls between these extremes, circle a number in the middle of the scale to show your opinion.
Absolute Maybe MostPICTURE Appropriate Inappropriate
One 1 2 3 4 5Two 1 2 3 4 5 Three 1 2 3 4 5Four 1 2 3 4 5Five 1 2 3 4 5Six 1 2 3 4 5

119
(APPENDIX A continued)
1 2 3
4 5 6

120
(APPENDIX A continued)
Section 5
Please indicate the demographic characteristics that describe you best.
5.1 Age under 18 18 – 24 25 – 30
5.2 Sex Female Male
5.3 Race Black White Other
5.4 Current education level Freshman
Sophomore Junior Senior Graduate
5.5 College Major
5.6 List the student organizations that you are a member of

121
APPENDIX B
FOCUS GROUP QUESTIONS
1. Do you feel that retailers market merchandise to African Americans?2. Do you feel you are expected to copy and appropriate consumer goods which have been considered
beautiful or fashionable by someone else?3. Do you consider yourself a fashion leader or fashion follower?4. If you consider yourself a fashion leader what are your motivations for dressing in a forward fashion?5. Do you preferred to be called Black, African American, Person of Color or other?6. How do stereotypes affect your life and your fashion choices?7. Are you aware of Code switching? Do you now anyone who does this?8. What do you consider traditional professional dress?9. Do you think Black men are more innovative in clothing than White men?10. Do you feel your aesthetic of dress comes from mainstream White American or some other avenue?11. Do you incorporate fashion items in your interview dress?12. Are you a member in a minority organization?13. Do you get your fashion advice from these groups?14. What is your opinion of casual workdays?15. What is your opinion of appropriate dress for causal workdays?16. As a Black man or woman, how do you negotiate clothing and appearance within the workplace or where
the majority devalues any culture outside mainstream Anglo-America?17. What are specific garments that you think are appropriate for business casual dress that may be high-
fashion?18. Where did you learn how to dress professionally?19. Do you believe employers hire for positions based on clothing?20. Do you believe employers discriminate based on unfashionable clothing?21. Do you consider church dress and professional dress to be in the same genera?22. Is it hard to maintain a positive self-esteem at a predominantly White institution like UGA?23. Do you try to assimilate into the established culture of your company/office through clothing? Why or why
not?24. How do stereotypes affect your life and more specifically your fashion choices?

122
APPENDIX C
FOUCS GROUP SURVEY
Participant Name:
African American College Students’ Perceptions of Professional Dress
On the power-point slides are 33 pictures of women’s professional clothing found in the workplace. Please indicate to what degree you think pictures 1-33 are appropriate for a middle management employment interview as an Executive Assistant in a Law firm. Circle one if you believe the suit is Absolute Appropriate; circle five if you believe the suit is Most Inappropriate. Feel free to write comments about each suit on this paper.
Absolute MostPICTURE Appropriate Inappropriate
1 1 2 3 4 52 1 2 3 4 5 3 1 2 3 4 54 1 2 3 4 55 1 2 3 4 56 1 2 3 4 57 1 2 3 4 58 1 2 3 4 5 9 1 2 3 4 510 1 2 3 4 511 1 2 3 4 512 1 2 3 4 513 1 2 3 4 514 1 2 3 4 515 1 2 3 4 516 1 2 3 4 517 1 2 3 4 518 1 2 3 4 519 1 2 3 4 520 1 2 3 4 521 1 2 3 4 522 1 2 3 4 523 1 2 3 4 524 1 2 3 4 525 1 2 3 4 526 1 2 3 4 527 1 2 3 4 528 1 2 3 4 529 1 2 3 4 530 1 2 3 4 531 1 2 3 4 532 1 2 3 4 533 1 2 3 4 5

123
APPENDIX D
FOCUS GROUP INFORMATION SHEET
March 3, 2006Focus Group Discussion
“African American College Students’ Perceptions of Professional Dress”
Participant Name: Age:Sex:Major:Undergrad/ Grad:
Do you prefer to be called: African American, Black, Person of Color, or other? Why?
Is clothing an important aspect of your life?
Do you consider yourself a fashion leader? (meaning: do your friends look to you for clothing advice?)
Do you try to assimilate into the established culture of your company/office/school through clothing? Why?
Do you wear your clothing with style or does your clothing wear you?
What is your opinion of causal Fridays or casual dress at work?
What do you consider business professional dress?
Where did you learn the definition of professional dress?
Did your parents have an opinion of your everyday dress as a child and as a teenager?
Do you believe employers hire for positions based on clothing?
Have you ever heard of code-switching? Do you experience this here at UGA?

124
(APPENDIX D continued)
“African American households’ top priority is buying clothes to enhance identity” (U.S. Census Bureau, 2002; Fisher, 1996; Kochman, 1981; Yankelovich partners, 1995). Do you agree?
Additional comments about the discussion: (wait until the end of all discussion)

125
APPENDIX E
FREQUENCY TABLES
TABLE ONE
Descriptive Statistics for HBCU and PWI Subsamples
HBCU PWI HBCU PWIVariables
% % M (SD) M (SD)t
Section 3.1 Traditional Professional Dress (1), Fashion Oriented Professional Dress (5)
1. Suits with Embroidered Jackets 46% 27% 2.99 (1.47) 3.35 (1.28) -2.10*
2. Loafers (no laces) 43% 54% 2.75(1.473) 2.40 (1.24) 1.99*
Section 3.2 Business Casual Dress (1), Casual Dress (5)
3. Dress pants/ slacks 65% 78% 2.33 (1.50) 1.85 (1.20) 2.71**
4. Dress pants- wide leg 34% 44% 3.23 (1.50) 2.85 (1.37) 2.02*
5. Short-sleeve blouses (not sheer) 46% 58% 2.77 (1.32) 2.42 (1.17) 2.21*
6. T-shirts (no collar) 63% 73% 3.96 (1.06) 4.23 (1.08) -1.97*
7. Tank tops 64% 76% 4.07 (1.00) 4.34 (1.01) -2.06*
Note. *p < .05. **p < .01. Item mean scores reflect the following response choices for
Section 3.1: 1 = Traditional Professional Dress, 2 = Semi Traditional Professional Dress, 3
= Neither, 4 = Semi Fashion-Oriented Professional Dress, 5 = Fashion-Oriented
Professional Dress. Item mean scores reflect the following response choices for Section 3.2:
1 = Business Casual Dress, 2 = Semi Business Casual Dress, 3 = Neither, 4 = Semi Casual
Dress, 5 = Casual Dress.

126
APPENDIX E (continued)
TABLE TWO
Descriptive Statistics for the Male and Female Subsamples
Women Men Women MenVariables
% % M (SD) M (SD)t
Section 3.1 Traditional Professional Dress (1) verse Fashion Oriented Professional Dress (5)
1. Suits with Skirts 95% 91% 1.27 (.77) 1.52 (.69) -2.28*2. Suits with jacket hem above waist 57% 40% 3.49 (1.50) 3.08(1.32) 2.06*3. Suits with high contrast trim 65% 38% 3.80 (1.09) 3.35 (.97) 2.81**4. Suits with dress pants-wide leg 61% 41% 3.57 (1.37) 3.10 (1.34) 2.40*5. suits with bermuda shorts 72% 62% 4.21 (1.08) 3.87 (1.16) 2.08*6. Loafers (no laces) 52% 40% 2.46 (1.36) 2.85 (1.32) -1.98*7. Leather shoes (3-5" heels) 71% 52% 3.90 (1.29) 3.35 (1.30) 2.90**8. Leather flats. (no heels) 64% 45% 2.15 (1.13) 2.73 (1.18) -3.44***9. Open-toed dress shoes 70% 50% 3.96 (1.14) 3.32 (1.11) 3.80***10. Chandelier/ medium earrings 63% 35% 3.74 (1.28) 3.07 (1.18) 3.61***
Section 3.2 Business Casual Dress (1) verse Casual Dress (5)
11. Jacket/ Blazer with skirt 92% 86% 1.35 (.89) 1.68 (1.20) -2.29*12. Dresses 43% 57% 2.79 (1.41) 2.41 (1.17) 1.89*13. Jeans/ denim pants 82% 61% 4.46 (.88) 3.89 (1.28) 3.26***14. Khakis 18% 31% 3.83 (1.34) 3.39 (1.39) 2.16*15. Long-sleeve blouses (not sheer) 77% 64% 1.93 (1.82) 2.25 (.96) -1.87*16. Long-sleeve blouses (sheer) 33% 44% 3.25 (1.36) 2.80 (1.15) 2.50*17. Short-sleeve blouses (sheer) 24% 38% 3.47 (1.28) 2.98 (1.13) 2.83**18. Polo/ knit shirts with a collar 63% 56% 3.80 (1.24) 3.39 (1.32) 2.25*19. V-neck low cut blouse 66% 53% 3.90 (1.08) 3.55 (1.08) 2.17*20. Tank tops 74% 59% 4.31 (.96) 3.95 (1.12) 2.25*
Women Men Women MenVariables
% % M (SD) M (SD)t
Section 3.2 Business Casual Dress (1) verse Casual Dress (5)
21. Halter tops 71% 55% 4.27 (1.00) 3.83 (.96) 2.94**22. Sleeveless blouses 12% 24% 3.98 (1.14) 3.32 (1.17) 3.88***23. Leather shoes (2-3" heels) 77% 65% 1.90 (1.15) 2.27 (1.13) -2.22*24. Leather shoes (3-5" heels) 31% 42% 3.44 (1.48) 2.98 (1.24) 2.38*25. Open-toed dress shoes 27% 47% 3.50 (1.37) 2.87 (1.27) 3.17**
Section 4 Absolute Appropriate Dress (1) verse Absolute Inappropriate Dress (5)
26. Black skirt suit with lace trim 24% 37% 2.74 (1.14) 3.11 (.99) -2.33*
(Table 2 continues)

127
(Table 2 continued)
Note. *p < .05. **p < .01. ***p < .001. Item mean scores reflect the following response choices for
Section 3.1: 1 = Traditional Professional Dress, 2 = Semi Traditional Professional Dress, 3 =
Neither, 4 = Semi Fashion-Oriented Professional Dress, 5 = Fashion-Oriented Professional Dress.
Item mean scores reflect the following response choices for Section 3.2: 1 = Business Casual Dress,
2 = Semi Business Casual Dress, 3 = Neither, 4 = Semi Casual Dress, 5 = Casual Dress. Item
mean scores reflect the following response choices for Section 4: 1 = Absolute Appropriate, 2 =
Semi Appropriate, 3 = Maybe, 4 = Semi Inappropriate, 5 = Absolute Inappropriate.

128
APPENDIX E (continued)
TABLE THREE
Difference Between HBCU and PWI On Rosenberg's Self Esteem Scale
Strongly StronglyQuestion
AgreeAgree Disagree
Disagreen (%) n (%) n (%) n (%)
1. I feel that I'm a person of worth, at least on an equal plane with others. HBCU 88(76.5%) 25 (21.7%) 1 (.9) 1 (.9)
PWI 121 (89%) 12 (16.2%) 3 (2.2%) /
2. I feel that I have a number of good qualities.HBCU 95 (82.6%) 17 (14.8%) / 3 (2.6 %)
PWI 112 (82.4%) 22 (16.2%) 1 (.7%) 1 (.7%)
3. All in all, I am inclined to feel that I am a failure.HBCU 7 (6.1%) 8 (7%) 26 (22.6%) 74 (64.3%)
PWI 6 (4.4%) 7 (5.1%) 36 (26.4%) 87 (64%)
4. I am able to do things as well as most other people.HBCU 76 (66.1%) 32 (27.8%) 6 (5.2%) 1 (.9%)
PWI 84 (61.8%) 47 (34.6%) 5 (3.7%) /
5. I feel I do not have much to be proud of.HBCU 4 (3.5%) 9 (7.8%) 16 (13.9%) 86 (74.8%)
PWI 5 (3.7%) 7 (5.1%) 20 (14.7%) 104 (76.5%)
6. I take a positive attitude towards myself.HBCU 77 (67%) 33 (28.7%) 2 (1.7%) 3 (2.6%)
PWI 94 (69.1%) 37 (27.3%) 4 (2.9%) 1 (.7%)
7. On the whole, I am satisfied with myself.HBCU 61 (53%) 42 (36.5%) 10 (8.5%) 2 (1.7%)
PWI 75 (55.1%) 54 (39.7%) 7 (5.1%) /
8. I wish I could have more respect for myself.HBCU 9 (7.8%) 17 (14.8%) 41 (35.6%) 48 (41.7%)
PWI 7 (5.1%) 20 (14.7%) 41 (30.2%) 68 (50%)
9. I certainly feel useless at times.HBCU 8 (7%) 23 (20%) 38 (33%) 46 (40%)
PWI 2 (1.5%) 28 (20.6%) 41 (30.1%) 65 (47.8%)
10. At times I think I am no good at all.HBCU 6 (5.2%) 15 (13%) 30 (26.1%) 64 (55.7%)
PWI 3 (2.2%) 11 (8.1%) 43 (31.6%) 79 (58.1%)(Table 3 continues)
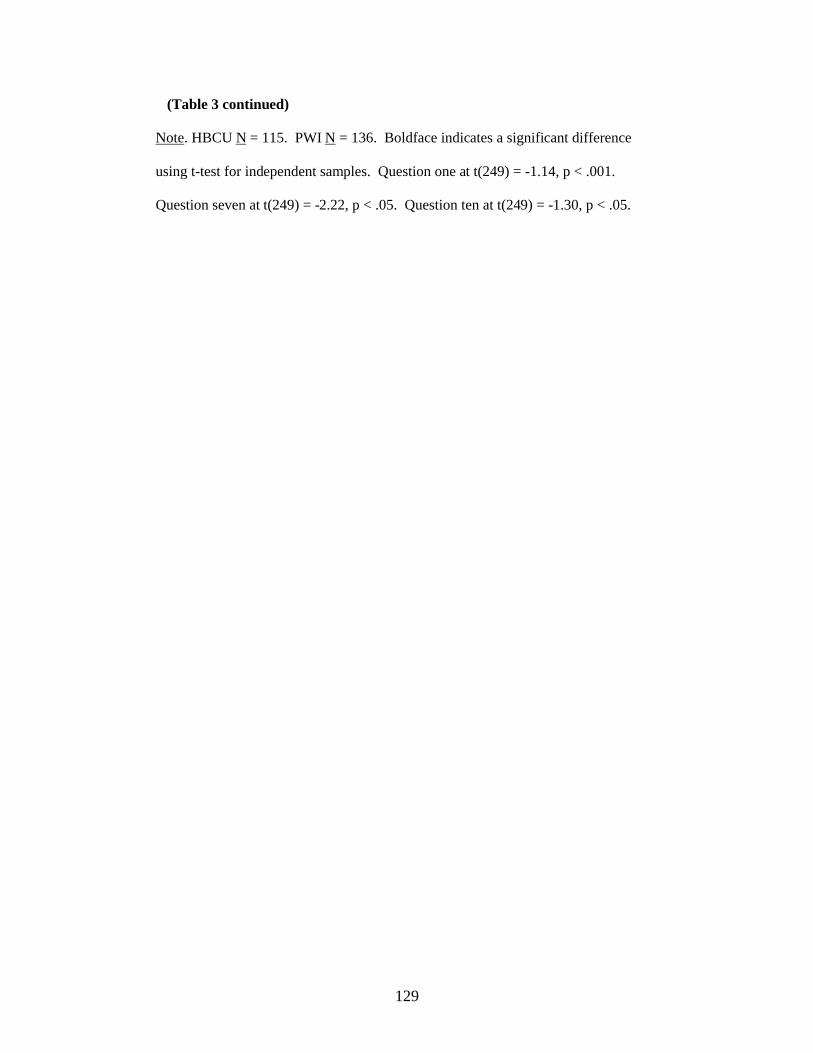
129
(Table 3 continued)
Note. HBCU N = 115. PWI N = 136. Boldface indicates a significant difference
using t-test for independent samples. Question one at t(249) = -1.14, p < .001.
Question seven at t(249) = -2.22, p < .05. Question ten at t(249) = -1.30, p < .05.

130
130
APPENDIX E (continued)
TABLE FOUR
Correlations for Mississippi and Louisiana Samples
Self-Esteem Fashion Importance Fashion FashionLeadership of Clothing Behavior Innovators
Self-Esteem:Mississippi .135 .192* .180* -.063Louisiana .266** .081 .245** -.267**
Fashion LeadershipMississippi - .415** .933** -.643**Louisiana .363** .923** -.705**
Importance of ClothingMississippi - .715** -.444**Louisiana .693** -.438**
Fashion Behavior Mississippi - -.670**Louisiana -.726**
Fashion InnovatorsMississippi -Louisiana
Note. Mississippi N = 125. Louisiana N = 126. *p < .05. **p < .01.

131
131
APPENDIX E (continued)
TABLE FIVE
Correlations for Male and Female Samples
Self- Fashion Importance Fashion FashionEsteem Leadership of Clothing Behavior Innovators
Self-Esteem:Man .016 .130 .068 -.088
Woman .262** .123 .251** -.185*Fashion Leadership
Man - .191 .910** -.659**Woman .441** .933** -.683**
Importance of ClothingMan - .580** -.349**
Woman .734** -.468**Fashion Behavior
Man - -.694**Woman -.704**
Fashion InnovatorsMan -
Woman
Note. Man N = 67. Woman N = 184. *p < .05. **p < .01.

132
132
APENDIX E (continued)
TABLE SIX
Descriptive Statistics for the Mississippi and Louisiana Samples
MS LA MS LAVariables
% % M (SD) M (SD)t
Section 3.1 Traditional Professional Dress (1) verse Fashion Oriented Professional Dress (5)
1. Suits with Embroidered Jackets 42% 30% 3.00(13.85) 3.39 (1.35) -2.20*2. Suits with jacket hem above waist 40% 20% 3.06 (1.47) 3.72 (1.38) -3.65*3. Pink suits with skirts 22% 10% 3.60 (1.29) 3.94 (1.12) -2.23*4. Suits with high contrast trim 18% 10% 3.45 (1.08) 3.92 (1.02) -3.46*5. Suits with dress pants-wide leg 39% 16% 3.12 (1.42) 3.79 (1.24) -3.95***6. suits with bermuda shorts 14% 2% 3.79 (1.23) 4.47 (.84) -5.06***7. Suits with capri pants 19% 3% 3.72 (1.26) 4.39 (.91) -4.78***8. Suits with turtlenecks 44% 35% 2.63 (1.12) 2.93 (1.18) -2.07*9. Suits with halter tops 13% 2% 3.72 (1.22) 4.21 (.92) -3.48***10. Leather shoes (2-3" heels) 62% 73% 2.38 (1.40) 2.03 (1.20) 2.12*11. Sandals 18% 2% 3.63 (1.25) 4.04 (.88) -3.00**12. Chandelier/ medium earrings 31% 15% 3.37 (1.23) 3.76 (1.23) -2.39*13. Cultural headwrap 23% 9% 3.50 (1.25) 3.81 (1.11) -2.05*14. Scarf around neck 44% 39% 2.69 (1.26) 3.06 (1.39) -2.20*
Section 3.2 Business Casual Dress (1) verse Casual Dress (5)
15. Dresses 54% 38% 2.49 (1.30) 2.91 (1.39) -2.41*16. Jeans/ denim pants 72% 82% 4.18 (1.13) 4.46 (.88) -2.134*17. Bermuda/ walking shorts 60% 79% 3.98 (1.13) 4.42 (.91) -3.36***18. Fitted capri pants 68% 81% 4.06 (1.15) 4.47 (.84) -3.19**19. Long-sleeve blouses (not sheer) 66% 81% 2.25 (1.22) 1.77 (.99) 3.32***20. Long-sleeve blouses (sheer) 28% 53% 2.85 (1.24) 3.44 (1.38) -3.57***21. Three-quarter sleeve blouses 50% 60% 2.71 (1.25) 2.38 (1.26) 2.04*22. Short-sleeve blouses (sheer) 36% 54% 3.08 (1.24) 3.63 (1.22) -3.47***23. T-shirts (no collar) 64% 73% 3.97 (1.13) 4.26 (.99) -2.15*24. Tank tops 8% .8% 4.00 (1.10) 4.45 (.86) -3.53***25. Halter tops 62% 72% 3.97 (1.06) 4.36 (.91) -3.07**26. Sleeveless blouses 20% 10% 3.60 (1.19) 4.03 (1.13) -2.83**27. Mules (backless shoes) 25% 18% 3.43 (1.27) 3.74 (1.22) -1.93*28. Canvas shoes 50% 73% 3.56 (1.23) 4.15 (1.01) -4.01***29. Athletic shoes 61% 79% 4.03 (1.11) 4.44 (.90) -3.15**30. White athletic socks 57% 78% 4.01 (1.11) 4.38 (.90) -2.89**
Section 4 Absolute Appropriate Dress (1) verse Absolute Inappropriate Dress (5)
31. Black skirt suit with lace trim 87% 67% 2.32 (1.09) 2.99 (1.02) -4.38*32. Black pants suit with long jacket 81% 64% 2.41 (1.31) 2.92 (1.32) -3.05**
(Table 6 continues)

133
133
(Table 6 continued)
Note. *p < .05. **p < .01. ***p < .001. Item mean scores reflect the following response
choices for Section 3.1: 1 = Traditional Professional Dress, 2 = Semi Traditional
Professional Dress, 3 = Neither, 4 = Semi Fashion-Oriented Professional Dress, 5 =
Fashion-Oriented Professional Dress. Item mean scores reflect the following response
choices for Section 3.2: 1 = Business Casual Dress, 2 = Semi Business Casual Dress, 3
= Neither, 4 = Semi Casual Dress, 5 = Casual Dress. Item mean scores reflect the
following response choices for Section 4: 1 = Absolute Appropriate, 2 = Semi
Appropriate, 3 = Maybe, 4 = Semi Inappropriate, 5 = Absolute Inappropriate.

134
134
APPENDIX F
SURVEY DISTRIBUTION
Survey # University Class/ OrganizationDate
Collected1-30 MSU Minorities in Agriculture, Natural Resources and Related Sciences 4/7/2006
190-216 MSU Holmes Cultural Diversity Center 4/7/200651-70 MSU Kappa Alpha Psi 4/29/200671-85 LSU Career Service Center 5/2/2006
106-126 LSU African American Cultural Center 4/27/2006148-168 LSU National Society of Black Engineers 5/5/2006169-189 LSU National Association of Black Social Workers 4/20/2006
ASU (NUTR) Maternal & Child Nutrition 4/13/2006308-403
ASU (NUTR) HACCP/ ServSafe 4/13/2006SU (TMI) Textile Evaluation 4/10/2006
217-260SU (TMI) Computer Applications in Design 4/10/2006
261-287 SU (MKT) Intro to Marketing Principals 4/10/2006