AFRICAN ALLIANCE INSURANCE PLC · 2018-12-24 · African Alliance Insurance Plc Consolidated and...
168
AFRICAN ALLIANCE INSURANCE PLC CONSOLIDATED AND SEPARATE FINANCIAL STATEMENTS 31 DECEMBER 2017
Transcript of AFRICAN ALLIANCE INSURANCE PLC · 2018-12-24 · African Alliance Insurance Plc Consolidated and...

AFRICAN ALLIANCE INSURANCE PLC
CONSOLIDATED AND SEPARATE FINANCIAL STATEMENTS
31 DECEMBER 2017

African Alliance Insurance Plc
Consolidated and Separate Financial Statements
For the year ended 31 December 2017
Table of contents
Page
Corporate information
1
Vision, Mission and Values
2
Statement of directors' responsibilities 3
Certification by company secretary 4
Risk declaration
5
Certification Pursuant to Section 60(2) of Investment and Securities Act No.27 of
2007
6
Directors' report 7
Audit Committee Report
10
Enterprise risk management
11
Management's discussion and analysis 15
Corporate governance
16
Result at a glance
23
Independent auditor
24
Statement of significant accounting policies 29
Consolidated Statement of financial position 59
Consolidated Statement of Comprehensive income 61
Statement of changes in equity – Group 62
Statement of changes in equity – Company 63
Statement of cash flows
64
Notes to the financial statements 65
Other national disclosure
162
African Alliance Insurance Plc
Consolidated and Separate Financial Statements
For the year ended 31 December 2017
1
CORPORATE INFORMATION
Membership of the Board of Directors during the year ended 31 December, 2017
1 Anthony Okocha Non-Executive Director Acting Chairman
2 Abayomi Mumuni Non-Executive Director Member
3 Funmi Omo Managing Director Member Appointed 11th May, 2017
4 Olabisi Adekola Executive Director Member
5 Alphonse Okpor Managing Director Member Retired 4th March,2017
COMPANY SECRETARY Tope Adebayo LLP FRC/2013/NBA/0000000001586
RE-INSURERS
African Reinsurance Corporation
WAICA Reinsurance Corporation Plc
REGISTERED OFFICE 112, Broad Street, Marina Lagos. RC NO: 2176 [email protected]
HEAD OFFICE
61 Marina,
Lagos
ACTUARIES
Ernst & Young FRC/2012/NAS/00000000738 (Consulting Actuaries & Chartered Insurers)
10th & 13th Floors, UBA House 57, Marina Lagos, Nigeria REGISTRARS Mainstreet Bank Registrars Limited 2a Gbagada Expressway Anthony Village Lagos. BANKERS EcoBank Nigeria Limited Guaranty Trust Bank Plc. First Bank of Nigeria Limited Fidelity Bank Plc Access Bank Plc Keystone Bank Limited Sterling Bank Union Bank of Nigeria First City Monument Bank AUDITORS Deloitte & Touche (Chartered Accountants) Civic Towers Ozumba Mbadiwe Avenue, Victoria Island, Lagos. REGULATORY AUTHORITY National Insurance Commission
African Alliance Insurance Plc
Consolidated and Separate Financial Statements
For the year ended 31 December 2017
2
MISSION
’We improve the quality of life of our clients using cutting edge technology and competent
personnel to add value to our stakeholders’’
VISION
‘’To be the most preferred life insurance specialist’’
CORE VALUES
Accountability
We are responsible
Accessibility
We are within your reach
Integrity
We keep our words
Professionalism
We provide quality service
Loyalty
We are committed to our stakeholders
Creativity
We are innovative


African Alliance Insurance Plc
Consolidated and Separate Financial Statements
For the year ended 31 December 2017
7
DIRECTORS' REPORT
The directors submit their report together with the audited consolidated and separate financial
statements for the year ended 31 December 2017, which disclose the state of affairs of the
Group.
(a) Legal Form
The company was incorporated as a private limited liability company in 1960 under the
provisions of the companies and Allied Matters Act CAP C20 LFN 2004 with RC No 2176.
The company became a public liability company following the successful completion of
the private placement exercise undertaken by the company in June 2008, On 17
September 2009, the Company became listed on the Nigerian Stock exchange. The
subsidiaries wholly owned by the company are Axiom Air Limited, a cargo airline
company, Frenchies Foods Nigeria Limited, a restaurant and catering company while
African Alliance Insurance Plc as 98% in Ghana Life Insurance Company Limited, a Life
company in Ghana.
During the year, the company, African Alliance Insurance Company Plc., voluntarily
wound down the business operations of two of its subsidiaries which it wholly owns. The
two subsidiaries liquidated were African Alliance Realty Company Limited and Frenchies
Foods Nigeria Limited. The relevant net assets of the wounded down subsidiaries was
absorbed by African Alliance Insurance Company Plc. Approval for the liquidation was
gotten from the Board of Directors for the company on 31 December 2017. The relevant
net assets of the two subsidiaries on acquisition is detailed in note 45
(b) Principal activities
The principal activity of the company is the provision of life business risk management
solutions to corporate and retail customers in Nigeria.
(c) Operating Results
The Group’s results for the 12-months period are set out on pages 58 to 60. The loss
after tax for the year of N6.2bn for the Group and N3.7bn for the Company (and a profit
after tax of N2.4bn and N2.9bn in 2016 respectively) has been transferred to retained
earnings.
Group Company
31-Dec-17 31-Dec-16 31-Dec-17 31-Dec-16
N'000 N'000 N'000 N'000
Gross premium written 7,626,710 14,068,406
6,335,448
12,963,414
Net Underwriting income 7,533,138 14,465,397 6,251,479 13,381,090
(Loss)/Profit before tax (6,726,979) 2,774,855
(4,167,907)
3,216,247
Taxation 475,924 (330,817)
455,316
(270,628)
(Loss)/Profit after tax (6,251,055) 2,444,038 (3,712,591) 2,945,619
(d) Dividends
No dividend was proposed for year ended 31 December 2017
(e) Directors
The directors who held office during the year and to the date of this report were:
Mrs Funmi Omo - Managing Director
Mrs Olabisi Adekola - Executive Director
Mr Anthony Okocha - Non Executive
Amb. Abayomi Mumuni - Non Executive
Appointment of Directors
Mrs Funmi Omo was appointed as Managing Director effective 11 May, 2017.
African Alliance Insurance Plc
Consolidated and Separate Financial Statements
For the year ended 31 December 2017
8
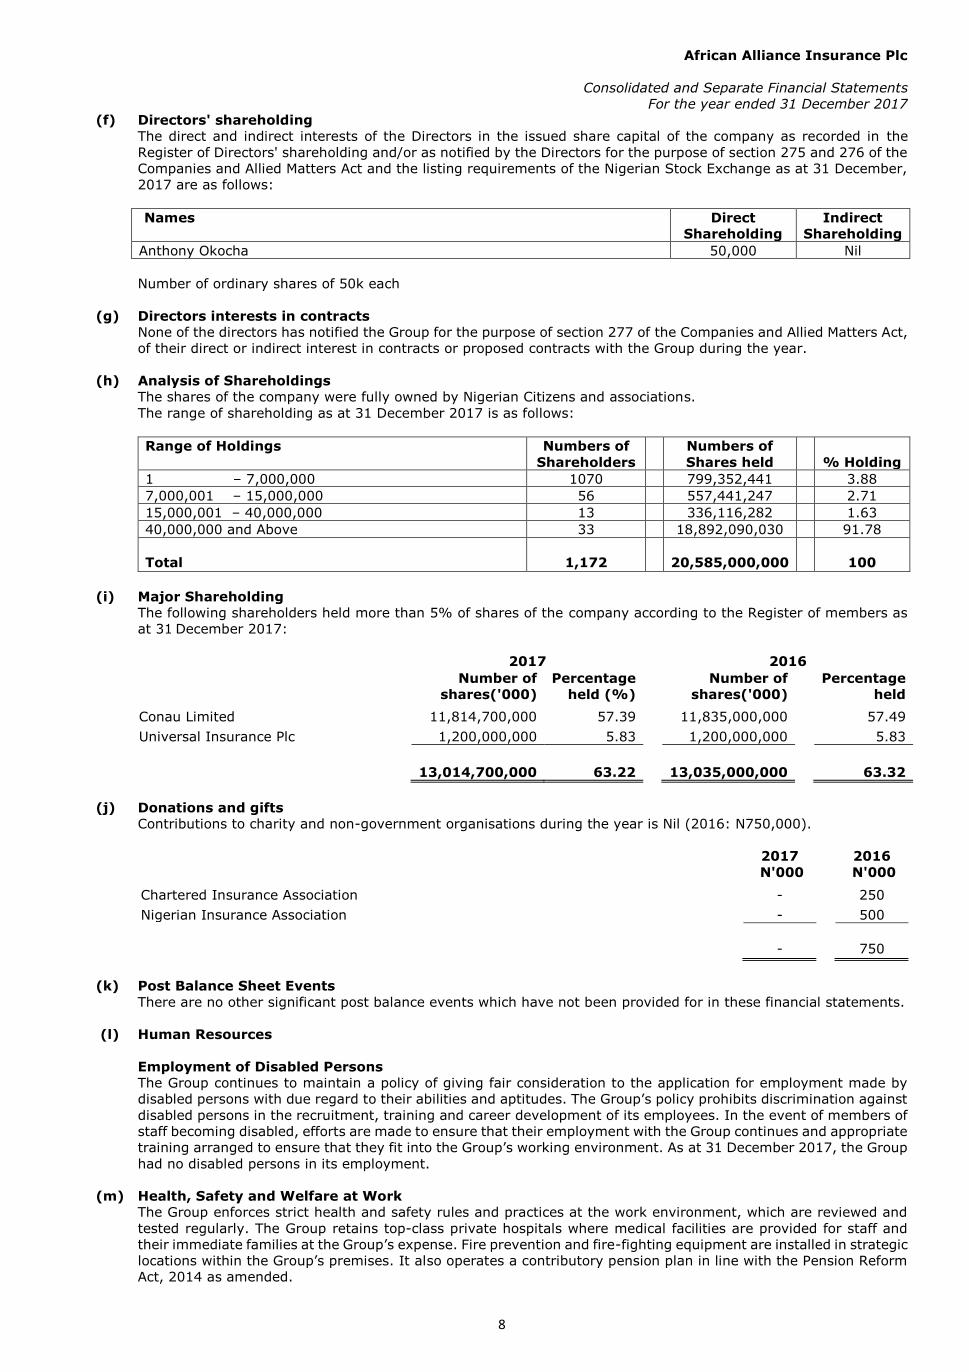
(f) Directors' shareholding
The direct and indirect interests of the Directors in the issued share capital of the company as recorded in the
Register of Directors' shareholding and/or as notified by the Directors for the purpose of section 275 and 276 of the
Companies and Allied Matters Act and the listing requirements of the Nigerian Stock Exchange as at 31 December,
2017 are as follows:
Names Direct
Shareholding
Indirect
Shareholding
Anthony Okocha 50,000 Nil
Number of ordinary shares of 50k each
(g) Directors interests in contracts
None of the directors has notified the Group for the purpose of section 277 of the Companies and Allied Matters Act,
of their direct or indirect interest in contracts or proposed contracts with the Group during the year.
(h) Analysis of Shareholdings
The shares of the company were fully owned by Nigerian Citizens and associations.
The range of shareholding as at 31 December 2017 is as follows:
Range of Holdings Numbers of
Shareholders
Numbers of
Shares held % Holding
1 – 7,000,000 1070 799,352,441 3.88
7,000,001 – 15,000,000 56 557,441,247 2.71
15,000,001 – 40,000,000 13 336,116,282 1.63
40,000,000 and Above 33 18,892,090,030 91.78
Total
1,172
20,585,000,000
100
(i) Major Shareholding
The following shareholders held more than 5% of shares of the company according to the Register of members as
at 31 December 2017:
2017
2016
Number of
shares('000)
Percentage
held (%)
Number of
shares('000)
Percentage
held
Conau Limited 11,814,700,000 57.39 11,835,000,000 57.49
Universal Insurance Plc 1,200,000,000 5.83 1,200,000,000 5.83
13,014,700,000 63.22 13,035,000,000 63.32
(j) Donations and gifts
Contributions to charity and non-government organisations during the year is Nil (2016: N750,000).
2017
2016
N'000
N'000
Chartered Insurance Association
-
250
Nigerian Insurance Association
-
500
-
750
(k) Post Balance Sheet Events
There are no other significant post balance events which have not been provided for in these financial statements.
(l) Human Resources
Employment of Disabled Persons
The Group continues to maintain a policy of giving fair consideration to the application for employment made by
disabled persons with due regard to their abilities and aptitudes. The Group’s policy prohibits discrimination against
disabled persons in the recruitment, training and career development of its employees. In the event of members of
staff becoming disabled, efforts are made to ensure that their employment with the Group continues and appropriate
training arranged to ensure that they fit into the Group’s working environment. As at 31 December 2017, the Group
had no disabled persons in its employment.
(m) Health, Safety and Welfare at Work
The Group enforces strict health and safety rules and practices at the work environment, which are reviewed and
tested regularly. The Group retains top-class private hospitals where medical facilities are provided for staff and
their immediate families at the Group’s expense. Fire prevention and fire-fighting equipment are installed in strategic
locations within the Group’s premises. It also operates a contributory pension plan in line with the Pension Reform
Act, 2014 as amended.


African Alliance Insurance Plc
Consolidated and Separate Financial Statements
For the year ended 31 December 2017
11
ENTERPRISE RISK MANAGEMENT
Enterprise risk management philosophy
Our business provides financial guarantee to our clients and this is also linked to their longevity.
Hence, the management of our business strongly focuses on mortality studies and investment
performance.
A key business objective is meeting client claims as and when they occur, achieving this
objective involves us in many activities including:
• correctly pricing the insurance risks,
• ensuring our business contracts are adequately written, optimally investing both Insurance
and Shareholder Funds,
• timely reporting our financial activities internally and externally, deploying adequate
operating and having adequate processes/people/systems"
The Board is committed to ensuring ERM is embraced by all the staff of the Group and also
ensure that our processes reflect our strategic objectives.
Our Risk Culture
The Group is building a risk culture whereby there is an adequate level of risk awareness across
all business units and amongst all employees.
Risks faced by the Group are communicated across the Group. The Risk Management
Committee (RMC) ensures that the business units develop a risk culture where all Heads of
Departments /Units are aware of the Group’s strategy objectives and risk Appetite and limits.
The business process adheres to the stipulated risk limits and if they are likely to exceeded, the
information is escalated to the Risk Officer/RMC.
Risk management framework
We have robust and effective Group management framework which seeks to protect our
company's capital base and earnings without hindering our business growth:
We operate and maintain three lines of defence for the management and oversight of risk to
ensure adherence to guiding principles and control. The lines of defence are
First Line – Board and Management
The Board of Directors set the tone for Risk Management through approving the Strategic
objectives of the Group and the Group's risk appetite and tolerance limits. The Risk Management
Committee has the oversight role of ensuring that the business units adhere to the Boards
directives and ensure the business units develop a risk culture where all leaders are aware of
the company's strategy.
The Risk Management Committee through the Chairman reports on risk matters to the Board.
The Chief Risk Officer collates quarterly enterprise reports to the Risk Management Committee.
Second Line – Risk Management Unit
The company’s risk management department is responsible for designing risk framework
methodologies and tools which supports the business in analysing and managing risks and
providing early warning of adverse trends. The department reports to the Board, management
and staff on risk identification, control and mitigation.
Third Line – Internal Audit Function
This line of defence provides independent and objective assurance on the effectiveness of
internal controls established by the Board, management and Risk Unit in the Group.
African Alliance Insurance Plc
Consolidated and Separate Financial Statements
For the year ended 31 December 2017
12
Risk appetite
The Group has low appetite for taking risk. The Group intends at all times ensure that it is
solvent and ensure that all obligations are met as at when due.
The Group intends to always be in compliance with applicable laws and regulations and be within
its set tolerance limit.
Risk management policies and procedures
The Group has a risk management policy and procedural manual which sets out the Group's
risk governance framework. The document is implemented by the Risk Management
Committee, and the committee reports on risk matters to the Board. The Chief Risk Officer
collates quarterly enterprise - wide reports to the Risk Management Committee.
Risk classification
Operational risk
This is the risk of loss from inadequate or failed internal processes, people and systems or from
external events which arises from the potential that inadequate information systems,
operational problems, breaches in internal controls, fraud, or unforeseen catastrophes will result
in unexpected losses. The Group has policies that cover risk that may arise from people,
systems and internal process failures. The policies include staff recruitment, training, retention
plans, succession plans, remuneration and welfare benefits, designing standard operating
procedure and policies, driving compliance culture, process automation, Information
Technology support systems, data integrity, IT systems access, etc.
Liquidity risk
Liquidity risk exist when there is insufficient cash flow to meet the Group’s operational and
financial obligations and is usually associated with inability to liquidate assets or obtain funding
from external sources to pay claims and other liabilities when due. The Company manages its
liquidity risk through appropriate assets and liability management strategy through the
Investment Management Committee. Monthly reports and review of liquidity gaps is conducted
to assess the level of liquidity risk.
Reinsurance risk
This is the risk of inadequate reinsurance cover to mitigate underwriting risk. It usually occurs
when there is insolvency of a reinsurer, discovery of exposures without current reinsurance
coverage, or exhaustion of reinsurance covers through multiple losses. The Group has
documented reinsurance policies for adequate reinsurance arrangements and treaties for all
categories of insurance business transacted. The policies include the process for Reinsurer
selection, monitoring, claims recovery, etc.
Underwriting risk
Underwriting is the process by which an insurer determines the conditions necessary and
suitable to accept insurance risk. The risk crystallises when there is severe and frequent claims
against the Group’s projected capacity. The Group has embedded internal control processes to
guide its insurance business and guide against the risk of unexpected losses and capital erosion.
There is well documented underwriting policies and procedure and are enforced throughout the
organisation.
Business risk
The Group’s business risk is associated with gaining market shares and remains profitable. This
risk is considered through documented process for product development and launch, business
segment profitability analysis, stakeholder’s engagement as well as being embedded in our
brand promise.
African Alliance Insurance Plc
Consolidated and Separate Financial Statements
For the year ended 31 December 2017
13
Reputational risk
This is the risk of events that could cause public distrust and damages to the Group’s integrity,
reputation and goodwill especially in the eyes of the customers, regulators, competitors, and
the general public. We manage reputational risk through a structured approach for defining and
implementing core values and acceptable standard of behaviour which the staff are expected
to follow while conducting the day to day business of the Group. The Group risk assessment
and monitoring process has embedded controls for testing reputational risk and the outcome of
such exercise is communicated to the Board Risk Committee on a quarterly basis.
Legal/compliance risk management
The Group has procedures to ensure that all statutory regulations are completely adhered to by
the business unit at all time. These regulations include those set by NAICOM and other relevant
agencies of government. There are internal control processes that identify potential breaches
to the regulations and are promptly mitigated. Some of the control processes include:
a) Know -your-customer (KYC) procedure
b) Anti-money laundering/combating the financing of terrorism (AML/CFT)
c) Anti-bribery and corruption measures
d) Guidelines for adherence to Corporate Governance principles
e) Gift policies
f) Whistle blowing policies
Risk report and risk map
Issues arising from risk assessment process are collated and presented in a report called the
Risk Report which forms the basis of constructing the risk map. The risk map draws senior
management's attention to the critical risk factors as well as the adequacy of existing controls
to mitigate the risk. The risk map provides a snap short summary of the significant risk and the
ratings and probability of occurrence within a specific period. This forms the basis for estimating
the potential operational loss.
Risk control self-assessment (RCSA)
The Group has a mechanism for risk assessment on periodic basis and this is known as Risk
control self-assessment (RCSA) principle. It involves the tests and procedures or assessments
that need to be performed periodically to assure that key controls are in place and are working
effectively as designed. The control requirements are proactively assessed through Process risk
analysis and review of policy requirements, loss events, and audit findings. The Group then set
controls required to comply with policy requirements and test these processes for adequacy and
risk mitigation capability. Risk Champions are engaged in each business or risk unit and
facilitates the process of risk control self-assessment in the Group.
Key risk indicators
The key risk indicator (KRI) provides trend analysis of risk exposures or deviation from standard
processes. This helps the Risk Officers and Risk owners to promptly identify increasing threat
to business activities and escalate to the appropriate senior levels for control and to probably
review the risk appetite. The trend analysis is one of the sources of data for the risk report and
risk map documented by the Group.
Loss events reporting
The Group has a Loss Event Register that captures all actual loss sustained during operational
processes.
Health and safety management
The Health and Safety Management has been instituted to provide and maintain safe healthy
working conditions, work equipment and systems for all staff. This responsibility also extends
to visitors, contractors and others who may potentially be affected by our activities. The Health
and Safety Policy framework underpins the policy statements, roles and responsibilities of HSE
officer with "Safety First" culture and zero tolerance for near misses approach.
African Alliance Insurance Plc
Consolidated and Separate Financial Statements
For the year ended 31 December 2017
14
Business Continuity Plan (BCP)
The business continuity plan (BCP) has been designed to promote resilience against operational
threats especially with regards to continuity of critical operations, in the event of a disaster or
disruption to critical operations. The BCP framework also addresses adherence to contingency
planning procedures, in the event of emergencies. We aim to continually improve on inherent
gaps identified during each simulation exercise.
African Alliance Insurance Plc
Consolidated and Separate Financial Statements
For the year ended 31 December 2017
15
MANAGEMENT DISCUSSION AND ANALYSIS
The Management Discussion and Analysis (MD&A) presents management’s view of the financial
results of the Group’s operations and cash flows of African Alliance Insurance Plc and its
subsidiaries for the year ended 31st December 2017.
The nature of the business
African Alliance Insurance Plc was incorporated as a Private Limited Liability Company on 6 May,
1960 and was the first indigenous insurance company to carry out the business of Life Assurance
in Nigeria. In 2005, African Alliance Insurance Plc. pioneered the sale of Takaful (Islamic
Insurance) in Nigeria through a robust selection of Sharia compliant insurance and investment
products, also in the same year, the company went into a joint venture with First Securities
Discount House Limited (FSDH) to set up Pension Alliance Limited (PAL), a licenced Pension
Fund Administrator.
Management objectives and strategies
The Group has established a solid reputation for excellent customer service and prompt claims
settlement. Our marketing efforts are co-ordinated through a network of 18 Branches manned
by experienced managers and highly motivated sales personnel for effective field coverage.
Other recent and on-going capacity building efforts and performance enhancers embarked on
by the Group’s management include information technology infrastructure to link our offices
nationwide for more excellent standard of service delivery through improved on-line, real-time
customer claims and policy handling processes.
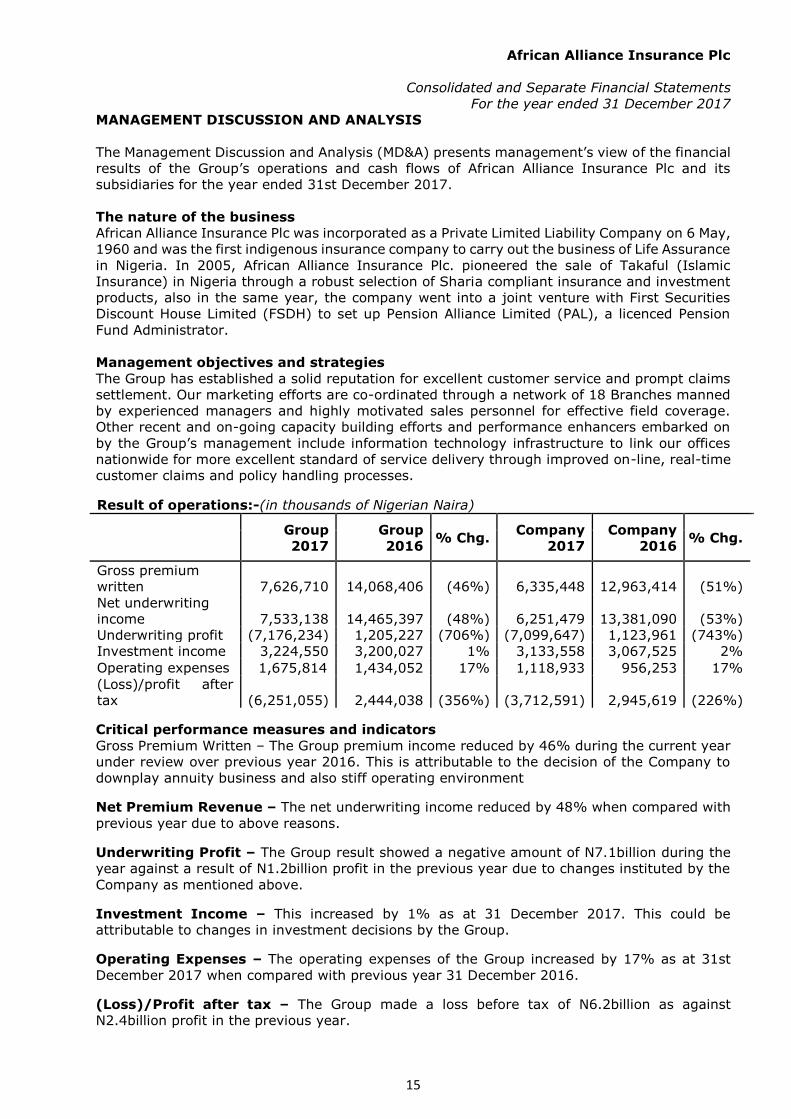
Result of operations:-(in thousands of Nigerian Naira)
Group
2017
Group
2016 % Chg.
Company
2017
Company
2016 % Chg.
Gross premium
written 7,626,710 14,068,406 (46%) 6,335,448 12,963,414 (51%)
Net underwriting
income
7,533,138
14,465,397
(48%)
6,251,479
13,381,090
(53%)
Underwriting profit (7,176,234) 1,205,227 (706%) (7,099,647) 1,123,961 (743%)
Investment income 3,224,550 3,200,027 1% 3,133,558 3,067,525 2%
Operating expenses 1,675,814 1,434,052 17% 1,118,933 956,253 17%
(Loss)/profit after
tax (6,251,055) 2,444,038 (356%) (3,712,591) 2,945,619 (226%)
Critical performance measures and indicators
Gross Premium Written – The Group premium income reduced by 46% during the current year
under review over previous year 2016. This is attributable to the decision of the Company to
downplay annuity business and also stiff operating environment
Net Premium Revenue – The net underwriting income reduced by 48% when compared with
previous year due to above reasons.
Underwriting Profit – The Group result showed a negative amount of N7.1billion during the
year against a result of N1.2billion profit in the previous year due to changes instituted by the
Company as mentioned above.
Investment Income – This increased by 1% as at 31 December 2017. This could be
attributable to changes in investment decisions by the Group.
Operating Expenses – The operating expenses of the Group increased by 17% as at 31st
December 2017 when compared with previous year 31 December 2016.
(Loss)/Profit after tax – The Group made a loss before tax of N6.2billion as against
N2.4billion profit in the previous year.
African Alliance Insurance Plc
Consolidated and Separate Financial Statements
For the year ended 31 December 2017
16
CORPORATE GOVERNANCE
The Group is committed to high standards of Corporate Governance. Corporate Governance
practice in the Group is drawn from various applicable codes of corporate governance issued by
NAICOM and the Code of Governance codes available in the Country. This ensures compliance
with regulatory requirements as well as the core values on which the Group was established.
The Group has developed corporate policies and standards to encourage good and transparent
corporate governance framework to avoid potential conflicts of interest between all stakeholders
whilst promoting ethical business practices.
The activities of the Group are at all times conducted with high standards of professionalism,
accountability and integrity with due regard to the genuine interests of all our stakeholders.
This is the foundation of our history, values and culture as a Group for building and sustaining
an endurable institution that guarantees profitability and professionalism whilst enhancing
shareholders’ value.
African Alliance Insurance Plc is committed to the continuous management of its business
operations by identifying and implementing key governance indicators which aid sustainable
development and guarantee shareholders excellent return on investment.
Governance Structure
The governance of the Group resides with the Board of Directors who are accountable to
shareholders for creating and delivering sustainable value through the management of the
Group’s business. The Board of Directors is responsible for the efficient operation of the Group
and to ensure the Group fully discharges its legal, financial and regulatory responsibilities.
The membership of the Board is a mix of executive and non-executive directors based on
integrity, professionalism, career success, recognition and the ability to add value to the
organisation. In reviewing Board composition, the Board ensures a mix with representatives
from different industry sectors.
The Group’s financial performance is reviewed at each Board meeting. The Board reviews all
financial reports before they are released. The effectiveness of the process for assessing risks
and the execution of control activities are monitored continuously at various levels. This involves
reviews of results in comparison with budgets and plans. Responsibility for maintaining an
effective control environment and operating the system for risk management and internal
control of financial reporting is delegated to the Chief Executive Officer (CEO).
The Group has a compliance program. Standard requirements have been defined for internal
control over financial reporting. The management expects all employees to maintain high moral
and ethical standards and those expectations are communicated to the employees through
internal channels.
The Board monitors the effectiveness of its governance practices, manages potential conflict
and provides general direction to management. These oversight functions of the Board of
Directors are exercised through its various Committees. In the course of the year under review,
the Board has three (3) Committees to ensure the proper management and direction of the
Group via interactive dialogue on a regular basis.
The Board comprises of 4 (Four) members led by a Chairman who is a Non-Executive Director.
2 (Two) Executive Directors, the Managing Director/Chief Executive Officer and Executive
Director for Finance, HR & Admin., 1 (One) Non-Executive Director.
The Board derives its effectiveness from the various skills and vast experiences of each Director.

African Alliance Insurance Plc
Consolidated and Separate Financial Statements
For the year ended 31 December 2017
17
The members of the Board bring various and varied competencies to bear on all Board
deliberations. The Directors have attained the highest pinnacle of their various professions. The
Board meets quarterly and other meetings are convened when necessary and is responsible for
the effective control and monitoring of the Group's strategies.
The Directors are provided with comprehensive information at each of the quarterly Board
meetings and are also briefed on business developments monthly.
The primary responsibility of the Board of Directors is to build long-term shareholders value
and ensure oversight of management. The Board ensures that adequate systems, policies and
procedures are in place to safeguard the assets of the Group. The Board is also responsible to
shareholders for creating and delivering sustainable shareholders value through the
management of the Group’s business.
Responsibilities of the Board
1. The Board determines the Group's objectives and strategies and plans to achieve them.
2. The Board approves mergers and acquisitions, equity investments, branch expansion and
establishment of subsidiaries; approval of remuneration policy and packages of the Board
members.
3. The Board considers and approves the annual budget, monitors performance and ensures
that the Group remains a going concern.
4. The Board approves resolutions and corresponding documentation for shareholders in
general meeting(s), shareholder’s circulars, prospectus and principal regulatory filings
with the regulators.
5. The Board ensures that a risk culture and effective risk management process exists and
is maintained.
6. The Board approves changes to the Group’s corporate structure and changes relating to
the Group capital structure.
7. The Board approves yearly audited financial statements.
8. The Board monitors the statutory audit of the financial statements, evaluates the
independence of the statutory auditor or audit firm, particularly the provision of related
services to the Group and prepares the proposal for resolution on the election of the
auditor. It performs this function through the Board Audit Committee.
9. The Board determines the terms of reference and procedures of the Board committees,
including reviewing and approving the reports of such committees where appropriate.
10. The Board ensures that an adequate budgetary and planning process exists such that
performance is measured against budgets and plans.
11. The Board reviews annually the description of the main features of the internal control and
risk management systems in relation to the financial reporting process.
12. The Board ensures evaluation, compensation and succession for Key Management Roles
13. The Board performs oversight of the Management of Risks and the Implementation of
Internal Controls
Composition of the Board
Anthony Okocha - Alternate Chairman
Funmi Omo - Managing Director/CEO
Olabisi Adekola - Executive Director
Abayomi Mumuni - Non-Executive Director
Board Meetings
The Board of Directors meetings are held every quarter or as the need arises to consider the
Financial Statement of the Group for the period, review of management accounts for the
quarter, consider the reports and minutes of Board committees, consider the report of risk
assessment and resolution and any other reports pertaining to issues within the purview of the
Board’s responsibilities.

African Alliance Insurance Plc
Consolidated and Separate Financial Statements
For the year ended 31 December 2017
18
Board Committees
The Board discharges its responsibilities through the different committees and is regularly
informed about the work of the committees by their respective chairman.
The Board has three standing (3) Committees, namely:
(1) Audit and Compliance Committee,
(2) Board Finance, Investment Committee,
(3) Board Enterprise Risk Management and Governance Committee
The Committees make recommendations to the Board, which retains responsibility for final
decision making.
All Committees report to the Board and as such must conform to the regulations laid down by
the Board, with well-defined terms of reference contained in the charter of each Committee.
The Committees render reports to the Board at the Board’s quarterly meetings.
A summary of the functions of each committee is stated below:
Audit and Compliance Committee
The Committee held four meetings during the year. Section 359(6) of the Companies and Allied
Matters Act Cap C20, Laws of the Federation of Nigeria, 2004 provides for the functions of this
committee. In addition, the 2011 Securities and Exchange Commission (SEC) Code of Corporate
Governance also assigns responsibilities to the Committee. In addition to this, a Board Audit
Committee is constituted to further ensure compliance to the statutory requirements.
The Committee provides oversight responsibility for the audit, regulatory, compliance and risk
functions of the Group. The Committee also discusses the quarterly compliance reports and
takes delivery of the audit reports and statements by the external auditor. The Committee
monitors the effectiveness of the Group's internal control system, risk management system,
compliance system and internal audit system. The committee recommends the appointment of
external auditors and monitors its independence and quality and review audit fee of the external
auditor.
Core responsibilities of the Committee include:
1. Monitoring the effectiveness of internal control and processes in the Group
2. Setting and overseeing the overall standard for financial reporting and internal controls
within the Group
3. Reviewing and assessing the quality of the work done by the professionals responsible
for financial reporting
4. Engaging in discussions with external and internal auditor on the quality and acceptability
of the control environment and reporting structure.
Board Finance, Investment and Committee
The Finance, Investment and Committee monitors and reviews the Group's investment policies,
it ensures at all times that the Group's investment policies reflect the objectives of safety and
maintenance of fair returns on investments. The Committee equally establishes standards, rules
and guidelines for the Group's investment management operations while also reviewing the
Group's Investment strategy with a view to sustaining medium to long term competitive edge.
The value of the Group’s marked-to-market portfolios is also evaluated by this Committee.

African Alliance Insurance Plc
Consolidated and Separate Financial Statements
For the year ended 31 December 2017
19
Objectives of the Committee include:
1. Assist the Board to oversee the overall management of the company’s finances
2. Support the Board in overseeing the company’s investment strategy and portfolios to
ensure consistency and compliance with set objectives
3. Advise the Board on its oversight responsibilities in relation to human capital issues in
general, and in specific, the recruitment, compensation and benefits
4. Provide broad guidance to the Board on other generic but strategic matters including but
not limited to customer satisfaction, corporate communications etc
5. Assess the company’s financial statements including the income statement, statement of
financial position, statement of changes in equity and the statement of cash flow
6. Review the quality of the company’s investment portfolio with a view to appraising
performance and recommending necessary improvements.
7. Review the process for determining provision for investment losses and the adequacy of
provisions made.
Core responsibilities of the Committee include:
1. The committee reviews and recommends for the board’s approval the company’s annual
operating budget
2. The committee reviews the capital adequacy and requirements of the company and make
recommendations.
3. Ensure that the Company’s Investment Portfolio is structured to meet the minimum
requirement for Investments as per Insurance Act 2003
4. Review and make recommendations to the Board regarding investment strategy, policy
and guidelines, its implementation and compliance with those policies and guidelines
5. Ensure that the liability of insurance contracts are adequately matched against their
maturity Profiles.
6. Periodically review the performance of the major securities and financial instruments
relative to the investment portfolio of the company.
7. The committee annually reviews the company’ policies with respect to financial risk
assessment and financial risk management.
The Committee met three times during the year to review the financial performance of Group
and approve the management and performance of the investment portfolio for the Group.
Board Enterprise Risk Management and Governance Committee
The Enterprise Risk Management and Governance Committee assist the Board in the
development and implementation of a comprehensive Enterprise Risk Management framework
in line with NAICOM’s risk management guidelines. It reviews and monitors the Enterprise Risk
Management practices of the Company. The Committee also ensures the development and
implementation of an appropriate corporate governance framework for the Company while it
also reviews and monitors the corporate governance practices and the implementation of the
corporate strategy in the context of prevailing trends in the business landscape.
Objectives of the Committee include:
1· The development and implementation of a comprehensive enterprise risk management
framework in line with NAICOM’s risk management guidelines, and where possible,
international best practices on risk management.
2· Reviewing and monitoring of the enterprise risk management practices of the Company
and providing improvement recommendations where necessary.
3· Overseeing the development and implementation of a Business Continuity Plan for the
Company relative to existing and emerging risks.
4· Ensuring the development and implementation of an appropriate corporate governance
framework for the Company in line with NAICOM’s code of corporate governance and
international best practices.
African Alliance Insurance Plc
Consolidated and Separate Financial Statements
For the year ended 31 December 2017
20
5· Reviewing and monitoring the corporate governance practices and providing improvement
recommendations where necessary.
6· Monitoring the implementation of the corporate strategy in the context of prevailing trends
in the business landscape.
7· Supervising the strategic activities and initiatives of key operational functions of the
Company.
Core responsibilities of the Committee include:
1. Oversee the development, and when necessary, the review of the enterprise risk
management framework, policies and procedures.
2. Review the adequacy of the risk control activities and provide additional control measures
where necessary.
3. Ensure that the enterprise risk management framework includes processes for the
identification, assessment, control and mitigation of all categories of risks.
4. Escalate high impact risks to the Board as deemed necessary for further consideration with
a view to promptly intervening in the mitigation of such risks.
5. Support the Board and Management in the process of defining short to medium term
strategic aspirations and objectives for the Company.
6. Review the implementation status of key strategic initiatives as defined in the approved
corporate strategy and make necessary recommendations.
7. Continuously monitor conflict of interests within Management and Board Members and
advise the Board on addressing same.
8. Work in conjunction with the Management and other relevant board committees in ensuring
that the integrity of the Companies’ accounting and reporting systems are maintained.
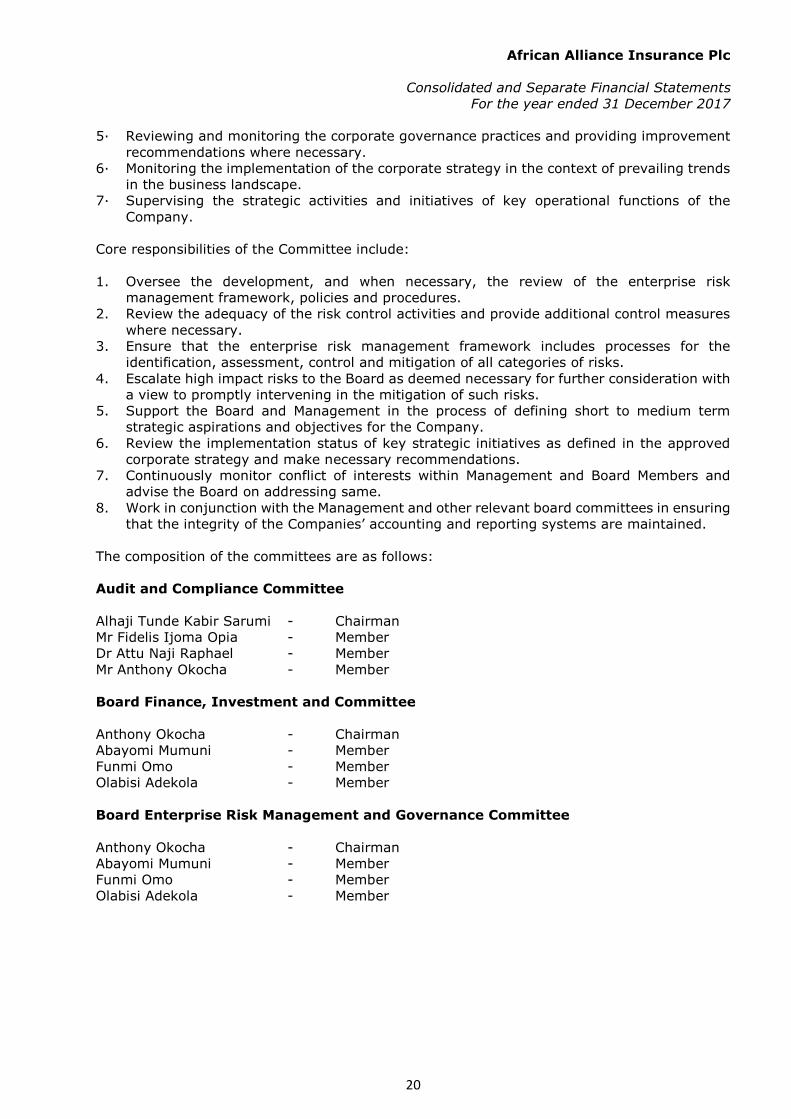
The composition of the committees are as follows:
Audit and Compliance Committee
Alhaji Tunde Kabir Sarumi - Chairman
Mr Fidelis Ijoma Opia - Member
Dr Attu Naji Raphael - Member
Mr Anthony Okocha - Member
Board Finance, Investment and Committee
Anthony Okocha - Chairman
Abayomi Mumuni - Member
Funmi Omo - Member
Olabisi Adekola - Member
Board Enterprise Risk Management and Governance Committee
Anthony Okocha - Chairman
Abayomi Mumuni - Member
Funmi Omo - Member
Olabisi Adekola - Member

African Alliance Insurance Plc
Consolidated and Separate Financial Statements
For the year ended 31 December 2017
21
Attendance of Board and Committee
meetings
2017
Board Meetings
Composition
No of
meetings
attended
02
Mar
11
May
2
Aug
30
Nov
12
Dec
Anthony Okocha Chairman
5 * * * * *
Abayomi Mumuni Member 5 * * * * *
Funmi Omo Member 5 * * * * *
Olabisi Adekola Member 5 * * * * *
Audit and Compliance
Committee
Composition
No of
meetings
attended
14
Feb
23
May
25
Jul
31
Oct
Alhaji Tunde Kabir Sarumi Chairman 4 * * * *
Mr Fidelis Ijoma Opia Member 4 * * * *
Dr Attu Naji Raphael Member 4 * * * *
Mr Anthony Okocha Member 4 * * * *
Board Finance,
Investment and
General Purpose
Committee Composition
No of
meetings
attended
01
Mar
03
Nov
12
Dec
Anthony Okocha Chairman 3 * * *
Abayomi Mumuni Member 3 * * *
Funmi Omo Member 3 * * *
Olabisi Adekola Member 3 * * *
Board Enterprise Risk
Management and
Governance Committee Composition
No of
meetings
attended
22
May
03
Nov
12
Dec
Anthony Okocha Chairman 3 * * *
Abayomi Mumuni Member 3 * * *
Funmi Omo Member 3 * * *
Olabisi Adekola Member 3 * * *
*connotes present
-connotes absent
Support Committees
Executive Management Committee (ExCo)
This Committee reports to the Board on activities of the Group. The Committee Members are
staff on executive management level. The Committee meets regularly to deliberate on various
activities.
The Committee is responsible for the following:
i) ensuring alignment of Group's strategy and plan with operations activities.
ii) reviewing strategic and business performance against approved plans and budget of the
Group, and agreeing recommendations and corrective actions.
iii) discussing and monitoring compliance with policies.
African Alliance Insurance Plc
Consolidated and Separate Financial Statements
For the year ended 31 December 2017
22
Management Executive Committee
This committee reports to the Board Investment Committee on investment activities of the
Group. The Committee meets weekly to discuss and review the portfolio of the Group. The
Committee members are:
MD/ CEO - Chairman
Chief Financial Officer - Member
Head, Group Life Marketing - Member
Head, Agency Operations - Member
Head, Information Technology - Member
Head, Risk Management - Member
Head, Internal Audit & Control - Member
Whistle blowing procedures
The whistle-blowing process involves steps that should be taken by the whistle-blower in
reporting a reportable misconduct, and steps required for the investigation of the reported
misconduct. The Company has a procedure that encourages staff and other relevant
stakeholders to report perceived unethical or illegal conduct of employees, management,
directors and other stakeholders across the Group to appropriate authorities in a confidential
manner without any fear of harassment, intimidation, victimization or reprisal of anyone for
raising concern(s) under this policy.
The Board of Directors and Management is committed towards promoting a culture of openness,
accountability and Integrity, and will not tolerate any harassment, victimization or
discrimination of the whistle blower provided such disclosure is made in good faith with
reasonable belief that what is being reported is fact. The company has dedicated email address
and telephone numbers through which staff are encouraged to raise any concern or unethical
conduct.

African Alliance Insurance Plc
Consolidated and Separate Financial Statements
For the year ended 31 December 2017
23
RESULTS AT A GLANCE
Group Company
31-Dec-17 31-Dec-16 31-Dec-17 31-Dec-16
COMPREHENSIVE INCOME
STATEMENT N'000 N'000 N'000 N'000
Gross premium written 7,626,710 14,068,406 6,335,448 12,963,414
Gross premium income 7,586,932 14,523,181 6,295,670 13,418,189
Net premium income 7,527,926 14,452,052 6,246,267 13,367,745
Investment income 3,245,257 2,548,409 3,149,636 2,470,980
(Loss)/Profit before tax (6,726,979) 2,774,855 (4,167,907) 3,216,247
(Loss)/Profit after tax (6,251,055) 2,444,038 (3,712,591) 2,945,619
Group Company
31-Dec-17 31-Dec-16 31-Dec-17 31-Dec-16
STATEMENT OF FINANCIAL
POSITION N'000 N'000 N'000 N'000
Total assets 43,830,646 45,648,170 41,289,651 41,133,110
Insurance and investment
contract liabilities 41,305,557 37,022,992 39,463,472 35,515,923
Total liabilities 44,341,824 40,185,745 41,571,213 37,751,639
Total Equity (511,178) 5,462,425 (281,562) 3,381,471
(Loss)/Earnings per share
(basic) - in kobo (30) 12 (18) 14

African Alliance Insurance Plc
Consolidated and Separate Financial Statements
For the year ended 31 December 2017
STATEMENT OF SIGNIFICANT ACCOUNTING POLICIES
29
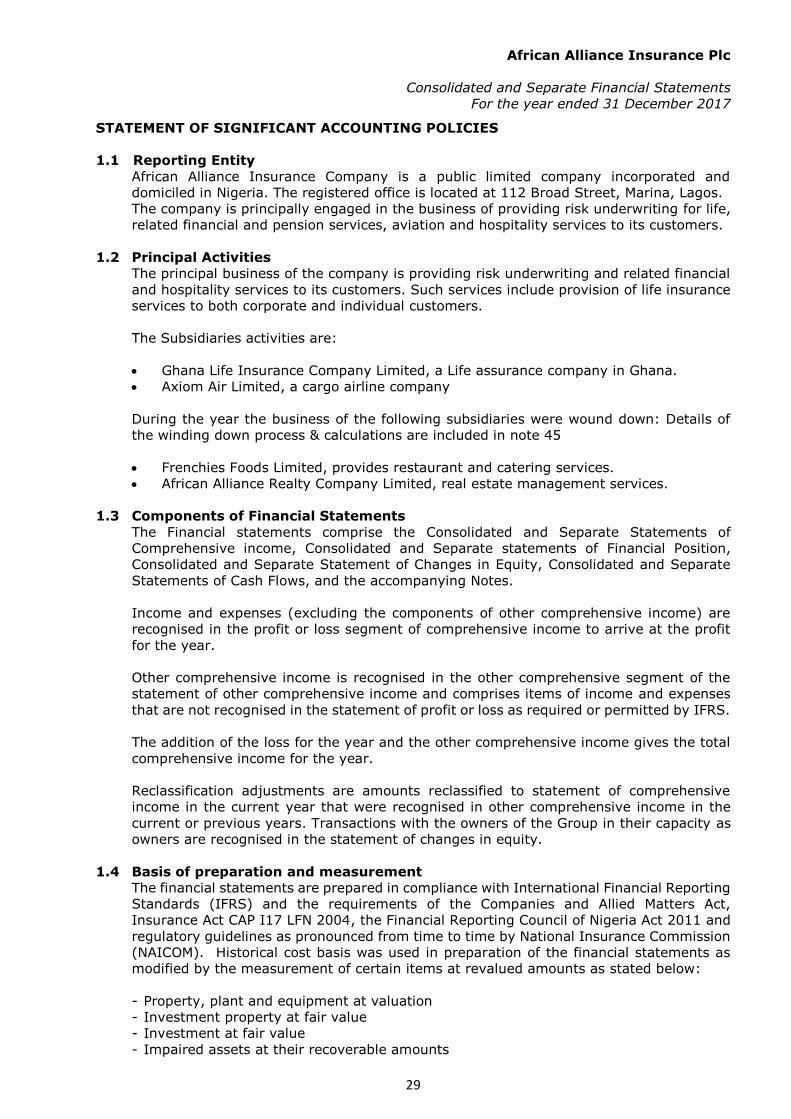
1.1 Reporting Entity
African Alliance Insurance Company is a public limited company incorporated and
domiciled in Nigeria. The registered office is located at 112 Broad Street, Marina, Lagos.
The company is principally engaged in the business of providing risk underwriting for life,
related financial and pension services, aviation and hospitality services to its customers.
1.2 Principal Activities
The principal business of the company is providing risk underwriting and related financial
and hospitality services to its customers. Such services include provision of life insurance
services to both corporate and individual customers.
The Subsidiaries activities are:
• Ghana Life Insurance Company Limited, a Life assurance company in Ghana.
• Axiom Air Limited, a cargo airline company
During the year the business of the following subsidiaries were wound down: Details of
the winding down process & calculations are included in note 45
• Frenchies Foods Limited, provides restaurant and catering services.
• African Alliance Realty Company Limited, real estate management services.
1.3 Components of Financial Statements
The Financial statements comprise the Consolidated and Separate Statements of
Comprehensive income, Consolidated and Separate statements of Financial Position,
Consolidated and Separate Statement of Changes in Equity, Consolidated and Separate
Statements of Cash Flows, and the accompanying Notes.
Income and expenses (excluding the components of other comprehensive income) are
recognised in the profit or loss segment of comprehensive income to arrive at the profit
for the year.
Other comprehensive income is recognised in the other comprehensive segment of the
statement of other comprehensive income and comprises items of income and expenses
that are not recognised in the statement of profit or loss as required or permitted by IFRS.
The addition of the loss for the year and the other comprehensive income gives the total
comprehensive income for the year.
Reclassification adjustments are amounts reclassified to statement of comprehensive
income in the current year that were recognised in other comprehensive income in the
current or previous years. Transactions with the owners of the Group in their capacity as
owners are recognised in the statement of changes in equity.
1.4 Basis of preparation and measurement
The financial statements are prepared in compliance with International Financial Reporting
Standards (IFRS) and the requirements of the Companies and Allied Matters Act,
Insurance Act CAP I17 LFN 2004, the Financial Reporting Council of Nigeria Act 2011 and
regulatory guidelines as pronounced from time to time by National Insurance Commission
(NAICOM). Historical cost basis was used in preparation of the financial statements as
modified by the measurement of certain items at revalued amounts as stated below:
- Property, plant and equipment at valuation
- Investment property at fair value
- Investment at fair value
- Impaired assets at their recoverable amounts

African Alliance Insurance Plc
Consolidated and Separate Financial Statements
For the year ended 31 December 2017
STATEMENT OF SIGNIFICANT ACCOUNTING POLICIES
30
1.5 Compliance with IFRS
These financial statements have been prepared in accordance with the International
Financial Reporting Standards (IFRS) and IFRS Interpretations Committee (IFRIC)
Interpretations applicable to companies reporting under IFRS as issued by the
International Accounting Standards Board (IASB). Additional information required by
national regulations have been included where appropriate
1.6 Going Concern status
As at the end of the financial year 31 December 2017, the following negative regulatory
indicators were identified:
1. The company’s solvency margin is below the regulatory requirement as stated in the
Insurance Act CAP I17, LFN 2004. The company reported a solvency margin deficit of
N5.5 billion for the year ended 31 December, 2017.
2. The total admissible assets of the company less net insurance and investment contract
liabilities amounted to a deficit of N6billion (Group N6.1billion) as at 31 December
2017.
3. Negative shareholders’ fund amounting to N281 million as at the end of 31 December
2017.
4. The company reported an after tax loss position of N3.7 billion (Group – N6.25 billion)
The Board of Directors have confirmed that all actions below will be implemented subject
to uncertainty relating to the timing and value of these actions. Overall the below actions
will mitigate our going concern issues. However, please refer to different factors for
different actions noted below.
1. Disposal of non-revenue generating assets that are currently in the books of the entity;
2. Ensure that properties that are currently not in the name of the company are changed
and registered in the name of African Alliance Insurance Plc, and dispose those that
are not required for the operations of the entity;
3. Dispose relevant investments. Firm commitment of offer and acceptance have been
made. However, this is subject to the consent and approval of the regulators
(NAICOM).
4. The company is currently conducting plans to request from shareholders and investors
to inject additional capital into the company. However, the success of the capital
raising is dependent on the shareholders and the timing for the conclusion for the
exercise is subject to several factors that might be beyond the expectations of the
company.
5. A cashflow projection have also been prepared by management factoring the above
into the liquidity assessment of the entity as well as the operational requirements of
the entity over the next 24 months. This projection was however premised on a
projected share of the market and year-on-year growth expectations of the company.
There is material uncertainty relating to the company achieving the market share to
support the projected increase in cash flows.
These indicators, based on the performance and financial statements of the company,
including the deficit in the solvency margin as well as the failure of the regulatory
admissible assets of the entity to cover the insurance liabilities, all indicate that a
material uncertainty exists that may cast significant doubt on the company's ability to
continue as a going concern.
The board of directors and management performed an assessment of its ability to
continue as a going concern and is satisfied that it has the resources to continue in
business for the foreseeable future.
Following extensive appraisal of the current situation of the company at various Board
Committee meetings as well as at the Board Meeting, the following plan was agreed
to by the Board in turning around the company.
African Alliance Insurance Plc
Consolidated and Separate Financial Statements
For the year ended 31 December 2017
STATEMENT OF SIGNIFICANT ACCOUNTING POLICIES
31
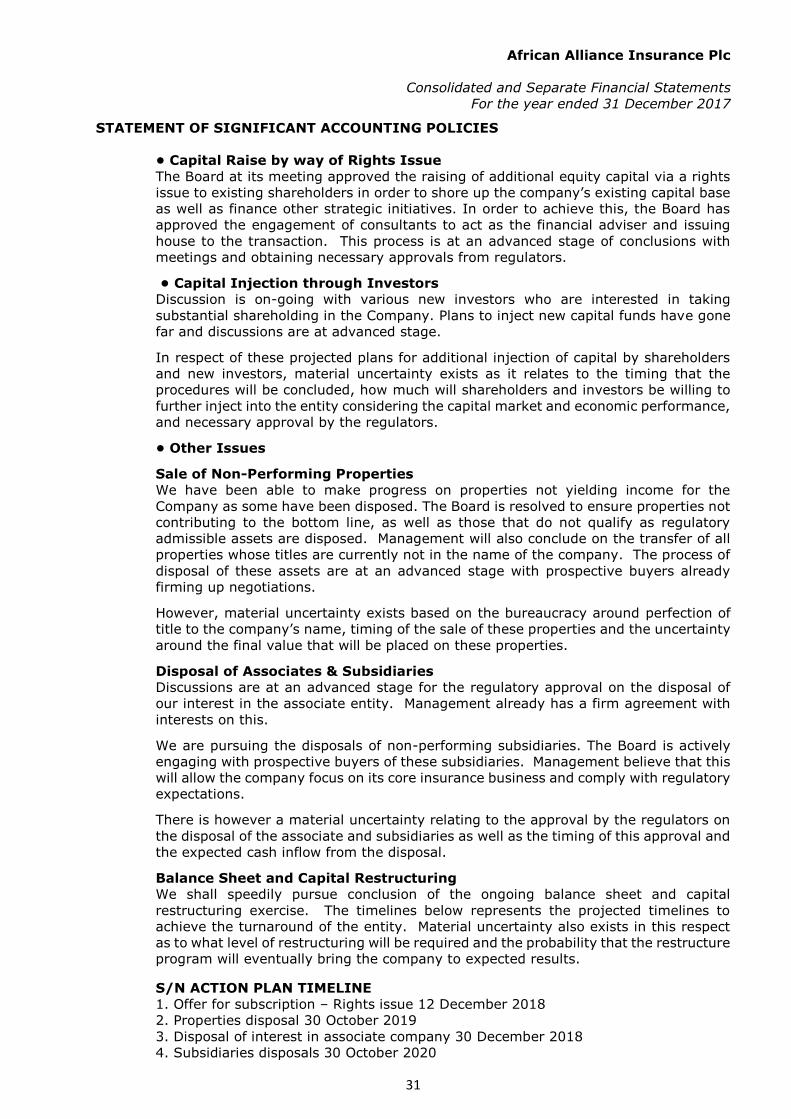
• Capital Raise by way of Rights Issue
The Board at its meeting approved the raising of additional equity capital via a rights
issue to existing shareholders in order to shore up the company’s existing capital base
as well as finance other strategic initiatives. In order to achieve this, the Board has
approved the engagement of consultants to act as the financial adviser and issuing
house to the transaction. This process is at an advanced stage of conclusions with
meetings and obtaining necessary approvals from regulators.
• Capital Injection through Investors
Discussion is on-going with various new investors who are interested in taking
substantial shareholding in the Company. Plans to inject new capital funds have gone
far and discussions are at advanced stage.
In respect of these projected plans for additional injection of capital by shareholders
and new investors, material uncertainty exists as it relates to the timing that the
procedures will be concluded, how much will shareholders and investors be willing to
further inject into the entity considering the capital market and economic performance,
and necessary approval by the regulators.
• Other Issues
Sale of Non-Performing Properties
We have been able to make progress on properties not yielding income for the
Company as some have been disposed. The Board is resolved to ensure properties not
contributing to the bottom line, as well as those that do not qualify as regulatory
admissible assets are disposed. Management will also conclude on the transfer of all
properties whose titles are currently not in the name of the company. The process of
disposal of these assets are at an advanced stage with prospective buyers already
firming up negotiations.
However, material uncertainty exists based on the bureaucracy around perfection of
title to the company’s name, timing of the sale of these properties and the uncertainty
around the final value that will be placed on these properties.
Disposal of Associates & Subsidiaries
Discussions are at an advanced stage for the regulatory approval on the disposal of
our interest in the associate entity. Management already has a firm agreement with
interests on this.
We are pursuing the disposals of non-performing subsidiaries. The Board is actively
engaging with prospective buyers of these subsidiaries. Management believe that this
will allow the company focus on its core insurance business and comply with regulatory
expectations.
There is however a material uncertainty relating to the approval by the regulators on
the disposal of the associate and subsidiaries as well as the timing of this approval and
the expected cash inflow from the disposal.
Balance Sheet and Capital Restructuring
We shall speedily pursue conclusion of the ongoing balance sheet and capital
restructuring exercise. The timelines below represents the projected timelines to
achieve the turnaround of the entity. Material uncertainty also exists in this respect
as to what level of restructuring will be required and the probability that the restructure
program will eventually bring the company to expected results.
S/N ACTION PLAN TIMELINE
1. Offer for subscription – Rights issue 12 December 2018
2. Properties disposal 30 October 2019
3. Disposal of interest in associate company 30 December 2018
4. Subsidiaries disposals 30 October 2020
African Alliance Insurance Plc
Consolidated and Separate Financial Statements
For the year ended 31 December 2017
STATEMENT OF SIGNIFICANT ACCOUNTING POLICIES
32
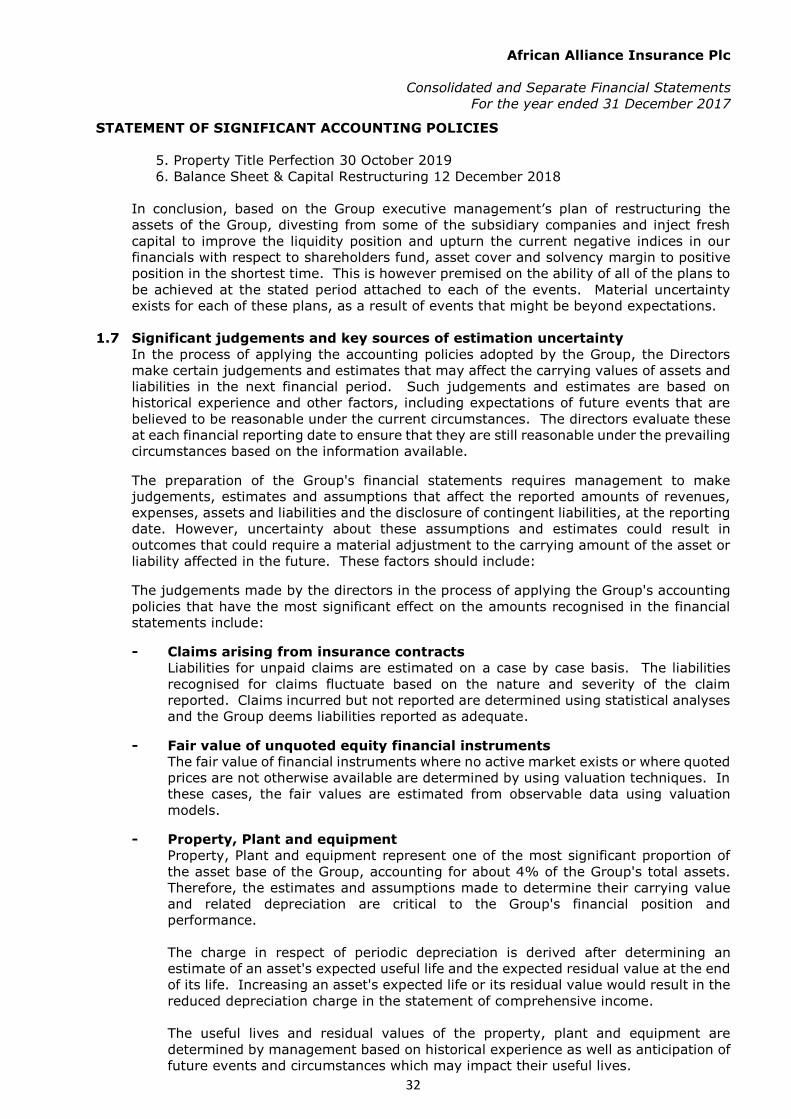
5. Property Title Perfection 30 October 2019
6. Balance Sheet & Capital Restructuring 12 December 2018
In conclusion, based on the Group executive management’s plan of restructuring the
assets of the Group, divesting from some of the subsidiary companies and inject fresh
capital to improve the liquidity position and upturn the current negative indices in our
financials with respect to shareholders fund, asset cover and solvency margin to positive
position in the shortest time. This is however premised on the ability of all of the plans to
be achieved at the stated period attached to each of the events. Material uncertainty
exists for each of these plans, as a result of events that might be beyond expectations.
1.7 Significant judgements and key sources of estimation uncertainty
In the process of applying the accounting policies adopted by the Group, the Directors
make certain judgements and estimates that may affect the carrying values of assets and
liabilities in the next financial period. Such judgements and estimates are based on
historical experience and other factors, including expectations of future events that are
believed to be reasonable under the current circumstances. The directors evaluate these
at each financial reporting date to ensure that they are still reasonable under the prevailing
circumstances based on the information available.
The preparation of the Group's financial statements requires management to make
judgements, estimates and assumptions that affect the reported amounts of revenues,
expenses, assets and liabilities and the disclosure of contingent liabilities, at the reporting
date. However, uncertainty about these assumptions and estimates could result in
outcomes that could require a material adjustment to the carrying amount of the asset or
liability affected in the future. These factors should include:
The judgements made by the directors in the process of applying the Group's accounting
policies that have the most significant effect on the amounts recognised in the financial
statements include:
- Claims arising from insurance contracts
Liabilities for unpaid claims are estimated on a case by case basis. The liabilities
recognised for claims fluctuate based on the nature and severity of the claim
reported. Claims incurred but not reported are determined using statistical analyses
and the Group deems liabilities reported as adequate.
- Fair value of unquoted equity financial instruments
The fair value of financial instruments where no active market exists or where quoted
prices are not otherwise available are determined by using valuation techniques. In
these cases, the fair values are estimated from observable data using valuation
models.
- Property, Plant and equipment
Property, Plant and equipment represent one of the most significant proportion of
the asset base of the Group, accounting for about 4% of the Group's total assets.
Therefore, the estimates and assumptions made to determine their carrying value
and related depreciation are critical to the Group's financial position and
performance.
The charge in respect of periodic depreciation is derived after determining an
estimate of an asset's expected useful life and the expected residual value at the end
of its life. Increasing an asset's expected life or its residual value would result in the
reduced depreciation charge in the statement of comprehensive income.
The useful lives and residual values of the property, plant and equipment are
determined by management based on historical experience as well as anticipation of
future events and circumstances which may impact their useful lives.
African Alliance Insurance Plc
Consolidated and Separate Financial Statements
For the year ended 31 December 2017
STATEMENT OF SIGNIFICANT ACCOUNTING POLICIES
33
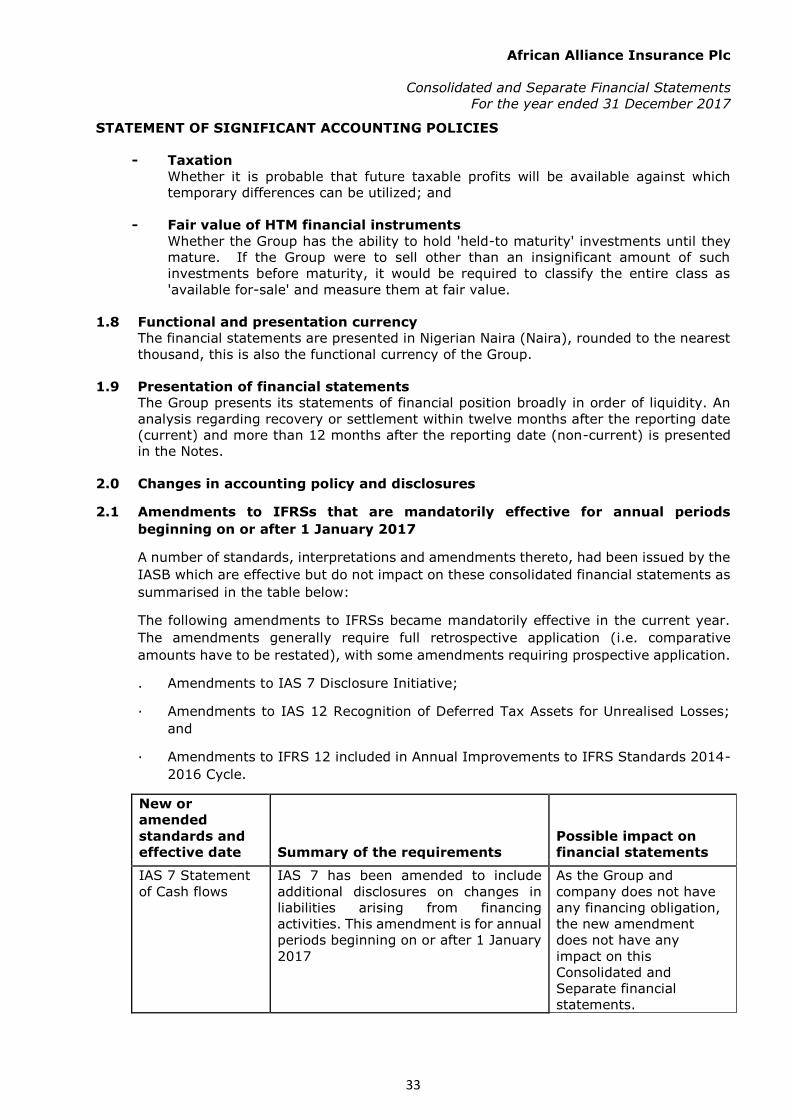
- Taxation
Whether it is probable that future taxable profits will be available against which
temporary differences can be utilized; and
- Fair value of HTM financial instruments
Whether the Group has the ability to hold 'held-to maturity' investments until they
mature. If the Group were to sell other than an insignificant amount of such
investments before maturity, it would be required to classify the entire class as
'available for-sale' and measure them at fair value.
1.8 Functional and presentation currency
The financial statements are presented in Nigerian Naira (Naira), rounded to the nearest
thousand, this is also the functional currency of the Group.
1.9 Presentation of financial statements
The Group presents its statements of financial position broadly in order of liquidity. An
analysis regarding recovery or settlement within twelve months after the reporting date
(current) and more than 12 months after the reporting date (non-current) is presented
in the Notes.
2.0 Changes in accounting policy and disclosures
2.1 Amendments to IFRSs that are mandatorily effective for annual periods
beginning on or after 1 January 2017
A number of standards, interpretations and amendments thereto, had been issued by the
IASB which are effective but do not impact on these consolidated financial statements as
summarised in the table below:
The following amendments to IFRSs became mandatorily effective in the current year.
The amendments generally require full retrospective application (i.e. comparative
amounts have to be restated), with some amendments requiring prospective application.
. Amendments to IAS 7 Disclosure Initiative;
· Amendments to IAS 12 Recognition of Deferred Tax Assets for Unrealised Losses;
and
· Amendments to IFRS 12 included in Annual Improvements to IFRS Standards 2014-
2016 Cycle.
New or
amended
standards and
effective date Summary of the requirements
Possible impact on
financial statements
IAS 7 Statement
of Cash flows
IAS 7 has been amended to include
additional disclosures on changes in
liabilities arising from financing
activities. This amendment is for annual
periods beginning on or after 1 January
2017
As the Group and
company does not have
any financing obligation,
the new amendment
does not have any
impact on this
Consolidated and
Separate financial
statements.
African Alliance Insurance Plc
Consolidated and Separate Financial Statements
For the year ended 31 December 2017
STATEMENT OF SIGNIFICANT ACCOUNTING POLICIES
34
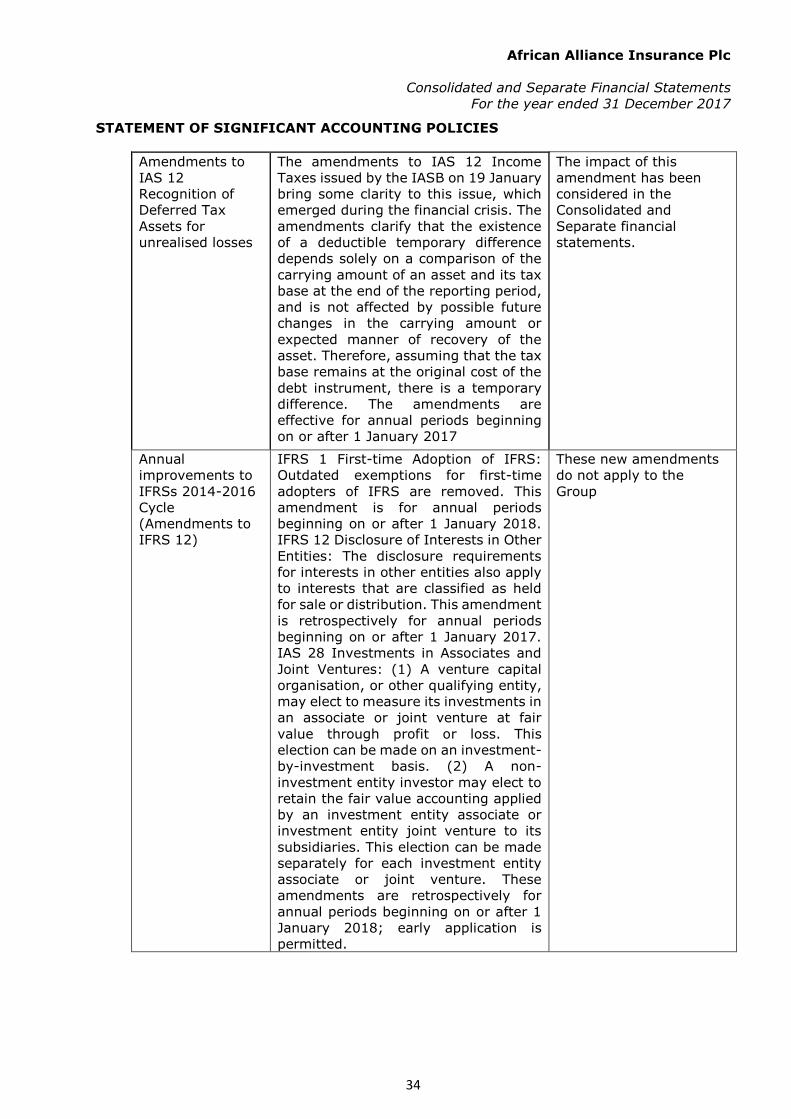
Amendments to
IAS 12
Recognition of
Deferred Tax
Assets for
unrealised losses
The amendments to IAS 12 Income
Taxes issued by the IASB on 19 January
bring some clarity to this issue, which
emerged during the financial crisis. The
amendments clarify that the existence
of a deductible temporary difference
depends solely on a comparison of the
carrying amount of an asset and its tax
base at the end of the reporting period,
and is not affected by possible future
changes in the carrying amount or
expected manner of recovery of the
asset. Therefore, assuming that the tax
base remains at the original cost of the
debt instrument, there is a temporary
difference. The amendments are
effective for annual periods beginning
on or after 1 January 2017
The impact of this
amendment has been
considered in the
Consolidated and
Separate financial
statements.
Annual
improvements to
IFRSs 2014-2016
Cycle
(Amendments to
IFRS 12)
IFRS 1 First-time Adoption of IFRS:
Outdated exemptions for first-time
adopters of IFRS are removed. This
amendment is for annual periods
beginning on or after 1 January 2018.
IFRS 12 Disclosure of Interests in Other
Entities: The disclosure requirements
for interests in other entities also apply
to interests that are classified as held
for sale or distribution. This amendment
is retrospectively for annual periods
beginning on or after 1 January 2017.
IAS 28 Investments in Associates and
Joint Ventures: (1) A venture capital
organisation, or other qualifying entity,
may elect to measure its investments in
an associate or joint venture at fair
value through profit or loss. This
election can be made on an investment-
by-investment basis. (2) A non-
investment entity investor may elect to
retain the fair value accounting applied
by an investment entity associate or
investment entity joint venture to its
subsidiaries. This election can be made
separately for each investment entity
associate or joint venture. These
amendments are retrospectively for
annual periods beginning on or after 1
January 2018; early application is
permitted.
These new amendments
do not apply to the
Group
African Alliance Insurance Plc
Consolidated and Separate Financial Statements
For the year ended 31 December 2017
STATEMENT OF SIGNIFICANT ACCOUNTING POLICIES
35
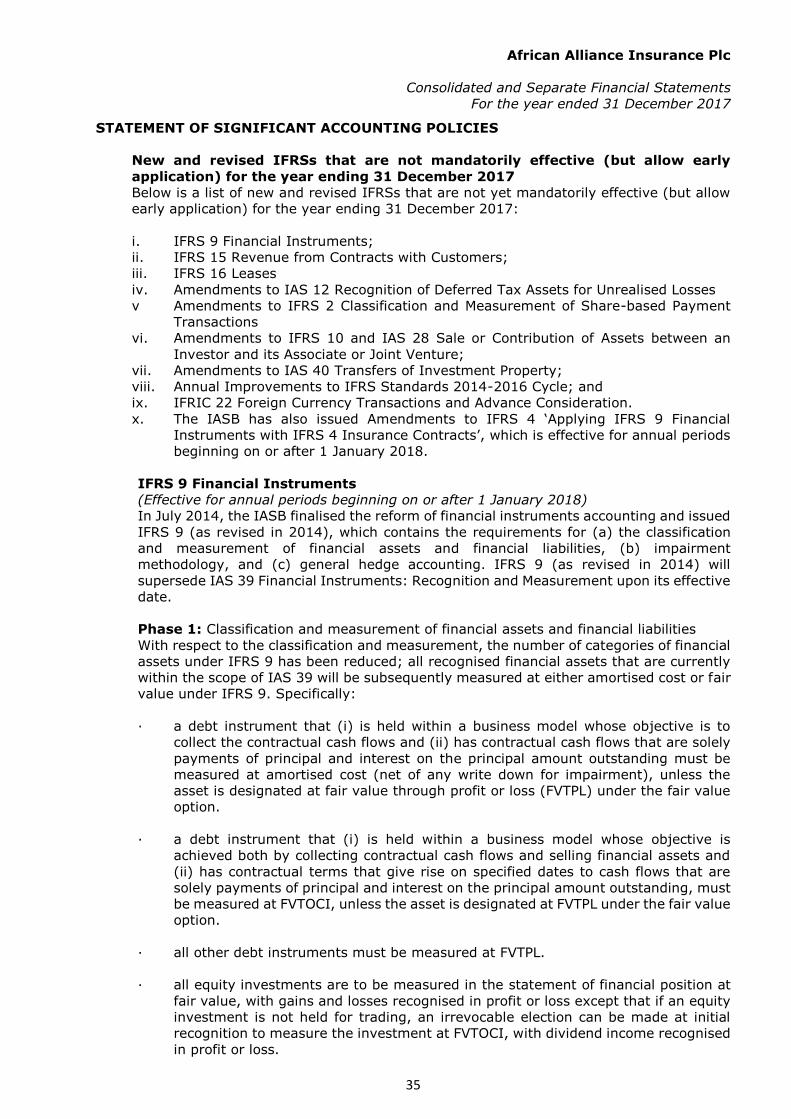
New and revised IFRSs that are not mandatorily effective (but allow early
application) for the year ending 31 December 2017
Below is a list of new and revised IFRSs that are not yet mandatorily effective (but allow
early application) for the year ending 31 December 2017:
i. IFRS 9 Financial Instruments;
ii. IFRS 15 Revenue from Contracts with Customers;
iii. IFRS 16 Leases
iv. Amendments to IAS 12 Recognition of Deferred Tax Assets for Unrealised Losses
v Amendments to IFRS 2 Classification and Measurement of Share-based Payment
Transactions
vi. Amendments to IFRS 10 and IAS 28 Sale or Contribution of Assets between an
Investor and its Associate or Joint Venture;
vii. Amendments to IAS 40 Transfers of Investment Property;
viii. Annual Improvements to IFRS Standards 2014-2016 Cycle; and
ix. IFRIC 22 Foreign Currency Transactions and Advance Consideration.
x. The IASB has also issued Amendments to IFRS 4 ‘Applying IFRS 9 Financial
Instruments with IFRS 4 Insurance Contracts’, which is effective for annual periods
beginning on or after 1 January 2018.
IFRS 9 Financial Instruments
(Effective for annual periods beginning on or after 1 January 2018)
In July 2014, the IASB finalised the reform of financial instruments accounting and issued
IFRS 9 (as revised in 2014), which contains the requirements for (a) the classification
and measurement of financial assets and financial liabilities, (b) impairment
methodology, and (c) general hedge accounting. IFRS 9 (as revised in 2014) will
supersede IAS 39 Financial Instruments: Recognition and Measurement upon its effective
date.
Phase 1: Classification and measurement of financial assets and financial liabilities
With respect to the classification and measurement, the number of categories of financial
assets under IFRS 9 has been reduced; all recognised financial assets that are currently
within the scope of IAS 39 will be subsequently measured at either amortised cost or fair
value under IFRS 9. Specifically:
· a debt instrument that (i) is held within a business model whose objective is to
collect the contractual cash flows and (ii) has contractual cash flows that are solely
payments of principal and interest on the principal amount outstanding must be
measured at amortised cost (net of any write down for impairment), unless the
asset is designated at fair value through profit or loss (FVTPL) under the fair value
option.
· a debt instrument that (i) is held within a business model whose objective is
achieved both by collecting contractual cash flows and selling financial assets and
(ii) has contractual terms that give rise on specified dates to cash flows that are
solely payments of principal and interest on the principal amount outstanding, must
be measured at FVTOCI, unless the asset is designated at FVTPL under the fair value
option.
· all other debt instruments must be measured at FVTPL.
· all equity investments are to be measured in the statement of financial position at
fair value, with gains and losses recognised in profit or loss except that if an equity
investment is not held for trading, an irrevocable election can be made at initial
recognition to measure the investment at FVTOCI, with dividend income recognised
in profit or loss.
African Alliance Insurance Plc
Consolidated and Separate Financial Statements
For the year ended 31 December 2017
STATEMENT OF SIGNIFICANT ACCOUNTING POLICIES
36
IFRS 9 also contains requirements for the classification and measurement of financial
liabilities and derecognition requirements. One major change from IAS 39 relates to the
presentation of changes in the fair value of a financial liability designated as at FVTPL
attributable to changes in the credit risk of that liability. Under IFRS 9, such changes are
presented in other comprehensive income, unless the presentation of the effect of the
change in the liability’s credit risk in other comprehensive income would create or enlarge
an accounting mismatch in profit or loss. Changes in fair value attributable to a financial
liability’s credit risk are not subsequently reclassified to profit or loss. Under IAS 39, the
entire amount of the change in the fair value of the financial liability designated as FVTPL
is presented in profit or loss.
Phase 2: Impairment methodology
The impairment model under IFRS 9 reflects expected credit losses, as opposed to
incurred credit losses under IAS 39. Under the impairment approach in IFRS 9, it is no
longer necessary for a credit event to have occurred before credit losses are recognised.
Instead, an entity always accounts for expected credit losses and changes in those
expected credit losses. The amount of expected credit losses should be updated at each
reporting date to reflect changes in credit risk since initial recognition.
Phase 3: Hedge accounting
The general hedge accounting requirements of IFRS 9 retain the three types of hedge
accounting mechanisms in IAS 39. However, greater flexibility has been introduced to
the types of transactions eligible for hedge accounting, specifically broadening the types
of instruments that qualify as hedging instruments and the types of risk components of
non-financial items that are eligible for hedge accounting. In addition, the effectiveness
test has been overhauled and replaced with the principle of an ‘economic relationship’.
Retrospective assessment of hedge effectiveness is no longer required. Far more
disclosure requirements about an entity’s risk management activities have been
introduced.
The work on macro hedging by the IASB is still at a preliminary stage - a discussion paper
was issued in April 2014 to gather preliminary views and direction from constituents with
a period which ended on 17 October 2014. The project is under redeliberation at the time
of writing.
Transitional provisions
IFRS 9 (as revised in 2014) is effective for annual periods beginning on or after 1 January
2018 with earlier application permitted. If an entity elects to apply IFRS 9 early, it must
apply all of the requirements in IFRS 9 at the same time, except for those relating to:
1. the presentation of fair value gains and losses attributable to changes in the credit
risk of financial liabilities designated as at FVTPL, the requirements for which an
entity may early apply without applying the other requirements in IFRS 9; and
2. hedge accounting, for which an entity may choose to continue to apply the hedge
accounting requirements of IAS 39 instead of the requirements of IFRS 9.
An entity may early apply the earlier versions of IFRS 9 instead of the 2014 version if the
entity’s date of initial application of IFRS 9 is before 1 February 2015. The date of initial
application is the beginning of the reporting period when an entity first applies the
requirements of IFRS 9.
IFRS 9 contains specific transitional provisions for i) classification and measurement of
financial assets; ii) impairment of financial assets; and iii) hedge accounting. Please see
IFRS 9 for details.
African Alliance Insurance Plc
Consolidated and Separate Financial Statements
For the year ended 31 December 2017
STATEMENT OF SIGNIFICANT ACCOUNTING POLICIES
37
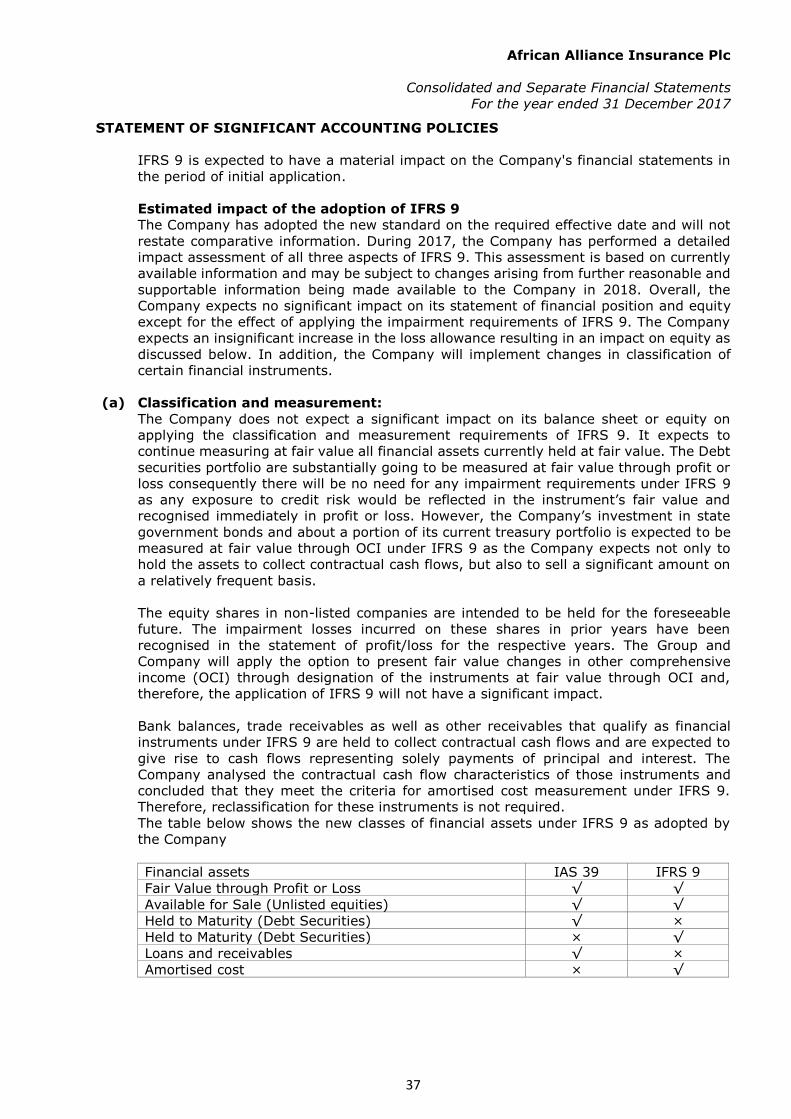
IFRS 9 is expected to have a material impact on the Company's financial statements in
the period of initial application.
Estimated impact of the adoption of IFRS 9
The Company has adopted the new standard on the required effective date and will not
restate comparative information. During 2017, the Company has performed a detailed
impact assessment of all three aspects of IFRS 9. This assessment is based on currently
available information and may be subject to changes arising from further reasonable and
supportable information being made available to the Company in 2018. Overall, the
Company expects no significant impact on its statement of financial position and equity
except for the effect of applying the impairment requirements of IFRS 9. The Company
expects an insignificant increase in the loss allowance resulting in an impact on equity as
discussed below. In addition, the Company will implement changes in classification of
certain financial instruments.
(a) Classification and measurement:
The Company does not expect a significant impact on its balance sheet or equity on
applying the classification and measurement requirements of IFRS 9. It expects to
continue measuring at fair value all financial assets currently held at fair value. The Debt
securities portfolio are substantially going to be measured at fair value through profit or
loss consequently there will be no need for any impairment requirements under IFRS 9
as any exposure to credit risk would be reflected in the instrument’s fair value and
recognised immediately in profit or loss. However, the Company’s investment in state
government bonds and about a portion of its current treasury portfolio is expected to be
measured at fair value through OCI under IFRS 9 as the Company expects not only to
hold the assets to collect contractual cash flows, but also to sell a significant amount on
a relatively frequent basis.
The equity shares in non-listed companies are intended to be held for the foreseeable
future. The impairment losses incurred on these shares in prior years have been
recognised in the statement of profit/loss for the respective years. The Group and
Company will apply the option to present fair value changes in other comprehensive
income (OCI) through designation of the instruments at fair value through OCI and,
therefore, the application of IFRS 9 will not have a significant impact.
Bank balances, trade receivables as well as other receivables that qualify as financial
instruments under IFRS 9 are held to collect contractual cash flows and are expected to
give rise to cash flows representing solely payments of principal and interest. The
Company analysed the contractual cash flow characteristics of those instruments and
concluded that they meet the criteria for amortised cost measurement under IFRS 9.
Therefore, reclassification for these instruments is not required.
The table below shows the new classes of financial assets under IFRS 9 as adopted by
the Company
Financial assets IAS 39 IFRS 9
Fair Value through Profit or Loss √ √
Available for Sale (Unlisted equities) √ √
Held to Maturity (Debt Securities) √ ×
Held to Maturity (Debt Securities) × √
Loans and receivables √ ×
Amortised cost × √

African Alliance Insurance Plc
Consolidated and Separate Financial Statements
For the year ended 31 December 2017
STATEMENT OF SIGNIFICANT ACCOUNTING POLICIES
38
The table below shows the estimated impact of adoption of IFRS 9
Amounts in thousands of Nigerian Naira
As reported as
at 31 December
2017 (N)
Estimated
adjustment due
to the adoption
of IFRS 9 (N)
Retained Earnings (26,146,738) (117,369)
This amount represents the fair value gains on the company’s debt securities as at 31
December 2017 which will be reclassified to profit or loss.
(b) Impairment:
IFRS 9 requires an expected credit loss model (in other words losses expected at the
balance sheet date rather than only losses incurred in the year). This requires the entity
to account for expected credit losses on all its financial instruments not held at fair value
through profit or loss, either on a 12-month or lifetime basis. Changes in this expected
credit losses at each reporting date should reflect changes in credit risk since initial
recognition.
The Directors of the Group have decided to apply the simplified approach and record 12-
month expected losses on all trade receivables and similar assets however the company
is in the process of quantifying the impact of this impairment on the financial statement.
In view of the Group’s decision to classify majority of its asset exposures under Fair Value
Through Profit or Loss, the group expects that there will be no significant impact of the
impairment on these other financial instruments on the company’s financial statements.
Main assumptions:
✓ The impact assessment is conducted with reference to the simplified IFRS 9
approach.
✓ For the purpose of impairment assessment, the classification of the instruments
under IFRS 9 are based on similar classification under IAS 39. i.e. Held for trading
instruments were classified as FVTPL; AFS instruments were classified as FVTOCI
✓ The data was populated by the Company:
o Analysis of debt instrument
o In one selected currency (Nigerian Naira)
✓ The market prices of the debt instruments were gotten from Financial Market
Dealers Quotation (FMDQ) as at 29 December 2017-being the last working day of
the year.
Apart from the above, the directors do not anticipate that the application of the IFRS 9
will have a material impact on the Company’s financial statements.
IFRS 15 Revenue from Contracts with Customers
(Effective for annual periods beginning on or after 1 January 2018)
IFRS 15 establishes a single comprehensive model for entities to use in accounting for
revenue arising from contracts with customers. It will supersede the following revenue
Standards and Interpretations upon its effective date:
• IAS 18 Revenue;
• IAS 11 Construction Contracts;
• IFRIC 13 Customer Loyalty Programmes;
• IFRIC 15 Agreements for the Construction of Real Estate;
• IFRIC 18 Transfers of Assets from Customers; and
• SIC 31 Revenue-Barter Transactions Involving Advertising Services.
African Alliance Insurance Plc
Consolidated and Separate Financial Statements
For the year ended 31 December 2017
STATEMENT OF SIGNIFICANT ACCOUNTING POLICIES
39
As suggested by the title of the new revenue Standard, IFRS 15 will only cover revenue
arising from contracts with customers. Under IFRS 15, a customer of an entity is a party
that has contracted with the entity to obtain goods or services that are an output of the
entity's ordinary activities in exchange for consideration.
Unlike the scope of IAS 18, the recognition and measurement of interest income and
dividend income from debt and equity investments are no longer within the scope of IFRS
15. Instead, they are within the scope of IAS 39 Financial Instruments: Recognition and
Measurement (or IFRS 9 Financial Instruments, if IFRS 9 is early adopted).
As mentioned above, the new revenue Standard has a single model to deal with revenue
from contracts with customers. Its core principle is that an entity should recognise
revenue to depict the transfer of promised goods or services to customers in an amount
that reflects the consideration to which the entity expects to be entitled in exchange for
those goods or services.
The new revenue Standard introduces a 5-step approach to revenue recognition and
measurement:
Step 1: Identify the contract with a customer
Step 2: Identify the performance obligations in the contract
Step 3: Determine the transaction price
Step 4: Allocate the transaction price to the performance obligations in the contract
Step 5: Recognise revenue when (or as) the entity satisfies a performance obligation.
Far more prescriptive guidance has been introduced by the new revenue Standard:
• Whether or not a contract (or a combination of contracts) contains more than one
promised good or service, and if so, when and how the promised goods or services
should be unbundled.
• Whether the transaction price allocated to each performance obligation should be
recognised as revenue over time or at a point in time. Under IFRS 15, an entity
recognises revenue when a performance obligation is satisfied, which is when
‘control’ of the goods or services underlying the particular performance obligation is
transferred to the customer. Unlike IAS 18, the new Standard does not include
separate guidance for 'sales of goods' and 'provision of services'; rather, the new
Standard requires entities to assess whether revenue should be recognised over time
or a particular point in time regardless of whether revenue relates to 'sales of goods'
or 'provision of services'.
• When the transaction price includes a variable consideration element, how it will
affect the amount and timing of revenue to be recognised. The concept of variable
consideration is broad; a transaction price is considered variable due to discounts,
rebates, refunds, credits, price concessions, incentives, performance bonuses,
penalties and contingency arrangements. The new Standard introduces a high hurdle
for variable consideration to be recognised as revenue – that is, only to the extent
that it is highly probable that a significant reversal in the amount of cumulative
revenue recognised will not occur when the uncertainty associated with the variable
consideration is subsequently resolved.
• When costs incurred to obtain a contract and costs to fulfil a contract can be
recognised as an asset.
African Alliance Insurance Plc
Consolidated and Separate Financial Statements
For the year ended 31 December 2017
STATEMENT OF SIGNIFICANT ACCOUNTING POLICIES
40
IFRS 16 Leases
(Effective for annual periods beginning on or after 1 January 2019)
IFRS 16 provides a comprehensive model for the identification of lease arrangements and
their treatment in the financial statements of both lessees and lessors. It will supersede
the following lease Standard and Interpretations upon its effective date:
· IAS 17 Leases;
· IFRIC 4 Determining whether an Arrangement contains a Lease;
· SIC-15 Operating Leases – Incentives; and
· SIC-27 Evaluating the Substance of Transactions Involving the Legal Form of a Lease.
Identification of a lease
IFRS 16 applies a control model to the identification of leases, distinguishing between
leases and service contracts on the basis of whether there is an identified asset controlled
by the customer. Control is considered to exist if the customer has:
a) the right to obtain substantially all of the economic benefits from the use of an
identified asset; and
b) the right to direct the use of that asset.
The Standard provides detailed guidance to determine whether those conditions are met,
including instances where the supplier has substantive substitution rights, and where the
relevant decisions about how and for what purpose the asset is used are predetermined.
Lessee accounting
IFRS 16 introduces significant changes to lessee accounting: it removes the distinction
between operating and finance leases under IAS 17 and requires a lessee to recognise a
right-of-use asset and a lease liability at lease commencement for all leases, except for
short-term leases and leases of low value assets.
The right-of-use asset is initially measured at cost and subsequently measured at cost
(subject to certain exceptions) less accumulated depreciation and impairment losses,
adjusted for any remeasurement of the lease liability.
The lease liability is initially measured at the present value of the lease payments that
are not paid at that date. Subsequently, the lease liability is adjusted for interest and
lease payments, as well as the impact of lease modifications, amongst others.
If a lessee elects not to apply the general requirements of IFRS 16 to short-term leases
(i.e. one that does not include a purchase option and has a lease term at commencement
date of 12 months or less) and leases of low value assets, the lessee should recognise
the lease payments associated with those leases as an expense on either a straight-line
basis over the lease term or another systematic basis, similar to the current accounting
for operating leases.
Lessor accounting
In contrast to lessee accounting, the IFRS 16 lessor accounting requirements remain
largely unchanged from IAS 17, which continue to require a lessor to classify a lease
either as an operating lease or a finance lease.
In addition, IFRS 16 also provides guidance on the accounting for sale and leaseback
transactions. Extensive disclosures are also required by the new Standard.
Due to the prominence of leasing transactions in the economy, many entities across
different industries will be affected by IFRS 16.
African Alliance Insurance Plc
Consolidated and Separate Financial Statements
For the year ended 31 December 2017
STATEMENT OF SIGNIFICANT ACCOUNTING POLICIES
41
In some cases, the changes may be substantial and may require changes to the existing
IT systems and internal controls. Entities should consider the nature and extent of these
changes.
IFRS 16 is effective for reporting periods beginning on or after 1 January 2019 with early
application permitted for entities that apply IFRS 15 at or before the date of initial
application of IFRS 16.
A lessee can apply IFRS 16 either by a full retrospective approach or a modified
retrospective approach. If the latter approach is selected, an entity is not required to
restate the comparative information and the cumulative effect of initially applying IFRS
16 must be presented as an adjustment to opening retained earnings (or other
component of equity as appropriate).
Amendments to IFRS 2 Classification and Measurement of Share-based Payment
Transactions (Effective for annual periods beginning on or after 1 January 2018)
The amendments clarify the following:
1. In estimating the fair value of a cash-settled share-based payment, the accounting
for the effects of vesting and non-vesting conditions should follow the same
approach as for equity-settled share-based payments.
2. Where tax law or regulation requires an entity to withhold a specified number of
equity instruments equal to the monetary value of the employee’s tax obligation to
meet the employee’s tax liability which is then remitted to the tax authority
(typically in cash), i.e. the share-based payment arrangement has a ‘net settlement
feature’, such an arrangement should be classified as equity-settled in its entirety,
provided that the share-based payment would have been classified as equity-settled
had it not included the net settlement feature.
3. A modification of a share-based payment that changes the transaction from cash-
settled to equity-settled should be accounted for as follows:
(i) the original liability is derecognised;
(ii) the equity-settled share-based payment is recognised at the modification date
fair value of the equity instrument granted to the extent that services have
been rendered up to the modification date; and
(iii) any difference between the carrying amount of the liability at the modification
date and the amount recognised in equity should be recognised in profit or
loss immediately.
The amendments are effective for annual reporting periods beginning on or after 1
January 2018 with earlier application permitted. Specific transition provisions apply.
Amendments to IFRS 10 and IAS 28 Sale or Contribution of Assets between an
Investor and its Associate or Joint Venture
The amendments deal with situations where there is a sale or contribution of assets
between an investor and its associate or joint venture.
IAS 28 and IFRS 10 are amended to reflect the following:
. Gains and losses resulting from transactions involving assets that do not constitute
a business between an investor and its associate or joint venture are recognised to
the extent of unrelated investor's interests in the associate or joint venture.
African Alliance Insurance Plc
Consolidated and Separate Financial Statements
For the year ended 31 December 2017
STATEMENT OF SIGNIFICANT ACCOUNTING POLICIES
42
. Gains or losses from downstream transactions involving assets that constitute a
business between an investor and its associate or joint venture should be recognised
in full in the investor's financial statements.
IFRS 10 has been amended to reflect the following:
Gains or losses resulting from the loss of control of a subsidiary that does not contain a
business in a transaction with an associate or a joint venture that is accounted for using
the equity method, are recognised in the parent’s profit or loss only to the extent of the
unrelated investors’ interests in that associate or joint venture. Similarly, gains and losses
resulting from the remeasurement of investments retained in any former subsidiary (that
has become an associate or a joint venture that is accounted for using the equity method)
to fair value are recognised in the former parent’s profit or loss only to the extent of the
unrelated investors’ interests in the new associate or joint venture.
In December 2015, the IASB postponed the effective date of this amendment indefinitely
pending the outcome of its research project on the equity method of accounting. Earlier
application of these amendments is still permitted.
Amendments to IAS 40 Transfers of Investment Property
The amendments clarify that a transfer to, or from, investment property necessitates an
assessment of whether a property meets, or has ceased to meet, the definition of
investment property, supported by observable evidence that a change in use has
occurred. The amendments further clarify that the situations listed in IAS 40 are not
exhaustive and that a change in use is possible for properties under construction (i.e. a
change in use is not limited to completed properties).
The amendments are effective for annual periods beginning on or after 1 January 2018
with earlier application permitted. Entities can apply the amendments either
retrospectively (if this is possible without the use of hindsight) or prospectively. Specific
transition provisions apply.
Annual Improvements to IFRSs 2014 – 2016 Cycle
The Annual Improvements include amendments to a number of IFRSs, which have been
summarised below. The package also includes amendments to IFRS 12 Disclosure of
Interests in Other Entities, which is effective for annual periods beginning on or after 1
January 2017 (see details below).
Standard Subject of
Amendment
Details
IFRS 1 First time
Adoption of
International
Financial
Reporting
Standards
Deletion of short-
term exemptions for
first-time adopters
The amendments delete certain short-term
exemptions in IFRS 1 because the reporting
period to which the exemptions applied have
already passed. As such, these exemptions
are no longer applicable.
IAS 28 Investments in
Associates and
Joint Ventures
Measuring an
associate or joint
venture at fair value
The amendments clarify that the option for
a venture capital organisation and other
similar entities to measure investments in
associates and joint ventures at FVTPL is
available separately for each associate or
joint venture, and that election should be
African Alliance Insurance Plc
Consolidated and Separate Financial Statements
For the year ended 31 December 2017
STATEMENT OF SIGNIFICANT ACCOUNTING POLICIES
43
made at initial recognition of the associate
or joint venture.
In respect of the option for an entity that is
not an investment entity (IE) to retain the
fair value measurement applied by its
associates and joint ventures that are IEs
when applying the equity method, the
amendments make a similar clarification
that this choice is available for each IE
associate or IE joint venture.
The amendments apply retrospectively with
earlier application permitted.
IFRIC 22 Foreign Currency Transactions and Advance Consideration
IFRIC 22 addresses how to determine the ‘date of transaction’ for the purpose of
determining the exchange rate to use on initial recognition of an asset, expense or
income, when consideration for that item has been paid or received in advance in a
foreign currency which resulted in the recognition of a non-monetary asset or non-
monetary liability (for example, a non-refundable deposit or deferred revenue).
The Interpretation specifies that the date of transaction is the date on which the entity
initially recognises the non-monetary asset or non-monetary liability arising from the
payment or receipt of advance consideration. If there are multiple payments or receipts
in advance, the Interpretation requires an entity to determine the date of transaction
for each payment or receipt of advance consideration.
2.2 IFRS 13 Fair Value Measurement (Amendment)
Amendments to the standard provide clarification that issuing IFRS 13 and amending
IFRS 9 and IAS 39 did not remove the ability to measure certain short-term receivables
and payables on an undiscounted basis (amends basis for conclusions only). It also
clarifies the scope of the portfolio exception in paragraph 52. This amendment does not
have any effect on the Group as it does not discount its short-term receivable and
payable balances.
2.3 Consolidation
2.3.1 Subsidiaries
Subsidiaries are all entities (including structured entities) over which the Group has
control. The Group controls an entity when the Group is exposed to, or has rights to,
variable returns from its involvement with the entity and has the ability to affect those
returns through its power over the entity. Subsidiaries are fully consolidated from the
date on which control is transferred to the Group. They are deconsolidated from the date
that control ceases.
The Group applies the acquisition method to account for business combinations. The
consideration transferred for the acquisition of a subsidiary is the fair values of the assets
transferred, the liabilities incurred to the former owners of the acquiree and the equity
interests issued by the Group. The consideration transferred includes the fair value of
any asset or liability resulting from a contingent consideration arrangement. Identifiable
assets acquired and liabilities and contingent liabilities assumed in a business
combination are measured initially at their fair values at the acquisition date. The Group
recognises any non-controlling interest in the acquiree on an acquisition-by-acquisition
basis, either at fair value or at the non-controlling interest’s proportionate share of the
recognised amounts of acquiree’s identifiable net assets.
African Alliance Insurance Plc
Consolidated and Separate Financial Statements
For the year ended 31 December 2017
STATEMENT OF SIGNIFICANT ACCOUNTING POLICIES
44
Acquisition-related costs are expensed as incurred.
If the business combination is achieved in stages, the acquisition date carrying value of
the acquirer’s previously held equity interest in the acquiree is re-measured to fair value
at the acquisition date; any gains or losses arising from such re-measurement are
recognised in profit or loss.
Any contingent consideration to be transferred by the Group is recognised at fair value
at the acquisition date. Subsequent changes to the fair value of the contingent
consideration that is deemed to be an asset or liability is recognised in accordance with
IAS 39 either in profit or loss or as a change to other comprehensive income. Contingent
consideration that is classified as equity is not re-measured, and its subsequent
settlement is accounted for within equity.
Inter-company transactions, balances and unrealised gains on transactions between
Group companies are eliminated. Unrealised losses are also eliminated. When necessary,
amounts reported by subsidiaries have been adjusted to conform with the Group’s
accounting policies.
2.3.2 Changes in ownership interests in subsidiaries without change of control
Transactions with non-controlling interests that do not result in loss of control are
accounted for as equity transactions – that is, as transactions with the owners in their
capacity as owners. The difference between fair value of any consideration paid and the
relevant share acquired of the carrying value of net assets of the subsidiary is recorded
in equity. Gains or losses on disposals to non-controlling interests are also recorded in
equity.
2.3.3 Disposal of subsidiaries
When the group ceases to have control, any retained interest in the entity is remeasured
to its fair value at the date when control is lost, with the change in carrying amount
recognised in profit or loss. The fair value is the initial carrying amount for the purposes
of subsequently accounting for the retained interest as an associate, joint venture or
financial asset. In addition, any amounts previously recognised in other comprehensive
income in respect of that entity are accounted for as if the group had directly disposed
of the related assets or liabilities. This may mean that amounts previously recognised in
other comprehensive income are reclassified to profit or loss.
2.4 Foreign currencies
On initial recognition, all transactions are recorded in the functional currency (the
currency of the primary economic environment in which the Group operates or transact
business), which is Nigerian Naira. Transactions in foreign currencies during the year
are converted into the functional currency using the exchange rate prevailing at the
transaction date.
Monetary assets and liabilities at the statement of financial position date denominated
in foreign currencies are translated into the functional currency using the exchange rate
prevailing as at that date. The resulting foreign exchange gains and losses from the
settlement of such transactions and from year-end translation are recognised on a net
basis in the income statements in the year in which they arise, except for difference
arising on translation of non-monetary available-for-sale financial assets, which are
recognised in other comprehensive income.

African Alliance Insurance Plc
Consolidated and Separate Financial Statements
For the year ended 31 December 2017
STATEMENT OF SIGNIFICANT ACCOUNTING POLICIES
45
2.4 Segment reporting
A segment is a distinguishable component of the company that is engaged either in
providing related products or services (business segment), or in providing products or
services within a particular economic environment (geographical segment), which is
subject to risks and rewards that are different from those of other segments.
An operating segment is a component of an entity:
- That engages in business activities from which it may earn revenues and incur
expenses (including revenues and expenses relating to transactions with other
components of the same entity).
- Whose operating results are regularly reviewed by the entity's chief operating
decision maker to make decision about resources to be allocated to the segment
and assess its performance of the same entity)
- For which discrete financial information is available.
An operating segment may engage in business activities for which it has yet to earn
revenues for example start-up operations may be operating segments before earning
revenues.
2.5 Cash and cash equivalents
Cash and cash equivalents comprise cash on hand and demand deposits, together with
other short-term, highly liquid investments that are readily convertible into known
amounts of cash and which are subject to an insignificant risk of changes in value. cash
equivalents have a maturity period of less than or equal to three months.
2.6 Financial instruments
Financial instruments are recognised when the Group becomes a party to the
contractual provision of the instrument. Financial assets are recognised and
derecognised on the basis of trade date (the date at which the agreement has been
entered) accounting.
2.6.1 Recognition of financial assets
Financial instruments are recognised initially at fair value. The Group classifies its
financial instruments in the following categories:
- Financial assets at fair value through profit or loss,
- Loans and receivables,
- Held-to-maturity
- Available-for-sale investments
The classification depends on the purpose for which the investments were acquired.
Management determines the classification of its investments at initial recognition and
re-evaluates such designation at every reporting date.
2.6.1a Financial assets at fair value through profit or loss
Financial assets at fair value through profit and loss include financial assets held for
trading and those designated at fair value through profit or loss at inception.
Investments typically bought with the intention to sell in the near future are classified
as held for trading, for investments designated as at fair value through profit or loss,
the following criteria must be met:
- The designation eliminates or significantly reduces the inconsistent treatment that
would otherwise arise from measuring the assets or liabilities or recognising gains
or losses on a different basis, or

African Alliance Insurance Plc
Consolidated and Separate Financial Statements
For the year ended 31 December 2017
STATEMENT OF SIGNIFICANT ACCOUNTING POLICIES
46
- The assets and liabilities are part of a portfolio of financial assets, financial
liabilities or both which are managed and their performance evaluated on a fair
value basis, in accordance with a documented risk management or investment
strategy and information regarding these instruments are reported to the key
management personnel on a fair value basis.
- These investments are initially recorded at fair value. Subsequent to initial
recognition, these investments are re-measured at fair value. Fair value
adjustments and realised gain and loss are recognised in the statement of profit
or loss.
The company’s investment in quoted equities are carried at fair-value through profit or
loss.
2.6.1b Loans and receivables
Loans and receivables are non-derivative financial assets with fixed or determined
payments that are not quoted in an active market. Loans and receivables are disclosed
on the face of the statements. Loans and receivables are initially recognised at fair
value which is the cash consideration to originate or purchase the loan including any
transaction costs and subsequently, measured at amortised cost using the effective
interest method, less any impairment loss, interest on loans is included in the income
statement and is reported as interest income. Interest income is recognised by applying
the effective interest rate, except for short term receivables when the recognition of
interest would be immaterial. When the asset is impaired, they are carried on the
statement of financial position as a deduction from the carrying amount of the loan and
receivable and recognised in profit or loss as impairment losses.
2.6.1c Held-to-Maturity Investments
Held-to-maturity investments are non-derivative financial assets with fixed or
determinable payments and fixed maturities that the Group has the positive intention
and ability to hold to maturity. Held-to-maturity investments are initially recognised at
fair plus transaction costs for all financial assets not carried at fair value through profit
or loss. Held-to-maturity investments are subsequently measured at amortised cost
using the effective interest method. Gains and losses on held to maturity assets are
recognised on impairment, de-recognition and through the amortization process.
2.6.1d Available-for-sale investments
Available-for-sale financial assets are non-derivative financial assets that are designed
as available for-sale or are not classified in any of the three preceding categories. They
include investment in non-quoted shares. These investments are initially recorded at
fair value. Where equity instruments do not have a quoted market price in an active
market and whose fair value cannot be reliably measured the instruments have been
measured at cost. After initial measurement, available-for-sale financial assets are
measured at fair value. Fair value gains and losses are reported as a separate
component in other comprehensive income until the investment is derecognised or the
investment is determined to be impaired.
On derecognition or impairment, the cumulative fair value gains and losses previously
reported in equity are transferred to the statement of profit or loss.
African Alliance Insurance Plc
Consolidated and Separate Financial Statements
For the year ended 31 December 2017
STATEMENT OF SIGNIFICANT ACCOUNTING POLICIES
47
2.6.2 Derecognition of financial assets
A financial asset is derecognised when:
- The rights to receive cash flows from the asset have expired
- The Group retains the right to receive cash flows from the asset or has assumed
an obligation to pay the received cash flows in full without material delay to a third
party under a pass-through arrangement, and either:
- The Group has transferred substantially all the risks and rewards of the asset; or
- The Group has neither transferred nor retained substantially all the risks and
rewards of the asset, but has transferred control of the asset.
When the Group has transferred its right to receive cash flows from an asset or has
entered into a pass through arrangement, and has neither transferred nor retained
substantially all the risks and rewards of the asset nor transferred control of the asset,
the asset is recognised to the extent of the Group's continuing involvement in the asset.
2.6.3 Amortised cost
Amortised cost is computed using the effective interest method less any allowance for
impairment and principal repayment or reduction. The calculation takes into account
any premium or discount on acquisition and includes transaction costs and fees that
are an integral part of the effective interest rate.
2.6.4 Fair value
The fair value of quoted investments is based on current market prices. If the market
for a financial asset is not active (and for unlisted securities), the Group establishes fair
value by using valuation techniques.
These include:
- The use of recent arm's length transactions,
- reference to other instruments that are substantially the same, discounted cash
flow analysis and option pricing models refined to reflect the issuer's specific
circumstances.
2.6.5 Impairment of financial assets
The Group assesses at each reporting date whether there is objective evidence that a
financial asset or a group of financial assets is impaired. A financial asset or a group of
financial assets is deemed to be impaired if, and only if, there is objective evidence of
impairment as a result of one or more events that has occurred after the initial
recognition of the asset (an incurred 'loss event') and that loss event has an impact on
the estimated future cash flows of the financial asset or the group of financial assets
that can be reliably estimated.
If an available-for-sale financial asset is impaired, an amount comprising the difference
between its cost (net of any principal repayment and amortization and its current fair
value, less any impairment loss previously recognised in other comprehensive income,
is transferred from equity to the income statement, reversals in respect of equity
instruments classified as available-for-sale are not recognised in the income statement.
Reversals of impairment losses on debt instruments classified at available-for-sale are
reversed through the income statement if the increase in the fair value of the
instruments can be objectively related to an event occurring after the impairment losses
were recognised in the income statement.

African Alliance Insurance Plc
Consolidated and Separate Financial Statements
For the year ended 31 December 2017
STATEMENT OF SIGNIFICANT ACCOUNTING POLICIES
48
2.7 Trade Receivables
Receivables are recognised when due. These include amounts due from agents, brokers
and insurance contract holders.
If there is objective evidence that the insurance receivable is impaired, the Group
reduces the carrying amount of the insurance receivable accordingly and recognises
that impairment loss in the income statement. The Group gathers the objective
evidence that an insurance receivables impaired using the same methodology adopted
for financial assets held at amortised cost. The impairment loss is calculated under the
same method used for these financial assets.
2.8 Reinsurance
The Group cedes insurance risk in the normal course of business for all of its businesses.
2.9 Reinsurance assets
Reinsurance assets represent balances due from reinsurance companies. Amounts
recoverable from reinsurers are estimated in a manner consistent with the outstanding
claims provision or settled claims or insurance contract liabilities associated with the
reinsurer’s policies and are in accordance with the related reinsurance contract.
Reinsurance assets are reviewed for impairment at each reporting date or more
frequently when an indication of impairment arises during the reporting year.
Impairment occurs when there is objective evidence as a result of an event that
occurred after initial recognition of the reinsurance asset that the Group may not receive
all outstanding amounts due under the terms of the contract and the event has a reliably
measurable impact on the amounts that the Group will receive from the reinsurer. The
impairment loss recorded in the statement of profit or loss and other comprehensive
income.
Gains or losses on buying reassurance are recognised in the income statement
immediately at the date of purchase and are not amortised. Ceded reinsurance
arrangements do not relieve the Group from its obligation to policy holders.
2.10 Reinsurance Liabilities
Reinsurance liabilities are primarily premiums payable for reinsurance contracts and are
recognised as an expense when due. The Group has the right to set-off re-insurance
payables against amount due from re-insurance and brokers in line with the agreed
arrangement between both parties.
2.11 Deferred Policy Acquisition Costs (DAC)
Acquisition cost comprise all direct and indirect costs arising from the writing of non-
life insurance contracts. Deferred acquisition costs represent a proportion of
commission which are incurred during a financial year and are deferred to the extent
that they are recoverable out of future revenue margins. It is calculated by applying
to the acquisition expenses that ratio of unearned premium to written premium.
2.12 Prepayment
Prepayments are carried at cost less accumulated impairment losses.
2.13 Investment in Associates
As associate is an entity over which the Group has significant influence and that is
neither a subsidiary nor an interest in a joint venture. Significant influence is the power
to participate in the financial and operating policy decisions of the investee but is not
control or joint control over those policies.
African Alliance Insurance Plc
Consolidated and Separate Financial Statements
For the year ended 31 December 2017
STATEMENT OF SIGNIFICANT ACCOUNTING POLICIES
49
The results and assets and liabilities of associates are incorporated in these consolidated
financial statements using the equity method accounting, except when the investment
is classified as held for sale, in which case it is accounted for in accordance with IFRS 5
- Noncurrent Asset Held for Sale and Discontinued Operations. Under the equity
method, an investment in an associate is initially recognised in the consolidated and
separate statement of financial position at cost and adjusted thereafter to recognize
the Group's share of the profit or loss and other comprehensive income of the associate.
when the Group's share of losses of an associate exceeds the Group's interest in that
associate (which includes any long-term interest that, in substance, form part of the
Groups net investment in the associate), the Group discontinues recognizing its share
of further losses. Additional losses are recognised only to the extent that the Group has
incurred legal or constructive obligations or made payments on behalf of the associate.
Any excess of the cost of acquisition over the Group's share of the net fair value of the
identifiable assets, liabilities and contingent liabilities of an associate recognised at the
date of acquisition is recognised as goodwill, which is included within the carrying
amount of the investment. Any excess of the Group's share of the net fair value of the
identifiable assets, liabilities and contingent liabilities over the cost of acquisition, after
reassessment, is recognised immediately in profit or loss.
The requirements of IAS 39 are applied to determine whether it is necessary to
recognize any impairment loss with respect to the Group's investment in an associate.
When necessary, the entire carrying amount of the investment (including goodwill) is
tested for impairment in accordance with IAS 36 Impairment of Assets as a single asset
by comparing its recoverable amount (higher of value in use and fair value less costs
to sell) with its carrying amount. Any impairment loss recognised forms part of the
carrying amount of the investment. Any reversal of that impairment loss is recognised
in accordance with IAS 36 to the extent that the recoverable amount of the investment
subsequently increases.
When a group entity transacts with its associate, profits and losses resulting from the
transactions with the associate are recognised in the Group's consolidated financial
statements only to the extent of interests in the associate that are not related to the
Group.
2.14 Investment Properties
Investment property is property held on earn rentals or for capital appreciation or both.
Investment property, including interest in leasehold land, is initially recognised at cost
including the transaction costs. Subsequently, investment property is carried at fair
value representing the open market value at the statement of financial position date
determined by annual valuation carried out by external registered valuers’. Gains or
losses arising from changes in the fair value are included in determining the profit or
loss for the year to which they relate.
Investment properties are derecognized when either they have been disposed or when
the investment property is permanently withdrawn from use and no future economic
benefit is expected from its disposal. On disposal of an investment property, the
difference between the disposal proceeds and the carrying amount is charged or
credited to profit or loss.
Transfers are made to or from investment property only when there is a change in use.
For a transfer from investment property to owner occupied property, the deemed cost
for subsequent accounting is the fair value at the date of change in use. If owner
occupied property becomes an investment property, the Group accounts for such
property in accordance with the policy stated under property and equipment up to the
date of the change in use
African Alliance Insurance Plc
Consolidated and Separate Financial Statements
For the year ended 31 December 2017
STATEMENT OF SIGNIFICANT ACCOUNTING POLICIES
50
When the Group completes the construction or development of a self-constructed
investment property, any difference between the fair value of the property at that date
and its previous carrying amount is recognised in the income statement.
2.15 Intangible Assets
Software license costs and computer software that is not an integral part of the related
hardware are initially recognised at cost, and subsequently carried at cost less
accumulated amortization and accumulated impairment losses. Costs that are directly
attributable to the production of identifiable computer software products controlled by
the Group are recognised as intangible assets.
Amortization is calculated using the straight line method to write down the cost of each
license or item of software to its residual value over its estimated useful life.
Amortization begins when the asset is available for use, i.e. when it is in the location
and condition necessary for it to be capable of operating in the manner intended by
management, even when idle. Amortization ceases at the earlier date that the asset is
classified as held for sale and the date that the asset is derecognized and ceases
temporarily, while the residual value exceeds or is equal to the carrying value.
Gains or losses arising from derecognition of an intangible asset are measured as the
difference between the net disposal proceeds and the carrying amount of the asset and
are recognised in the income statement when the asset it derecognized.
Intangibles recognised as assets are amortized over their useful lives, which does not
exceed five years.
2.16 Property, Plant and Equipment
All categories of property and equipment are initially recognised at cost. Cost includes
expenditure directly attributable to the acquisition of the assets. Computer software,
including the operating system that is an integral part of the related hardware is
capitalized as part of the computer equipment
Work in progress owner-occupied property that are included in property, plant and
equipment are stated at cost to date and are not yet de-componentised as the asset
has not been put into use.
Subsequent cost is included in the asset's carrying amount or recognised as a separate
asset, as appropriate, only when it is probable that future economic benefits associated
with the item will flow to the Group and the cost of the item can be measured reliably.
Repairs and maintenance expenses are charged to the income statement in the year in
which they are incurred.
Increases in the carrying amount arising on revaluation are recognised in other
comprehensive income and accumulated in equity under the heading of revaluation
surplus. Decreases that offset previous increases of the same asset are recognised in
other comprehensive income. All other decreases are charged to the statement of profit
or loss.
Freehold land is not depreciated. Depreciation is calculated using the straight line
method to write down the cost or the revalued amount of each asset to its residual
value over its estimated useful life using the following annual rates:

African Alliance Insurance Plc
Consolidated and Separate Financial Statements
For the year ended 31 December 2017
STATEMENT OF SIGNIFICANT ACCOUNTING POLICIES
51
Leasehold land 0%
Buildings 2%
Motor Vehicles 25%
Computer Equipment 20%
Furniture & Fittings 10%
Computer Equipment 20%
Office Equipment 20%
Plant & Machinery 10%
Aircraft (Componentized)
▪ Aircraft Engines 4%
▪ Airframes (Body) 3%
▪ Landing gears 10%
▪ APU, Avionic & other electronic parts 15%
Depreciation on an item of property, plant and equipment commences when it is
available for use and continues to depreciate until it is derecognized, even if during that
period the item is idle. Depreciation of an item ceases when the item is retired from
active use and is being held for disposal
Where no parts of items of property, plant and equipment have a cost that is significant
in relation to the total cost of the item, the same rate of depreciation is applied to the
whole item.
The assets' residual values, depreciation method and useful lives are reviewed, and
adjusted if appropriate, at each statement of financial position date.
An item of property and equipment is derecognized upon disposal or when no future
economic benefits are expected from its use or disposal.
Gains and losses on disposal of property and equipment are determined by reference
to their carrying amounts and are taken into account in determining operating profit.
2.17 Statutory Deposits
Statutory Deposit represents 10% of the paid up capital of the Company deposited with
the Central Bank of Nigeria (CBN) pursuant to Section 10(3) of the Insurance Act CAP
I17 LFN 2004.
Statutory deposit is measured at cost.
2.18 Insurance Liabilities
The Group issues contracts that transfer insurance risk or financial risk or both.
Insurance contracts are those contracts that transfer significant insurance risk. Such
contracts may also transfer financial risk.
2.19 Classification of contracts
A contract is classified as an insurance contract where the Group accepts significant
insurance risk by agreeing with the policyholder to pay benefits if a specified uncertain
future event (the insured event) adversely affects the policyholder or other beneficiary.
Significant insurance risk exists where it is expected that for the duration of the policy
or part thereof, policy benefits payable on the occurrence of the insured event will exceed
the amount payable on early termination, before allowance for expense deductions at
early termination. Once a contract has been classified as an insurance contract, the
classification remains unchanged for the remainder of its lifetime, even if the insurance
risk reduces significantly during this period.
African Alliance Insurance Plc
Consolidated and Separate Financial Statements
For the year ended 31 December 2017
STATEMENT OF SIGNIFICANT ACCOUNTING POLICIES
52
2.19a Recognition and measurement
(i) Short-term insurance contracts
Short-duration life insurance contracts protect the Group’s customers from the
consequences of events (such as death or disability) that would affect the ability
of the customer or his/her dependents to maintain their current level of income.
They are usually short-duration life insurance contracts ranging between 12 to 24
months period of coverage. Guaranteed benefits paid on occurrence of the
specified insurance event are either fixed or linked to the extent of the economic
loss suffered by the policyholder.
For all these contracts, premiums are recognised as revenue (earned premiums)
proportionally over the period of coverage. The portion of premium received on
in-force contracts that relates to unexpired risks at the balance sheet date is
reported as the unearned premium liability. Premiums are shown before deduction
of commission and are gross of any taxes or duties levied on premiums.
Claims and loss adjustment expenses are charged to income as incurred based on
the estimated liability for compensation owed to contract holders or third parties
damaged by the contract holders. They include direct and indirect claims
settlement costs and arise from events that have occurred up to the end of the
reporting period even if they have not yet been reported to the Group. The Group
does not discount its liabilities for unpaid claims. Liabilities for unpaid claims are
estimated using the input of assessments for individual cases reported to the
Group and statistical analyses for the claims incurred but not reported (IBNR),
and to estimate the expected ultimate cost of more complex claims that may be
affected by external factors.
The liability reserve on short term insurance contract is made up of an unexpired
premium reserve (UPR) and reserve for ‘Incurred but not reported’ claims (IBNR).
The UPR are calculated after adjusting for acquisition expenses. IBNR reserves are
required to take account of the delay in reporting claims. These are determined
by considering ultimate claims ratios for the life schemes on the Group’s books.
The ratios differ by industry and have been determined following a historical
analysis of portfolio claims experience. The IBNR reserves are calculated by
adjusting the ultimate claims amounts to allow for claims already paid and those
outstanding for payment, and again adjusted to allow for the holding of a separate
UPR reserve. As the short term insurance contract experience of FBN builds up we
will be able to adjust for Group-specific claims settlement patterns.
(ii) Long-term insurance contracts with fixed and guaranteed terms
These contracts insure events associated with human life (for example, death or
survival) over a long duration. Premiums are recognised as revenue when they
become payable by the contract holder. Premiums are shown before deduction of
commission. Benefits are recorded as an expense when they are incurred.
A liability for contractual benefits that are expected to be incurred in the future is
recorded when the premiums are recognised. The liability is determined as the
sum of the expected discounted value of the benefit payments and the future
administration expenses that are directly related to the contract, less the expected
discounted value of the theoretical premiums that would be required to meet the
benefits and administration expenses based on the valuation assumptions used
(the valuation premiums). The liability is based on assumptions as to mortality,
persistency, maintenance expenses and investment income that are established
at the time the contract is issued. A margin for adverse deviations is included in
the assumptions.
African Alliance Insurance Plc
Consolidated and Separate Financial Statements
For the year ended 31 December 2017
STATEMENT OF SIGNIFICANT ACCOUNTING POLICIES
53
Where insurance contracts have a single premium or a limited number of premium
payments due over a significantly shorter period than the period during which
benefits are provided, the excess of the premiums payable over the valuation
premiums is deferred and recognised as income in line with the decrease of
unexpired insurance risk of the contracts in force or, for annuities in force, in line
with the decrease of the amount of future benefits expected to be paid. The
liabilities are recalculated at each end of the reporting period using the
assumptions established at inception of the contracts.
The long term insurance contracts insure events associated with human life. They
include individual insurance contracts.
Individual insurance contracts
The reserve has been calculated using the gross premium valuation approach.
This reserving methodology adopts a cash flow approach taking into account all
expected future cash flows including premiums, expenses and benefit payments
to satisfy the liability adequacy test. The test also considers current estimates of
all contractual cash flows, and of related cash flows such as claims handling costs,
as well as cash flows resulting from embedded options and guarantees (where
applicable).
2.19b Insurance contract liabilities
Life insurance policy claims received up to the last day of each financial period and
claims incurred but not reported (IBNR) are provided for and included in the policy
liabilities. Past claims experience is used as the basis for determining the extent of the
IBNR claims.
Income from reinsurance policies is recognised concurrently with the recognition of the
related policy benefit. Insurance liabilities are presented without offsetting them against
related reinsurance assets.
Insurance liabilities are retained in the statement of financial position until they are
discharged or cancelled and/or expire. The Group performs a liability adequacy test to
determine the recognised insurance liabilities and an impairment test for reinsurance
assets held at each reporting date.
2.19c Technical reserves
These are the reserves computed in compliance with the provision of Section 20, 21,
and 22 of the Insurance Act 2003. They are:
Life business
Life fund
This is made up of net liabilities on policies in force as computed by the actuaries at the
time of the actuarial valuation.
Liability adequacy test
At the end of the reporting period, liability adequacy tests are performed by an Actuary
to ensure the adequacy of the contract liabilities. In performing these tests, current
best estimates of future contractual cash flows including office premiums, expenses and
benefit payments satisfying the liability adequacy test, are used. Any deficiency is
immediately charged to statement of comprehensive income.
2.20 Trade and other Payables
Trade and other payables are recognised initially at fair value and subsequently
measured at amortized cost using the effective interest method. The fair value of a
non-interest bearing liability is its discounted repayment amount. If the due date of the
liability is less than one-year discounting is omitted.
African Alliance Insurance Plc
Consolidated and Separate Financial Statements
For the year ended 31 December 2017
STATEMENT OF SIGNIFICANT ACCOUNTING POLICIES
54
2.21 Retirement Benefit Obligations
a) Defined Contribution Plan
A defined contribution plan is a pension plan under which the company pays fixed
contributions into a separate entity. The company has no legal or constructive
obligations to pay further contributions if the fund does not hold sufficient assets
to pay all employees the benefits relating to employee service in the current and
prior periods.
The company pays contributions to publicly or privately administered pension
insurance plans on a mandatory, contractual or voluntary basis. The company
has no further payment obligations once the contributions have been paid. The
contributions are recognised as employee benefit expense when they are due.
Prepaid contributions are recognised as an asset to the extent that a cash refund
or a reduction in the future payments is available.
In accordance with the provisions of the Pension Reform Act 2014, the company
and its employees contributes a minimum of 18% of basic salary, housing and
transport allowance to each employee’s retirement savings account maintained
with their nominated pension fund administrators. "
b) Short-term employee benefits
Short-term employee benefit obligations are measured on an undiscounted basis
and are expensed as the related service is provided.
A liability is recognised for the amount expected to be paid under short-term cash
bonus or profit sharing plans if the company has a present legal or constructive
obligation to pay this amount as a result of past service provided by the employee
and obligation can be estimated reliably.
c) Defined benefit plan
A defined benefit plan is a pension plan that defines an amount of pension benefit
that an employee will receive on retirement, usually dependent on one or more
factors, such as age, years of service and compensation.
The liability recognised in the statement of financial position in respect of the
defined benefit pension plan is the present value of the defined benefit obligation
at the date of the statement of financial position less the fair value of plan assets,
together with adjustments for unrecognised actuarial gains or losses and past
service costs.
2.22 Provisions
General Provisions are recognised when the Group has a present obligation (legal or
constructive) as a result of a past event, and it is probable that an outflow of resources
embodying economic benefits will be required to settle the obligation and a reliable
estimate can be made of the amount of the obligation. Where the Group expects some
or all of a provision to be reimbursed, the reimbursement is recognised as a separate
asset but only when the reimbursement is virtually certain. The expense relating to any
provision is presented in the income statement net of any reimbursement. if the effect
of the time value of money is material, provisions are discounted using a current pre-
tax rate that reflects, where appropriate, the risks specific to the liability. Where
discounting is used, the increase in the provision due to the passage of time is
recognised as a finance cost.

African Alliance Insurance Plc
Consolidated and Separate Financial Statements
For the year ended 31 December 2017
STATEMENT OF SIGNIFICANT ACCOUNTING POLICIES
55
2.23 Current Income Tax
Current income tax is the amount of income tax payable on the taxable profit for the
year determined in accordance with the Nigeria Income Tax Act. The tax rates and tax
laws used to compute the amount are those that are enacted or substantively enacted
as at the reporting date.
2.24 Deferred Income Tax
Deferred income tax is provided in full on all temporary differences except those arising
on the initial recognition of an asset or liability.
Deferred income tax is determined using the liability method on all temporary
differences arising between the tax bases of assets and liabilities and their carrying
values for financial reporting purposes, using tax rates and laws enacted or
substantively enacted at the statement of financial position date and expected to apply
when the related deferred income tax asset is realized or the deferred tax liability is
settled.
Deferred income tax assets are recognised only to the extent that it is probable that
future taxable profits will be available against which the temporary differences can be
utilized. The carrying amount of deferred tax assets is reviewed at each reporting date
and reduced to the extent that it is no longer probable that sufficient taxable profit will
be available to allow all or part of the deferred income tax asset to be utilized.
unrecognized deferred tax assets are reassessed at each reporting date and are
recognised to the extent that it has become probable that future taxable profit will allow
the deferred tax asset to be recovered.
Deferred tax assets and liabilities are measured at the tax rates that are expected to
apply to the year when the asset is realized or the liability is settled, based on tax rates
(and tax laws) that have been enacted or substantively enacted at the reporting date.
Deferred tax relating to items recognised outside profit or loss is recognised outside
profit or loss. Deferred tax items are recognised in correlation to the underlying
transaction either in other comprehensive income or directly in equity.
Deferred tax assets and deferred tax liabilities are offset, if a legally enforceable right
exists to set off such:
* Current tax assets against current income tax liabilities and
* The deferred taxes relate to the same taxable entity and
* The same taxation authority
2.25 Share Capital and Share Premium
Ordinary shares are recognized at par value and classified as 'share capital' in equity.
Any amounts received over and above the par value of the shares issued are classified
as 'share premium' in equity.
2.26 Statutory Contingency Reserve
The Group maintains contingency reserves in accordance with the provisions of
Insurance Act 2003 to cover fluctuations in securities and variations in statistical
estimates at the rate equal to the higher of 3% of total premium or 20% of the net
profit.
2.27 Retained Earnings
The retained earnings represent the amount available for dividend distribution to the
equity shareholders of the company. See statement of changes in equities for
movement in retained earnings.
African Alliance Insurance Plc
Consolidated and Separate Financial Statements
For the year ended 31 December 2017
STATEMENT OF SIGNIFICANT ACCOUNTING POLICIES
56
2.28 Assets Revaluation Reserve
This represents the Group's revaluation reserve emanating from revaluation of certain
assets
2.29 Income Recognition
2.29.1 Gross Premiums
Gross premiums on insurance contract are recognized as revenue when payable by the
policy holder.
For single premium business revenue is recognised on the date on which the policy is
effect.
Gross insurance written premiums comprise the total premiums receivable for the whole
period of cover provided by contracts entered into during the accounting period and are
recognised on the date on which the policy incepts. Premiums include any adjustments
arising in the accounting period for premiums receivable in respect of business written
in prior accounting periods.
Premiums collected by intermediaries, but not yet received, are assessed based on
estimates from underwriting or past experience and are included in premiums written.
Unearned premiums are those proportions of premiums written in a year that relate to
periods of risk after the statement of financial position date. Unearned premiums are
calculated on a daily pro rata basis. The proportion attributable to subsequent periods
is deferred as a provision for unearned premiums.
2.29.2 Reinsurance Premiums
Gross reinsurance premium on insurance contracts are recognized as an expense when
payable or on the date on which the policy is effective. Gross reinsurance premiums
written comprise the total premiums payable for the whole cover provided by contracts
entered into the period and are recognised on the date on which the policy incepts.
Premiums include any adjustments arising in the accounting period in respect of
reinsurance contracts incepting in prior accounting periods.
Unearned reinsurance premiums are those proportions of premiums written in a year
that relate to periods of risk after the statement of financial position date. Unearned
premiums are deferred over the term of the underlying direct insurance policies for
risks attaching contracts and over the term of the reinsurance contract for losses-
occurring contracts.
2.29.3 Commission income
Commission are recognized on ceding business to the reinsurers and are credited to the
income statements.
2.29.4 Investment Income
Interest income is recognised in the income statement as it accrues and is calculated
by using the effective interest rate method. Fees and commissions that are an integral
part of the effective yield of the financial asset or liability are recognised as an
adjustment to the effective interest rate of the instrument.
Investment income also includes dividend income which is recognised when the right
to receive the payment is established.
Rental income arising from operating leases on investment properties is accounted for
on a straight line basis over the lease terms.
African Alliance Insurance Plc
Consolidated and Separate Financial Statements
For the year ended 31 December 2017
STATEMENT OF SIGNIFICANT ACCOUNTING POLICIES
57
2.30 Management and Administrative Fees
The management and administrative fee consist primarily of investment contract fee
income, asset management fee, policyholder administrative fee and other contract fees
2.31 Realized/Unrealized Gains and Losses
Realized or unrealized gains and losses recorded in the income statement on
investments include gains and losses on financial assets and investment properties.
Gains and losses on the sale of investments are calculated as the difference between
net sales proceeds and the original carrying or amortized cost and are recorded on
occurrence of the sale transaction
2.32 Gross Benefits and Claims
Claims incurred in respect of Insurance contracts include the cost of all claims arising
during the year including internal and external claims handling costs that are directly
related to the processing and settlement of claims as well as changes in the gross
valuation of insurance and investment contract liabilities. All claims paid and incurred
are charged against revenue as expenses when incurred.
2.33 Reinsurance Claims
Reinsurance claims are recognised when the related gross insurance claim is recognised
according to the terms of the relevant contract.
2.34 Interest Income and Expense
Interest income and expense are recognized in profit or loss using the effective interest
method. The effective interest rate is the rate that exactly discounts the estimated
future cash (or, where appropriate, the next re-pricing date) to the carrying amount of
the financial asset or liability. When calculating the effective interest rate, the entity
estimates future cash flows considering all contractual terms of the financial
instruments but not future credit losses.
The calculation of the effective interest rate includes contractual fees and points paid
or received transaction costs and discounts or premium that are integral part of the
effective interest rate.
Transaction costs are incremental costs that are directly attributable to the acquisition,
issue or disposal of a financial asset or liability.
Interest income and expense presented in the financial statement include:
* Interest on financial assets and liabilities measured at amortized cost calculated
on an effective interest basis
* Interest on financial assets measured at fair value through profit or loss calculated
on an effective interest rate basis.
2.35 Expenses
Expenses are recognised in the income statement when a decrease in future economic
benefit related to a decrease in an asset or an increase of a liability has arisen that can
be measured reliably. This means, in effect, that recognition of expenses occurs
simultaneously with the recognition of an increase in liabilities or a decrease in assets
(for example, the accrual of employee entitlements or the depreciation of equipment)
When economic benefits are expected to arise over several accounting periods and the
association with income can only be broadly or indirectly determined, expenses are
recognised in the income statement on the basis of systematic and rational allocation
procedures.
African Alliance Insurance Plc
Consolidated and Separate Financial Statements
For the year ended 31 December 2017
STATEMENT OF SIGNIFICANT ACCOUNTING POLICIES
58
This is often necessary in recognizing the equipment associated with the using up of
assets such as property, plant and equipment in such cases the expense is referred to
as a deprecation or amortization. These allocation procedures are intended to recognise
expenses in the accounting periods in which the economic benefits associated with
these items are consumed or expire. An expense is recognised immediately in the
income statement when expenditure produces no future economic benefits or when,
and to the extent that future economic benefits do not qualify, or cease to qualify, for
recognition in the statement of financial position as an asset.
2.36 Underwriting Expenses
Underwriting expenses comprise acquisition costs and other underwriting expenses.
Acquisition costs comprise all direct and indirect costs arising from writing insurance
contracts. These cost are charged in the income statement in the period they are
incurred.
2.37 Impairment of non-financial assets
The Group assesses at each reporting date whether there is an indication that an asset
may be impaired. If any such indication exists, or when annual impairment testing for
an asset is required, the Group estimates the asset's recoverable amount. An
impairment loss is recognised for the amount by which the asset's carrying amount
exceeds its recoverable amount. An asset's recoverable amount is the higher of an
asset's or cash generating unit's fair value less costs to sell and its value in use.
The recoverable amount is determined for an individual asset, unless the asset does
not generate cash inflows that are largely independent of those from other assets or
Groups of assets. In assessing value in use, he estimated future cash flows are
discounted to their present value using a pre- discount rate that reflects current market
assessments of the time value of money and the risks specific to the asset. In
determining fair value less costs to sell, an appropriate valuation model is used.
Impairment losses of continuing operations are recognised in the income statement in
those expenses categories consistent with the function of the impaired asset, except
for property previously revalued where the revaluation was taken to comprehensive
income. in this case the impairment is also recognised in comprehensive income up to
the amount of any previous revaluation.
An assessment is made at each reporting date as to whether there is any indication
that previously recognised impairment losses may no longer exist or may have
decreased. If such indication exists, the Group makes an estimate of recoverable
amount. A previous impairment loss is reversed only if there has been a change in the
estimates used to determine the asset's recoverable amount since the last impairment
loss was recognised. If that is the case the carrying amount of the asset is increased
to its recoverable amount.
The increased amount cannot exceed the carrying amount that would have been
determined, net of depreciation, had no impairment loss been recognised for the asset
in prior years. Such reversal is recognised in the income statement unless the asset is
carried at revalued amount, in which case the reversal is treated as a revaluation
increase.
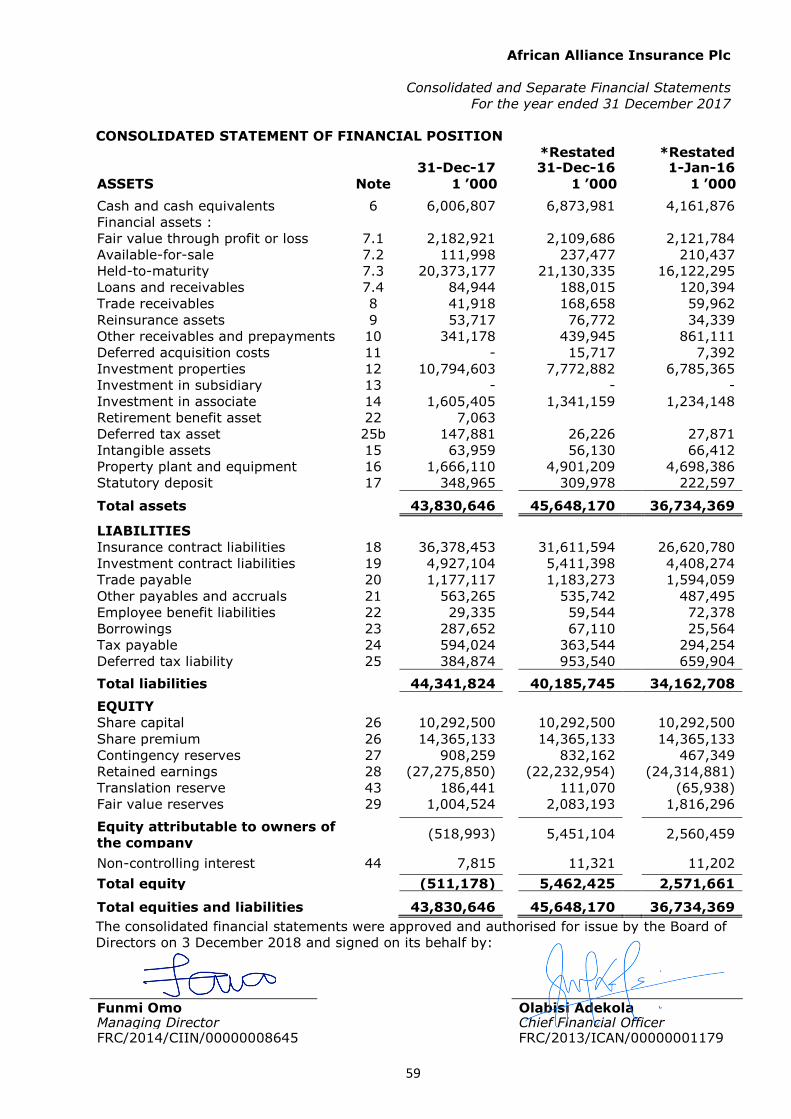
African Alliance Insurance Plc
Consolidated and Separate Financial Statements For the year ended 31 December 2017
59
CONSOLIDATED STATEMENT OF FINANCIAL POSITION
*Restated *Restated
31-Dec-17
31-Dec-16
1-Jan-16
ASSETS Note N’000
N’000
N’000 Cash and cash equivalents 6 6,006,807
6,873,981
4,161,876
Financial assets :
Fair value through profit or loss 7.1 2,182,921
2,109,686
2,121,784 Available-for-sale 7.2 111,998
237,477
210,437
Held-to-maturity 7.3 20,373,177
21,130,335
16,122,295 Loans and receivables 7.4 84,944
188,015
120,394
Trade receivables 8 41,918
168,658
59,962 Reinsurance assets 9 53,717
76,772
34,339
Other receivables and prepayments 10 341,178
439,945
861,111 Deferred acquisition costs 11 -
15,717
7,392
Investment properties 12 10,794,603
7,772,882
6,785,365 Investment in subsidiary 13 -
-
-
Investment in associate 14 1,605,405
1,341,159
1,234,148 Retirement benefit asset 22 7,063 Deferred tax asset 25b 147,881
26,226
27,871
Intangible assets 15 63,959
56,130
66,412 Property plant and equipment 16 1,666,110
4,901,209
4,698,386
Statutory deposit 17 348,965
309,978
222,597 Total assets
43,830,646
45,648,170
36,734,369
LIABILITIES
Insurance contract liabilities 18 36,378,453
31,611,594
26,620,780 Investment contract liabilities 19 4,927,104
5,411,398
4,408,274
Trade payable 20 1,177,117
1,183,273
1,594,059 Other payables and accruals 21 563,265
535,742
487,495
Employee benefit liabilities 22 29,335
59,544
72,378 Borrowings 23 287,652
67,110
25,564
Tax payable 24 594,024
363,544
294,254 Deferred tax liability 25 384,874
953,540
659,904
Total liabilities
44,341,824
40,185,745
34,162,708 EQUITY
Share capital 26 10,292,500
10,292,500
10,292,500 Share premium 26 14,365,133
14,365,133
14,365,133
Contingency reserves 27 908,259
832,162
467,349 Retained earnings 28 (27,275,850)
(22,232,954)
(24,314,881)
Translation reserve 43 186,441
111,070
(65,938) Fair value reserves 29 1,004,524
2,083,193
1,816,296
Equity attributable to owners of the company
(518,993) 5,451,104 2,560,459
Non-controlling interest 44 7,815 11,321 11,202 Total equity
(511,178)
5,462,425
2,571,661
Total equities and liabilities
43,830,646
45,648,170
36,734,369 The consolidated financial statements were approved and authorised for issue by the Board of Directors on 3 December 2018 and signed on its behalf by:
Funmi Omo Olabisi Adekola Managing Director Chief Financial Officer FRC/2014/CIIN/00000008645 FRC/2013/ICAN/00000001179

African Alliance Insurance Plc
Consolidated and Separate Financial Statements For the year ended 31 December 2017
60
SEPARATE STATEMENT OF FINANCIAL POSITION
*Restated *Restated
31-Dec-17
31-Dec-16
1-Jan-16
ASSETS Note N’000
N’000
N’000 Cash and cash equivalents 6 5,799,468
6,359,793
3,771,636
Financial assets :
Fair value through profit or loss 7.1 2,182,921
2,109,686
2,121,784
Available-for-sale 7.2 91,525
217,005
189,965 Held-to-maturity 7.3 20,373,177
21,130,335
16,122,295
Loans and receivables 7.4 18,131
127,222
95,342 Trade receivables 8 -
-
-
Reinsurance assets 9 53,717
76,772
34,339 Other receivables and prepayments 10 324,286
700,236
1,142,935
Deferred acquisition costs 11 -
15,717
7,392 Investment properties 12 9,285,488
6,616,999
6,058,586
Investment in subsidiary 13 553,805
1,538,299
1,357,558 Investment in Associate 14 1,605,405
1,341,159
1,234,148
Retirement benefit asset 22 7,063 Deferred Tax Asset 25b 146,476
24,551
24,551
Intangible assets 15 20,913
28,023
33,636 Property plant and equipment 16 627,276
647,313
662,963
Statutory deposit 17 200,000
200,000
200,000 Total assets
41,289,651
41,133,110
33,057,130
LIABILITIES
Insurance contract liabilities 18 34,536,368
30,104,525
25,774,605 Investment contract liabilities 19 4,927,104
5,411,398
4,408,274
Trade payable 20 914,215
923,974
1,413,614 Other payables and accruals 21 344,085
291,182
275,966
Employee benefit liabilities 22 29,335
39,624
52,458 Borrowings 23 182,714
-
-
Tax payable 24 545,285
285,240
224,970 Deferred tax liability 25 92,107
695,696
515,418
Total liabilities
41,571,213
37,751,639
32,665,305
EQUITY
Share capital 26 10,292,500
10,292,500
10,292,500 Share premium 26 14,365,133
14,365,133
14,365,133
Contingency reserves 27 839,681
776,327
422,588 Retained earnings 28 (26,146,738)
(22,370,793)
(24,962,673)
Translation reserve 43 -
-
- Non-controlling interest 44
Fair value reserves 29 367,862
318,304
274,277 Total equity
(281,562)
3,381,471
391,825
Total equities and liabilities
41,289,651
41,133,110
33,057,130
The financial statements were approved and authorised for issue by the Board of Directors on 3 December 2018 and signed on its behalf by:
Funmi Omo Olabisi Adekola Managing Director Chief Financial Officer FRC/2014/CIIN/00000008645 FRC/2013/ICAN/00000001179

African Alliance Insurance Plc
Consolidated and Separate Financial Statements
For the year ended 31 December 2017
61
CONSOLIDATED STATEMENT OF COMPREHENSIVE INCOME
Note Group
Company
*Restated
*Restated
31-Dec-17
31-Dec-16 31-Dec-17 31-Dec-16 N’000
N’000 N’000
N’000
Gross premium written
30 7,626,710
14,068,406
6,335,448
12,963,414
Unearned premium
30 (39,778)
454,775
(39,778)
454,775
Gross premium income
7,586,932
14,523,181
6,295,670
13,418,189
Insurance premium ceded to reinsurers 31 (59,006)
(71,129)
(49,403)
(50,444)
Net premium income
7,527,926
14,452,052
6,246,267
13,367,745
Fees and commission income
32 5,212
13,345
5,212
13,345
Net underwriting income
7,533,138
14,465,397
6,251,479
13,381,090
Insurance claims incurred and loss
adjustments expenses
33a 9,725,184
7,170,625
8,687,549
6,567,454
Insurance claims incurred/(recovered) from
reinsurers 33b 23,515
(48,987) 23,515 (48,987)
Underwriting expenses
34 980,993
1,045,075
839,041
951,683
Changes in long term insurance contracts 35 3,979,680
5,093,457
3,801,021
4,786,979
Net underwriting expenses
14,709,372
13,260,170
13,351,126
12,257,129
Net underwriting profit
(7,176,234)
1,205,227
(7,099,647)
1,123,961
Other income
36 135,929
43,886
131,300
98,959
Impairment (charges)/write back
38 (1,608,472)
90,821
(656,355)
90,821
Net (loss)/ gain on liquidated subsidiaries 45 (335,149)
607,924
Fair value gain on investment properties 12 1,127,970
700,844
909,239
556,900
Fair value through profit or loss
7.1 73,235
(12,098)
73,235
(12,098)
Investment income
37 3,224,550
3,200,027
3,133,558
3,067,525
Loss from investment contracts
37a (115,222)
(695,504)
(115,222)
(695,504)
Share of profit of equity accounted investee 14 641,546
484,311
641,546
484,311
Employee benefit expenses
39 (1,014,139)
(808,607)
(669,373)
(542,375)
Other operating and administrative expenses 40 (1,675,814)
(1,434,052)
(1,118,933)
(956,253)
Finance cost
41 (5,179)
-
(5,179)
-
(Loss)/Profit before tax
(6,726,979)
2,774,855
(4,167,907)
3,216,247
Income tax credit/(expense)
42 475,924 (330,817)
455,316
(270,628) (Loss)/Profit for the year
(6,251,055) 2,444,038
(3,712,591)
2,945,619
(Loss)/Profit attributable to: – Owners of the parent (6,244,850) 2,446,716 - -
– Non-controlling interests (6,205) (2,678) - -
(6,251,055) 2,444,038 - -
Other comprehensive income: Items that may be subsequently reclassified to profit or loss Change in value of available for sale financial
assets (net of taxes) 29 650 - 650 -
Foreign exchange translation gain/(loss) 43 76,375 179,618
77,025 179,618 650 - Items that will not be subsequently reclassified to profit or loss (Loss)/Gain on revaluation of property, plant and
equipment (net of taxes) 29 (96,046) 267,108 48,908 44,027
Deferred tax on revaluation gain(loss) 29 (38,675)
(134,721) 267,108 48,908 44,027
Other comprehensive (loss)/ income for
the year (57,696) 446,726 49,558 44,027
Total comprehensive (loss)/income for
the year (6,308,751) 2,890,764 (3,663,033) 2,989,646
Total comprehensive (loss)/ income
attributable to:
– Owners of the parent (6,305,075) 2,890,622 (3,663,033) 2,989,646
– Non-controlling interests (3,676) 143
(6,308,751) 2,890,765 (3,663,033) 2,989,646

African Alliance Insurance Plc
Consolidated and Separate Financial Statements
For the year ended 31 December 2017
62
STATEMENT OF CHANGES IN EQUITY - GROUP
FOR THE YEAR ENDED 31 DECEMBER 2017
Share capital
Share
premium
Fair value
reserve
Contingency
reserve
Translation
reserve
Retained
earnings
Non-
controlling
interest Total equity
N'000 N'000 N'000 N'000 N'000 N'000 N'000 N'000
Balance at 1 January 2017 10,292,500 14,365,133 2,083,193 832,162 111,070 (22,232,954) 11,321 5,462,425
Total comprehensive income for the year Loss for the year - - - - - (6,244,850) (6,205) (6,251,055)
Other comprehensive (loss)/income for the
year - - (135,596) - 75,371 - 2,529 (57,696)
Total Comprehensive income for the year - - (135,596) - 75,371 (6,244,850) (3,676) (6,308,751)
Disposal of interest in Frenchies and Africa Realty 335,149 335,149
Transfer to contingency reserve - - - 76,097 - (76,268) 171 -
Transfer from properties revaluation reserve (943,073) 943,073 -
Total transactions with owners, recognised directly in
equity - - (943,073) 76,097 - 1,201,954 171 335,149
Balance at 31 December 2017 10,292,500 14,365,133 1,004,524 908,259 186,441 (27,275,850) 7,816 (511,177)
Balance at 1 January 2016 10,292,500 14,365,133 1,816,296 467,349.00 (65,938) (24,314,881) 11,202 2,571,661
Total comprehensive income for the year Profit for the year - - - - - 2,446,716 (2,678) 2,444,038
Other comprehensive income for the year - - 266,897 - 177,008 2,821 446,726
Total Comprehensive income for the year - - 266,897 - 177,008 2,446,716 143 2,890,764
Transactions with owners, recorded directly in equity
Dividend paid to equity holders Transfer to contingency reserve - - - 364,813 - (364,789) (24) -
Total transactions with owners, recognised
directly in equity - - - 364,813 - (364,789) (24) -
Gain on the revaluation of land and
buildings
Balance at 31 December 2016 10,292,500 14,365,133 2,083,193 832,162 111,070 (22,232,954) 11,321 5,462,425

African Alliance Insurance Plc
Consolidated and Separate Financial Statements
For the year ended 31 December 2017
63
STATEMENT OF CHANGES IN EQUITY - COMPANY
Share
capital
Share
premium
Contingency
reserve
Fair
value
reserve
Retained
earnings Total
N'000 N'000 N'000 N'000 N'000 N'000
Balance at 1 January 2017 10,292,500 14,365,133 776,327 318,304 (22,370,793) 3,381,471
Total comprehensive income for the year Loss for the year - (3,712,591) (3,840,706)
Other comprehensive income for the year - 49,558 49,558
Total Comprehensive income for the year
- - - 49,558 (3,712,591) (3,791,148)
Transactions with owners, recorded directly in equity
Transfer to contingency reserve - 63,354 (63,354) -
Total transactions with owners, recognised directly in equity - - 63,354 - (63,354) -
Balance at 31 December 2017 10,292,500 14,365,133 839,681 367,862
(26,146,738) (281,562)
Share
capital
Share
premium
Contingency
reserve
Fair
value
reserve
Retained
earnings Total
N'000 N'000 N'000 N'000 N'000 N'000
Balance at 1 January 2016 10,292,500 14,365,133 422,588 274,277 (24,962,673) 391,825
Total comprehensive income for the year Other comprehensive income for the year 44,027 44,027
Profit for the year
2,945,619 2,945,619
Total Comprehensive income for the year
- - - 44,027 2,945,619 2,989,646
Transactions with owners, recorded directly in equity
Transfer to contingency reserve 353,739 (353,739) -
Total transactions with owners, recognised directly in equity - - 353,739 - (353,739) -
Balance at 31 December 2016 10,292,500 14,365,133 776,327 318,304 (22,370,793) 3,381,471
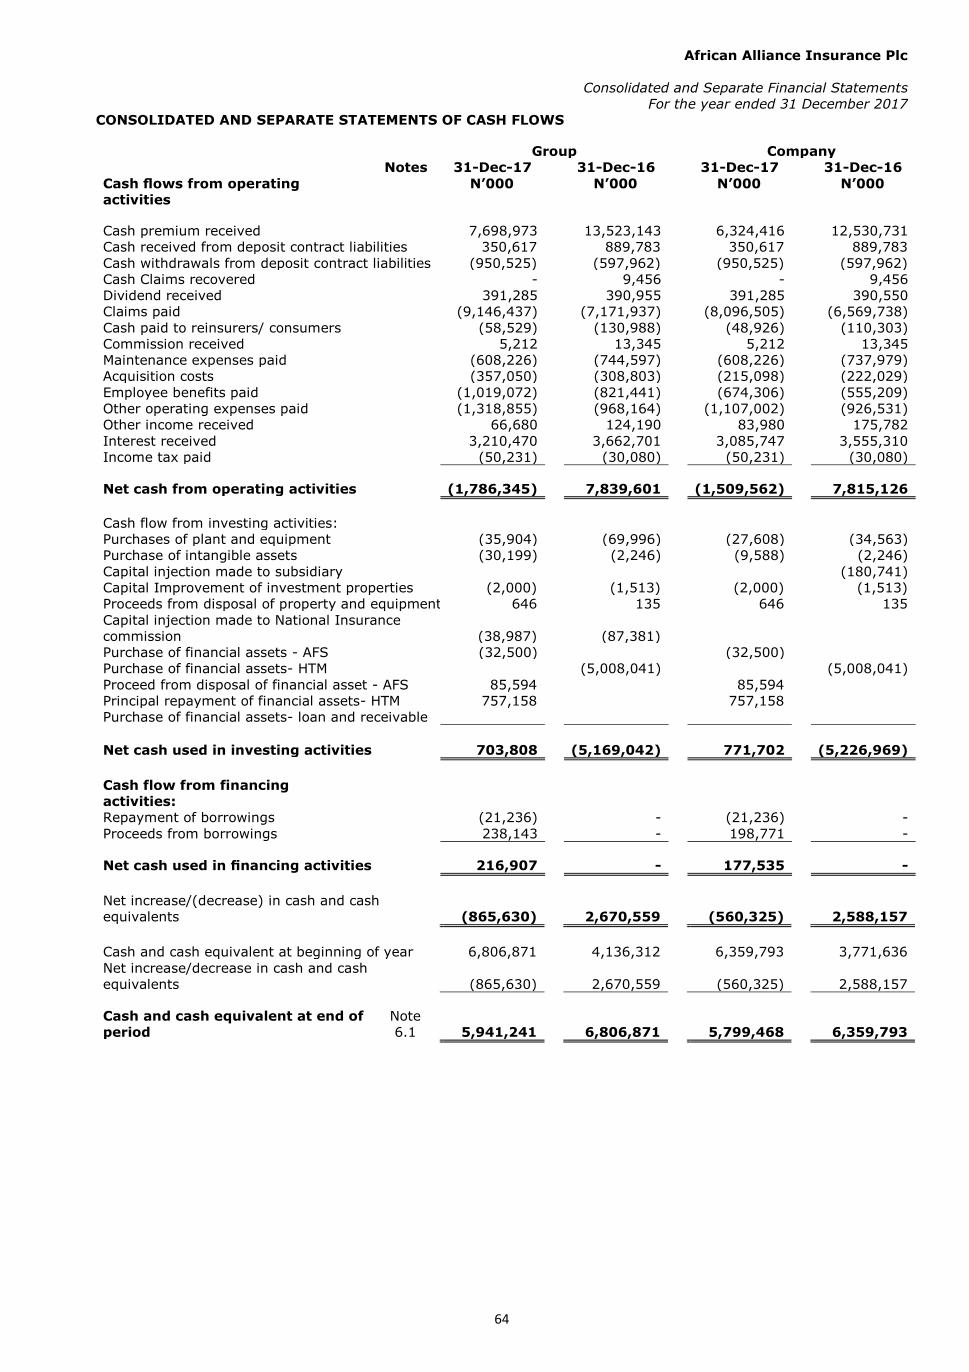
African Alliance Insurance Plc
Consolidated and Separate Financial Statements
For the year ended 31 December 2017
64
CONSOLIDATED AND SEPARATE STATEMENTS OF CASH FLOWS
Group Company
Notes 31-Dec-17 31-Dec-16 31-Dec-17
31-Dec-16
Cash flows from operating
activities
N’000
N’000
N’000
N’000
Cash premium received 7,698,973 13,523,143 6,324,416 12,530,731
Cash received from deposit contract liabilities 350,617 889,783 350,617 889,783
Cash withdrawals from deposit contract liabilities (950,525) (597,962) (950,525) (597,962)
Cash Claims recovered - 9,456 - 9,456
Dividend received 391,285 390,955 391,285 390,550
Claims paid (9,146,437) (7,171,937) (8,096,505) (6,569,738)
Cash paid to reinsurers/ consumers (58,529) (130,988) (48,926) (110,303)
Commission received 5,212 13,345 5,212 13,345
Maintenance expenses paid (608,226) (744,597) (608,226) (737,979)
Acquisition costs (357,050) (308,803) (215,098) (222,029)
Employee benefits paid (1,019,072) (821,441) (674,306) (555,209)
Other operating expenses paid (1,318,855) (968,164) (1,107,002) (926,531)
Other income received 66,680 124,190 83,980 175,782
Interest received 3,210,470 3,662,701 3,085,747 3,555,310
Income tax paid (50,231) (30,080) (50,231) (30,080)
Net cash from operating activities (1,786,345) 7,839,601 (1,509,562) 7,815,126
Cash flow from investing activities: Purchases of plant and equipment (35,904) (69,996) (27,608) (34,563)
Purchase of intangible assets (30,199) (2,246) (9,588) (2,246)
Capital injection made to subsidiary (180,741)
Capital Improvement of investment properties (2,000) (1,513) (2,000) (1,513)
Proceeds from disposal of property and equipment 646 135 646 135
Capital injection made to National Insurance
commission (38,987) (87,381) Purchase of financial assets - AFS (32,500) (32,500) Purchase of financial assets- HTM (5,008,041) (5,008,041)
Proceed from disposal of financial asset - AFS 85,594 85,594 Principal repayment of financial assets- HTM 757,158 757,158 Purchase of financial assets- loan and receivable Net cash used in investing activities 703,808 (5,169,042) 771,702 (5,226,969)
Cash flow from financing
activities: Repayment of borrowings (21,236) - (21,236) -
Proceeds from borrowings 238,143 - 198,771 -
Net cash used in financing activities 216,907 - 177,535 -
Net increase/(decrease) in cash and cash
equivalents (865,630) 2,670,559 (560,325) 2,588,157
Cash and cash equivalent at beginning of year 6,806,871 4,136,312 6,359,793 3,771,636
Net increase/decrease in cash and cash
equivalents (865,630) 2,670,559 (560,325) 2,588,157
Cash and cash equivalent at end of
period
Note
6.1 5,941,241 6,806,871 5,799,468 6,359,793
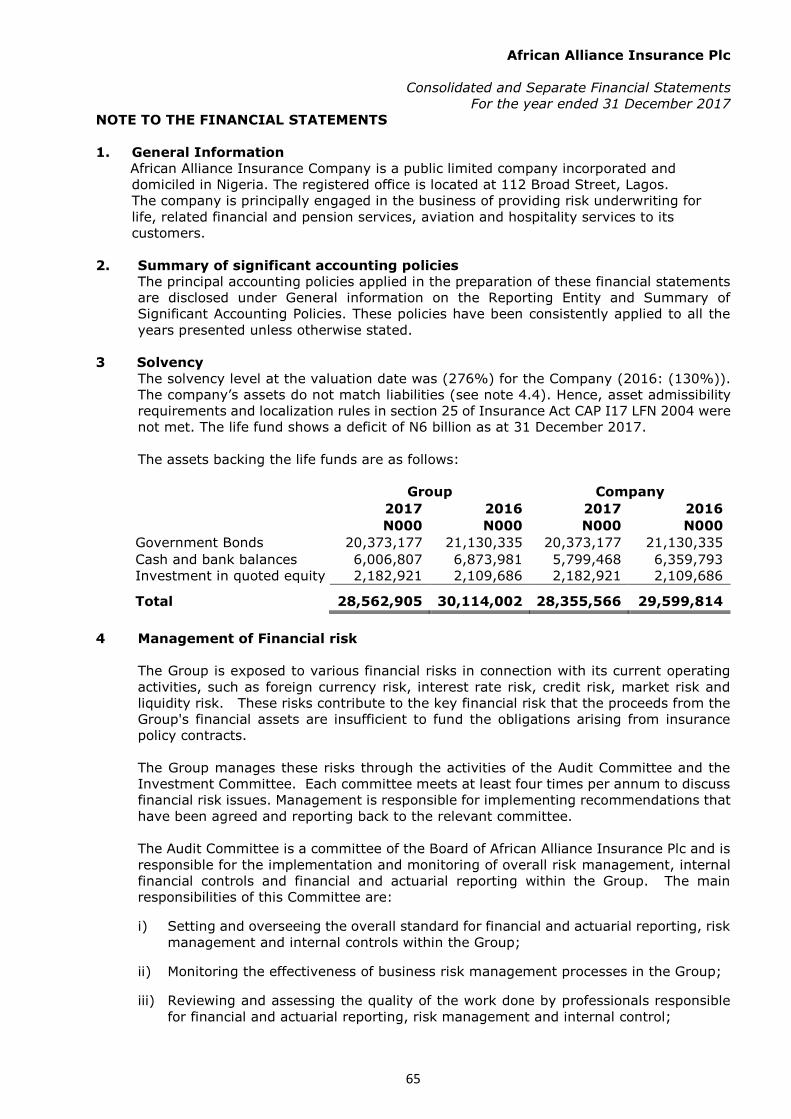
African Alliance Insurance Plc
Consolidated and Separate Financial Statements
For the year ended 31 December 2017
NOTE TO THE FINANCIAL STATEMENTS
65
1. General Information
African Alliance Insurance Company is a public limited company incorporated and
domiciled in Nigeria. The registered office is located at 112 Broad Street, Lagos.
The company is principally engaged in the business of providing risk underwriting for
life, related financial and pension services, aviation and hospitality services to its
customers.
2. Summary of significant accounting policies
The principal accounting policies applied in the preparation of these financial statements
are disclosed under General information on the Reporting Entity and Summary of
Significant Accounting Policies. These policies have been consistently applied to all the
years presented unless otherwise stated.
3 Solvency
The solvency level at the valuation date was (276%) for the Company (2016: (130%)).
The company’s assets do not match liabilities (see note 4.4). Hence, asset admissibility
requirements and localization rules in section 25 of Insurance Act CAP I17 LFN 2004 were
not met. The life fund shows a deficit of N6 billion as at 31 December 2017.
The assets backing the life funds are as follows:
Group Company
2017 2016 2017 2016 N000 N000 N000 N000
Government Bonds 20,373,177 21,130,335 20,373,177 21,130,335 Cash and bank balances 6,006,807 6,873,981 5,799,468 6,359,793 Investment in quoted equity 2,182,921 2,109,686 2,182,921 2,109,686
Total
28,562,905 30,114,002 28,355,566 29,599,814
4 Management of Financial risk
The Group is exposed to various financial risks in connection with its current operating
activities, such as foreign currency risk, interest rate risk, credit risk, market risk and
liquidity risk. These risks contribute to the key financial risk that the proceeds from the
Group's financial assets are insufficient to fund the obligations arising from insurance
policy contracts.
The Group manages these risks through the activities of the Audit Committee and the
Investment Committee. Each committee meets at least four times per annum to discuss
financial risk issues. Management is responsible for implementing recommendations that
have been agreed and reporting back to the relevant committee.
The Audit Committee is a committee of the Board of African Alliance Insurance Plc and is
responsible for the implementation and monitoring of overall risk management, internal
financial controls and financial and actuarial reporting within the Group. The main
responsibilities of this Committee are:
i) Setting and overseeing the overall standard for financial and actuarial reporting, risk
management and internal controls within the Group;
ii) Monitoring the effectiveness of business risk management processes in the Group;
iii) Reviewing and assessing the quality of the work done by professionals responsible
for financial and actuarial reporting, risk management and internal control;
African Alliance Insurance Plc
Consolidated and Separate Financial Statements
For the year ended 31 December 2017
NOTE TO THE FINANCIAL STATEMENTS
66
iv) Engaging in discussions with external and internal auditors on the quality and
acceptability of the control environment and reporting structures.
The Investment Committee is a management committee and is responsible for
i) ensuring that insurance and investment contract liabilities are matched with
appropriate supporting assets based on the type of benefits payable to the contract
holders;
ii) ensuring that the long-term investment return on assets supporting policy liabilities
are sufficient to fund policyholders' reasonable benefit expectations and the
shareholders' profit entitlement;
iii) the implementation and monitoring of the asset management process to ensure that
the risks arising from trading positions are effectively managed within the pre-
determined risk parameters.
4.1 Market risk
The business's operations are exposed to market risk. Market risk is the risk of adverse
financial impact as a consequence of market movements such as currency exchange
rates, interest rates and other price changes. Market risks arises due to fluctuations in
both value of assets and liabilities. The company has established policies and procedures
in order to manage market risk.
The acquisition of policyholders’ assets is based on the design of the product and
marketing descriptions. Within these parameters, investments are managed with the aim
of maximising policyholder returns while limiting risk to acceptable levels within the
framework of statutory requirements. The focus of risk measurement and management
is to ensure that the potential risks inherent in an investment are reasonable for the
future potential reward, exposure to investment risk is limited to acceptable levels,
premium rates are adequate to compensate for investment risk and an adequate
reserving policy is applied for long-term policy liabilities. The diverse product range
requires a variety of approaches to the management of risk; these range from portfolio
management practices and techniques such as optimization of expected risks and
rewards based on investment objectives, to asset-liability matching in support of
statement of financial position obligations.
4.1.1 Foreign exchange risk
Foreign exchange risk is the risk associated with movement in the foreign exchange prices
from foreign currency denominated transactions which the Group is exposed to.
The Group is exposed to foreign exchange currency risk primarily through certain
transactions denominated in foreign currency. The Group is exposed to foreign currency
denominated in dollars and Pound through bank balances in other foreign currencies.
The Group manages its exposure to foreign exchange risk using sensitivity analysis to
assess potential changes in the value of foreign exchange positions and impact of such
changes on the Group's income. There have been no major changes from the previous
year in the exposure to risk or policies, procedures and methods used to measure the
risk.
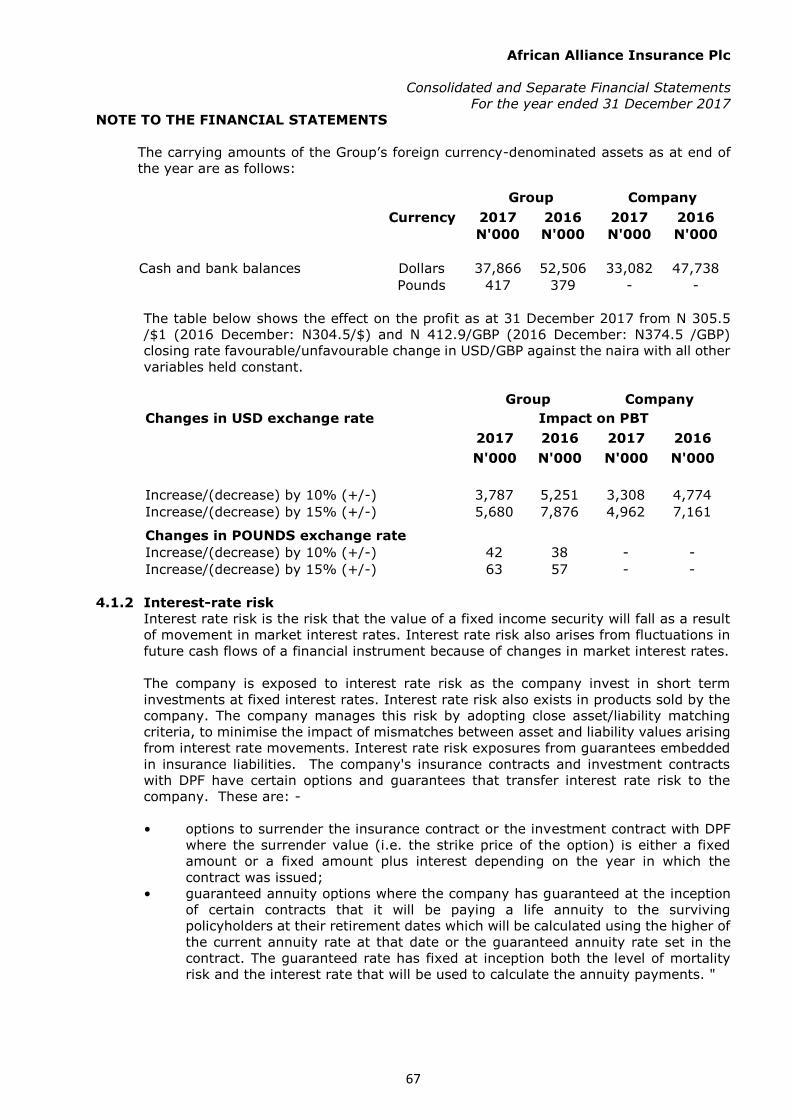
African Alliance Insurance Plc
Consolidated and Separate Financial Statements
For the year ended 31 December 2017
NOTE TO THE FINANCIAL STATEMENTS
67
The carrying amounts of the Group’s foreign currency-denominated assets as at end of
the year are as follows:
Group Company
Currency 2017 2016 2017 2016 N'000 N'000 N'000 N'000
Cash and bank balances Dollars 37,866 52,506 33,082 47,738
Pounds 417 379 - -
The table below shows the effect on the profit as at 31 December 2017 from N 305.5
/$1 (2016 December: N304.5/$) and N 412.9/GBP (2016 December: N374.5 /GBP)
closing rate favourable/unfavourable change in USD/GBP against the naira with all other
variables held constant.
Group Company
Changes in USD exchange rate Impact on PBT
2017 2016 2017 2016
N'000 N'000 N'000 N'000
Increase/(decrease) by 10% (+/-) 3,787 5,251 3,308 4,774 Increase/(decrease) by 15% (+/-) 5,680 7,876 4,962 7,161
Changes in POUNDS exchange rate
Increase/(decrease) by 10% (+/-) 42 38 - - Increase/(decrease) by 15% (+/-) 63 57 - -
4.1.2 Interest-rate risk
Interest rate risk is the risk that the value of a fixed income security will fall as a result
of movement in market interest rates. Interest rate risk also arises from fluctuations in
future cash flows of a financial instrument because of changes in market interest rates.
The company is exposed to interest rate risk as the company invest in short term
investments at fixed interest rates. Interest rate risk also exists in products sold by the
company. The company manages this risk by adopting close asset/liability matching
criteria, to minimise the impact of mismatches between asset and liability values arising
from interest rate movements. Interest rate risk exposures from guarantees embedded
in insurance liabilities. The company's insurance contracts and investment contracts
with DPF have certain options and guarantees that transfer interest rate risk to the
company. These are: -
• options to surrender the insurance contract or the investment contract with DPF
where the surrender value (i.e. the strike price of the option) is either a fixed
amount or a fixed amount plus interest depending on the year in which the
contract was issued;
• guaranteed annuity options where the company has guaranteed at the inception
of certain contracts that it will be paying a life annuity to the surviving
policyholders at their retirement dates which will be calculated using the higher of
the current annuity rate at that date or the guaranteed annuity rate set in the
contract. The guaranteed rate has fixed at inception both the level of mortality
risk and the interest rate that will be used to calculate the annuity payments. "
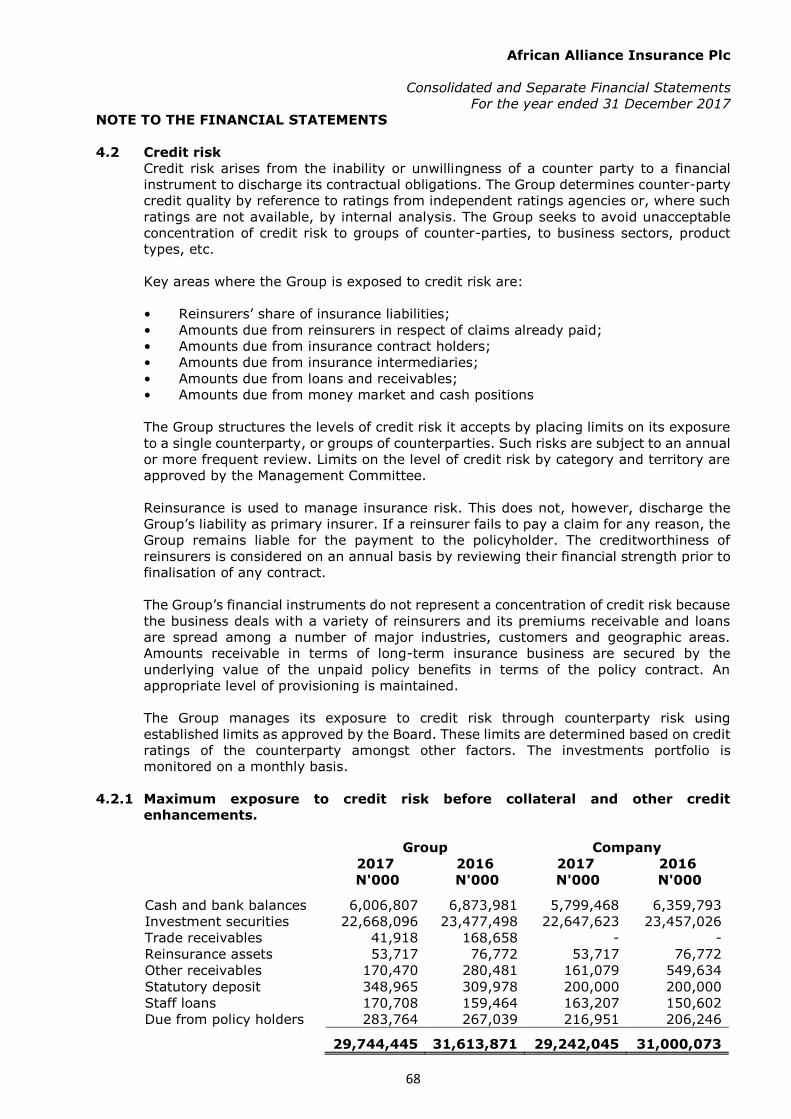
African Alliance Insurance Plc
Consolidated and Separate Financial Statements
For the year ended 31 December 2017
NOTE TO THE FINANCIAL STATEMENTS
68
4.2 Credit risk
Credit risk arises from the inability or unwillingness of a counter party to a financial
instrument to discharge its contractual obligations. The Group determines counter-party
credit quality by reference to ratings from independent ratings agencies or, where such
ratings are not available, by internal analysis. The Group seeks to avoid unacceptable
concentration of credit risk to groups of counter-parties, to business sectors, product
types, etc.
Key areas where the Group is exposed to credit risk are:
• Reinsurers’ share of insurance liabilities;
• Amounts due from reinsurers in respect of claims already paid;
• Amounts due from insurance contract holders;
• Amounts due from insurance intermediaries;
• Amounts due from loans and receivables;
• Amounts due from money market and cash positions
The Group structures the levels of credit risk it accepts by placing limits on its exposure
to a single counterparty, or groups of counterparties. Such risks are subject to an annual
or more frequent review. Limits on the level of credit risk by category and territory are
approved by the Management Committee.
Reinsurance is used to manage insurance risk. This does not, however, discharge the
Group’s liability as primary insurer. If a reinsurer fails to pay a claim for any reason, the
Group remains liable for the payment to the policyholder. The creditworthiness of
reinsurers is considered on an annual basis by reviewing their financial strength prior to
finalisation of any contract.
The Group’s financial instruments do not represent a concentration of credit risk because
the business deals with a variety of reinsurers and its premiums receivable and loans
are spread among a number of major industries, customers and geographic areas.
Amounts receivable in terms of long-term insurance business are secured by the
underlying value of the unpaid policy benefits in terms of the policy contract. An
appropriate level of provisioning is maintained.
The Group manages its exposure to credit risk through counterparty risk using
established limits as approved by the Board. These limits are determined based on credit
ratings of the counterparty amongst other factors. The investments portfolio is
monitored on a monthly basis.
4.2.1 Maximum exposure to credit risk before collateral and other credit
enhancements.
Group Company
2017 2016 2017 2016 N'000 N'000 N'000 N'000
Cash and bank balances 6,006,807 6,873,981 5,799,468 6,359,793 Investment securities
22,668,096 23,477,498 22,647,623 23,457,026
Trade receivables
41,918 168,658 - - Reinsurance assets
53,717 76,772 53,717 76,772
Other receivables
170,470 280,481 161,079 549,634 Statutory deposit
348,965 309,978 200,000 200,000
Staff loans
170,708 159,464 163,207 150,602 Due from policy holders 283,764 267,039 216,951 206,246
29,744,445 31,613,871 29,242,045 31,000,073

African Alliance Insurance Plc
Consolidated and Separate Financial Statements
For the year ended 31 December 2017
NOTE TO THE FINANCIAL STATEMENTS
69
4.2.2 Credit quality of financial assets
All assets are classified as “Neither past due nor impaired”. Credit quality of trade
receivables is summarised as follows:
Group Company 2017 2016 2017 2016 N'000 N'000 N'000 N'000
Neither past due nor
impaired 29,119,503 30,906,887 28,700,808 30,093,591 Individually impaired
624,942 706,984 541,237 906,482
Gross
29,744,445 31,613,871 29,242,045 31,000,073 Less: allowance for
impairment (395,744) (68,488) (690,601) (57,713)
Net 29,348,701 31,545,383 28,551,444 30,942,360
No trade receivable balance was past due but not impaired. The risk associated with
other receivables are low.
4.2.3 Credit quality of financial assets neither past due nor impaired
The credit quality of financial assets that are neither past due nor impaired can be
assessed by reference to internal credit ratings or to historical information about
counterparty default rates:
Internal credit rating system:
Rating
bucket
Description
Range
of
scores
Probability
of default
AAA
Extremely low risk
1
1.00-1.99 90-100% 1% AA
Very low risk
2
2.00-2.99 80-89% 1% A
Low risk
3
3.00-3.99 70-79% 1.5% BBB
Low risk
4
4.00-4.99 60-69% 2% BB
Acceptable - moderately high risk
5
5.00-5.99 50-59% 4% B
High risk
6
6.00-6.99 40-49% 6% CCC
Very high risk
7
7.00-7.99 30-39% 9% CC
Extremely high risk
8
8.00-8.99 10-29% 13% C
High likelihood of default
9
9.00-9.99 0-9% 15% D
Default risk
10
D
Sub -standard
25%
D
Doubtful
50% D
Lost
100%
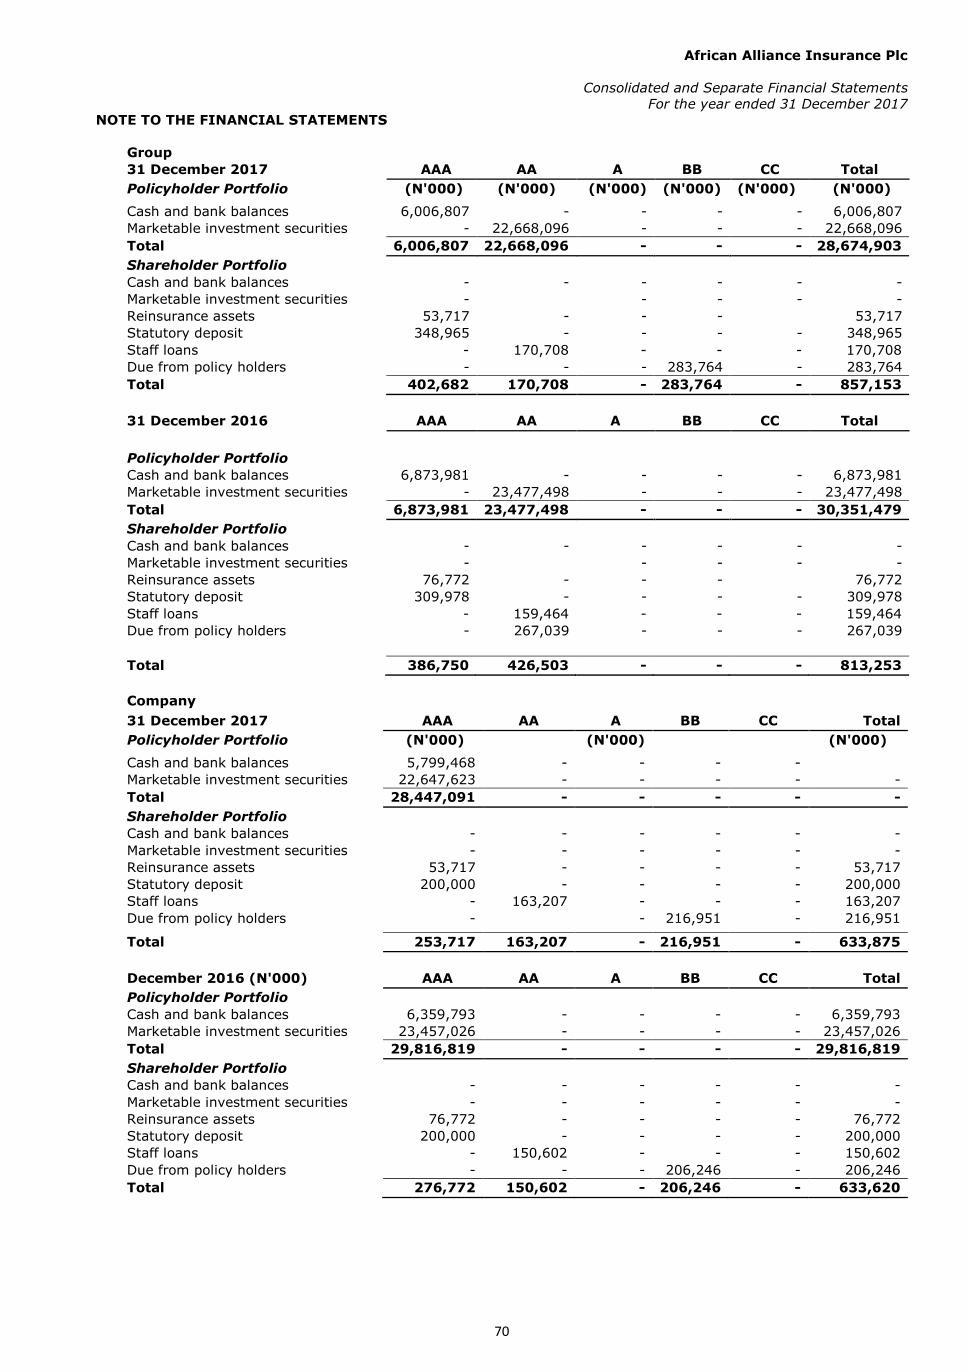
African Alliance Insurance Plc
Consolidated and Separate Financial Statements
For the year ended 31 December 2017
NOTE TO THE FINANCIAL STATEMENTS
70
Group
31 December 2017
AAA AA A BB CC Total
Policyholder Portfolio (N'000) (N'000) (N'000) (N'000) (N'000) (N'000)
Cash and bank balances 6,006,807 - - - - 6,006,807 Marketable investment securities - 22,668,096 - - - 22,668,096 Total
6,006,807 22,668,096 - - - 28,674,903
Shareholder Portfolio
Cash and bank balances - - - - - - Marketable investment securities -
- - - -
Reinsurance assets
53,717 - - -
53,717 Statutory deposit
348,965 - - - - 348,965
Staff loans
- 170,708 - - - 170,708 Due from policy holders - - - 283,764 - 283,764 Total
402,682 170,708 - 283,764 - 857,153
31 December 2016
AAA AA A BB CC Total
Policyholder Portfolio
Cash and bank balances 6,873,981 - - - - 6,873,981 Marketable investment securities - 23,477,498 - - - 23,477,498 Total
6,873,981 23,477,498 - - - 30,351,479
Shareholder Portfolio
Cash and bank balances - - - - - - Marketable investment securities -
- - - -
Reinsurance assets
76,772 - - -
76,772 Statutory deposit
309,978 - - - - 309,978
Staff loans
- 159,464 - - - 159,464 Due from policy holders - 267,039 - - - 267,039
Total
386,750 426,503 - - - 813,253
Company
31 December 2017
AAA AA A BB CC Total
Policyholder Portfolio
(N'000)
(N'000)
(N'000)
Cash and bank balances 5,799,468 - - - -
Marketable investment securities 22,647,623 - - - - - Total
28,447,091 - - - - -
Shareholder Portfolio
Cash and bank balances - - - - - - Marketable investment securities - - - - - - Reinsurance assets
53,717 - - - - 53,717
Statutory deposit
200,000 - - - - 200,000 Staff loans
- 163,207 - - - 163,207
Due from policy holders
-
- 216,951 - 216,951
Total
253,717 163,207 - 216,951 - 633,875
December 2016 (N'000) AAA AA A BB CC Total Policyholder Portfolio
Cash and bank balances 6,359,793 - - - - 6,359,793 Marketable investment securities 23,457,026 - - - - 23,457,026 Total
29,816,819 - - - - 29,816,819
Shareholder Portfolio
Cash and bank balances - - - - - - Marketable investment securities - - - - - - Reinsurance assets
76,772 - - - - 76,772
Statutory deposit
200,000 - - - - 200,000 Staff loans
- 150,602 - - - 150,602
Due from policy holders
- - - 206,246 - 206,246 Total
276,772 150,602 - 206,246 - 633,620
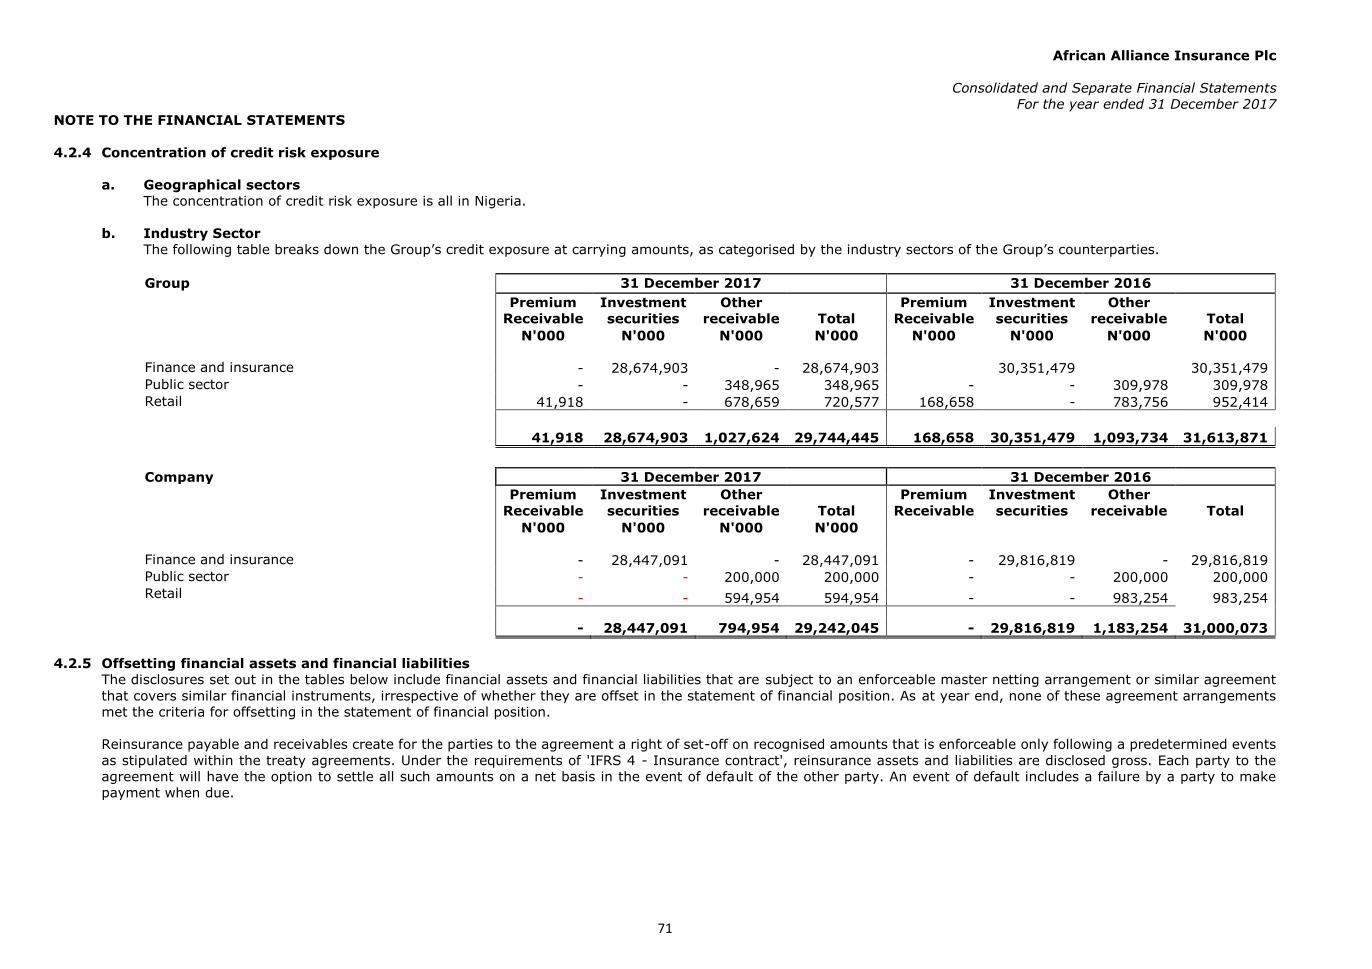
African Alliance Insurance Plc
Consolidated and Separate Financial Statements
For the year ended 31 December 2017
NOTE TO THE FINANCIAL STATEMENTS
71
4.2.4 Concentration of credit risk exposure
a. Geographical sectors
The concentration of credit risk exposure is all in Nigeria.
b. Industry Sector
The following table breaks down the Group’s credit exposure at carrying amounts, as categorised by the industry sectors of the Group’s counterparties.
Group
31 December 2017 31 December 2016
Premium
Receivable
Investment
securities
Other
receivable Total
Premium
Receivable
Investment
securities
Other
receivable Total N'000 N'000 N'000 N'000 N'000 N'000 N'000 N'000
Finance and insurance - 28,674,903 - 28,674,903 30,351,479 30,351,479 Public sector
- - 348,965 348,965 - - 309,978 309,978
Retail
41,918 - 678,659 720,577 168,658 - 783,756 952,414
41,918 28,674,903 1,027,624 29,744,445 168,658 30,351,479 1,093,734 31,613,871
Company
31 December 2017 31 December 2016
Premium
Receivable
Investment
securities
Other
receivable Total
Premium
Receivable
Investment
securities
Other
receivable Total N'000 N'000 N'000 N'000
Finance and insurance - 28,447,091 - 28,447,091 - 29,816,819 - 29,816,819 Public sector
- - 200,000 200,000 - - 200,000 200,000
Retail
- - 594,954 594,954 - - 983,254 983,254
- 28,447,091 794,954 29,242,045 - 29,816,819 1,183,254 31,000,073
4.2.5 Offsetting financial assets and financial liabilities
The disclosures set out in the tables below include financial assets and financial liabilities that are subject to an enforceable master netting arrangement or similar agreement
that covers similar financial instruments, irrespective of whether they are offset in the statement of financial position. As at year end, none of these agreement arrangements
met the criteria for offsetting in the statement of financial position.
Reinsurance payable and receivables create for the parties to the agreement a right of set-off on recognised amounts that is enforceable only following a predetermined events
as stipulated within the treaty agreements. Under the requirements of 'IFRS 4 - Insurance contract', reinsurance assets and liabilities are disclosed gross. Each party to the
agreement will have the option to settle all such amounts on a net basis in the event of default of the other party. An event of default includes a failure by a party to make
payment when due.
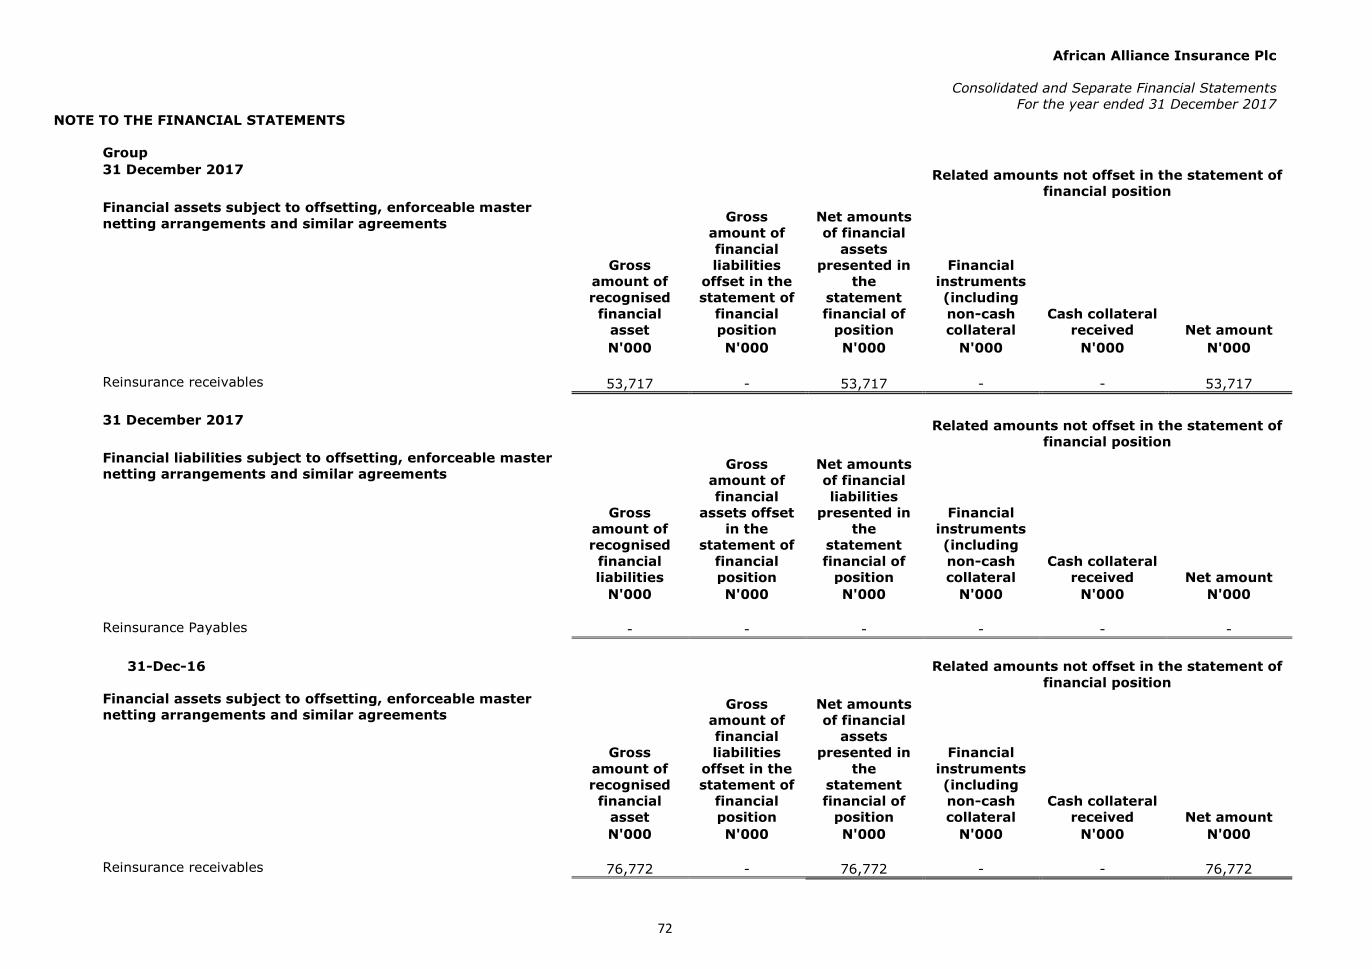
African Alliance Insurance Plc
Consolidated and Separate Financial Statements
For the year ended 31 December 2017
NOTE TO THE FINANCIAL STATEMENTS
72
Group
31 December 2017
Related amounts not offset in the statement of
financial position Financial assets subject to offsetting, enforceable master
netting arrangements and similar agreements
Gross
amount of
recognised
financial
asset
Gross
amount of
financial
liabilities
offset in the
statement of
financial
position
Net amounts
of financial
assets
presented in
the
statement
financial of
position
Financial
instruments
(including
non-cash
collateral
Cash collateral
received Net amount N'000 N'000 N'000 N'000 N'000 N'000
Reinsurance receivables
53,717 - 53,717 - - 53,717
31 December 2017
Related amounts not offset in the statement of
financial position
Financial liabilities subject to offsetting, enforceable master
netting arrangements and similar agreements
Gross
amount of
recognised
financial
liabilities
Gross
amount of
financial
assets offset
in the
statement of
financial
position
Net amounts
of financial
liabilities
presented in
the
statement
financial of
position
Financial
instruments
(including
non-cash
collateral
Cash collateral
received Net amount
N'000 N'000 N'000 N'000 N'000 N'000
Reinsurance Payables
- - - - - -
31-Dec-16
Related amounts not offset in the statement of
financial position Financial assets subject to offsetting, enforceable master
netting arrangements and similar agreements
Gross
amount of
recognised
financial
asset
Gross
amount of
financial
liabilities
offset in the
statement of
financial
position
Net amounts
of financial
assets
presented in
the
statement
financial of
position
Financial
instruments
(including
non-cash
collateral
Cash collateral
received Net amount N'000 N'000 N'000 N'000 N'000 N'000
Reinsurance receivables
76,772 - 76,772 - - 76,772
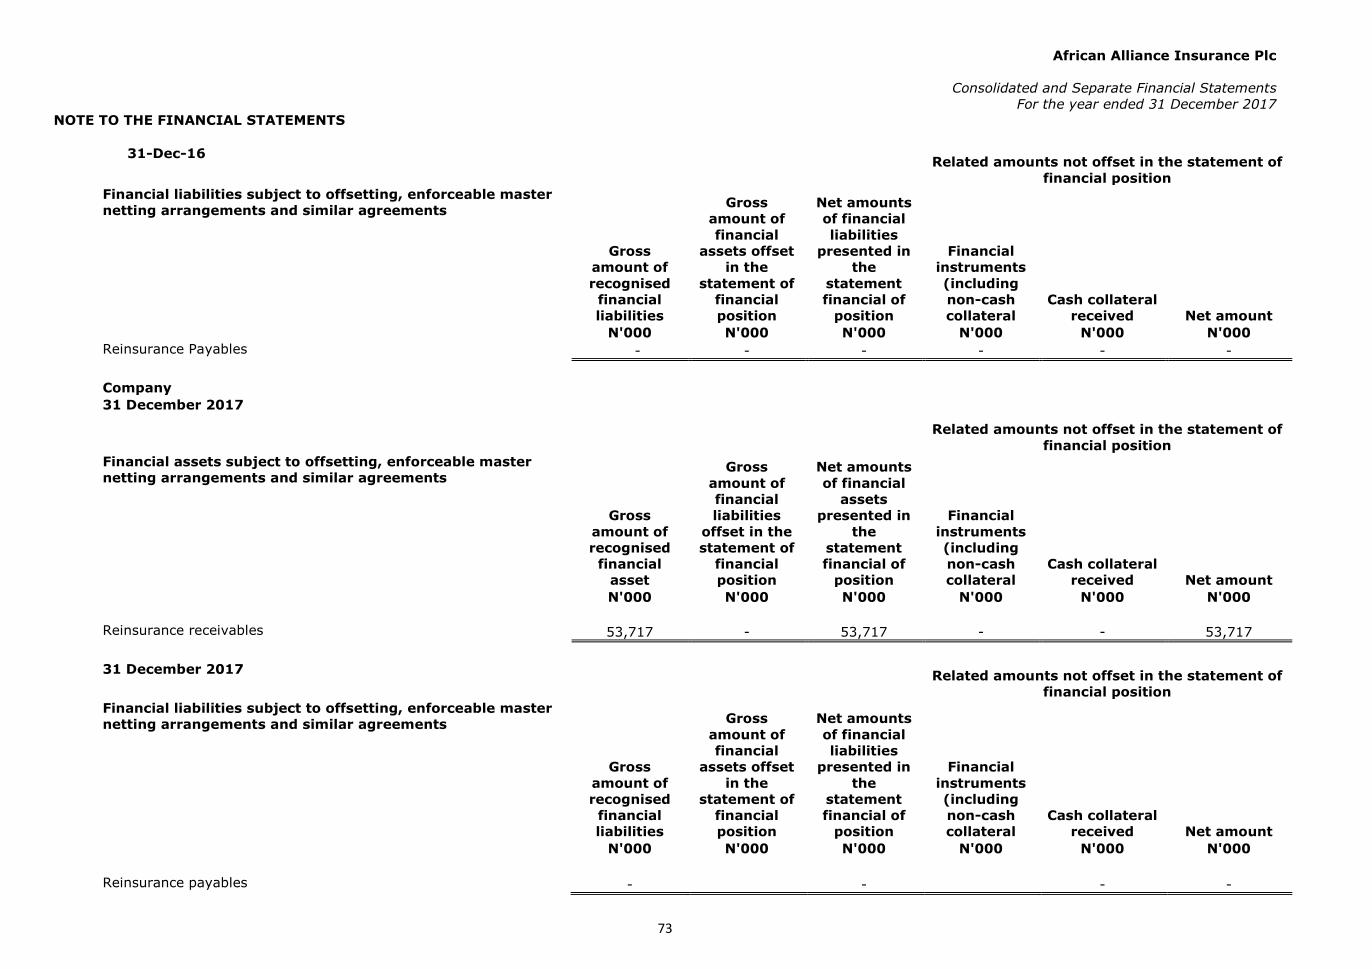
African Alliance Insurance Plc
Consolidated and Separate Financial Statements
For the year ended 31 December 2017
NOTE TO THE FINANCIAL STATEMENTS
73
31-Dec-16
Related amounts not offset in the statement of
financial position Financial liabilities subject to offsetting, enforceable master
netting arrangements and similar agreements
Gross
amount of
recognised
financial
liabilities
Gross
amount of
financial
assets offset
in the
statement of
financial
position
Net amounts
of financial
liabilities
presented in
the
statement
financial of
position
Financial
instruments
(including
non-cash
collateral
Cash collateral
received Net amount N'000 N'000 N'000 N'000 N'000 N'000
Reinsurance Payables
- - - - - -
Company
31 December 2017
Related amounts not offset in the statement of
financial position Financial assets subject to offsetting, enforceable master
netting arrangements and similar agreements
Gross
amount of
recognised
financial
asset
Gross
amount of
financial
liabilities
offset in the
statement of
financial
position
Net amounts
of financial
assets
presented in
the
statement
financial of
position
Financial
instruments
(including
non-cash
collateral
Cash collateral
received Net amount N'000 N'000 N'000 N'000 N'000 N'000
Reinsurance receivables
53,717 - 53,717 - - 53,717
31 December 2017
Related amounts not offset in the statement of
financial position Financial liabilities subject to offsetting, enforceable master
netting arrangements and similar agreements
Gross
amount of
recognised
financial
liabilities
Gross
amount of
financial
assets offset
in the
statement of
financial
position
Net amounts
of financial
liabilities
presented in
the
statement
financial of
position
Financial
instruments
(including
non-cash
collateral
Cash collateral
received Net amount N'000 N'000 N'000 N'000 N'000 N'000
Reinsurance payables
- - - -
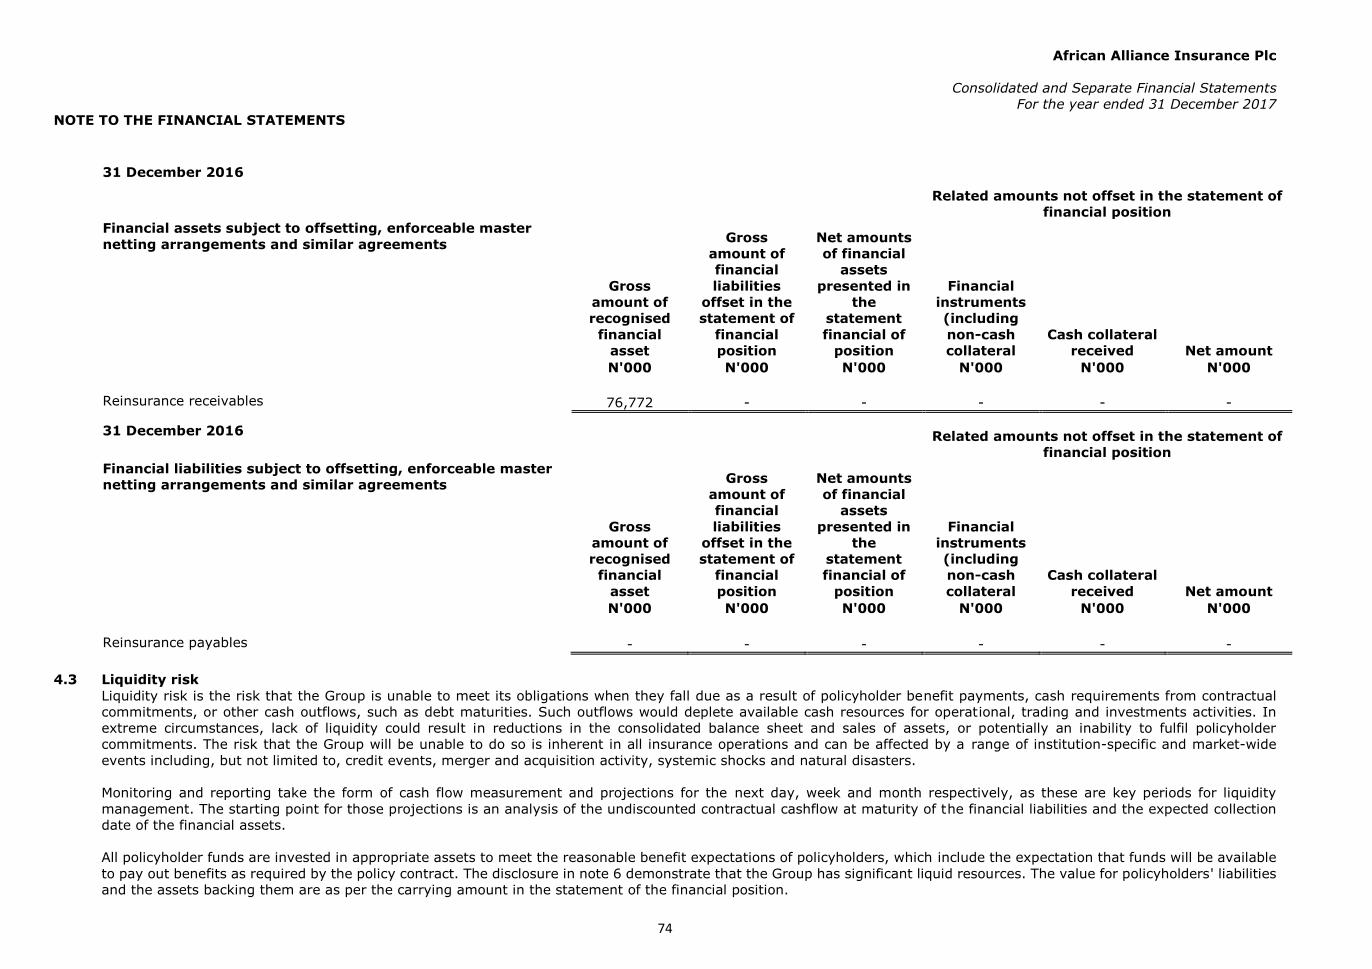
African Alliance Insurance Plc
Consolidated and Separate Financial Statements
For the year ended 31 December 2017
NOTE TO THE FINANCIAL STATEMENTS
74
31 December 2016
Related amounts not offset in the statement of
financial position Financial assets subject to offsetting, enforceable master
netting arrangements and similar agreements
Gross
amount of
recognised
financial
asset
Gross
amount of
financial
liabilities
offset in the
statement of
financial
position
Net amounts
of financial
assets
presented in
the
statement
financial of
position
Financial
instruments
(including
non-cash
collateral
Cash collateral
received Net amount N'000 N'000 N'000 N'000 N'000 N'000
Reinsurance receivables
76,772 - - - - -
31 December 2016
Related amounts not offset in the statement of
financial position Financial liabilities subject to offsetting, enforceable master
netting arrangements and similar agreements
Gross
amount of
recognised
financial
asset
Gross
amount of
financial
liabilities
offset in the
statement of
financial
position
Net amounts
of financial
assets
presented in
the
statement
financial of
position
Financial
instruments
(including
non-cash
collateral
Cash collateral
received Net amount N'000 N'000 N'000 N'000 N'000 N'000
Reinsurance payables
- - - - - -
4.3 Liquidity risk
Liquidity risk is the risk that the Group is unable to meet its obligations when they fall due as a result of policyholder benefit payments, cash requirements from contractual
commitments, or other cash outflows, such as debt maturities. Such outflows would deplete available cash resources for operational, trading and investments activities. In
extreme circumstances, lack of liquidity could result in reductions in the consolidated balance sheet and sales of assets, or potentially an inability to fulfil policyholder
commitments. The risk that the Group will be unable to do so is inherent in all insurance operations and can be affected by a range of institution-specific and market-wide
events including, but not limited to, credit events, merger and acquisition activity, systemic shocks and natural disasters.
Monitoring and reporting take the form of cash flow measurement and projections for the next day, week and month respectively, as these are key periods for liquidity
management. The starting point for those projections is an analysis of the undiscounted contractual cashflow at maturity of the financial liabilities and the expected collection
date of the financial assets.
All policyholder funds are invested in appropriate assets to meet the reasonable benefit expectations of policyholders, which include the expectation that funds will be available
to pay out benefits as required by the policy contract. The disclosure in note 6 demonstrate that the Group has significant liquid resources. The value for policyholders' liabilities
and the assets backing them are as per the carrying amount in the statement of the financial position.
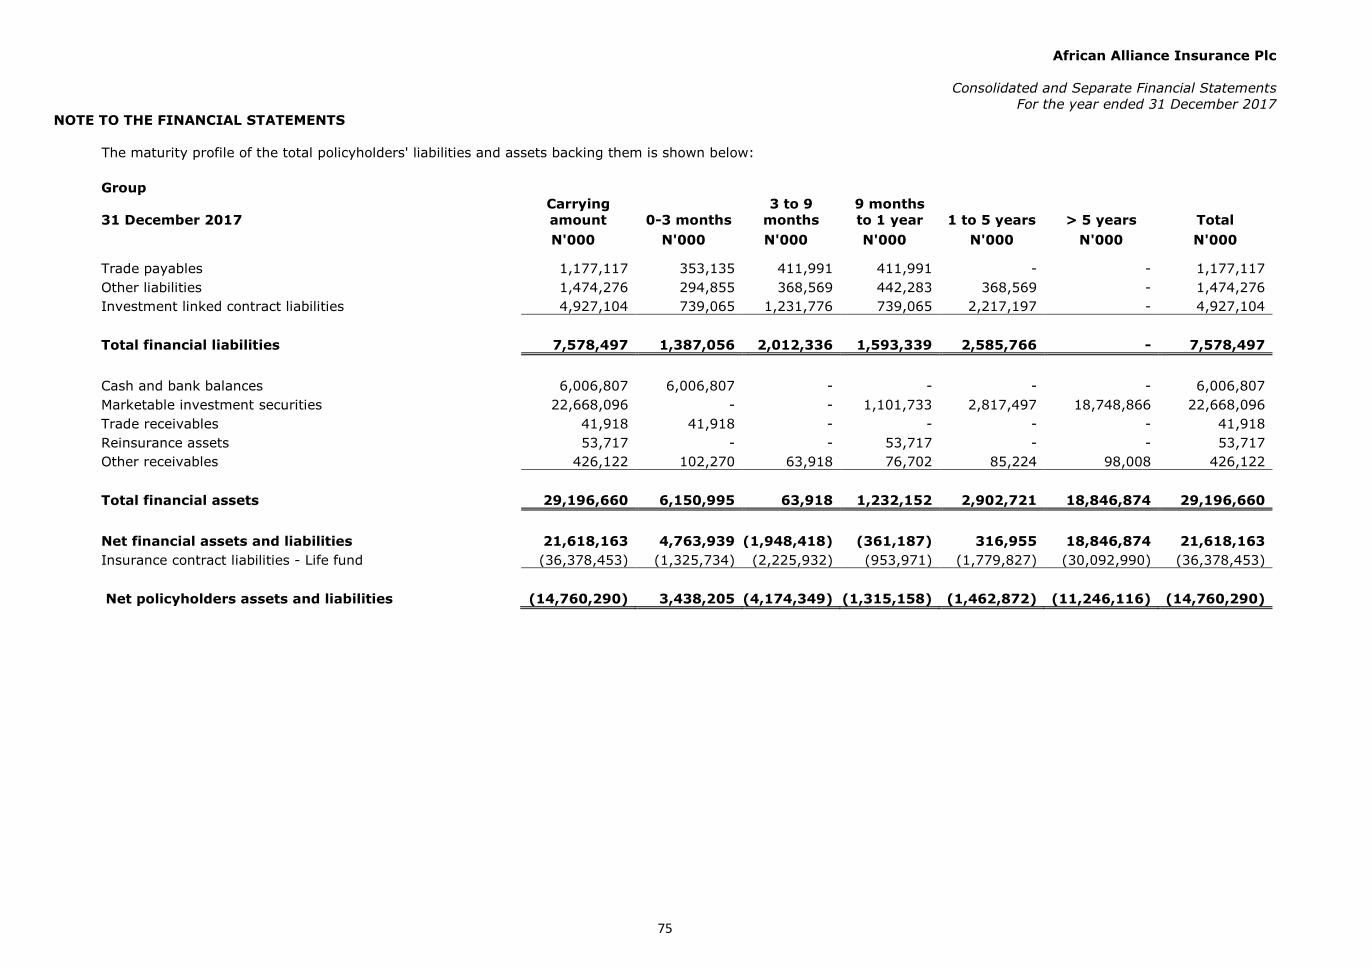
African Alliance Insurance Plc
Consolidated and Separate Financial Statements
For the year ended 31 December 2017
NOTE TO THE FINANCIAL STATEMENTS
75
The maturity profile of the total policyholders' liabilities and assets backing them is shown below:
Group
31 December 2017
Carrying
amount 0-3 months
3 to 9
months
9 months
to 1 year 1 to 5 years > 5 years Total
N'000 N'000 N'000 N'000 N'000 N'000 N'000
Trade payables 1,177,117 353,135 411,991 411,991 - - 1,177,117
Other liabilities 1,474,276 294,855 368,569 442,283 368,569 - 1,474,276
Investment linked contract liabilities 4,927,104 739,065 1,231,776 739,065 2,217,197 - 4,927,104
Total financial liabilities 7,578,497 1,387,056 2,012,336 1,593,339 2,585,766 - 7,578,497
Cash and bank balances 6,006,807 6,006,807 - - - - 6,006,807
Marketable investment securities 22,668,096 - - 1,101,733 2,817,497 18,748,866 22,668,096
Trade receivables 41,918 41,918 - - - - 41,918
Reinsurance assets 53,717 - - 53,717 - - 53,717
Other receivables 426,122 102,270 63,918 76,702 85,224 98,008 426,122
Total financial assets 29,196,660 6,150,995 63,918 1,232,152 2,902,721 18,846,874 29,196,660
Net financial assets and liabilities 21,618,163 4,763,939 (1,948,418) (361,187) 316,955 18,846,874 21,618,163
Insurance contract liabilities - Life fund (36,378,453) (1,325,734) (2,225,932) (953,971) (1,779,827) (30,092,990) (36,378,453)
Net policyholders assets and liabilities (14,760,290) 3,438,205 (4,174,349) (1,315,158) (1,462,872) (11,246,116) (14,760,290)

African Alliance Insurance Plc
Consolidated and Separate Financial Statements
For the year ended 31 December 2017
NOTE TO THE FINANCIAL STATEMENTS
76
Group
31-Dec-16
Carrying
amount
0-3
months
3 to 9
months
9 months to
1 year 1 to 5 years > 5 years Total
N'000 N'000 N'000 N'000 N'000 N'000 N'000
Trade payables 1,183,273 354,981 414,146 414,146 - - 1,183,273
Other liabilities 1,025,939 205,188 256,484 307,782 256,485 - 1,025,939
Investment linked contract liabilities 5,411,398 811,710 1,352,850 811,709 2,435,129 - 5,411,398
Total financial liabilities 7,620,610 1,371,879 2,023,480 1,533,637 2,691,614 - 7,620,610
Cash and bank balances 6,873,981 6,873,981 - - - - 6,873,981
Marketable investment securities 23,477,498 - - - - 23,477,498 23,477,498
Trade receivables 168,658 168,658 - - - - 168,658
Reinsurance assets 76,722 - - 76,772 - - 76,772
Statutory Deposit 309,978 - 309,978 309,978
Other receivables 627,960 150,710 94,194 113,033 125,592 144,431 627,960
Total financial assets 31,534,847 7,193,349 94,194 189,805 125,592 23,931,907 31,534,847
Net financial assets and liabilities 23,914,237 5,821,470 (1,929,286) (1,343,832) (2,566,022) 23,931,907 23,914,237
Insurance contract liabilities - Life fund (31,611,594) (869,364) (1,521,387) (652,023) (1,304,046) (27,264,775) (31,611,594)
Net policyholders assets and liabilities (7,697,357) 4,952,106 (3,450,672) (1,955,855) (3,870,068) (3,332,868) (7,697,357)
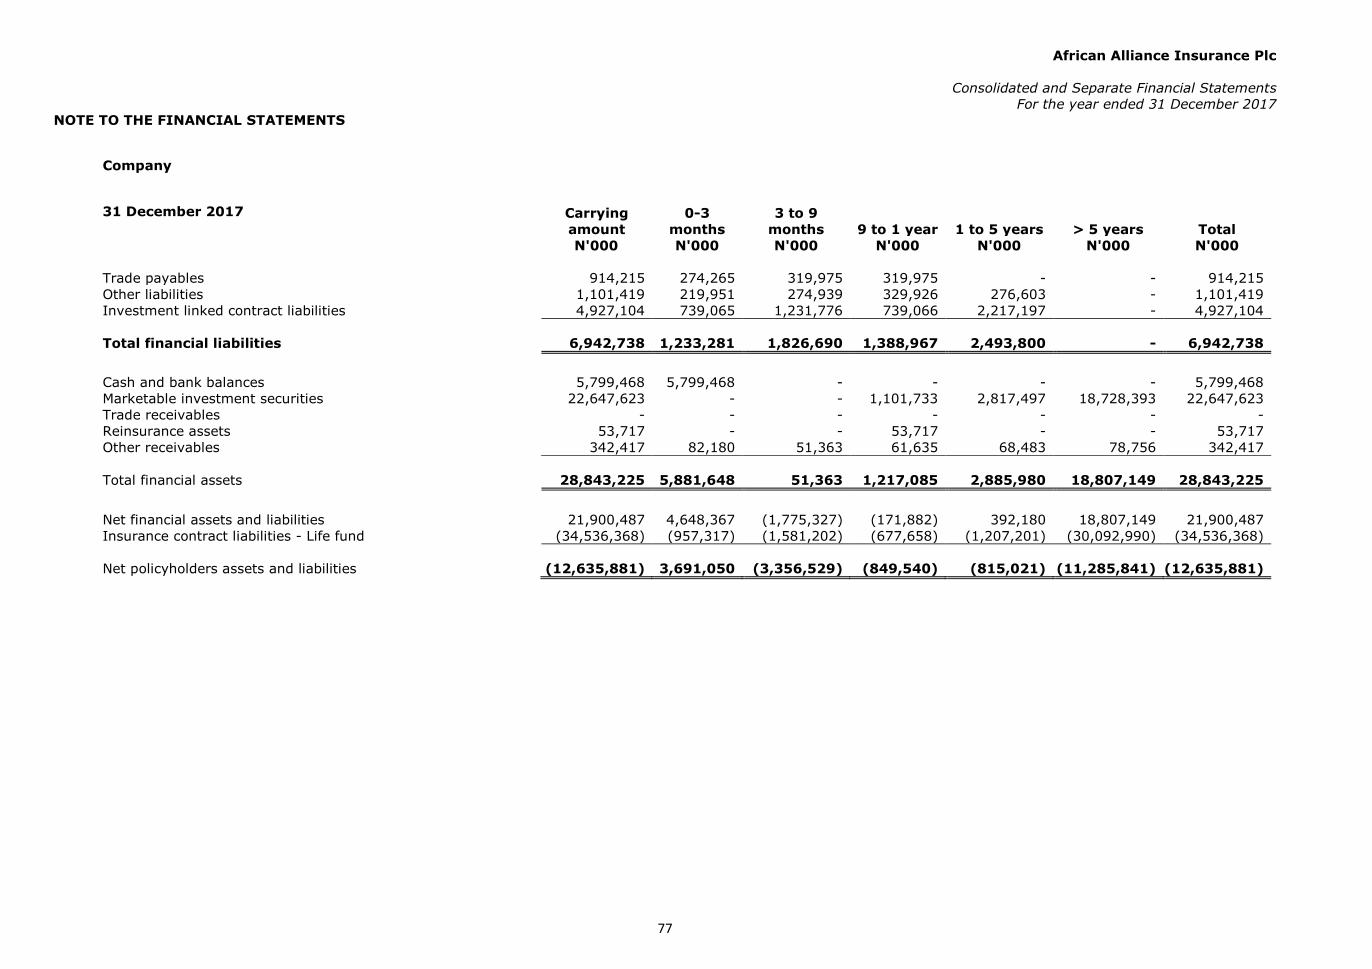
African Alliance Insurance Plc
Consolidated and Separate Financial Statements
For the year ended 31 December 2017
NOTE TO THE FINANCIAL STATEMENTS
77
Company
31 December 2017
Carrying
amount
0-3
months
3 to 9
months 9 to 1 year 1 to 5 years > 5 years Total N'000 N'000 N'000 N'000 N'000 N'000 N'000
Trade payables
914,215 274,265 319,975 319,975 - - 914,215
Other liabilities
1,101,419 219,951 274,939 329,926 276,603 - 1,101,419 Investment linked contract liabilities 4,927,104 739,065 1,231,776 739,066 2,217,197 - 4,927,104
Total financial liabilities
6,942,738 1,233,281 1,826,690 1,388,967 2,493,800 - 6,942,738
Cash and bank balances
5,799,468 5,799,468 - - - - 5,799,468
Marketable investment securities
22,647,623 - - 1,101,733 2,817,497 18,728,393 22,647,623 Trade receivables
- - - - - - -
Reinsurance assets
53,717 - - 53,717 - - 53,717 Other receivables
342,417 82,180 51,363 61,635 68,483 78,756 342,417
Total financial assets
28,843,225 5,881,648 51,363 1,217,085 2,885,980 18,807,149 28,843,225
Net financial assets and liabilities
21,900,487 4,648,367 (1,775,327) (171,882) 392,180 18,807,149 21,900,487
Insurance contract liabilities - Life fund (34,536,368) (957,317) (1,581,202) (677,658) (1,207,201) (30,092,990) (34,536,368)
Net policyholders assets and liabilities (12,635,881) 3,691,050 (3,356,529) (849,540) (815,021) (11,285,841) (12,635,881)
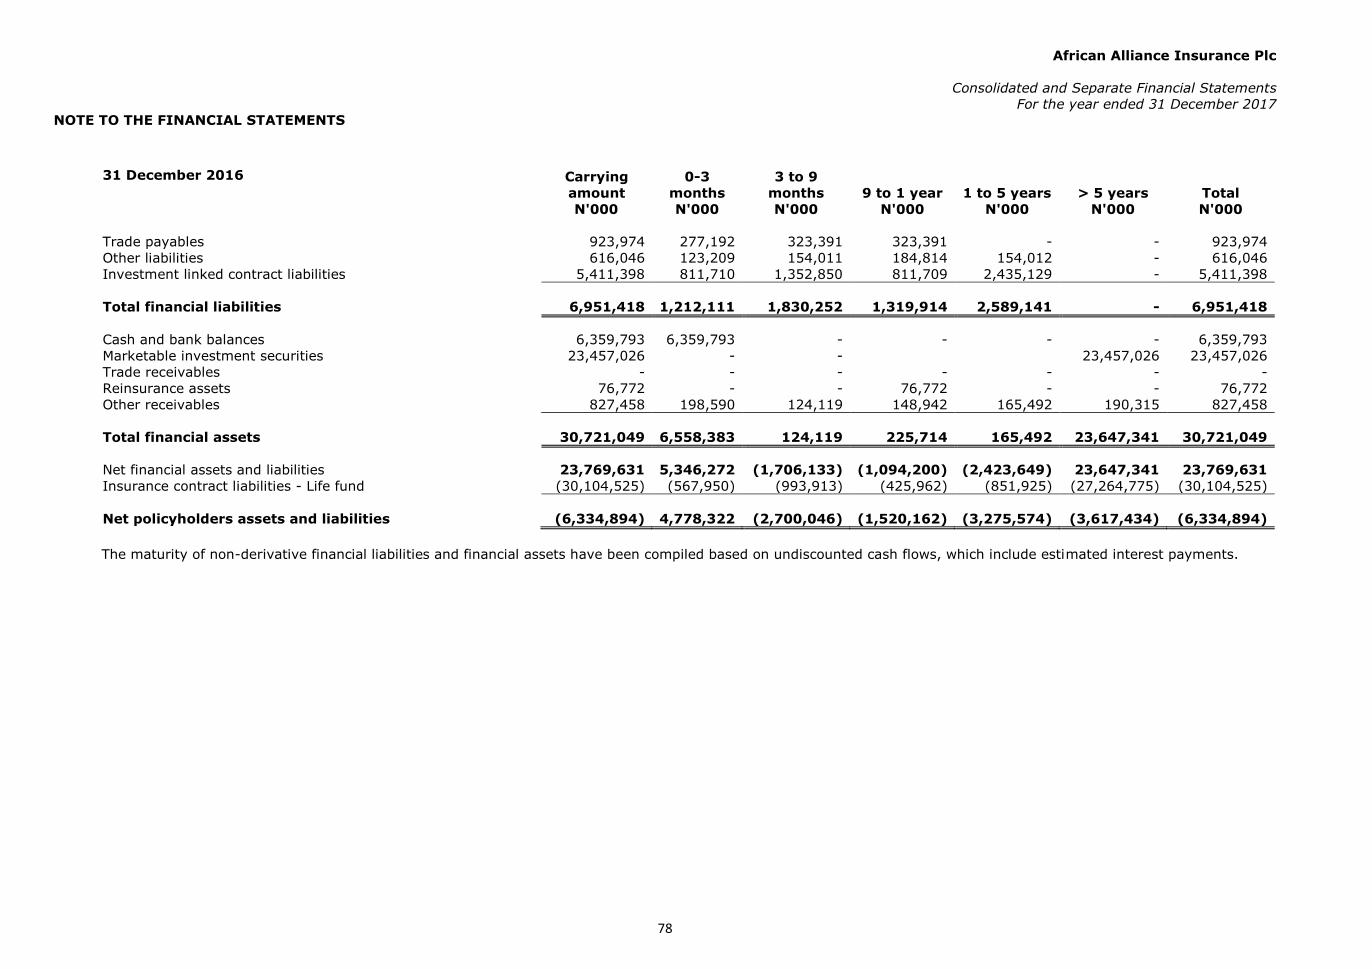
African Alliance Insurance Plc
Consolidated and Separate Financial Statements
For the year ended 31 December 2017
NOTE TO THE FINANCIAL STATEMENTS
78
31 December 2016
Carrying
amount
0-3
months
3 to 9
months 9 to 1 year 1 to 5 years > 5 years Total N'000 N'000 N'000 N'000 N'000 N'000 N'000
Trade payables
923,974 277,192 323,391 323,391 - - 923,974
Other liabilities
616,046 123,209 154,011 184,814 154,012 - 616,046 Investment linked contract liabilities 5,411,398 811,710 1,352,850 811,709 2,435,129 - 5,411,398
Total financial liabilities
6,951,418 1,212,111 1,830,252 1,319,914 2,589,141 - 6,951,418
Cash and bank balances
6,359,793 6,359,793 - - - - 6,359,793
Marketable investment securities
23,457,026 - -
23,457,026 23,457,026 Trade receivables
- - - - - - -
Reinsurance assets
76,772 - - 76,772 - - 76,772 Other receivables
827,458 198,590 124,119 148,942 165,492 190,315 827,458
Total financial assets
30,721,049 6,558,383 124,119 225,714 165,492 23,647,341 30,721,049
Net financial assets and liabilities
23,769,631 5,346,272 (1,706,133) (1,094,200) (2,423,649) 23,647,341 23,769,631
Insurance contract liabilities - Life fund (30,104,525) (567,950) (993,913) (425,962) (851,925) (27,264,775) (30,104,525)
Net policyholders assets and liabilities (6,334,894) 4,778,322 (2,700,046) (1,520,162) (3,275,574) (3,617,434) (6,334,894)
The maturity of non-derivative financial liabilities and financial assets have been compiled based on undiscounted cash flows, which include estimated interest payments.
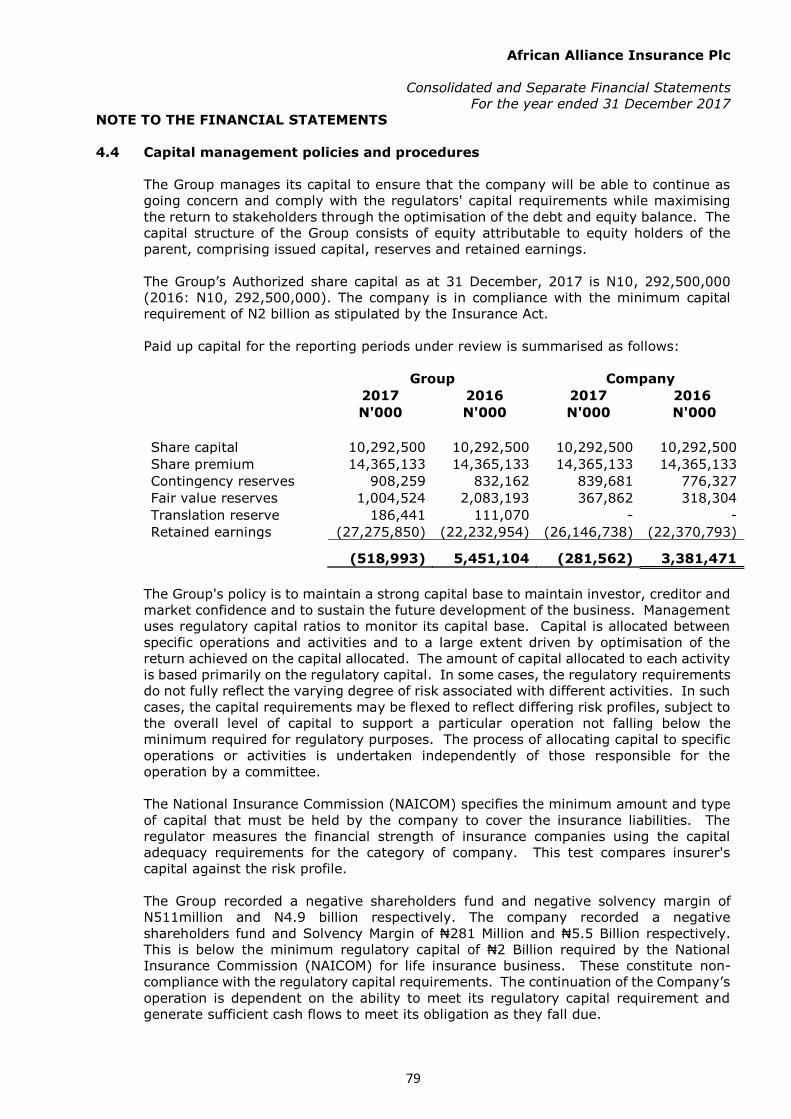
African Alliance Insurance Plc
Consolidated and Separate Financial Statements
For the year ended 31 December 2017
NOTE TO THE FINANCIAL STATEMENTS
79
4.4 Capital management policies and procedures
The Group manages its capital to ensure that the company will be able to continue as
going concern and comply with the regulators' capital requirements while maximising
the return to stakeholders through the optimisation of the debt and equity balance. The
capital structure of the Group consists of equity attributable to equity holders of the
parent, comprising issued capital, reserves and retained earnings.
The Group’s Authorized share capital as at 31 December, 2017 is N10, 292,500,000
(2016: N10, 292,500,000). The company is in compliance with the minimum capital
requirement of N2 billion as stipulated by the Insurance Act.
Paid up capital for the reporting periods under review is summarised as follows:
Group Company 2017 2016 2017 2016 N'000 N'000 N'000 N'000
Share capital 10,292,500 10,292,500 10,292,500 10,292,500 Share premium 14,365,133 14,365,133 14,365,133 14,365,133 Contingency reserves 908,259 832,162 839,681 776,327 Fair value reserves 1,004,524 2,083,193 367,862 318,304
Translation reserve 186,441 111,070 - - Retained earnings (27,275,850) (22,232,954) (26,146,738) (22,370,793)
(518,993) 5,451,104 (281,562) 3,381,471
The Group's policy is to maintain a strong capital base to maintain investor, creditor and
market confidence and to sustain the future development of the business. Management
uses regulatory capital ratios to monitor its capital base. Capital is allocated between
specific operations and activities and to a large extent driven by optimisation of the
return achieved on the capital allocated. The amount of capital allocated to each activity
is based primarily on the regulatory capital. In some cases, the regulatory requirements
do not fully reflect the varying degree of risk associated with different activities. In such
cases, the capital requirements may be flexed to reflect differing risk profiles, subject to
the overall level of capital to support a particular operation not falling below the
minimum required for regulatory purposes. The process of allocating capital to specific
operations or activities is undertaken independently of those responsible for the
operation by a committee.
The National Insurance Commission (NAICOM) specifies the minimum amount and type
of capital that must be held by the company to cover the insurance liabilities. The
regulator measures the financial strength of insurance companies using the capital
adequacy requirements for the category of company. This test compares insurer's
capital against the risk profile.
The Group recorded a negative shareholders fund and negative solvency margin of
N511million and N4.9 billion respectively. The company recorded a negative
shareholders fund and Solvency Margin of ₦281 Million and ₦5.5 Billion respectively.
This is below the minimum regulatory capital of ₦2 Billion required by the National
Insurance Commission (NAICOM) for life insurance business. These constitute non-
compliance with the regulatory capital requirements. The continuation of the Company’s
operation is dependent on the ability to meet its regulatory capital requirement and
generate sufficient cash flows to meet its obligation as they fall due.
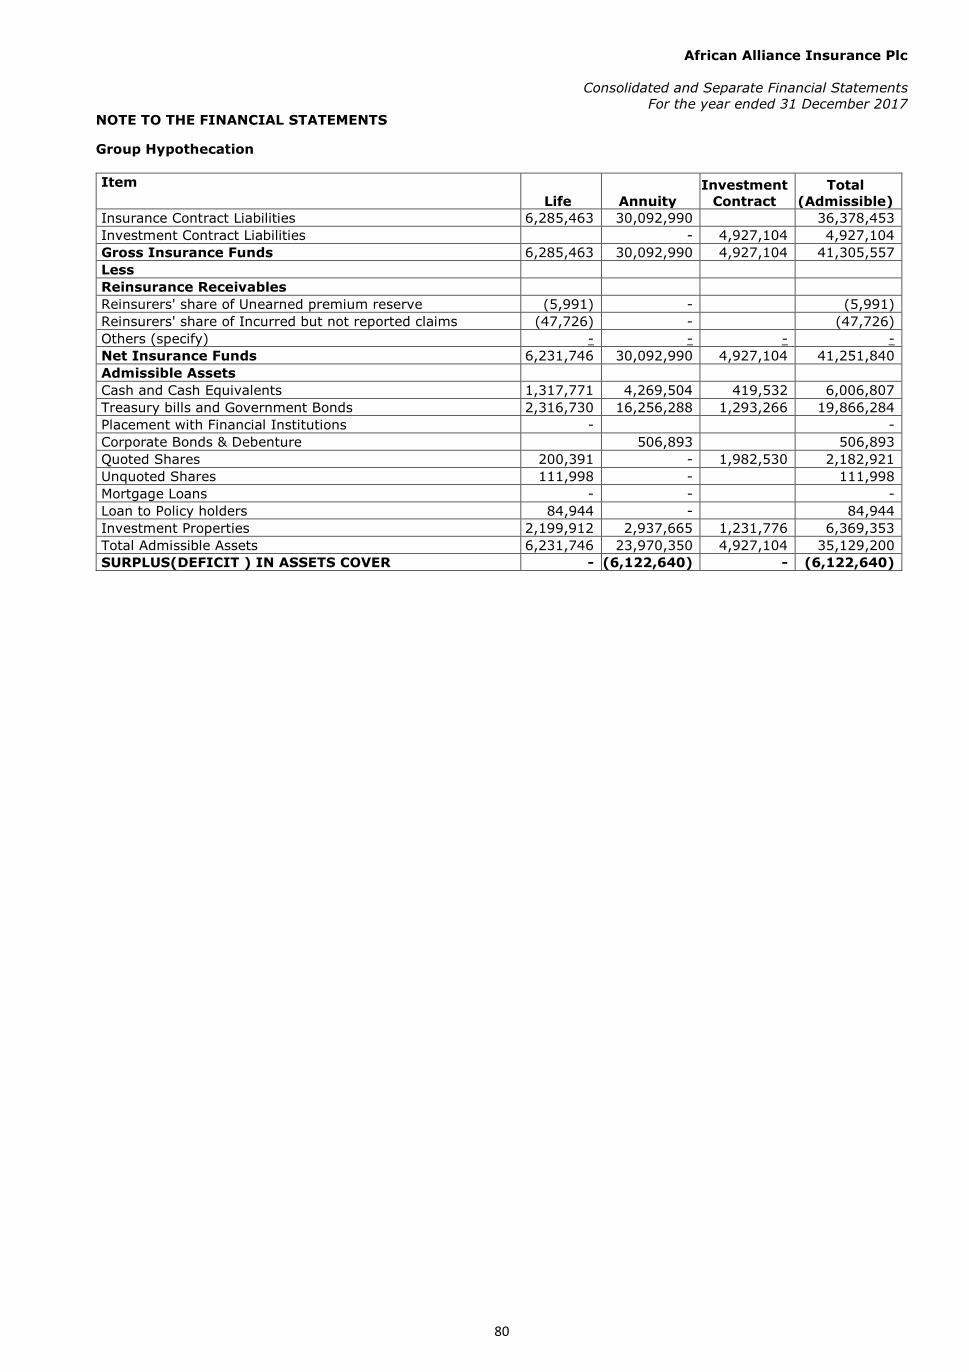
African Alliance Insurance Plc
Consolidated and Separate Financial Statements
For the year ended 31 December 2017
NOTE TO THE FINANCIAL STATEMENTS
80
Group Hypothecation
Item
Life Annuity
Investment
Contract
Total
(Admissible)
Insurance Contract Liabilities 6,285,463 30,092,990
36,378,453
Investment Contract Liabilities
- 4,927,104 4,927,104
Gross Insurance Funds 6,285,463 30,092,990 4,927,104 41,305,557
Less
Reinsurance Receivables
Reinsurers' share of Unearned premium reserve (5,991) -
(5,991)
Reinsurers' share of Incurred but not reported claims (47,726) -
(47,726)
Others (specify) - - - -
Net Insurance Funds 6,231,746 30,092,990 4,927,104 41,251,840
Admissible Assets
Cash and Cash Equivalents 1,317,771 4,269,504 419,532 6,006,807
Treasury bills and Government Bonds 2,316,730 16,256,288 1,293,266 19,866,284
Placement with Financial Institutions -
-
Corporate Bonds & Debenture
506,893
506,893
Quoted Shares 200,391 - 1,982,530 2,182,921
Unquoted Shares 111,998 -
111,998
Mortgage Loans - -
-
Loan to Policy holders 84,944 -
84,944
Investment Properties 2,199,912 2,937,665 1,231,776 6,369,353
Total Admissible Assets 6,231,746 23,970,350 4,927,104 35,129,200
SURPLUS(DEFICIT ) IN ASSETS COVER - (6,122,640) - (6,122,640)
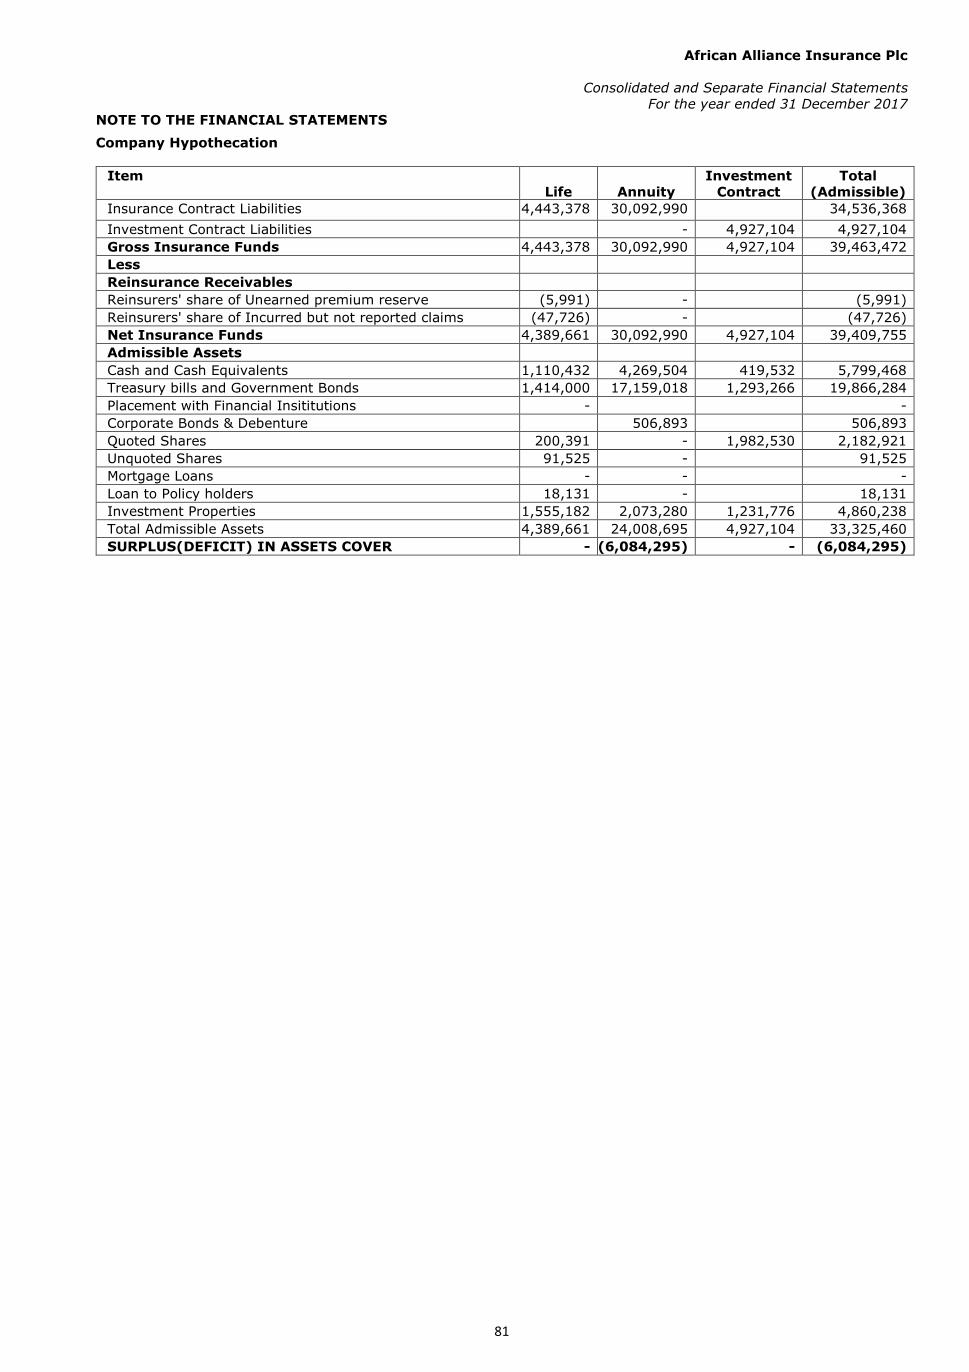
African Alliance Insurance Plc
Consolidated and Separate Financial Statements
For the year ended 31 December 2017
NOTE TO THE FINANCIAL STATEMENTS
81
Company Hypothecation
Item
Life Annuity
Investment
Contract
Total
(Admissible)
Insurance Contract Liabilities 4,443,378 30,092,990
34,536,368
Investment Contract Liabilities
- 4,927,104 4,927,104
Gross Insurance Funds 4,443,378 30,092,990 4,927,104 39,463,472
Less
Reinsurance Receivables
Reinsurers' share of Unearned premium reserve (5,991) -
(5,991)
Reinsurers' share of Incurred but not reported claims (47,726) -
(47,726)
Net Insurance Funds 4,389,661 30,092,990 4,927,104 39,409,755
Admissible Assets
Cash and Cash Equivalents 1,110,432 4,269,504 419,532 5,799,468
Treasury bills and Government Bonds 1,414,000 17,159,018 1,293,266 19,866,284
Placement with Financial Insititutions -
-
Corporate Bonds & Debenture
506,893
506,893
Quoted Shares 200,391 - 1,982,530 2,182,921
Unquoted Shares 91,525 -
91,525
Mortgage Loans - -
-
Loan to Policy holders 18,131 -
18,131
Investment Properties 1,555,182 2,073,280 1,231,776 4,860,238
Total Admissible Assets 4,389,661 24,008,695 4,927,104 33,325,460
SURPLUS(DEFICIT) IN ASSETS COVER - (6,084,295) - (6,084,295)
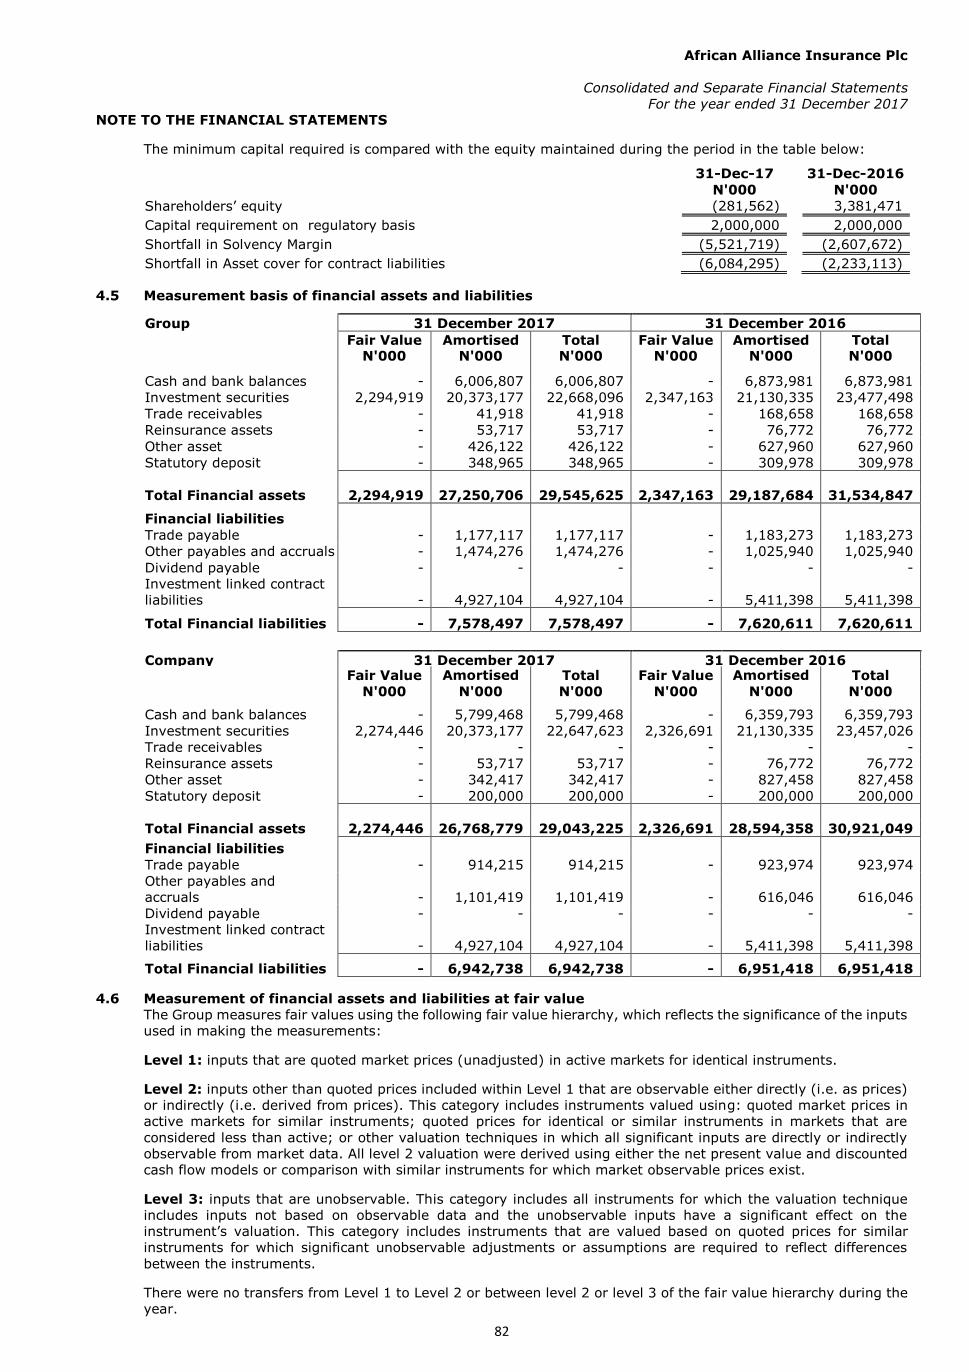
African Alliance Insurance Plc
Consolidated and Separate Financial Statements
For the year ended 31 December 2017
NOTE TO THE FINANCIAL STATEMENTS
82
The minimum capital required is compared with the equity maintained during the period in the table below:
31-Dec-17 31-Dec-2016
N'000 N'000
Shareholders’ equity (281,562) 3,381,471
Capital requirement on regulatory basis 2,000,000 2,000,000
Shortfall in Solvency Margin (5,521,719) (2,607,672)
Shortfall in Asset cover for contract liabilities (6,084,295) (2,233,113)
4.5 Measurement basis of financial assets and liabilities
Group
31 December 2017 31 December 2016 Fair Value Amortised
Cost
Total Fair Value Amortised
Cost
Total N'000 N'000 N'000 N'000 N'000 N'000
Cash and bank balances - 6,006,807 6,006,807 - 6,873,981 6,873,981 Investment securities 2,294,919 20,373,177 22,668,096 2,347,163 21,130,335 23,477,498 Trade receivables - 41,918 41,918 - 168,658 168,658 Reinsurance assets - 53,717 53,717 - 76,772 76,772 Other asset - 426,122 426,122 - 627,960 627,960 Statutory deposit - 348,965 348,965 - 309,978 309,978 Total Financial assets 2,294,919 27,250,706 29,545,625 2,347,163 29,187,684 31,534,847 Financial liabilities Trade payable - 1,177,117 1,177,117 - 1,183,273 1,183,273 Other payables and accruals - 1,474,276 1,474,276 - 1,025,940 1,025,940 Dividend payable - - - - - - Investment linked contract
liabilities - 4,927,104 4,927,104 - 5,411,398 5,411,398 Total Financial liabilities - 7,578,497 7,578,497 - 7,620,611 7,620,611
Company
31 December 2017 31 December 2016
Fair Value Amortised
Cost
Total Fair Value Amortised
Cost
Total N'000 N'000 N'000 N'000 N'000 N'000
Cash and bank balances - 5,799,468 5,799,468 - 6,359,793 6,359,793 Investment securities 2,274,446 20,373,177 22,647,623 2,326,691 21,130,335 23,457,026 Trade receivables - - - - - - Reinsurance assets - 53,717 53,717 - 76,772 76,772 Other asset - 342,417 342,417 - 827,458 827,458 Statutory deposit - 200,000 200,000 - 200,000 200,000 Total Financial assets 2,274,446 26,768,779 29,043,225 2,326,691 28,594,358 30,921,049 Financial liabilities Trade payable - 914,215 914,215 - 923,974 923,974 Other payables and
accruals - 1,101,419 1,101,419 - 616,046 616,046 Dividend payable - - - - - - Investment linked contract
liabilities - 4,927,104 4,927,104 - 5,411,398 5,411,398 Total Financial liabilities - 6,942,738 6,942,738 - 6,951,418 6,951,418
4.6 Measurement of financial assets and liabilities at fair value
The Group measures fair values using the following fair value hierarchy, which reflects the significance of the inputs
used in making the measurements:
Level 1: inputs that are quoted market prices (unadjusted) in active markets for identical instruments.
Level 2: inputs other than quoted prices included within Level 1 that are observable either directly (i.e. as prices)
or indirectly (i.e. derived from prices). This category includes instruments valued using: quoted market prices in
active markets for similar instruments; quoted prices for identical or similar instruments in markets that are
considered less than active; or other valuation techniques in which all significant inputs are directly or indirectly
observable from market data. All level 2 valuation were derived using either the net present value and discounted
cash flow models or comparison with similar instruments for which market observable prices exist.
Level 3: inputs that are unobservable. This category includes all instruments for which the valuation technique
includes inputs not based on observable data and the unobservable inputs have a significant effect on the
instrument’s valuation. This category includes instruments that are valued based on quoted prices for similar
instruments for which significant unobservable adjustments or assumptions are required to reflect differences
between the instruments.
There were no transfers from Level 1 to Level 2 or between level 2 or level 3 of the fair value hierarchy during the
year.
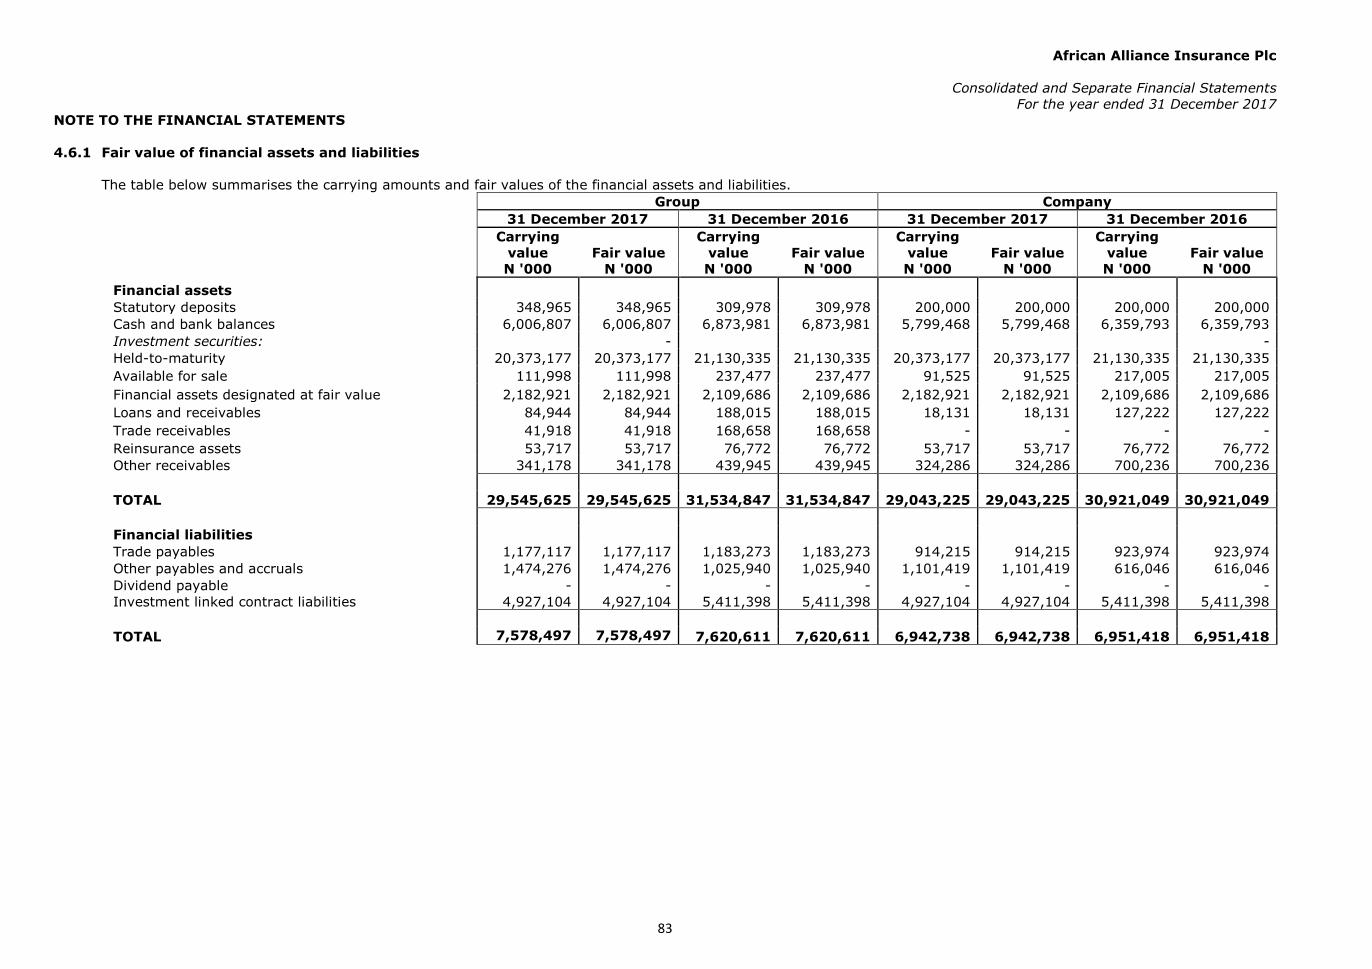
African Alliance Insurance Plc
Consolidated and Separate Financial Statements
For the year ended 31 December 2017
NOTE TO THE FINANCIAL STATEMENTS
83
4.6.1 Fair value of financial assets and liabilities
The table below summarises the carrying amounts and fair values of the financial assets and liabilities. Group Company
31 December 2017 31 December 2016 31 December 2017 31 December 2016 Carrying
value Fair value
Carrying
value Fair value
Carrying
value Fair value
Carrying
value Fair value N '000 N '000 N '000 N '000 N '000 N '000 N '000 N '000
Financial assets
Statutory deposits
348,965 348,965 309,978 309,978 200,000 200,000 200,000 200,000
Cash and bank balances 6,006,807 6,006,807 6,873,981 6,873,981 5,799,468 5,799,468 6,359,793 6,359,793 Investment securities: - - Held-to-maturity
20,373,177 20,373,177 21,130,335 21,130,335 20,373,177 20,373,177 21,130,335 21,130,335
Available for sale
111,998 111,998 237,477 237,477 91,525 91,525 217,005 217,005 Financial assets designated at fair value 2,182,921 2,182,921 2,109,686 2,109,686 2,182,921 2,182,921 2,109,686 2,109,686 Loans and receivables
84,944 84,944 188,015 188,015 18,131 18,131 127,222 127,222
Trade receivables
41,918 41,918 168,658 168,658 - - - - Reinsurance assets
53,717 53,717 76,772 76,772 53,717 53,717 76,772 76,772
Other receivables
341,178 341,178 439,945 439,945 324,286 324,286 700,236 700,236
TOTAL
29,545,625 29,545,625 31,534,847 31,534,847 29,043,225 29,043,225 30,921,049 30,921,049
Financial liabilities
Trade payables
1,177,117 1,177,117 1,183,273 1,183,273 914,215 914,215 923,974 923,974
Other payables and accruals
1,474,276 1,474,276 1,025,940 1,025,940 1,101,419 1,101,419 616,046 616,046 Dividend payable
- - - - - - - -
Investment linked contract liabilities 4,927,104 4,927,104 5,411,398 5,411,398 4,927,104 4,927,104 5,411,398 5,411,398
TOTAL
7,578,497 7,578,497 7,620,611 7,620,611 6,942,738 6,942,738 6,951,418 6,951,418
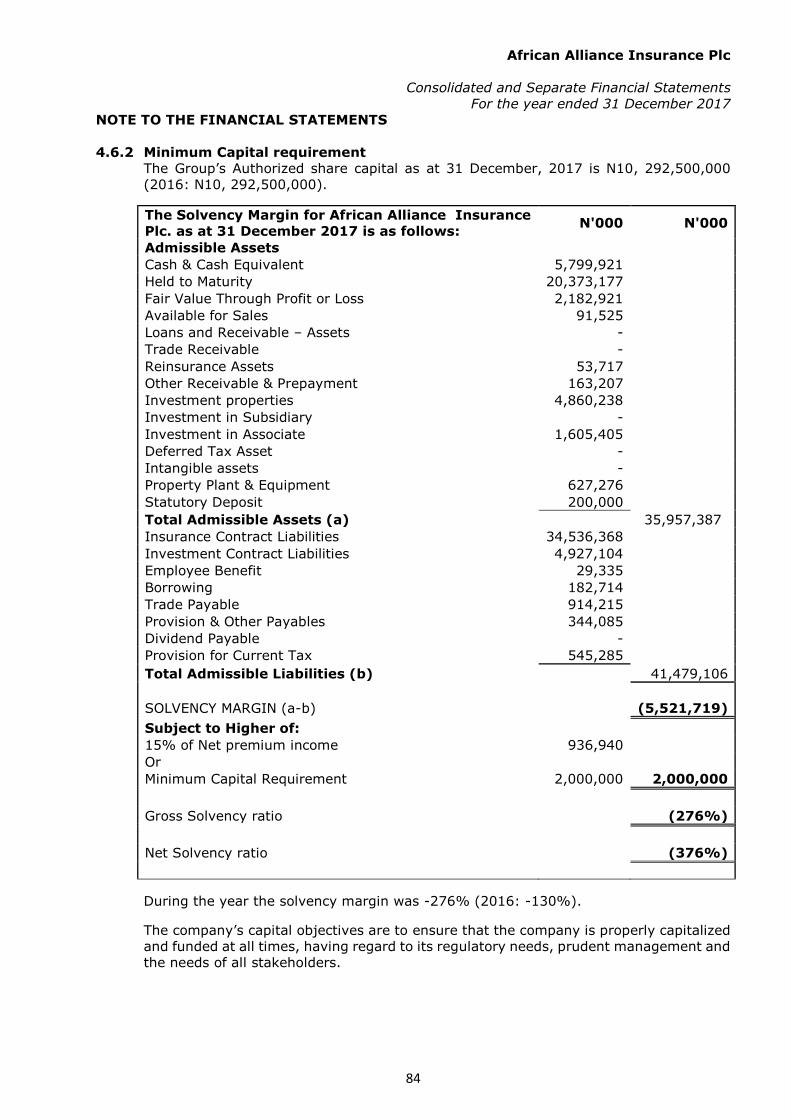
African Alliance Insurance Plc
Consolidated and Separate Financial Statements
For the year ended 31 December 2017
NOTE TO THE FINANCIAL STATEMENTS
84
4.6.2 Minimum Capital requirement
The Group’s Authorized share capital as at 31 December, 2017 is N10, 292,500,000
(2016: N10, 292,500,000).
The Solvency Margin for African Alliance Insurance
Plc. as at 31 December 2017 is as follows: N'000 N'000
Admissible Assets
Cash & Cash Equivalent 5,799,921
Held to Maturity 20,373,177
Fair Value Through Profit or Loss 2,182,921
Available for Sales 91,525
Loans and Receivable – Assets -
Trade Receivable -
Reinsurance Assets 53,717
Other Receivable & Prepayment 163,207
Investment properties 4,860,238
Investment in Subsidiary -
Investment in Associate 1,605,405
Deferred Tax Asset -
Intangible assets -
Property Plant & Equipment 627,276
Statutory Deposit 200,000
Total Admissible Assets (a) 35,957,387
Insurance Contract Liabilities 34,536,368
Investment Contract Liabilities 4,927,104
Employee Benefit 29,335
Borrowing 182,714
Trade Payable 914,215
Provision & Other Payables 344,085
Dividend Payable -
Provision for Current Tax 545,285
Total Admissible Liabilities (b) 41,479,106
SOLVENCY MARGIN (a-b) (5,521,719)
Subject to Higher of:
15% of Net premium income 936,940
Or
Minimum Capital Requirement 2,000,000 2,000,000
Gross Solvency ratio (276%)
Net Solvency ratio (376%)
During the year the solvency margin was -276% (2016: -130%).
The company’s capital objectives are to ensure that the company is properly capitalized
and funded at all times, having regard to its regulatory needs, prudent management and
the needs of all stakeholders.
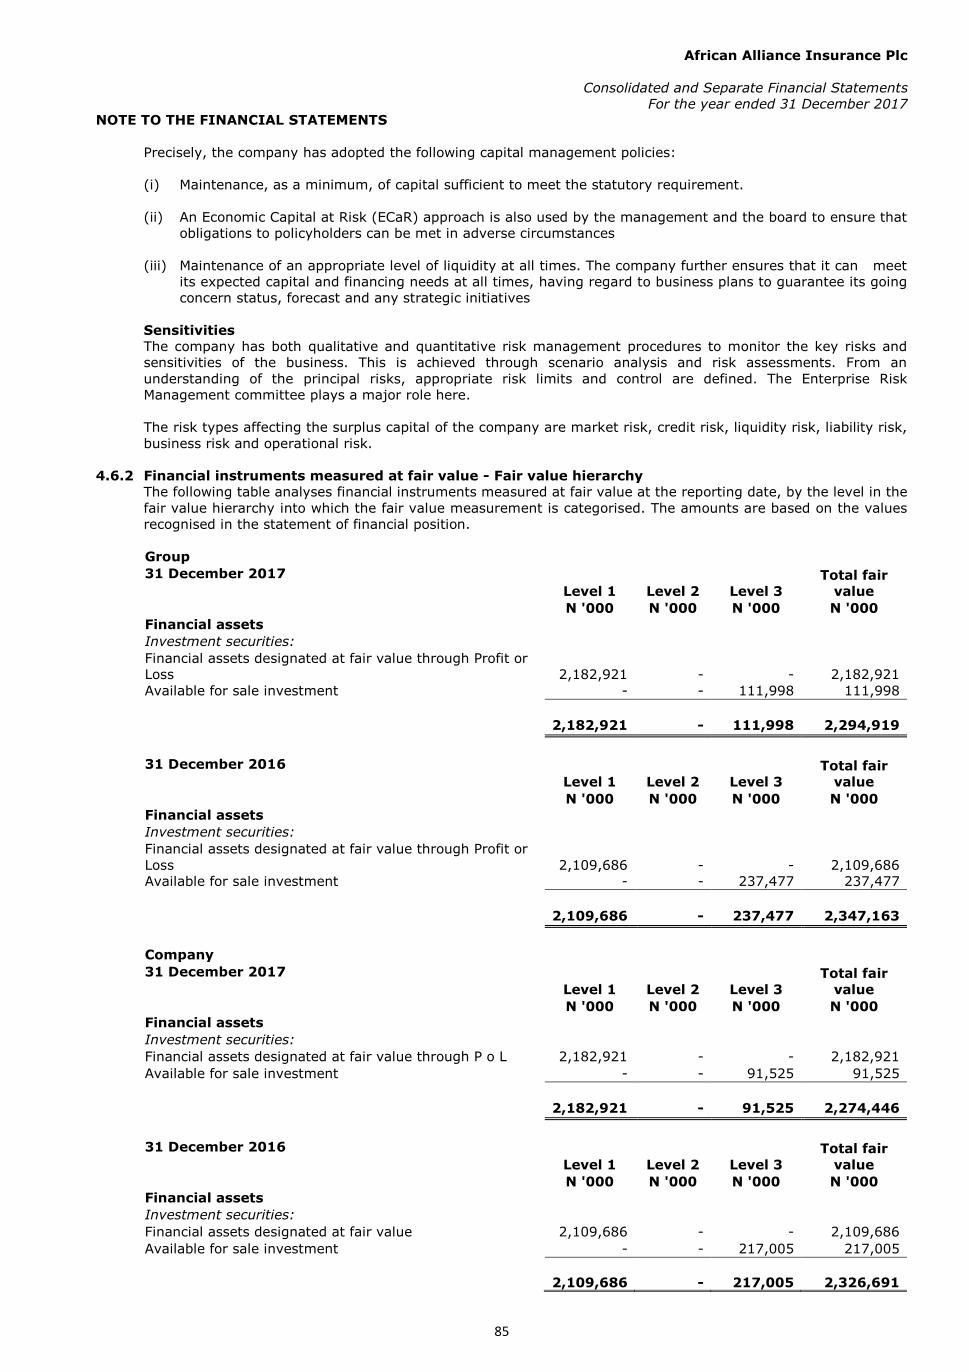
African Alliance Insurance Plc
Consolidated and Separate Financial Statements
For the year ended 31 December 2017
NOTE TO THE FINANCIAL STATEMENTS
85
Precisely, the company has adopted the following capital management policies:
(i) Maintenance, as a minimum, of capital sufficient to meet the statutory requirement.
(ii) An Economic Capital at Risk (ECaR) approach is also used by the management and the board to ensure that
obligations to policyholders can be met in adverse circumstances
(iii) Maintenance of an appropriate level of liquidity at all times. The company further ensures that it can meet
its expected capital and financing needs at all times, having regard to business plans to guarantee its going
concern status, forecast and any strategic initiatives
Sensitivities
The company has both qualitative and quantitative risk management procedures to monitor the key risks and
sensitivities of the business. This is achieved through scenario analysis and risk assessments. From an
understanding of the principal risks, appropriate risk limits and control are defined. The Enterprise Risk
Management committee plays a major role here.
The risk types affecting the surplus capital of the company are market risk, credit risk, liquidity risk, liability risk,
business risk and operational risk.
4.6.2 Financial instruments measured at fair value - Fair value hierarchy
The following table analyses financial instruments measured at fair value at the reporting date, by the level in the
fair value hierarchy into which the fair value measurement is categorised. The amounts are based on the values
recognised in the statement of financial position.
Group
31 December 2017
Level 1 Level 2 Level 3
Total fair
value
N '000 N '000 N '000 N '000 Financial assets
Investment securities:
Financial assets designated at fair value through Profit or
Loss
2,182,921
-
-
2,182,921 Available for sale investment
- - 111,998 111,998
2,182,921 - 111,998 2,294,919
31 December 2016
Level 1 Level 2 Level 3
Total fair
value
N '000 N '000 N '000 N '000 Financial assets
Investment securities:
Financial assets designated at fair value through Profit or
Loss
2,109,686
-
-
2,109,686 Available for sale investment
- - 237,477 237,477
2,109,686 - 237,477 2,347,163
Company
31 December 2017
Level 1 Level 2 Level 3
Total fair
value
N '000 N '000 N '000 N '000 Financial assets
Investment securities:
Financial assets designated at fair value through P o L 2,182,921 - - 2,182,921 Available for sale investment
- - 91,525 91,525
2,182,921 - 91,525 2,274,446
31 December 2016
Level 1 Level 2 Level 3
Total fair
value
N '000 N '000 N '000 N '000 Financial assets
Investment securities:
Financial assets designated at fair value 2,109,686 - - 2,109,686 Available for sale investment
- - 217,005 217,005
2,109,686
-
217,005
2,326,691
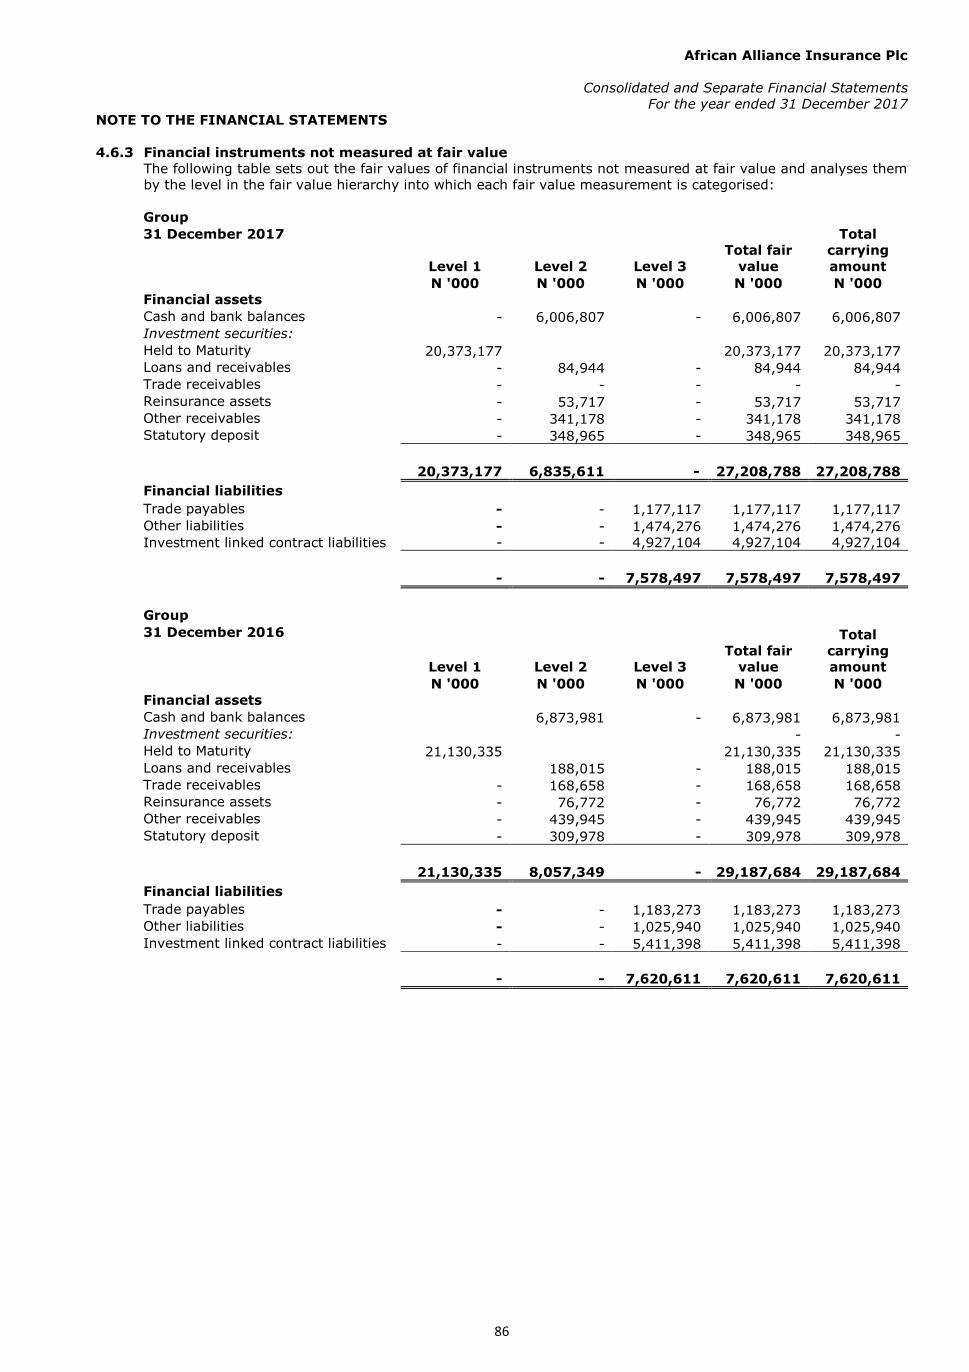
African Alliance Insurance Plc
Consolidated and Separate Financial Statements
For the year ended 31 December 2017
NOTE TO THE FINANCIAL STATEMENTS
86
4.6.3 Financial instruments not measured at fair value
The following table sets out the fair values of financial instruments not measured at fair value and analyses them
by the level in the fair value hierarchy into which each fair value measurement is categorised:
Group
31 December 2017
Level 1 Level 2 Level 3
Total fair
value
Total
carrying
amount N '000 N '000 N '000 N '000 N '000
Financial assets
Cash and bank balances - 6,006,807 - 6,006,807 6,006,807 Investment securities: Held to Maturity
20,373,177 20,373,177 20,373,177
Loans and receivables
- 84,944 - 84,944 84,944 Trade receivables
- - - - -
Reinsurance assets
- 53,717 - 53,717 53,717 Other receivables
- 341,178 - 341,178 341,178
Statutory deposit
- 348,965 - 348,965 348,965
20,373,177 6,835,611 - 27,208,788 27,208,788
Financial liabilities
Trade payables
- - 1,177,117 1,177,117 1,177,117
Other liabilities
- - 1,474,276 1,474,276 1,474,276 Investment linked contract liabilities - - 4,927,104 4,927,104 4,927,104
- - 7,578,497 7,578,497 7,578,497
Group
31 December 2016
Level 1 Level 2 Level 3
Total fair
value
Total
carrying
amount N '000 N '000 N '000 N '000 N '000
Financial assets
Cash and bank balances 6,873,981 - 6,873,981 6,873,981 Investment securities:
- - Held to Maturity
21,130,335 21,130,335 21,130,335
Loans and receivables
188,015 - 188,015 188,015 Trade receivables
- 168,658 - 168,658 168,658
Reinsurance assets
- 76,772 - 76,772 76,772 Other receivables
- 439,945 - 439,945 439,945
Statutory deposit
- 309,978 - 309,978 309,978
21,130,335 8,057,349 - 29,187,684 29,187,684
Financial liabilities
Trade payables
- - 1,183,273 1,183,273 1,183,273
Other liabilities
- - 1,025,940 1,025,940 1,025,940 Investment linked contract liabilities - - 5,411,398 5,411,398 5,411,398
- - 7,620,611 7,620,611 7,620,611
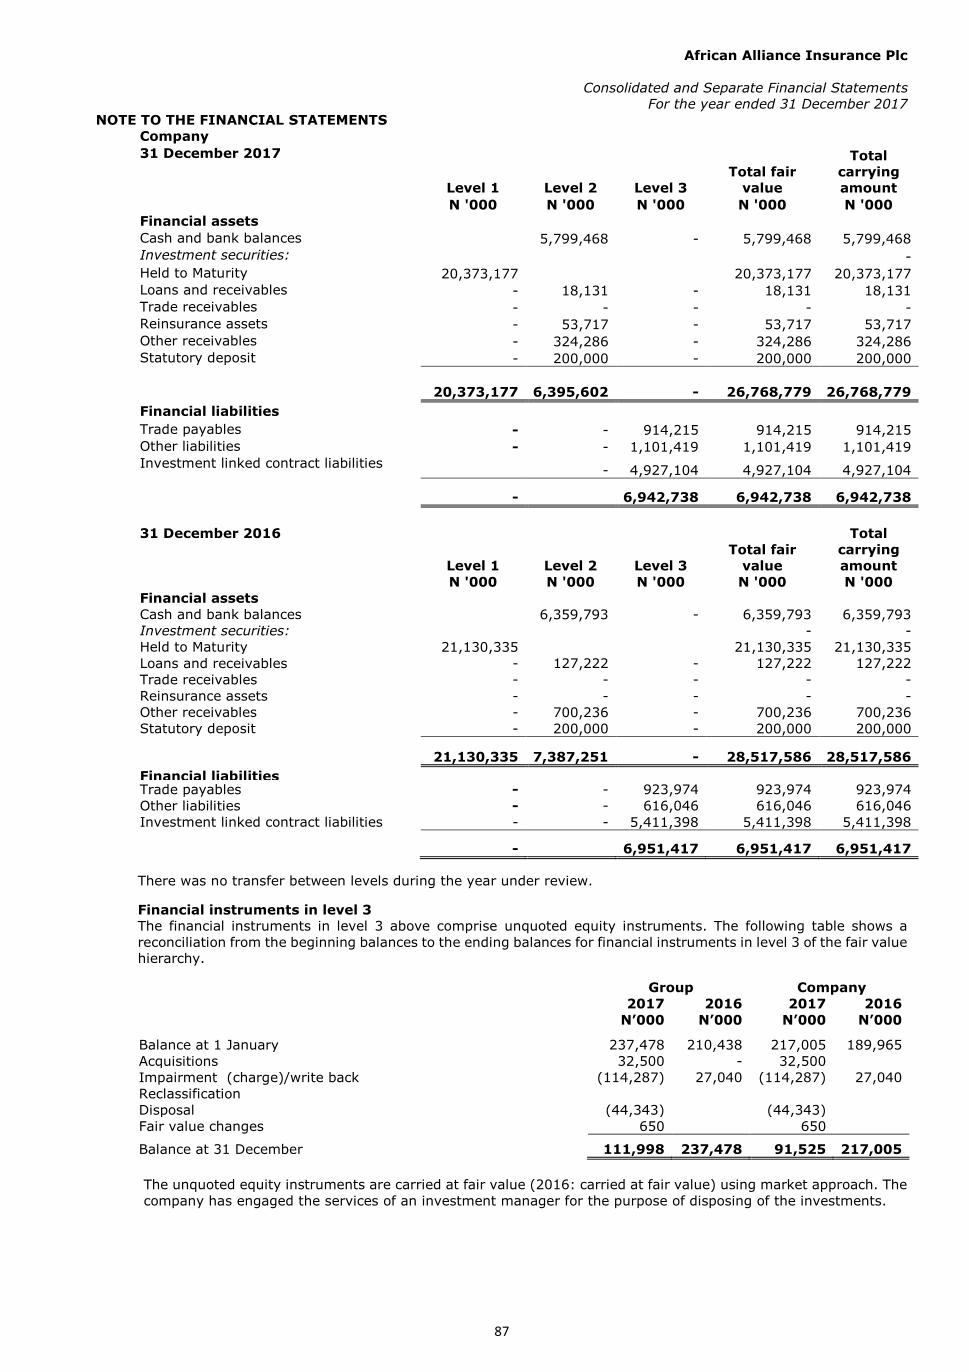
African Alliance Insurance Plc
Consolidated and Separate Financial Statements
For the year ended 31 December 2017
NOTE TO THE FINANCIAL STATEMENTS
87
Company
31 December 2017
Level 1 Level 2 Level 3
Total fair
value
Total
carrying
amount N '000 N '000 N '000 N '000 N '000
Financial assets
Cash and bank balances 5,799,468 - 5,799,468 5,799,468 Investment securities:
- Held to Maturity
20,373,177 20,373,177 20,373,177
Loans and receivables
- 18,131 - 18,131 18,131 Trade receivables
- - - - -
Reinsurance assets
- 53,717 - 53,717 53,717 Other receivables
- 324,286 - 324,286 324,286
Statutory deposit
- 200,000 - 200,000 200,000
20,373,177 6,395,602 - 26,768,779 26,768,779 Financial liabilities
Trade payables
- - 914,215 914,215 914,215
Other liabilities
- - 1,101,419 1,101,419 1,101,419
Investment linked contract liabilities - 4,927,104 4,927,104 4,927,104
- 6,942,738 6,942,738 6,942,738
31 December 2016
Level 1 Level 2 Level 3
Total fair
value
Total
carrying
amount N '000 N '000 N '000 N '000 N '000
Financial assets
Cash and bank balances 6,359,793 - 6,359,793 6,359,793 Investment securities:
- - Held to Maturity
21,130,335 21,130,335 21,130,335
Loans and receivables
- 127,222 - 127,222 127,222 Trade receivables
- - - - -
Reinsurance assets
- - - - - Other receivables
- 700,236 - 700,236 700,236
Statutory deposit
- 200,000 - 200,000 200,000
21,130,335 7,387,251 - 28,517,586 28,517,586 Financial liabilities
Trade payables
- - 923,974 923,974 923,974 Other liabilities
- - 616,046 616,046 616,046
Investment linked contract liabilities - - 5,411,398 5,411,398 5,411,398
- 6,951,417 6,951,417 6,951,417
There was no transfer between levels during the year under review.
Financial instruments in level 3
The financial instruments in level 3 above comprise unquoted equity instruments. The following table shows a
reconciliation from the beginning balances to the ending balances for financial instruments in level 3 of the fair value
hierarchy.
Group Company 2017 2016 2017 2016
N’000 N’000 N’000 N’000
Balance at 1 January
237,478 210,438 217,005 189,965
Acquisitions
32,500 - 32,500
Impairment (charge)/write back
(114,287) 27,040 (114,287) 27,040 Reclassification
Disposal
(44,343) (44,343)
Fair value changes
650 650
Balance at 31 December
111,998 237,478 91,525 217,005
The unquoted equity instruments are carried at fair value (2016: carried at fair value) using market approach. The
company has engaged the services of an investment manager for the purpose of disposing of the investments.
African Alliance Insurance Plc
Consolidated and Separate Financial Statements
For the year ended 31 December 2017
NOTE TO THE FINANCIAL STATEMENTS
88
4.6.4 Fair valuation methods and assumptions
i. Cash & cash equivalent
This represents cash held in various bank accounts at the end of the period. The
fair value of this amount is the carrying amount.
ii. Held to maturity
The held to maturity financial assets are based on market prices, or broker/dealer
price quotations. Where this information is not available, fair value is estimated
using quoted market prices for securities with similar credit, maturity and yield
characteristics.
iii. Loans and receivables
For loans and receivables exceeding 12 months, the estimated fair values of the
loans and receivables are the discounted amount of the estimated future cash
flows expected to be received. Expected cash flows are discounted at current
market rates to determine fair value. For loans and receivables with maturity
period of below 12 months, no discounting was applied.
iv. Other receivables
Other assets represent amount due from reinsurers and other related parties have
a short recycle period and as such the fair values of these balances approximate
their carrying amount.
v. Statutory deposit
This represents the deposit held by Central bank of Nigeria. i.e. 10% of the
minimum capitalisation in compliance with the section 9(1) and section 10(3) of
insurance Act 2003. The fair value of this balance is approximately its carrying
amount.
vi. Trade payables
These represent amount payable to reinsurers and other creditors have a short
recycle period and as such the fair values of these balances approximate their
carrying amount.
vii. Other liabilities
These are amounts outstanding and are payable within a period of one year.
Amount outstanding are assumed to approximate their respective fair values.
viii. Insurance contract liabilities
These are amounts payable to policyholders in the event of a claim. The carrying
amount have been calculated by the actuary and the carrying amount represents
the fair value as at 31 December, 2017.
5 Critical accounting estimates and judgements
When preparing the financial statements management undertakes a number of
judgements, estimates and assumptions about recognition and measurement of assets,
liabilities, income and expenses. The actual results are likely to differ from the
judgements, estimates and assumptions made by management, and will seldom equal
the estimated results. Information about the significant judgements, estimates and
assumptions that have the most significant effect on the recognition and measurement
of assets, liabilities, income and expenses are discussed below.

African Alliance Insurance Plc
Consolidated and Separate Financial Statements
For the year ended 31 December 2017
NOTE TO THE FINANCIAL STATEMENTS
89
5.1 The ultimate liability arising from claims made under insurance contracts
The estimation of the ultimate liability arising from claims made under insurance
contracts is the Group’s most critical accounting estimate. There are several sources of
uncertainty that need to be considered in the estimate of the liability that the Group will
ultimately pay for such claims.
5.2 Sources of uncertainty in the estimation of future claim payments
Claims on contracts are payable on a claims-occurrence basis. The Group is liable for all
insured events that occurred during the term of the contract, even if the loss is
discovered after the end of the contract term. As a result, liability claims are settled over
a long period of time, and a larger element of the claims provision relates to incurred
but not reported claims (IBNR).
Uncertainty in the estimation of future benefits payments and premium receipts for
insurance contracts arises from the unpredictability of long-term changes in variables
such as the overall levels of mortality, accident level and the variability in policyholder
behaviour.
The insurance liabilities have been made on the following principles:-
Type of Business Valuation Method
Individual Risk Business Gross premium
Individual Deposit Based business Deposit reserve: Account balance at val. Date
Risk reserve: Gross premium
Group Life UPR + IBNR
Group Deposit Administration Deposit reserve: Account balance at val. Date (
5.2.1 Individual business
A gross premium method is adopted for individual traditional risk business. This is a
monthly cash flow approach taking into account the incidence of all expected future cash
flows including office premiums, expenses and benefit payments, satisfying the Liability
Adequacy Test. This implies that no further testing is required as a result of the
implementation of the IFRS; or in other words the liability adequacy test has been met
implicitly and a separate liability calculation will not be required for accounting purposes.
Negative reserves will be zeroised at the valuation date.
5.2.2 Individual Deposit Based business
A reserve for the Individual and group deposit-based business (Deposit Plus Plan) will
be maintained being the amount standing to the credit of the policyholders (account
balance) at the valuation date.
Reserves for the supplementary life cover and expenses for individual deposit based
business will be calculated using a gross premium cash flow approach as described in
above. This is the present value of future guaranteed risk related benefit costs and
expenses, less future risk premiums
5.2.3 Group life
Reserves for Group Life business will comprise an unexpired premium reserve (UPR) and
where necessary, a reserve for Incurred But Not Reported Claims (IBNR) to make an
allowance for the delay in reporting of claims.
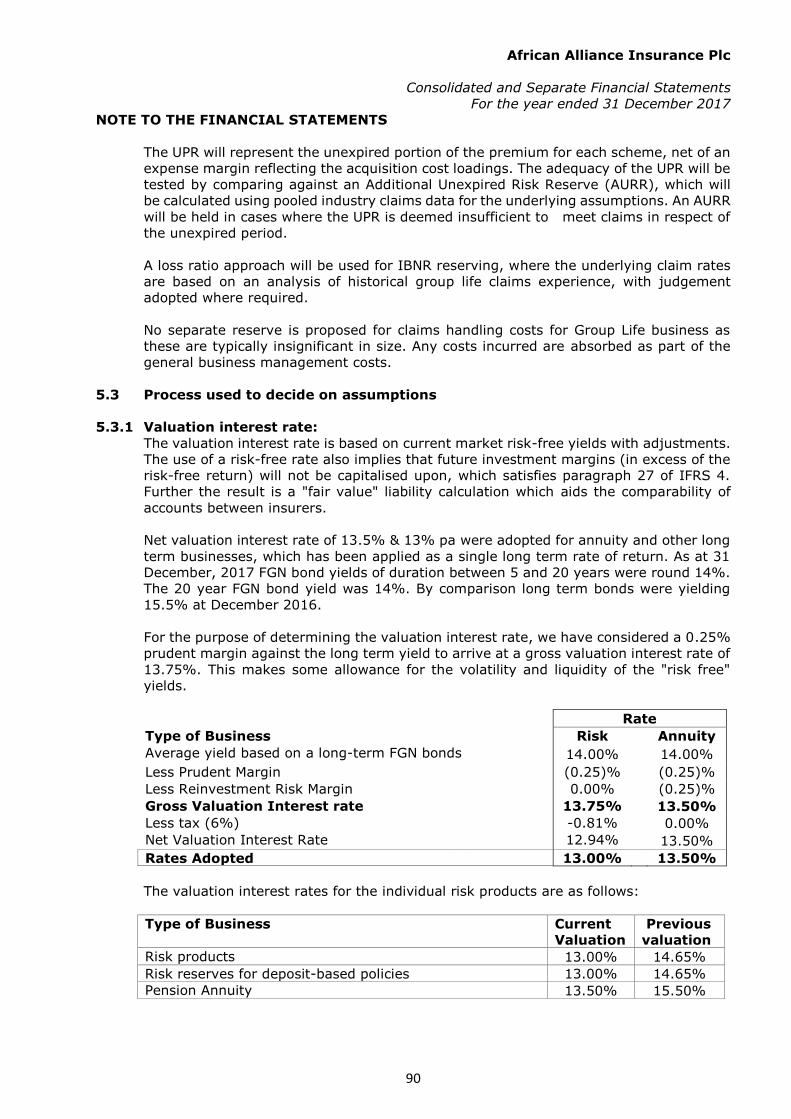
African Alliance Insurance Plc
Consolidated and Separate Financial Statements
For the year ended 31 December 2017
NOTE TO THE FINANCIAL STATEMENTS
90
The UPR will represent the unexpired portion of the premium for each scheme, net of an
expense margin reflecting the acquisition cost loadings. The adequacy of the UPR will be
tested by comparing against an Additional Unexpired Risk Reserve (AURR), which will
be calculated using pooled industry claims data for the underlying assumptions. An AURR
will be held in cases where the UPR is deemed insufficient to meet claims in respect of
the unexpired period.
A loss ratio approach will be used for IBNR reserving, where the underlying claim rates
are based on an analysis of historical group life claims experience, with judgement
adopted where required.
No separate reserve is proposed for claims handling costs for Group Life business as
these are typically insignificant in size. Any costs incurred are absorbed as part of the
general business management costs.
5.3 Process used to decide on assumptions
5.3.1 Valuation interest rate:
The valuation interest rate is based on current market risk-free yields with adjustments.
The use of a risk-free rate also implies that future investment margins (in excess of the
risk-free return) will not be capitalised upon, which satisfies paragraph 27 of IFRS 4.
Further the result is a "fair value" liability calculation which aids the comparability of
accounts between insurers.
Net valuation interest rate of 13.5% & 13% pa were adopted for annuity and other long
term businesses, which has been applied as a single long term rate of return. As at 31
December, 2017 FGN bond yields of duration between 5 and 20 years were round 14%.
The 20 year FGN bond yield was 14%. By comparison long term bonds were yielding
15.5% at December 2016.
For the purpose of determining the valuation interest rate, we have considered a 0.25%
prudent margin against the long term yield to arrive at a gross valuation interest rate of
13.75%. This makes some allowance for the volatility and liquidity of the "risk free"
yields.
Rate
Type of Business Risk Annuity
Average yield based on a long-term FGN bonds 14.00% 14.00%
Less Prudent Margin (0.25)% (0.25)%
Less Reinvestment Risk Margin 0.00% (0.25)%
Gross Valuation Interest rate 13.75% 13.50%
Less tax (6%) -0.81% 0.00%
Net Valuation Interest Rate 12.94% 13.50%
Rates Adopted 13.00% 13.50%
The valuation interest rates for the individual risk products are as follows:
Type of Business Current
Valuation
Previous
valuation
Risk products 13.00% 14.65%
Risk reserves for deposit-based policies 13.00% 14.65%
Pension Annuity 13.50% 15.50%
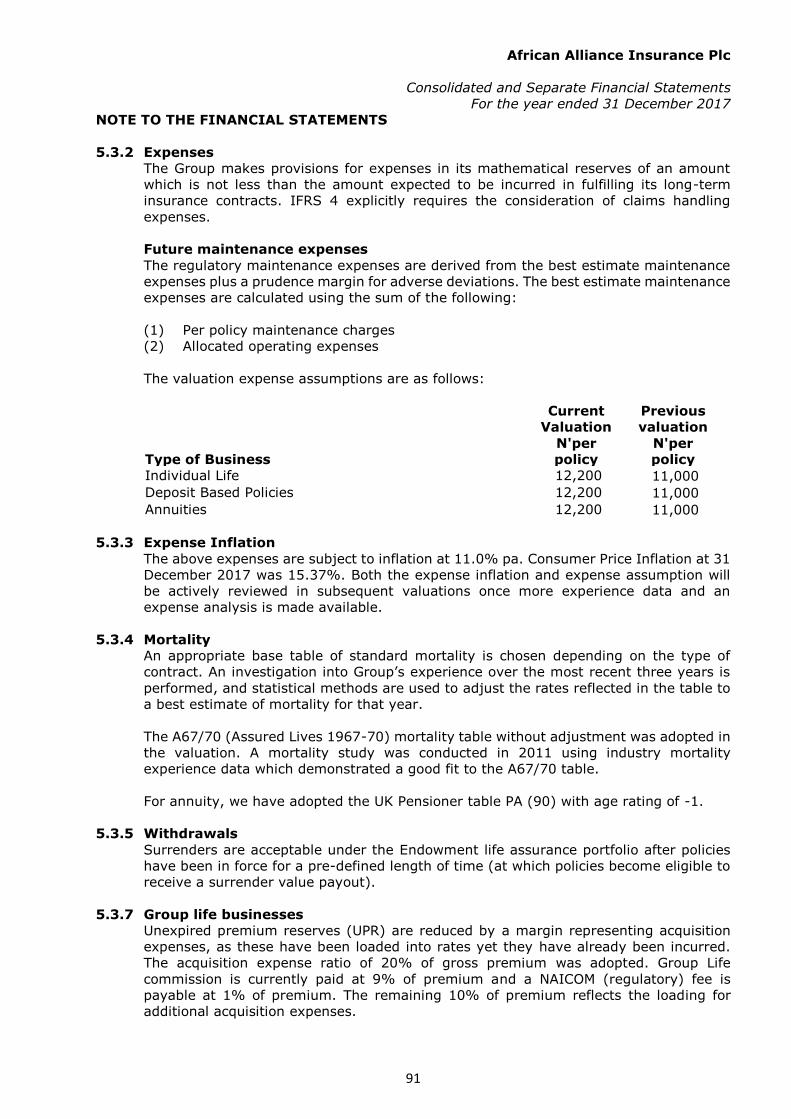
African Alliance Insurance Plc
Consolidated and Separate Financial Statements
For the year ended 31 December 2017
NOTE TO THE FINANCIAL STATEMENTS
91
5.3.2 Expenses
The Group makes provisions for expenses in its mathematical reserves of an amount
which is not less than the amount expected to be incurred in fulfilling its long-term
insurance contracts. IFRS 4 explicitly requires the consideration of claims handling
expenses.
Future maintenance expenses
The regulatory maintenance expenses are derived from the best estimate maintenance
expenses plus a prudence margin for adverse deviations. The best estimate maintenance
expenses are calculated using the sum of the following:
(1) Per policy maintenance charges
(2) Allocated operating expenses
The valuation expense assumptions are as follows:
Type of Business
Current
Valuation
N'per
policy
Previous
valuation
N'per
policy
Individual Life 12,200 11,000
Deposit Based Policies 12,200 11,000
Annuities 12,200 11,000
5.3.3 Expense Inflation
The above expenses are subject to inflation at 11.0% pa. Consumer Price Inflation at 31
December 2017 was 15.37%. Both the expense inflation and expense assumption will
be actively reviewed in subsequent valuations once more experience data and an
expense analysis is made available.
5.3.4 Mortality
An appropriate base table of standard mortality is chosen depending on the type of
contract. An investigation into Group’s experience over the most recent three years is
performed, and statistical methods are used to adjust the rates reflected in the table to
a best estimate of mortality for that year.
The A67/70 (Assured Lives 1967-70) mortality table without adjustment was adopted in
the valuation. A mortality study was conducted in 2011 using industry mortality
experience data which demonstrated a good fit to the A67/70 table.
For annuity, we have adopted the UK Pensioner table PA (90) with age rating of -1.
5.3.5 Withdrawals
Surrenders are acceptable under the Endowment life assurance portfolio after policies
have been in force for a pre-defined length of time (at which policies become eligible to
receive a surrender value payout).
5.3.7 Group life businesses
Unexpired premium reserves (UPR) are reduced by a margin representing acquisition
expenses, as these have been loaded into rates yet they have already been incurred.
The acquisition expense ratio of 20% of gross premium was adopted. Group Life
commission is currently paid at 9% of premium and a NAICOM (regulatory) fee is
payable at 1% of premium. The remaining 10% of premium reflects the loading for
additional acquisition expenses.
African Alliance Insurance Plc
Consolidated and Separate Financial Statements
For the year ended 31 December 2017
NOTE TO THE FINANCIAL STATEMENTS
92
5.3.8 Reinsurance agreements
Reinsurance is allowed for in the valuation by having gross and reinsurance ceded
records in the policy files. All reserves have been reported gross of reinsurance, with the
value of the reinsurance asset reported separately.
5.3.9 Changes in assumptions
The Group did not change its assumptions for the insurance contracts.
5.4 Insurance and Market risk sensitivities
The sensitivity analysis of insurance and market risk is used as it provides a detailed
understanding of the risks inherent in the business and to help develop a risk monitoring
and management framework to ensure the risks remain within limits, taking into account
the available capital and shareholder risk tolerance levels.
The "Assumption Changes" component of the analysis of change in the table below
shows the impact on liabilities of the actual assumption changes made over the year.
The sensitivity analysis was performed using the under-listed variables:
a) Valuation interest (discount) rate +/-1%
b) Expenses +/- 10%
c) Expense inflation +/-2%
d) Mortality +/-5% (including Group Life)
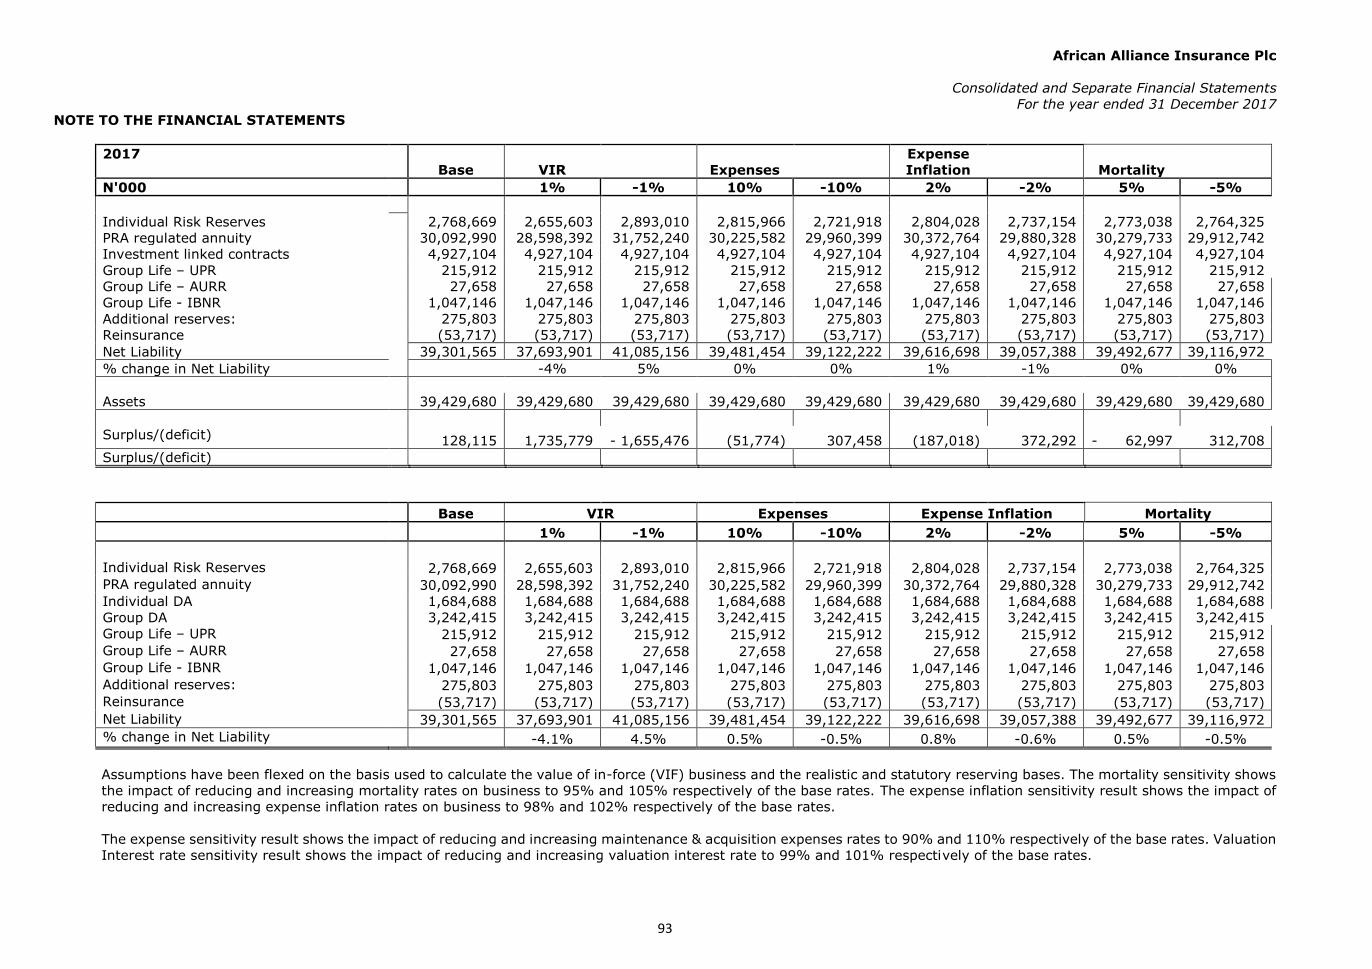
African Alliance Insurance Plc
Consolidated and Separate Financial Statements
For the year ended 31 December 2017
NOTE TO THE FINANCIAL STATEMENTS
93
2017
Base VIR Expenses
Expense
Inflation Mortality N'000 1% -1% 10% -10% 2% -2% 5% -5%
Individual Risk Reserves 2,768,669 2,655,603 2,893,010 2,815,966 2,721,918 2,804,028 2,737,154 2,773,038 2,764,325 PRA regulated annuity 30,092,990 28,598,392 31,752,240 30,225,582 29,960,399 30,372,764 29,880,328 30,279,733 29,912,742 Investment linked contracts 4,927,104 4,927,104 4,927,104 4,927,104 4,927,104 4,927,104 4,927,104 4,927,104 4,927,104 Group Life – UPR 215,912 215,912 215,912 215,912 215,912 215,912 215,912 215,912 215,912 Group Life – AURR 27,658 27,658 27,658 27,658 27,658 27,658 27,658 27,658 27,658 Group Life - IBNR 1,047,146 1,047,146 1,047,146 1,047,146 1,047,146 1,047,146 1,047,146 1,047,146 1,047,146 Additional reserves: 275,803 275,803 275,803 275,803 275,803 275,803 275,803 275,803 275,803 Reinsurance (53,717) (53,717) (53,717) (53,717) (53,717) (53,717) (53,717) (53,717) (53,717) Net Liability 39,301,565 37,693,901 41,085,156 39,481,454 39,122,222 39,616,698 39,057,388 39,492,677 39,116,972 % change in Net Liability
-4% 5% 0% 0% 1% -1% 0% 0% Assets
39,429,680 39,429,680 39,429,680 39,429,680 39,429,680 39,429,680 39,429,680 39,429,680 39,429,680
Surplus/(deficit)
128,115 1,735,779 - 1,655,476 (51,774) 307,458 (187,018) 372,292 - 62,997 312,708 Surplus/(deficit)
Base VIR Expenses Expense Inflation Mortality 1% -1% 10% -10% 2% -2% 5% -5% Individual Risk Reserves 2,768,669 2,655,603 2,893,010 2,815,966 2,721,918 2,804,028 2,737,154 2,773,038 2,764,325 PRA regulated annuity 30,092,990 28,598,392 31,752,240 30,225,582 29,960,399 30,372,764 29,880,328 30,279,733 29,912,742 Individual DA 1,684,688 1,684,688 1,684,688 1,684,688 1,684,688 1,684,688 1,684,688 1,684,688 1,684,688 Group DA 3,242,415 3,242,415 3,242,415 3,242,415 3,242,415 3,242,415 3,242,415 3,242,415 3,242,415 Group Life – UPR 215,912 215,912 215,912 215,912 215,912 215,912 215,912 215,912 215,912 Group Life – AURR 27,658 27,658 27,658 27,658 27,658 27,658 27,658 27,658 27,658 Group Life - IBNR
1,047,146 1,047,146 1,047,146 1,047,146 1,047,146 1,047,146 1,047,146 1,047,146 1,047,146
Additional reserves:
275,803 275,803 275,803 275,803 275,803 275,803 275,803 275,803 275,803 Reinsurance
(53,717) (53,717) (53,717) (53,717) (53,717) (53,717) (53,717) (53,717) (53,717)
Net Liability 39,301,565 37,693,901 41,085,156 39,481,454 39,122,222 39,616,698 39,057,388 39,492,677 39,116,972 % change in Net Liability -4.1% 4.5% 0.5% -0.5% 0.8% -0.6% 0.5% -0.5%
Assumptions have been flexed on the basis used to calculate the value of in-force (VIF) business and the realistic and statutory reserving bases. The mortality sensitivity shows
the impact of reducing and increasing mortality rates on business to 95% and 105% respectively of the base rates. The expense inflation sensitivity result shows the impact of
reducing and increasing expense inflation rates on business to 98% and 102% respectively of the base rates.
The expense sensitivity result shows the impact of reducing and increasing maintenance & acquisition expenses rates to 90% and 110% respectively of the base rates. Valuation
Interest rate sensitivity result shows the impact of reducing and increasing valuation interest rate to 99% and 101% respectively of the base rates.
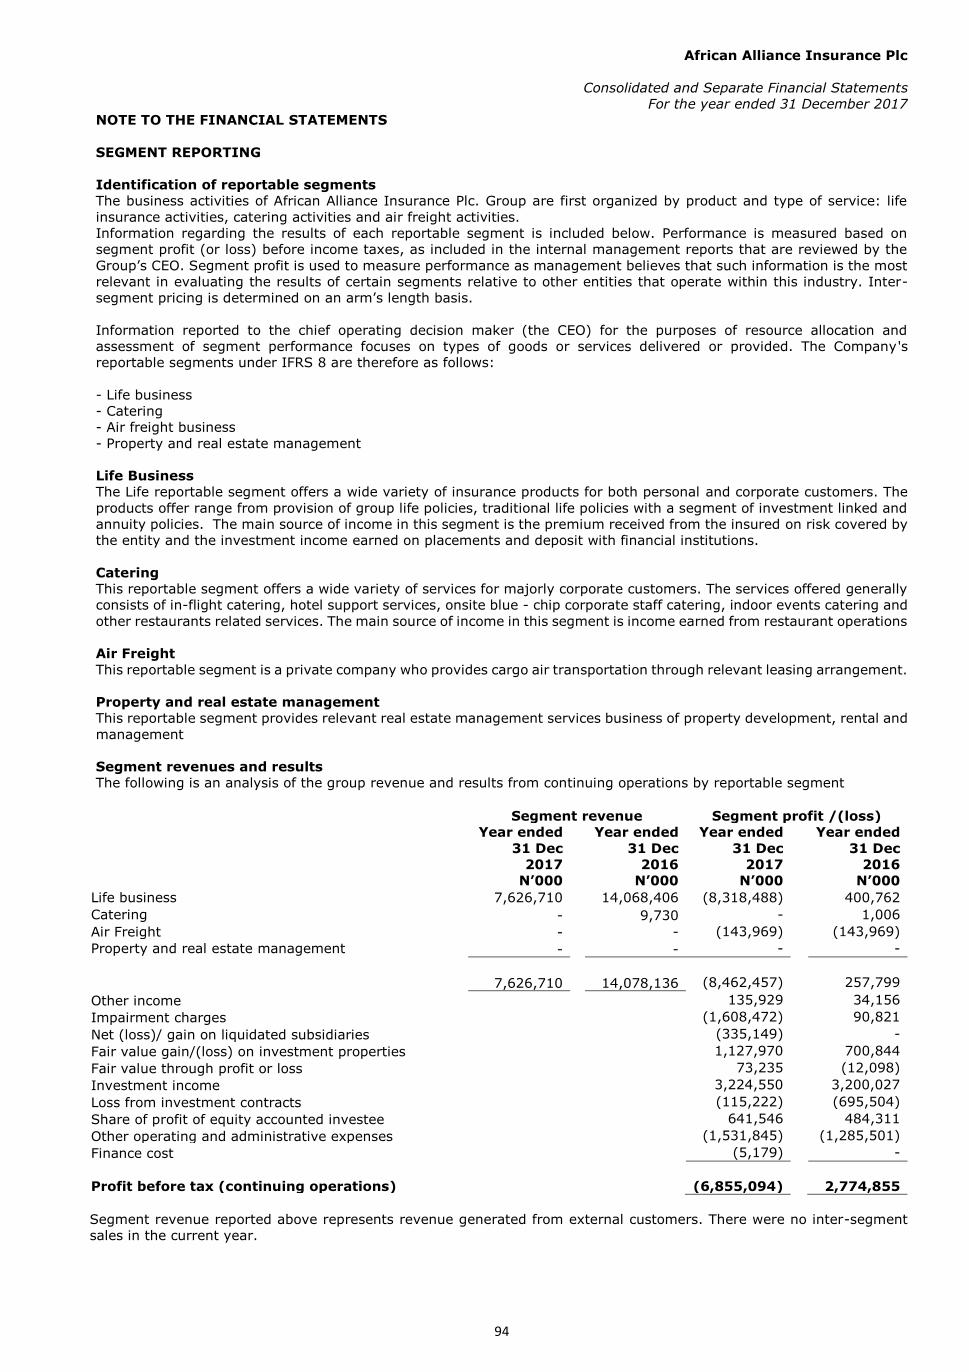
African Alliance Insurance Plc
Consolidated and Separate Financial Statements
For the year ended 31 December 2017
NOTE TO THE FINANCIAL STATEMENTS
94
SEGMENT REPORTING
Identification of reportable segments
The business activities of African Alliance Insurance Plc. Group are first organized by product and type of service: life
insurance activities, catering activities and air freight activities.
Information regarding the results of each reportable segment is included below. Performance is measured based on
segment profit (or loss) before income taxes, as included in the internal management reports that are reviewed by the
Group’s CEO. Segment profit is used to measure performance as management believes that such information is the most
relevant in evaluating the results of certain segments relative to other entities that operate within this industry. Inter-
segment pricing is determined on an arm’s length basis.
Information reported to the chief operating decision maker (the CEO) for the purposes of resource allocation and
assessment of segment performance focuses on types of goods or services delivered or provided. The Company's
reportable segments under IFRS 8 are therefore as follows:
- Life business
- Catering
- Air freight business
- Property and real estate management
Life Business
The Life reportable segment offers a wide variety of insurance products for both personal and corporate customers. The
products offer range from provision of group life policies, traditional life policies with a segment of investment linked and
annuity policies. The main source of income in this segment is the premium received from the insured on risk covered by
the entity and the investment income earned on placements and deposit with financial institutions.
Catering
This reportable segment offers a wide variety of services for majorly corporate customers. The services offered generally
consists of in-flight catering, hotel support services, onsite blue - chip corporate staff catering, indoor events catering and
other restaurants related services. The main source of income in this segment is income earned from restaurant operations
Air Freight
This reportable segment is a private company who provides cargo air transportation through relevant leasing arrangement.
Property and real estate management
This reportable segment provides relevant real estate management services business of property development, rental and
management
Segment revenues and results
The following is an analysis of the group revenue and results from continuing operations by reportable segment
Segment revenue Segment profit /(loss)
Year ended
31 Dec
2017
Year ended
31 Dec
2016
Year ended
31 Dec
2017
Year ended
31 Dec
2016
N’000
N’000 N’000
N’000
Life business 7,626,710
14,068,406 (8,318,488) 400,762
Catering - 9,730 - 1,006
Air Freight - - (143,969) (143,969)
Property and real estate management - - - -
7,626,710 14,078,136 (8,462,457) 257,799
Other income 135,929 34,156
Impairment charges (1,608,472) 90,821
Net (loss)/ gain on liquidated subsidiaries (335,149) -
Fair value gain/(loss) on investment properties 1,127,970 700,844
Fair value through profit or loss 73,235 (12,098)
Investment income 3,224,550 3,200,027
Loss from investment contracts
(115,222) (695,504)
Share of profit of equity accounted investee 641,546 484,311
Other operating and administrative expenses
(1,531,845) (1,285,501)
Finance cost (5,179) -
Profit before tax (continuing operations)
(6,855,094)
2,774,855
Segment revenue reported above represents revenue generated from external customers. There were no inter-segment
sales in the current year.

African Alliance Insurance Plc
Consolidated and Separate Financial Statements
For the year ended 31 December 2017
NOTE TO THE FINANCIAL STATEMENTS
95
The accounting policies of the reportable segments are the same as the Group's accounting
policies. Segment profit represents the profit before tax carried by each segment without
allocation of other operating administration costs and director's salaries, share of profit of
associates, investment income, other gains and losses as well as finance costs. This is the
measure reported to the chief operating decision maker for the purposes of resource allocation
and assessment of segment performance.
Segment assets
31-Dec-17
31-Dec-16
N’000
N’000
Life business
43,822,536
42,102,481
Catering
-
1,032,448
Air Freight
8,110
1,443,241
Property and real estate management
-
1,070,000
43,830,646
45,648,170
Segment liabilities
Life business
44,007,984
39,626,765
Catering
-
85,447
Air Freight
461,955
458,937
Property and real estate management
-
14,596
44,469,939 40,185,745
Other segment information Depreciation and
amortisation
Additions to non-
current assets Year
ended 31
Dec
2017
Year
ended
31 Dec
2016
Year
ended
31 Dec
2017
Year
ended
31 Dec
2016 N’000
N’000 N’000
N’000
Life business 154,252 134,757 66,103 72,242
Catering 4,985 2,605 - -
Air Freight 143,969 143,969 - -
Property and real estate management 26,383 26,383 - -
329,589 307,714 66,103 72,242
In addition to the depreciation and amortisation reported above, impairment losses of N1.18
Billion (2016: nil) were recognised in respect of property, plant and equipment. The impairment
loss was attributable to the following reportable segment.
Impairment loss recognised for the year in respect of property, plant and equipment
N’000
Air Freight
1,188,240
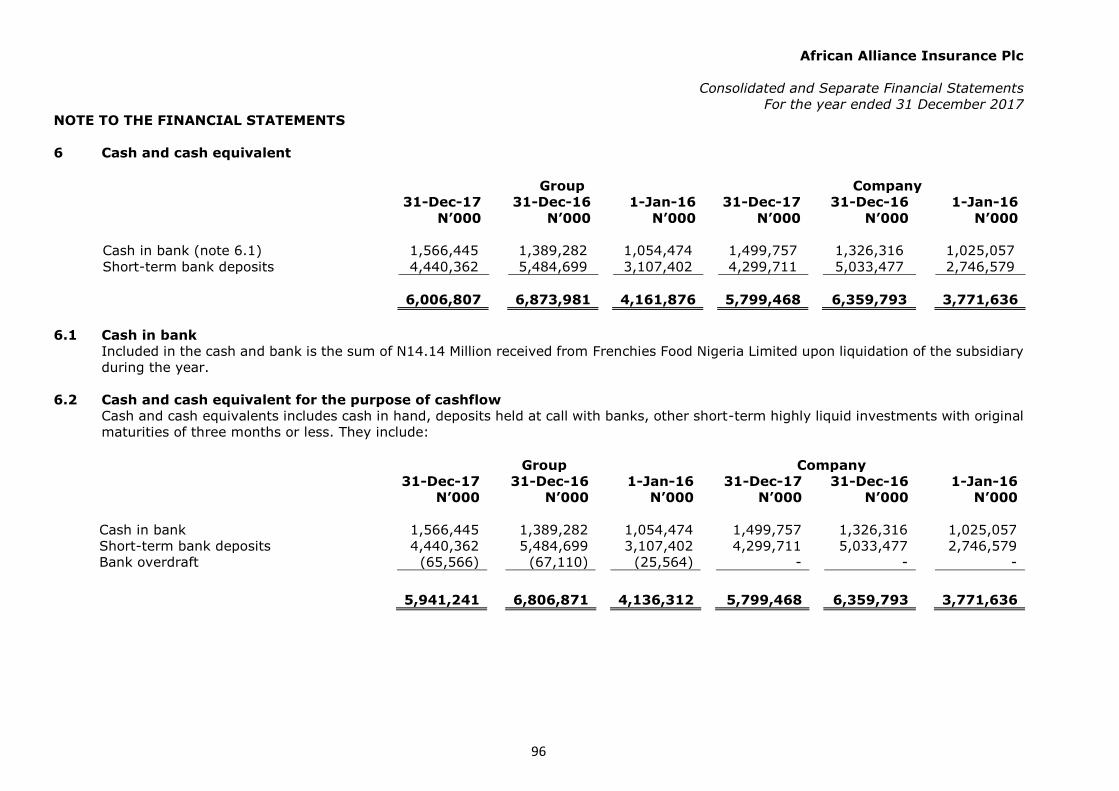
African Alliance Insurance Plc
Consolidated and Separate Financial Statements
For the year ended 31 December 2017
NOTE TO THE FINANCIAL STATEMENTS
96
6 Cash and cash equivalent
Group Company
31-Dec-17
31-Dec-16 1-Jan-16 31-Dec-17
31-Dec-16 1-Jan-16
N’000
N’000 N’000 N’000
N’000 N’000
Cash in bank (note 6.1) 1,566,445 1,389,282 1,054,474 1,499,757 1,326,316 1,025,057
Short-term bank deposits 4,440,362 5,484,699 3,107,402 4,299,711 5,033,477 2,746,579
6,006,807 6,873,981 4,161,876 5,799,468 6,359,793 3,771,636
6.1 Cash in bank
Included in the cash and bank is the sum of N14.14 Million received from Frenchies Food Nigeria Limited upon liquidation of the subsidiary
during the year.
6.2 Cash and cash equivalent for the purpose of cashflow
Cash and cash equivalents includes cash in hand, deposits held at call with banks, other short-term highly liquid investments with original
maturities of three months or less. They include:
Group Company
31-Dec-17
31-Dec-16 1-Jan-16 31-Dec-17
31-Dec-16 1-Jan-16
N’000
N’000 N’000 N’000
N’000 N’000
Cash in bank 1,566,445 1,389,282 1,054,474 1,499,757 1,326,316 1,025,057
Short-term bank deposits 4,440,362 5,484,699 3,107,402 4,299,711 5,033,477 2,746,579
Bank overdraft (65,566) (67,110) (25,564) - - -
5,941,241 6,806,871 4,136,312 5,799,468 6,359,793 3,771,636
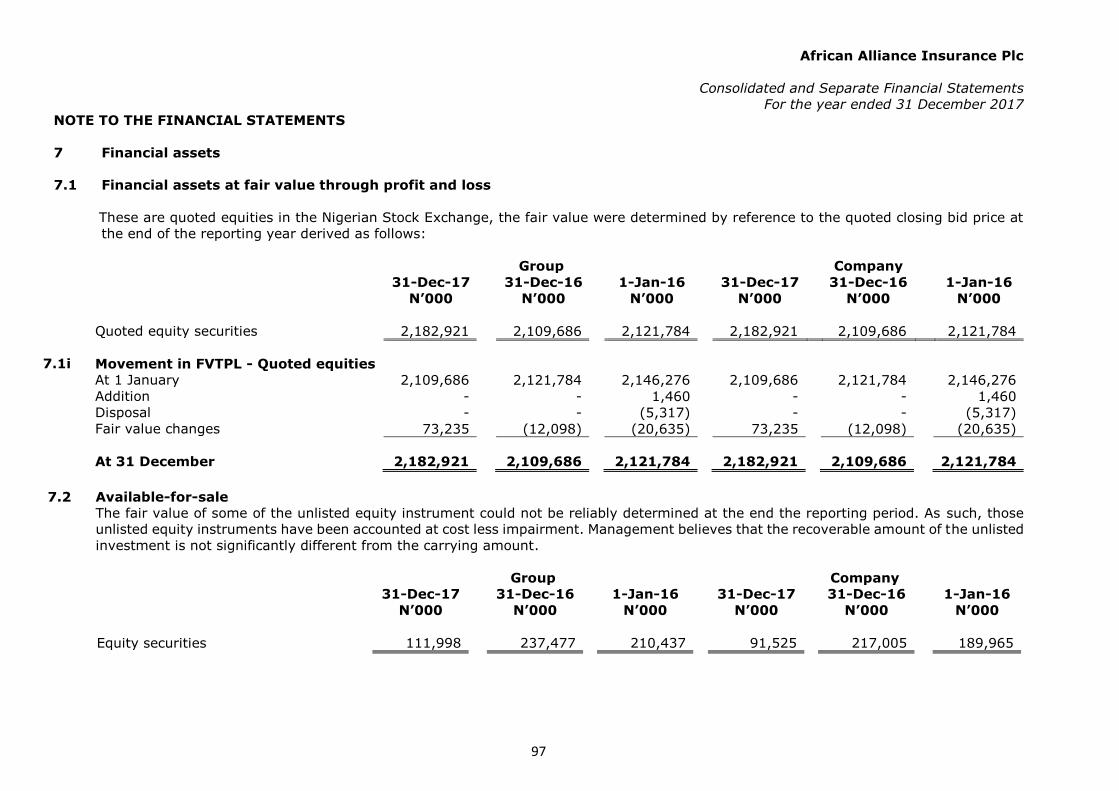
African Alliance Insurance Plc
Consolidated and Separate Financial Statements
For the year ended 31 December 2017
NOTE TO THE FINANCIAL STATEMENTS
97
7 Financial assets
7.1 Financial assets at fair value through profit and loss
These are quoted equities in the Nigerian Stock Exchange, the fair value were determined by reference to the quoted closing bid price at
the end of the reporting year derived as follows:
Group Company
31-Dec-17
31-Dec-16 1-Jan-16 31-Dec-17
31-Dec-16
1-Jan-16
N’000
N’000 N’000 N’000
N’000
N’000
Quoted equity securities 2,182,921 2,109,686 2,121,784 2,182,921 2,109,686 2,121,784
7.1i Movement in FVTPL - Quoted equities
At 1 January 2,109,686 2,121,784 2,146,276 2,109,686 2,121,784 2,146,276 Addition
- - 1,460 - - 1,460
Disposal
- - (5,317) - - (5,317) Fair value changes
73,235 (12,098) (20,635) 73,235 (12,098) (20,635)
At 31 December 2,182,921 2,109,686 2,121,784 2,182,921 2,109,686 2,121,784
7.2 Available-for-sale
The fair value of some of the unlisted equity instrument could not be reliably determined at the end the reporting period. As such, those
unlisted equity instruments have been accounted at cost less impairment. Management believes that the recoverable amount of the unlisted
investment is not significantly different from the carrying amount.
Group Company
31-Dec-17 31-Dec-16 1-Jan-16 31-Dec-17 31-Dec-16 1-Jan-16
N’000 N’000 N’000 N’000 N’000 N’000
Equity securities 111,998 237,477 210,437 91,525 217,005 189,965

African Alliance Insurance Plc
Consolidated and Separate Financial Statements
For the year ended 31 December 2017
NOTE TO THE FINANCIAL STATEMENTS
98
Group Company
31-Dec-17 31-Dec-16 1-Jan-16 31-Dec-17 31-Dec-16 1-Jan-16
N’000 N’000 N’000 N’000 N’000 N’000
7.2i Movement in AFS - Equity securities
At 1 January 237,477 210,437 135,272 217,005 189,965 114,800 Additions
32,500 - - 32,500 - -
Impairment (charge)/write back (114,287) 27,040 59,625 (114,287) 27,040 59,625 Reclassification from other receivables - - 15,540 - - 15,540 Disposal
(44,342) - - (44,343) - -
Fair value changes 650 - - 650 - -
At 31 December 111,998 237,477 210,437 91,525 217,005 189,965
7.2ii Equity Securities
Cost (Note 7.2iii)
1,412,774 1,424,616 1,424,616 1,392,301 1,404,144 1,404,144
Impairment allowance (Note 7.2iii) (1,301,426) (1,187,139) (1,214,179) (1,301,426) (1,187,139) (1,214,179) Fair value
650 - - 650 - -
111,998 237,477 210,437 91,525 217,005 189,965
Debt Securities Cost
1,787 1,787 1,787 1,787 1,787 1,787
Impairment allowance (1,787) (1,787) (1,787) (1,787) (1,787) (1,787)
At 31 December - - - - - -
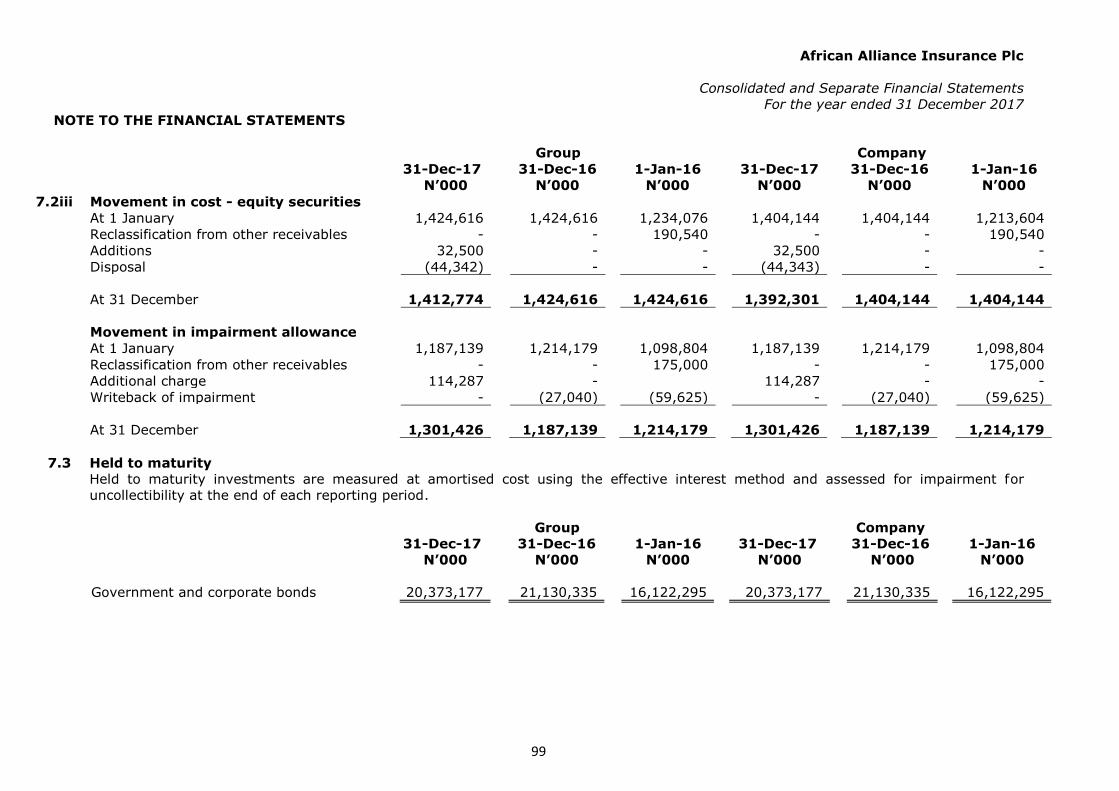
African Alliance Insurance Plc
Consolidated and Separate Financial Statements
For the year ended 31 December 2017
NOTE TO THE FINANCIAL STATEMENTS
99
Group Company
31-Dec-17 31-Dec-16 1-Jan-16 31-Dec-17 31-Dec-16 1-Jan-16
N’000 N’000 N’000 N’000 N’000 N’000
7.2iii Movement in cost - equity securities At 1 January 1,424,616 1,424,616 1,234,076 1,404,144 1,404,144 1,213,604
Reclassification from other receivables - - 190,540 - - 190,540
Additions 32,500 - - 32,500 - -
Disposal (44,342) - - (44,343) - -
At 31 December 1,412,774 1,424,616 1,424,616 1,392,301 1,404,144 1,404,144
Movement in impairment allowance At 1 January 1,187,139 1,214,179 1,098,804 1,187,139 1,214,179 1,098,804
Reclassification from other receivables - - 175,000 - - 175,000
Additional charge 114,287 - 114,287 - -
Writeback of impairment - (27,040) (59,625) - (27,040) (59,625)
At 31 December 1,301,426 1,187,139 1,214,179 1,301,426 1,187,139 1,214,179
7.3 Held to maturity
Held to maturity investments are measured at amortised cost using the effective interest method and assessed for impairment for
uncollectibility at the end of each reporting period.
Group Company
31-Dec-17
31-Dec-16 1-Jan-16 31-Dec-17
31-Dec-16
1-Jan-16
N’000
N’000 N’000 N’000
N’000
N’000
Government and corporate bonds 20,373,177 21,130,335 16,122,295 20,373,177 21,130,335
16,122,295
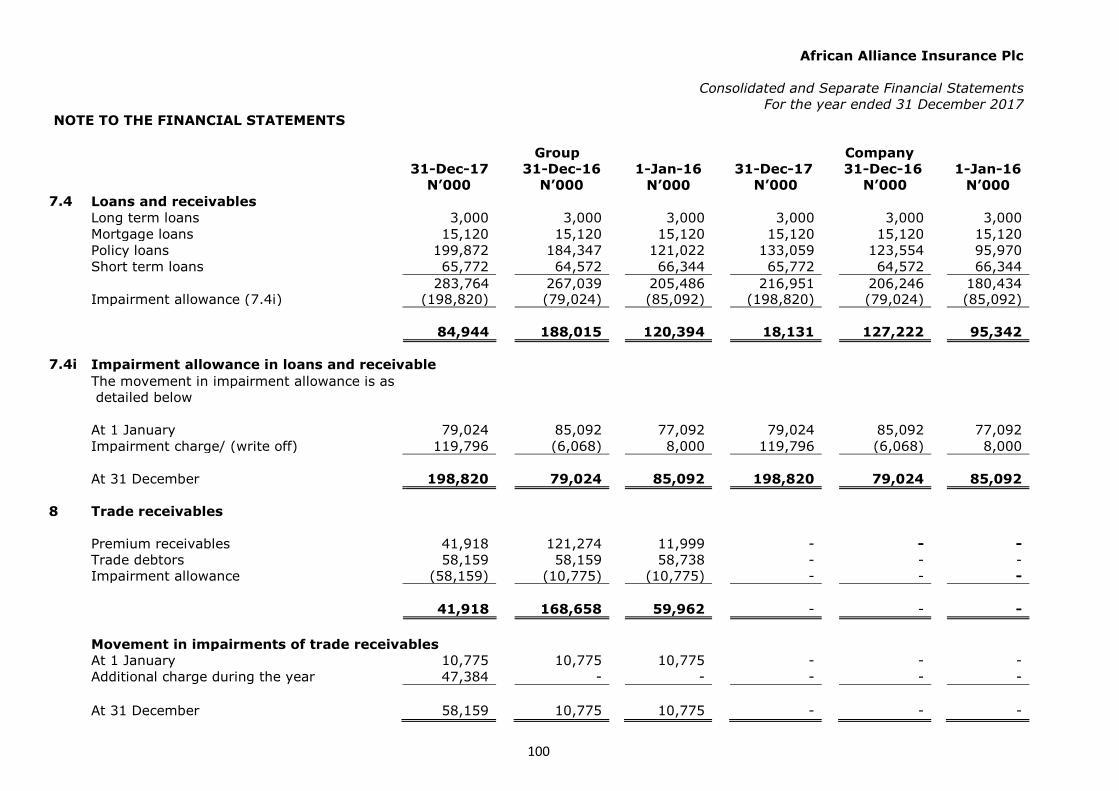
African Alliance Insurance Plc
Consolidated and Separate Financial Statements
For the year ended 31 December 2017
NOTE TO THE FINANCIAL STATEMENTS
100
Group Company
31-Dec-17
31-Dec-16 1-Jan-16 31-Dec-17
31-Dec-16
1-Jan-16
N’000
N’000 N’000 N’000
N’000
N’000
7.4 Loans and receivables Long term loans 3,000 3,000 3,000 3,000 3,000 3,000
Mortgage loans 15,120 15,120 15,120 15,120 15,120 15,120
Policy loans 199,872 184,347 121,022 133,059 123,554 95,970
Short term loans 65,772 64,572 66,344 65,772 64,572 66,344
283,764 267,039 205,486 216,951 206,246 180,434 Impairment allowance (7.4i) (198,820) (79,024) (85,092) (198,820) (79,024) (85,092)
84,944 188,015 120,394 18,131 127,222 95,342
7.4i Impairment allowance in loans and receivable
The movement in impairment allowance is as
detailed below
At 1 January 79,024 85,092 77,092 79,024 85,092 77,092
Impairment charge/ (write off) 119,796 (6,068) 8,000 119,796 (6,068) 8,000
At 31 December 198,820 79,024 85,092 198,820 79,024 85,092
8 Trade receivables
Premium receivables 41,918 121,274
11,999 - -
-
Trade debtors 58,159 58,159 58,738 - - -
Impairment allowance (58,159) (10,775) (10,775) - - -
41,918 168,658 59,962 - - -
Movement in impairments of trade receivables
At 1 January 10,775 10,775 10,775 - - -
Additional charge during the year 47,384 - - - - -
At 31 December 58,159 10,775 10,775 - - -
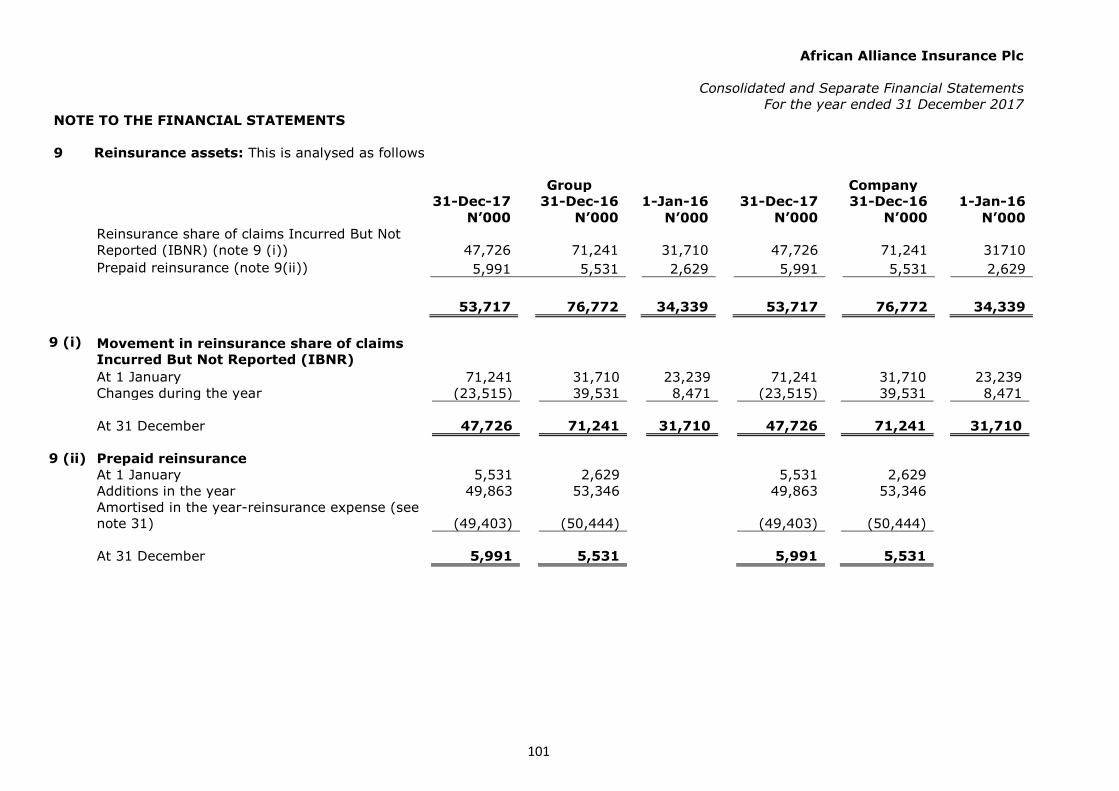
African Alliance Insurance Plc
Consolidated and Separate Financial Statements
For the year ended 31 December 2017
NOTE TO THE FINANCIAL STATEMENTS
101
9 Reinsurance assets: This is analysed as follows
Group Company
31-Dec-17 31-Dec-16 1-Jan-16 31-Dec-17 31-Dec-16 1-Jan-16
N’000 N’000 N’000 N’000 N’000 N’000
Reinsurance share of claims Incurred But Not
Reported (IBNR) (note 9 (i)) 47,726 71,241 31,710
47,726 71,241 31710
Prepaid reinsurance (note 9(ii)) 5,991 5,531 2,629 5,991 5,531 2,629
53,717 76,772 34,339 53,717 76,772 34,339
9 (i) Movement in reinsurance share of claims
Incurred But Not Reported (IBNR)
At 1 January 71,241 31,710 23,239 71,241 31,710 23,239
Changes during the year (23,515) 39,531 8,471 (23,515) 39,531 8,471
At 31 December 47,726 71,241 31,710 47,726 71,241 31,710
9 (ii) Prepaid reinsurance
At 1 January 5,531 2,629 5,531 2,629 Additions in the year 49,863 53,346 49,863 53,346 Amortised in the year-reinsurance expense (see
note 31) (49,403) (50,444) (49,403) (50,444)
At 31 December 5,991 5,531 5,991 5,531
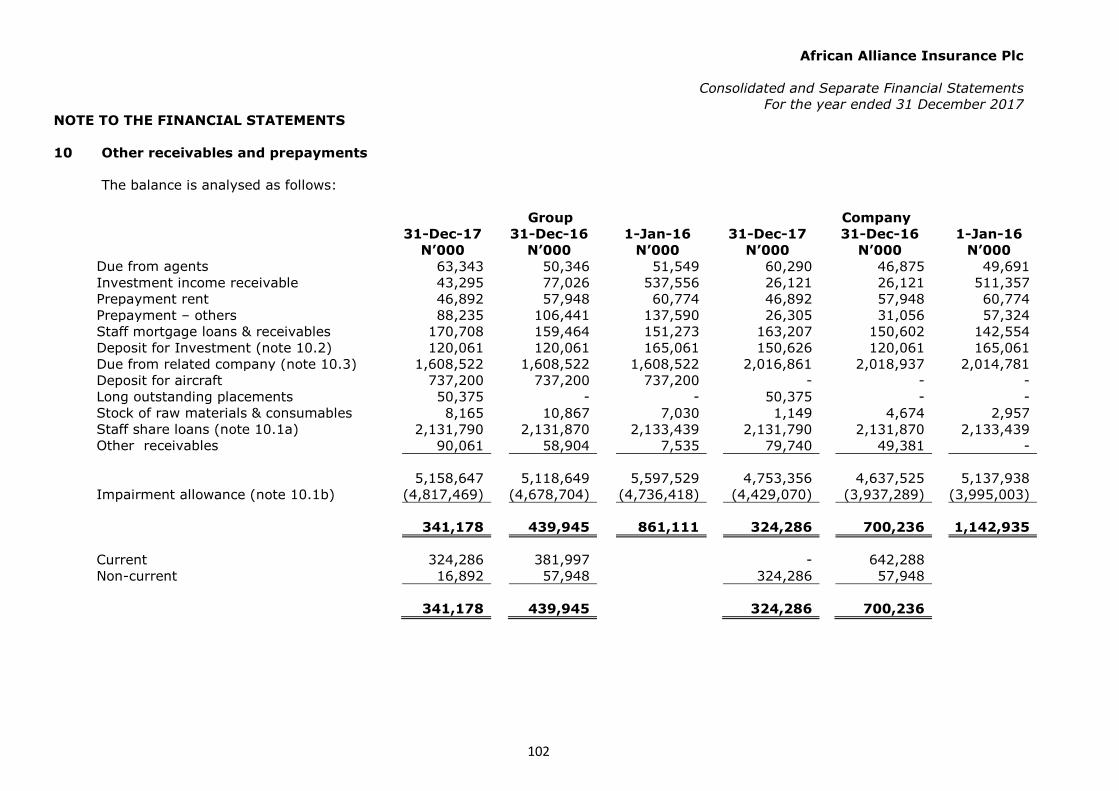
African Alliance Insurance Plc
Consolidated and Separate Financial Statements
For the year ended 31 December 2017
NOTE TO THE FINANCIAL STATEMENTS
102
10 Other receivables and prepayments
The balance is analysed as follows:
Group Company 31-Dec-17 31-Dec-16 1-Jan-16 31-Dec-17 31-Dec-16 1-Jan-16 N’000 N’000 N’000 N’000 N’000 N’000
Due from agents 63,343 50,346 51,549 60,290 46,875 49,691
Investment income receivable 43,295 77,026 537,556 26,121 26,121 511,357
Prepayment rent 46,892 57,948 60,774 46,892 57,948 60,774
Prepayment – others 88,235 106,441 137,590 26,305 31,056 57,324
Staff mortgage loans & receivables 170,708 159,464 151,273 163,207 150,602 142,554
Deposit for Investment (note 10.2) 120,061 120,061 165,061 150,626 120,061 165,061
Due from related company (note 10.3) 1,608,522 1,608,522 1,608,522 2,016,861 2,018,937 2,014,781
Deposit for aircraft 737,200 737,200 737,200 - - -
Long outstanding placements 50,375 - - 50,375 - -
Stock of raw materials & consumables 8,165 10,867 7,030 1,149 4,674 2,957
Staff share loans (note 10.1a) 2,131,790 2,131,870 2,133,439 2,131,790 2,131,870 2,133,439
Other receivables 90,061 58,904 7,535 79,740 49,381 -
5,158,647 5,118,649 5,597,529 4,753,356 4,637,525 5,137,938
Impairment allowance (note 10.1b) (4,817,469) (4,678,704) (4,736,418) (4,429,070) (3,937,289) (3,995,003)
341,178 439,945 861,111 324,286 700,236 1,142,935
Current 324,286 381,997 - 642,288 Non-current 16,892 57,948 324,286 57,948
341,178 439,945 324,286 700,236
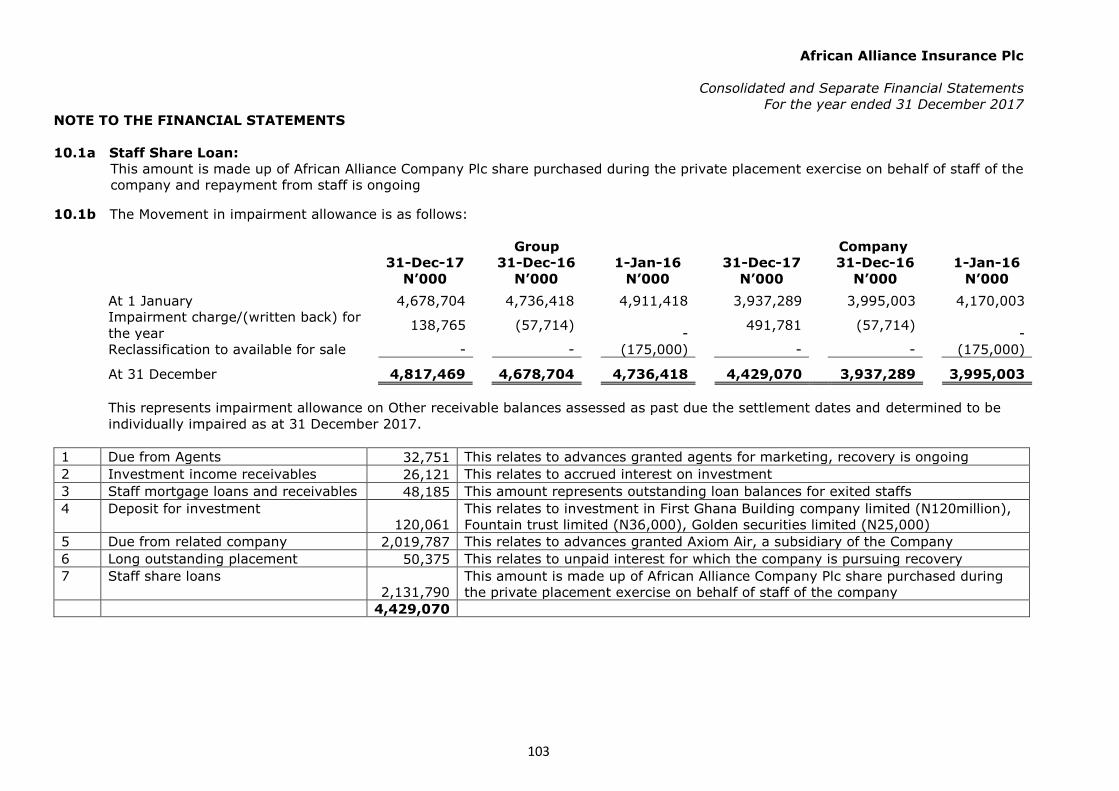
African Alliance Insurance Plc
Consolidated and Separate Financial Statements
For the year ended 31 December 2017
NOTE TO THE FINANCIAL STATEMENTS
103
10.1a Staff Share Loan:
This amount is made up of African Alliance Company Plc share purchased during the private placement exercise on behalf of staff of the
company and repayment from staff is ongoing
10.1b The Movement in impairment allowance is as follows:
Group Company
31-Dec-17
31-Dec-16 1-Jan-16 31-Dec-17
31-Dec-16
1-Jan-16
N’000 N’000 N’000 N’000 N’000
N’000
At 1 January 4,678,704 4,736,418 4,911,418 3,937,289 3,995,003 4,170,003 Impairment charge/(written back) for
the year 138,765 (57,714)
- 491,781 (57,714)
- Reclassification to available for sale - - (175,000) - - (175,000)
At 31 December 4,817,469 4,678,704 4,736,418 4,429,070 3,937,289 3,995,003
This represents impairment allowance on Other receivable balances assessed as past due the settlement dates and determined to be
individually impaired as at 31 December 2017.
1 Due from Agents 32,751 This relates to advances granted agents for marketing, recovery is ongoing
2 Investment income receivables 26,121 This relates to accrued interest on investment
3 Staff mortgage loans and receivables 48,185 This amount represents outstanding loan balances for exited staffs
4 Deposit for investment
120,061
This relates to investment in First Ghana Building company limited (N120million),
Fountain trust limited (N36,000), Golden securities limited (N25,000)
5 Due from related company 2,019,787 This relates to advances granted Axiom Air, a subsidiary of the Company
6 Long outstanding placement 50,375 This relates to unpaid interest for which the company is pursuing recovery
7 Staff share loans
2,131,790
This amount is made up of African Alliance Company Plc share purchased during
the private placement exercise on behalf of staff of the company
4,429,070
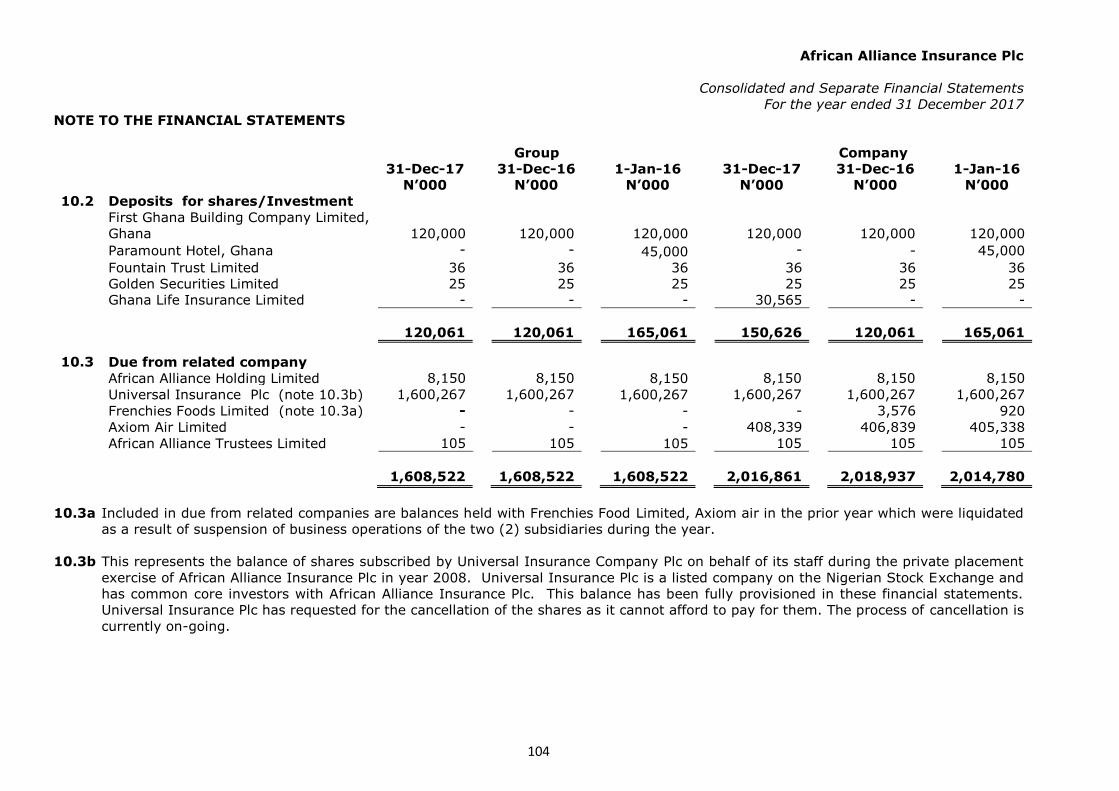
African Alliance Insurance Plc
Consolidated and Separate Financial Statements
For the year ended 31 December 2017
NOTE TO THE FINANCIAL STATEMENTS
104
Group Company
31-Dec-17
31-Dec-16 1-Jan-16 31-Dec-17
31-Dec-16
1-Jan-16
N’000 N’000 N’000 N’000 N’000
N’000
10.2 Deposits for shares/Investment
First Ghana Building Company Limited,
Ghana
120,000
120,000 120,000
120,000
120,000
120,000
Paramount Hotel, Ghana - - 45,000 - -
45,000
Fountain Trust Limited 36 36 36 36 36 36
Golden Securities Limited 25 25 25 25 25 25
Ghana Life Insurance Limited - - - 30,565 - -
120,061 120,061 165,061 150,626 120,061 165,061
10.3 Due from related company
African Alliance Holding Limited 8,150 8,150 8,150 8,150
8,150 8,150
Universal Insurance Plc (note 10.3b) 1,600,267
1,600,267 1,600,267 1,600,267
1,600,267 1,600,267
Frenchies Foods Limited (note 10.3a) -
- - -
3,576 920
Axiom Air Limited - - - 408,339 406,839 405,338
African Alliance Trustees Limited 105
105 105 105
105 105
1,608,522 1,608,522 1,608,522 2,016,861 2,018,937 2,014,780
10.3a Included in due from related companies are balances held with Frenchies Food Limited, Axiom air in the prior year which were liquidated
as a result of suspension of business operations of the two (2) subsidiaries during the year.
10.3b This represents the balance of shares subscribed by Universal Insurance Company Plc on behalf of its staff during the private placement
exercise of African Alliance Insurance Plc in year 2008. Universal Insurance Plc is a listed company on the Nigerian Stock Exchange and
has common core investors with African Alliance Insurance Plc. This balance has been fully provisioned in these financial statements.
Universal Insurance Plc has requested for the cancellation of the shares as it cannot afford to pay for them. The process of cancellation is
currently on-going.
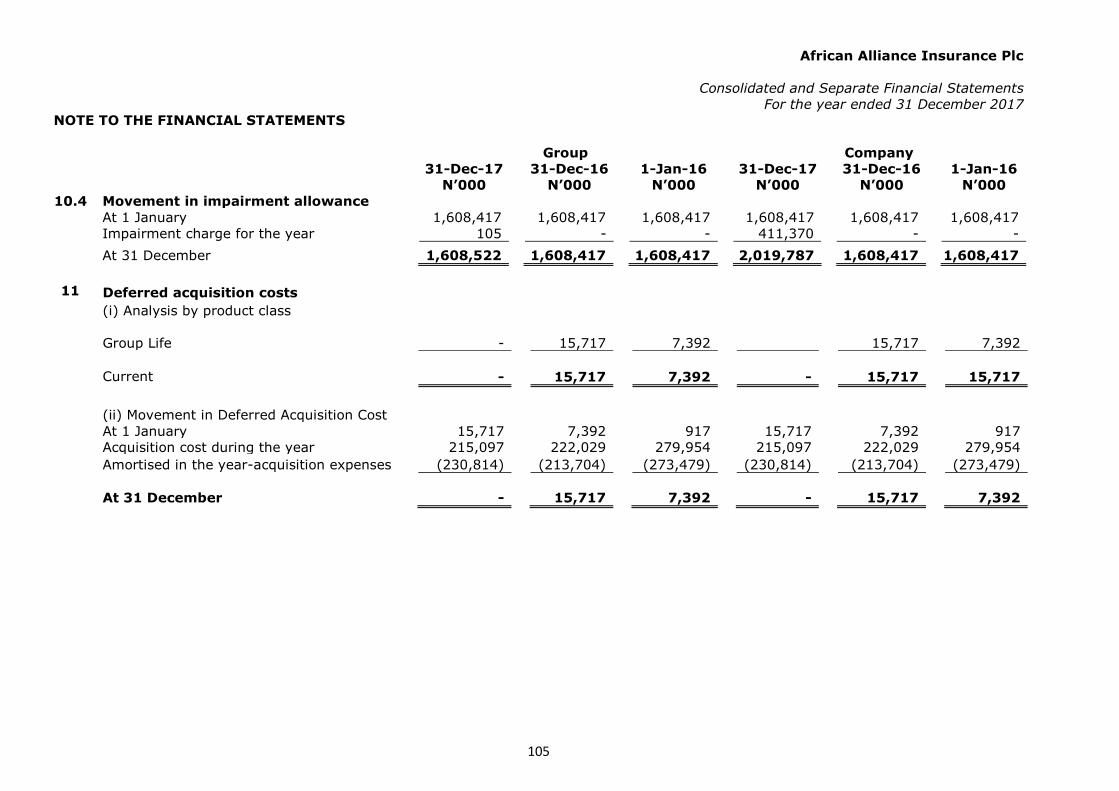
African Alliance Insurance Plc
Consolidated and Separate Financial Statements
For the year ended 31 December 2017
NOTE TO THE FINANCIAL STATEMENTS
105
Group Company
31-Dec-17 31-Dec-16 1-Jan-16 31-Dec-17 31-Dec-16 1-Jan-16
N’000 N’000 N’000 N’000 N’000 N’000
10.4 Movement in impairment allowance
At 1 January 1,608,417 1,608,417 1,608,417 1,608,417 1,608,417 1,608,417 Impairment charge for the year 105 - - 411,370 - -
At 31 December 1,608,522 1,608,417 1,608,417 2,019,787 1,608,417 1,608,417
11 Deferred acquisition costs
(i) Analysis by product class
Group Life - 15,717 7,392 15,717 7,392
Current - 15,717 7,392 - 15,717 15,717
(ii) Movement in Deferred Acquisition Cost
At 1 January 15,717 7,392 917 15,717 7,392 917
Acquisition cost during the year 215,097 222,029 279,954 215,097 222,029 279,954
Amortised in the year-acquisition expenses (230,814) (213,704) (273,479) (230,814) (213,704) (273,479)
At 31 December - 15,717 7,392 - 15,717 7,392
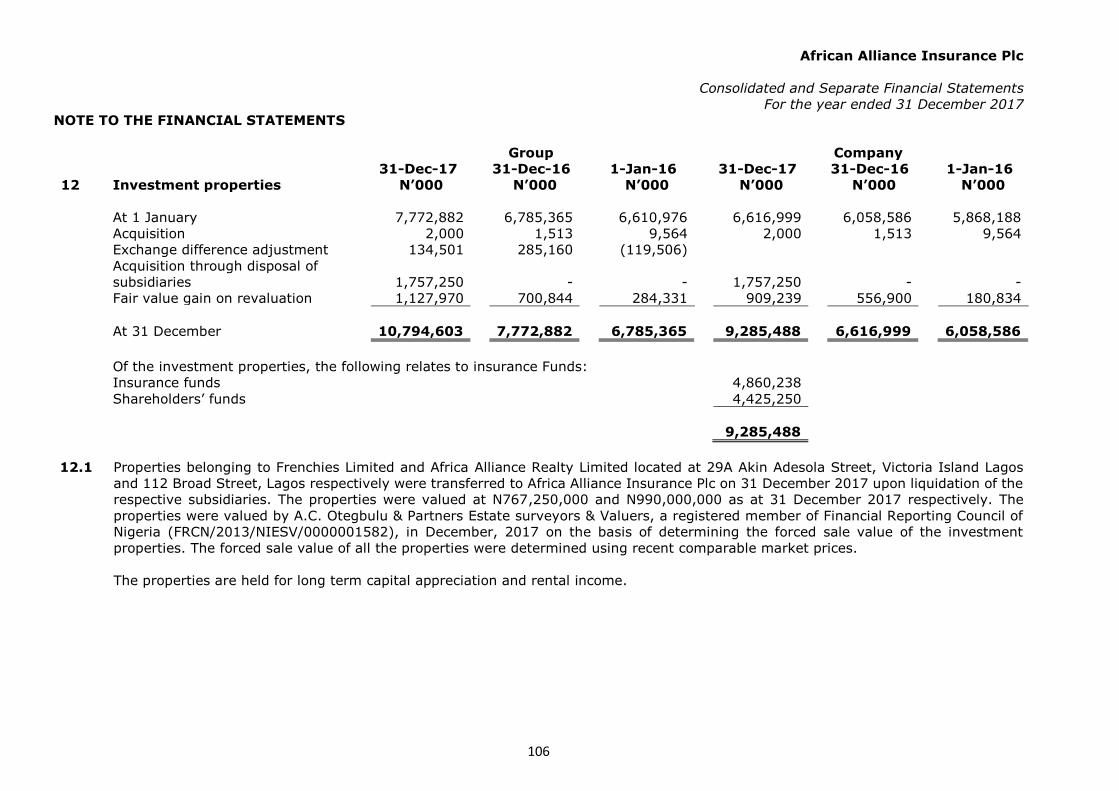
African Alliance Insurance Plc
Consolidated and Separate Financial Statements
For the year ended 31 December 2017
NOTE TO THE FINANCIAL STATEMENTS
106
Group Company
31-Dec-17 31-Dec-16 1-Jan-16 31-Dec-17 31-Dec-16 1-Jan-16
12 Investment properties N’000 N’000 N’000 N’000 N’000
N’000
At 1 January 7,772,882
6,785,365 6,610,976 6,616,999
6,058,586
5,868,188
Acquisition 2,000
1,513 9,564 2,000
1,513 9,564
Exchange difference adjustment 134,501
285,160 (119,506)
Acquisition through disposal of
subsidiaries 1,757,250 - -
1,757,250
-
-
Fair value gain on revaluation 1,127,970 700,844 284,331 909,239 556,900
180,834
At 31 December 10,794,603 7,772,882 6,785,365 9,285,488 6,616,999
6,058,586
Of the investment properties, the following relates to insurance Funds:
Insurance funds 4,860,238 Shareholders’ funds 4,425,250 9,285,488
12.1 Properties belonging to Frenchies Limited and Africa Alliance Realty Limited located at 29A Akin Adesola Street, Victoria Island Lagos
and 112 Broad Street, Lagos respectively were transferred to Africa Alliance Insurance Plc on 31 December 2017 upon liquidation of the
respective subsidiaries. The properties were valued at N767,250,000 and N990,000,000 as at 31 December 2017 respectively. The
properties were valued by A.C. Otegbulu & Partners Estate surveyors & Valuers, a registered member of Financial Reporting Council of
Nigeria (FRCN/2013/NIESV/0000001582), in December, 2017 on the basis of determining the forced sale value of the investment
properties. The forced sale value of all the properties were determined using recent comparable market prices.
The properties are held for long term capital appreciation and rental income.
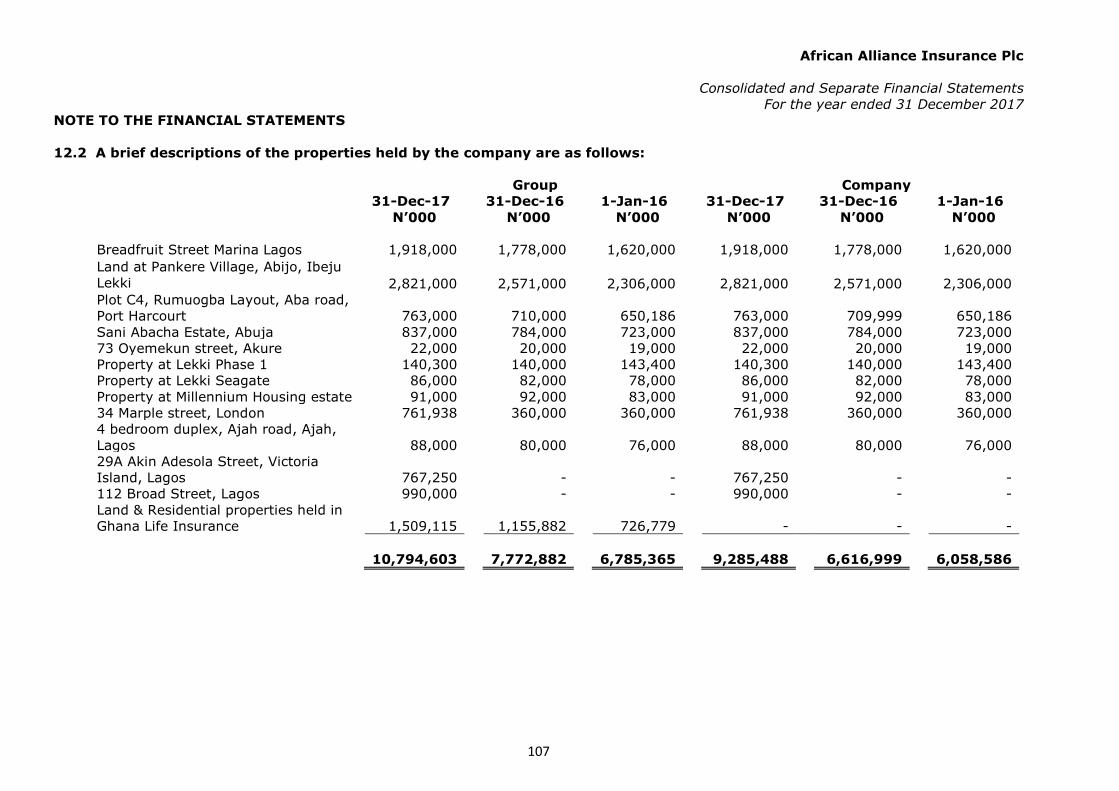
African Alliance Insurance Plc
Consolidated and Separate Financial Statements
For the year ended 31 December 2017
NOTE TO THE FINANCIAL STATEMENTS
107
12.2 A brief descriptions of the properties held by the company are as follows:
Group Company
31-Dec-17
31-Dec-16 1-Jan-16 31-Dec-17
31-Dec-16 1-Jan-16
N’000
N’000 N’000 N’000
N’000 N’000
Breadfruit Street Marina Lagos 1,918,000 1,778,000 1,620,000 1,918,000 1,778,000 1,620,000
Land at Pankere Village, Abijo, Ibeju
Lekki 2,821,000 2,571,000 2,306,000 2,821,000 2,571,000 2,306,000
Plot C4, Rumuogba Layout, Aba road,
Port Harcourt 763,000 710,000 650,186 763,000 709,999 650,186
Sani Abacha Estate, Abuja 837,000 784,000 723,000 837,000 784,000 723,000
73 Oyemekun street, Akure 22,000 20,000 19,000 22,000 20,000 19,000
Property at Lekki Phase 1 140,300 140,000 143,400 140,300 140,000 143,400
Property at Lekki Seagate 86,000 82,000 78,000 86,000 82,000 78,000
Property at Millennium Housing estate 91,000 92,000 83,000 91,000 92,000 83,000
34 Marple street, London 761,938 360,000 360,000 761,938 360,000 360,000
4 bedroom duplex, Ajah road, Ajah,
Lagos 88,000 80,000 76,000 88,000 80,000 76,000
29A Akin Adesola Street, Victoria
Island, Lagos 767,250 - - 767,250 - -
112 Broad Street, Lagos 990,000 - - 990,000 - -
Land & Residential properties held in
Ghana Life Insurance 1,509,115 1,155,882 726,779 - - -
10,794,603 7,772,882 6,785,365 9,285,488 6,616,999 6,058,586

African Alliance Insurance Plc
Consolidated and Separate Financial Statements
For the year ended 31 December 2017
NOTE TO THE FINANCIAL STATEMENTS
108
A brief descriptions of the properties held by the company in its name are as follows:
Group
Company
31-Dec-17
31-Dec-16 1-Jan-16 31-Dec-17
31-Dec-16 1-Jan-16
N’000
N’000 N’000 N’000
N’000 N’000
Breadfruit Street Marina Lagos 1,918,000 1,778,000 1,620,000 1,918,000 1,778,000 1,620,000
Property at Millennium Housing estate 91,000 92,000 83,000 91,000 92,000 83,000
34 Marple street, London 761,938 360,000 360,000 761,938 360,000 360,000
4 bedroom duplex, Ajah road, Ajah,
Lagos 88,000 80,000 76,000 88,000 80,000 76,000
73 Oyemekun street, Akure 22,000 20,000 19,000 22,000 20,000 19,000
Property at Lekki Phase 1 140,300 140,000 143,400 140,300 140,000 143,400
Property at Lekki Seagate 86,000 82,000 78,000 86,000 82,000 78,000
112, Broad Street, Lagos 990,000 - - 990,000 - -
Plot C4, Rumuogba Layout, Aba road,
Port Harcourt 763,000 710,000 650,186 763,000 709,999 650,186
4,860,238 3,262,000 3,029,586 4,860,238 3,261,999 3,029,586
A brief descriptions of the
properties held by
the company in the name of Conau
Limited are as follows:
Land at Pankere Village, Abijo, Ibeju
Lekki 2,821,000 2,571,000 2,306,000 2,821,000 2,571,000 2,306,000
Land & Residential properties held in
Ghana Life Insurance 1,509,115 1,155,882 726,779
29A, Akin Adesola Street, Victoria
Island 767,250 - - 767,250 - -
Sani Abacha Estate, Abuja 837,000 784,000 723,000 837,000 784,000 723,000
5,934,365 4,510,882 3,755,779 4,425,250 3,355,000 3,029,000
Total investment property 10,794,603 7,772,882 6,785,365 9,285,488 6,616,999 6,058,586
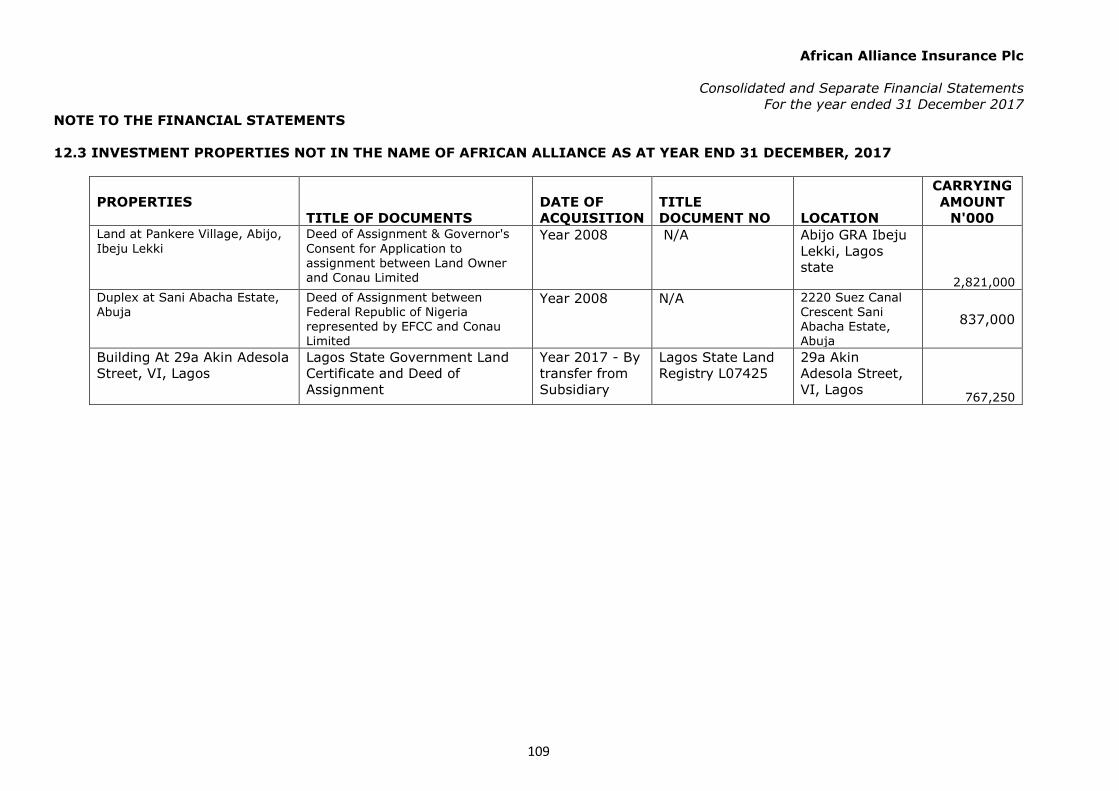
African Alliance Insurance Plc
Consolidated and Separate Financial Statements
For the year ended 31 December 2017
NOTE TO THE FINANCIAL STATEMENTS
109
12.3 INVESTMENT PROPERTIES NOT IN THE NAME OF AFRICAN ALLIANCE AS AT YEAR END 31 DECEMBER, 2017
PROPERTIES
TITLE OF DOCUMENTS
DATE OF
ACQUISITION
TITLE
DOCUMENT NO LOCATION
CARRYING
AMOUNT
N'000 Land at Pankere Village, Abijo,
Ibeju Lekki
Deed of Assignment & Governor's
Consent for Application to assignment between Land Owner and Conau Limited
Year 2008 N/A Abijo GRA Ibeju
Lekki, Lagos
state 2,821,000
Duplex at Sani Abacha Estate, Abuja
Deed of Assignment between Federal Republic of Nigeria represented by EFCC and Conau Limited
Year 2008 N/A 2220 Suez Canal Crescent Sani Abacha Estate, Abuja
837,000
Building At 29a Akin Adesola
Street, VI, Lagos
Lagos State Government Land
Certificate and Deed of
Assignment
Year 2017 - By
transfer from
Subsidiary
Lagos State Land
Registry L07425
29a Akin
Adesola Street,
VI, Lagos 767,250
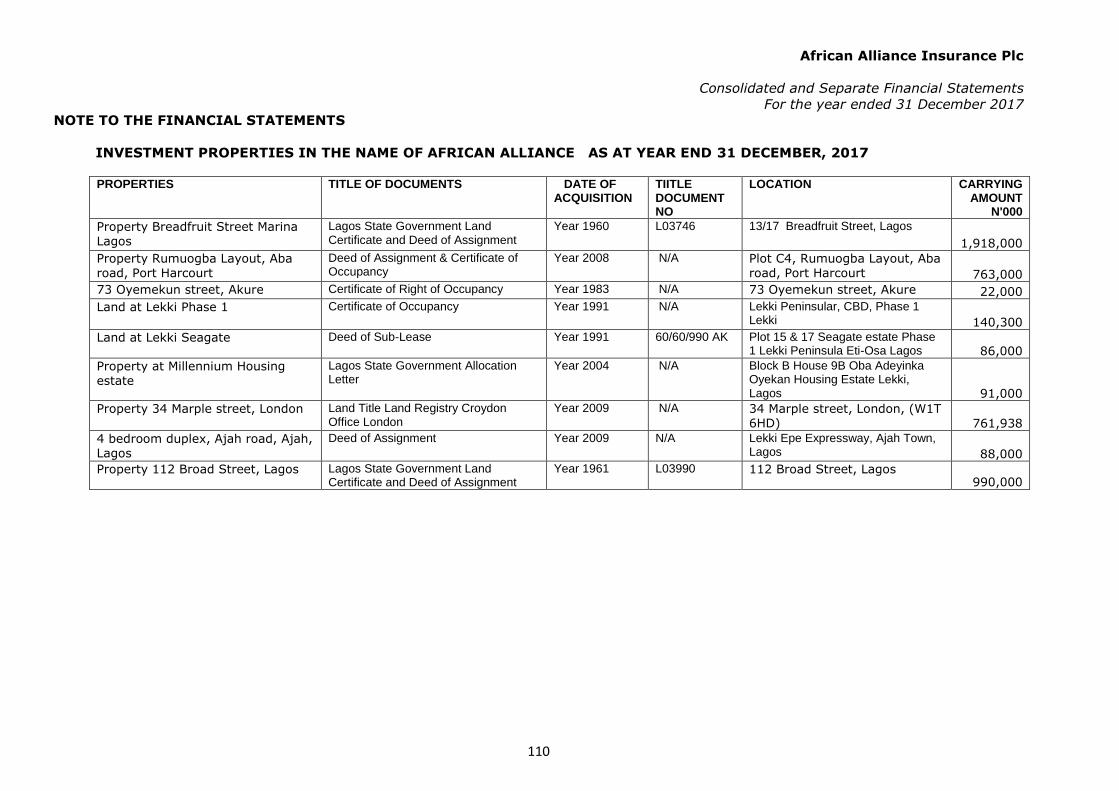
African Alliance Insurance Plc
Consolidated and Separate Financial Statements
For the year ended 31 December 2017
NOTE TO THE FINANCIAL STATEMENTS
110
INVESTMENT PROPERTIES IN THE NAME OF AFRICAN ALLIANCE AS AT YEAR END 31 DECEMBER, 2017
PROPERTIES TITLE OF DOCUMENTS DATE OF
ACQUISITION TIITLE DOCUMENT NO
LOCATION CARRYING AMOUNT
N'000
Property Breadfruit Street Marina
Lagos
Lagos State Government Land Certificate and Deed of Assignment
Year 1960 L03746 13/17 Breadfruit Street, Lagos
1,918,000
Property Rumuogba Layout, Aba road, Port Harcourt
Deed of Assignment & Certificate of Occupancy
Year 2008 N/A Plot C4, Rumuogba Layout, Aba road, Port Harcourt 763,000
73 Oyemekun street, Akure Certificate of Right of Occupancy Year 1983 N/A 73 Oyemekun street, Akure 22,000
Land at Lekki Phase 1 Certificate of Occupancy Year 1991 N/A Lekki Peninsular, CBD, Phase 1 Lekki 140,300
Land at Lekki Seagate Deed of Sub-Lease Year 1991 60/60/990 AK Plot 15 & 17 Seagate estate Phase 1 Lekki Peninsula Eti-Osa Lagos 86,000
Property at Millennium Housing estate
Lagos State Government Allocation Letter
Year 2004 N/A Block B House 9B Oba Adeyinka Oyekan Housing Estate Lekki, Lagos 91,000
Property 34 Marple street, London Land Title Land Registry Croydon Office London
Year 2009 N/A 34 Marple street, London, (W1T 6HD) 761,938
4 bedroom duplex, Ajah road, Ajah, Lagos
Deed of Assignment Year 2009 N/A Lekki Epe Expressway, Ajah Town, Lagos 88,000
Property 112 Broad Street, Lagos Lagos State Government Land Certificate and Deed of Assignment
Year 1961 L03990 112 Broad Street, Lagos 990,000
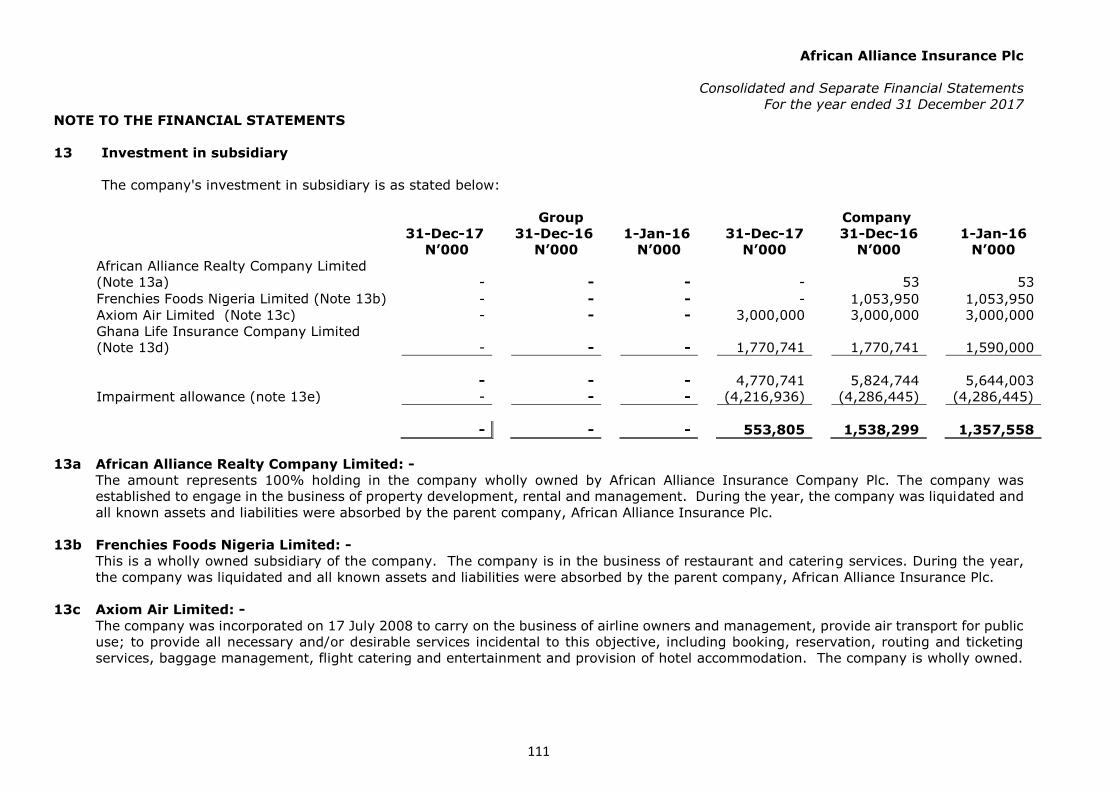
African Alliance Insurance Plc
Consolidated and Separate Financial Statements
For the year ended 31 December 2017
NOTE TO THE FINANCIAL STATEMENTS
111
13 Investment in subsidiary
The company's investment in subsidiary is as stated below:
Group Company
31-Dec-17
31-Dec-16 1-Jan-16 31-Dec-17
31-Dec-16
1-Jan-16
N’000
N’000 N’000 N’000
N’000
N’000
African Alliance Realty Company Limited
(Note 13a) - - - - 53 53
Frenchies Foods Nigeria Limited (Note 13b) - - - - 1,053,950 1,053,950
Axiom Air Limited (Note 13c) - - - 3,000,000 3,000,000 3,000,000
Ghana Life Insurance Company Limited
(Note 13d) - - - 1,770,741 1,770,741 1,590,000
- - - 4,770,741 5,824,744 5,644,003
Impairment allowance (note 13e) - - - (4,216,936) (4,286,445) (4,286,445)
- - - 553,805 1,538,299 1,357,558
13a African Alliance Realty Company Limited: -
The amount represents 100% holding in the company wholly owned by African Alliance Insurance Company Plc. The company was
established to engage in the business of property development, rental and management. During the year, the company was liquidated and
all known assets and liabilities were absorbed by the parent company, African Alliance Insurance Plc.
13b Frenchies Foods Nigeria Limited: -
This is a wholly owned subsidiary of the company. The company is in the business of restaurant and catering services. During the year,
the company was liquidated and all known assets and liabilities were absorbed by the parent company, African Alliance Insurance Plc.
13c Axiom Air Limited: -
The company was incorporated on 17 July 2008 to carry on the business of airline owners and management, provide air transport for public
use; to provide all necessary and/or desirable services incidental to this objective, including booking, reservation, routing and ticketing
services, baggage management, flight catering and entertainment and provision of hotel accommodation. The company is wholly owned.
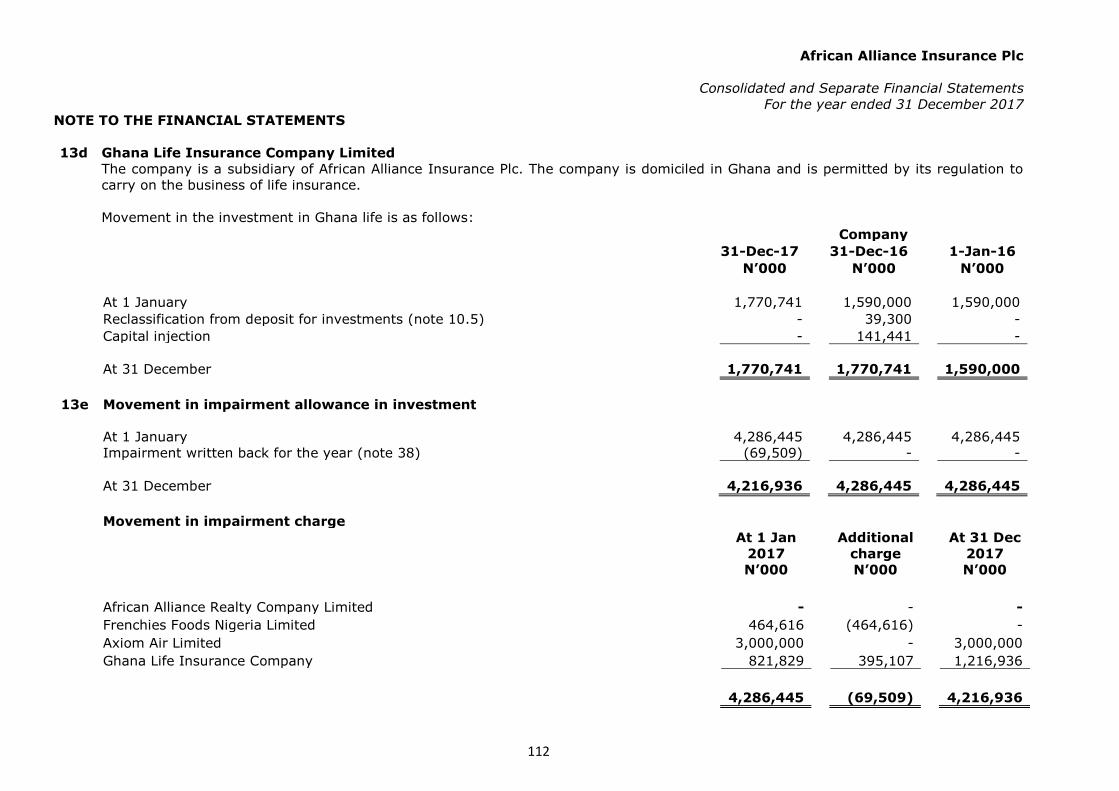
African Alliance Insurance Plc
Consolidated and Separate Financial Statements
For the year ended 31 December 2017
NOTE TO THE FINANCIAL STATEMENTS
112
13d Ghana Life Insurance Company Limited
The company is a subsidiary of African Alliance Insurance Plc. The company is domiciled in Ghana and is permitted by its regulation to
carry on the business of life insurance.
Movement in the investment in Ghana life is as follows:
Company
31-Dec-17 31-Dec-16 1-Jan-16
N’000 N’000 N’000
At 1 January
1,770,741 1,590,000 1,590,000
Reclassification from deposit for investments (note 10.5) - 39,300 -
Capital injection
- 141,441 -
At 31 December
1,770,741 1,770,741 1,590,000
13e Movement in impairment allowance in investment
At 1 January
4,286,445 4,286,445 4,286,445
Impairment written back for the year (note 38) (69,509) - -
At 31 December 4,216,936 4,286,445 4,286,445
Movement in impairment charge
At 1 Jan
2017
Additional
charge
At 31 Dec
2017
N’000 N’000 N’000
African Alliance Realty Company Limited
- - -
Frenchies Foods Nigeria Limited
464,616 (464,616) -
Axiom Air Limited
3,000,000 - 3,000,000
Ghana Life Insurance Company
821,829 395,107 1,216,936
4,286,445 (69,509) 4,216,936
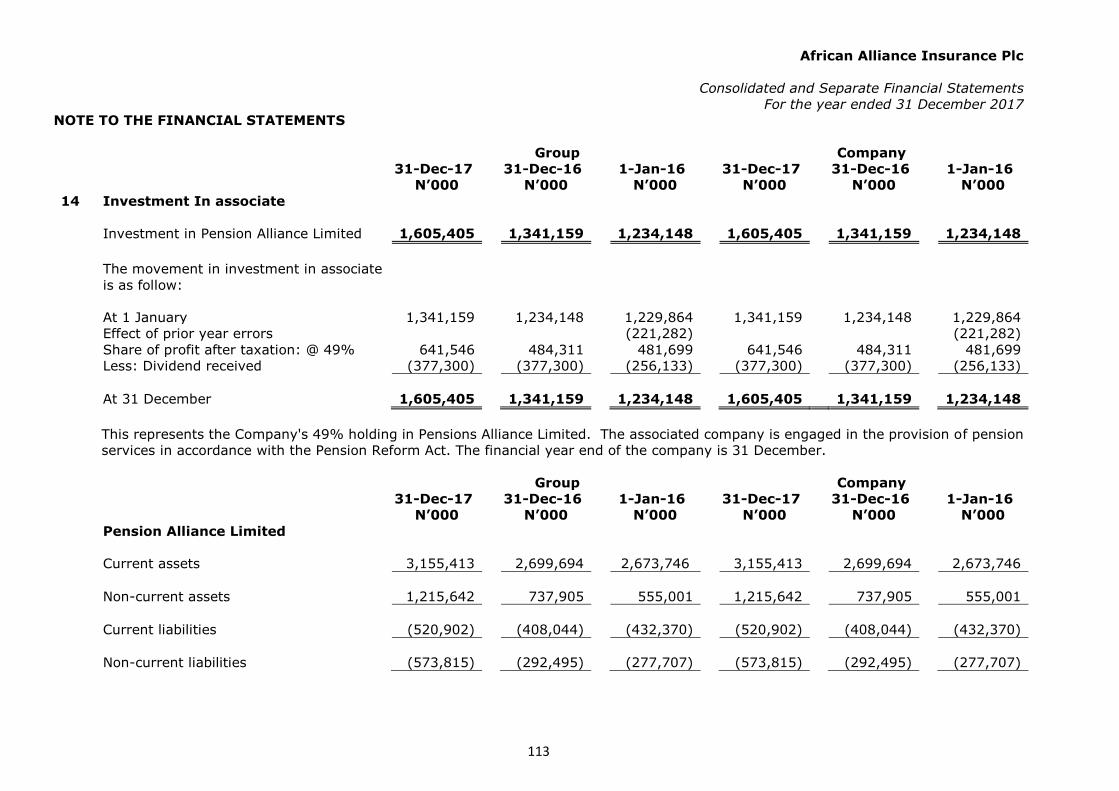
African Alliance Insurance Plc
Consolidated and Separate Financial Statements
For the year ended 31 December 2017
NOTE TO THE FINANCIAL STATEMENTS
113
Group Company
31-Dec-17
31-Dec-16 1-Jan-16 31-Dec-17
31-Dec-16
1-Jan-16
N’000
N’000 N’000 N’000
N’000
N’000
14 Investment In associate
Investment in Pension Alliance Limited
1,605,405
1,341,159
1,234,148
1,605,405
1,341,159
1,234,148
The movement in investment in associate
is as follow:
At 1 January
1,341,159
1,234,148
1,229,864
1,341,159
1,234,148
1,229,864
Effect of prior year errors (221,282) (221,282)
Share of profit after taxation: @ 49%
641,546
484,311
481,699
641,546
484,311
481,699
Less: Dividend received
(377,300)
(377,300)
(256,133)
(377,300)
(377,300)
(256,133)
At 31 December
1,605,405
1,341,159
1,234,148
1,605,405
1,341,159
1,234,148
This represents the Company's 49% holding in Pensions Alliance Limited. The associated company is engaged in the provision of pension
services in accordance with the Pension Reform Act. The financial year end of the company is 31 December.
Group Company
31-Dec-17
31-Dec-16 1-Jan-16 31-Dec-17
31-Dec-16
1-Jan-16
N’000
N’000 N’000 N’000
N’000
N’000
Pension Alliance Limited
Current assets
3,155,413
2,699,694
2,673,746
3,155,413
2,699,694
2,673,746
Non-current assets 1,215,642
737,905
555,001
1,215,642
737,905
555,001
Current liabilities
(520,902)
(408,044)
(432,370)
(520,902)
(408,044)
(432,370)
Non-current liabilities
(573,815)
(292,495)
(277,707)
(573,815)
(292,495)
(277,707)

African Alliance Insurance Plc
Consolidated and Separate Financial Statements
For the year ended 31 December 2017
NOTE TO THE FINANCIAL STATEMENTS
114
Group Company
31-Dec-17
31-Dec-16 1-Jan-16 31-Dec-17
31-Dec-16
1-Jan-16
N’000
N’000 N’000 N’000
N’000
N’000
Pension Alliance Limited
Revenue 4,303,148 3,385,662 3,038,414 4,303,148 3,385,662 3,038,414
Profit (loss) for the
year 1,309,278 988,390 983,059 1,309,278 988,390 983,059
Other comprehensive
income - - - - - -
Total comprehensive
income for the year 1,309,278 988,390 983,059 1,309,278 988,390 983,059
Dividend received
from the associate
during the year (377,300) (377,300) (256,133) (377,300) (377,300) (256,133)
Reconciliation of the above summarised financial information to the carrying amount of the interest in Pension
Alliance Limited recognised in the consolidated financial statements
Group Company
31-Dec-17
31-Dec-16 1-Jan-16 31-Dec-17
31-Dec-16
1-Jan-16
N’000
N’000 N’000 N’000
N’000
N’000
Net assets of
the associate 3,276,338 2,737,060 2,518,670 3,276,338 2,737,060 2,518,670
Proportion of
the Group’s
ownership
interest in
Pensions
Alliance Limited 49% 49% 49% 49% 49% 49%
Carrying
amount of the
net assets 1,605,405 1,341,159 1,234,148 1,605,405 1,341,159 1,234,148
15 Intangible assets Group Company
Deferred
Expenditure
Software
in
Progress
Computer
Software Total
Computer
Software Total
N’000 N’000 N’000 N’000 N’000 N’000
Cost At 1 January 2017 11,252 12,626 87,898 111,776 73,450 73,450
Additions
-
30,199
30,199 9,588 9,588
At 31 December 2017
11,252 12,626 118,097 141,975 83,038 83,038
Amortisation
At 1 January 2017 5,993 - 49,653 55,646 45,427
45,427
Charge for the year 3,863
18,507 22,370 16,698
16,698
At 31 December 2017 9,856 - 68,160 78,016 62,125 62,125
Net book amount
At 31 December 2017 1,396 12,626 49,937 63,959 20,913 20,913
At 31 December 2016 5,259 12,626 38,245 56,130 28,023 28,023
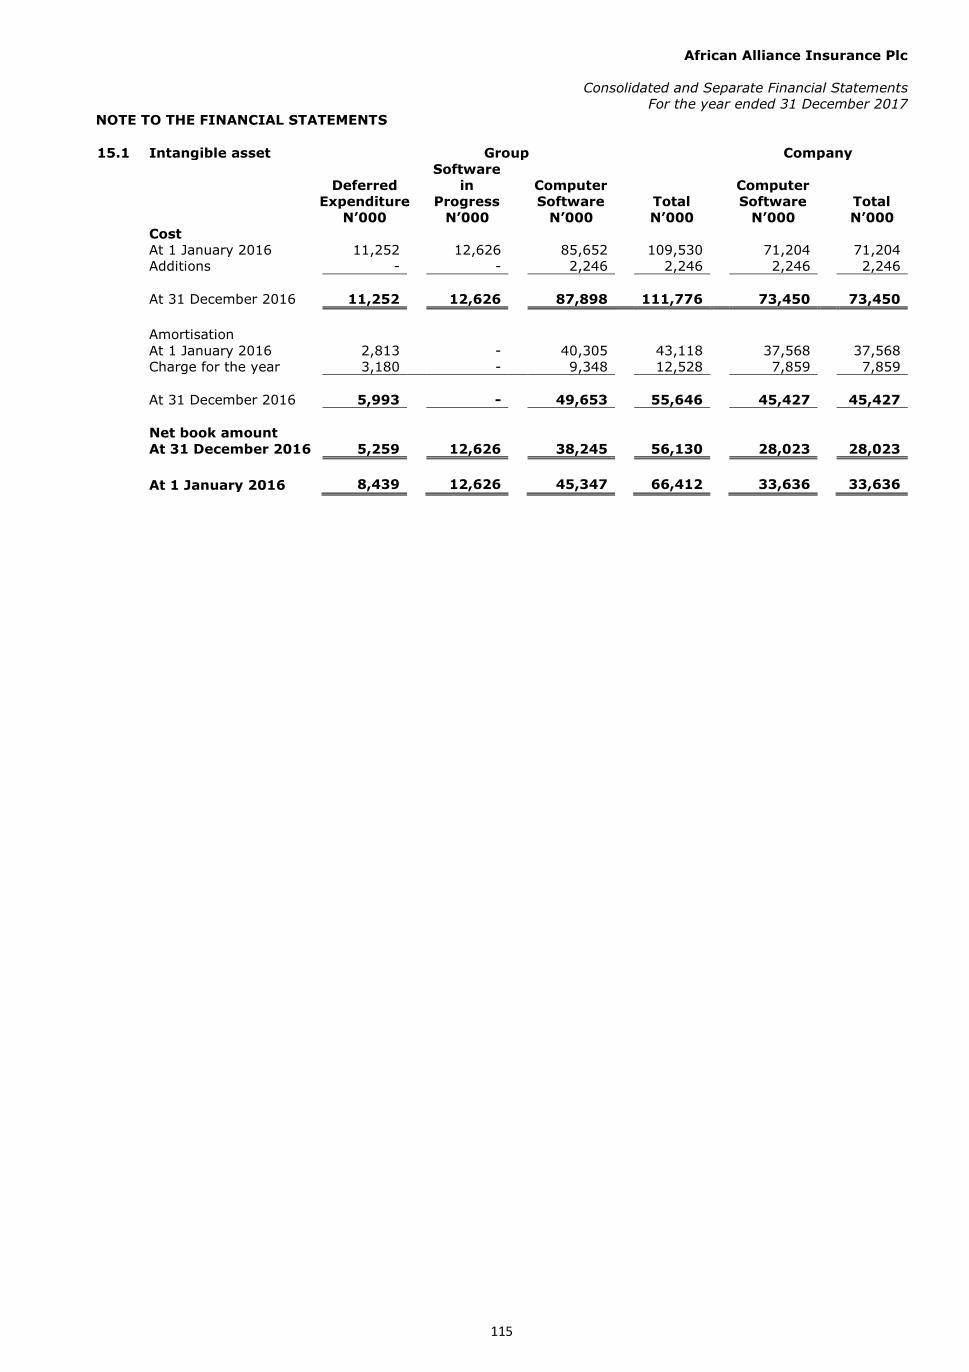
African Alliance Insurance Plc
Consolidated and Separate Financial Statements
For the year ended 31 December 2017
NOTE TO THE FINANCIAL STATEMENTS
115
15.1 Intangible asset Group Company
Deferred
Expenditure
Software
in
Progress
Computer
Software Total
Computer
Software Total
N’000 N’000 N’000 N’000 N’000 N’000
Cost At 1 January 2016 11,252 12,626 85,652 109,530 71,204
71,204
Additions - - 2,246 2,246 2,246
2,246
At 31 December 2016 11,252
12,626
87,898
111,776
73,450
73,450
Amortisation
At 1 January 2016 2,813 - 40,305 43,118 37,568
37,568
Charge for the year 3,180 - 9,348 12,528 7,859
7,859
At 31 December 2016 5,993 - 49,653 55,646 45,427 45,427
Net book amount
At 31 December 2016 5,259 12,626 38,245 56,130 28,023 28,023
At 1 January 2016 8,439 12,626 45,347 66,412 33,636 33,636

African Alliance Insurance Plc
Consolidated and Separate Financial Statements
For the year ended 31 December 2017
NOTE TO THE FINANCIAL STATEMENTS
116
16 Property and equipment
Group
Motor
Vehicles
Furniture
&
Fittings
Computer
Equipment
Office
Equipment
Plant &
Machinery
Land Building
Aircraft Total
N'000 N'000 N'000
N'000
N'000
N'000
N'000
N'000
N'000
Cost
At 1 January 2017 62,000 3,319,487 478,541 155,789 164,097 121,617 16,022 2,281,122 6,598,675
Additions - 472 - 7,030 24,301 4,101 - - 35,904
Disposal - - (15,480) (2,778) (8,782) (639) - - (27,679)
Arising on liquidation of subsidiaries
(note 12.1) (1,757,250) (2,091) (6,259) - - (6,851) - (1,772,451)
Exchange adjustment - 78,160 - - - - - - 78,160
Revaluation - (289,768) - - - - - - (289,768)
At 31 December 2017 62,000 1,351,101 460,970 153,782 179,616 125,079 9,171 2,281,122 4,622,841
Depreciation and impairment At 1 January 2017 - 173,399 314,604 88,499 102,576 53,453 16,022 948,913 1,697,466
Charge for the year - 46,228 72,470 11,179 22,474 10,899 - 143,969 307,219
Disposal - - (15,480) (2,778) (8,779) (639) - - (27,676)
Exchange adjustment 405 - - - - - - 405
Liquidation of subsidiaries - - (2,091) (6,259) - - (6,851) - (15,201)
Revaluation - (193,722) - - - - - - (193,722)
Impairment allowance* (note 38) - - - - - - - 1,188,240 1,188,240
At 31 December 2017 - 26,310 369,503 90,641 116,271 63,713 9,171 2,281,122 2,956,731
Net book amount At 31 December 2017 62,000 1,324,791 91,467 63,141 63,345 61,366 - - 1,666,110
At 31 December 2016 62,000 3,146,087 163,936 67,290 61,521 68,164 - 1,332,209 4,901,209
* The aircraft registered under Axiom Air Limited is currently grounded.
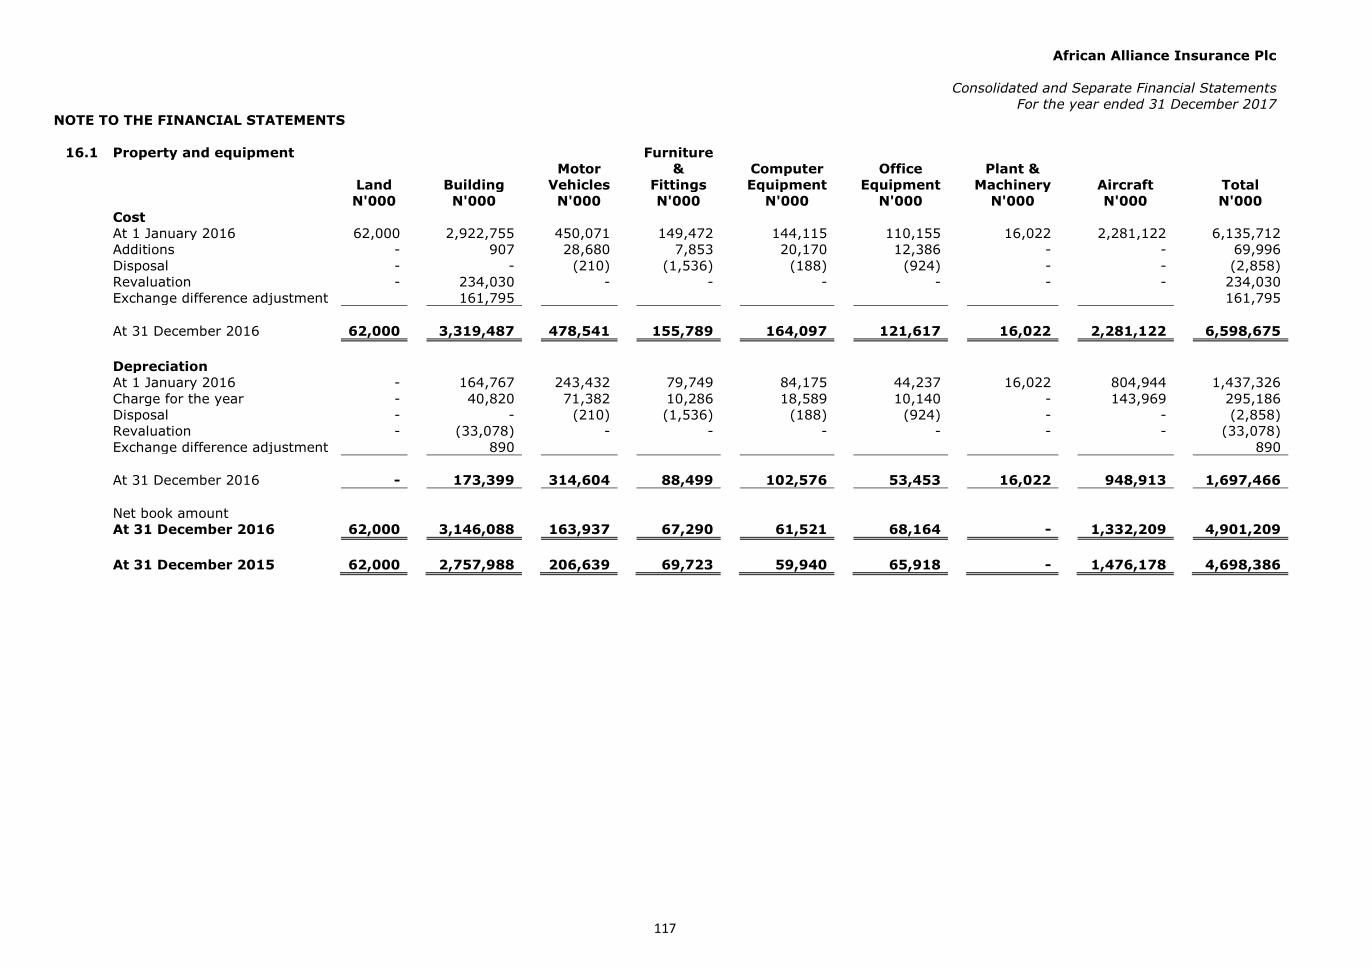
African Alliance Insurance Plc
Consolidated and Separate Financial Statements
For the year ended 31 December 2017
NOTE TO THE FINANCIAL STATEMENTS
117
16.1 Property and equipment Motor
Vehicles
Furniture
&
Fittings
Computer
Equipment
Office
Equipment
Plant &
Machinery
Land Building
Aircraft Total
N'000 N'000 N'000
N'000
N'000
N'000
N'000
N'000
N'000
Cost
At 1 January 2016 62,000 2,922,755 450,071 149,472 144,115 110,155 16,022 2,281,122
6,135,712
Additions -
907
28,680 7,853 20,170 12,386 - - 69,996
Disposal -
-
(210) (1,536) (188) (924) - - (2,858)
Revaluation -
234,030
- - - - - - 234,030
Exchange difference adjustment 161,795
161,795
At 31 December 2016 62,000 3,319,487 478,541
155,789
164,097
121,617
16,022
2,281,122
6,598,675
Depreciation
At 1 January 2016 -
164,767
243,432 79,749 84,175 44,237 16,022 804,944 1,437,326
Charge for the year -
40,820
71,382 10,286 18,589 10,140 - 143,969 295,186
Disposal - - (210) (1,536) (188) (924) - - (2,858)
Revaluation - (33,078) - - - - - - (33,078)
Exchange difference adjustment 890 890
At 31 December 2016 - 173,399 314,604 88,499 102,576 53,453 16,022 948,913 1,697,466
Net book amount
At 31 December 2016 62,000 3,146,088 163,937 67,290 61,521 68,164 - 1,332,209 4,901,209
At 31 December 2015 62,000 2,757,988 206,639 69,723 59,940 65,918 - 1,476,178 4,698,386

African Alliance Insurance Plc
Consolidated and Separate Financial Statements
For the year ended 31 December 2017
NOTE TO THE FINANCIAL STATEMENTS
118
16.4 Property and equipment
Company
Motor
Vehicles
Furniture
&
Fittings
Computer
Equipment
Office
Equipment
Total Land Building
N'000 N'000
N'000
N'000
N'000
N'000
Cost
At 1 January 2017 62,000 345,400
323,584
104,454
126,641
121,617 1,083,696
Additions - -
- 4,330 19,176 4,100 27,606
Disposal - -
(15,480) (2,778) (8,782) (639) (27,679)
Arising on Liquidation - - (2,091) (6,259) - - (8,350)
Revaluation - 48,908
- - - - 48,908
At 31 December 2017 62,000 394,308 306,013
99,747
137,035
125,078
1,124,181
Depreciation
At 1 January 2017 - 19,400
225,109
60,052
78,369
53,453
436,383
Charge for the year - 6,908
53,366 8,201 17,174 10,899 96,548
Disposal - -
(15,480) (2,778) (8,779) (639) (27,676)
Arising on Liquidation - - (2,091) (6,259) - - (8,350)
Revaluation - -
- - - - -
At 31 December 2017 - 26,308 260,904
59,216
86,764
63,713
496,905
Net book amount
At 31 December 2017 62,000 368,000
45,109 40,531 50,271 61,365 627,276
At 31 December 2016 62,000 326,000
98,475 44,402 48,272 68,164 647,313
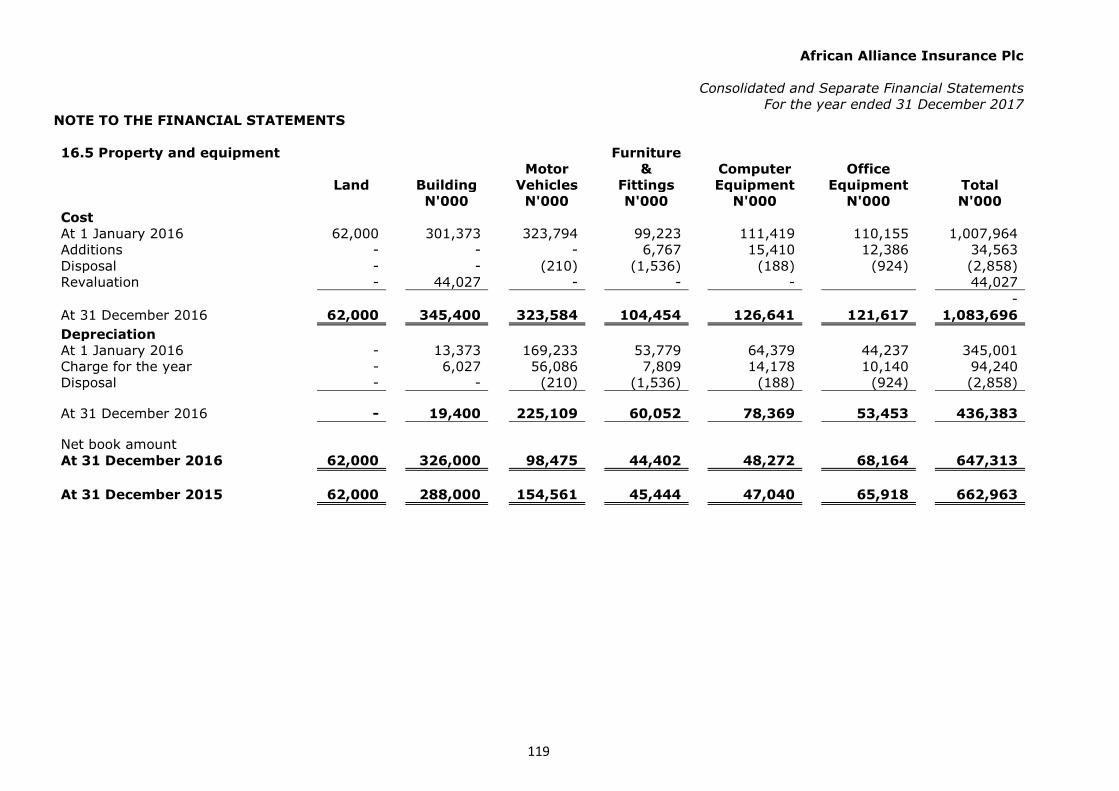
African Alliance Insurance Plc
Consolidated and Separate Financial Statements
For the year ended 31 December 2017
NOTE TO THE FINANCIAL STATEMENTS
119
16.5 Property and equipment Motor
Vehicles
Furniture
&
Fittings
Computer
Equipment
Office
Equipment
Total Land Building
N'000 N'000
N'000
N'000
N'000
N'000
Cost
At 1 January 2016 62,000 301,373
323,794
99,223
111,419
110,155
1,007,964
Additions - -
- 6,767 15,410 12,386 34,563
Disposal - -
(210) (1,536) (188) (924) (2,858)
Revaluation - 44,027
- - - 44,027
-
At 31 December 2016 62,000 345,400 323,584
104,454
126,641
121,617
1,083,696
Depreciation
At 1 January 2016 - 13,373
169,233 53,779 64,379 44,237 345,001
Charge for the year - 6,027
56,086 7,809 14,178 10,140 94,240
Disposal - - (210) (1,536) (188) (924) (2,858)
At 31 December 2016 - 19,400 225,109 60,052 78,369 53,453 436,383
Net book amount
At 31 December 2016 62,000 326,000 98,475 44,402 48,272 68,164 647,313
At 31 December 2015 62,000 288,000 154,561 45,444 47,040 65,918 662,963
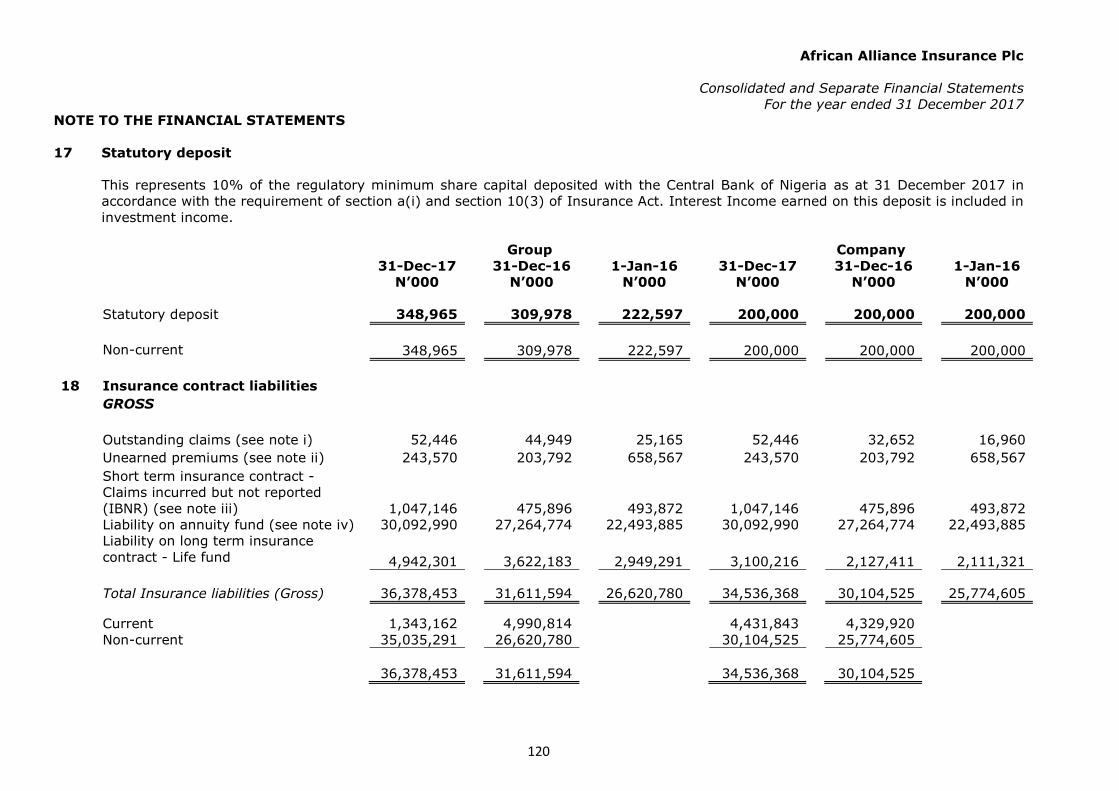
African Alliance Insurance Plc
Consolidated and Separate Financial Statements
For the year ended 31 December 2017
NOTE TO THE FINANCIAL STATEMENTS
120
17 Statutory deposit
This represents 10% of the regulatory minimum share capital deposited with the Central Bank of Nigeria as at 31 December 2017 in
accordance with the requirement of section a(i) and section 10(3) of Insurance Act. Interest Income earned on this deposit is included in
investment income.
Group Company
31-Dec-17
31-Dec-16 1-Jan-16 31-Dec-17
31-Dec-16
1-Jan-16
N’000
N’000 N’000 N’000
N’000
N’000
Statutory deposit
348,965 309,978 222,597 200,000 200,000 200,000
Non-current
348,965 309,978 222,597 200,000 200,000 200,000
18 Insurance contract liabilities
GROSS
Outstanding claims (see note i) 52,446 44,949 25,165 52,446 32,652 16,960
Unearned premiums (see note ii) 243,570 203,792 658,567 243,570 203,792 658,567
Short term insurance contract -
Claims incurred but not reported
(IBNR) (see note iii) 1,047,146 475,896 493,872 1,047,146 475,896 493,872
Liability on annuity fund (see note iv) 30,092,990 27,264,774 22,493,885 30,092,990 27,264,774 22,493,885
Liability on long term insurance
contract - Life fund
4,942,301 3,622,183 2,949,291 3,100,216 2,127,411 2,111,321
Total Insurance liabilities (Gross) 36,378,453 31,611,594 26,620,780 34,536,368 30,104,525 25,774,605
Current 1,343,162 4,990,814 4,431,843 4,329,920
Non-current 35,035,291 26,620,780 30,104,525 25,774,605
36,378,453 31,611,594 34,536,368 30,104,525

African Alliance Insurance Plc
Consolidated and Separate Financial Statements
For the year ended 31 December 2017
NOTE TO THE FINANCIAL STATEMENTS
121
Group Company
31-Dec-17
31-Dec-16 1-Jan-16 31-Dec-17
31-Dec-16
1-Jan-16
N’000
N’000 N’000 N’000
N’000
N’000
Recoverable from reinsurers
Claims reported and loss adjustment
expenses - -
Unearned premiums 5,991 5,531 2,629 5,991 5,531 2,629
IBNR on Short term insurance contract 47,726 71,241 31,710 47,726 71,241 31,710
Total reinsurers’ share of insurance
liabilities 53,717 76,772 34,339 53,717 76,772 34,339
NET
Claims reported and loss adjustment
expenses 52,446 44,949 25,165 52,446 32,652 16,960
Unearned premiums 237,579 198,261 655,938 237,579 198,261 655,938
Claims incurred but not reported on
Short term insurance contract 999,420 404,655 462,162 999,420 404,655 462,162
Liability on annuity fund 30,092,990 27,264,774 22,493,885 30,092,990 27,264,774 22,493,885
Liability on long term insurance
contract (Life fund )
4,942,301 3,622,183 2,949,291 3,100,216 2,127,411 2,111,321
Total Insurance liabilities (Net) 36,324,736 31,534,822 26,586,441 34,482,651 30,027,753
25,740,266
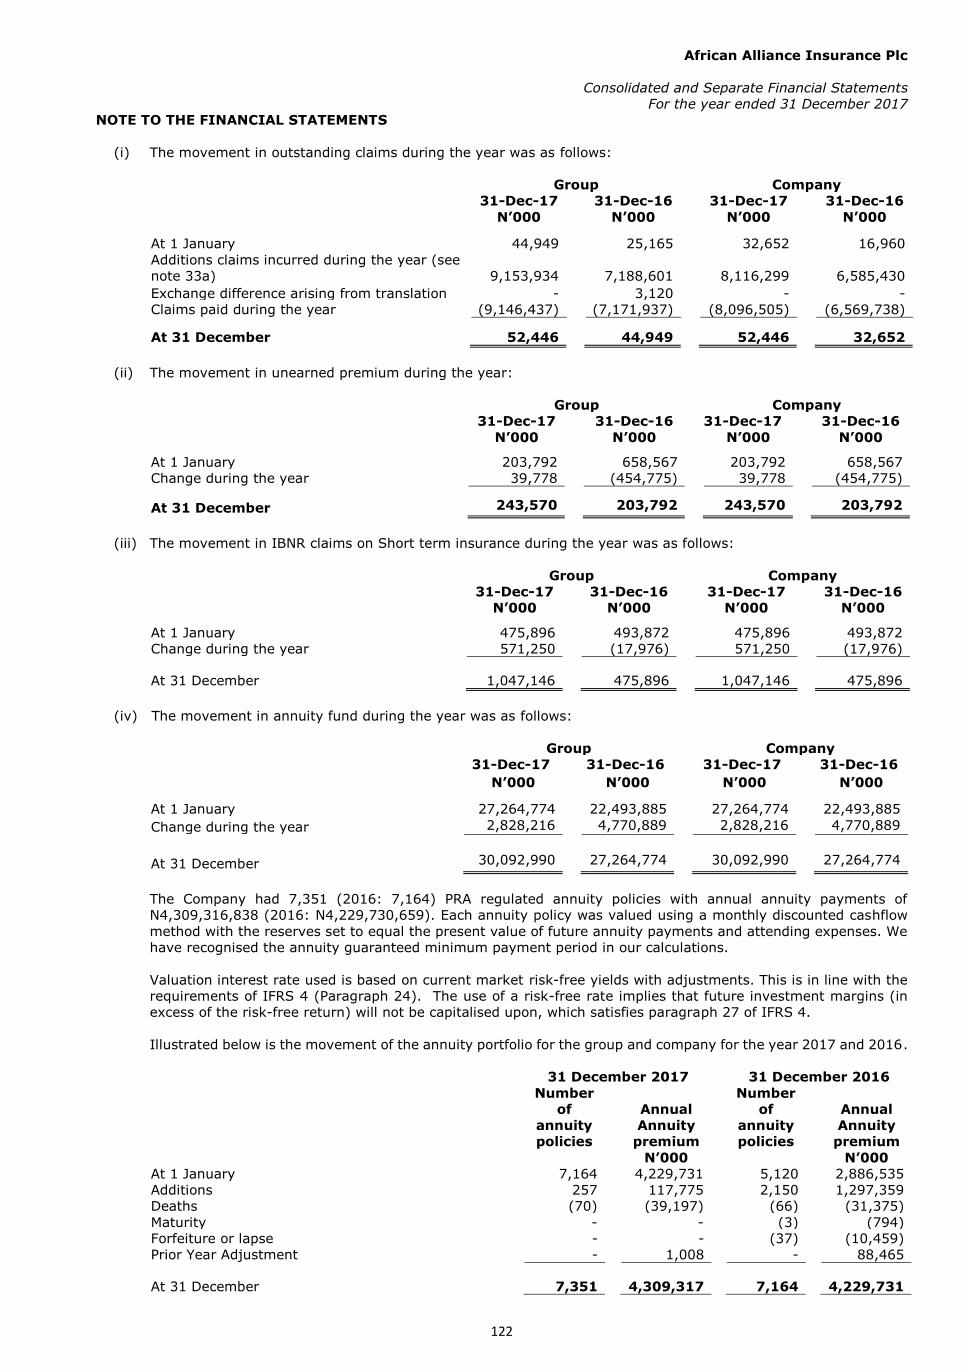
African Alliance Insurance Plc
Consolidated and Separate Financial Statements
For the year ended 31 December 2017
NOTE TO THE FINANCIAL STATEMENTS
122
(i) The movement in outstanding claims during the year was as follows:
Group Company
31-Dec-17
31-Dec-16 31-Dec-17
31-Dec-16
N’000
N’000 N’000
N’000
At 1 January 44,949 25,165 32,652 16,960
Additions claims incurred during the year (see
note 33a) 9,153,934 7,188,601 8,116,299 6,585,430
Exchange difference arising from translation - 3,120 - -
Claims paid during the year (9,146,437) (7,171,937) (8,096,505) (6,569,738)
At 31 December 52,446 44,949 52,446 32,652
(ii) The movement in unearned premium during the year:
Group Company
31-Dec-17
31-Dec-16 31-Dec-17
31-Dec-16
N’000
N’000 N’000
N’000
At 1 January 203,792 658,567 203,792 658,567
Change during the year 39,778 (454,775) 39,778 (454,775)
At 31 December 243,570 203,792 243,570 203,792
(iii) The movement in IBNR claims on Short term insurance during the year was as follows:
Group Company
31-Dec-17
31-Dec-16 31-Dec-17
31-Dec-16
N’000 N’000 N’000
N’000
At 1 January 475,896 493,872 475,896 493,872
Change during the year 571,250 (17,976) 571,250 (17,976)
At 31 December 1,047,146 475,896 1,047,146 475,896
(iv) The movement in annuity fund during the year was as follows:
Group Company
31-Dec-17
31-Dec-16 31-Dec-17
31-Dec-16
N’000
N’000 N’000
N’000
At 1 January 27,264,774 22,493,885 27,264,774 22,493,885
Change during the year 2,828,216 4,770,889 2,828,216 4,770,889
At 31 December 30,092,990
27,264,774
30,092,990
27,264,774
The Company had 7,351 (2016: 7,164) PRA regulated annuity policies with annual annuity payments of
N4,309,316,838 (2016: N4,229,730,659). Each annuity policy was valued using a monthly discounted cashflow
method with the reserves set to equal the present value of future annuity payments and attending expenses. We
have recognised the annuity guaranteed minimum payment period in our calculations.
Valuation interest rate used is based on current market risk-free yields with adjustments. This is in line with the
requirements of IFRS 4 (Paragraph 24). The use of a risk-free rate implies that future investment margins (in
excess of the risk-free return) will not be capitalised upon, which satisfies paragraph 27 of IFRS 4.
Illustrated below is the movement of the annuity portfolio for the group and company for the year 2017 and 2016.
31 December 2017 31 December 2016
Number
of
annuity
policies
Annual
Annuity
premium
Number
of
annuity
policies
Annual
Annuity
premium
N’000 N’000
At 1 January 7,164 4,229,731 5,120 2,886,535
Additions 257 117,775 2,150 1,297,359
Deaths (70) (39,197) (66) (31,375)
Maturity - - (3) (794)
Forfeiture or lapse - - (37) (10,459)
Prior Year Adjustment - 1,008 - 88,465
At 31 December 7,351 4,309,317 7,164 4,229,731
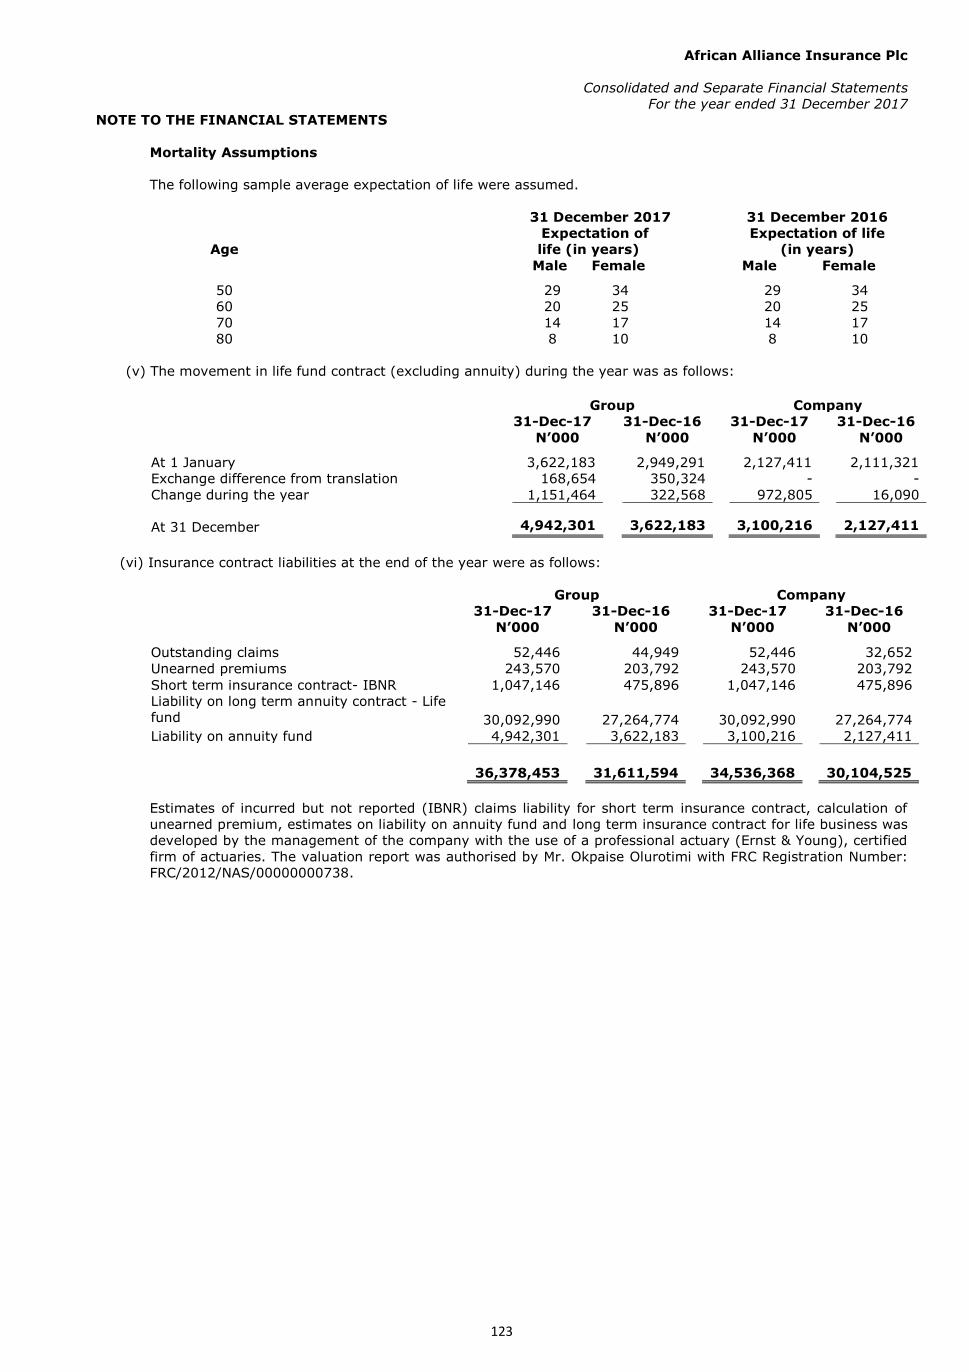
African Alliance Insurance Plc
Consolidated and Separate Financial Statements
For the year ended 31 December 2017
NOTE TO THE FINANCIAL STATEMENTS
123
Mortality Assumptions
The following sample average expectation of life were assumed.
31 December 2017 31 December 2016
Age
Expectation of
life (in years)
Expectation of life
(in years)
Male Female Male Female
50 29 34 29 34
60 20 25 20 25
70 14 17 14 17
80 8 10 8 10
(v) The movement in life fund contract (excluding annuity) during the year was as follows:
Group Company
31-Dec-17
31-Dec-16 31-Dec-17
31-Dec-16
N’000
N’000 N’000
N’000
At 1 January 3,622,183 2,949,291 2,127,411 2,111,321
Exchange difference from translation 168,654 350,324 - -
Change during the year 1,151,464 322,568 972,805 16,090
At 31 December 4,942,301 3,622,183 3,100,216 2,127,411
(vi) Insurance contract liabilities at the end of the year were as follows:
Group Company
31-Dec-17
31-Dec-16 31-Dec-17
31-Dec-16
N’000
N’000 N’000
N’000
Outstanding claims 52,446 44,949 52,446 32,652
Unearned premiums 243,570 203,792 243,570 203,792
Short term insurance contract- IBNR 1,047,146 475,896 1,047,146 475,896
Liability on long term annuity contract - Life
fund 30,092,990 27,264,774 30,092,990 27,264,774
Liability on annuity fund 4,942,301 3,622,183 3,100,216 2,127,411
36,378,453 31,611,594 34,536,368 30,104,525
Estimates of incurred but not reported (IBNR) claims liability for short term insurance contract, calculation of
unearned premium, estimates on liability on annuity fund and long term insurance contract for life business was
developed by the management of the company with the use of a professional actuary (Ernst & Young), certified
firm of actuaries. The valuation report was authorised by Mr. Okpaise Olurotimi with FRC Registration Number:
FRC/2012/NAS/00000000738.

African Alliance Insurance Plc
Consolidated and Separate Financial Statements
For the year ended 31 December 2017
NOTE TO THE FINANCIAL STATEMENTS
124
19 Investment contract liabilities
The investment contract liabilities comprise interest-linked guaranteed investment funds. The movement in the investment contract
liabilities is shown below:
Group Company
31-Dec-17
31-Dec-16 1-Jan-16 31-Dec-17
31-Dec-16 1-Jan-16
N’000
N’000 N’000 N’000
N’000 N’000
At 1 January 5,411,398 4,408,274 4,446,262 5,411,398 4,408,274 4,446,262
(Excess)/Shortfall in deposit
administration (note 19.1) (59) 591,769 - (59) 591,769 -
Deposits received during the year 350,617 889,783 1,900,481 350,617 889,783 1,900,481
Withdrawals during the year (950,525) (597,962) (2,146,654) (950,525) (597,962) (2,146,654)
Guaranteed interest in the year 115,673 119,534 208,185 115,673 119,534 208,185
At 31 December 4,927,104 5,411,398 4,408,274 4,927,104 5,411,398 4,408,274
Non-current
4,927,104 5,411,398 4,408,274 4,927,104 5,411,398 4,408,274
Investment contract liabilities consist of group deposit administered funds and account balance of policy holders under investment linked
insurance funds. Movement in the relevant funds are detailed below
19.1 The excess/shortfall in deposit administration is as a result of errors in data after necessary reconciliation was done. The shortfall was
observed after necessary review by the actuaries and thus was adjusted for in statement of profit or loss.
Group Company
31-Dec-17
31-Dec-16 1-Jan-16 31-Dec-17
31-Dec-16 1-Jan-16
N’000
N’000 N’000 N’000
N’000 N’000
19.2 Liabilities on administered deposits
At 1 January 4,074,884 3,528,836 3,682,841 4,074,884 3,528,836 3,682,841
(Excess)/Shortfall in deposit
administration (note 19.1) (59) 591,769 - (59) 591,769 -
Deposits received during the year 19,580 204,020 1,083,876 19,580 204,020 1,083,876
Withdrawals during the year (944,101) (354,301) (1,429,803) (944,101) (354,301) (1,429,803)
Guaranteed interest in the year 92,111 104,560 191,922 92,111 104,560 191,922
At 31 December 3,242,415 4,074,884 3,528,836 3,242,415 4,074,884 3,528,836
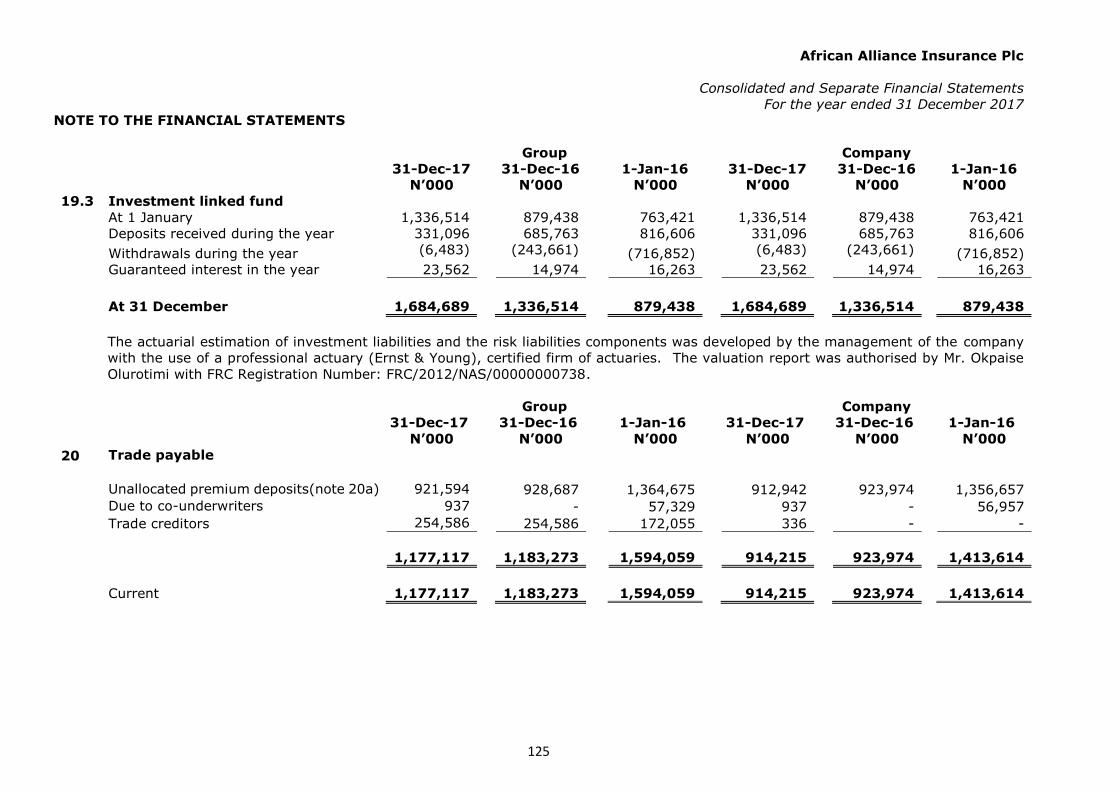
African Alliance Insurance Plc
Consolidated and Separate Financial Statements
For the year ended 31 December 2017
NOTE TO THE FINANCIAL STATEMENTS
125
Group Company
31-Dec-17 31-Dec-16 1-Jan-16 31-Dec-17 31-Dec-16 1-Jan-16
N’000 N’000 N’000 N’000 N’000 N’000
19.3 Investment linked fund
At 1 January 1,336,514 879,438 763,421 1,336,514 879,438 763,421
Deposits received during the year 331,096 685,763 816,606 331,096 685,763 816,606
Withdrawals during the year (6,483)
(243,661)
(716,852) (6,483)
(243,661)
(716,852)
Guaranteed interest in the year 23,562 14,974 16,263 23,562 14,974 16,263
At 31 December 1,684,689 1,336,514 879,438 1,684,689 1,336,514 879,438
The actuarial estimation of investment liabilities and the risk liabilities components was developed by the management of the company
with the use of a professional actuary (Ernst & Young), certified firm of actuaries. The valuation report was authorised by Mr. Okpaise
Olurotimi with FRC Registration Number: FRC/2012/NAS/00000000738.
Group Company
31-Dec-17 31-Dec-16 1-Jan-16 31-Dec-17 31-Dec-16 1-Jan-16
N’000 N’000 N’000 N’000 N’000 N’000
20 Trade payable
Unallocated premium deposits(note 20a) 921,594
928,687 1,364,675 912,942 923,974 1,356,657
Due to co-underwriters
937
- 57,329 937 - 56,957
Trade creditors
254,586
254,586 172,055 336 - -
1,177,117
1,183,273 1,594,059 914,215 923,974 1,413,614
Current
1,177,117
1,183,273 1,594,059 914,215 923,974 1,413,614
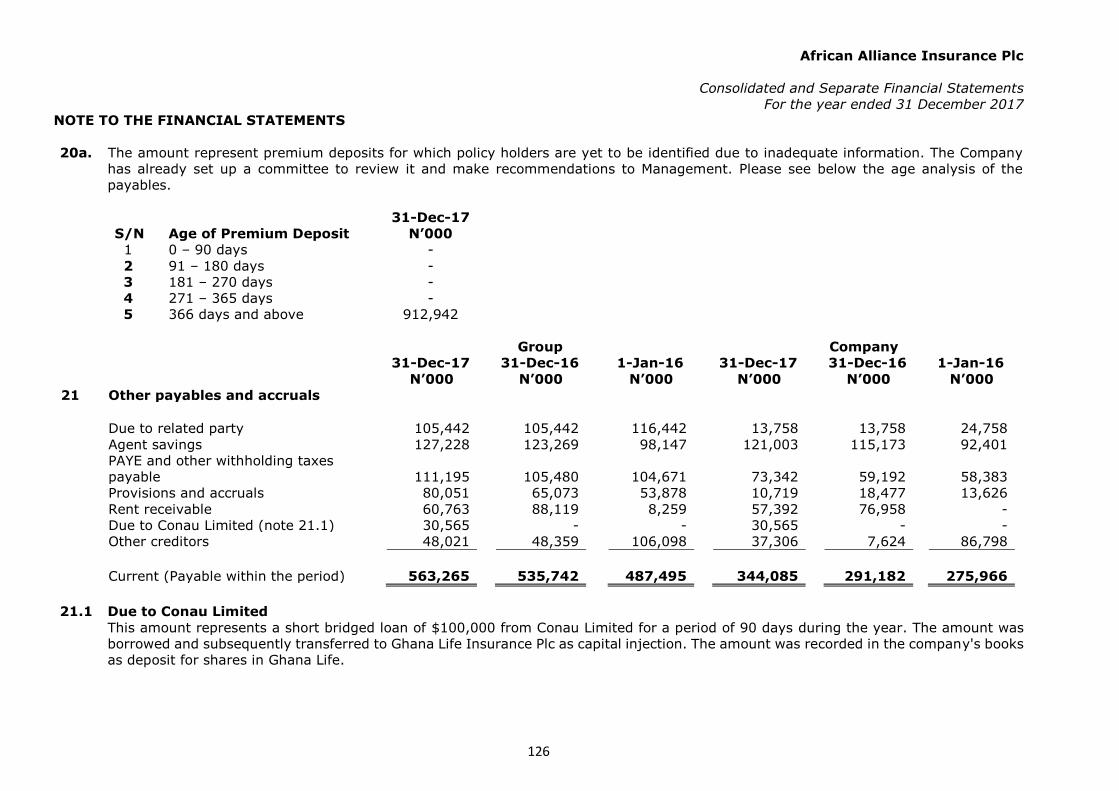
African Alliance Insurance Plc
Consolidated and Separate Financial Statements
For the year ended 31 December 2017
NOTE TO THE FINANCIAL STATEMENTS
126
20a. The amount represent premium deposits for which policy holders are yet to be identified due to inadequate information. The Company
has already set up a committee to review it and make recommendations to Management. Please see below the age analysis of the
payables.
S/N Age of Premium Deposit
31-Dec-17
N’000
1 0 – 90 days -
2 91 – 180 days -
3 181 – 270 days -
4 271 – 365 days -
5 366 days and above 912,942
Group Company
31-Dec-17 31-Dec-16 1-Jan-16 31-Dec-17 31-Dec-16 1-Jan-16
N’000 N’000 N’000 N’000 N’000 N’000
21 Other payables and accruals
Due to related party 105,442 105,442 116,442 13,758 13,758 24,758
Agent savings 127,228 123,269 98,147 121,003 115,173 92,401
PAYE and other withholding taxes
payable
111,195
105,480 104,671
73,342
59,192 58,383
Provisions and accruals 80,051 65,073 53,878 10,719 18,477 13,626
Rent receivable 60,763 88,119 8,259 57,392 76,958 -
Due to Conau Limited (note 21.1) 30,565 - - 30,565 - -
Other creditors 48,021 48,359 106,098 37,306 7,624 86,798
Current (Payable within the period) 563,265 535,742 487,495 344,085 291,182 275,966
21.1 Due to Conau Limited
This amount represents a short bridged loan of $100,000 from Conau Limited for a period of 90 days during the year. The amount was
borrowed and subsequently transferred to Ghana Life Insurance Plc as capital injection. The amount was recorded in the company's books
as deposit for shares in Ghana Life.

African Alliance Insurance Plc
Consolidated and Separate Financial Statements
For the year ended 31 December 2017
NOTE TO THE FINANCIAL STATEMENTS
127
Group Company
31-Dec-17 31-Dec-16 1-Jan-16 31-Dec-17 31-Dec-16 1-Jan-16
N’000 N’000 N’000 N’000 N’000 N’000
22.1 Retirement benefit asset (7,063) - - (7,063) - -
22.2 Retirement benefit liabilities
Staff pension scheme 29,335 27,857 40,095 29,335 7,937 20,175
Staff defined benefit plan - 31,687 32,283 - 31,687 32,283
29,335 59,544 72,378 29,335 39,624 52,458
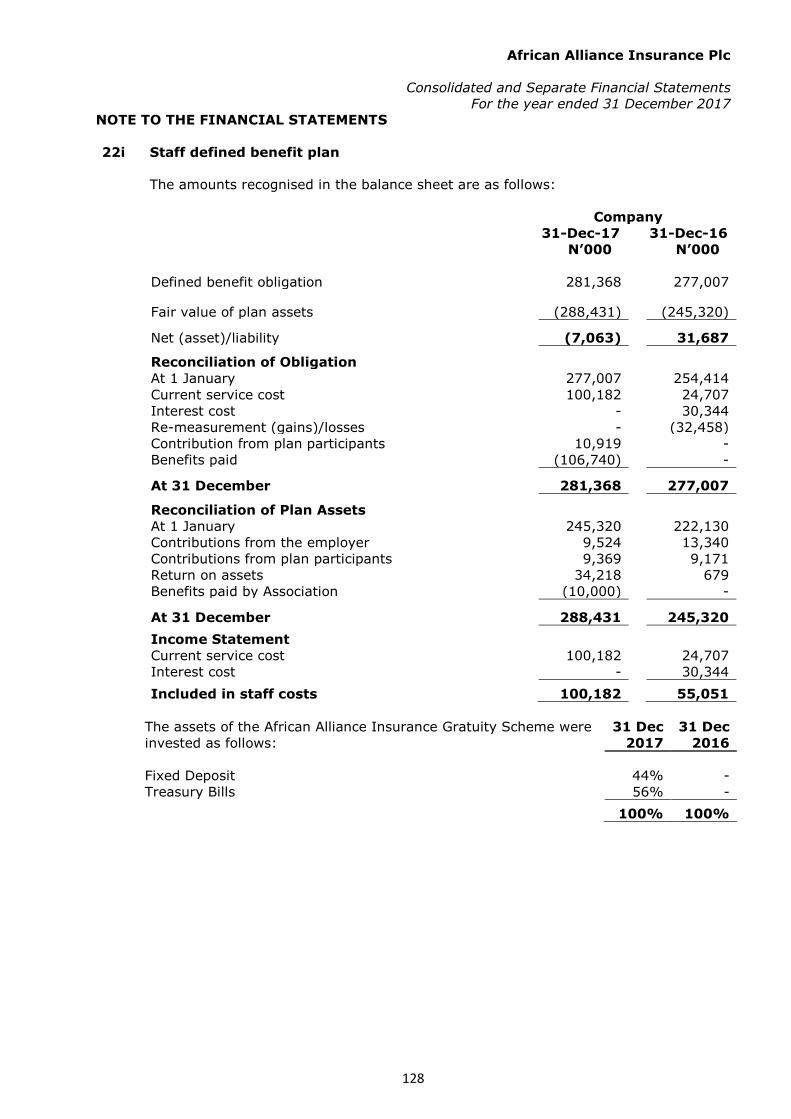
African Alliance Insurance Plc
Consolidated and Separate Financial Statements
For the year ended 31 December 2017
NOTE TO THE FINANCIAL STATEMENTS
128
22i Staff defined benefit plan
The amounts recognised in the balance sheet are as follows:
Company
31-Dec-17 31-Dec-16
N’000 N’000
Defined benefit obligation
281,368 277,007
Fair value of plan assets
(288,431)
(245,320)
Net (asset)/liability
(7,063) 31,687
Reconciliation of Obligation
At 1 January 277,007 254,414
Current service cost
100,182 24,707
Interest cost
- 30,344
Re-measurement (gains)/losses - (32,458)
Contribution from plan participants
10,919 -
Benefits paid (106,740) -
At 31 December
281,368 277,007
Reconciliation of Plan Assets
At 1 January 245,320 222,130
Contributions from the employer 9,524 13,340
Contributions from plan participants 9,369 9,171
Return on assets 34,218 679
Benefits paid by Association (10,000) -
At 31 December 288,431 245,320
Income Statement
Current service cost 100,182 24,707
Interest cost - 30,344
Included in staff costs 100,182 55,051
The assets of the African Alliance Insurance Gratuity Scheme were
invested as follows:
31 Dec
2017
31 Dec
2016
Fixed Deposit 44% -
Treasury Bills 56% -
100% 100%
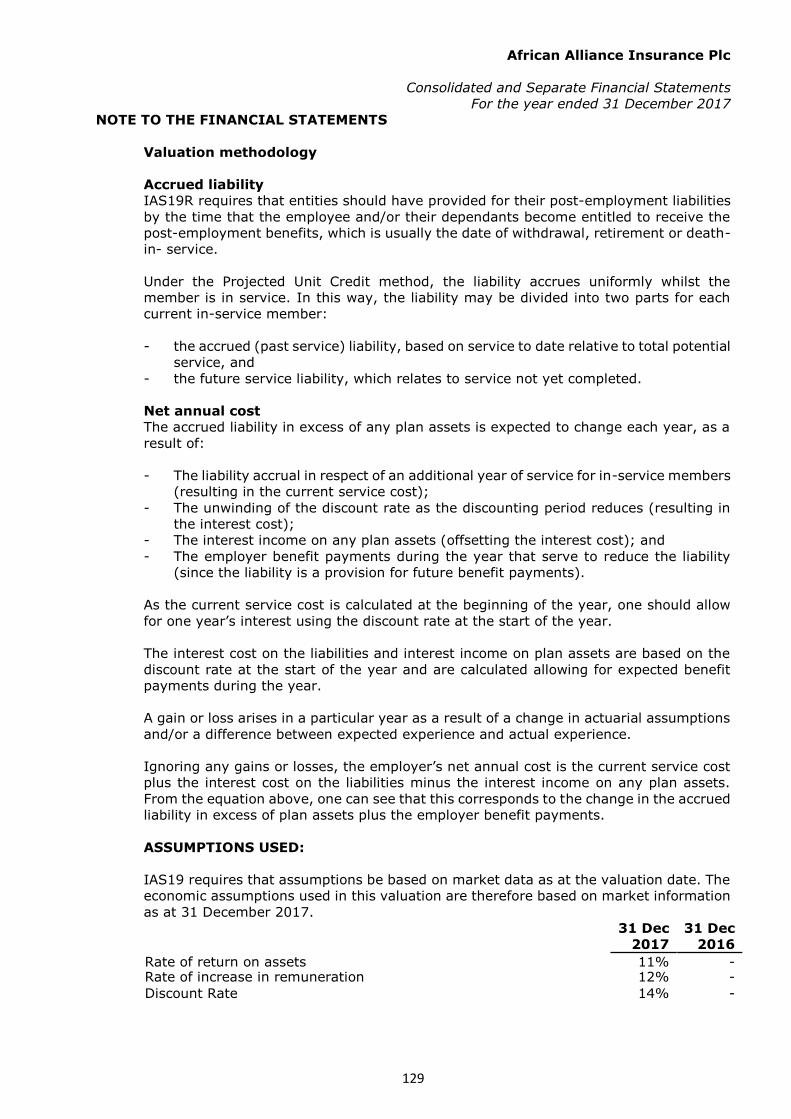
African Alliance Insurance Plc
Consolidated and Separate Financial Statements
For the year ended 31 December 2017
NOTE TO THE FINANCIAL STATEMENTS
129
Valuation methodology
Accrued liability
IAS19R requires that entities should have provided for their post-employment liabilities
by the time that the employee and/or their dependants become entitled to receive the
post-employment benefits, which is usually the date of withdrawal, retirement or death-
in- service.
Under the Projected Unit Credit method, the liability accrues uniformly whilst the
member is in service. In this way, the liability may be divided into two parts for each
current in-service member:
- the accrued (past service) liability, based on service to date relative to total potential
service, and
- the future service liability, which relates to service not yet completed.
Net annual cost
The accrued liability in excess of any plan assets is expected to change each year, as a
result of:
- The liability accrual in respect of an additional year of service for in-service members
(resulting in the current service cost);
- The unwinding of the discount rate as the discounting period reduces (resulting in
the interest cost);
- The interest income on any plan assets (offsetting the interest cost); and
- The employer benefit payments during the year that serve to reduce the liability
(since the liability is a provision for future benefit payments).
As the current service cost is calculated at the beginning of the year, one should allow
for one year’s interest using the discount rate at the start of the year.
The interest cost on the liabilities and interest income on plan assets are based on the
discount rate at the start of the year and are calculated allowing for expected benefit
payments during the year.
A gain or loss arises in a particular year as a result of a change in actuarial assumptions
and/or a difference between expected experience and actual experience.
Ignoring any gains or losses, the employer’s net annual cost is the current service cost
plus the interest cost on the liabilities minus the interest income on any plan assets.
From the equation above, one can see that this corresponds to the change in the accrued
liability in excess of plan assets plus the employer benefit payments.
ASSUMPTIONS USED:
IAS19 requires that assumptions be based on market data as at the valuation date. The
economic assumptions used in this valuation are therefore based on market information
as at 31 December 2017.
31 Dec
2017
31 Dec
2016
Rate of return on assets 11% -
Rate of increase in remuneration 12% -
Discount Rate 14% -
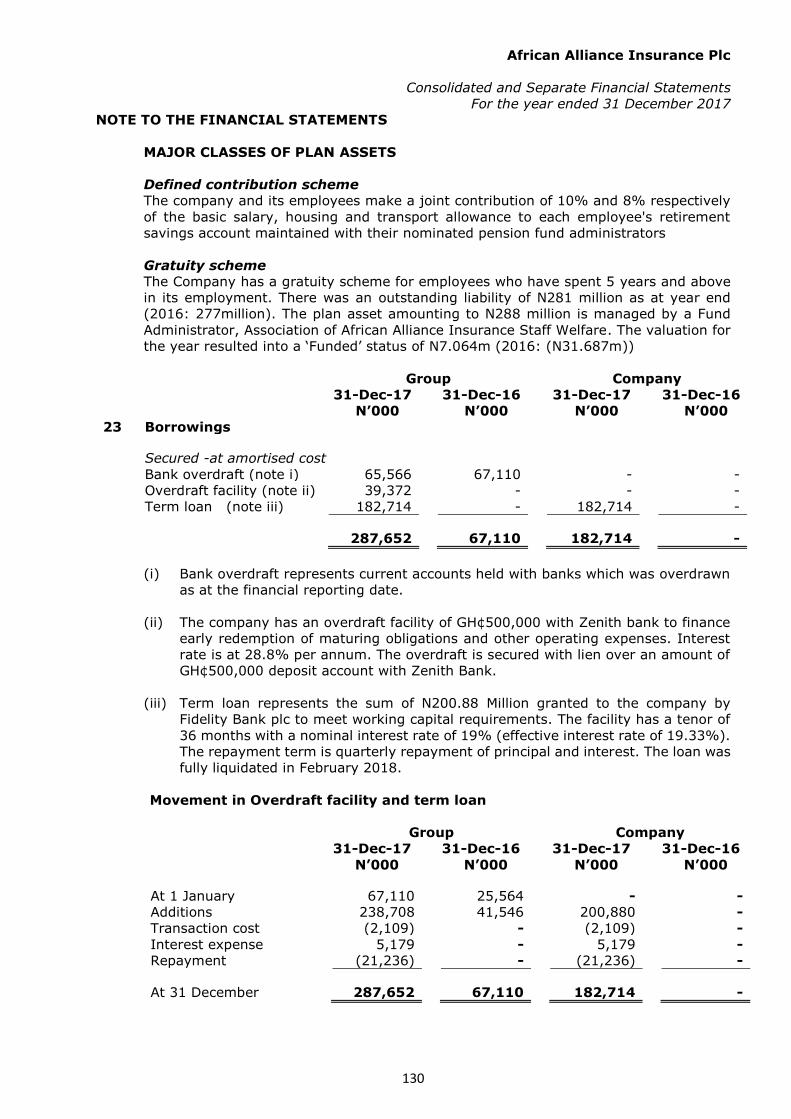
African Alliance Insurance Plc
Consolidated and Separate Financial Statements
For the year ended 31 December 2017
NOTE TO THE FINANCIAL STATEMENTS
130
MAJOR CLASSES OF PLAN ASSETS
Defined contribution scheme
The company and its employees make a joint contribution of 10% and 8% respectively
of the basic salary, housing and transport allowance to each employee's retirement
savings account maintained with their nominated pension fund administrators
Gratuity scheme
The Company has a gratuity scheme for employees who have spent 5 years and above
in its employment. There was an outstanding liability of N281 million as at year end
(2016: 277million). The plan asset amounting to N288 million is managed by a Fund
Administrator, Association of African Alliance Insurance Staff Welfare. The valuation for
the year resulted into a ‘Funded’ status of N7.064m (2016: (N31.687m))
Group Company
31-Dec-17
31-Dec-16 31-Dec-17
31-Dec-16
N’000
N’000 N’000
N’000
23 Borrowings
Secured -at amortised cost
Bank overdraft (note i) 65,566 67,110 - -
Overdraft facility (note ii) 39,372 - - -
Term loan (note iii) 182,714 - 182,714 -
287,652 67,110 182,714 -
(i) Bank overdraft represents current accounts held with banks which was overdrawn
as at the financial reporting date.
(ii) The company has an overdraft facility of GH¢500,000 with Zenith bank to finance
early redemption of maturing obligations and other operating expenses. Interest
rate is at 28.8% per annum. The overdraft is secured with lien over an amount of
GH¢500,000 deposit account with Zenith Bank.
(iii) Term loan represents the sum of N200.88 Million granted to the company by
Fidelity Bank plc to meet working capital requirements. The facility has a tenor of
36 months with a nominal interest rate of 19% (effective interest rate of 19.33%).
The repayment term is quarterly repayment of principal and interest. The loan was
fully liquidated in February 2018.
Movement in Overdraft facility and term loan
Group Company
31-Dec-17
31-Dec-16 31-Dec-17
31-Dec-16
N’000
N’000 N’000
N’000
At 1 January 67,110
25,564 -
-
Additions 238,708
41,546 200,880
-
Transaction cost (2,109)
- (2,109)
-
Interest expense 5,179
- 5,179
-
Repayment (21,236)
- (21,236)
-
At 31 December 287,652
67,110 182,714
-

African Alliance Insurance Plc
Consolidated and Separate Financial Statements
For the year ended 31 December 2017
NOTE TO THE FINANCIAL STATEMENTS
131
24 Tax payable Group Company
31-Dec-17 31-Dec-16 1-Jan-16 31-Dec-17 31-Dec-16 1-Jan-16
N’000 N’000 N’000 N’000 N’000 N’000
Company income tax payable:
At 1 January 363,544 294,254 210,198 285,240 224,970 149,069
Charge to profit and loss 278,885 94,825 103,924 271,172 90,350 94,696
Transfer of liabilities upon liquidation - - - 39,104 - -
Foreign exchange difference arising from translation 1,826 4,545 (1,073) - - -
Tax paid in the year (50,231) (30,080) (18,795) (50,231) (30,080) (18,795)
At 31 December 594,024 363,544 294,254 545,285 285,240 224,970
Current 594,024 363,544 294,254 545,285 285,240 224,970
Deferred income taxes are calculated an all temporary differences under the liability method may the enacted tax rate of 30% (2016:30%).
Group Company
31-Dec-17 31-Dec-16 1-Jan-16 31-Dec-17 31-Dec-16 1-Jan-16
N’000 N’000 N’000 N’000 N’000 N’000
25 Deferred tax liability
The analysis of deferred tax liabilities is as follows:
Deferred tax liability to be incurred within 12 months -
Deferred tax liability to be incurred after more than 12months 384,874 923,669 659,904 92,107 695,696 515,418
384,874
923,669 659,904 92,107 695,696 515,418
The movement on the deferred tax liabilities account is as follows:
At 1 January 953,540 659,904 582,566 695,696 515,418 449,593
Tax charge recognised in other comprehensive income 38,675 - 8,621 - - -
Transfer of liabilities upon liquidation of subsidiaries - - - 974 - -
Foreign exchange difference arising from translation 25,970 60,113 (11,864) - - -
Income statement charge (note 42) (633,311) 233,523 80,581 (604,563) 180,278 65,825
At 31 December 384,874 953,540 659,904 92,107 695,696 515,418
Non- current 384,874 953,540 659,904 92,107 695,696 515,418
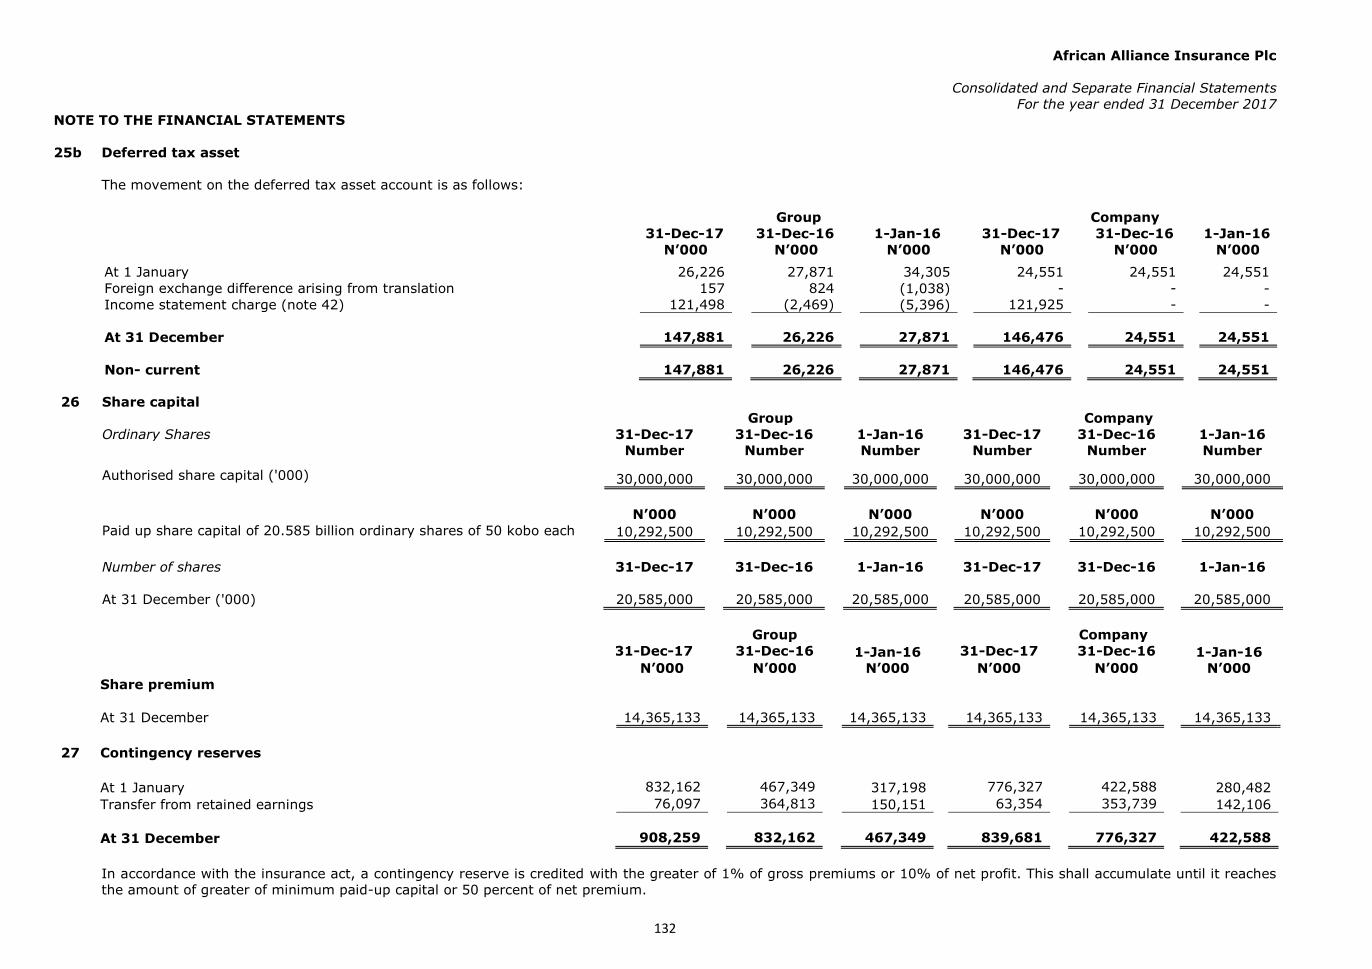
African Alliance Insurance Plc
Consolidated and Separate Financial Statements
For the year ended 31 December 2017
NOTE TO THE FINANCIAL STATEMENTS
132
25b Deferred tax asset
The movement on the deferred tax asset account is as follows:
Group Company
31-Dec-17 31-Dec-16 1-Jan-16 31-Dec-17 31-Dec-16 1-Jan-16
N’000 N’000 N’000 N’000 N’000 N’000
At 1 January 26,226 27,871 34,305 24,551 24,551 24,551
Foreign exchange difference arising from translation 157 824 (1,038) - - -
Income statement charge (note 42) 121,498 (2,469) (5,396) 121,925 - -
At 31 December 147,881 26,226 27,871 146,476 24,551 24,551
Non- current 147,881 26,226 27,871 146,476 24,551 24,551
26 Share capital Group Company
Ordinary Shares 31-Dec-17
31-Dec-16 1-Jan-16 31-Dec-17
31-Dec-16
1-Jan-16
Number
Number Number Number
Number
Number
Authorised share capital ('000) 30,000,000
30,000,000 30,000,000 30,000,000
30,000,000
30,000,000
N’000
N’000 N’000 N’000
N’000
N’000
Paid up share capital of 20.585 billion ordinary shares of 50 kobo each 10,292,500 10,292,500 10,292,500 10,292,500 10,292,500 10,292,500
Number of shares
31-Dec-17
31-Dec-16 1-Jan-16 31-Dec-17
31-Dec-16
1-Jan-16
At 31 December ('000)
20,585,000
20,585,000
20,585,000 20,585,000
20,585,000
20,585,000
Group Company
31-Dec-17
31-Dec-16 1-Jan-16 31-Dec-17
31-Dec-16
1-Jan-16
N’000
N’000 N’000 N’000
N’000 N’000
Share premium
At 31 December 14,365,133 14,365,133 14,365,133 14,365,133 14,365,133 14,365,133
27 Contingency reserves
At 1 January 832,162
467,349 317,198 776,327
422,588 280,482
Transfer from retained earnings 76,097
364,813 150,151 63,354
353,739 142,106
At 31 December 908,259
832,162 467,349 839,681
776,327 422,588
In accordance with the insurance act, a contingency reserve is credited with the greater of 1% of gross premiums or 10% of net profit. This shall accumulate until it reaches
the amount of greater of minimum paid-up capital or 50 percent of net premium.
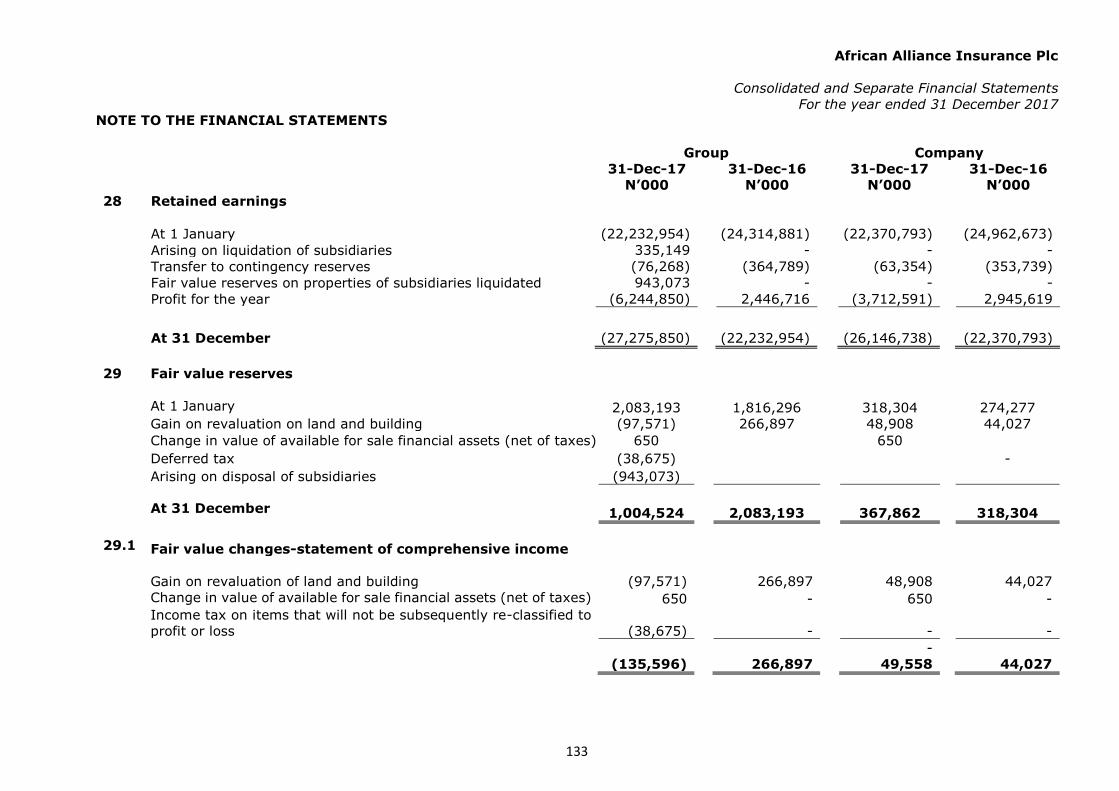
African Alliance Insurance Plc
Consolidated and Separate Financial Statements
For the year ended 31 December 2017
NOTE TO THE FINANCIAL STATEMENTS
133
Group Company
31-Dec-17
31-Dec-16 31-Dec-17
31-Dec-16
N’000
N’000 N’000
N’000 28 Retained earnings
At 1 January (22,232,954)
(24,314,881) (22,370,793)
(24,962,673)
Arising on liquidation of subsidiaries 335,149
- -
-
Transfer to contingency reserves (76,268)
(364,789) (63,354)
(353,739)
Fair value reserves on properties of subsidiaries liquidated 943,073
943,073
- -
-
Profit for the year
(6,244,850)
2,446,716 (3,712,591)
2,945,619
At 31 December (27,275,850)
(22,232,954)
)
(26,146,738)
(22,370,793)
29 Fair value reserves
At 1 January 2,083,193 1,816,296 318,304 274,277 Gain on revaluation on land and building (97,571) 266,897 48,908 44,027 Change in value of available for sale financial assets (net of taxes) 650 650 Deferred tax
(38,675) -
Arising on disposal of subsidiaries
(943,073)
At 31 December 1,004,524 2,083,193 367,862 318,304
29.1 Fair value changes-statement of comprehensive income
Gain on revaluation of land and building (97,571) 266,897 48,908 44,027 Change in value of available for sale financial assets (net of taxes) 650 - 650 - Income tax on items that will not be subsequently re-classified to
profit or loss
(38,675)
- - -
- (135,596) 266,897 49,558 44,027
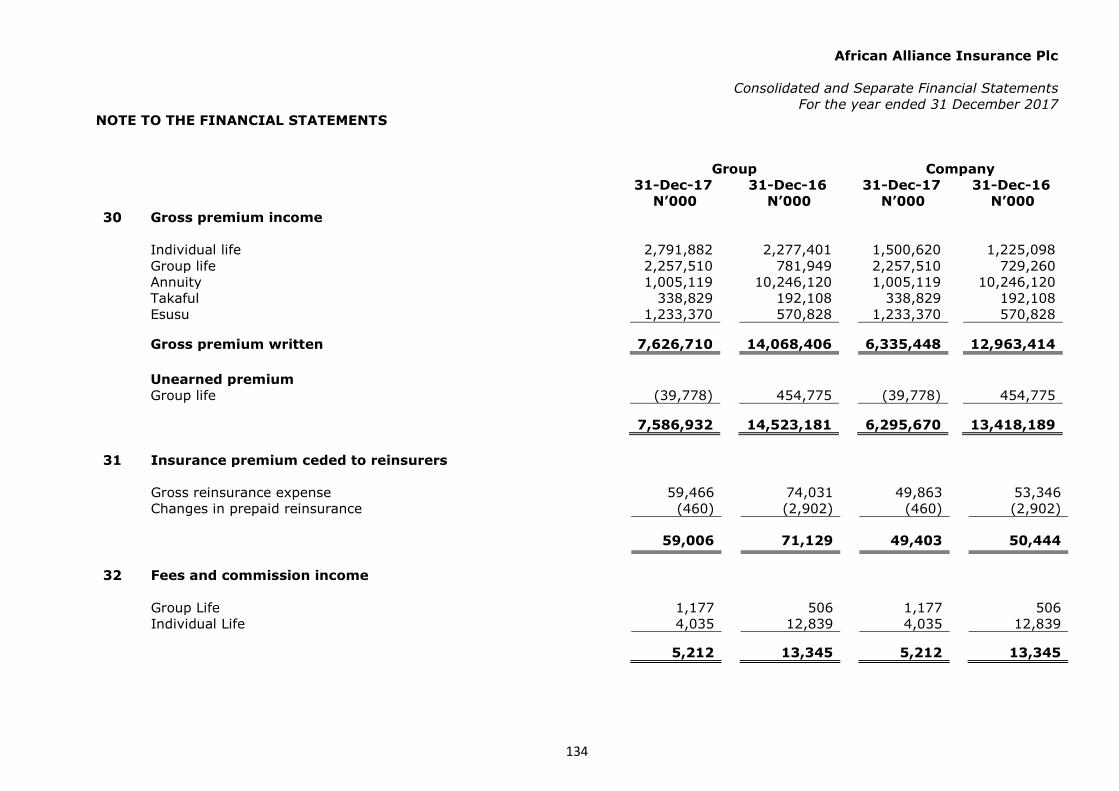
African Alliance Insurance Plc
Consolidated and Separate Financial Statements
For the year ended 31 December 2017
NOTE TO THE FINANCIAL STATEMENTS
134
Group Company
31-Dec-17
31-Dec-16 31-Dec-17
31-Dec-16
N’000
N’000 N’000
N’000
30 Gross premium income
Individual life
2,791,882
2,277,401
1,500,620
1,225,098 Group life
2,257,510
781,949
2,257,510
729,260 Annuity
1,005,119
10,246,120
1,005,119
10,246,120 Takaful
338,829
192,108
338,829
192,108 Esusu
1,233,370
570,828
1,233,370
570,828
Gross premium written
7,626,710
14,068,406
6,335,448
12,963,414
Unearned premium
Group life
(39,778)
454,775
(39,778)
454,775
7,586,932
14,523,181
6,295,670
13,418,189
31 Insurance premium ceded to reinsurers
Gross reinsurance expense 59,466
74,031
49,863
53,346
Changes in prepaid reinsurance (460)
(2,902)
(460)
(2,902)
59,006
71,129 49,403
50,444
32 Fees and commission income
Group Life
1,177
506 1,177
506 Individual Life
4,035
12,839 4,035
12,839
5,212 13,345 5,212 13,345
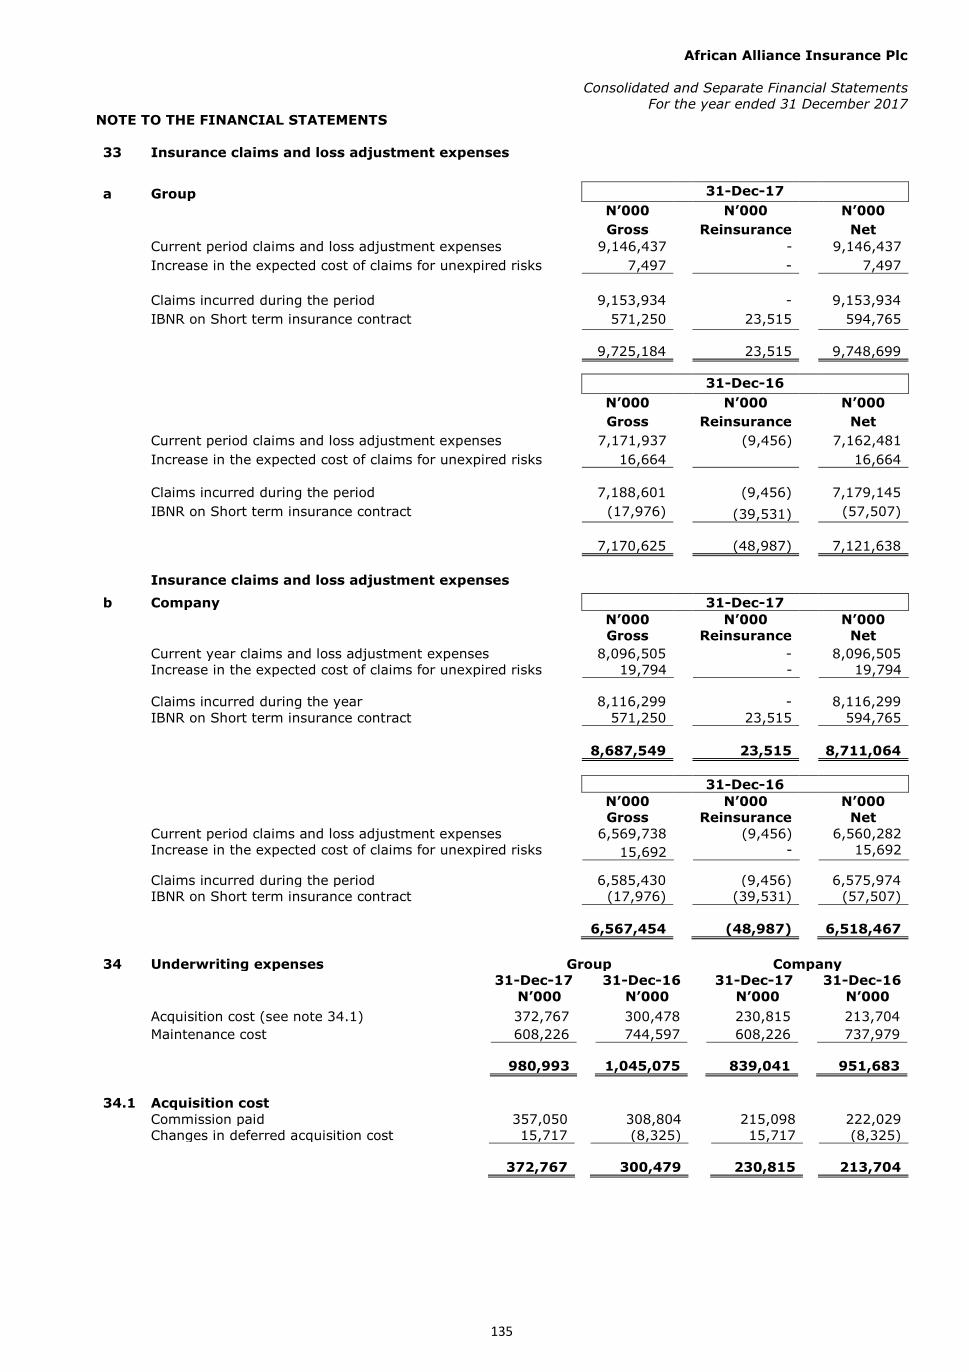
African Alliance Insurance Plc
Consolidated and Separate Financial Statements
For the year ended 31 December 2017
NOTE TO THE FINANCIAL STATEMENTS
135
33 Insurance claims and loss adjustment expenses
a Group
31-Dec-17
N’000
N’000
N’000 Gross
Reinsurance
Net
Current period claims and loss adjustment expenses 9,146,437
-
9,146,437 Increase in the expected cost of claims for unexpired risks
7,497 - 7,497
Claims incurred during the period
9,153,934
-
9,153,934
IBNR on Short term insurance contract
571,250
23,515
594,765
9,725,184
23,515
9,748,699
31-Dec-16 N’000
N’000
N’000
Gross
Reinsurance
Net
Current period claims and loss adjustment expenses 7,171,937
(9,456)
7,162,481 Increase in the expected cost of claims for unexpired risks
16,664 16,664
Claims incurred during the period
7,188,601
(9,456)
7,179,145
IBNR on Short term insurance contract
(17,976)
(39,531)
(57,507)
7,170,625
(48,987)
7,121,638
Insurance claims and loss adjustment expenses
b Company
31-Dec-17 N’000
N’000
N’000
Gross
Reinsurance
Net Current year claims and loss adjustment expenses
8,096,505
-
8,096,505
Increase in the expected cost of claims for unexpired risks 19,794 - 19,794
Claims incurred during the year
8,116,299
-
8,116,299 IBNR on Short term insurance contract
571,250
23,515
594,765
8,687,549
23,515
8,711,064
31-Dec-16
N’000
N’000
N’000 Gross Reinsurance Net
Current period claims and loss adjustment expenses 6,569,738
(9,456)
6,560,282 Increase in the expected cost of claims for unexpired risks 15,692
-
15,692
Claims incurred during the period
6,585,430
(9,456)
6,575,974
IBNR on Short term insurance contract
(17,976)
(39,531)
(57,507)
6,567,454
(48,987)
6,518,467
34 Underwriting expenses Group Company 31-Dec-17
31-Dec-16 31-Dec-17
31-Dec-16
N’000
N’000
N’000
N’000
Acquisition cost (see note 34.1) 372,767 300,478 230,815 213,704 Maintenance cost
608,226 744,597 608,226 737,979
980,993 1,045,075 839,041 951,683
34.1 Acquisition cost
Commission paid 357,050 308,804 215,098 222,029
Changes in deferred acquisition cost 15,717 (8,325) 15,717 (8,325)
372,767 300,479 230,815 213,704
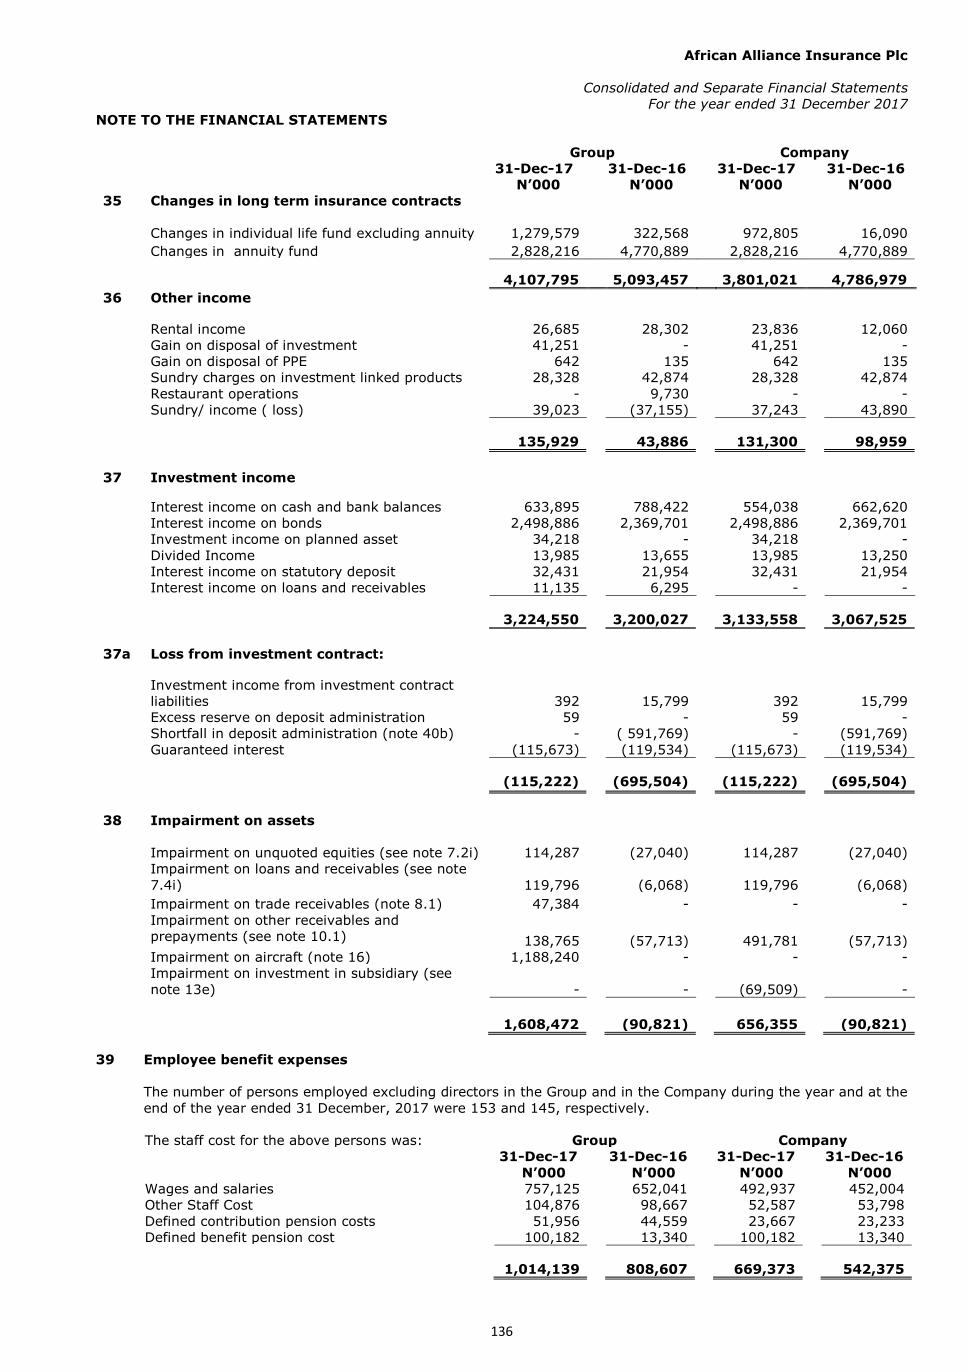
African Alliance Insurance Plc
Consolidated and Separate Financial Statements
For the year ended 31 December 2017
NOTE TO THE FINANCIAL STATEMENTS
136
Group Company
31-Dec-17
31-Dec-16 31-Dec-17
31-Dec-16 N’000
N’000 N’000
N’000
35 Changes in long term insurance contracts
Changes in individual life fund excluding annuity 1,279,579 322,568 972,805 16,090 Changes in annuity fund 2,828,216 4,770,889 2,828,216 4,770,889
4,107,795 5,093,457 3,801,021 4,786,979
36 Other income
Rental income
26,685
28,302
23,836
12,060 Gain on disposal of investment
41,251
-
41,251
-
Gain on disposal of PPE
642
135
642
135 Sundry charges on investment linked products 28,328
42,874
28,328
42,874
Restaurant operations
-
9,730
-
- Sundry/ income ( loss)
39,023
(37,155)
37,243
43,890
135,929
43,886
131,300
98,959
37 Investment income
Interest income on cash and bank balances 633,895 788,422 554,038 662,620 Interest income on bonds 2,498,886 2,369,701 2,498,886 2,369,701
Investment income on planned asset 34,218 - 34,218 - Divided Income 13,985 13,655 13,985 13,250 Interest income on statutory deposit 32,431 21,954 32,431 21,954 Interest income on loans and receivables 11,135 6,295 - -
3,224,550 3,200,027 3,133,558 3,067,525
37a Loss from investment contract:
Investment income from investment contract
liabilities 392 15,799 392 15,799 Excess reserve on deposit administration 59 - 59 - Shortfall in deposit administration (note 40b) - ( 591,769)
-
(591,769)
Guaranteed interest
(115,673)
(119,534)
(115,673)
(119,534)
(115,222)
(695,504)
(115,222)
(695,504)
38 Impairment on assets
Impairment on unquoted equities (see note 7.2i) 114,287 (27,040) 114,287 (27,040) Impairment on loans and receivables (see note
7.4i) 119,796 (6,068) 119,796 (6,068)
Impairment on trade receivables (note 8.1) 47,384 - - - Impairment on other receivables and
prepayments (see note 10.1) 138,765 (57,713) 491,781 (57,713)
Impairment on aircraft (note 16) 1,188,240 - - - Impairment on investment in subsidiary (see
note 13e) - - (69,509) -
1,608,472 (90,821) 656,355 (90,821)
39 Employee benefit expenses
The number of persons employed excluding directors in the Group and in the Company during the year and at the
end of the year ended 31 December, 2017 were 153 and 145, respectively.
The staff cost for the above persons was: Group Company 31-Dec-17
31-Dec-16 31-Dec-17
31-Dec-16
N’000
N’000 N’000
N’000 Wages and salaries
757,125
652,041
492,937
452,004 Other Staff Cost
104,876
98,667
52,587
53,798 Defined contribution pension costs
51,956
44,559
23,667
23,233 Defined benefit pension cost
100,182
13,340
100,182
13,340
1,014,139
808,607
669,373
542,375

African Alliance Insurance Plc
Consolidated and Separate Financial Statements
For the year ended 31 December 2017
NOTE TO THE FINANCIAL STATEMENTS
137
40 Other operating and administrative expenses
Group Company 31-Dec-17
31-Dec-16 31-Dec-17
31-Dec-16
N’000
N’000 N’000
N’000 Directors’ emoluments
56,056 109,095
27,875
85,150 Bank Charges
76,580 70,376
34,591
42,921 Auditors' remuneration
22,829 21,354
17,500
16,850 Depreciation
307,219 295,186
96,548
94,240 Amortisation
22,370 12,528
16,698
7,858 Consultancy expenses
109,613 85,451
91,139
73,866 Security
27,726 32,537
13,744
22,220 Rent and rates
80,075 79,560
65,792
62,870 General maintenance and running costs 209,553 173,947
117,094
104,205
Advert and Publicity
93,757 33,751
74,447
28,529 Telecommunications
27,084 26,215
15,554
20,015 Dues and Subscription
12,311 9,367
9,903
9,305 Travels and accommodation
253,931 121,988
222,186
86,416 Insurance supervision fees
141,066 131,760
132,000
123,584 Insurance expenses
20,170 15,926
14,648
11,694 Printing and stationeries
37,244 34,838
25,692
14,365 Industrial training fund
5,674 5,017
5,674
5,017 Entertainment
32,441 21,573
19,559
11,375 Regulatory levies
5,145 34,750
5,145
34,750
Penalties 4,060 - 4,060 - Lease
8,231 -
8,231
- Office ICT expenses
67,415 59,188
67,415
58,763 Donation
- 750
-
750 Office cleaning expenses
8,874 12,017
8,874
12,017 Medical expenses
13,333 8,603
1,773
1,839 Cost of sales restaurant
- 4,582
Other Administrative Expenses
33,057 33,693
22,791
27,654
1,675,814
1,434,052
1,118,933
956,253
40a Auditor's remuneration
The audit remuneration represents audit fee for the statutory audit for the year ended 31 December 2017. The
external auditor did not provide any non-audit service to the company
40b Shortfall in deposit administration
This amount represents shortfall observed in the 2016 financial statements due to the shortfall in deposit
administration after necessary reconciliation was done. The shortfall was observed after necessary review by the
actuaries and thus was corrected in the 2016 financial statements.
40c Contraventions
Nature of Contravention Penalties
N,000
Outstanding penalty for late submission to NAICOM 5
Penalty for late submission to Nigeria Stock Exchange 4,055
4,060
Group Company
31-Dec-17
31-Dec-16 31-Dec-17
31-Dec-16
N’000
N’000 N’000
N’000
41 Finance cost
Interest expense on borrowings 5,179 - 5,179 -
42 Income tax (credit)/expense
Current tax on profits for the year (note 24) 278,885 94,825 271,172 90,350
Deferred tax (credit)/charge for the year (note
25) (754,809) 235,992 (726,488) 180,278
(475,924) 330,817 (455,316) 270,628

African Alliance Insurance Plc
Consolidated and Separate Financial Statements
For the year ended 31 December 2017
NOTE TO THE FINANCIAL STATEMENTS
138
Group Company 31-Dec-17
31-Dec-16 31-Dec-17
31-Dec-16
N’000
N’000 N’000
N’000 Reconciliation of effective tax rate
(Loss)/Profit before tax (6,853,094) 2,774,855
(4,296,022)
3,216,247
Tax calculated using the domestic rate of
Corporate tax rate of 30% (2,055,928) 832,457
(1,288,807)
964,874 Effect of applying:
Income not subject to tax (1,814,362) (1,262,762)
(1,438,552)
(996,444)
Non-deductible expenses 3,661,855 421,901
2,727,359
31,570 Tax impact of loss not utilised 184,063 -
-
-
Capital allowances - -
-
38,080 Information technology levy - 38,080
-
-
Taxable temporary differences (633,311) 233,523
(604,563)
180,278
Different tax rates in subsidiary in different
jurisdiction 24,372 8,404
-
-
Deductible temporary differences now arising as
deferred tax assets (121,498) 2,469
(121,925)
-
Minimum tax 56,745 - 52,270
Minimum Profit 278,885 - 271,172 -
(475,924) 330,817
(455,316)
270,628
Group Company
31-Dec-17
31-Dec-16 31-Dec-17
31-Dec-16
Tax calculated using the domestic rate of
Corporate tax rate of 30% 30% 30% 30% 30%
Effect of applying:
Income not subject to tax 42% (46%)
34%
(31%)
Non-deductible expenses (86%) 15% (64%) 1%
Tax impact of loss not utilised (4%) 0% 0% 0%
Information technology levy 0% 1% 0% 1%
Taxable temporary differences 15% 9% 14% 6%
Different tax rates in subsidiary in different
jurisdiction (1%) 0% 0% 0%
Deductible temporary differences now arising as
deferred tax assets 3% 0% 3% 0%
Minimum tax 2% (0%) 2%
Minimum Profit (6%) 0% (6%) 0%
Effective tax rate (7%) 12% 11% 9%
The tax (charge)/credit relating to components of other comprehensive income is as follows:
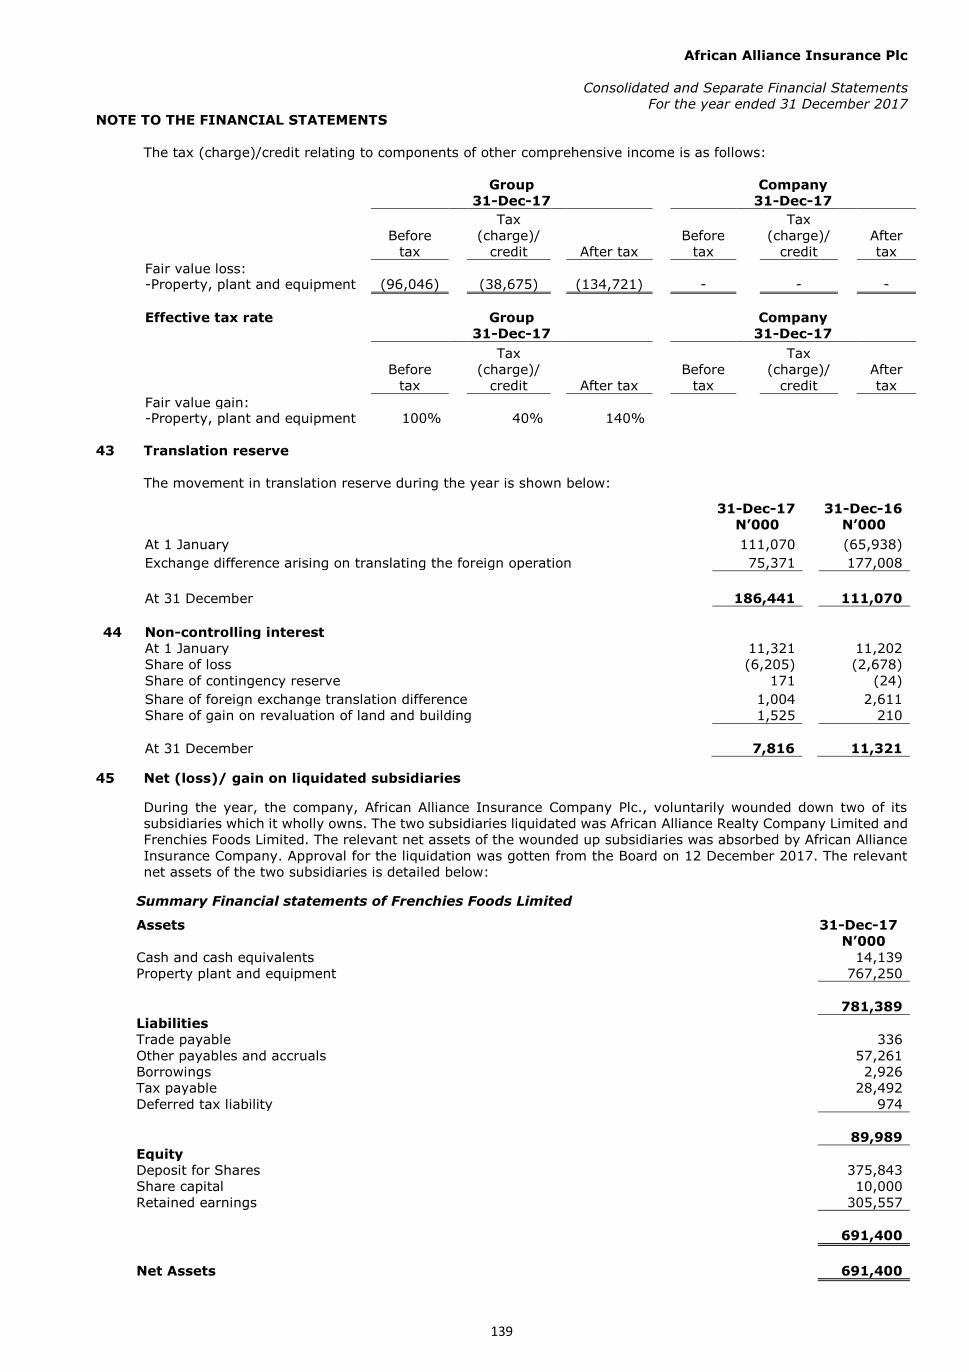
African Alliance Insurance Plc
Consolidated and Separate Financial Statements
For the year ended 31 December 2017
NOTE TO THE FINANCIAL STATEMENTS
139
The tax (charge)/credit relating to components of other comprehensive income is as follows:
Group
Company
31-Dec-17
31-Dec-17
Before
tax
Tax
(charge)/
credit After tax
Before
tax
Tax
(charge)/
credit
After
tax Fair value loss:
-Property, plant and equipment
(96,046) (38,675) (134,721) - - -
Effective tax rate Group
Company
31-Dec-17
31-Dec-17
Before
tax
Tax
(charge)/
credit After tax
Before
tax
Tax
(charge)/
credit
After
tax Fair value gain:
-Property, plant and equipment
100% 40% 140%
43 Translation reserve
The movement in translation reserve during the year is shown below:
31-Dec-17 31-Dec-16
N’000 N’000
At 1 January 111,070 (65,938)
Exchange difference arising on translating the foreign operation 75,371 177,008
At 31 December 186,441 111,070
44 Non-controlling interest
At 1 January 11,321 11,202
Share of loss (6,205) (2,678)
Share of contingency reserve 171 (24)
Share of foreign exchange translation difference 1,004 2,611
Share of gain on revaluation of land and building 1,525 210
At 31 December 7,816 11,321
45 Net (loss)/ gain on liquidated subsidiaries
During the year, the company, African Alliance Insurance Company Plc., voluntarily wounded down two of its
subsidiaries which it wholly owns. The two subsidiaries liquidated was African Alliance Realty Company Limited and
Frenchies Foods Limited. The relevant net assets of the wounded up subsidiaries was absorbed by African Alliance
Insurance Company. Approval for the liquidation was gotten from the Board on 12 December 2017. The relevant
net assets of the two subsidiaries is detailed below:
Summary Financial statements of Frenchies Foods Limited
Assets
31-Dec-17
N’000
Cash and cash equivalents
14,139
Property plant and equipment
767,250
781,389
Liabilities
Trade payable
336 Other payables and accruals
57,261
Borrowings
2,926
Tax payable
28,492
Deferred tax liability
974
89,989
Equity
Deposit for Shares
375,843
Share capital
10,000
Retained earnings
305,557
691,400
Net Assets
691,400
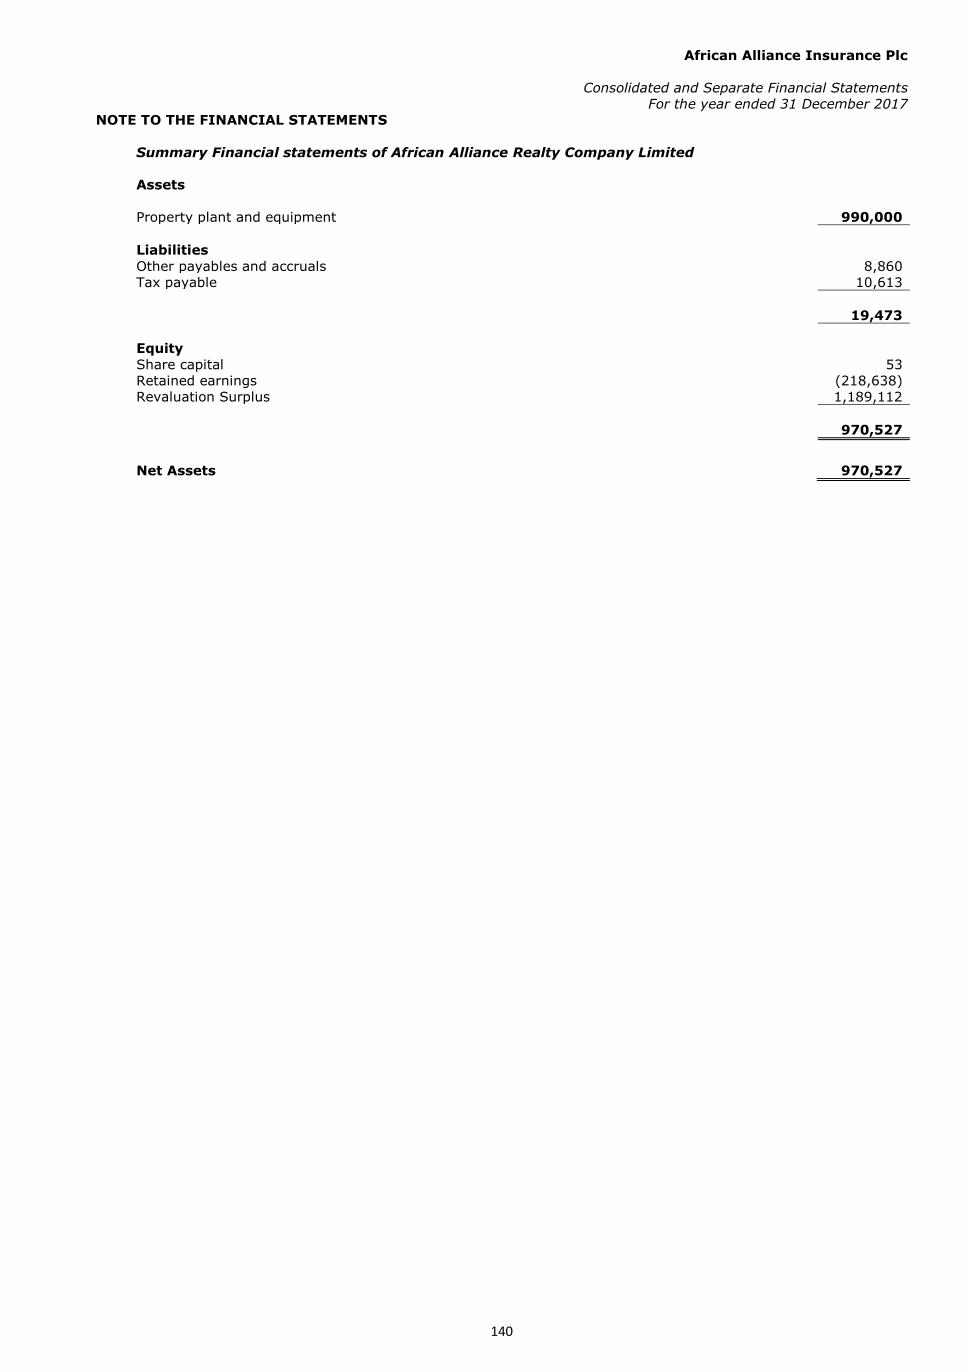
African Alliance Insurance Plc
Consolidated and Separate Financial Statements
For the year ended 31 December 2017
NOTE TO THE FINANCIAL STATEMENTS
140
Summary Financial statements of African Alliance Realty Company Limited
Assets
Property plant and equipment
990,000
Liabilities
Other payables and accruals
8,860
Tax payable
10,613
19,473
Equity
Share capital
53
Retained earnings
(218,638)
Revaluation Surplus
1,189,112
970,527
Net Assets
970,527

African Alliance Insurance Plc
Consolidated and Separate Financial Statements
For the year ended 31 December 2017
NOTE TO THE FINANCIAL STATEMENTS
141
Loss upon liquidation of Subsidiary (Frenchies Foods Nigeria Limited)
Group Company
31-Dec-17 31-Dec-17
N’000 N’000
Investment in Frenchies Foods Limited 1,053,950 1,053,950 Net Asset of Frenchies Foods Limited
(691,400) (691,400)
Loss on disposal
362,550 362,550 Revaluation loss on building included in fair value reserves recycled to
retained earnings (246,039)
116,511 362,550
Loss/ (Gain) upon liquidation of Africa Alliance Realty Company Limited
Investment in African Realty Company limited 53 53 Net Asset of African Realty Company Limited (970,527) (970,527)
Gain on disposal
(970,474) (970,474)
Revaluation gain on building included in fair value reserves recycled to
retained earnings 1,189,112
218,638 (970,474)
Net loss/ (gain) on liquidated subsidiaries
Loss upon liquidation of Frenchies Limited 116,511 362,550 Loss/ (Gain) upon liquidation of Africa Realty Company Limited 218,638 (970,474)
335,149 (607,924)
The post-acquisition retained earnings of the liquidated subsidiaries excluding fair value reserves
N’000 Frenchies Foods Limited
Net assets as at 31 December 2017
691,400
Cost of acquisition
(1,053,950) Impairment charge on cost of acquisition
-
Loss on revaluation on building for Frenchies Limited recognised in profit or loss of Frenchies 246,039
(116,511)
African Realty Company Limited
Net assets as at 31 December 2017 970,474
Cost of acquisition (53)
Fair value reserves recycled to retained earnings (1,189,112)
(218,638)
Total post acquisition retained earnings (335,149)
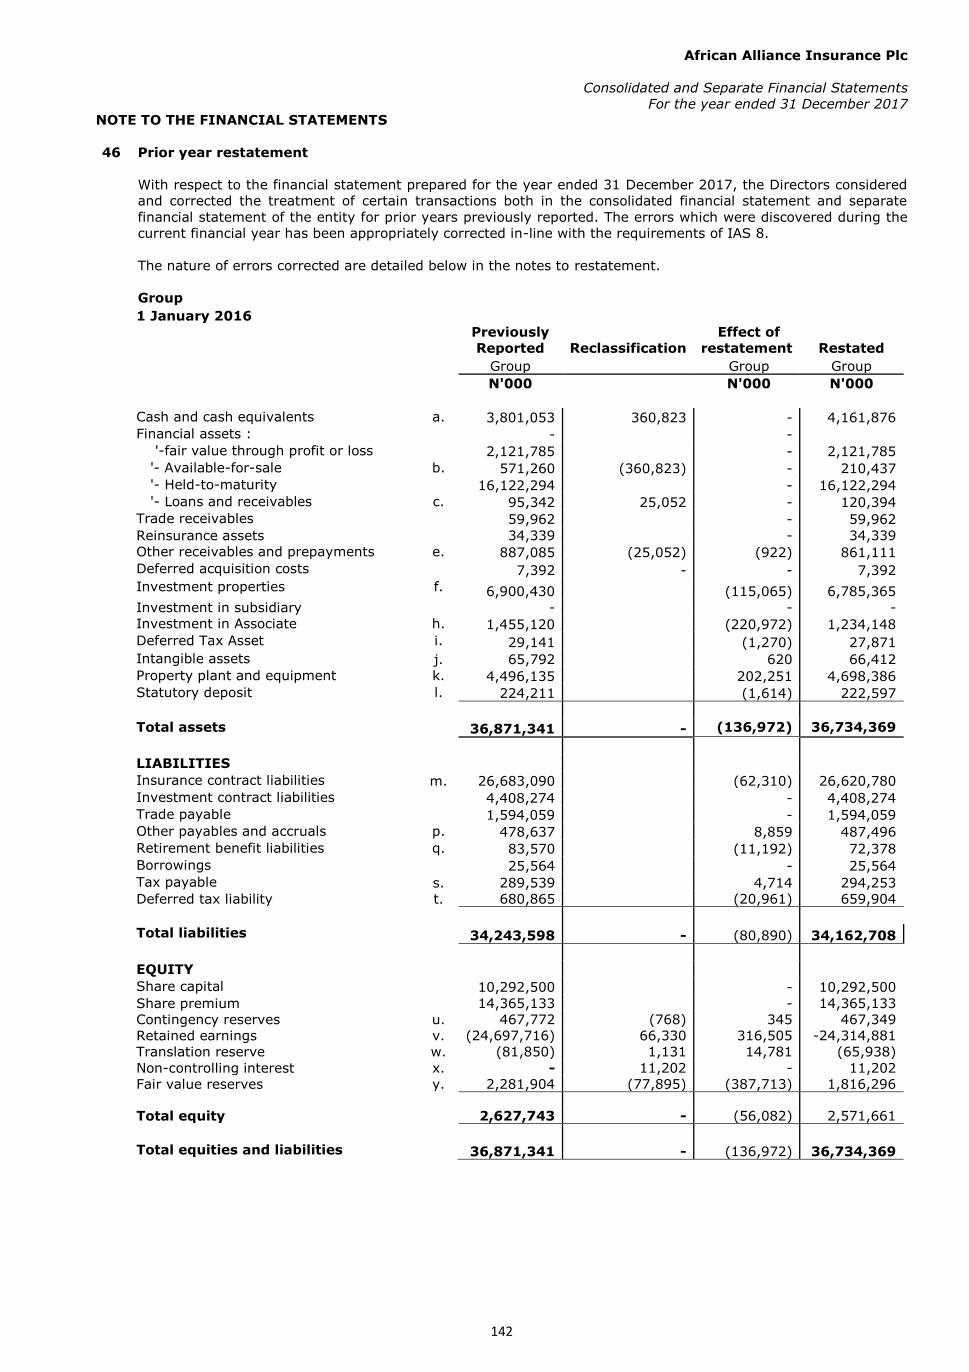
African Alliance Insurance Plc
Consolidated and Separate Financial Statements
For the year ended 31 December 2017
NOTE TO THE FINANCIAL STATEMENTS
142
46 Prior year restatement
With respect to the financial statement prepared for the year ended 31 December 2017, the Directors considered
and corrected the treatment of certain transactions both in the consolidated financial statement and separate
financial statement of the entity for prior years previously reported. The errors which were discovered during the
current financial year has been appropriately corrected in-line with the requirements of IAS 8.
The nature of errors corrected are detailed below in the notes to restatement.
Group 1 January 2016
Previously
Reported Reclassification
Effect of
restatement Restated
Group Group Group
N'000 N'000 N'000
Cash and cash equivalents a. 3,801,053 360,823 - 4,161,876 Financial assets :
- -
'-fair value through profit or loss
2,121,785 - 2,121,785 '- Available-for-sale b. 571,260 (360,823) - 210,437 '- Held-to-maturity
16,122,294 - 16,122,294
'- Loans and receivables c. 95,342 25,052 - 120,394 Trade receivables
59,962 - 59,962
Reinsurance assets
34,339 - 34,339
Other receivables and prepayments e. 887,085 (25,052) (922) 861,111 Deferred acquisition costs
7,392 - - 7,392
Investment properties
f. 6,900,430 (115,065) 6,785,365 Investment in subsidiary
- - -
Investment in Associate h. 1,455,120 (220,972) 1,234,148 Deferred Tax Asset i. 29,141 (1,270) 27,871 Intangible assets j. 65,792 620 66,412 Property plant and equipment k. 4,496,135 202,251 4,698,386 Statutory deposit l. 224,211 (1,614) 222,597
Total assets 36,871,341 - (136,972) 36,734,369
LIABILITIES Insurance contract liabilities m. 26,683,090 (62,310) 26,620,780 Investment contract liabilities 4,408,274 - 4,408,274 Trade payable 1,594,059 - 1,594,059 Other payables and accruals p. 478,637 8,859 487,496 Retirement benefit liabilities q. 83,570 (11,192) 72,378 Borrowings
25,564 - 25,564
Tax payable s. 289,539 4,714 294,253 Deferred tax liability t. 680,865 (20,961) 659,904
Total liabilities 34,243,598 - (80,890) 34,162,708
EQUITY Share capital 10,292,500 - 10,292,500 Share premium 14,365,133 - 14,365,133 Contingency reserves u. 467,772 (768) 345 467,349 Retained earnings v. (24,697,716) 66,330 316,505 -24,314,881 Translation reserve w. (81,850) 1,131 14,781 (65,938) Non-controlling interest x. - 11,202 - 11,202 Fair value reserves y. 2,281,904 (77,895) (387,713) 1,816,296
Total equity
2,627,743 - (56,082) 2,571,661
Total equities and liabilities 36,871,341 - (136,972) 36,734,369

African Alliance Insurance Plc
Consolidated and Separate Financial Statements
For the year ended 31 December 2017
NOTE TO THE FINANCIAL STATEMENTS
143
Group
31 December 2016
Previously
Reported Reclassification
Effect of
restatement Restated
Group Group Group
N'000 N'000 N'000
Cash and cash equivalents a. 6,423,424 451,222 (665) 6,873,981 Financial assets :
- - -
'-fair value through profit or loss
2,109,686 - 2,109,686 '- Available-for-sale b. 708,914 (451,222) (20,215) 237,477 '- Held-to-maturity
21,130,335 - 21,130,335
'- Loans and receivables c. 127,222 60,793 - 188,015 Trade receivables d. 170,660 (2,002) 168,658 Reinsurance assets
76,772 - 76,772
Other receivables and prepayments e. 506,883 (60,793) (6,145) 439,945 Deferred acquisition costs
15,717 - 15,717
Investment properties
f. 7,627,590 145,292 7,772,882 Investment in subsidiary
- - -
Investment in Associate h. 1,562,131 (220,972) 1,341,159 Deferred Tax Asset i. 26,247 (21) 26,226 Intangible assets j. 58,433 (2,303) 56,130 Property plant and equipment k. 4,474,022 427,187 4,901,209 Statutory deposit l. 313,407 (3,429) 309,978
Total assets 45,331,443 - 316,727 45,648,170
LIABILITIES Insurance contract liabilities m. 31,634,602 (23,008) 31,611,594 Investment contract liabilities n. 4,819,629 591,769 5,411,398 Trade payable o. 1,183,351 (78) 1,183,273 Other payables and accruals p. 527,249 8,493 535,742 Retirement benefit liabilities q. 70,736 (11,192) 59,544 Borrowings r 68,217 (1,107) 67,110 Tax payable s. 359,112 4,432 363,544 Deferred tax liability t. 923,562 29,978 953,540
Total liabilities 39,586,458 - 599,287 40,185,745
EQUITY Share capital 10,292,500 - 10,292,500 Share premium 14,365,133 - 14,365,133 Contingency reserves u. 834,464 (744) (1,558) 832,162 Retained earnings v. (22,634,734) 69,008 332,772 -22,232,954 Translation reserve w. 430,305 (1,479) (317,756) 111,070 Non-controlling interest x. - 11,321 - 11,321 Fair value reserves y. 2,457,317 (78,106) (296,018) 2,083,193
Total equity
5,744,985 - (282,560) 5,462,425
Total equities and liabilities 45,331,443 316,727 45,648,170
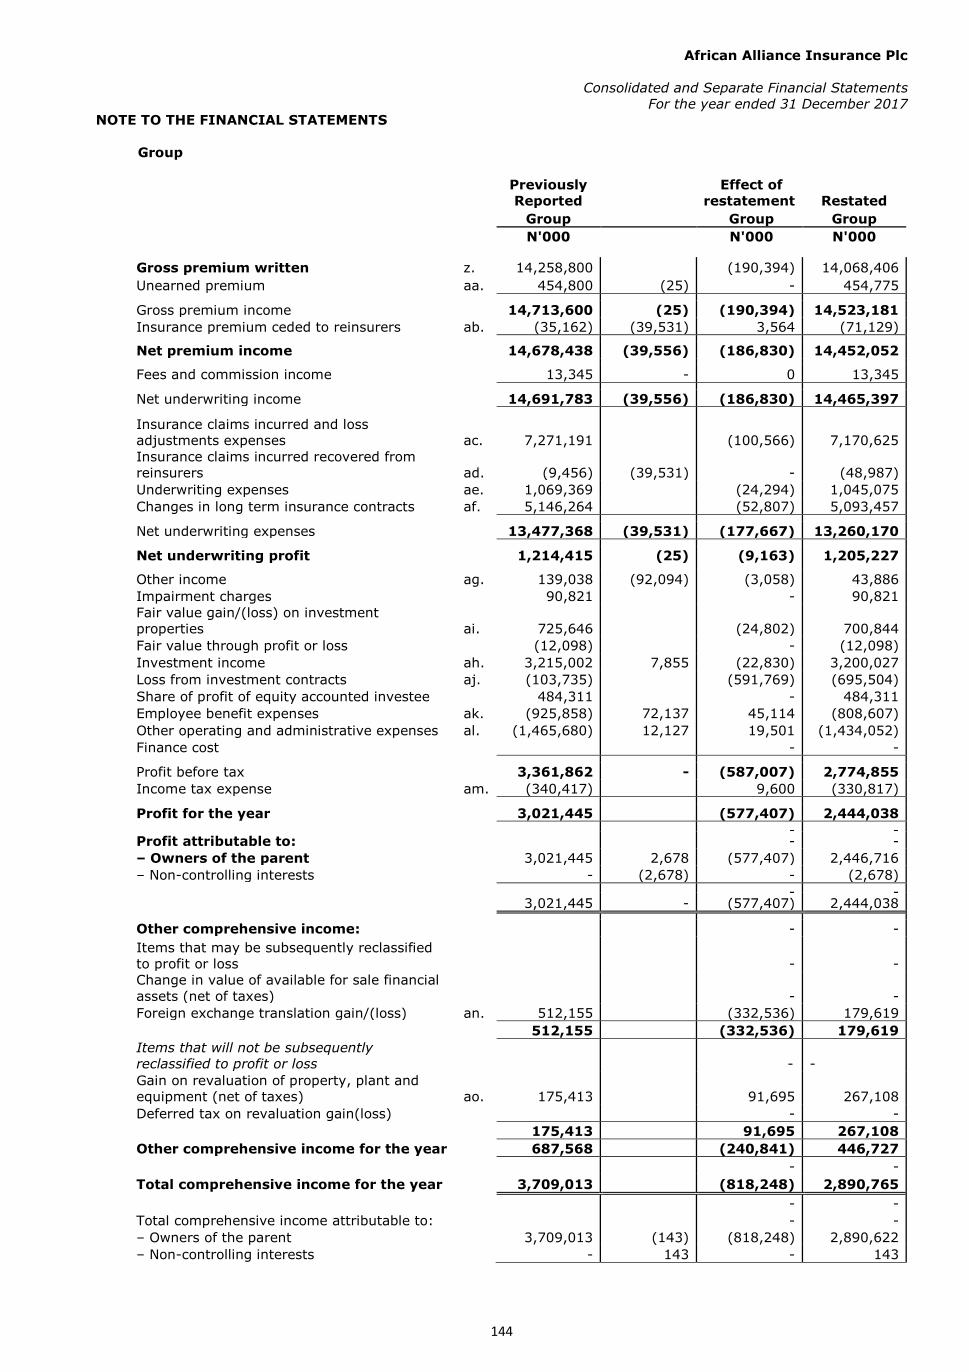
African Alliance Insurance Plc
Consolidated and Separate Financial Statements
For the year ended 31 December 2017
NOTE TO THE FINANCIAL STATEMENTS
144
Group
Previously
Reported
Effect of
restatement Restated
Group Group Group
N'000 N'000 N'000 Gross premium written z. 14,258,800 (190,394) 14,068,406
Unearned premium aa. 454,800 (25) - 454,775
Gross premium income 14,713,600 (25) (190,394) 14,523,181 Insurance premium ceded to reinsurers ab. (35,162) (39,531) 3,564 (71,129)
Net premium income 14,678,438 (39,556) (186,830) 14,452,052
Fees and commission income 13,345 - 0 13,345
Net underwriting income 14,691,783 (39,556) (186,830) 14,465,397
Insurance claims incurred and loss
adjustments expenses ac. 7,271,191 (100,566) 7,170,625
Insurance claims incurred recovered from
reinsurers ad. (9,456) (39,531) - (48,987)
Underwriting expenses ae. 1,069,369 (24,294) 1,045,075
Changes in long term insurance contracts af. 5,146,264 (52,807) 5,093,457
Net underwriting expenses 13,477,368 (39,531) (177,667) 13,260,170
Net underwriting profit 1,214,415 (25) (9,163) 1,205,227
Other income ag. 139,038 (92,094) (3,058) 43,886
Impairment charges 90,821 - 90,821
Fair value gain/(loss) on investment
properties ai. 725,646 (24,802) 700,844
Fair value through profit or loss (12,098) - (12,098)
Investment income ah. 3,215,002 7,855 (22,830) 3,200,027
Loss from investment contracts aj. (103,735) (591,769) (695,504)
Share of profit of equity accounted investee 484,311 - 484,311
Employee benefit expenses ak. (925,858) 72,137 45,114 (808,607)
Other operating and administrative expenses al. (1,465,680) 12,127 19,501 (1,434,052)
Finance cost - -
- - Profit before tax 3,361,862 - (587,007) 2,774,855
Income tax expense am. (340,417) 9,600 (330,817)
- - Profit for the year 3,021,445 (577,407) 2,444,038 - - Profit attributable to: - -
– Owners of the parent 3,021,445 2,678 (577,407) 2,446,716
– Non-controlling interests - (2,678) - (2,678) - - 3,021,445 - (577,407) 2,444,038
- - Other comprehensive income: - -
Items that may be subsequently reclassified
to profit or loss - -
Change in value of available for sale financial
assets (net of taxes) - -
Foreign exchange translation gain/(loss) an. 512,155 (332,536) 179,619
512,155 (332,536) 179,619
Items that will not be subsequently
reclassified to profit or loss -
-
Gain on revaluation of property, plant and
equipment (net of taxes) ao. 175,413 91,695 267,108
Deferred tax on revaluation gain(loss) - -
175,413 91,695 267,108
Other comprehensive income for the year 687,568 (240,841) 446,727
- -
Total comprehensive income for the year 3,709,013 (818,248) 2,890,765
- -
Total comprehensive income attributable to: - -
– Owners of the parent 3,709,013 (143) (818,248) 2,890,622
– Non-controlling interests - 143 - 143
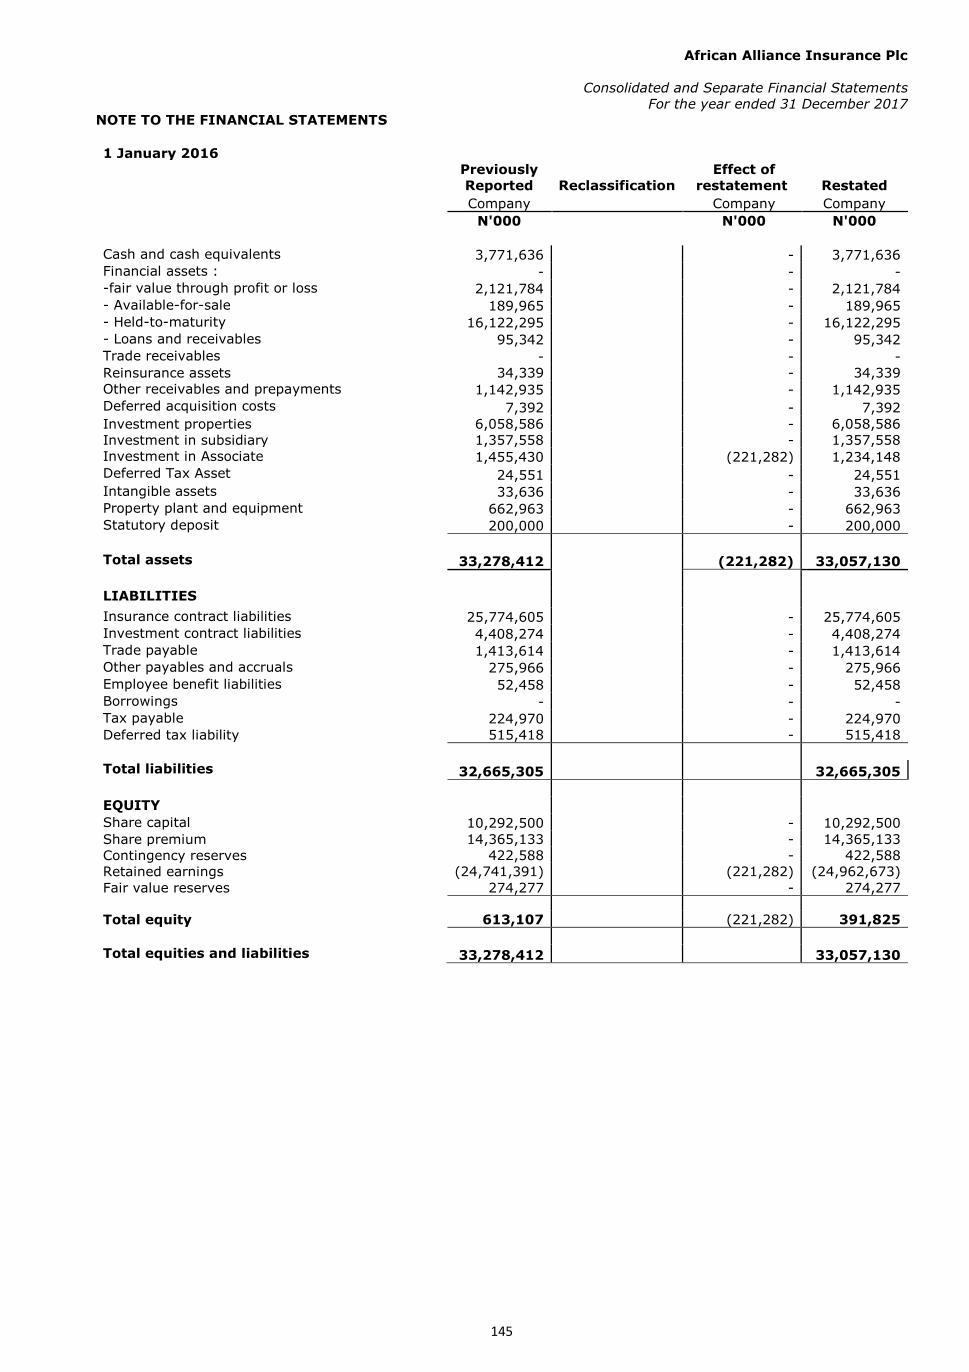
African Alliance Insurance Plc
Consolidated and Separate Financial Statements
For the year ended 31 December 2017
NOTE TO THE FINANCIAL STATEMENTS
145
1 January 2016
Previously
Reported Reclassification
Effect of
restatement Restated
Company Company Company
N'000 N'000 N'000
Cash and cash equivalents
3,771,636 - 3,771,636
Financial assets :
- - -
-fair value through profit or loss
2,121,784 - 2,121,784
- Available-for-sale
189,965 - 189,965
- Held-to-maturity
16,122,295 - 16,122,295
- Loans and receivables
95,342 - 95,342
Trade receivables
- - -
Reinsurance assets
34,339 - 34,339
Other receivables and prepayments
1,142,935 - 1,142,935
Deferred acquisition costs
7,392 - 7,392
Investment properties
6,058,586 - 6,058,586
Investment in subsidiary
1,357,558 - 1,357,558
Investment in Associate
1,455,430 (221,282) 1,234,148
Deferred Tax Asset
24,551 - 24,551
Intangible assets 33,636 - 33,636
Property plant and equipment
662,963 - 662,963
Statutory deposit
200,000 - 200,000
Total assets 33,278,412 (221,282) 33,057,130
LIABILITIES
Insurance contract liabilities 25,774,605 - 25,774,605
Investment contract liabilities 4,408,274 - 4,408,274
Trade payable 1,413,614 - 1,413,614
Other payables and accruals
275,966 - 275,966
Employee benefit liabilities
52,458 - 52,458
Borrowings
- - -
Tax payable 224,970 - 224,970
Deferred tax liability
515,418 - 515,418
Total liabilities 32,665,305 32,665,305
EQUITY Share capital 10,292,500 - 10,292,500
Share premium 14,365,133 - 14,365,133
Contingency reserves 422,588 - 422,588
Retained earnings (24,741,391) (221,282) (24,962,673)
Fair value reserves 274,277 - 274,277
Total equity
613,107 (221,282) 391,825
Total equities and liabilities 33,278,412 33,057,130
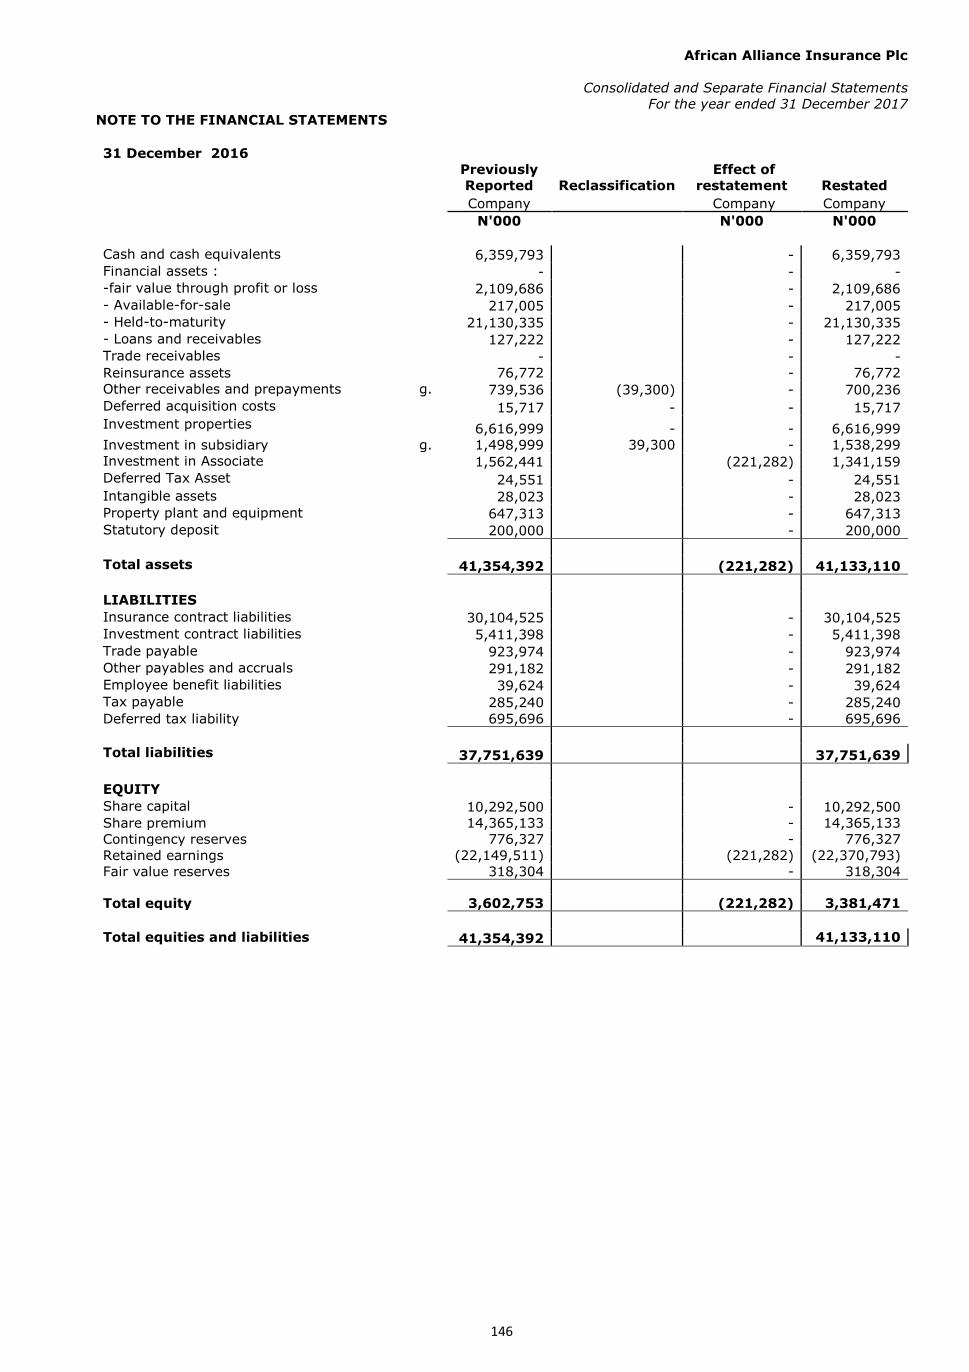
African Alliance Insurance Plc
Consolidated and Separate Financial Statements
For the year ended 31 December 2017
NOTE TO THE FINANCIAL STATEMENTS
146
31 December 2016
Previously
Reported Reclassification
Effect of
restatement Restated
Company Company Company
N'000 N'000 N'000
Cash and cash equivalents
6,359,793 - 6,359,793
Financial assets :
- - -
-fair value through profit or loss
2,109,686 - 2,109,686
- Available-for-sale
217,005 - 217,005
- Held-to-maturity
21,130,335 - 21,130,335
- Loans and receivables
127,222 - 127,222
Trade receivables
- - -
Reinsurance assets
76,772 - 76,772
Other receivables and prepayments g. 739,536 (39,300) - 700,236
Deferred acquisition costs
15,717 - - 15,717
Investment properties
6,616,999 - - 6,616,999
Investment in subsidiary g. 1,498,999 39,300 - 1,538,299
Investment in Associate
1,562,441 (221,282) 1,341,159
Deferred Tax Asset
24,551 - 24,551
Intangible assets 28,023 - 28,023
Property plant and equipment
647,313 - 647,313
Statutory deposit
200,000 - 200,000
Total assets 41,354,392 (221,282) 41,133,110
LIABILITIES Insurance contract liabilities 30,104,525 - 30,104,525
Investment contract liabilities 5,411,398 - 5,411,398
Trade payable 923,974 - 923,974
Other payables and accruals
291,182 - 291,182
Employee benefit liabilities
39,624 - 39,624
Tax payable 285,240 - 285,240
Deferred tax liability
695,696 - 695,696
Total liabilities 37,751,639 37,751,639
EQUITY Share capital 10,292,500 - 10,292,500
Share premium 14,365,133 - 14,365,133
Contingency reserves 776,327 - 776,327
Retained earnings (22,149,511) (221,282) (22,370,793)
Fair value reserves 318,304 - 318,304
Total equity
3,602,753 (221,282) 3,381,471
Total equities and liabilities 41,354,392 41,133,110
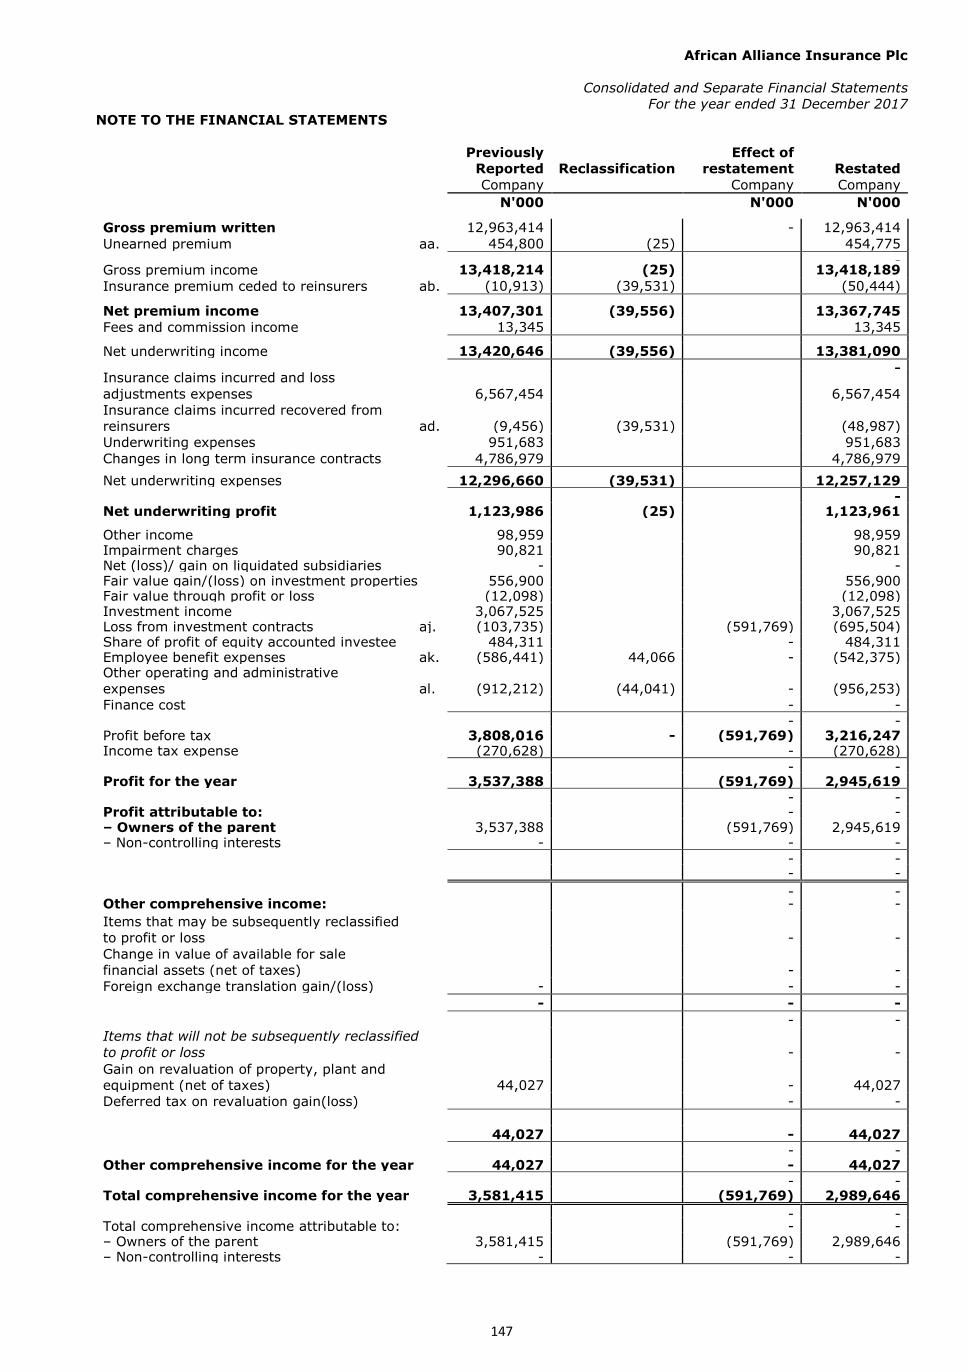
African Alliance Insurance Plc
Consolidated and Separate Financial Statements
For the year ended 31 December 2017
NOTE TO THE FINANCIAL STATEMENTS
147
Previously
Reported Reclassification
Effect of
restatement Restated
Company Company Company
N'000 N'000 N'000 Gross premium written 12,963,414
- 12,963,414
Unearned premium aa. 454,800 (25)
454,775
-
Gross premium income 13,418,214 (25)
13,418,189
Insurance premium ceded to reinsurers ab. (10,913) (39,531)
(50,444)
-
Net premium income 13,407,301 (39,556) 13,367,745
Fees and commission income 13,345
13,345
-
Net underwriting income 13,420,646 (39,556)
13,381,090
-
Insurance claims incurred and loss
adjustments expenses 6,567,454 6,567,454
Insurance claims incurred recovered from
reinsurers ad. (9,456) (39,531) (48,987)
Underwriting expenses 951,683
951,683
Changes in long term insurance contracts 4,786,979
4,786,979
- Net underwriting expenses 12,296,660 (39,531)
12,257,129
- Net underwriting profit 1,123,986 (25)
1,123,961
- Other income 98,959 98,959 Impairment charges 90,821 90,821 Net (loss)/ gain on liquidated subsidiaries - - Fair value gain/(loss) on investment properties 556,900 556,900 Fair value through profit or loss (12,098) (12,098) Investment income 3,067,525 3,067,525 Loss from investment contracts aj. (103,735) (591,769) (695,504) Share of profit of equity accounted investee 484,311 - 484,311 Employee benefit expenses ak. (586,441) 44,066 - (542,375) Other operating and administrative
expenses al. (912,212) (44,041) - (956,253)
Finance cost
- -
- - Profit before tax 3,808,016 - (591,769) 3,216,247 Income tax expense (270,628) - (270,628)
- - Profit for the year 3,537,388 (591,769) 2,945,619
- - Profit attributable to: - - – Owners of the parent 3,537,388 (591,769) 2,945,619 – Non-controlling interests - - -
- -
- -
- - Other comprehensive income: - -
Items that may be subsequently reclassified
to profit or loss - -
Change in value of available for sale
financial assets (net of taxes) - -
Foreign exchange translation gain/(loss) - - -
- - -
- -
Items that will not be subsequently reclassified
to profit or loss - -
Gain on revaluation of property, plant and
equipment (net of taxes) 44,027 - 44,027
Deferred tax on revaluation gain(loss) - -
44,027 - 44,027
- - Other comprehensive income for the year 44,027 - 44,027
- - Total comprehensive income for the year 3,581,415 (591,769) 2,989,646
- - Total comprehensive income attributable to: - - – Owners of the parent 3,581,415 (591,769) 2,989,646 – Non-controlling interests - - -

African Alliance Insurance Plc
Consolidated and Separate Financial Statements
For the year ended 31 December 2017
NOTE TO THE FINANCIAL STATEMENTS
148
a. Cash equivalents, such a short term deposits and mutual funds, owned by the company's subsidiary, Ghana Life
Insurance Plc., was not adequately presented in the consolidated financial statements. It was previously presented
as available for sale financial assets. This was corrected and appropriately presented. In 2016, an inappropriate
rate was used in translating the assets of the foreign subsidiary which has been appropriately adjusted for.
31-Dec-16 1-Jan-16 31-Dec-16 1-Jan-16
N'000 N'000 N'000 N'000
Balance as per NAICOM approved accounts 6,423,424 3,801,053 6,359,793 3,771,636
Reclassified to cash and cash equivalent 451,222 360,823 - -
Remeasurement (Retained earnings) (665)
Balance (Restated) 6,873,981 4,161,876 6,359,793 3,771,636
b. Cash equivalents, such a short term deposits and mutual funds, owned by a subsidiary was not adequately
presented in the consolidated financial statements. It was previously presented as available for sale financial assets.
This was corrected and appropriately presented. In 2016, an inappropriate rate was used in translating the assets
of the foreign subsidiary which has been appropriately adjusted for. In addition, a consolidation adjustment was
passed which had no basis. This was adjusted against the group retained earnings.
31-Dec-16 1-Jan-16 31-Dec-16 1-Jan-16
N'000 N'000 N'000 N'000
Balance as per NAICOM approved accounts 708,914 571,260 217,005 189,965
Reclassified to cash and cash equivalent (451,222) (360,823) - -
Remeasurement (retained earnings) (20,215)
Balance (Restated) 237,477 210,437 217,005 189,965
c. Policy loans granted customers were not classified as a part of loans and receivables but classified as a part of
other receivables which is contrary to the group's policy. The policy loan amount has been reclassified appropriately
from other receivables.
31-Dec-16 1-Jan-16 31-Dec-16 1-Jan-16
N'000 N'000 N'000 N'000
Balance as per NAICOM approved accounts 127,222 95,342 127,222 95,342
Reclassified from other receivables 60,793 25,052 - -
Balance (Restated) 188,015 120,394 127,222 95,342
d. Trade receivables belonging to Ghana life Insurance were translated using an inappropriate rate which was
inconsistent with the closing rates used in prior years. This error was corrected and adjusted against retained
earnings.
31-Dec-16 1-Jan-16 31-Dec-16 1-Jan-16
N'000 N'000 N'000 N'000
Balance as per NAICOM approved accounts 170,660 59,962 - -
Reclassified from other receivables (2,002) - - -
Balance (Restated) 168,658 59,962 - -
e. Policy loans granted customers amounting to N60.7 Million were not classified as a part of loans and receivables
but classified as a part of other receivables which is contrary to the group's policy. The policy loan amount has
been reclassified appropriately from other receivables. In 2016, an inappropriate rate was used in translating the
assets of the foreign subsidiary which has been appropriately adjusted for. Intercompany balance with one of the
company's subsidiaries was not eliminated at the time of consolidation. This was appropriately adjusted for
accordingly. Capital injection amounting to N39.3 Million made to Ghana Life Insurance was classified
inappropriately as due to related company instead of investment in subsidiary. This was appropriately reclassified
in the separate financial statements.
31-Dec-16 1-Jan-16 31-Dec-16 1-Jan-16
N'000 N'000 N'000 N'000
Balance as per NAICOM approved accounts 506,883 887,085 739,536 1,142,935
Reclassified to investment in subsidiary (39,300)
Reclassified to loans and receivables (60,793) (25,052) - -
Remeasurement (Retained earnings) (2,569)
Elimination of inter-company balance with Frenchies (3,576) (922)
Balance (Restated) 439,945 861,111 700,236 1,142,935
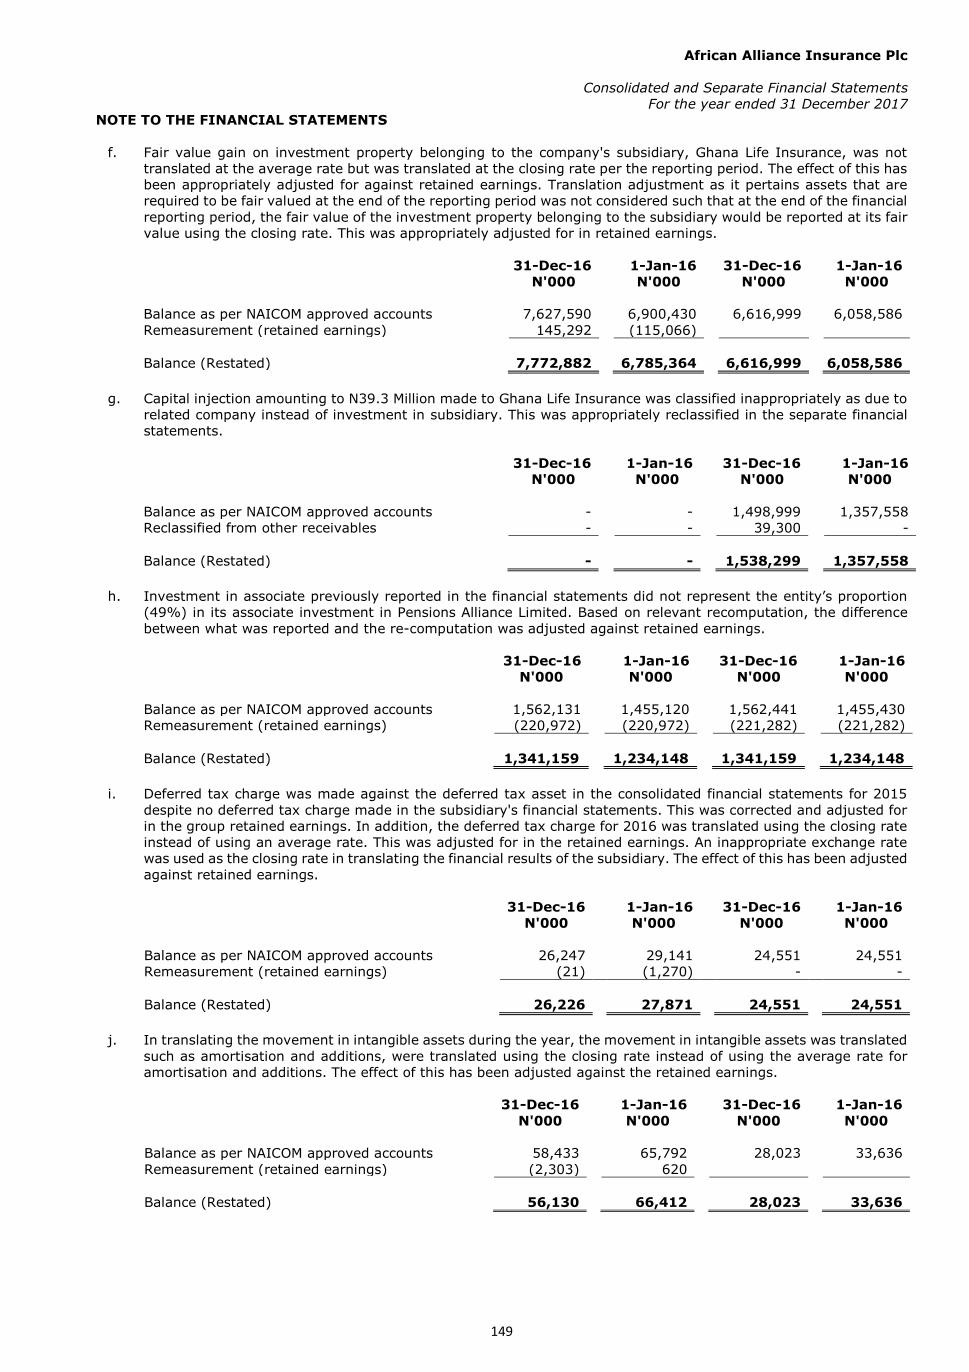
African Alliance Insurance Plc
Consolidated and Separate Financial Statements
For the year ended 31 December 2017
NOTE TO THE FINANCIAL STATEMENTS
149
f. Fair value gain on investment property belonging to the company's subsidiary, Ghana Life Insurance, was not
translated at the average rate but was translated at the closing rate per the reporting period. The effect of this has
been appropriately adjusted for against retained earnings. Translation adjustment as it pertains assets that are
required to be fair valued at the end of the reporting period was not considered such that at the end of the financial
reporting period, the fair value of the investment property belonging to the subsidiary would be reported at its fair
value using the closing rate. This was appropriately adjusted for in retained earnings.
31-Dec-16 1-Jan-16 31-Dec-16 1-Jan-16
N'000 N'000 N'000 N'000
Balance as per NAICOM approved accounts 7,627,590 6,900,430 6,616,999 6,058,586
Remeasurement (retained earnings) 145,292 (115,066)
Balance (Restated) 7,772,882 6,785,364 6,616,999 6,058,586
g. Capital injection amounting to N39.3 Million made to Ghana Life Insurance was classified inappropriately as due to
related company instead of investment in subsidiary. This was appropriately reclassified in the separate financial
statements.
31-Dec-16 1-Jan-16 31-Dec-16 1-Jan-16
N'000 N'000 N'000 N'000
Balance as per NAICOM approved accounts - - 1,498,999 1,357,558
Reclassified from other receivables - - 39,300 -
Balance (Restated) - - 1,538,299 1,357,558
h. Investment in associate previously reported in the financial statements did not represent the entity’s proportion
(49%) in its associate investment in Pensions Alliance Limited. Based on relevant recomputation, the difference
between what was reported and the re-computation was adjusted against retained earnings.
31-Dec-16 1-Jan-16 31-Dec-16 1-Jan-16
N'000 N'000 N'000 N'000
Balance as per NAICOM approved accounts 1,562,131 1,455,120 1,562,441 1,455,430
Remeasurement (retained earnings) (220,972) (220,972) (221,282) (221,282)
Balance (Restated) 1,341,159
1,234,148 1,341,159
1,234,148
i. Deferred tax charge was made against the deferred tax asset in the consolidated financial statements for 2015
despite no deferred tax charge made in the subsidiary's financial statements. This was corrected and adjusted for
in the group retained earnings. In addition, the deferred tax charge for 2016 was translated using the closing rate
instead of using an average rate. This was adjusted for in the retained earnings. An inappropriate exchange rate
was used as the closing rate in translating the financial results of the subsidiary. The effect of this has been adjusted
against retained earnings.
31-Dec-16 1-Jan-16 31-Dec-16 1-Jan-16
N'000 N'000 N'000 N'000
Balance as per NAICOM approved accounts 26,247 29,141 24,551 24,551
Remeasurement (retained earnings) (21) (1,270) - -
Balance (Restated) 26,226 27,871 24,551 24,551
j. In translating the movement in intangible assets during the year, the movement in intangible assets was translated
such as amortisation and additions, were translated using the closing rate instead of using the average rate for
amortisation and additions. The effect of this has been adjusted against the retained earnings.
31-Dec-16 1-Jan-16 31-Dec-16 1-Jan-16
N'000 N'000 N'000 N'000
Balance as per NAICOM approved accounts 58,433 65,792 28,023 33,636
Remeasurement (retained earnings) (2,303) 620
Balance (Restated) 56,130 66,412 28,023 33,636

African Alliance Insurance Plc
Consolidated and Separate Financial Statements
For the year ended 31 December 2017
NOTE TO THE FINANCIAL STATEMENTS
150
k. A difference of 427 million (2015: N202.2 million) was noted between the amount reported as property, plant and
equipment in 2016 and 2015 respectively and the audited financial statements of the entities consolidated. The
adjustment of N200.5 Million was adjusted against the opening retained earnings (1 January 2016) and an
adjustment of N1.6 Billion was adjusted against the opening retained earnings. While the net adjustment of N233
million the net impact to the income statement for year ended 31 December 2016. In addition, the entity did not
use the average rate in translating the movements in property, plant and equipment but instead translated it using
the closing rate. This was adjusted against the retained earnings.
31-Dec-16 1-Jan-16 31-Dec-16 1-Jan-16
N'000 N'000 N'000 N'000
Balance as per NAICOM approved accounts 4,474,022 4,496,135 647,313 662,963
Remeasurement (retained earnings) 427,187 202,251
Balance (Restated) 4,901,209 4,698,386 647,313 662,963
l. A consolidation adjustment of N1.61 Million was passed in the consolidated financial statements for which there is
no basis which was thus eliminated against the retained earnings. An inappropriate rate was used in translating
the statutory deposit of Ghana Life Insurance which was thus adjusted against the retained earnings.
31-Dec-16 1-Jan-16 31-Dec-16 1-Jan-16
N'000 N'000 N'000 N'000
Balance as per NAICOM approved accounts 313,407 224,211 200,000 200,000
Remeasurement (retained earnings) (3,429) (1,614)
Balance (Restated) 309,978 222,597 200,000 200,000
m. Claims incurred during the year was translated using the average rate instead of the closing rate. The effects of
this has been adjusted against the retained earnings. An inappropriate closing rate was used in translating the
subsidiary's financial results in 2016. The effect of this has been adjusted against the translation reserve.
31-Dec-16 1-Jan-16 31-Dec-16 1-Jan-16
N'000 N'000 N'000 N'000
Balance as per NAICOM approved accounts 31,634,602 26,683,090 30,104,525 25,774,606
Remeasurement (retained earnings) (23,008) (62,310)
Balance (Restated) 31,611,594 26,620,780 30,104,525 25,774,606
n. A prior year adjustment of N591 Million was made against deposit administration in the consolidated financial
statements and not in the separate financial statements. The same amount was adjusted in the retained earnings
of the parent company in its separate financial statements. The adjustment was made as a result of inadequate
reconciliation. The prior year adjustment was thus charged to profit or loss of 2016 financial statements as there
were no errors observed in the amount stated as investment contract liabilities.
31-Dec-16 1-Jan-16 31-Dec-16 1-Jan-16
N'000 N'000 N'000 N'000
Balance as per NAICOM approved accounts 4,819,629 4,408,274 5,411,398 4,408,274
Remeasurement (retained earnings) 591,769 -
Balance (Restated) 5,411,398 4,408,274 5,411,398 4,408,274
o. Trade payables belonging to the foreign subsidiary was not translated using the appropriate closing rate that was
consistent with what was used in the prior year. This was adjusted accordingly in retained earnings.
31-Dec-16 1-Jan-16 31-Dec-16 1-Jan-16
N'000 N'000 N'000 N'000
Balance as per NAICOM approved accounts 1,183,351 1,594,059 923,974 1,413,614
Remeasurement (retained earnings) (78) -
Balance (Restated) 1,183,273 1,594,059 923,974 1,413,614

African Alliance Insurance Plc
Consolidated and Separate Financial Statements
For the year ended 31 December 2017
NOTE TO THE FINANCIAL STATEMENTS
151
p. Creditors in the financial statements of Africa Realty Company Limited, a wholly owned subsidiary of African Alliance
Insurance, were not consolidated in the financial statements. This was appropriately adjusted for and recognised
in the group retained earnings of African Alliance Insurance Plc. In addition, an inappropriate closing rate was used
in translating the creditors of Ghana Life in the 2016 financial statements and this was adjusted for in the translation
reserve of the group financial statements.
31-Dec-16 1-Jan-16 31-Dec-16 1-Jan-16
N'000 N'000 N'000 N'000
Balance as per NAICOM approved accounts 527,249 478,637 275,967 291,182
Remeasurement (retained earnings) 8,493 8,859 - -
Remeasurement (translation reserve) - - - -
Balance (Restated) 535,742 487,496 275,967 291,182
q. An elimination adjustment of N11.1 Million was passed in the group financial statements. Based on the consolidation
of the parent's financial results and the subsidiaries' financial results, there were no inter-company balances
between the parent company and its subsidiaries to warrant this elimination journal passed. The elimination
adjustment was thus adjusted against retained earnings.
31-Dec-16 1-Jan-16 31-Dec-16 1-Jan-16
N'000 N'000 N'000 N'000
Balance as per NAICOM approved accounts 70,736 83,570 39,624 52,458
Remeasurement (retained earnings) (11,192) (11,192) -
Balance (Restated) 59,544 72,378 39,624 52,458
r Borrowings belonging to the foreign subsidiary was not translated using the appropriate closing rate that was
consistent with what was used in the prior year. This was adjusted accordingly in retained earnings.
31-Dec-16 1-Jan-16 31-Dec-16 1-Jan-16
N'000 N'000 N'000 N'000
Balance as per NAICOM approved accounts 68,217 25,564 - -
Remeasurement (retained earnings) (1,107) - -
Balance (Restated) 67,110 25,564 - -
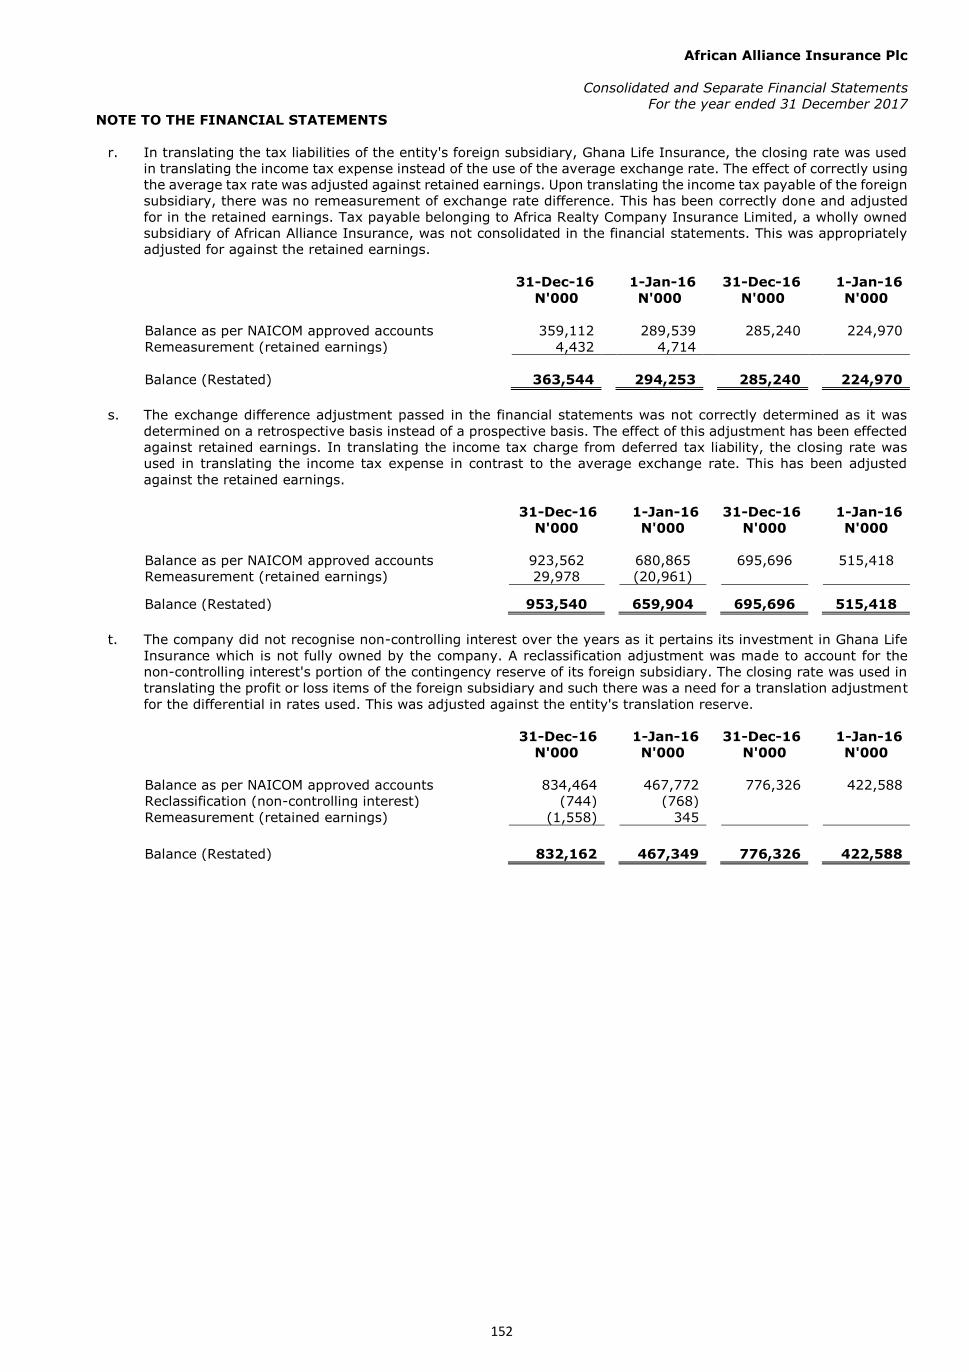
African Alliance Insurance Plc
Consolidated and Separate Financial Statements
For the year ended 31 December 2017
NOTE TO THE FINANCIAL STATEMENTS
152
r. In translating the tax liabilities of the entity's foreign subsidiary, Ghana Life Insurance, the closing rate was used
in translating the income tax expense instead of the use of the average exchange rate. The effect of correctly using
the average tax rate was adjusted against retained earnings. Upon translating the income tax payable of the foreign
subsidiary, there was no remeasurement of exchange rate difference. This has been correctly done and adjusted
for in the retained earnings. Tax payable belonging to Africa Realty Company Insurance Limited, a wholly owned
subsidiary of African Alliance Insurance, was not consolidated in the financial statements. This was appropriately
adjusted for against the retained earnings.
31-Dec-16 1-Jan-16 31-Dec-16 1-Jan-16
N'000 N'000 N'000 N'000
Balance as per NAICOM approved accounts 359,112 289,539 285,240 224,970
Remeasurement (retained earnings)
4,432 4,714
Balance (Restated) 363,544 294,253 285,240 224,970
s. The exchange difference adjustment passed in the financial statements was not correctly determined as it was
determined on a retrospective basis instead of a prospective basis. The effect of this adjustment has been effected
against retained earnings. In translating the income tax charge from deferred tax liability, the closing rate was
used in translating the income tax expense in contrast to the average exchange rate. This has been adjusted
against the retained earnings.
31-Dec-16 1-Jan-16 31-Dec-16 1-Jan-16
N'000 N'000 N'000 N'000
Balance as per NAICOM approved accounts 923,562 680,865 695,696 515,418
Remeasurement (retained earnings) 29,978 (20,961)
Balance (Restated) 953,540 659,904 695,696 515,418
t. The company did not recognise non-controlling interest over the years as it pertains its investment in Ghana Life
Insurance which is not fully owned by the company. A reclassification adjustment was made to account for the
non-controlling interest's portion of the contingency reserve of its foreign subsidiary. The closing rate was used in
translating the profit or loss items of the foreign subsidiary and such there was a need for a translation adjustment
for the differential in rates used. This was adjusted against the entity's translation reserve.
31-Dec-16 1-Jan-16 31-Dec-16 1-Jan-16
N'000 N'000 N'000 N'000
Balance as per NAICOM approved accounts 834,464 467,772 776,326 422,588
Reclassification (non-controlling interest) (744) (768)
Remeasurement (retained earnings) (1,558) 345
Balance (Restated) 832,162 467,349 776,326 422,588

African Alliance Insurance Plc
Consolidated and Separate Financial Statements
For the year ended 31 December 2017
NOTE TO THE FINANCIAL STATEMENTS
153
u. The impact of restatement on the retained earnings for all the periods affected are analysed below:
31-Dec-16 1-Jan-16 31-Dec-16 1-Jan-16
N'000 N'000 N'000 N'000
Balance as per NAICOM approved accounts (22,634,734) (24,697,716) (22,149,511) (24,741,391)
Adjustment on translation error on cash and cash equivalent (665) -
Adjustment on translation error on available for sale financial assets (20,215) - Adjustment on the translation error on trade receivables (2,002) -
Adjustment on translation error on trade receivables belonging to Ghana Life and inter-company
receivables not eliminated (6,145) (922)
Adjustment on translation error pertaining to investment property 145,292 (115,065)
Adjustment on inter-company transaction on investment in associate (220,972) (220,972) (221,282) (221,282)
Adjustment on translation error on deferred tax asset (21) (1,270)
Adjustment on translation error on intangible assets (2,303) 620
Adjustment on non-existent property, plant and equipment 427,187 202,251
Adjustment on translation error in statutory deposit (3,429) (1,614)
Adjustment on translation error of claims incurred 23,008 62,310
Adjustment on incorrect treatment of prior year adjustment (591,769) -
Translation error on trade payables of Ghana Life Insurance 78 -
Adjustment on creditors belonging to Africa Realty and translation error on creditors of Ghana
Life Insurance (8,493) (8,859)
Consolidation error adjustment made in the consolidated financial statements 11,192 11,192
Translation error on borrowings of Ghana Life Insurance 1,107 -
Translation error on income tax liabilities of Ghana Life Insurance (4,432) (4,714)
Adjustment on translation error on deferred tax liabilities (29,978) 20,961
Adjustment on translation of contingency reserve appropriation 1,558 (345)
Adjustment from the use of closing exchange rate in translating profit or loss items 317,756 (14,781)
Reclassification of retained earnings belonging to non-controlling interest (2,143) (4,821)
Reclassification of deferred tax liabilities from retained earnings to fair value reserve belonging
to revaluation gain 71,151 71,151
Adjustment on revaluation reserve for non-existent fair value of relevant property 296,018 387,713
Balance (Restated) (22,232,954) (24,314,881) (22,370,793) (24,962,673)
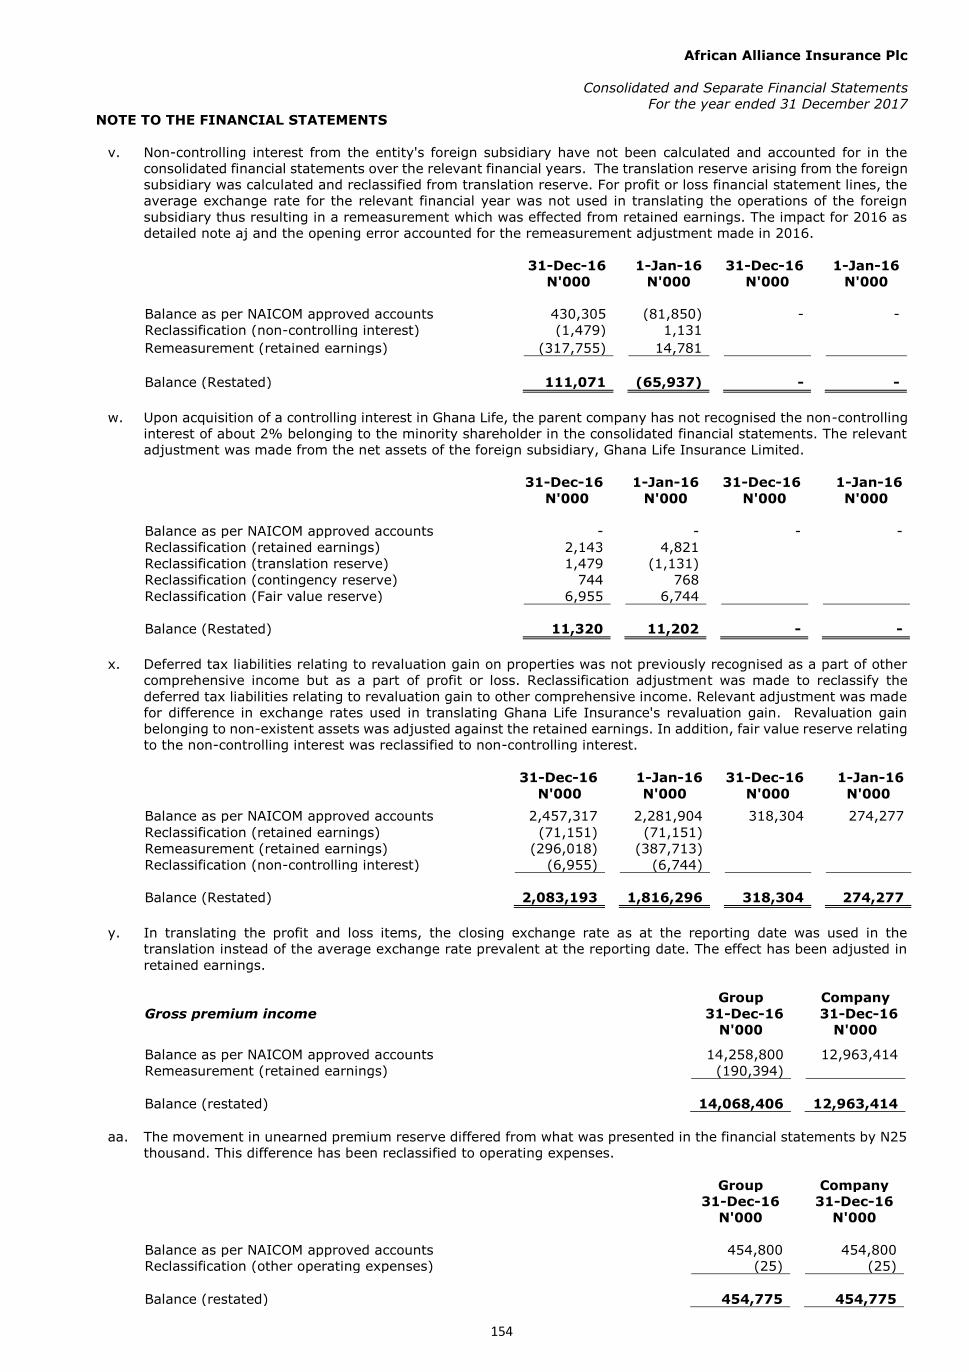
African Alliance Insurance Plc
Consolidated and Separate Financial Statements
For the year ended 31 December 2017
NOTE TO THE FINANCIAL STATEMENTS
154
v. Non-controlling interest from the entity's foreign subsidiary have not been calculated and accounted for in the
consolidated financial statements over the relevant financial years. The translation reserve arising from the foreign
subsidiary was calculated and reclassified from translation reserve. For profit or loss financial statement lines, the
average exchange rate for the relevant financial year was not used in translating the operations of the foreign
subsidiary thus resulting in a remeasurement which was effected from retained earnings. The impact for 2016 as
detailed note aj and the opening error accounted for the remeasurement adjustment made in 2016.
31-Dec-16 1-Jan-16 31-Dec-16 1-Jan-16
N'000 N'000 N'000 N'000
Balance as per NAICOM approved accounts 430,305 (81,850) - -
Reclassification (non-controlling interest) (1,479) 1,131
Remeasurement (retained earnings) (317,755) 14,781
Balance (Restated) 111,071 (65,937) - -
w. Upon acquisition of a controlling interest in Ghana Life, the parent company has not recognised the non-controlling
interest of about 2% belonging to the minority shareholder in the consolidated financial statements. The relevant
adjustment was made from the net assets of the foreign subsidiary, Ghana Life Insurance Limited.
31-Dec-16 1-Jan-16 31-Dec-16 1-Jan-16
N'000 N'000 N'000 N'000
Balance as per NAICOM approved accounts - - - -
Reclassification (retained earnings) 2,143 4,821
Reclassification (translation reserve) 1,479 (1,131)
Reclassification (contingency reserve) 744 768
Reclassification (Fair value reserve) 6,955 6,744
Balance (Restated) 11,320 11,202 - -
x. Deferred tax liabilities relating to revaluation gain on properties was not previously recognised as a part of other
comprehensive income but as a part of profit or loss. Reclassification adjustment was made to reclassify the
deferred tax liabilities relating to revaluation gain to other comprehensive income. Relevant adjustment was made
for difference in exchange rates used in translating Ghana Life Insurance's revaluation gain. Revaluation gain
belonging to non-existent assets was adjusted against the retained earnings. In addition, fair value reserve relating
to the non-controlling interest was reclassified to non-controlling interest.
31-Dec-16 1-Jan-16 31-Dec-16 1-Jan-16
N'000 N'000 N'000 N'000
Balance as per NAICOM approved accounts 2,457,317 2,281,904 318,304 274,277
Reclassification (retained earnings) (71,151) (71,151)
Remeasurement (retained earnings) (296,018) (387,713)
Reclassification (non-controlling interest) (6,955) (6,744)
Balance (Restated) 2,083,193 1,816,296 318,304 274,277
y. In translating the profit and loss items, the closing exchange rate as at the reporting date was used in the
translation instead of the average exchange rate prevalent at the reporting date. The effect has been adjusted in
retained earnings.
Group Company
Gross premium income 31-Dec-16 31-Dec-16
N'000 N'000
Balance as per NAICOM approved accounts 14,258,800 12,963,414
Remeasurement (retained earnings) (190,394)
Balance (restated) 14,068,406 12,963,414
aa. The movement in unearned premium reserve differed from what was presented in the financial statements by N25
thousand. This difference has been reclassified to operating expenses.
Group Company
31-Dec-16 31-Dec-16
N'000 N'000
Balance as per NAICOM approved accounts 454,800 454,800
Reclassification (other operating expenses) (25) (25)
Balance (restated) 454,775 454,775

African Alliance Insurance Plc
Consolidated and Separate Financial Statements
For the year ended 31 December 2017
NOTE TO THE FINANCIAL STATEMENTS
155
ab. The movement in reinsurance share of IBNR on outstanding claims was presented as a part of reinsurance premium
incurred. The movement in reinsurance share of IBNR should have been reflected in the claim recoveries. This has
been appropriate reclassified to claim recoveries in the restated accounts. In translating the reinsurance premium
incurred by the subsidiary, the average rate was not used in translating the reinsurance premium incurred but
instead the closing rate was used in the translation. The effect of this has been adjusted for appropriately in the
retained earnings.
Group Company
31-Dec-16 31-Dec-16
N'000 N'000
Balance as per NAICOM approved accounts (35,162) (10,913)
Reclassification (claim recoveries) (39,531) (39,531)
Remeasurement (retained earnings) 3,564
Balance (restated) (71,129) (50,444)
ac. In translating the claims incurred by the foreign subsidiary, the company utilised the closing exchange rate as at
the reporting date for relevant translation instead of utilising the average exchange rate in translating the claims
incurred by the foreign subsidiary. The effect of this error has been adjusted against the retained earnings.
Group Company
31-Dec-16 31-Dec-16
N'000 N'000
Balance as per NAICOM approved accounts 7,271,191 7,271,191
Remeasurement (retained earnings) (100,566) -
Balance (restated) 7,170,625 7,271,191
ad. The movement in reinsurance share of IBNR on outstanding claims was presented as a part of reinsurance premium
incurred. The movement in reinsurance share of IBNR should have been reflected in the claim recoveries. This has
been appropriate reclassified to claim recoveries in the restated accounts.
Group Company
31-Dec-16 31-Dec-16
N'000 N'000
Balance as per NAICOM approved accounts (9,456) (9,456)
Reclassification (claim recoveries) (39,531) (39,531)
Balance (restated) (48,987) (48,987)
ae. In translating the underwriting expenses incurred by the foreign subsidiary, the company utilised the closing
exchange rate as at the reporting date for relevant translation instead of utilising the average exchange rate in
translating the underwriting expenses incurred by the foreign subsidiary. The effect of this error has been adjusted
against the retained earnings.
Group Company
31-Dec-16 31-Dec-16
N'000 N'000
Balance as per NAICOM approved accounts 1,069,369 951,683
Remeasurement (retained earnings) (24,294) -
Balance (restated) 1,045,075 951,683
af. In translating the changes in insurance contracts of the foreign subsidiary, Ghana Life Insurance, the company
utilised the closing exchange rate as at the reporting date for relevant translation instead of utilising the average
exchange rate in translating the changes in insurance contracts of the foreign subsidiary. The effect of this error
has been adjusted against the retained earnings.
Group Company
31-Dec-16 31-Dec-16
N'000 N'000
Balance as per NAICOM approved accounts 5,146,264 4,786,979
Remeasurement (retained earnings) (52,807) -
Balance (restated) 5,093,457 4,786,979

African Alliance Insurance Plc
Consolidated and Separate Financial Statements
For the year ended 31 December 2017
NOTE TO THE FINANCIAL STATEMENTS
156
ag. Investment income on financial assets belonging to Ghana Life Insurance was reclassified to investment income in
order to align with the group's presentation as it pertains investment income. Exchange loss incurred during the
year belonging to Axiom Air Limited, a wholly owned subsidiary, was reclassified from other operating and
administration expenses to other income due to the nature of the expenses. In addition, the closing exchange rate
as at the reporting date was used in translating other income instead of using the average exchange rate. Other
income was retranslated using the average exchange rate and the relevant differential was adjusted against
retained earnings.
Group Company
31-Dec-16 31-Dec-16
N'000 N'000
Balance as per NAICOM approved accounts 139,038 98,959
Reclassification (investment income) (7,855)
Reclassification (other operating and administrative expenses) (84,239)
Remeasurement (retained earnings) (3,058) -
Balance (restated) 43,886 98,959
ah. Investment income on financial assets belonging to Ghana Life Insurance was reclassified to investment income in
order to align with the group's presentation as it pertains investment income. In addition, the closing exchange
rate as at the reporting date was used in translating investment income instead of using the average exchange
rate. Investment income was retranslated using the average exchange rate and the relevant differential was
adjusted against retained earnings.
Group Company
31-Dec-16 31-Dec-16
N'000 N'000
Balance as per NAICOM approved accounts 3,215,002 3,067,525
Reclassification (investment income) 7,855
Remeasurement (retained earnings) (22,830) -
Balance (restated) 3,200,027 3,067,525
ai. In translating the fair value gain on investment property earned by the foreign subsidiary, the company utilised
the closing exchange rate as at the reporting date for relevant translation instead of utilising the average exchange
rate in translating the underwriting expenses incurred by the foreign subsidiary. The effect of this error has been
adjusted against the retained earnings
Group Company
31-Dec-16 31-Dec-16
N'000 N'000
Balance as per NAICOM approved accounts 725,646 556,900
Remeasurement (retained earnings) (24,802) -
Balance (restated) 700,844 556,900
aj. A prior year adjustment of N591 Million was made against deposit administration in the consolidated financial
statements and not in the separate financial statements. The same amount was adjusted in the retained earnings
of the parent company in its separate financial statements. The adjustment was made as a result of inadequate
reconciliation. The prior year adjustment was thus charged to profit or loss of 2016 financial statements as there
were no errors observed in the amount stated as investment contract liabilities.
Group Company
31-Dec-16 31-Dec-16
N'000 N'000
Balance as per NAICOM approved accounts (103,735) (103,735)
Remeasurement (retained earnings) (591,769) (591,769)
Balance (restated) (695,504) (695,504)
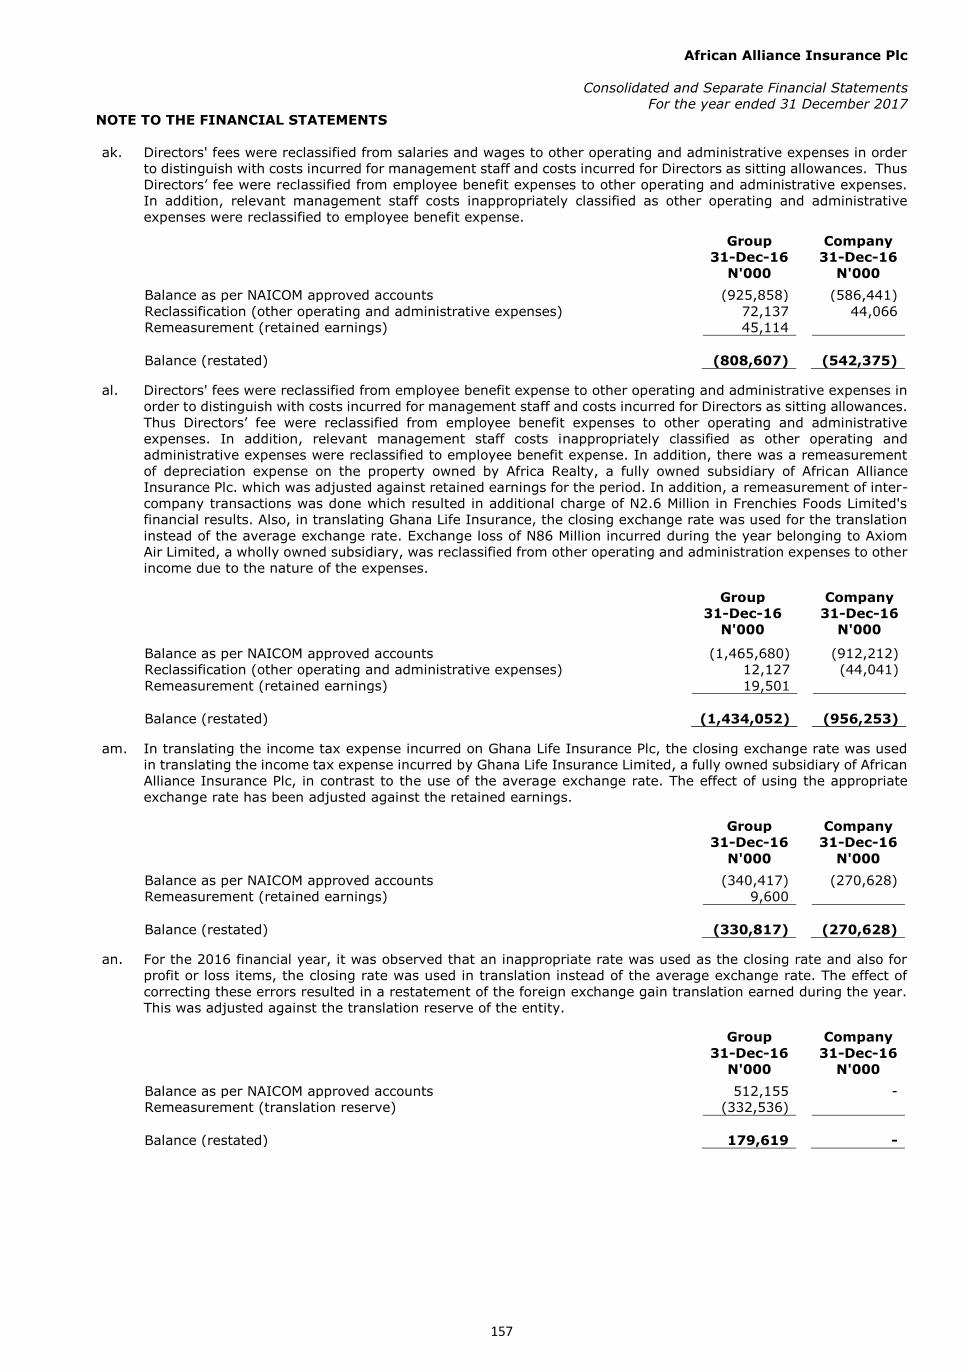
African Alliance Insurance Plc
Consolidated and Separate Financial Statements
For the year ended 31 December 2017
NOTE TO THE FINANCIAL STATEMENTS
157
ak. Directors' fees were reclassified from salaries and wages to other operating and administrative expenses in order
to distinguish with costs incurred for management staff and costs incurred for Directors as sitting allowances. Thus
Directors’ fee were reclassified from employee benefit expenses to other operating and administrative expenses.
In addition, relevant management staff costs inappropriately classified as other operating and administrative
expenses were reclassified to employee benefit expense.
Group Company
31-Dec-16 31-Dec-16
N'000 N'000
Balance as per NAICOM approved accounts (925,858) (586,441)
Reclassification (other operating and administrative expenses) 72,137 44,066
Remeasurement (retained earnings) 45,114
Balance (restated) (808,607) (542,375)
al. Directors' fees were reclassified from employee benefit expense to other operating and administrative expenses in
order to distinguish with costs incurred for management staff and costs incurred for Directors as sitting allowances.
Thus Directors’ fee were reclassified from employee benefit expenses to other operating and administrative
expenses. In addition, relevant management staff costs inappropriately classified as other operating and
administrative expenses were reclassified to employee benefit expense. In addition, there was a remeasurement
of depreciation expense on the property owned by Africa Realty, a fully owned subsidiary of African Alliance
Insurance Plc. which was adjusted against retained earnings for the period. In addition, a remeasurement of inter-
company transactions was done which resulted in additional charge of N2.6 Million in Frenchies Foods Limited's
financial results. Also, in translating Ghana Life Insurance, the closing exchange rate was used for the translation
instead of the average exchange rate. Exchange loss of N86 Million incurred during the year belonging to Axiom
Air Limited, a wholly owned subsidiary, was reclassified from other operating and administration expenses to other
income due to the nature of the expenses.
Group Company
31-Dec-16 31-Dec-16
N'000 N'000
Balance as per NAICOM approved accounts (1,465,680) (912,212)
Reclassification (other operating and administrative expenses) 12,127 (44,041)
Remeasurement (retained earnings) 19,501
Balance (restated) (1,434,052) (956,253)
am. In translating the income tax expense incurred on Ghana Life Insurance Plc, the closing exchange rate was used
in translating the income tax expense incurred by Ghana Life Insurance Limited, a fully owned subsidiary of African
Alliance Insurance Plc, in contrast to the use of the average exchange rate. The effect of using the appropriate
exchange rate has been adjusted against the retained earnings.
Group Company
31-Dec-16 31-Dec-16
N'000 N'000
Balance as per NAICOM approved accounts (340,417) (270,628)
Remeasurement (retained earnings) 9,600
Balance (restated) (330,817) (270,628)
an. For the 2016 financial year, it was observed that an inappropriate rate was used as the closing rate and also for
profit or loss items, the closing rate was used in translation instead of the average exchange rate. The effect of
correcting these errors resulted in a restatement of the foreign exchange gain translation earned during the year.
This was adjusted against the translation reserve of the entity.
Group Company
31-Dec-16 31-Dec-16
N'000 N'000
Balance as per NAICOM approved accounts 512,155 -
Remeasurement (translation reserve) (332,536)
Balance (restated) 179,619 -

African Alliance Insurance Plc
Consolidated and Separate Financial Statements
For the year ended 31 December 2017
NOTE TO THE FINANCIAL STATEMENTS
158
ao. The property belonging to Africa Realty, a wholly owned subsidiary of African Alliance Insurance Plc, fair valued in
the 2016 financial year which was not considered in the determination of the revaluation gain earned by the group.
This was accounted appropriately and adjusted against the fair value reserve. In addition, an inappropriate rate
was used in translating the foreign subsidiary which was not consistent with what was used in previous year. The
effect of this has been adjusted against retained earnings.
Group Company
31-Dec-16 31-Dec-16
N'000 N'000
Balance as per NAICOM approved accounts 175,413 44,027
Remeasurement (fair value reserve) 93,829
Remeasurement (retained earnings) (2,134)
Balance (restated) 267,108 44,027
47 Other income statement information: Staff and directors cost
Employee costs during the year amounted to: Group Company
31-Dec-17 31-Dec-16 31-Dec-17 31-Dec-16
N’000 N’000 N’000 N’000
Wages & salaries 757,125 652,042 492,937 452,004
Pension cost 51,956 44,559 23,667 23,233
Other staff cost 104,875 98,667 52,586 53,798
Staff defined benefit 100,183 13,340 100,183 13,340
1,014,139 808,608 669,373 542,375
The exit bonus become payable when employee exit the group at the age of 60 and satisfies performance criteria
The number of employees of the company, other than directors, who received emoluments in the following ranges
was:
Group Company
31-Dec-17 31-Dec-16 31-Dec-17 31-Dec-16
Number Number Number Number
N1,000,001 - N1,500,000 60 65 5 10
N1,500,001 - N2,000,000 10 11 10 11
N2,000,001 - N2,500,000 5 25 5 25
N2,500,001 - N3,000,000 41 14 41 14
N3,000,001 - N3,500,000 2 8 2 8
N3,500,001 - N4,000,000 11 3 11 3
Above N4,000,000 20 14 20 14
149 140 94 85
iii. The average number of full time persons employed by the Company during the year per level were as followed:
Executive director
4 5 2 3
Management staff 9 9 6 6
Non-management staff 140 131 88 79
153 145 96 88

African Alliance Insurance Plc
Consolidated and Separate Financial Statements
For the year ended 31 December 2017
NOTE TO THE FINANCIAL STATEMENTS
159
Directors’ remuneration:
i. Remuneration paid to the directors of the Company were as follows:
Group Company
31-Dec-17 31-Dec-16 31-Dec-17 31-Dec-16
N’000 N’000 N’000 N’000
Short term benefits:
- Directors fees 20,000 78,000 20,000 78,000
- Directors sitting allowances 5,375 7,150 5,375 7,150
- Executive compensation 37,921 53,204 37,921 53,204
- Other directors costs and expenses 2,500 - 2,500 -
65,796 138,354 65,796 138,354
Fees and other emoluments disclosed above include amounts paid to :
The Chairman - 20,000 - 20,000
The highest paid director 19,033 25,242 19,033 25,242
The number of directors who received fees and other emoluments (excluding pension contributions) in the
following ranges was:
Group Company
31-Dec-17 31-Dec-16 31-Dec-17 31-Dec-16
Number Number Number Number
Below N5,000,000 - - - -
N5,000,000- N10,000,000 - - - -
N10,000,000 and above 2 3 2 3
2 3 2 3

African Alliance Insurance Plc
Consolidated and Separate Financial Statements
For the year ended 31 December 2017
NOTE TO THE FINANCIAL STATEMENTS
160
48 Related parties
Shareholders 31-Dec-17 31-Dec-16
Conau Limited 57.39% 57.49%
Universal Insurance Plc 5.83% 5.83%
Nature of the balance Related party 2017 2016
N’000 N’000
Intercompany receivable Frenchies Foods Ltd - 3,576
intercompany receivables Axiom Air Ltd 408,339 406,839
Intercompany receivable African Alliance Holding Limited 8,150 8,150
intercompany receivables Universal Insurance
Company Plc 1,600,267 1,600,267
intercompany receivables African Alliance Trustees
Limited 105 105
Premium receivable - -
Due to related party - -
Intercompany payable - -
Transactions with directors
Remuneration is paid to directors in the form of fees to non-executive directors and remuneration to executive
directors of the Company. All directors of the Company have notified that they did not have any interest in
transactions recorded within the reporting period. Key management personnel transactions with the Group have
been disclosed in note 39.
Directors’ remuneration:
ii. Remuneration paid to the directors of the Company were as follows:
Group Company
31-Dec-17 31-Dec-16 31-Dec-17 31-Dec-16
N’000 N’000 N’000 N’000
Short term benefits:
- Directors fees 20,000 78,000 20,000 78,000
- Directors Sitting Allowances 5,375 7,150 5,375 7,150
- Executive Compensation 37,921 53,204 37,921 53,204
- Other Directors Costs and Expenses 2,500 - 2,500 -
65,796 138,354 65,796 138,354
Fees and other emoluments disclosed above include amounts paid to :
The Chairman - 20,000 - 20,000
The highest paid director 19,033 25,242 19,033 25,242
The number of directors who received fees and other emoluments (excluding pension contributions) in the
following ranges was:
Group Company
31-Dec-17 31-Dec-16 31-Dec-17 31-Dec-16
Number Number Number Number
Below N5,000,000 - - - -
N5,000,000- N10,000,000 - - - -
N10,000,000 and above 2 3 2 3
2 3 2 3
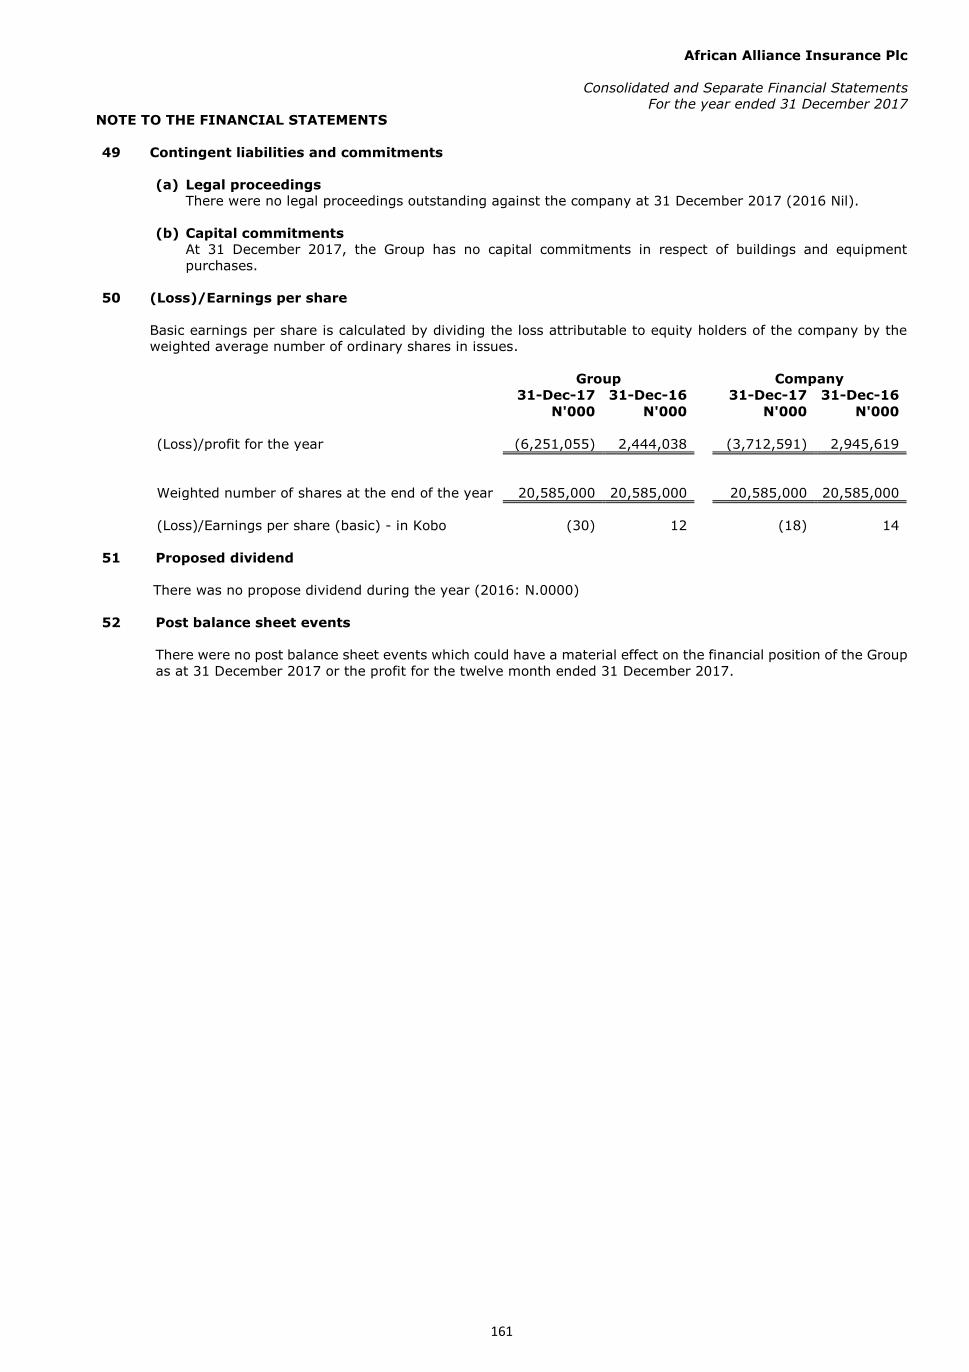
African Alliance Insurance Plc
Consolidated and Separate Financial Statements
For the year ended 31 December 2017
NOTE TO THE FINANCIAL STATEMENTS
161
49 Contingent liabilities and commitments
(a) Legal proceedings
There were no legal proceedings outstanding against the company at 31 December 2017 (2016 Nil).
(b) Capital commitments
At 31 December 2017, the Group has no capital commitments in respect of buildings and equipment
purchases.
50 (Loss)/Earnings per share
Basic earnings per share is calculated by dividing the loss attributable to equity holders of the company by the
weighted average number of ordinary shares in issues.
Group Company
31-Dec-17 31-Dec-16 31-Dec-17 31-Dec-16
N'000 N'000 N'000 N'000
(Loss)/profit for the year (6,251,055) 2,444,038 (3,712,591) 2,945,619
Weighted number of shares at the end of the year 20,585,000 20,585,000 20,585,000 20,585,000
(Loss)/Earnings per share (basic) - in Kobo (30) 12 (18) 14
51 Proposed dividend
There was no propose dividend during the year (2016: N.0000)
52 Post balance sheet events
There were no post balance sheet events which could have a material effect on the financial position of the Group
as at 31 December 2017 or the profit for the twelve month ended 31 December 2017.

African Alliance Insurance Plc
Consolidated and Separate Financial Statement
For the year ended 31 December 2017
162
OTHER NATIONAL DISCLOSURES
(a) Value Added Statement
Group Company
2017 2016 2017 2016
N'000 % N'000 % N'000 % N'000 %
Net insurance premium Income 7,533,138 14,465,397 6,251,479 13,381,090
Fee and Commission Income -
Insurance Contracts 5212 13,345 5,212 13,345
Net Investment Income 5,205,238 4,416,970 4,890,878 4,195,597
Other services bought (18,402,332) (14,704,492) (14,813,380) (13,435,843)
Value added (5,658,744) 100 4,191,220 100 (3,665,811) 100 4,154,189 100
Applied as follows:
In payment of employees:
- Salaries, wages and other benefits 1,014,139 808,607 669,373 542,375
In payment to providers of capital:
- Interest on loan 5,179 - 5,179 -
In payment to Government
- Taxation 50,231 30,080 50,231 30,080
For future replacement of assets,
expansion of business and payment
of dividend to shareholders: - Deferred Taxation (754,809) 235,992 (726,488) 180,278
- Depreciation & Amortisation 329,589 307,714 113,246 102,098
- Contingency reserve 76,097 364,789 63,354 353,739
- (Loss)/profit for the year (6,379,170) 2,444,038 (3,840,706) 2,945,619
(5,658,744) 100 4,191,220 100 (3,665,811) 100 4,154,189 100

African Alliance Insurance Plc
Consolidated and Separate Financial Statement
For the year ended 31 December 2017
163
OTHER NATIONAL DISCLOSURES
(b) Financial Summary (bi) Group 31 Dec 31 Dec 31 Dec 31 Dec 31 Dec
2017 2016 2015 2014 2013
ASSETS ₦'000 ₦'000 ₦'000 ₦'000 ₦'000
Cash and Cash equivalent 6,006,807 6,873,981 4,161,876 2,434,395 1,707,104
Financial Assets 22,753,040 \23,665,513 18,574,910 11,209,586 5,846,470
Trade receivables 41,918 168,658 59,962 74,213 54,181
Reinsurance Assets 53,717 76,772 34,339 917 173
Other receivables and prepayments 341,178 439,945 861,111 25,869 16,733
Deferred acquisition cost - 15,717 7,392 377,852 324,113
Investment properties 10,794,603 7,772,882 6,785,365 6,610,976 6,042,924
Investment in Subsidiary - - - - -
Investment in associate 1,605,405 1,341,159 1,234,148 1,229,554 1,062,455
Retirement benefit asset 7,063
Deferred tax asset 147,881 26,226 27,871 34,305 28,015
Intangible assets 63,959 56,130 66,412 48,597 29,958
Property and Equipment 1,666,110 4,901,209 4,698,386 4,551,019 4,174,162
Statutory deposit 348,965 309,978 222,597 219,144 218,347
Total Assets 43,830,646 45,648,170 36,734,369 26,816,429 19,504,635
LIABILITIES
Insurance Contract liabilities 36,378,453 31,611,594 26,620,780 13,000,434 7,066,878
Investment Contract liabilities 4,927,104 5,411,398 4,408,274 4,446,262 3,812,220
Trade payables 1,177,117 1,183,273 1,594,059 436,367 458,680
Other payables and accruals 563,265 535,742 487,495 472,456 653,690
Employee benefit liabilities 29,335 59,544 72,378 121,821 128,815
Borrowings 287,652 67,110 25,564 34,452 15,852
Tax payable 594,024 363,544 294,254 204,462 182,367
Deferred tax liabilities 384,874 953,540 659,904 592,666 437,631
Total Liabilities 44,341,824 40,185,745 34,162,708 19,308,829 12,756,133

African Alliance Insurance Plc
Consolidated and Separate Financial Statement
For the year ended 31 December 2017
164
31 Dec 31 Dec 31 Dec 31 Dec 31 Dec
2017 2016 2015 2014 2013
EQUITY ₦'000 ₦'000 ₦'000 ₦'000 ₦'000
Share Capital 10,292,500 10,292,500 10,292,500 10,292,500 10,292,500
Share Premium 14,365,133 14,365,133 14,365,133 14,365,133 14,365,133
Contingency Reserve 908,259 832,162 467,349 317,966 209,401
Retained Earnings (27,403,965) (22,232,954) (24,314,881) (19,606,612) (20,038,420)
Translation Reserve 186,441 111,070 (65,938) (49,699)
Non-Controlling Interest 7,815 11,321 11,202 - -
Fair Value Reserve 1,004,524 2,083,193 1,816,296 2,188,312 1,919,888
Total Equity (511,178) 5,462,425 2,571,661 7,507,600 6,748,502
Total Liabilities & Equity 43,830,646 45,648,170 36,734,369 26,816,429 19,504,635
INCOME STATEMENTS
Gross Premium written 7,626,710 14,068,406 14,442,436 10,802,772 7,275,079
Gross Premium income 7,586,932 14,523,181 14,400,292 10,732,198 7,195,937
Profit before tax (6,726,979) 2,774,855 (744,063) 710,930 1,462,405
Income tax expense 475,924 (330,817) (197,236) (224,957) (57,725)
Profit after tax (6,251,055) (2,444,038) (4,744,063) 485,973 1,404,679
Other Comprehensive income (57,696) 446,727 (197,236) - -
Total comprehensive income (6,308,751) 2,890,765 (4,941,299) 485,973 1,404,679
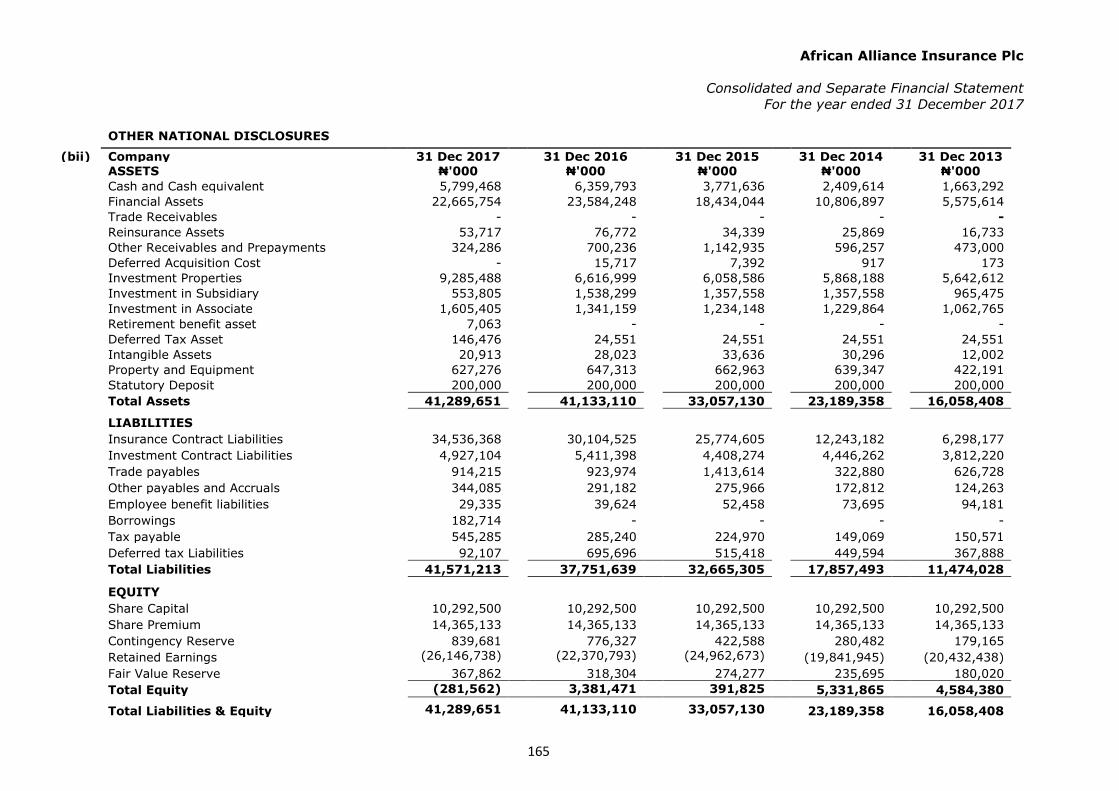
African Alliance Insurance Plc
Consolidated and Separate Financial Statement
For the year ended 31 December 2017
165
OTHER NATIONAL DISCLOSURES
(bii) Company 31 Dec 2017 31 Dec 2016 31 Dec 2015 31 Dec 2014 31 Dec 2013 ASSETS ₦'000 ₦'000 ₦'000 ₦'000 ₦'000
Cash and Cash equivalent 5,799,468 6,359,793 3,771,636 2,409,614 1,663,292
Financial Assets 22,665,754 23,584,248 18,434,044 10,806,897 5,575,614
Trade Receivables - - - - -
Reinsurance Assets 53,717 76,772 34,339 25,869 16,733
Other Receivables and Prepayments 324,286 700,236 1,142,935 596,257 473,000
Deferred Acquisition Cost - 15,717 7,392 917 173
Investment Properties 9,285,488 6,616,999 6,058,586 5,868,188 5,642,612
Investment in Subsidiary 553,805 1,538,299 1,357,558 1,357,558 965,475
Investment in Associate 1,605,405 1,341,159 1,234,148 1,229,864 1,062,765
Retirement benefit asset 7,063 - - - -
Deferred Tax Asset 146,476 24,551 24,551 24,551 24,551
Intangible Assets 20,913 28,023 33,636 30,296 12,002
Property and Equipment 627,276 647,313 662,963 639,347 422,191
Statutory Deposit 200,000 200,000 200,000 200,000 200,000
Total Assets 41,289,651 41,133,110 33,057,130 23,189,358 16,058,408
LIABILITIES
Insurance Contract Liabilities 34,536,368 30,104,525 25,774,605 12,243,182 6,298,177
Investment Contract Liabilities 4,927,104 5,411,398 4,408,274 4,446,262 3,812,220
Trade payables 914,215 923,974 1,413,614 322,880 626,728
Other payables and Accruals 344,085 291,182 275,966 172,812 124,263
Employee benefit liabilities 29,335 39,624 52,458 73,695 94,181
Borrowings 182,714 - - - -
Tax payable 545,285 285,240 224,970 149,069 150,571
Deferred tax Liabilities 92,107 695,696 515,418 449,594 367,888
Total Liabilities 41,571,213 37,751,639 32,665,305 17,857,493 11,474,028
EQUITY
Share Capital 10,292,500 10,292,500 10,292,500 10,292,500 10,292,500
Share Premium 14,365,133 14,365,133 14,365,133 14,365,133 14,365,133
Contingency Reserve 839,681 776,327 422,588 280,482 179,165
Retained Earnings (26,146,738) (22,370,793) (24,962,673) (19,841,945) (20,432,438)
Fair Value Reserve 367,862 318,304 274,277 235,695 180,020
Total Equity (281,562) 3,381,471 391,825 5,331,865 4,584,380
Total Liabilities & Equity 41,289,651 41,133,110 33,057,130 23,189,358 16,058,408
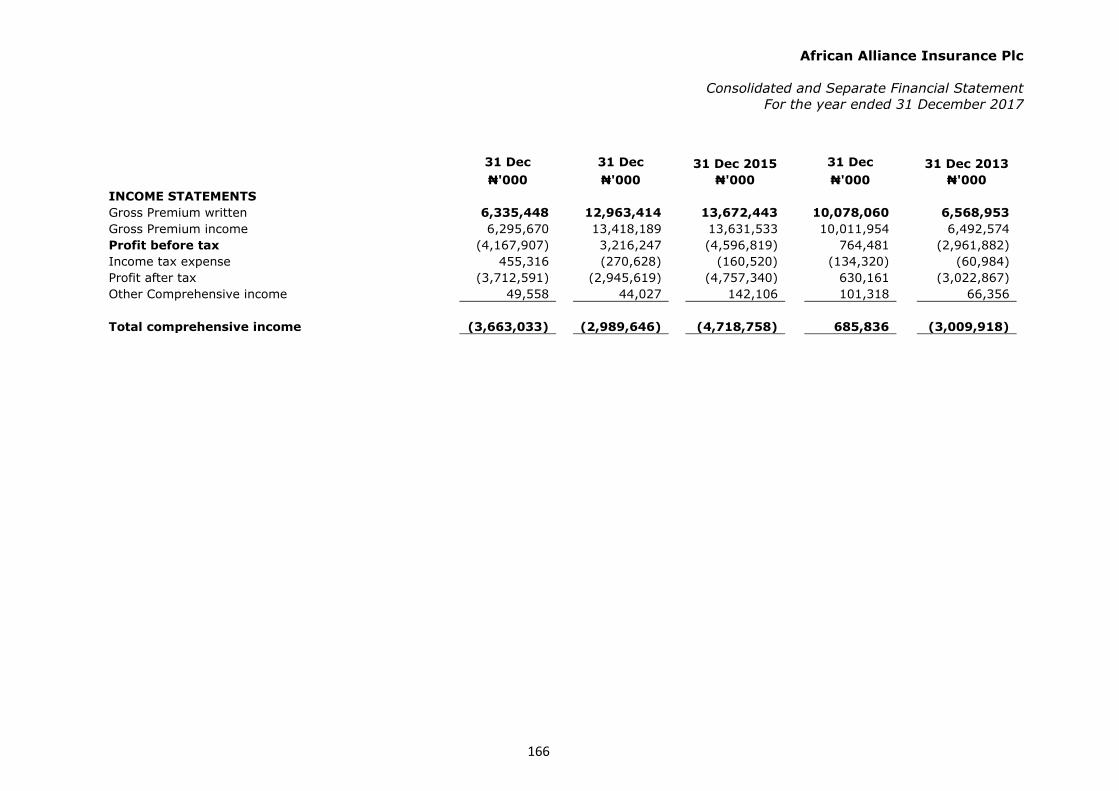
African Alliance Insurance Plc
Consolidated and Separate Financial Statement
For the year ended 31 December 2017
166
31 Dec 2017
31 Dec 2016
31 Dec 2015 31 Dec 2014
31 Dec 2013
₦'000 ₦'000 ₦'000 ₦'000 ₦'000
INCOME STATEMENTS
Gross Premium written 6,335,448 12,963,414 13,672,443 10,078,060 6,568,953
Gross Premium income 6,295,670 13,418,189 13,631,533 10,011,954 6,492,574
Profit before tax (4,167,907) 3,216,247 (4,596,819) 764,481 (2,961,882)
Income tax expense 455,316 (270,628) (160,520) (134,320) (60,984)
Profit after tax (3,712,591) (2,945,619) (4,757,340) 630,161 (3,022,867)
Other Comprehensive income 49,558 44,027 142,106 101,318 66,356
Total comprehensive income (3,663,033) (2,989,646) (4,718,758) 685,836 (3,009,918)