AFRICA RENEWABLE ENERGY FUND - … · la distribution de l’NRJ hydroélectrique des principaux...
64
Case study: Small hydro development in Uganda April 2018 AFRICA RENEWABLE ENERGY FUND
Transcript of AFRICA RENEWABLE ENERGY FUND - … · la distribution de l’NRJ hydroélectrique des principaux...

Case study: Small hydro development in Uganda April 2018
AFRICA RENEWABLE ENERGY FUND

1
Outline
Berkeley Energy Uganda Uganda power sector foundations IPP milestones Key documents and terms Benefits of small hydro Berkeley Energy activity in Cameroon

Berkeley Energy Uganda
12
Berkeley Energy has developed, constructed, operated and managed 4 hydro projects in Uganda totalling 110MW, which makes us the market leader in small/medium hydro in the country.
41 MW Achwa 2 In construction, COD Q4 2018
1
42 MW Achwa 1 In construction, COD Q2 2020
13 MW Bugoye Operational since 2009
2
3
14 MW Kikagati In construction, COD Q2 2020
4

Achwa 2 – Uganda – concreting of headrace channel Achwa 2 – Uganda – Powerhouse and penstocks
Achwa 2 – Uganda – intake structureAchwa 2 – Uganda – Achwa river and weir structure
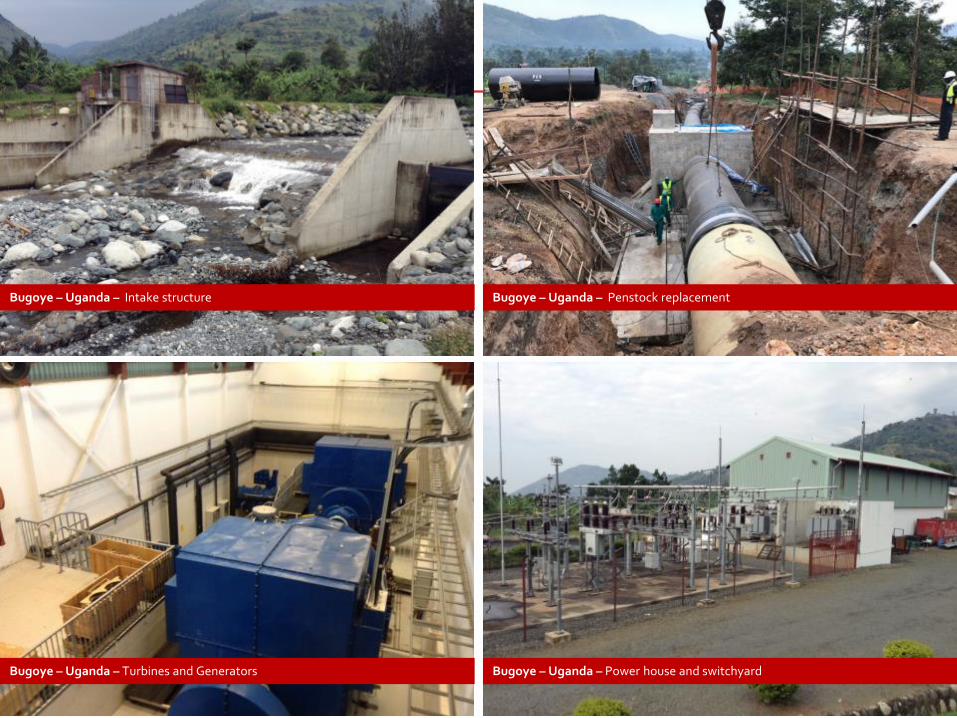
Bugoye – Uganda – Turbines and Generators Bugoye – Uganda – Power house and switchyard
Bugoye – Uganda – Penstock replacementBugoye – Uganda – Intake structure

Kikagati – Uganda / Tanzania Site enabling works

6
Uganda power sector foundations Well designed sector unbundling was the prerequisite for sector reform
UETCL Umeme
Industrial
Commercial
Domestic IPPs
State owned
Generation Transmission Distribution End-customers
The 1999 Electricity Act unbundled the state-owned Uganda Electricity Board, into: Uganda Electricity Transmission Company Limited, owns the transmission assets (>33kV) and acts as
single buyer Uganda Electricity Generation Company Limited, which owns the state generation assets, and Uganda Electricity Distribution Limited, which owns the distribution network (<33kV)
A 20-year private concession was signed in 2005 for Umeme to operate the distribution of electricity.
PPA
PPA
Bulk supply Retail

7
Uganda power sector foundations Independent regulator and Ministry of Energy played within their clearly defined roles and responsibly managed the sector to ensure a stable environment
The Act also created the Electricity Regulatory Authority (“ERA”), which acts as an independent regulator and provides regulatory oversight to the sector;
ERA issues feasibility permits for projects under development and generation licences once projects have completed feasibility studies, which stipulate clear requirements;
ERA monitors the supply and demand forecasts of the sector and determines which projects can be issued permits and licences.
Independent regulator
The end user tariff is cost reflective and considers all of the costs in the system including generation, deemed generation, transmission and distribution;
ERA undertakes quarterly reviews of the tariff.
Cost-reflective
tariff
Ministry of Energy and Mineral Development, in consultation with sector stakeholders, is responsible for establishing new policy;
Clear policy decision was taken to encourage new IPPs to ensure long term sustainability of supply.
Clear policy framework

IPP milestones
12
Sound policy and regulatory activity, together with well-run electricity distribution, has created the basis for IPP development. Systematic approach to small hydro sector has resulted in very strong investor activity.
Renewable Energy Law introduced. Tariff too low to
make projects viable 2007
Unbundling of Electricity
Sector
1999
Private concession Umeme to operate
distribution
2005 First small hydro IPPs negotiated on
a bilateral basis: Bugoye (2009), Mpanga (2010), Ishasha (2011) and
Kabalega (2013)
2009 - 2013
Introduction of GET FIT mechanism providing
bankable framework and subsidy
2013
Projects proceed through GET FIT
mechanism
2015-2020
GET FIT catalyses projects to proceed
outside of framework
2015-2020
320 MW across 29 small renewable
energy IPPs are in progress
2020
First large IPP in country: 250MW
Bujagali hydro
2007

IPP milestones
12
Approximately 320MW is being delivered across 29 small renewable energy IPPs, using hydro, solar and bagasse technologies, owned by a diverse set of investors
31 44 44
69 69 78
95 95 102
121
167
244
324
0
50
100
150
200
250
300
350
2008 2009 2010 2011 2012 2013 2014 2015 2016 2017 2018 2019 2020
Small Renewable Energy IPP Growth
GET FIT Hydro Sm Med Hydro Solar Bagasse

10
Key documents and terms GET FIT introduced template documents and tariff support to catalyse projects
Short-term Liquidity Support: UETCL provides a bank guarantee of 2-3 months revenue that the IPP can draw in the event of late payment;
Deemed Energy: IPP is to be paid if it is able to produce electricity. IPP’s investment is based on it being able to produce when it is available and hence it cannot take the risk that the grid or offtaker is not able to take its energy.
Limited Penalties: capped and reasonable penalties for late delivery of project and low availability that take into account the risk being taken by the IPP
Power Purchase
Agreement (“PPA”)
Support: Provision of support by the government for obtaining key permits and land Free transfer: Facilitate the free transfer of funds necessary to implement the project Termination payments: Government to make acquire the plant through specified termination
payments in the event of termination of the PPA or Government Support Agreement with specified values to be agreed for i) political force majeure, ii) other force majeure, iii) Government events of default and iv) IPP events of default.
Government Support
Agreement
KFW backed programme to catalyse small renewable energy IPPs. It introduced a standardised Power Purchase Agreement and Government Support Agreement and provided a tariff subsidy to facilitate projects.
GET FIT

11
Benefits of small hydro Several aspects of quantifiable project benefits that can be recognised locally and at a macro level
Job creation during construction and operation. Significant training and skills transfer Local infrastructure: roads and power supply. Boosting electrification in underserved areas Community projects, e.g. schools, health centres, etc as prioritised by the community
Localised development
Foreign direct investment that boosts country/sector standing as investment destinations Tax revenue during construction and operation Creation of assets whose longevity will benefit the country in decades to come
Economic benefits
Additional energy supplied to the grid, thus reducing dependence on thermal power generation Small, manageable increments in capacity that can be added in step with demand growth Improvement in quality of power delivered through the grid Reduction of transmission and distribution losses High level of production from a hydro renewable energy source
Distributed power
generation
Run of river hydro design with much lower impact than conventional hydro dam projects Adherence to high international standards of environmental and social governance in project
development and delivery
Environmental and social
considerations

12
Berkeley Energy activity in Cameroon
Berkeley Energy has identified and is evaluating six hydro project sites in the South-West region near the city of Kumba
MoU was signed with the Government of Cameroon in September 2017 for these projects
The following key steps have been achieved: Established a Cameroon company and a
local development team with presence in the region;
Actively engaged with village communities and signed MoU with local authorities representing them;
Carried out preliminary hydrology and grid studies based on available data;
Installed flow gauges in the rivers in order to substantiate the hydrology study;
Brought in a technical partner to accelerate the feasibility studies;
Carried out topographic survey.
Berkeley Energy is replicating its hydro delivery strategy in Cameroon

AFRICA RENEWABLE ENERGY FUND
13

élaboration DE la FEUillE DE roUtE PoUr la ProMotion DES
énErgiES rEnoUVElablES En aFriQUE CEntralE
Yaoundé, le 18 avril 2018
Par: Jean KOUTELE Expert en Energie - CEEAC Email: [email protected]

1- Bref aperçu de La CEEAC a) Présentation; b) Potentiel en Energies Renouvelables c) Etat des lieux (Installation / Consommation)
2- Action en cours 3- Perspectives 4- Objectifs globaux 5- Conclusions

Superficie: 6,6 Millions Km ² Population: 163 Millions d’habitants (en 2015)
La CEEAC en Afrique:
11 Etats membres

Création: octobre 1983 Siège: Libreville - Gabon Mission: Promouvoir et renforcer une
coopération harmonieuse et un développement dynamique, équilibré et auto-entretenu dans tous les domaines de l’activité économique et sociale.
Vision stratégique: Place explicitement l’Energie parmi les axes prioritaires pour l’intégration régionale (d’ici 2025)

Massif forestier: le 2e au monde (302 Millions ha)
• Importante biomasse Hydroélectricité: 150 000 MW environ,
représente 58% du potentiel africain (avec 100 000 MW en RDC; 23 000 MW au Cameroun)
Solaire: Dont le flux varie entre 5 et 7,5 KWh/m²/jour
Eolien: Vitesse moyenne du vent: 6 m/s

Le flux solaire varie entre 5 et 7,5 KWh/m²/jour
Le gisement solaire est important en Angola, au Cameroun, en RCA, et au Tchad, favorable à l’implantation de centrales solaires.
• Les autres Etats de la CEEAC peuvent accueillir des équipements décentralisés Source: Livre Blanc CEEAC / CEMAC
Issu du Laboratoire US des EnR

Le gisement éolien, peu Important en Afrique Centrale Pourrait néanmoins participer Au mix énergétique de la Région, Notamment au Cameroun, Centrafrique, Congo, Gabon, Guinée Equatoriale, Sao Tome & Principe et Tchad
Source: « Livre Blanc CEEAC/CEMAC)
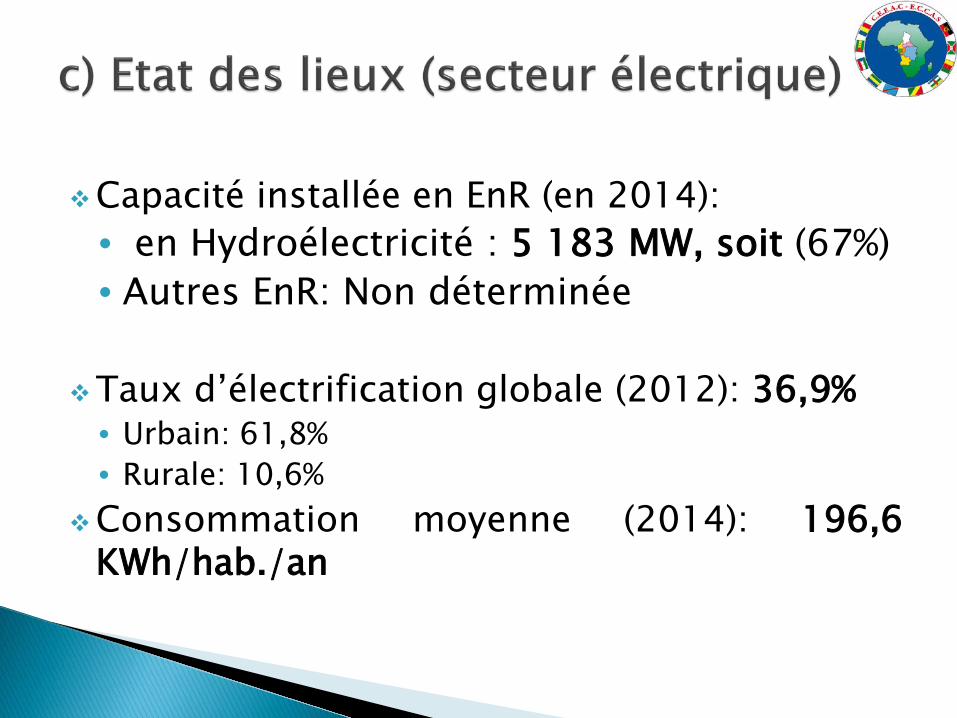
Capacité installée en EnR (en 2014): • en Hydroélectricité : 5 183 MW, soit (67%) • Autres EnR: Non déterminée
Taux d’électrification globale (2012): 36,9% • Urbain: 61,8% • Rurale: 10,6%
Consommation moyenne (2014): 196,6 KWh/hab./an

Ce Protocole vise entre autres: L’harmonisation et la coordination entre les
Etats, de leurs Politiques et activités dans le domaine de l’NRJ.
La coopération entre Etats pour l’inventaire la planification l’aménagement l’exploitation et la distribution de l’NRJ hydroélectrique des principaux bassins fluviaux et leurs affluents.
La coopération entre Etats dans la recherche et la mise en valeur des ressources d’EnR telles que: Solaire, Eolien, Géothermie, Biomasse.

Elaboration de la Politique Energétique de l’Afrique Centrale (processus en cours).
Elaboration de la Feuille de Route pour la promotion des EnR en Afrique Centrale (rédaction en cours);
Etude de faisabilité en vue la création et l’opérationnalisation d’une structure en charge des EnR en Afrique Centrale
Etude de faisabilité pour développement sites hydroélectriques de Booué et Tsengue Leledi
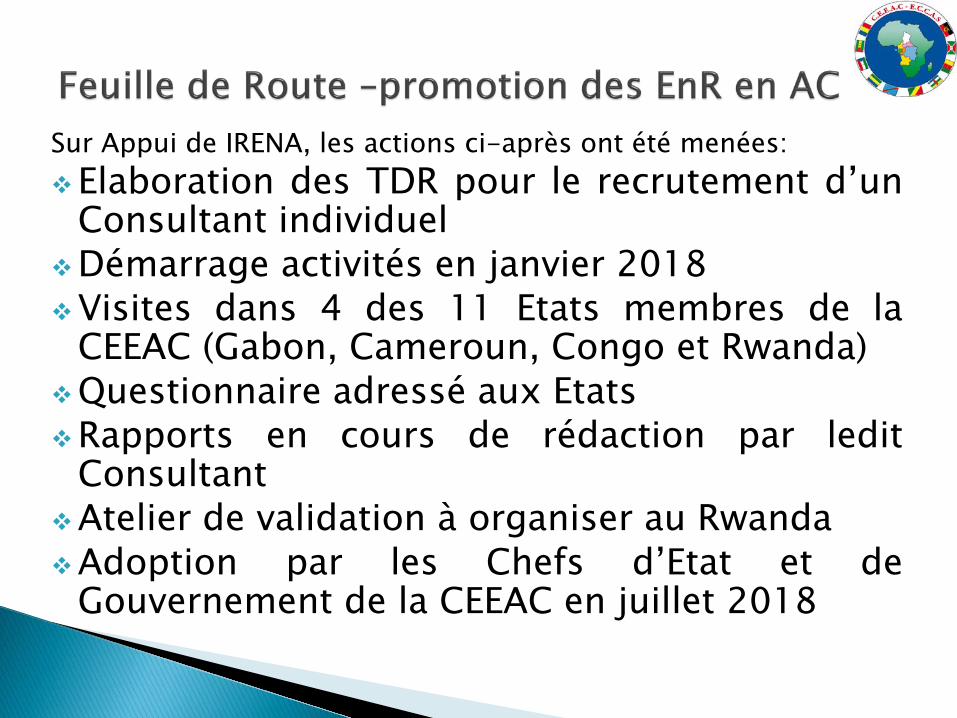
Sur Appui de IRENA, les actions ci-après ont été menées: Elaboration des TDR pour le recrutement d’un
Consultant individuel Démarrage activités en janvier 2018 Visites dans 4 des 11 Etats membres de la
CEEAC (Gabon, Cameroun, Congo et Rwanda) Questionnaire adressé aux Etats Rapports en cours de rédaction par ledit
Consultant Atelier de validation à organiser au Rwanda Adoption par les Chefs d’Etat et de
Gouvernement de la CEEAC en juillet 2018

Etablir un état des lieux et un diagnostic complet et fiable du sous-secteur des énergies renouvelables en Afrique Centrale ;
Présenter la vision, les défis à relever pour promouvoir le secteur des Energies Renouvelables, y compris les micro et mini-réseaux électriques à base d’Energies Renouvelables, et formuler les propositions de stratégie possibles pour relever les défis identifiés ;
Définir les perspectives de développement des énergies renouvelables à moyen et long termes ;
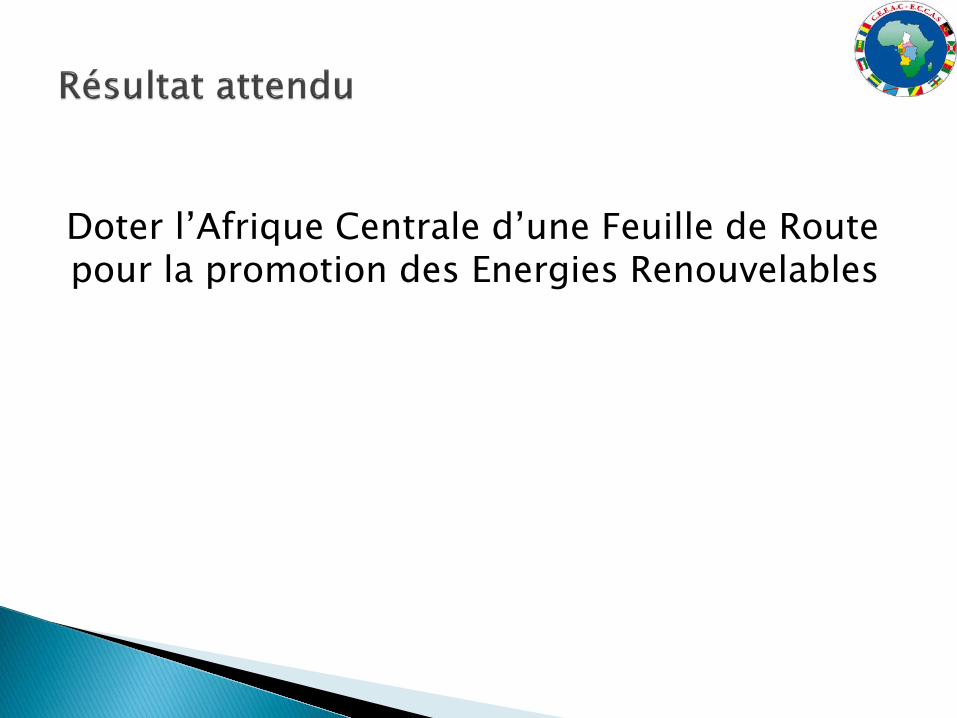
Doter l’Afrique Centrale d’une Feuille de Route
pour la promotion des Energies Renouvelables

Poursuivre le développement de partenariat
/ coopération pour la mise en synergie des initiatives Énergétiques dans l'espace Communautaire ( IRENA, ONUDI, ONU-HABITAT, CER, CUA/NEPAD, ONU, PNUD, SE4ALL, UE, Charte Internationale pour l’Energie, etc.)

Assurer l’accès universel aux services énergétiques modernes pour les populations
Contribuer à l’accroissement du taux d’accès à l’électricité : 54% (2030)
Valoriser les ressources des EnR

Le potentiel en EnR de l’Afrique Centrale est immense mais très faiblement exploité (hors mis la biomasse), en cause notamment: Cadre institutionnel inapproprié; Manque de moyens financiers; Des coûts initiaux élevés en capital; Secteur privé: peu développé
Il convient de: Prendre des mesures incitatives pour
accroître les investissements; Développer les systèmes décentralisés à
partir des EnR

Jean KOUTELE, Expert en Energie – CEEAC Email: [email protected]

REGIONAL WORKSHOP Central Africa
Developing Skills to Accelerate Renewable Energy Deployment
ISO 50001 Energy Management System
April 17-19, 2018 Yaounde, Cameroon
Facilitator: Charles Diarra, Ph.D. Email: [email protected] Tel: 647 522 2663 Mississauga ON, Canada

ISO 50001: Understanding the Context
• Industry utilizes very complex systems, consisting of equipment and their human interface to meet the production needs of the business
• Existing ISO standards for quality management practices (ISO 9001) and environmental management systems (ISO 14001) have successfully stimulated continual efficiency in the industrial sector
• According to the IEA manufacturing industries can improve their energy efficiency measures by 18 to 26%, while reducing the sector’s CO2 emissions by 19 - 32%, based on proven technology and energy management system
• This is especially true in developing countries and emerging economies that still lack national energy management standards as well as policies and mechanisms to achieve improved efficiency in the industrial sector.
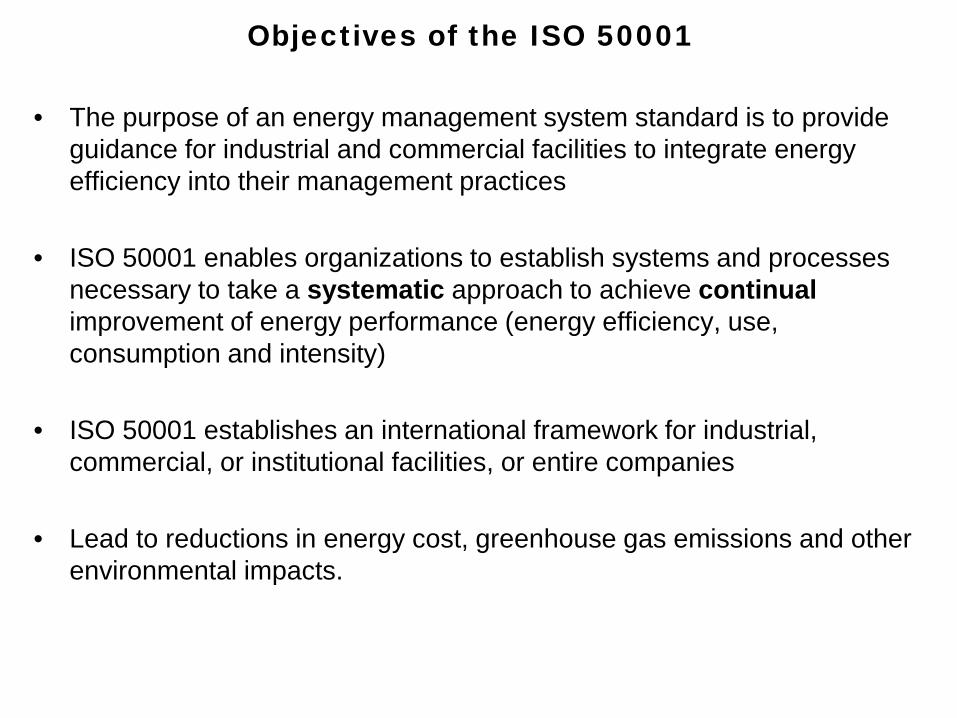
Objectives of the ISO 50001
• The purpose of an energy management system standard is to provide guidance for industrial and commercial facilities to integrate energy efficiency into their management practices
• ISO 50001 enables organizations to establish systems and processes necessary to take a systematic approach to achieve continual improvement of energy performance (energy efficiency, use, consumption and intensity)
• ISO 50001 establishes an international framework for industrial, commercial, or institutional facilities, or entire companies
• Lead to reductions in energy cost, greenhouse gas emissions and other environmental impacts.

Scope
• ISO 50001:2011 Energy Management Systems – Requirements with guidance for use is developed by ISO Technical Committee 242 Energy Management
• It is a voluntary international framework for the effective and sustainable management of energy in any organization large or small
• Its application assists organizations in reducing energy consumption through the utilization of international best practices, measurement and reporting disciplines, continuous improvement and promoting energy efficiency throughout the supply chain
• It therefore helps to reduce greenhouse gas emissions and operational costs of the organization
• It is not an energy efficiency plan (but requires to establish one)

ISO 50000- Family of Standards
i. ISO 50001:2011 Energy Management Systems – Requirements with guidance for use
ii. ISO 50002:2014 Energy audits - Requirements with guidance for use
iii. ISO 50003:2014 Energy management systems - Requirements for bodies providing audit and certification of energy management systems
iv. ISO 50004:2014 Energy management systems - Guidance for the implementation, maintenance and improvement of an energy management system
v. ISO 50006:2014 Energy management systems - Measuring energy performance using energy baselines (EnB) and energy performance indicators (EnPI) - General principles and guidance
vi. ISO 50015:2014 Energy management systems - Measurement and verification of energy performance of organizations - General principles and guidance

ISO 50001: Plan-Do-Check-Act

Management Responsibility
Goal • In addition to providing general support, top
management should provide the necessary resources such as time, personnel, financial, materials, etc. for the effective implementation of the EnMS.
• Top management commitment is crucial to the successful implementation of the EnMS.
• It must be communicated and made visible to the entire organisation to encourage active participation of all staff members in adhering to the EnMS.
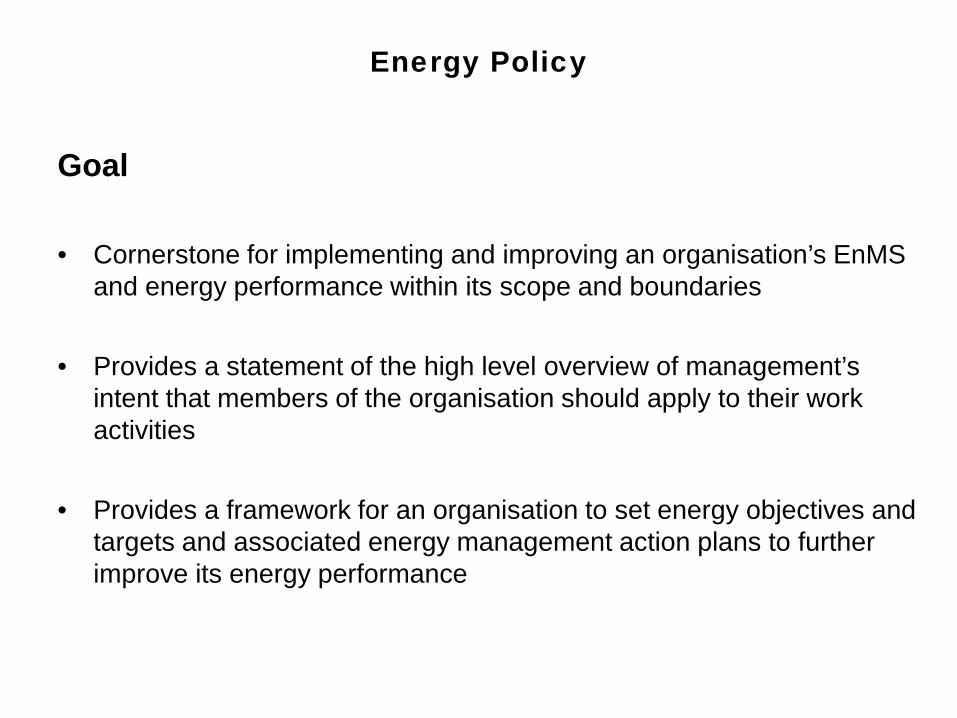
Energy Policy
Goal • Cornerstone for implementing and improving an organisation’s EnMS
and energy performance within its scope and boundaries
• Provides a statement of the high level overview of management’s intent that members of the organisation should apply to their work activities
• Provides a framework for an organisation to set energy objectives and targets and associated energy management action plans to further improve its energy performance

• Efficiency programmes save 9x more carbon per consumer GDP than carbon taxes or prices
23 0
10
20
30
40
50
60
2005 2007 2009 2011 2013 2015 2017 2019
Cum
ulat
ive
Car
bon
Dio
xide
Em
issi
ons
Save
d (M
tons
)
Cumulative CO2 Emissions Saved by: Increasing Rates 3%; and Increasing Rates 3% to Fund Energy Efficiency (UK Example)
Cumulative carbon dioxide emissions saved with 3% rise in rates to fund energy efficiency (Mtons)
Cumulative carbon dioxide emissions saved with 3% rise in rates only (Mtons)
Cumulative CO2 emissions avoided from raising rates 3% and funding EE, 2006-2020: 59.2 million tons
Cumulative CO2 emissions avoided from raising rates 3%, 2006-2020: 6.3 million tons
EE Obligations are Highly Cost Effective
Source: Regulatory Assistance Project (2012)
• It is not an energy efficiency plan (but requires to establish one)
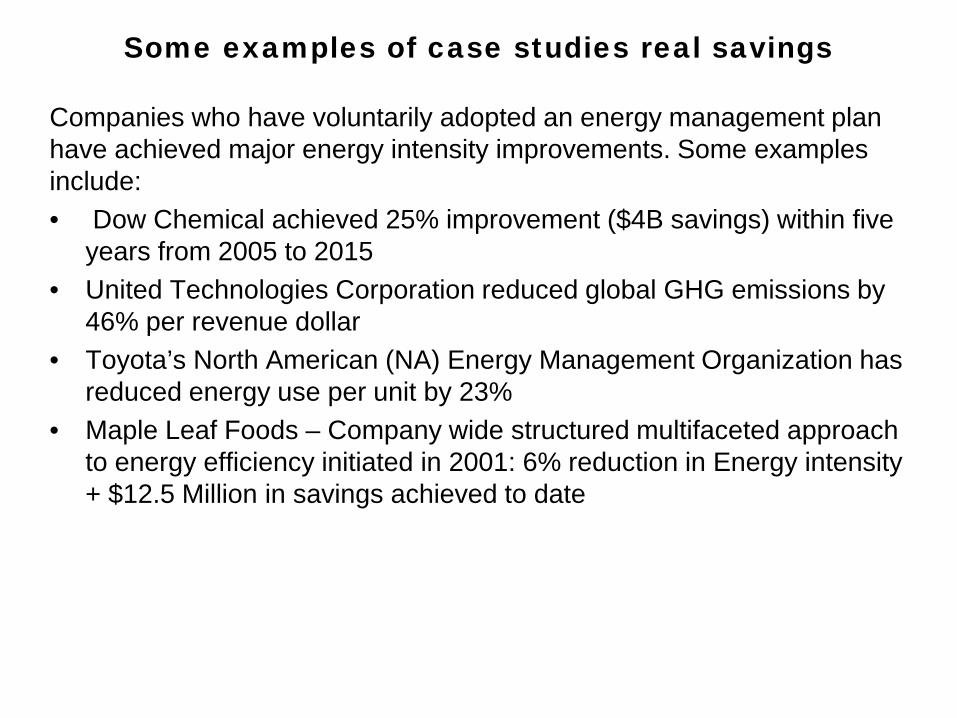
Some examples of case studies real savings
Companies who have voluntarily adopted an energy management plan have achieved major energy intensity improvements. Some examples include: • Dow Chemical achieved 25% improvement ($4B savings) within five
years from 2005 to 2015 • United Technologies Corporation reduced global GHG emissions by
46% per revenue dollar • Toyota’s North American (NA) Energy Management Organization has
reduced energy use per unit by 23% • Maple Leaf Foods – Company wide structured multifaceted approach
to energy efficiency initiated in 2001: 6% reduction in Energy intensity + $12.5 Million in savings achieved to date

Example of case studies in Nigeria

The Power Scenario in Nigeria
• 4,500 MW operational installed capacity for about 190 Mio people (South
Africa: 44,000 MW for 55 Mio people)
• Power outages of approx. 8-10 hours per day
• Technical and non-technical losses: 55%
• 40-60% of households (more than 90 Mio people) without electricity
access
• About 8,000 MW of privately installed Diesel generators
• Electricity supply one of the top-three barriers to doing business in
Nigeria (World Bank Ease of Doing Business Report)

Objectives of the Project - How we did it i. Support the formulation and implementation of relevant energy policies
ii. Create awareness on energy management systems among policy
makers, facility managers and the general public
iii. Create discussions with key stakeholders on the adaptation of ISO 50001 standards by SON
iv. Develop a strategy for ISO 50001 adoption and implementation
v. Build capacities of policy makers in for the implementation, monitoring and evaluation of EnMS in the industrial sector;
vi. Train and certify ISO 50001 energy mangers, a group selected eligible professional staff from MAN, NACCIMA, SMEDAN member industries; SON
vii. Creation of Energy Efficiency Networks (EEN)

Partners of the Project
Project implemented by: • Government of Nigeria (Federal Ministry of Industry, Trade and
Investment (FMITI), Standards’ Organisation of Nigeria (SON), Federal Ministry of Power, Works and Housing (FMPWH)
• Industries’ Associations (MAN, NACCIMA, SMEDAN)

The Need for Energy Management
i. How much percentage could be saved?
• Most industrial enterprises that have implemented EnMS achieved
average annual energy intensity reductions of 2-3% against 1% reduction of business as usual (IRL, NETH, DEN, SWE, USA)
• For companies new to energy management, savings during the first 2 years are 10-20%
• In many African Countries, potential savings can be up to 40% of total energy costs
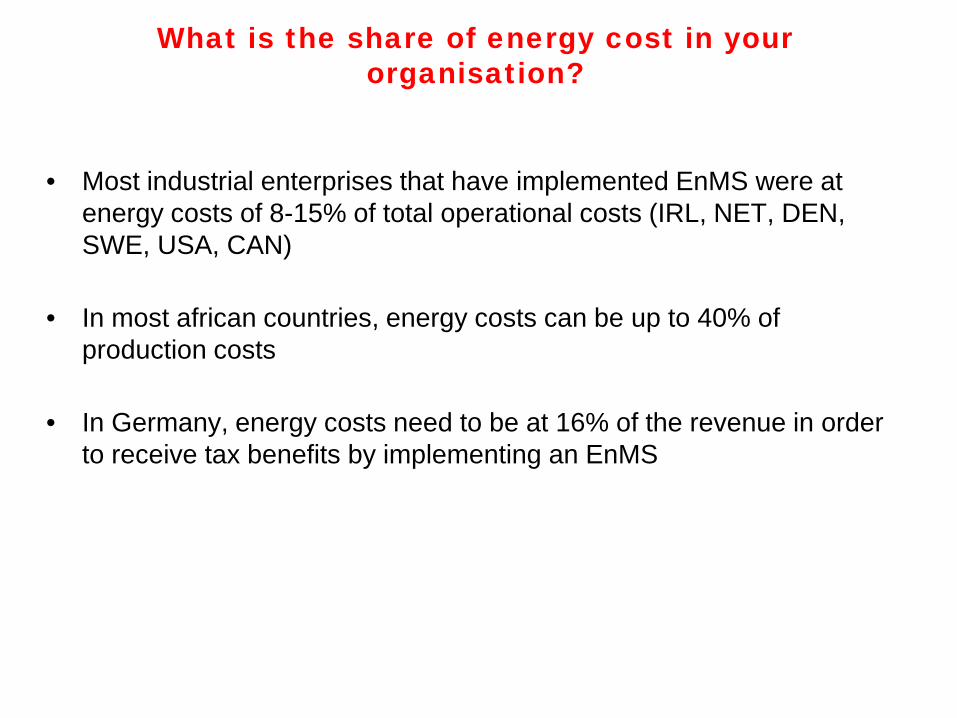
What is the share of energy cost in your organisation?
• Most industrial enterprises that have implemented EnMS were at energy costs of 8-15% of total operational costs (IRL, NET, DEN, SWE, USA, CAN)
• In most african countries, energy costs can be up to 40% of
production costs
• In Germany, energy costs need to be at 16% of the revenue in order to receive tax benefits by implementing an EnMS

What are the major challenges in energy management?
• Arbitrary generator sizing: Under-loading generator set results in efficiency
drop, fuel wastage, and impaired availability; while on the other hand, overloading a generator results in winding burnout. The best recommendation is to load generator set at 75-80% of its total rated power for optimum efficient operation, and not to be operated with a load less than 30% for more than one to two hours.
• Unsustainable procurement: Procurement of inefficient equipment (used appliances, second hand), procurement of energy guzzling equipment (incandescent bulbs, unlabeled appliances etc.)
• Inefficient processes: Idling machineries, unavailability of energy policy, untapped free contributors (day lighting, natural ventilation, solar PV etc.)
• Wrong approach to energy efficiency measures: lack of technical know-how in identifying unproductive energy consumption, non-consideration of sustainable building design

19
19
Who What Creates Savings?
-5% 0% 5% 10% 15% 20%Actual Savings
Source: Good Practice Guide 84 Managing and Motivating Staff to Save Energy
Technology Only People Only People & Technology
-4% 3% 16%
23%
40% of CO2 emissions is due to producing electricity

Typical Energy Efficiency Networks (EEN)

Example of case study: Compressed Air
• Body cleaning is a common use of compressed air- however, it is a very costly energy waste!
• This gentleman wastes about 10,000 USD per year

Compressed Air System
For a typical air compressor, the energy consumption represents 75% of the lifetime cost of operation, and so energy efficiency should be the priority for reducing the total costs of compressed air.
Life cycle costs of compressed air system

Air Leakage Energy Losses and Costs
inch mm 1/64 0.397 1/32 0.794 1/16 1.588 1/8 3.175 1/4 6.350 1/2 12.700
@ 8 bar, 720 hours/year, 0.06 USD/kWh

Air Leakage Energy Losses and Costs

Air leakage measurement
$37,440 annual energy cost
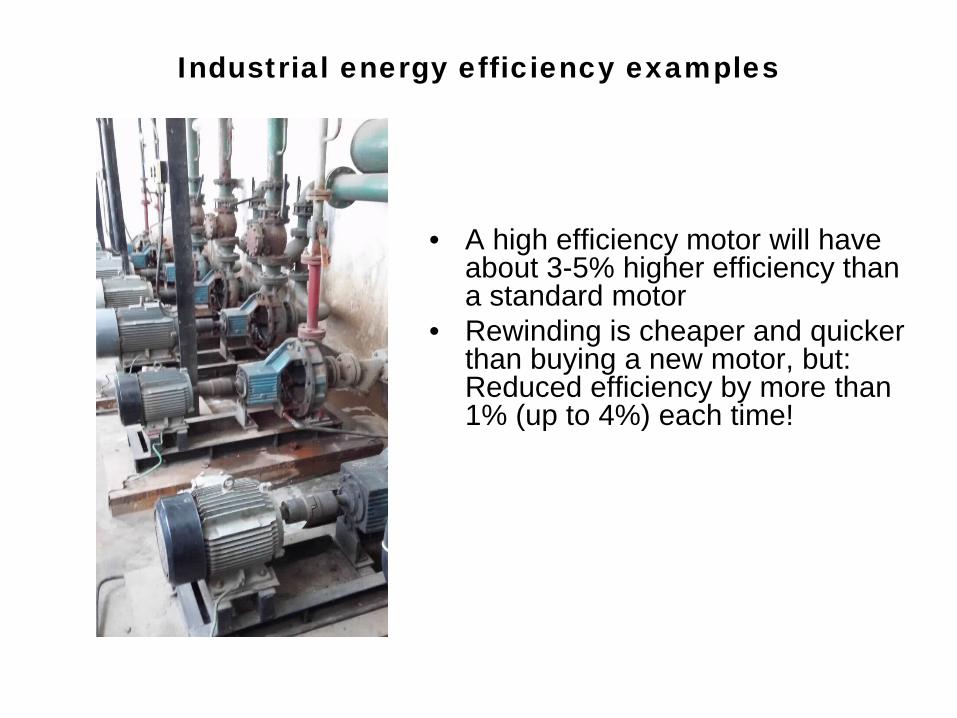
Industrial energy efficiency examples
• A high efficiency motor will have about 3-5% higher efficiency than a standard motor
• Rewinding is cheaper and quicker than buying a new motor, but: Reduced efficiency by more than 1% (up to 4%) each time!

Industrial energy efficiency examples
• You can’t manage what you don’t measure!
• Studies in Europe show that most industrial enterprises that have implemented energy measurement and monitoring schemes achieved average annual energy savings of 2-3%

Industrial energy efficiency examples
• Technology is only as smart as the operator –your employees are the most valuable asset in energy efficiency!
• Continuous awareness raising and training can lead to energy savings of 1-2% per year

In Summary: ISO50001 can achieve:
Management focus Systematic activity Actively managing energy use and costs, reducing exposure to rising energy costs Obligation to train and raise awareness Obligation to provide resources Document savings for internal and external
use (e.g. emission credits, legal reporting
requirements) Reduce GHG emissions without negative
effect on operations Continuity through changes of personnel
Energy and Cost Savings
Environmental Benefits
Continuous Improvement
29
Commitment of Management

Promoting EnM within various Policy contexts
ENERGY MANAGEMENT WITHIN BROADER POLICY
FRAMEWORK MANDATORY ENERGY
MANAGEMENT POLICIES
VOLUNTARY ENERGY MANAGEMENT PROGRAMS

Initial Questions for you
i. What is the share of energy cost in your organisation?
ii. How much percentage could be saved?
iii. What are the major challenges in energy management?
iv. What are the existing energy policies to promote, develop and implement EE measures in the domestic, industrial and building sectors

Group work:
Questions: 1. Give some Opportunities and challenges to
the implementation of EnMS based on ISO 50001
2. Name the 3 utmost policy areas you think are required for the promotion and implementation of ISO 50001

References
• ISO 14001 Environmental management systems- Requirements with guidance for Use
• [2] I.S. EN ISO 9000 Quality management systems- Fundamentals and vocabulary
• [3] I.S. EN ISO 9001 Quality management systems- Requirements • • [4] I.S. EN ISO 9004 Quality management systems-Guidelines for
performance improvement
• [5] DS 2403:2003 Energy management- Specification
• International Energy Agency. 2007. Tracking Industrial Energy Efficiency and CO2 Emissions: A Technology Perspective. Paris: IEA; ISBN 978-92-64-03016-9. http://www.iea.org/w/lookshop/add.aspx?id=298

ANY QUESTIONS?