Africa & AsiaGP Banglalink Robi Airtel Citycell Teletalk banglalink Macro- Environment Regulatory...
18
1 © VimpelCom Ltd 2011 Africa & Asia Ahmed Abou Doma Group Executive Vice President and Head of the Africa and Asia Business Unit
Transcript of Africa & AsiaGP Banglalink Robi Airtel Citycell Teletalk banglalink Macro- Environment Regulatory...

1
© V
impelC
om
Ltd
2011 Africa & Asia
Ahmed Abou Doma
Group Executive Vice President and Head of the Africa and Asia Business Unit
2
© V
impelC
om
Ltd
2011
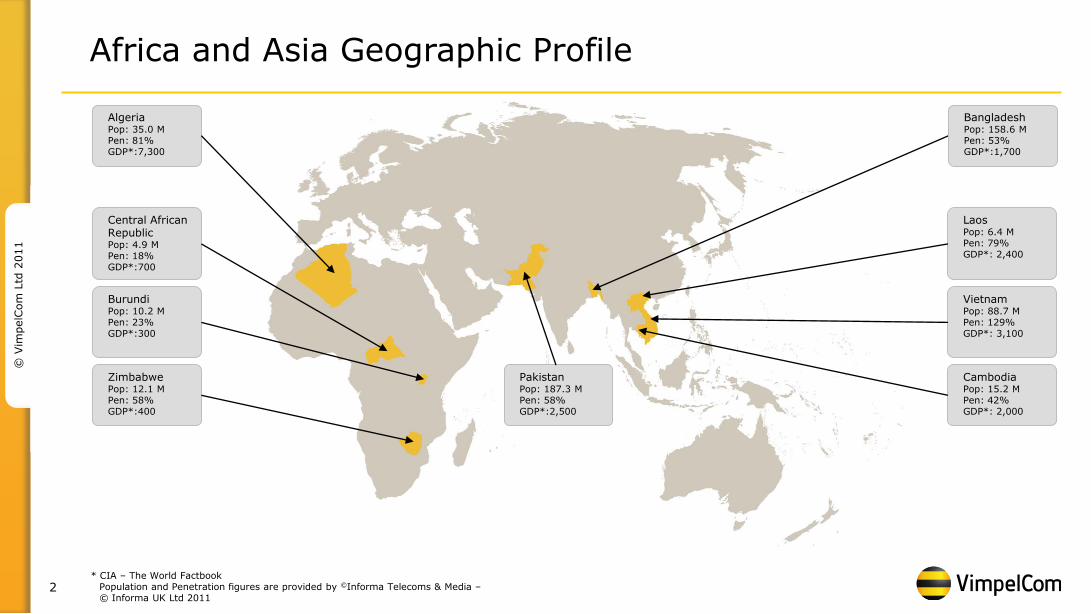
Africa and Asia Geographic Profile
* CIA – The World Factbook Population and Penetration figures are provided by ©Informa Telecoms & Media – © Informa UK Ltd 2011
Algeria Pop: 35.0 M Pen: 81% GDP*:7,300
Central African Republic Pop: 4.9 M Pen: 18% GDP*:700
Burundi Pop: 10.2 M Pen: 23% GDP*:300
Zimbabwe Pop: 12.1 M Pen: 58% GDP*:400
Laos Pop: 6.4 M Pen: 79% GDP*: 2,400
Vietnam Pop: 88.7 M Pen: 129% GDP*: 3,100
Cambodia Pop: 15.2 M Pen: 42% GDP*: 2,000
Pakistan Pop: 187.3 M Pen: 58% GDP*:2,500
Bangladesh Pop: 158.6 M Pen: 53% GDP*:1,700

3
© V
impelC
om
Ltd
2011
Market and Competitive Scenario
Pakistan:
• Mobilink leads the maturing market, and with a large customer base has great potential for revenue enhancement through data and VAS uptake
Bangladesh:
• In a large market with low penetration levels, banglalink is the fastest growing operator in a rapidly-growing market with strong focus on increasing value share
Algeria
• Despite limitations, Djezzy remains a profitable market leader with tremendous data potential
Mobile subscriber developments VIP (million)
Revenue developments VIP (USD million)
EBITDA and margin VIP (USD million & percentage%)
Sub Saharan Africa:
• Leading positions in markets with low penetration levels, healthy APPM, and high growth potential. Internet is a mobile story in Africa.
South-East Asia:
• Highly competitive markets offering growth potential
847
901 910
895 891
949 957
Q1 10 Q2 10 Q3 10 Q4 10 Q1 11 Q2 11 Q3 11
371 377 385
337
404 407
434
43,8% 41,8% 42,3% 37,7%
45,3% 42,9% 45,4%
Q1 10 Q2 10 Q3 10 Q4 10 Q1 11 Q2 11 Q3 11
63,1 66,2
67,7 69,8
72,2 74,3
77,7
Q1 10 Q2 10 Q3 10 Q4 10 Q1 11 Q2 11 Q3 11
4
© V
impelC
om
Ltd
2011
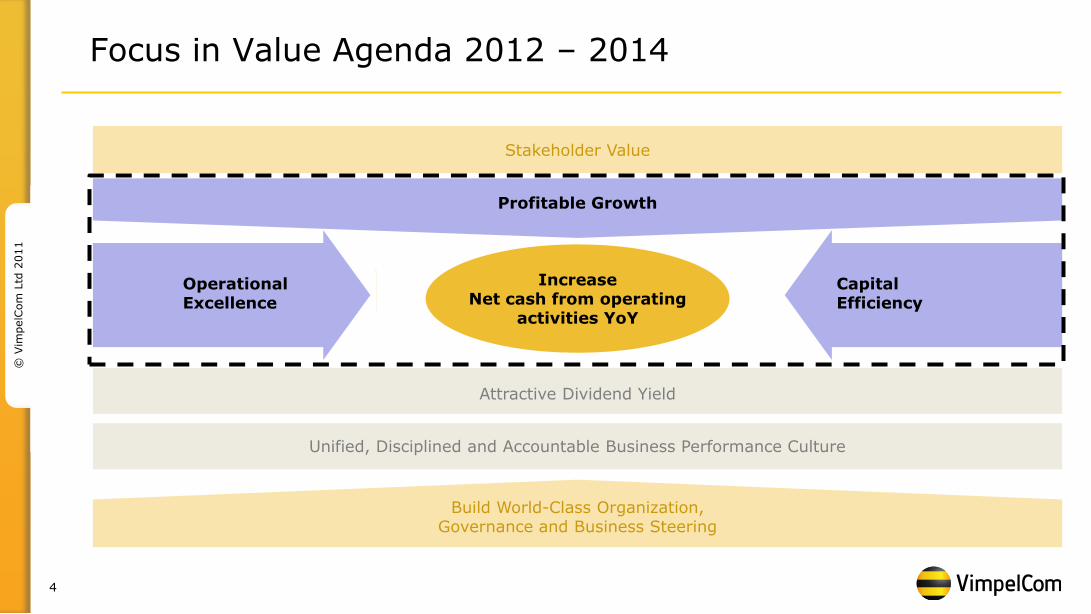
Unified, Disciplined and Accountable Business Performance Culture
Profitable Growth
Capital Efficiency
Operational Excellence
Attractive Dividend Yield
Build World-Class Organization, Governance and Business Steering
Stakeholder Value
Focus in Value Agenda 2012 – 2014
Increase Net cash from operating
activities YoY

5
© V
impelC
om
Ltd
2011
VAS & Data Stream
• Mobile Data / 3G Launch
• VAS
• Mobile Financial
Services
• Launched first App Store in Pakistan.
• Enhance VAS offerings to maintain leadership of diverse VAS services in Bangladesh
• Launched banglalink “m-wallet”
• Rollout of “mobile money” in Burundi
• Expected to launch Mobilink in early 2012
• Grow mobile broadband in Algeria & Pakistan by bidding for 3G licenses
• Launched services in Zimbabwe and Burundi
• Expected launch in Laos before end of 2011
Areas Approach Products
Core strategic objective is to further capture organic growth through pursuing 3G data opportunities, in addition to capturing market share
1 Drive Profitable Growth Focus on data growth, value driven pricing and further market penetration
Market Share Stream
• Mobile Voice & Messaging
• Further market penetration and subscriber growth
• Value driven pricing
• Low cost model strategy
• Rationalized competition

6
© V
impelC
om
Ltd
2011
Operational Excellence Cost Efficiency
Revenues
Gross Margin
Technology
Commercial
Opex
Current Situation Actions
• Maintain value-driven pricing • High subscriber growth potential in Africa, SEA and Bangladesh • Explore opportunities for revenue generation through international call center outsourcing services • Leverage large subscriber base to grow voice and non-voice revenue in Pakistan and Bangladesh
EBITDA
2
• Low-cost rural solutions, Indoor/Outdoor swaps • Increase resource efficiency; IN free traffic offloading, power saving features, and Hybrid solutions • Achieve higher CapEx/OpEx and enhance quality; Single RAN, All IP, HW modernizations • Explore network outsourcing opportunities • Invest in network modernization to preserve and improve network quality in SEA • Define leaner site configurations through tighter design guidelines to manage CAPEX demands in
Algeria • Increase coverage footprint by deploying low CAPEX sites in SSA
• Reduce technical OPEX
• Enhance margin through capturing mobile data opportunities • Adopt a variable mix of outsourced and in-sourced activities • Increased bandwidth creation will lead to higher demand for mobile internet in Africa • Increase quality and control over the distribution channel • Apply a dual market strategy in Bangladesh: tailored services for high-end segments and
optimized services for lower-end segments • Potential for Mobile Financial Services in Pakistan and Bangladesh
• Improve margins
• Increase top line
• Reduce commercial OPEX
• Increase consumer awareness and brand loyalty • Brand facelifts in CAR and Zimbabwe • Consolidate Djezzy brand leadership and strengthen emotional bonding with customers • Create a differentiated value position for consumers using Mobilink’s brand structure and market
position • Regional Beeline brand standardization, e.g. Rebranding in Laos from Tigo to Beeline • Increase electronic top-up penetration and use non-conventional advertising tools

7
© V
impelC
om
Ltd
2011
3 Improve Capital Efficiency Leverage Group size to realize CAPEX efficiencies within a cost-optimization strategy
CAPEX to Revenue ratio (Percentage %)
Technology Levers
• Infrastructure sharing
• Network outsourcing
• Network modernization
• Demand management
• Innovative solutions to achieve operational efficiency
Procurement Levers
• Unitary price alignments
• Volume aggregation
• Market-share redistribution
• Scope and SLA optimization
Capital Efficiency
0%
5%
10%
15%
20%
25%
30%
35%
40%
2007 2008 2009 2010 9M2011

8
© V
impelC
om
Ltd
2011
Algeria

9
© V
impelC
om
Ltd
2011
Djezzy
Macro- Environment
Regulatory Environment
• GDP growth rate for 2010 stood at 3.3% • Young population with 24% of the population under 15 years of age • Country-wide political stability • Government, trade and agriculture sectors account for over 60% of Algeria’s GDP • Hydrocarbons have long been the backbone of the economy, accounting for roughly
60% of budget revenues, 30% of GDP, and over 95% of export earnings • Penetration rate at end of Q3 2011 stood at approximately 81%
*Penetration figures are provided based on OTA Closing base and DWH figures for competition
** DWH Market Share
• Regulated telecom environment under the ARPT • 3G licensing process launched on September 19th, 2011
• Ongoing ban on Djezzy’s foreign currency transfers preventing the payment of essential suppliers, as well as the importing of equipment critical to network maintenance and necessary expansion
Djezzy is the market leader in a three-player market. • Djezzy: launched its operations in 2002, market leader, has a population coverage of
96%. • ATM: 1st entrant launched in 1999, rebranded their mobile business to Mobilis. ATM is
also the sole fixed line provider and owner of internet and international gateways. • Qtel: launched Nedjma in 2004. As challengers, Nedjma is a large contributor to
market growth.
Competitive Landscape
• Platform to identify and develop young Algerian talents
Corporate Social Responsibility
• Population: 35 M • GDP/capita: $7,300
Market Size: 28.25 M subs Penetration*: 81%
Market Players: • Djezzy • Mobilis • Nedjma
Market Shares *
57,700% 20,700
%
21,600%
OTA
Mobilis
Wattaniya
10
© V
impelC
om
Ltd
2011
13 14
15 15
16
2007 2008 2009 2010 9M2011
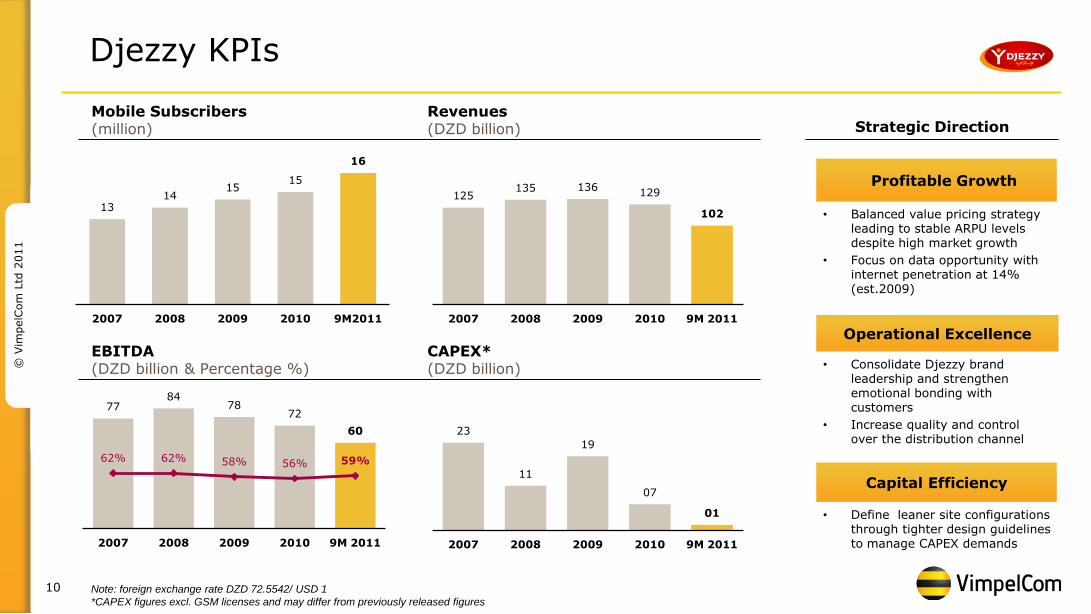
Djezzy KPIs
Note: foreign exchange rate DZD 72.5542/ USD 1
*CAPEX figures excl. GSM licenses and may differ from previously released figures
Profitable Growth
• Balanced value pricing strategy leading to stable ARPU levels despite high market growth
• Focus on data opportunity with internet penetration at 14% (est.2009)
Operational Excellence
• Consolidate Djezzy brand leadership and strengthen emotional bonding with customers
• Increase quality and control over the distribution channel
Capital Efficiency
• Define leaner site configurations through tighter design guidelines to manage CAPEX demands
Strategic Direction Mobile Subscribers (million)
Revenues (DZD billion)
EBITDA (DZD billion & Percentage %)
CAPEX* (DZD billion)
125 135 136
129
102
2007 2008 2009 2010 9M 2011
77 84
78 72
60
62% 62% 58% 56% 59%
2007 2008 2009 2010 9M 2011
23
11
19
07
01
2007 2008 2009 2010 9M 2011

11
© V
impelC
om
Ltd
2011
Pakistan

12
© V
impelC
om
Ltd
2011
30,700%
18,900% 10,00%
24,500%
16,00%
Market Shares *
Mobilink
Ufone
Zong
Telenor
Warid
• GDP growth rate in 2010 stood at 4.8%
• 35% of the population is under 15 years of age
• Power Shortages are widespread, but are countered by innovative technological solutions
• Slowing devaluation of the Pakistani Rupee against the US Dollar
• Heavy floods had a large impact on the country’s population and infrastructure
Mobilink
Macro- Environment
Regulatory Environment
Corporate Social Responsibility
• Mobilink in partnership with the UN’s Emergency Response Unit, committed about Rs. 81 million for setting up a camp for Internally Displaced families who were affected by the flood.
• Mobilink in partnership with UNESCO and Bunyad (a local NGO) has also implemented a pilot project to test the use of mobile phones in facilitating literacy in Pakistan.
• Mobilink also has its own billboard skins recycling program, which uses outdated billboard skins to manufacture school bags for underprivileged children, provide scholarships and support local schools.
• The regulator, PTA, introduced MNP several years ago, which is currently a high focus for all operators in the Pakistani market
• PTA introduced new measures concerning customer data verification, which is to be adopted by all mobile operators, ensuring subscriber information accuracy
• PTA is planning to launch an auction for three 3G licenses in 2012
• Population: 187 M • GDP/capita: $2,500
• Market Size: 109 M subs • Penetration: 58%
Market Players: • Telenor • Ufone • Warid • Zong
* Regulator Market Shares.
Mobilink is the market leader in a five-player market.
• Telenor: 2nd player in the market, value-driven operator, strong market share position
• Ufone: 3rd player in the market, positive mass market perception
• Warid: Have been mostly inactive for the past 2 years, however their level of activity has been increasing lately
• Zong: China Mobile’s 1st venture outside China, last entrant into Pakistani market, offers cheap products and services, aggressive on pricing and market share gains
Competitive Landscape

13
© V
impelC
om
Ltd
2011
Mobilink KPIs
Note: foreign exchange rate PKR 85.8751/ USD 1
*CAPEX figures excl. GSM licenses and may differ from previously released figures
Profitable Growth
• Leverage the large subscriber base in order to unlock revenue potential from non-voice services
• Enhance margin through capturing mobile data opportunities with internet penetration estimated at 11% in 2009
Operational Excellence
• Increase EBITDA through network OPEX reduction initiatives
• Revamp Mobilink’s positioning in the market as well as its brand structure with the objective of creating a differentiated value position in consumers’ minds
Capital Efficiency
• Adopt innovative technology solutions to use resources more efficiently through IN traffic offloading, power saving and site environmental monitoring systems
• Infrastructure sharing
• Joint 3G roll-out
• Network modernization
Strategic Direction Mobile Subscribers (million)
Revenues (PKR billion)
EBITDA (PKR billion & Percentage %)
CAPEX* (PKR billion)
77 88 87
94
73
2007 2008 2009 2010 9M 2011
34 35
32 37
30
44% 40%
36% 40% 41%
2007 2008 2009 2010 9M 2011
32
38
13 12 13
2007 2008 2009 2010 9M 2011
31
29
31 32
33
2007 2008 2009 2010 9M 2011

14
© V
impelC
om
Ltd
2011
Bangladesh

15
© V
impelC
om
Ltd
2011
44%
27%
19%
7%
2% 2%
Market Share
GP
Banglalink
Robi
Airtel
Citycell
Teletalk
banglalink
Macro- Environment
Regulatory Environment
Corporate Social Responsibility
banglalink has taken a number of initiatives such as:
• Cox’s Bazaar Beach Cleaning Project and International Coastal Cleanup Day
• Setting up computer labs in 270 underprivileged schools at different parts of the country under the umbrella of Digital Bangladesh
• Has the world’s highest population density
• 57% of population below 25 years of age • GDP growth rate was estimated at 6% in 2010
• Government Type: Unitary state and parliamentary democracy
• Low Mobile penetration: less than 50%
• Heavy existence of Multiple SIMs
• Prior to Telecom Act 2010 the Bangladesh Telecommunication Regulatory Commission (BTRC) was the sole telecom market legislator
• Receipt of 2G license renewal guidelines, validity of license renewal is for 15 years
• BTRC levies a SIM tax that has been reduced to BDT600 or USD8.5 from BDT800 in 2011
• 3G license awarding likely to happen in 2012
• Banks are engaging in the already existing mobile financial services
• Population: 158 mln. • GDP/capita: $1,700
• Market Size: 81 M subs • Penetration: 53%
Market Players: • Grameenphone • Airtel • Robi • CityCell • TeleTalk
banglalink places 2nd in a 6-player market.
• Grameenphone: 1st player, aggressive tariff moves targeting more acquisitions, largest network
• Robi: Rebranded from AkTel, started offering data services (GPRS), consistently subsidize SIM tax, aggressive on the VAS communication
• Airtel: Baharti Airtel acquired 70% stake in 2010, re-launched with new logo and corporate brand repositioning
• CityCell: CDMA operator, offers data services with handset subsidies
• TeleTalk: Operated by national fixed incumbent BTCL, offers the lowest flat tariff in the market
Competitive Landscape

16
© V
impelC
om
Ltd
2011
banglalink- KPIs
Note: foreign exchange rate BDT 73.1028/ USD 1
*CAPEX figures excl. GSM licenses and may differ from previously released figures
Profitable Growth
• Tap into mobile data opportunities with internet penetration rates extremely low in the country
• Explore opportunities for revenue generation through international call center outsourcing services
• Leverage large base by unlocking mass-market value potential
Operational Excellence
Capital Efficiency
• Capture technology synergies by introducing and swapping into outdoor sites and implementing innovative hybrid solutions
• Site sharing
Strategic Direction Mobile Subscribers (million)
Revenues (BDT billion)
EBITDA (BDT billion & Percentage %)
CAPEX* (BDT billion)
13
20 24
32 28
2007 2008 2009 2010 9M 2011
-3
0
7 9
10
-22%
2%
31% 28% 37%
2007 2008 2009 2010 9M 2011
24
29
09
16
07
2007 2008 2009 2010 9M 2011
7 10
14
19 22
2007 2008 2009 2010 9M 2011
• Apply a dual market strategy providing tailored services for high-end segments, as well as optimized services for lower-end segments in the market
17
© V
impelC
om
Ltd
2011
Conclusion
• Due to low penetration level, Markets of Asia & Africa BU have largest potential of growth in Vimpelcom Group
• Data is our key strategic focus
• Strong Leadership positions in large markets provides a solid platform for profitable growth
• Managing for value strategy and implementing operational efficiency- gaining mechanisms
• Leveraging Group size to realize CAPEX efficiencies within a cost-optimization strategy

18
© V
impelC
om
Ltd
2011
Disclaimer
This presentation contains "forward-looking statements", as the phrase is defined in Section 27A of the Securities Act of 1933 and Section 21E of the Securities Exchange Act of 1934. These statements relate to the Company's strategy, development plans and anticipated performance. The forward-looking statements are based on management's best assessment of the Company's strategic and financial position, and future market conditions and trends. These discussions involve risks and uncertainties. The actual outcome may differ materially from these statements as a result of continued volatility in the economies in the markets in which the Company operates, unforeseen developments from competition, governmental regulation of the telecommunications industries and general political uncertainties in the markets in which the Company operates and/or litigation with third parties. The actual outcome may also differ materially if the Company is unable to obtain all necessary corporate approvals relating to its business, if the Company is unable to successfully integrate newly-acquired businesses and other factors. There can be no assurance that these risks and uncertainties will not have a material adverse effect on the Company, that the Company will be able to grow or that it will be successful in executing its strategy and development plans. Certain factors that could cause actual results to differ materially from those discussed in any forward-looking statements include the risk factors described in the Company’s annual report on Form 20-F for the year ended December 31, 2010 filed with the U.S. Securities and Exchange Commission (the “SEC”) and other public filings made by the Company with the SEC, which risk factors are incorporated herein by reference. VimpelCom disclaims any obligation to update developments of these risk factors or to announce publicly any revision to any of the forward-looking statements contained herein, or to make corrections to reflect future events or developments.