
Afghanistan National EFA Review Report, 2015 - …moe.gov.af/Content/files/FINAL-EFA 2015 Review...
109
Transcript of Afghanistan National EFA Review Report, 2015 - …moe.gov.af/Content/files/FINAL-EFA 2015 Review...
Afghanistan National EFA Review Report, 2015
2
Islamic Republic of Afghanistan Ministry of Education
(Department of Planning and Evaluation)
Afghanistan National Education for All (EFA) Review Report, 2015
June 2014
Afghanistan National EFA Review Report, 2015
3
Foreword The Afghanistan National Education for All (EFA) 2015 review is part of a global stocktaking of progress towards the Education for All (EFA) targets, which are linked to the Millennium Development Goals (MDGs). The EFA targets and the MDGs constitute the tangible indicators against which progress is measured. They form part of the Afghanistan National Development Strategy (ANDS) policy framework and the National Education Strategic Plan (NESP). This review is the result of a government led process of critical self-assessment of EFA progress and contribution to the EFA 2015 review regional report and thereby the EFA global report, taking into account the difficult point of departure and the huge challenges that Education has been facing in Afghanistan. In recognition of these difficulties, the time frame for achieving the 2015 EFA goals was modified to 2020, when Afghanistan joined the EFA movement in 2005. Significant progress has been made against the EFA goals since 2001. Children are enjoying easier access to schools with the establishment of twelve thousand new general schools. The increase in enrolment from 1 million pupils, almost all boys to today’s enrolment of more than 8 million students, 39 % of whom are girls, stands out as one of the most significant achievements in the world. The number of teachers has also significantly increased from 110,000 in 2007 to around 187,000 in 2013 of which 32 % are females. The annual number of secondary graduates has risen from about 10,000 in 2001 to more than 266,000 in 2013 and it is estimated to reach 320,000 in 2015. Enrolment at semi higher education institutions has risen from less than 8,000 in 2001 to more than 132,000 in 2013. Investments have been made to improve quality and relevance of education. A major restructuring of the Ministry of Education (MoE) took place during the last decade and significant capacity has been built over the period so that the MoE administration today is well equipped to take on the challenges of the future. However, as the report suggests, there are still numerous challenges that the education sector is facing in Afghanistan: financing sustainable service delivery and much-needed expansion is one of the daunting tasks, while ensuring quality at all levels is another challenge. Finally, peace and security cannot be ignored and continued violence also poses a latent threat to the overall stability and operational effectiveness of the system. I would like to acknowledge the generous and persistent assistance from the majority of our development partners in successfully conducting this review and I would like to thank them for their support in achieving the result.
Farooq Wardak Minister of Education
Afghanistan National EFA Review Report, 2015
4
List of Contents
List of Contents ................................................................................................................................................................................... 4
Acronyms and Glossary of Terms Used ......................................................................................................................................... 7
1. Introduction ............................................................................................................................................... 9 1.1 Development Context.............................................................................................................................. 9 1.2 Education Sector Challenges ................................................................................................................. 11 1.3 Education Policies, Strategies and Interventions................................................................................... 12 1.4 EFA Relevance in Afghanistan ............................................................................................................. 14
2. Tracking Progress ........................................................................................................................................................................... 17
Goal 1 Early Childhood Care and Education (ECCE) ....................................................................................................... 17
1.0. Introduction ......................................................................................................................................... 17 1.1. Access and participation ...................................................................................................................... 18 1.2. Quality and Efficiency ......................................................................................................................... 20 1.3 Inequality and uncoordinated provision of ECCE services ................................................................... 21 1.4. ECCE challenges .................................................................................................................................. 21 1.5. Conclusion and way forward (including beyond 2015) ....................................................................... 21
Goal 2 Universalization of primary/basic education ...................................................................................................... 22
2.1 Introduction ........................................................................................................................................... 22 2.3 Access and Participation ....................................................................................................................... 22 2.3 Efficiency .............................................................................................................................................. 26 2.4 Remaining Gaps, Issues and Challenges ............................................................................................... 28
Goal 3: Meeting the learning needs of youths and adults ............................................................................................. 29
3.1 Introduction: .......................................................................................................................................... 29 3.2 Situation of TVET in 2002 and Targets for 2015/2020......................................................................... 31 3.3 Strategies to increase enrolment ............................................................................................................ 34 3.4 Curriculum Development and Training Materials ................................................................................ 35 3.5 Challenges ............................................................................................................................................. 35 3.6 Way forward ......................................................................................................................................... 35
Goal 4: Adult Literacy - ................................................................................................................................................................. 36
4.1 Introduction ........................................................................................................................................... 36 4.2 Progress and current situation on adult literacy rate and illiterate population ....................................... 37 4.3 Forms of Literacy provision, efficiency and effectiveness .................................................................... 39 4.4 Challenges ............................................................................................................................................. 40 4.5 Way forward ......................................................................................................................................... 40
Goal 5 Gender parity and equality ........................................................................................................................................... 40
5.1 Introduction ........................................................................................................................................... 40 5.2 Access & Participation .......................................................................................................................... 41 5.3 Quality ................................................................................................................................................... 42 5.4 Gaps ...................................................................................................................................................... 44 5.5 Recommendations and way Forward .................................................................................................... 45
Goal 6 Improving the Quality of education .......................................................................................................................... 46
6.1 Introduction ........................................................................................................................................... 46 6.2 Measuring Learning .............................................................................................................................. 47 6.3 Teachers ................................................................................................................................................ 48 6.4 Quality Indicators .................................................................................................................................. 50 6.5 Challenges: ............................................................................................................................................ 53 6.6 Recommendations ................................................................................................................................. 54
EFA Goals Summing up ................................................................................................................................................................ 55
3. Review of EFA Strategies and Sector Management .......................................................................................................... 57
MOE response to the EFA goals ................................................................................................................. 57 Sector Management ..................................................................................................................................... 58 Macroeconomic trends ................................................................................................................................ 60 Financing of Education ............................................................................................................................... 61
Afghanistan National EFA Review Report, 2015
5
Higher Education ........................................................................................................................................ 64 Security ....................................................................................................................................................... 67
4. Conclusions and Recommendations ....................................................................................................................................... 68
Significant progress since 2001 but problems remain ................................................................................. 68 Recommendations on the Way Forward ..................................................................................................... 70 References ................................................................................................................................................... 76
5. Annexes ................................................................................................................................................................................................ 79
Goal 1 Expanding ECCE (Early Childhood Care and Education) .............................................................. 79 Goal 2 Universalization of primary/basic education ................................................................................... 79 Goal 3 Meeting the learning needs of youths and adults ............................................................................. 90 Goal 4 Improving adult literacy level ......................................................................................................... 93 Goal 5 Gender Parity and Equality in Education ...................................................................................... 100 Goal 6 Quality of education ...................................................................................................................... 105
List of Figures and Tables
Figure 1 Population pyramid of Afghanistan............................................................................................................................... 19
Figure 2 Gross Enrolment................................................................................................................................................................. 23
Figure 3 Enrolment by level 2001-2013 .................................................................................................................................... 23
Figure 4 Gross Enrolment Ratios in Primary Education (GER) ....................................................................................... 24
Figure 5 Net Enrolment Ratio in primary education (NER) .................................................................................................... 24
Figure 6 Gross Enrolment by Province ....................................................................................................................................... 25
Figure 7 Number of TVET Centres 2002-2013 ...................................................................................................................... 31
Figure 8: Number of TVET Students 2002 - 2013 ................................................................................................................. 33
Figure 9: percentage of students in TVET schools and institutions ............................................................................................
Figure 10: Qualification of TVET Teachers ............................................................................................................................... 35
Figure 11: Literacy rate by age and sex ...................................................................................................................................... 38
Figure 12: Proportion of Female Students ................................................................................................................................ 42
Figure 13: Proportion of Male and female Teachers by Province .................................................................................. 43
Figure 14: Adult female literacy by province 2012: ............................................................................................................. 44
Figure 15: Adult male literacy by province 2012 .................................................................................................................. 45
Figure 16: Proportion of unqualified teachers by province .............................................................................................. 48
Figure 17: Proportion of qualified female teachers by province .................................................................................... 49
Figure 18: Number of teachers participating in and passing in-service training examinations...................... 49
Figure 19: Student-teacher ratio by province ......................................................................................................................... 50
Figure 20: Primary completion rate by region........................................................................................................................ 52
Figure 21: Primary completion rate by wealth quintile...................................................................................................... 53
Figure 22: GDP, Public Expenditure and Domestic Revenue 1386 (2007) - 1395 (2016) ................................. 60
Figure 23: Operating and total core financing gap (in percentage of GDP) ............................................................... 61
Figure 24: Projected enrolment (in 000) 2011 - 2024 ........................................................................................................ 63
Figure 25: Student projection 2011 - 2024 .............................................................................................................................. 63
Figure 26: Trends in education expenditure in million Afghanis and as % of national budget and of GDP 62
Figure 27: Education expenditure in % of GDP ...................................................................................................................... 62
Figure 28: Estimated growth in demand for Higher Education ...................................................................................... 64
Figure 29: Increase in number of students who do not get admitted into HE .......................................................... 65
Figure 30: Gross Intake Rate in primary education by sex ................................................................................................ 80
Figure 31: Enrolment in primary education by sex .............................................................................................................. 81
Figure 32: % primary school repeaters by grade and sex ................................................................................................. 81
Figure 33: Primary school repetition rate................................................................................................................................. 82
Figure 34: Primary school promotion rate ............................................................................................................................... 82
Figure 35: Dropout rate ..................................................................................................................................................................... 83
Figure 36: Survival rate ..................................................................................................................................................................... 83
Figure 37: Primary cohort completion rate.............................................................................................................................. 84
Afghanistan National EFA Review Report, 2015
6
Figure 38: Effective transition rate (ETR) ................................................................................................................................. 84
Figure 39: Number and percentage of teachers by academic qualification from 2007 to 2013 ...................... 85
Figure 40: percentage of qualified teachers ............................................................................................................................. 85
Figure 41: percentage of INSET trained teachers by year and sex ................................................................................ 86
Figure 42: PTR in primary/basic education ............................................................................................................................. 86
Figure 43: Student -teacher ratio by province 2011 ............................................................................................................ 87
Figure 44: Public expenditure on education as percentage of GDP ............................................................................... 88
Figure 45: Education expenditure as percentage of total government expenditure ............................................. 88
Figure 46: Public expenditure on primary education as percentage of total government education
expenditure ............................................................................................................................................................................................. 89
Figure 47: Public expenditure per student as % of GDP per capita ............................................................................... 90
Figure 48: Number of TVET centres (formal and informal) ............................................................................................. 91
Figure 49: Adult literacy level by year 2008-2013 ............................................................................................................... 90
Figure 50: Number and % distribution by type of literacy programmes .................................................................... 91
Figure 51: Regional distribution of literacy courses ............................................................................................................ 96
Figure 52: Number of adult continued basic education programmes .......................................................................... 96
Figure 53: Number of literacy learners by year and sex ..................................................................................................... 97
Figure 54: Literacy rate disaggregated by province and sex ............................................................................................ 97
Figure 55: Number of adult literacy facilitators by year and sex.................................................................................... 98
Figure 56: Regional distribution of literacy facilitators by year and sex .................................................................... 99
Figure 57: Public expenditure on literacy as a % of public expenditure on education ........................................ 99
Figure 58: Female enrolment in % by level and year ........................................................................................................ 100
Figure 59: percentage of qualified female teachers by province .................................................................................. 100
Figure 60: Number of teachers and managers trained by INSET programmes ..................................................... 101
Figure 61: GPI at pre-school level ............................................................................................................................................... 101
Figure 62: GPI for gross intake rate (GIR) at primary level ............................................................................................ 101
Figure 63: GPI for primary NIR .................................................................................................................................................... 102
Figure 64: GER at primary level ................................................................................................................................................... 102
Figure 65: Primary enrolment in numbers ............................................................................................................................. 102
Figure 66: Primary NER .................................................................................................................................................................. 103
Figure 67: Primary ANER ............................................................................................................................................................... 103
Figure 68: GPI primary completion rate .................................................................................................................................. 103
Figure 69: ETR primary to secondary level ............................................................................................................................ 104
Figure 70: GER at secondary level .............................................................................................................................................. 104
Figure 71: GER at basic education level ................................................................................................................................... 104
Figure 72: NER at basic education level ................................................................................................................................... 104
Figure 73: Number and % of INSET trained teachers ........................................................................................................ 105
Figure 74: Number of teachers by academic qualification and by year ..................................................................... 105
Figure 75: percentage of qualified teachers by year ............................................................................................................. 106
Figure 76: Number of teachers participating in and passing the competency test .............................................. 106
Figure 77: School life expectancy (SLE) 2012 & 2013 ....................................................................................................... 108
Afghanistan National EFA Review Report, 2015
7
Acronyms and Glossary of Terms Used AFMIS AFN AKF
Afghanistan Financial Management Information System Afghanistan currency: the Afghani (sometimes referred to as Afs) which is divided into 100 Pulse Aga Khan Foundation
AMICS ANER ANDS
Afghanistan Multiple Indicator Cluster Survey Adjusted Net Enrolment Rate Afghan National Development Strategy (“PRSP”)
AREU BEPA BESST CB
Afghanistan Research and Evaluation Unit Basic Education Programme for Afghanistan (GIZ, Germany) Building Education Support System for Teachers Capacity Building
CBE Community Based Education CBS CD CEDAW CPD
Community Based School Capacity Development Convention on Elimination of All Forms of Discrimination Against Women Continued Professional Development
CSO CSO
Civil Society Organisation Central Statistical Office
Dar-ul-Ulums Grade 13-14 of Islamic Education DED DM Literacy DM TVET ECD ECCE
District Education Directorates Deputy Ministry for Literacy Deputy Ministry for Technical and Vocational Education and Training Early Child Development Early Childhood Care and Development
EDB Education Development Board EFA EJSR ELA
Education for All Education Joint Sector Review Enhancement of Literacy in Afghanistan
EMIS Education Management and Information System EQUIP Education Quality Improvement Programme ETR FTI
Effective Transition Rate Fast Track Initiative
GER Gross Enrolment Rate GMU Grants Management Unit GoA Government of Afghanistan HDR HRDB ICT
Information and Communication Technology Human Development Report (UNDP) Human Resource Development Board
IGoA Islamic Government of Afghanistan IIEP International Institute for Educational Planning, Paris INSET IRoA
In-service Teacher Training Islamic Republic of Afghanistan
ISAF International Security Assistance Force IT LCEP
Information Technology Learning for Community Empowerment Program
LEAP Madrasa M&E
Literacy Enhancement for Afghan Police Islamic school for children Monitoring and Evaluation
Afghanistan National EFA Review Report, 2015
8
MAIL Ministry of Agriculture Irrigation and Livestock MDG Millennium Development Goal MoE Ministry of Education MoF Ministry of Finance MoHE Ministry of Higher Education MoI Ministry of Interior MOPH Ministry of Public Health MRRD NAPWA
Ministry of Rural Rehabilitation and Development National Action Plan for Women of Afghanistan
NDP National Development Program NER Net Enrolment Rate NESP National Education Strategic Plan NESP II National Education Strategic Plan II (1389-1393) NFEMIS Non Formal Education Management Information System NGO NPP NRVA
Non Government Organisation National Priority Programme National Risk and Vulnerability Assessment (2003; 2005; 2007-08; 2011-12)
ODA Official Development Assistance PACE-A PC
Partnership Advancing Community-based Education, Afghanistan Provincial Council
PED Provincial Education Department PRT Provincial Reconstruction Team PCR PRESET PTR REU
Pupil Class Ratio Pre-service Teacher Training Pupil Teacher Ratio Research and Evaluation Unit
SBS SCA
Sector Budget Support Swedish Committee for Afghanistan
Shura Traditional Afghan committee structure, used for school councils (SMC) SMC School Management Committee, sometimes also named school Shuras SWAp Sector Wide Approach SY Solar Year TA Tashkil
Technical Assistance Civil Service staff establishment
TB TTC
Textbook Teacher Training Centre
TVET Technical & Vocational Education and Training UNAMA UNDAF
United Nations Assistance Mission to Afghanistan United Nations’ Development Assistance Framework
UNDP United Nations Development Programme UNESCO United Nations Educational, Scientific and Cultural Organization UNICEF UNSCR
United Nation’s Children Fund United Nations Security Council Resolution
Afghanistan National EFA Review Report, 2015
9
1. Introduction
The Afghanistan National Education for All Review Report, 2015 is the result of a government led process of critical reflection on educational performance during the last decade. The Ministry of Education (MOE) established three technical working groups with the participation of MOE staff, external development partners and other sector stakeholders. With technical assistance provided by UNESCO and an external consultant, the Planning Department of MOE has led the process towards the finalisation of this stocktaking of progress. The report is divided in four sections and one annex. The first section, the Introduction, provides the contextual information, the methodology, and gives a brief overview of education sector challenges, the policy framework and the relevance of EFA in the Afghan context. The second chapter comprises the bulk of the report. It tracks progress in the six EFA goals against a standardised list of indicators. The third chapter looks at EFA strategies and sector management in Afghanistan and it identifies emerging challenges and government priorities, not the least in the post-2015 scenario. The final chapter, four, summarises the conclusions and suggests directions for the way forward. The annex contains a full list of all the EFA indicators. It contains detailed quantitative data and is structured on basis of the six EFA goals and numbered by the indicators specified in the “Detailed Outline Report for EFA of The National EFA Review Report”.
1.1 Development Context Afghanistan is one of the poorest countries in the world1. It ranks as the 13th least developed on the HDI. Life expectancy is 49,1 years for both sexes2. It has one of the highest fertility rates in the world (6 births /woman)3, one of the highest maternal mortality rates in the world (460 per 100.000), and the highest infant mortality rate in the world (122 deaths per 1000 live births)4. The social and economic fabric of the country is marred by decades of war and conflict. Poverty is widespread. According to the National Risk and Vulnerability Assessment (NRVA) 2011-2012, 36.5% of Afghans are not able to meet their basic needs, and are under the national poverty line, which is defined at 1.255 Afs (USD 22) per person per month5. The official unemployment rate is low and stands at 8.2%6, but most employed people (77%) have insecure jobs with low salaries, especially women, who are less likely to be employed and have lower salaries7. Malnutrition is almost pandemic. 59% of Afghan children are stunted, which means that due to malnutrition occurring before the age of two, they are suffering irreversible damage to their physical and cognitive development8. Deficiencies of iodine or iron have been shown to reduce children’s cognitive and motor skills and even their IQ9. Similarly, worm infestation causes anaemia and poor physical, intellectual and cognitive development, resulting in a detrimental effect on students’ educational performance. Even short-term hunger can adversely affect a child’s ability to learn.
1 Human Development Report 2013, UNDP
2 Ibid.
3 Ibid.
4 Ibid.
5 National Risk and Vulnerability Assessment 2011 – 2012
6 Ibid.
7 Draft National Education Sector Plan 2014-2020 (NESP) III).
8 UNICEF Afghanistan statistics 2008-2012
9 See e.g. Sultan Qaboos Univ Med J. Dec 2007; 7(3): 267–272.
Afghanistan National EFA Review Report, 2015
10
The exact number of the Afghan population is unknown. The last comprehensive census in Afghanistan took place in 1979. All later population data are estimates based on projections from this census. Afghanistan Central Statistics Office (CSO) estimated that Afghanistan’s population was 25.5 million in 2012. 10 United Nations Population Division (UNPD), however, estimated the population to be 30.552 million in 2013.11 Population growth according to UNPD is 3.1%, and if the population continues to grow at this rate, it will reach 42.6 million in 2020. Afghanistan has a very young population. The demographic composition is 50 % under the age of 15, and 36% of the population are at school age. 12 NRVA (2008) reports that 21% of Afghan children aged 6-17 (about 1.9 million) are working. Of these, at least 13% (1.2 million) can be classified as child labourers, e.g. only working. Child labour is a key reason for children being out of school. The number of grade 12 school graduates is going to double from 225,000 in 2014 to 451,000 in 2019. In a response to this context the Afghanistan National Development Strategy (ANDS) was developed in 2008. It had a vision that by 2020 Afghanistan would be a stable Islamic constitutional democracy at peace with itself and its neighbours; that it would be a tolerant, united and pluralistic nation honouring its Islamic heritage and aspirations towards participation, justice and equal rights for all. Afghanistan should be based on a strong, private sector led market economy, social equity, and environmental sustainability. The major goals of the ANDS were: Security, Governance, Rule of Law and Human Rights, and Economic and Social Development.
With regard to education, the Government aims at having a well-educated nation. Since 2002, the
Government has invested heavily in the education sector and has attained progress toward the
ultimate goals of educating all of Afghanistan’s children, reducing illiteracy, and creating a skilled
labour force. (ANDS 2008:14). The Constitution of Afghanistan (Article 22) proclaims that ‘education
is the right of all citizens of Afghanistan’. It echoes the Universal Declaration of Human Rights (1948)
that declared education as a human right. I
At the end of the strategic period, progress against the ANDS goals has been mixed. There has been significant progress in social development since the fall of the Taliban in 2001. Life expectancy at birth has risen from 4413 to 60,514 and consistent and impressive improvements have been observed for maternal health indicators. Significant improvements have been seen in youth literacy where female literacy has gone up from 29% in 2005 to 48% in 2012 and male literacy from 43% in 2005 to 64% in 2012.15 The estimated years of schooling for all increased from 2.5 to 8.1 during the last ten years16. The distribution of social benefits, however, has been unequal. The Gender Inequality Index (GII) value is the second lowest in the world17, and the sustainability of this progress remains fragile with the withdrawal of international military forces and a possible reduction in the volume of external development assistance.
10
National Risk and Vulnerability Assessment 2011 – 2012 11
United Nations Population Division, World Population Prospects- The 2012 Revision, 12
National Risk and Vulnerability Assessment 2011 – 2012 13
CIA Factbook 2009 14
Unicef Statistics, Afghanistan 2012 15
National Risk and Vulnerability Assessment 2011 – 2012 16
NRVA 2011 17
UNDP Statistical Tables from the 2013 Human Development Report
Afghanistan National EFA Review Report, 2015
11
The economy has grown during the last decade but the future looks bleak. Political uncertainties due to the withdrawal of international forces have reduced financial investments, and economic growth is expected to decrease from 14.4% in 2012 to 3.5% in 201418. The human rights situation, however, is worrying; in particular for women and girls, and the year 2013 witnessed a number of setbacks in the human rights situation. Last year a landmark law to prevent violence against women was turned down by parliament, the quota of seats for women on provincial councils was cut, and a proposal to reintroduce stoning as a punishment for adultery – used more against women than men – put forward by the Ministry of Justice. In 2014, parliament passed a law that exposed victims of domestic violence by preventing relatives testifying against each other, although it was later modified on Karzai's orders19. In addition, insecurity is a key barrier to development, including education. According to the 2012 Global Peace Index (GPI), Afghanistan was the most insecure country in the world after Somalia. In 2012, about 553 schools were closed due to insecurity, depriving over 275.000 students from education. Local communities and the Ministry of Education (MoE) with the support of religious and local influential persons are continuously making efforts through negotiations with Taliban to re-open the schools.
1.2 Education Sector Challenges There has been considerable progress over the past ten years in terms of access to education in Afghanistan. Enrolment has increased from just about 1 million children, almost all boys, in 2001 to over 9 million in 2013 of which 39% are girls. All education-related indicators– including gender equality indicators – show improvement since NRVA 2007-08, even though at the same time it is observed that the pace of improvement has slowed down. Despite major achievements in the last decade, education performance in Afghanistan is still among the poorest in the world, and the current rate of improvement will fail to achieve the ANDS targets by 2020. The share of the Afghan population, 25 years and older, that has completed any level of formal education is very small– less than 7 %, and for women as few as 3 %.20 However, major improvements in primary and secondary school completion are observed for the younger age group 15-24 years, especially for girls. This is the result of increasing school attendance in the past decade. The net enrolment rates21 (NER) in primary education for girls and boys were 64 and 86 % in 2013, while NER in General Education (gr. 1-12) were 50 and 71 for girls and boys respectively.. The downside of these figures is that 3.3 million children are still out of school according to MOE Planning Department estimations. Opportunities to attend education are inadequate, especially for girls and women, and rural and Kuchi (nomadic tribe) populations in general, even though the gender gap in education and literacy show continuous improvement, in both absolute and relative terms. Thus, the gender parity index (GPI) in primary, secondary and tertiary education was 0.74, 0.53 and 0.42 respectively in 2012, compared to 0.69, 0.49 and 0.28 in 2007-08, (EJSR 2012, based on MOE EMIS).
18
World Bank: South Asia Economic Focus Report, Oct. 2013. 19
Amnesty International, “Afghanistan: President Karzai blocks law protecting perpetrators of domestic violence”, 17 February 2014 20
National Risk and Vulnerability Assessment 2011 – 2012 21 NER: The number of children of official primary school age, who are enrolled in primary education as a percentage of the total children of the official school age population. NER is considered to be a measure of the education coverage at a specific level in a country’s education system and as such a useful indicator for cross country comparisons.
Afghanistan National EFA Review Report, 2015
12
Barriers to access to education include: insecurity, poverty, and child work, lack of schools in remote areas, long walking distance to schools, and harassment of children on their way to school.22 Attacks against students and schools are still common. The most frequent type of attack according to the UNICEF school security database is arson, where school buildings, tents or inventory was burned. Explosions in or near schools buildings (including throwing of grenades, mines and rocket attacks) and direct attacks against students or education personnel are also common23. For girls, cultural barriers are dominant among the reasons for not attending school. Specific barriers to girls’ education include shortage of female teachers, especially in higher grades, cultural beliefs about girls’ education, lack of necessary facilities in schools such as toilets, drinking water, and surrounding walls, and early marriages (child marriage). For boys, one of the main reasons is the need to contribute to family income, and also lack of access and quality of access to school24. The importance of these reasons increases with age. Insecurity and distance to schools are important reasons for non-attendance in rural areas. No more than around two in five rural households live within two kilometres of a primary school. Overall net primary school attendance in rural areas is 54 %, while in urban areas it is 78 %.25 Primary school attendance varies significantly between children living in the poorest households (40% attendance) and those living in the wealthiest households (79% attendance). Disparity in attendance26 also varies across regions with central region having the highest (77.9% attendance) and lowest in Southern region (21.9%). It was not possible to disaggregate data by province due to unavailability of data (AMICS 2010/11). With regard to literacy, similar patterns and changes are recorded as for school attendance and enrolment. The adult literacy rate was 45 % for men and a low 17 % for women (AMICS 2010/2011)27. The literacy rate is dramatically different for the rural and urban populations, with rural adult literacy rate less than half of urban adult literacy rate for both males and females. Much of this difference can be contributed to less school access available in rural compared to urban areas. The improvements in literacy between 2005 and 2011-12 are particularly observed in the youth literacy rate, which, while still low, increased from 20 to 32 % for females aged 15-24 and from 40 to 62 % for male youth.28 Consequently, the gender parity index for youth literacy has improved from 0.45 in 2007-08 to 0.52 in 2011-12. Again, the population in rural areas is at a severe disadvantage. The youth literacy rate there is only 39 %, compared to 71 % in urban areas.29 The stark contrasts in literacy rates between male, female and provinces are illustrated in the maps on p. 42 figure15.
1.3 Education Policies, Strategies and Interventions Since the signing of the Education for All (EFA) goals, the government of Afghanistan has put in place several policies, strategies and plans towards achieving the EFA goals. The National Education Strategic Plans (NESP) I, II, and III (not yet approved) are key strategy documents developed to facilitate this process.
22
National Risk and Vulnerability Assessment 2011 – 2012 23
Knowledge on Fire: Attacks on Education in Afghanistan, Care, 2009 24
National Risk and Vulnerability Assessment 2011 – 2012 25
Ibid. 26
AMICS data on attendance is used here because the MOE EMIS does not disaggregate enrolment by wealth. For other comparisons, however, the EMIS enrolment figures have been used. 27
EMIS provides figures of literacy learners in absolute figures but does not calculate the literacy rates. Therefore, AMICS and NRVA data has been used. 28
National Risk and Vulnerability Assessment 2011 – 2012 29
Ibid.
Afghanistan National EFA Review Report, 2015
13
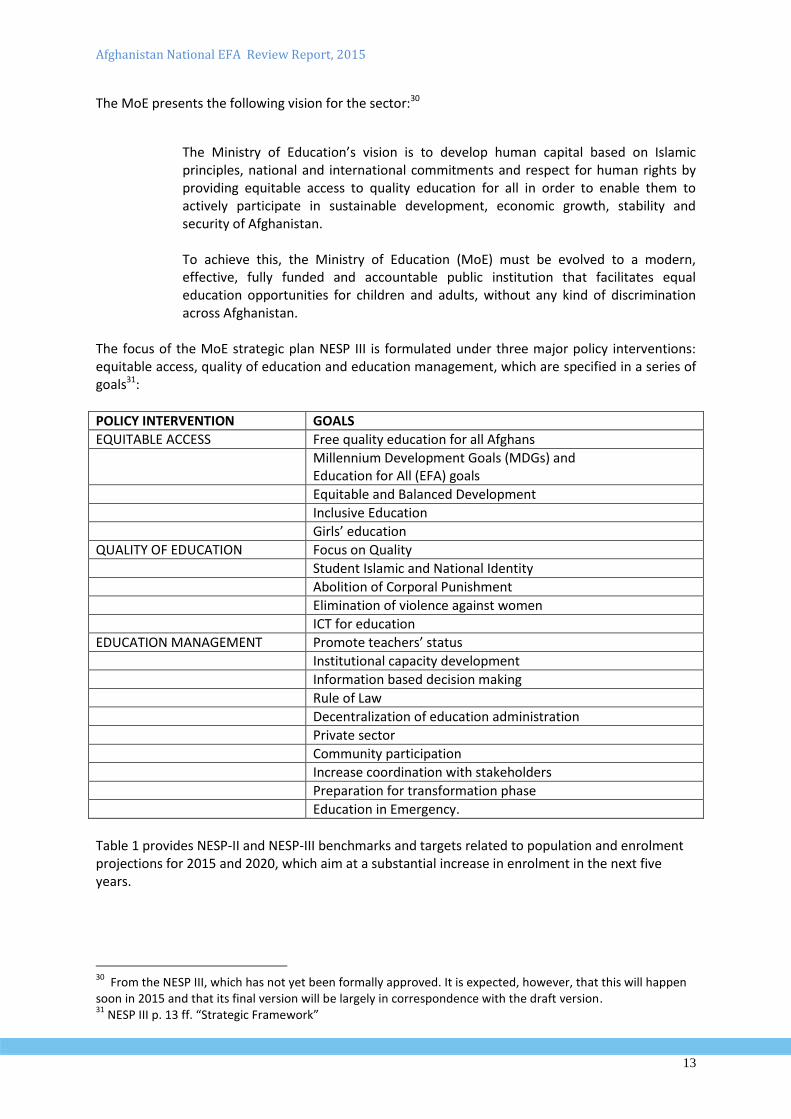
The MoE presents the following vision for the sector:30
The Ministry of Education’s vision is to develop human capital based on Islamic principles, national and international commitments and respect for human rights by providing equitable access to quality education for all in order to enable them to actively participate in sustainable development, economic growth, stability and security of Afghanistan. To achieve this, the Ministry of Education (MoE) must be evolved to a modern, effective, fully funded and accountable public institution that facilitates equal education opportunities for children and adults, without any kind of discrimination across Afghanistan.
The focus of the MoE strategic plan NESP III is formulated under three major policy interventions: equitable access, quality of education and education management, which are specified in a series of goals31:
POLICY INTERVENTION GOALS
EQUITABLE ACCESS Free quality education for all Afghans
Millennium Development Goals (MDGs) and Education for All (EFA) goals
Equitable and Balanced Development
Inclusive Education
Girls’ education
QUALITY OF EDUCATION Focus on Quality
Student Islamic and National Identity
Abolition of Corporal Punishment
Elimination of violence against women
ICT for education
EDUCATION MANAGEMENT Promote teachers’ status
Institutional capacity development
Information based decision making
Rule of Law
Decentralization of education administration
Private sector
Community participation
Increase coordination with stakeholders
Preparation for transformation phase
Education in Emergency.
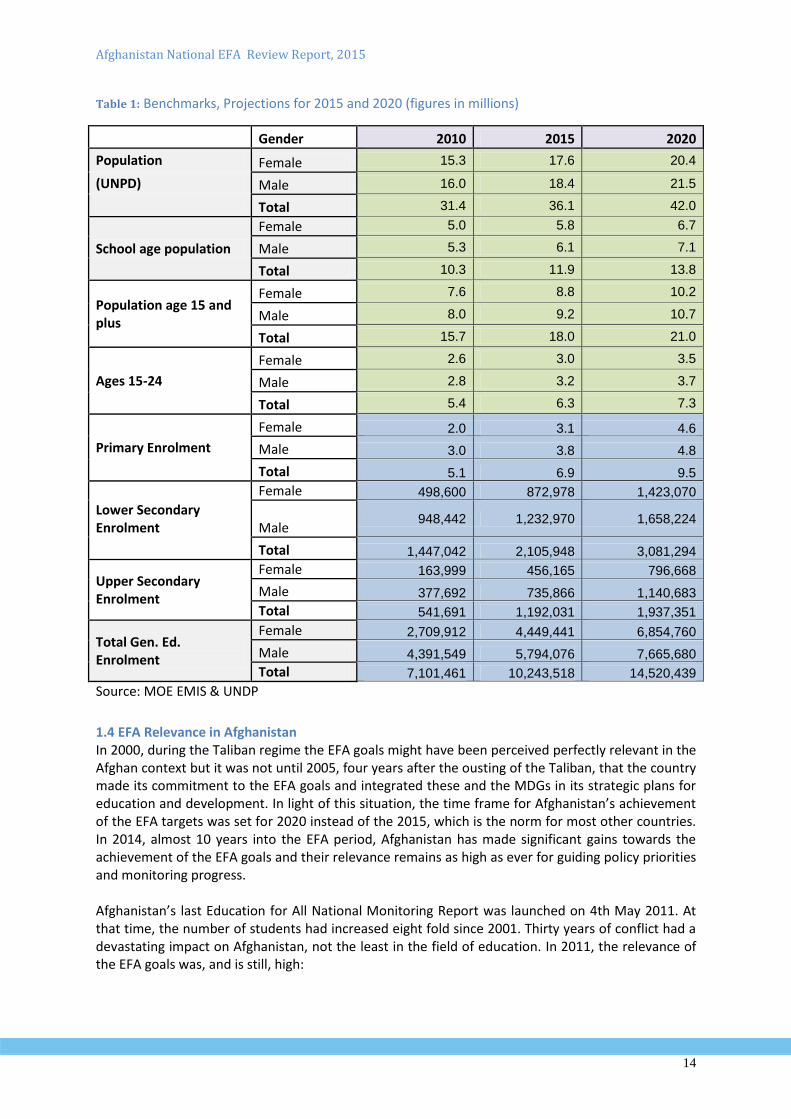
Table 1 provides NESP-II and NESP-III benchmarks and targets related to population and enrolment projections for 2015 and 2020, which aim at a substantial increase in enrolment in the next five years.
30
From the NESP III, which has not yet been formally approved. It is expected, however, that this will happen soon in 2015 and that its final version will be largely in correspondence with the draft version. 31
NESP III p. 13 ff. “Strategic Framework”
Afghanistan National EFA Review Report, 2015
14
Table 1: Benchmarks, Projections for 2015 and 2020 (figures in millions)
Gender 2010 2015 2020
Population Female 15.3 17.6 20.4
(UNPD) Male 16.0 18.4 21.5
Total 31.4 36.1 42.0
School age population
Female 5.0 5.8 6.7
Male 5.3 6.1 7.1
Total 10.3 11.9 13.8
Population age 15 and plus
Female 7.6 8.8 10.2
Male 8.0 9.2 10.7
Total 15.7 18.0 21.0
Ages 15-24
Female 2.6 3.0 3.5
Male 2.8 3.2 3.7
Total 5.4 6.3 7.3
Primary Enrolment
Female 2.0 3.1 4.6
Male 3.0 3.8 4.8
Total 5.1 6.9 9.5
Female 498,600 872,978 1,423,070
Lower Secondary Enrolment Male
948,442 1,232,970 1,658,224
Total 1,447,042 2,105,948 3,081,294
Upper Secondary Enrolment
Female 163,999 456,165 796,668
Male 377,692 735,866 1,140,683
Total 541,691 1,192,031 1,937,351
Total Gen. Ed. Enrolment
Female 2,709,912 4,449,441 6,854,760
Male 4,391,549 5,794,076 7,665,680
Total 7,101,461 10,243,518 14,520,439
Source: MOE EMIS & UNDP
1.4 EFA Relevance in Afghanistan In 2000, during the Taliban regime the EFA goals might have been perceived perfectly relevant in the Afghan context but it was not until 2005, four years after the ousting of the Taliban, that the country made its commitment to the EFA goals and integrated these and the MDGs in its strategic plans for education and development. In light of this situation, the time frame for Afghanistan’s achievement of the EFA targets was set for 2020 instead of the 2015, which is the norm for most other countries. In 2014, almost 10 years into the EFA period, Afghanistan has made significant gains towards the achievement of the EFA goals and their relevance remains as high as ever for guiding policy priorities and monitoring progress. Afghanistan’s last Education for All National Monitoring Report was launched on 4th May 2011. At that time, the number of students had increased eight fold since 2001. Thirty years of conflict had a devastating impact on Afghanistan, not the least in the field of education. In 2011, the relevance of the EFA goals was, and is still, high:
Afghanistan National EFA Review Report, 2015
15
Early childhood care and education has never attracted any meaningful attention in the overall Afghan context;
Primary education enrolment ranked among the lowest in the world in 2000 and despite significant gains in access, the number of out of school children remains high and survival rates are worrying;
Learning opportunities for youth and adults were negligible at the beginning of the decade and are still grossly inadequate;
Literacy rates were and are still among the lowest in the world but are rapidly improving among the younger population;
Gender equality in education was almost utopian in 2000 and is still very low, but the gap is slowly narrowing, in particular at primary level;
The quality of education is generally poor. Learning achievement is low and despite improvements in teacher qualifications, curriculum and textbooks education is still faced with a considerable number of challenges.
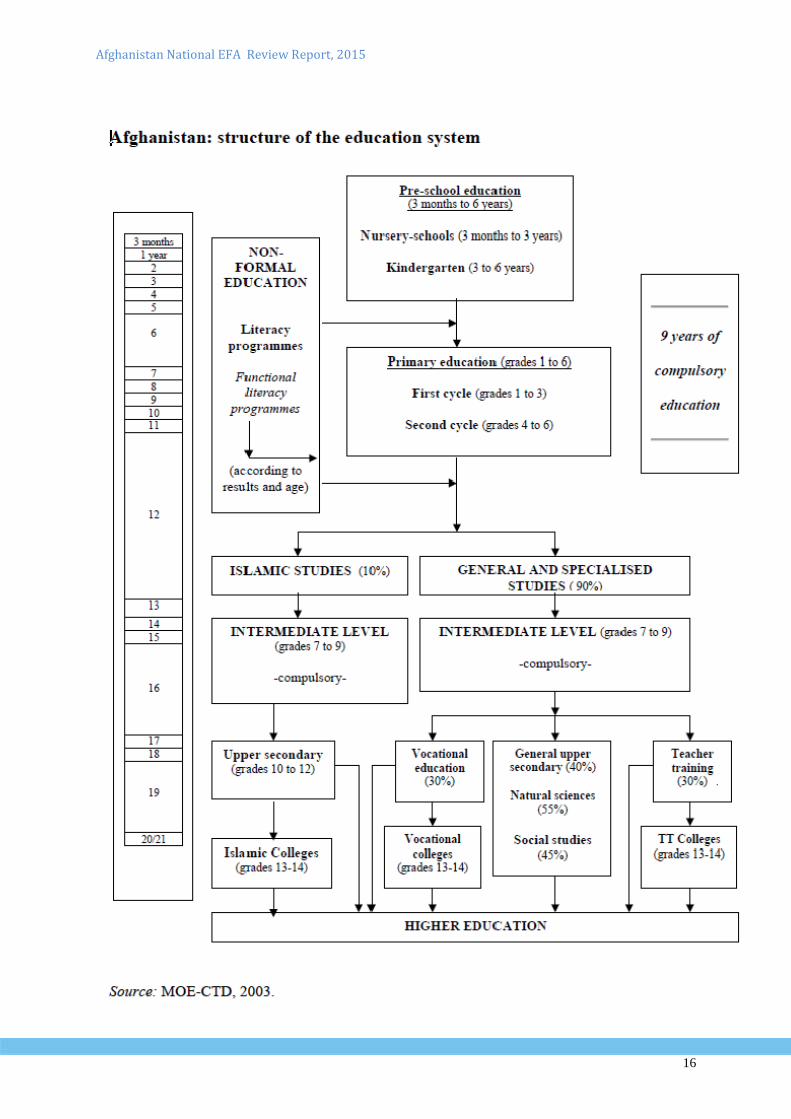
Afghanistan Education System The structure of the Afghan education system consists of three levels of general education from grades 1-12, a parallel system of Islamic education, technical and vocational education as well as teacher training from higher secondary level and higher education above grade 13.
Primary Education: 6 years Grade 1-6 age 7-12 The government provides free academic education at state schools. From age 7 to age 12 pupils attend primary schools where they learn the basics of reading, writing, arithmetic and their national culture. Religious education is the responsibility of clerics at mosques, but it is being regulated by the Department of Islamic education under MOE32. Lower Secondary Education: 3 years Grade 7-9 age 13-15 Three years of middle school follow where academic-style education continues. Students must pass an examination at the end of this phase if they wish to study further. Higher Secondary Education: 3 years, grade 10-12 age 16-18 At secondary school students have a choice between continuing with an academic path for 3 years that could perhaps lead on to university, or study subjects such as applied agriculture, aeronautics, arts, commerce and teacher training instead. Both programs culminate in a Baccalaureate examination. Vocational Education: from short-term courses to formal training grades 10-12 and 13-14 Technical and Vocational Education (TVET) programmes are delivered in formal education led by MOE and non-formal courses and programmes led by MOLSAMD and NGOS. Tertiary Education: grade 13 and onwards Teacher Education (grade 13-14) is offered at Teacher Training Colleges (TTCs) under the Teacher Education Department of MOE. Higher education is led by MOHE and is provided by a large number of public and private universities. The general structure consists of Bachelor Degrees (4 years), Masters’ Degrees (3 years) and doctorate/PhD degrees (3 years). The Islamic Dar-ul-Ulom system offers education at the level of grade 13-14.
Non-formal Education: In addition to the above-mentioned formal education structure non-formal TVET (short courses) are run by Ministry of Labour, Social Affairs, Martyrs and the Disabled (MoLSAMD) and NGOs. Furthermore, non-formal literacy courses, non-formal adult education courses, etc. are run by MOE Department for Literacy and other ministries, e.g. Ministry of the Interior offer literacy courses for the police and Ministry of Defence offer courses for the Afghan National Army (ANA).
32
For an introduction to Islamic education in Afghanistan see Anza 2003 and Karlson and Mansory.
Afghanistan National EFA Review Report, 2015
16
Afghanistan National EFA Review Report, 2015
17
2. Tracking Progress The stocktaking of EFA progress was done on a goal-by-goal basis, not only in terms of statistical presentation and qualitative analysis of progress, but also assessment of efficiency and effectiveness of the programmes and initiatives employed by the country to achieve the goal (see Annex for detailed indicators). All enrolment ratios are based on projections from the 1979 population census. In 2012, according
to Central Statistics Office (CSO), the population was 27 million. According to the United Nations
Development Program (UNDP) population estimates it, however, was about 34 million.
The implications for Gross Enrolment Rate (GER)/Net Enrolment Rate (NER) of using either of the
two figures are significant and all ratio data tend to be flawed for these reasons33. Notwithstanding,
this fact, MOE has used the UNDP projections as calculation reference.
Goal 1 Early Childhood Care and Education (ECCE)
Goal: Expanding Early Childhood Care and Education
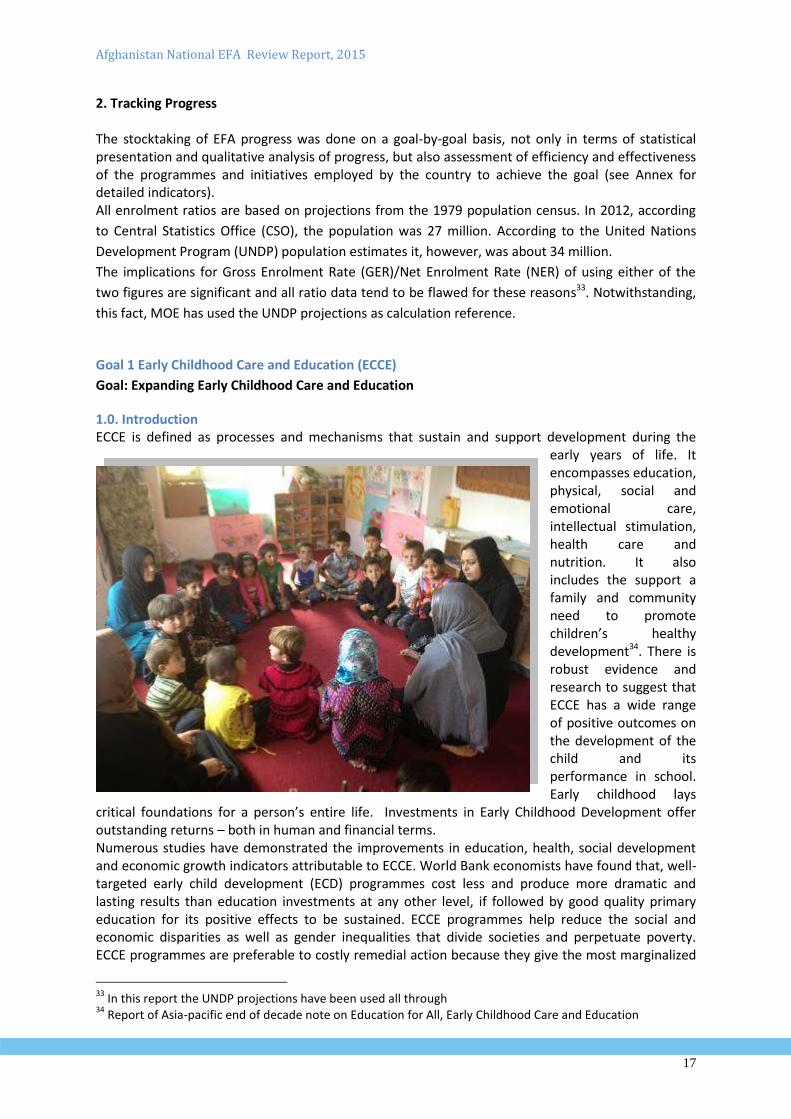
1.0. Introduction ECCE is defined as processes and mechanisms that sustain and support development during the
early years of life. It encompasses education, physical, social and emotional care, intellectual stimulation, health care and nutrition. It also includes the support a family and community need to promote children’s healthy development34. There is robust evidence and research to suggest that ECCE has a wide range of positive outcomes on the development of the child and its performance in school. Early childhood lays
critical foundations for a person’s entire life. Investments in Early Childhood Development offer outstanding returns – both in human and financial terms. Numerous studies have demonstrated the improvements in education, health, social development and economic growth indicators attributable to ECCE. World Bank economists have found that, well-targeted early child development (ECD) programmes cost less and produce more dramatic and lasting results than education investments at any other level, if followed by good quality primary education for its positive effects to be sustained. ECCE programmes help reduce the social and economic disparities as well as gender inequalities that divide societies and perpetuate poverty. ECCE programmes are preferable to costly remedial action because they give the most marginalized
33
In this report the UNDP projections have been used all through 34
Report of Asia-pacific end of decade note on Education for All, Early Childhood Care and Education
Afghanistan National EFA Review Report, 2015
18
children an equal start to develop, rather than investing later when the inequality is already much more pronounced. If ECCE investments are not followed up at the later stages, the positive effects erode and ECCE likely to leave only a negligible lasting impact.
In Afghanistan, attention to ECCE, so far, has beennegligible. Most of the programs for early
childhood care and education refer to an interval between birth and 6 years of life and it is broadly
divided into two groups: 0-4 years old and 5-6 years old and focus has mainly been on pre-school.
The Education Law from 2008 (MoE, 1387/2008) stipulates that the Ministry of Education is
responsible for providing pre-school education to children. It says “Children, whose ages are over
kindergarten and lower than the school enrolment age, shall be enrolled in the pre-school education
level”. Currently, the MoE, ECCE focus is on children aged 5-6 while other ministries, e.g. Ministry of
Labour Social Affairs and Martyrs and the Disabled (MoLSAMD), provide service and care to a very
limited number of children below this age, but as explained below, this subsector is largely
uncoordinated. A policy for the pre-school area has been drafted 2013 and awaiting approval.
A pre-school unit has been established within the MoE and a preschool unit added to the Curriculum
Development Department. A training package for pre-school teachers is being finalized, while, the
development of pre-school curriculum and learning materials have not yet been finalized.
Acknowledging that the capacity to deliver comprehensive pre-school services for children is not
available, the NESP III states that the MoE in coordination with MoLSAMD will develop Afghanistan’s
early childhood education policy based on the specific situation of the country in order to facilitate
achieving the first objective of “Education for All” and the MoE encourages development partners
and private sector to participate in implementing early childhood education.
1.1. Access and participation Access and participation in ECCE programmes have been very limited, and most of this has been
private. Currently, there are some early childhood education initiatives being implemented on a
limited basis in Afghanistan through private providers as well as through donor-funded programming.
Some of the more prominent ECCE initiatives are being implemented by BRAC, IRC, Save the Children,
Aga Khan Foundation and UNICEF. Another important provider of preschool education is the mosque.
There are mosque-based pre-school teaching/learning initiatives throughout Afghanistan. For many
families, these pre-school programmes play a critical educational role. There is no reliable data on
how many of these activities exist across the country or on the number of children attending them,
but it has been estimated that the vast majority of Afghan children attend some kind of mosque-
based programme, for some period of time.
There is not yet a systematic collection of data and the poor performance in ECCE suggests that it
has not been a policy priority.
Based on MoE and NGOs administrative records, the total number of students/children in non-
mosque based pre-school programs was 40,000 (60% girls) in 2013. The ECCE programmes of non-
mosque and mosque-based education are different. If children learning in mosques in 2013 are
included, the number comes to 1.2 million, but the learning processes, which take place there, do
not fully qualify as ECCE, according to the definition given in the beginning of this section since
mostly religious subjects are taught in Mosques.
Afghanistan National EFA Review Report, 2015
19
The GER in pre-primary education (both in mosques and other programs) for 2013 was 1.6% (1.9%
for boys and 1.1% for girls)35.
Some progress has been made in expanding opportunities for access to preschool education, but
from a very low level. The number of children in all pre-school programs (including mosque-based,
where the proportion of boys is higher) increased from 99,977 children (40% female) in 2003 to
1,226,533 children (42% female) in 2013, (NGOs and MoE records).
A total of 22,225 children were enrolled in private pre-primary education programs in 2013, which
constitutes 55.2% of total pre-primary enrolment (non-mosque based). The proportion of girls
enrolled in private pre-primary education is slightly lower than that of boys.36 However, the total
enrolment figure does not include a large number of children aged below seven years who are
learning Islamic education in mosques since it is not fully comparable with the pre-primary
education concept.
Most ECCE teachers have been given short-term training on pedagogical aspects, but almost all are
below grade 12 graduates. Females constitute 98% of ECCE teachers/care givers 37 (Save the
Children, 2013). On average, the pupil-teacher ratio in pre-primary programs was 22:1 in 2013.
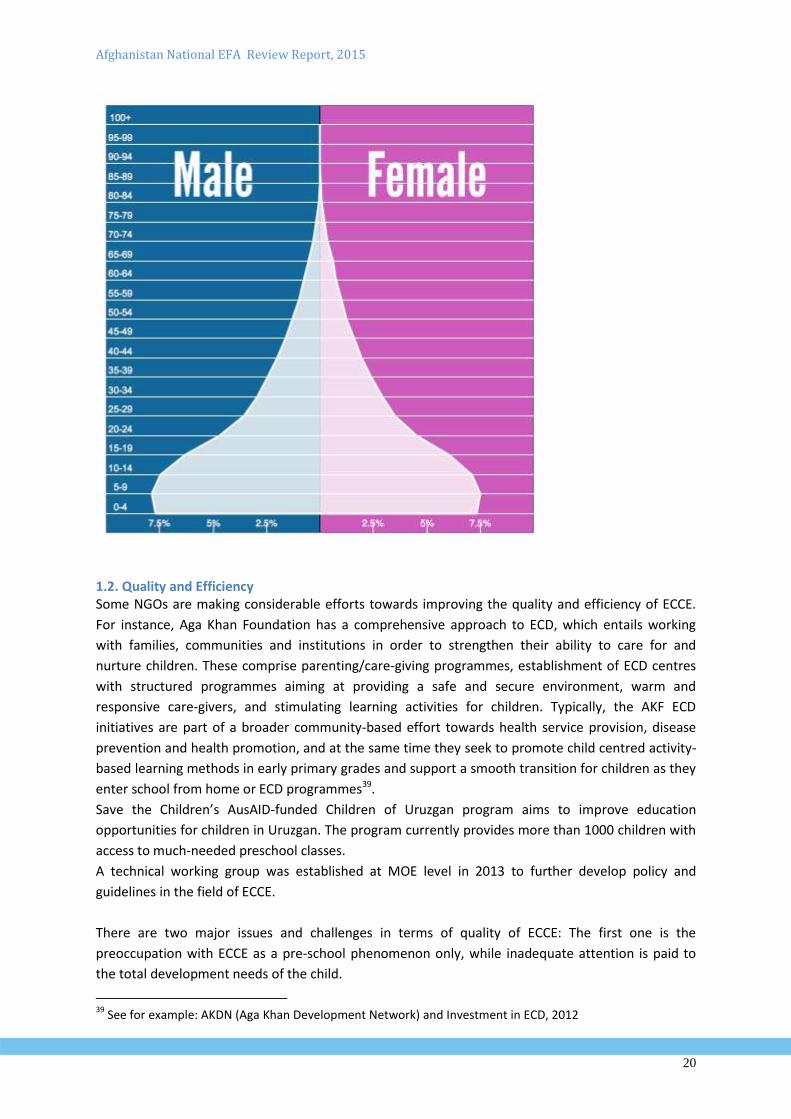
The figure with the population pyramid below suggests that the population of children aged 0-4
years constitute more than 1/3 of the estimated 13 million in the age group 1-14.
Figure 1 Population pyramid of Afghanistan38
35
MOE EMIS 36
This information was collected by telephonic data collection methods, there might be other pre-primary providers and students that are not reflected in this calculation. 37
Save the Children provided this data to MoE in a report. 38
http://populationpyramid.net/afghanistan/2015/
Afghanistan National EFA Review Report, 2015
20
1.2. Quality and Efficiency Some NGOs are making considerable efforts towards improving the quality and efficiency of ECCE.
For instance, Aga Khan Foundation has a comprehensive approach to ECD, which entails working
with families, communities and institutions in order to strengthen their ability to care for and
nurture children. These comprise parenting/care-giving programmes, establishment of ECD centres
with structured programmes aiming at providing a safe and secure environment, warm and
responsive care-givers, and stimulating learning activities for children. Typically, the AKF ECD
initiatives are part of a broader community-based effort towards health service provision, disease
prevention and health promotion, and at the same time they seek to promote child centred activity-
based learning methods in early primary grades and support a smooth transition for children as they
enter school from home or ECD programmes39.
Save the Children’s AusAID-funded Children of Uruzgan program aims to improve education
opportunities for children in Uruzgan. The program currently provides more than 1000 children with
access to much-needed preschool classes.
A technical working group was established at MOE level in 2013 to further develop policy and
guidelines in the field of ECCE.
There are two major issues and challenges in terms of quality of ECCE: The first one is the
preoccupation with ECCE as a pre-school phenomenon only, while inadequate attention is paid to
the total development needs of the child.
39
See for example: AKDN (Aga Khan Development Network) and Investment in ECD, 2012
Afghanistan National EFA Review Report, 2015
21
The second issue has to do with the lack of an institutional mechanism or structure at community
level, which could cater to the needs of infants and children aged 0-4. If ECD is perceived as an
educational issue only, i.e. the responsibility of MOE, then experience has shown that little
structured intervention, if anything at all, is applied before the pre-primary school level. On the
other hand, the needs for psycho-motoric, cognitive, linguistic stimulation and social development
are critical at the infant stages, so an educational perspective is indispensable, in addition to a health
perspective.
1.3 Inequality and uncoordinated provision of ECCE services Currently, the provision of ECCE services is limited to a few urban private centres, mainly catering to
the elites and to rural districts in areas where NGOs focusing on ECCE are active. No systematic data
were available to the EFA review team to disaggregate the provision of such ECCE services.
ECCE service provision is uncoordinated. At least four ministries work to provide early childhood care
and education in addition to the NGOs and private sector. In view of legislation, the role of each
ministry in the actual service delivery is still not clear and it is rather complementary to each other,
which has led to some duplications. For instance, both MoLSAMD and MoE deal with the children of
5-6, which may not be duplication in terms of coverage and access, but coordination is needed in
terms of content.
1.4. ECCE challenges Despite some progress in preparing a policy for pre-school development, a number of challenges
have been identified. These challenges to ECCE could be summarised as follows:
1. The preoccupation with ECCE as a pre-school phenomenon not paying sufficient attention to
the total development needs of the child
2. The lack of demand for ECCE stemming from the lack of understanding of its importance
3. Lack of a holistic and complementary approach in ECCE programs
4. Lack of strategies to address the quality of public and private ECCE
5. Lack of a comprehensive strategy for pre-school,
6. Lack of a comprehensive monitoring mechanism and evidence-based research to feed into
decision-making
7. Lack of a systematic and cost estimated action plan,
8. No specific budget allocation for the pre-school programme,
9. Need for improving the capacity and expansion of organizational structure
10. Pre-school is not compulsory
11. Lack of clear inter-Ministerial coordination structure
12. Low priority to pre-school education in the legal framework as it is not compulsory
13. Inequality in access to and quality of ECCE programs
14. Lack of funding and allocation of public resource to pre-school programs
15. Lack of a formal curriculum for pre-school programs
16. Lack of qualified teachers
17. Lack of a functional national curriculum for pre-school age group
1.5. Conclusion and way forward (including beyond 2015) There seems to be a growing realisation in Afghanistan that ECCE is important and that investments
in this goal might potentially yield significant returns. In order to realise this potential, however,
Afghanistan National EFA Review Report, 2015
22
there is need to raise the level of political commitment to ECCE. There is need for the development
of technical capacity, both in terms of conceptualising ECCE delivery modes and in terms of the
development of a critical mass of professional and dedicated ECCE staff covering a wide range of
expertise, at all levels, from the sectors of health, psychology and education. There is need for the
identification and development of service delivery mechanisms at the community level and there is
need for the mobilisation of domestic resources to finance the development and holistic expansion
of comprehensive and integrated ECCE. One way to start might be to bring this up I the HRDB forum
and to seek ways to engage the Ministry of Health, too.
Goal 2: Universalization of Primary/Basic education
Ensuring that by 2015 all children, particularly girls, children in difficult circumstances and those
belonging to ethnic minorities, have access to and complete free and compulsory primary education
of good quality.
2.1 Introduction The General Education System in Afghanistan consists of grades 1 to 12, which follows a 6-3-3 cycle
of Primary, Lower Secondary, and Upper Secondary respectively.
The Basic Education is comprised of Primary and Lower Secondary and spans grades 1-9.
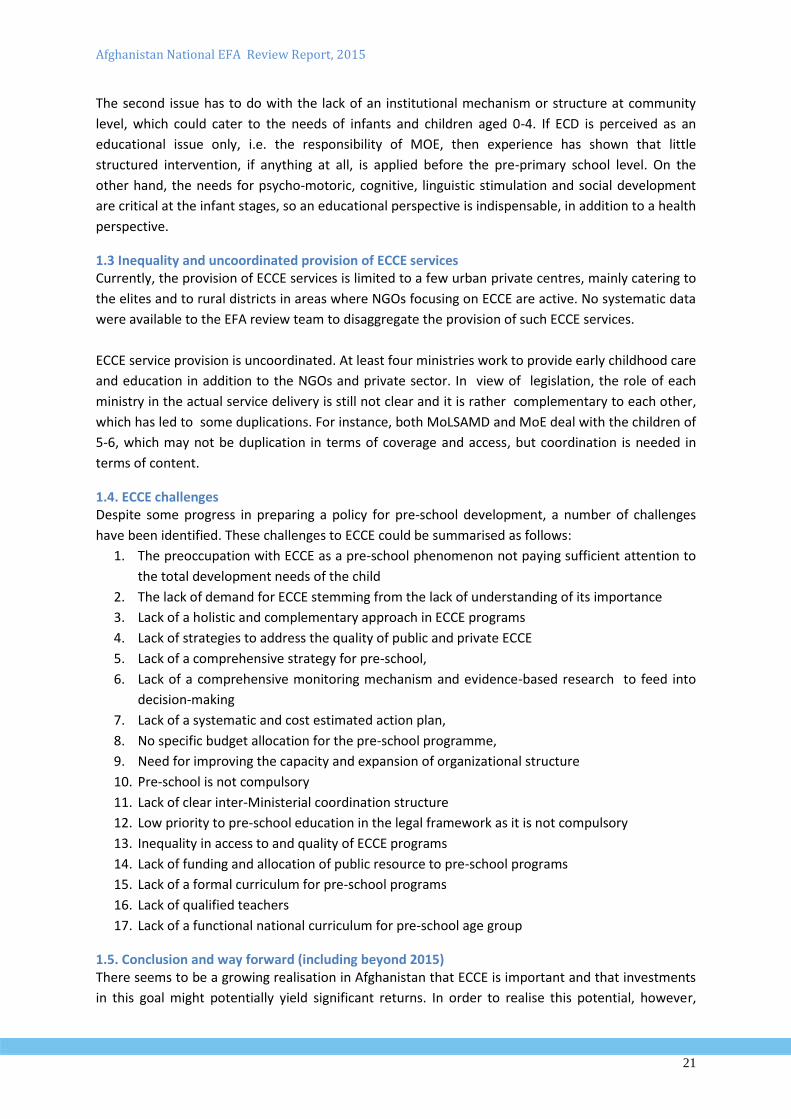
2.3 Access and Participation In Afghanistan significant progress has been made towards achieving goal 2, universalising Primary
Education. In 2001, less than one million children were enrolled in schools with almost no girls
registered. Hearsay evidence
suggests, however, that a
significant number of girls had
received private home-based
education. A decade later in 2012,
the number of children enrolled in
general education schools (primary
and secondary schools) had
increased to 8.2 million of whom
39% are girls. The average annual
growth rate from 2001 to 2012 was
9 %.
In 2020 the total number of
students is expected to be almost
double of the 2012 figure: a total of 13,730 students, of whom 9,341 will be at primary level. Please
refer to figure 24 on p 59 on projected enrolment.
Afghanistan National EFA Review Report, 2015
23
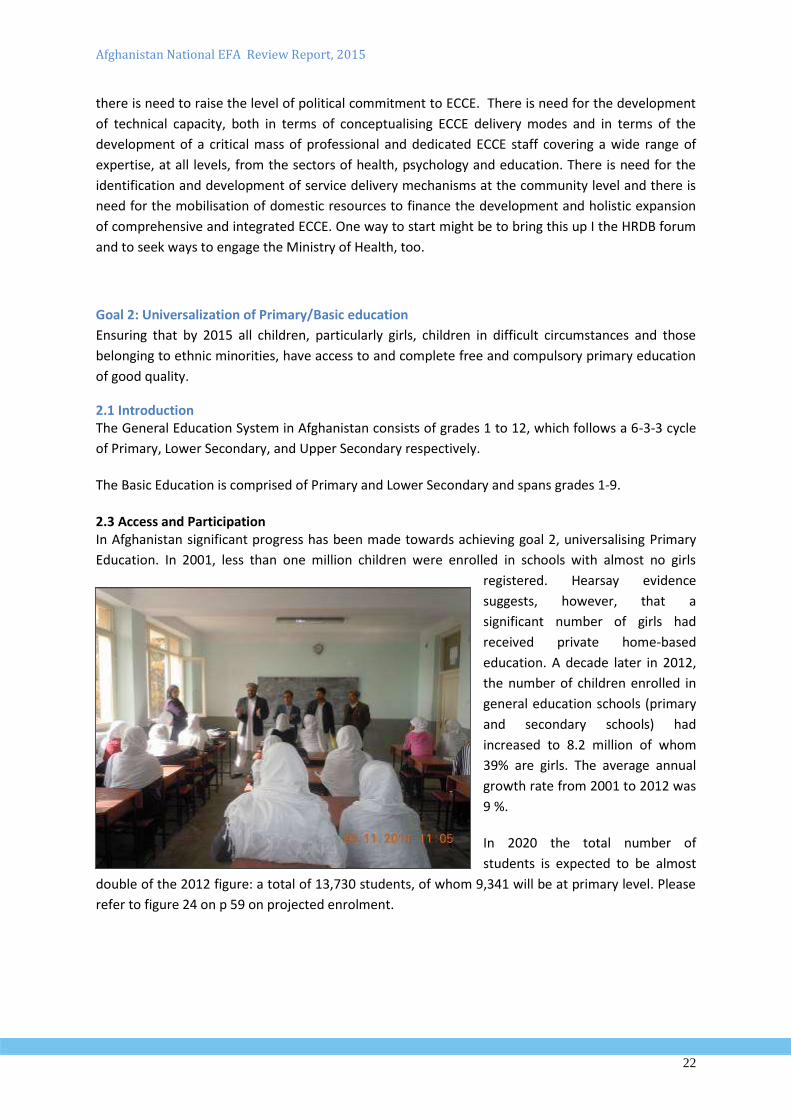
Figure 2 Gross Enrolment
Source: MoE EMIS, 2013
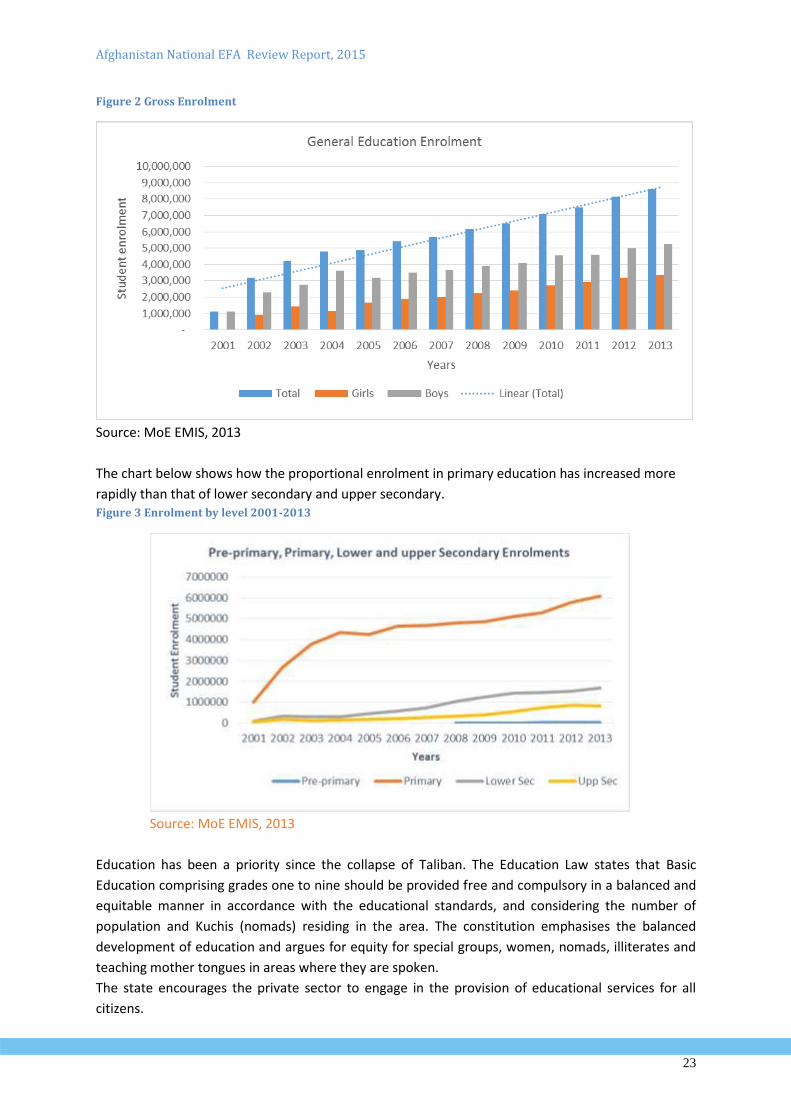
The chart below shows how the proportional enrolment in primary education has increased more
rapidly than that of lower secondary and upper secondary. Figure 3 Enrolment by level 2001-2013
Source: MoE EMIS, 2013
Education has been a priority since the collapse of Taliban. The Education Law states that Basic
Education comprising grades one to nine should be provided free and compulsory in a balanced and
equitable manner in accordance with the educational standards, and considering the number of
population and Kuchis (nomads) residing in the area. The constitution emphasises the balanced
development of education and argues for equity for special groups, women, nomads, illiterates and
teaching mother tongues in areas where they are spoken.
The state encourages the private sector to engage in the provision of educational services for all
citizens.
Afghanistan National EFA Review Report, 2015
24
The Ministry of Education has made significant effort to respond to the educational needs:
1) Between 2001-2013 a large number of schools (14,600) have been established and made
functional. Of these 6100 are primary schools; 2) 187,000 teachers have been recruited from 2001
to 2013 and 131,500 of these (70%) teach at the primary level; 3) new textbooks and teachers’
guides have been developed and distributed; 4) facilities and equipment have been provided to
school including toilets and sanitation facilities, and 5) a policy and guidelines for Community Based
Education (CBE) have been developed to facilitate the provision of education in early grades in
remote rural areas.
In order to decrease the opportunity cost of education, especially in the rural areas and for girls, the
Ministry of Education has provided various social incentives for children with the support from its
development partners. These include the provision of stationary, learning materials, food and
nutrition, and boarding schools. Conditional Cash Transfer (CCT) programmes for girls in rural and
remote areas have also been initiated. In some areas stipends to girl students at secondary level
have been provided on a pilot basis, but presently, MOE does not command the resources to
replicate such schemes on a larger scale.
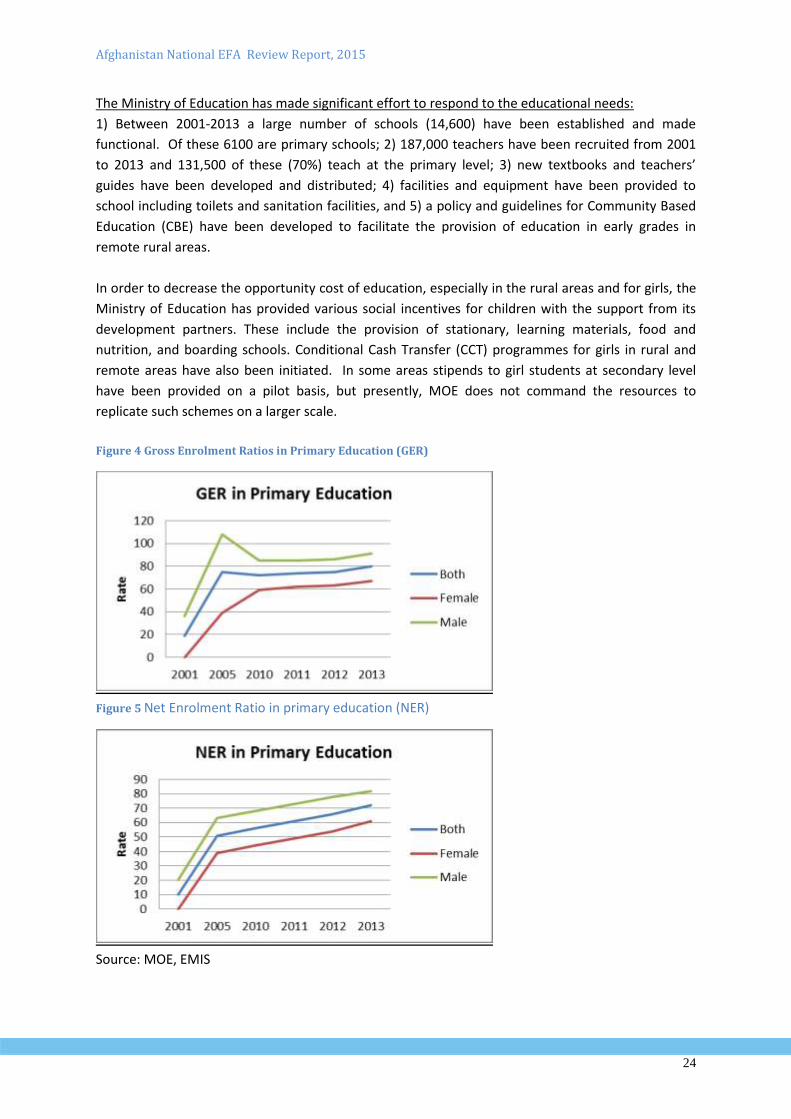
Figure 4 Gross Enrolment Ratios in Primary Education (GER)
Figure 5 Net Enrolment Ratio in primary education (NER)
Source: MOE, EMIS
Afghanistan National EFA Review Report, 2015
25
Access to education has increased significantly over the last three years due to increase in number of
schools, teachers and community-based classes. CBE programmes have shown their potential in
minimizing access problems for children in remote areas and for girls. By definition a community-
based school/class is jointly established by MOE, communities and facilitating NGOs in remote, rural
and sparsely populated areas40. Based on UNDP population projections GER in primary education
went up 6 percentage points in total, from 2011 to 2013, while NER went up 11 percentage points
during this period. While the gap between GER and NER suggests that a number of children enrolled
are either over- age or under-age, this gap has significantly reduced from 13 to 8 percentage points
over two years. Gross intake rate (GIR) in Primary Education has progressed from 88.7% in 2011 to
95% in 2013, while NIR has improved from 58% to 71% during the same period. However, the figures
suggest that a large % of age 7 children were not enrolled in the first grade of primary education in
2013.
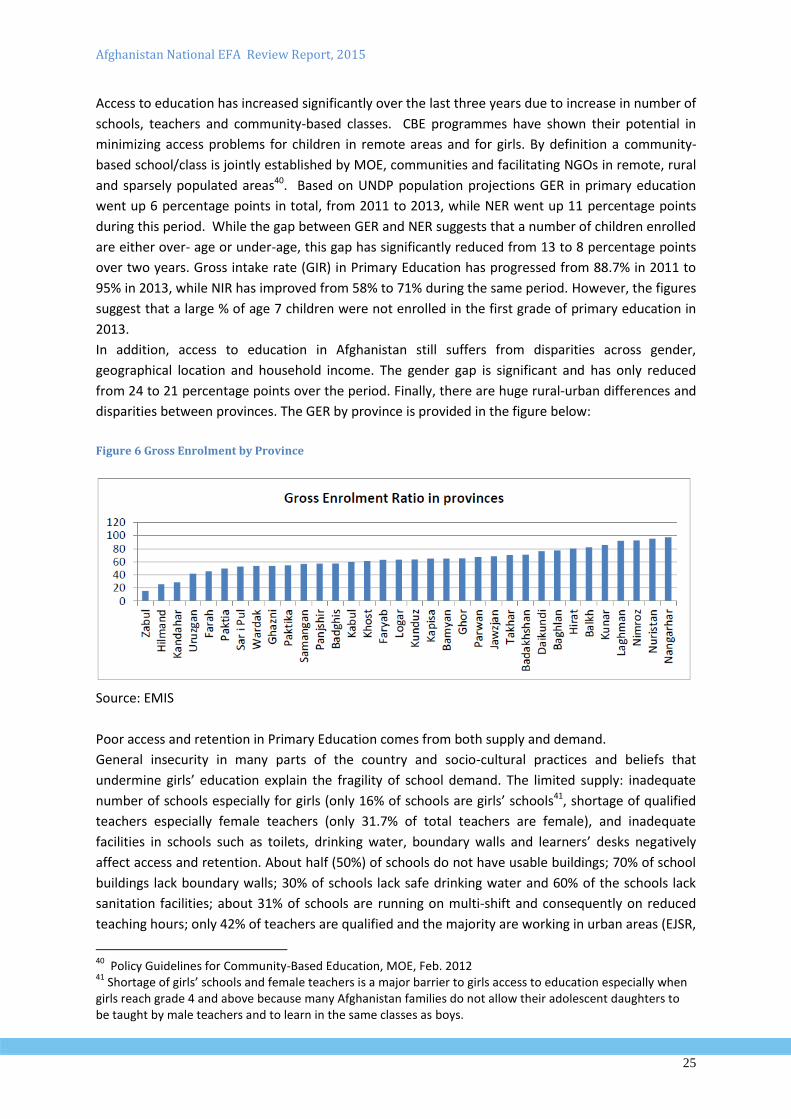
In addition, access to education in Afghanistan still suffers from disparities across gender,
geographical location and household income. The gender gap is significant and has only reduced
from 24 to 21 percentage points over the period. Finally, there are huge rural-urban differences and
disparities between provinces. The GER by province is provided in the figure below:
Figure 6 Gross Enrolment by Province
Source: EMIS
Poor access and retention in Primary Education comes from both supply and demand.
General insecurity in many parts of the country and socio-cultural practices and beliefs that
undermine girls’ education explain the fragility of school demand. The limited supply: inadequate
number of schools especially for girls (only 16% of schools are girls’ schools41, shortage of qualified
teachers especially female teachers (only 31.7% of total teachers are female), and inadequate
facilities in schools such as toilets, drinking water, boundary walls and learners’ desks negatively
affect access and retention. About half (50%) of schools do not have usable buildings; 70% of school
buildings lack boundary walls; 30% of schools lack safe drinking water and 60% of the schools lack
sanitation facilities; about 31% of schools are running on multi-shift and consequently on reduced
teaching hours; only 42% of teachers are qualified and the majority are working in urban areas (EJSR,
40
Policy Guidelines for Community-Based Education, MOE, Feb. 2012 41
Shortage of girls’ schools and female teachers is a major barrier to girls access to education especially when girls reach grade 4 and above because many Afghanistan families do not allow their adolescent daughters to be taught by male teachers and to learn in the same classes as boys.
Afghanistan National EFA Review Report, 2015
26
2012). Insecurity often include attacks on schools resulting in closure of schools for long periods of
time, shortage of schools result in long walking distance to schools, – all these factors negatively
affect enrolment and retention rates and ultimately students’ learning.
2.3 Efficiency The percentage of primary school repeaters in 2013 was 3.9% (4.1% boys 3.7% girls) constituting
220,000 students. As students move to higher grades the percentage of repeaters rises: from 1.5% in
grade 1 to 6.3% in grade 6. Grade four, however, has the highest percentage of repeaters: 7.4%42.
This could be explained by the fact that when students reach grade four they transition from early
grade learning to exposure to science subjects (increase in the number of subjects) and the exams
become the primary means of placing students. Although there is a policy on automatic promotion
in early grades (grade 1 and 2), repeaters are still seen in these grades.
Student repetition in Afghanistan is due to 1) failing in the final exam; 2) low attendance during the
school year, and 3) permanently absent. The percentage of primary school repeaters is calculated on
the basis of exam results; those who fail in the exam are counted as repeaters in the following year.
In the actual situation some students who failed in the exam last year might drop out in the
following year43.
The Promotion Rate in primary grades on average was 88.5% in 2013, almost equal for boys and
girls.
The Dropout Rate in primary education has shown a gradual decrease from 7.5% in 2011, 6.8%in
2012 to 6% in 2013. A number of new initiatives were designed to decrease the dropout rate and/or
bring children who already left the school back to school. They include Conditional Cash Transfer
(CCT) programmes for girls in the rural and remote areas, the relocation of qualified female teachers
to rural areas, where they get more incentives to teach in rural areas.
Students’ dropout rate increases in the upper grades, from 4.9% in grade 1 to 8.4% in grade 6 in
2013, but has decreased on average by 5 percentage points from 2011-2013. Explanations for the
high dropout rate include: 1) the school system is designed so that the permanently absent are kept
at least for 2 years in the records; 2) children at certain ages start working at home or on farms to
contribute to the income generation of the family; 3) due to cultural values/context girls are
supposed to leave school once they learn how to read and write; 4) some schools specific to girls
might not have the necessary facilities (boundary walls, toilets and water), but most importantly 5)
there is a severe shortage of qualified teachers outside the major cities, and female teachers are
critical to girls’ access to education, in particular beyond grade 4.
The internal efficiency of the system is low. The survival rate to the last grade (grade 6) of primary
education was 58% (60% boys/ 54% girls) in 2013 suggesting that 4 out of 10 students who enrol in
grade 1 do not reach grade 6 of primary education. The assumption is that if students do not reach
the last grade of primary section, they do not learn proper reading, writing and mathematics, and
over the years the level of their understanding and literacy decreases. The quality of education in
most cases is examined by conducting learning assessment tests; in the absence of such a system the
survival rate could be used as a proxy indicator to assess the quality of education, which is low in
42
EMIS 43
Currently, the EMIS system does not capture this variation.
Afghanistan National EFA Review Report, 2015
27
view of this indicator if compared to the 85% average survival rate to the last grade at the global
level44.
The overall completion rate for grade 6 differed ranging from 66% in 2009 to 63% % in 2013 (74%
boys / 52% girls), and at the same time it showed a variation of 22-36 percentage points in disfavour
of girls’ completion The decrease is due stricter examination policies. It is government policy that
examinations should identify high performing and low performing students after grade 3.
Significant progress has been made in the proportion of students that transit to secondary
education. The Effective Transition Rate (ETR) from primary to general secondary education has
improved from 81% in 2009 to 91% in 2013. There are gender disparities in ETR with almost 10 %
points in favour of boys. In addition, there has been a bigger growth in the transition rate for boys
compared to that of girls. For instance, the transition rates were almost equal for boys and girls in
2009 but by 2010, the transition rate for boys increased by 12 % point to 93% while the increase for
girls during the same year was only 4 % point (from 80% to 84%).
The ETR shows the capacity of accommodating students who transit from one level of education to
another. Currently, around 9% of the primary graduates do not join the lower Secondary Education.
Inadequate number of lower secondary schools, especially for girls, long distance to school and lack
of teachers particularly female are basic challenges preventing some students from enrolling in
grade 7.
Pupil/Teacher Ratio in primary
The MoE planning norms for pupil/ teacher ratio (PTR) in primary education is 40:1, while actual PTR
in 2013 was 45:1. It is difficult in the current set up of the education system to identify the exact
number of teachers who teach at primary level. Therefore, PTR for the primary level is estimation.
MoE has tried to decrease the PTR at primary level by recruiting and deploying new teachers but the
ratio has not improved because the number of pupils rises rapidly and it has been difficult to
mobilize resources from Ministry of Finance to meet the need for teachers. It is estimated that the
overall pupil-teacher ratio will rise to over 1:50, far above the national target of 1:35.
The PTR for the General Education (primary, lower secondary and upper secondary) is 44.6. The PTR
shows significant variation between the provinces: from less than 1:35 to more than 1:51. One
possible explanation for a high PTR could be increased demand in some provinces, which could not
be met by a corresponding supply. In particular the lack of female teachers in rural areas is believed
to contribute to the imbalance.
The total number of schools in the general education was 14,600 in 2013. Around 6056 ( 41%) are
primary specific schools, while 3,918 (27%) are lower secondary schools which also has primary
grades (1-6), and 4625 (32%) schools are upper secondary which has both primary and lower
secondary (7-9) grades.
Qualification level of teachers in primary education
Only 43% of teachers have the required minimum qualification (grade 14 and above) to teach at all
levels of general education. The number of primary teachers grew from 110,000 in 2007 to 131,500
44
UNESCO Institute for Statistics, Data Centre, January 2008.
Afghanistan National EFA Review Report, 2015
28
in 2013. The number of female primary teachers is 8,527 constituting 17.4% % of all primary
education teachers (48,921).
Out of the total of 187,000 teachers in the General Education more than 130,000 teachers, 70 %
have received the three sets of short-term training (INSET-I, II and III) over the past years. From the
total trained teachers 82,000 are male and 48,000 are female.
These trainings are designed to improve the pedagogical skills of the general education teachers more specifically pedagogical skills, content knowledge, general education requirements and administrative/management skills. INSET-I is introduction to the general pedagogy in which the teachers are exposed to the new skills in teaching methods and INSET-II and III are subject matter contents.
Primary schools offering instruction in mother tongue
The Afghanistan Constitution states that schools should be teaching in mother tongue in areas
where they are spoken. Currently, Pashto and Dari are the only language of instruction options,
which are offered at almost 100% of schools based on need and demand. Textbooks are prepared in
the two national official languages (Pashto and Dari) and schools are established in villages based on
the language spoken. Teachers are also deployed to schools based on the language of instruction. In
addition, language textbooks and teacher’s guidebooks were prepared in 2010 and in 2013 for
Afghanistan’s 8 officially recognised third (local) languages, Uzbeki, Nuristani, Pashai, Baluchi,
Turkmeni, Sheghnani, Gojari, and Wakhani for linguistic minority children in grades 1-945.
Duration of travel and distance between home and school
The official Ministry of Education policy states that primary schools can be established at a distance
of 3 km from the village/home of the children, and lower and upper secondary will be established
within an 8 km distance. Fortunately, schools are often within a distance of less than one or two km
from the village. The problems are with inaccessible areas and harsh climate conditions such as
mountains, rivers, hills, uneven areas, snow affected areas and floods. While there is no systematic
data available on the distance or duration of travel between home and school it is generally
acknowledged that some villages are much farther from school than what is the norm.
2.4 Remaining Gaps, Issues and Challenges Out of school children: About 3.3 million school-age children are estimated to be out of school. The
majority of these children are girls, children in remote and insecure areas, disabled children, Kuchi
nomad children, and other vulnerable groups. School attendance among Kuchi children has been
lower even than for other minority groups - 6.6 percent for boys and 1.8 percent for girls. Over 90
percent of Kuchi children did not go to school in 2005. 46 While reaching these marginalized children
remains one of the most important challenges for the MoE and no specific strategies have so far
been completed to address them.
Dropout: The MoE estimates that around 400,000 students drop out each year, which on average
constitute a dropout rate from 5% to 7%. Lack of schools for higher grades, particularly for girls,
poverty and, therefore, sending children to work, girls’ marriage before completing school, shortage
of female teachers, lack of girls’ schools and long distance from home, lack of necessary facilities in
45
Currently, EMIS does not capture which schools teach in local languages. 46
National Multi-sectorial Assessment on Kuchis in 2005. Cit. from IRIN, Feb 2010: “AFGHANISTAN: Mixed
report on Kuchi education”.
Afghanistan National EFA Review Report, 2015
29
schools such as building, surrounding wall, drinking water, and sanitation, and cultural beliefs about
the importance of girls’ education are reasons for high dropout rate (EJSR 2012).
Educational Statistics: While there has been improvement in data availability on important
education indicators such as enrolment ratios, dropout, primary completion, and literacy rates, the
accuracy of collected data is still questionable, and data are not available on time47.
Shortage of Qualified Female teachers, particularly in rural areas: There are no female teachers in
almost 80 districts (out of 364 districts), and there are no qualified female teachers in the majority of
districts, especially for secondary grades, which is a key reason for girls’ dropouts. The reasons
behind the low number of female teachers outside the major cities originate in the patriarchal social
norms restricting the movement of adolescent and adult females in the Afghan society. Attempts at
increasing supply of female teachers through incentives to female students at TTCs and stimulating
demand at school level by working with shuras (school committees) are yet to yield results in terms
of increased employment of female teachers at rural school level.
Low Quality of Education: Evidence shows that the quality of education is low in Afghan schools.
Teachers do not receive proper on-the-job support; more than half of teachers do not have required
qualifications; many qualified teachers teach subjects, they are not qualified for; many children do
not have access to complete sets of textbooks; teaching hours are short in many schools, and school
administrators are not able to provide strong instructional leadership.
Inappropriate Educational Environment: Approximately 50% of schools do not have usable
buildings; 70% of school buildings lack surrounding walls, 30% of schools lack drinking waters 60%
lack sanitation facilities, and 88% lack electricity. In addition, many schools in big cities are very
crowded.
Low Internal Efficiency: Only 6 out of 10 students who start in grade one reach at grade 6 and of
those who do, only 63 % pass their exams, 91% of whom transit to secondary level. Improved pre-
and in-service training of teachers are some of the measures that MOE has adopted to address the
low internal efficiency. In addition, MOE has recently initiated a pilot on learning assessment, which
is hoped to inform future policy development.
Goal 3: Meeting the learning needs of youths and adults Ensuring that the learning needs of all young people and adults are met through equitable access to appropriate learning and life-skills programmes.
3.1 Introduction:
In Afghanistan, where opportunities for Basic Education have not been and are not yet available to
all, it is important to see literacy for youth and adults as a fulfilment of the right to education.
Chapter Ten of the Education Law (MoE 2008b) calls for the provision of ‘literacy and basic practical
education’ for the ‘illiterate and less literate’ with a view to acquiring vocational skills and as a
preparation for continuing education.
As far as meeting the learning needs of youths and adults, the national development strategy ANDS
stipulates four main components of its Joint National Youth Programme: 1) Strengthening the
47
A 2010 study on EMIS in Helmand showed that reliable data seems to be available at school level, where the headmaster meticulously keeps records. Problems occur in the transmission process, however, when school level data are being entered from paper to electronic form, and aggregated and compiled at district and provincial levels by personnel with little or no training in data management. An MOE process of decentralising data collection is under way.
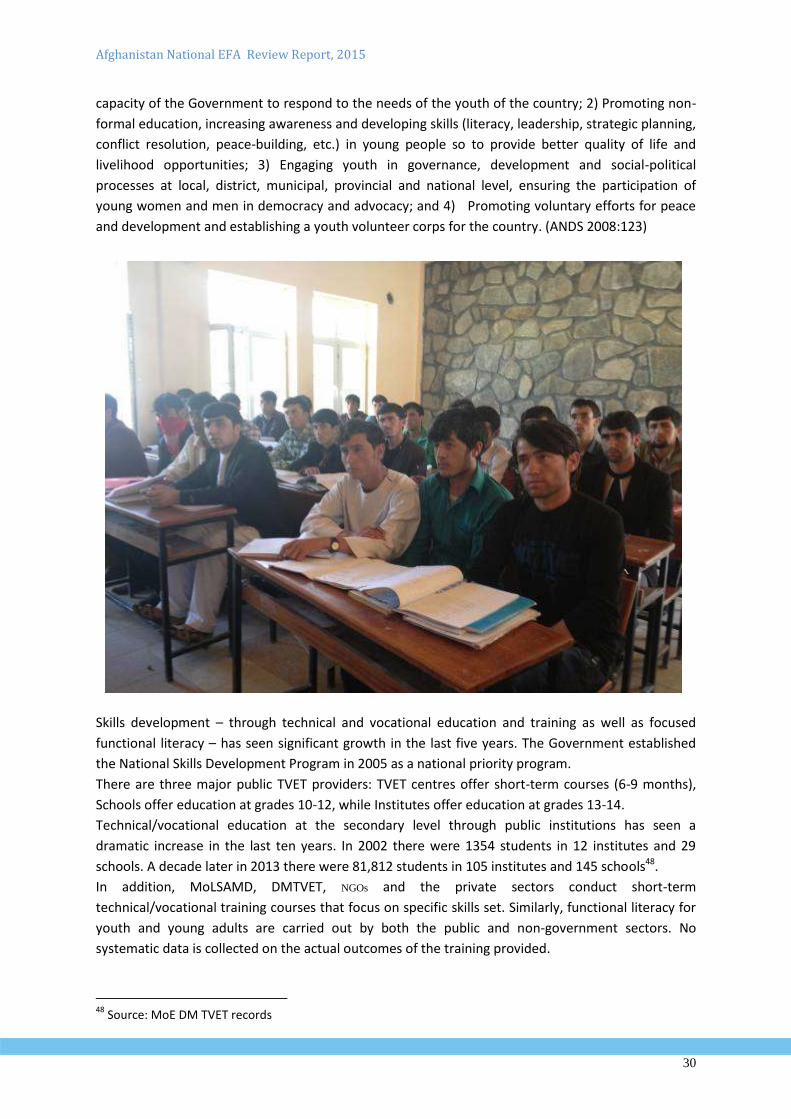
Afghanistan National EFA Review Report, 2015
30
capacity of the Government to respond to the needs of the youth of the country; 2) Promoting non-
formal education, increasing awareness and developing skills (literacy, leadership, strategic planning,
conflict resolution, peace-building, etc.) in young people so to provide better quality of life and
livelihood opportunities; 3) Engaging youth in governance, development and social-political
processes at local, district, municipal, provincial and national level, ensuring the participation of
young women and men in democracy and advocacy; and 4) Promoting voluntary efforts for peace
and development and establishing a youth volunteer corps for the country. (ANDS 2008:123)
Skills development – through technical and vocational education and training as well as focused
functional literacy – has seen significant growth in the last five years. The Government established
the National Skills Development Program in 2005 as a national priority program.
There are three major public TVET providers: TVET centres offer short-term courses (6-9 months),
Schools offer education at grades 10-12, while Institutes offer education at grades 13-14.
Technical/vocational education at the secondary level through public institutions has seen a
dramatic increase in the last ten years. In 2002 there were 1354 students in 12 institutes and 29
schools. A decade later in 2013 there were 81,812 students in 105 institutes and 145 schools48.
In addition, MoLSAMD, DMTVET, NGOs and the private sectors conduct short-term
technical/vocational training courses that focus on specific skills set. Similarly, functional literacy for
youth and young adults are carried out by both the public and non-government sectors. No
systematic data is collected on the actual outcomes of the training provided.
48
Source: MoE DM TVET records
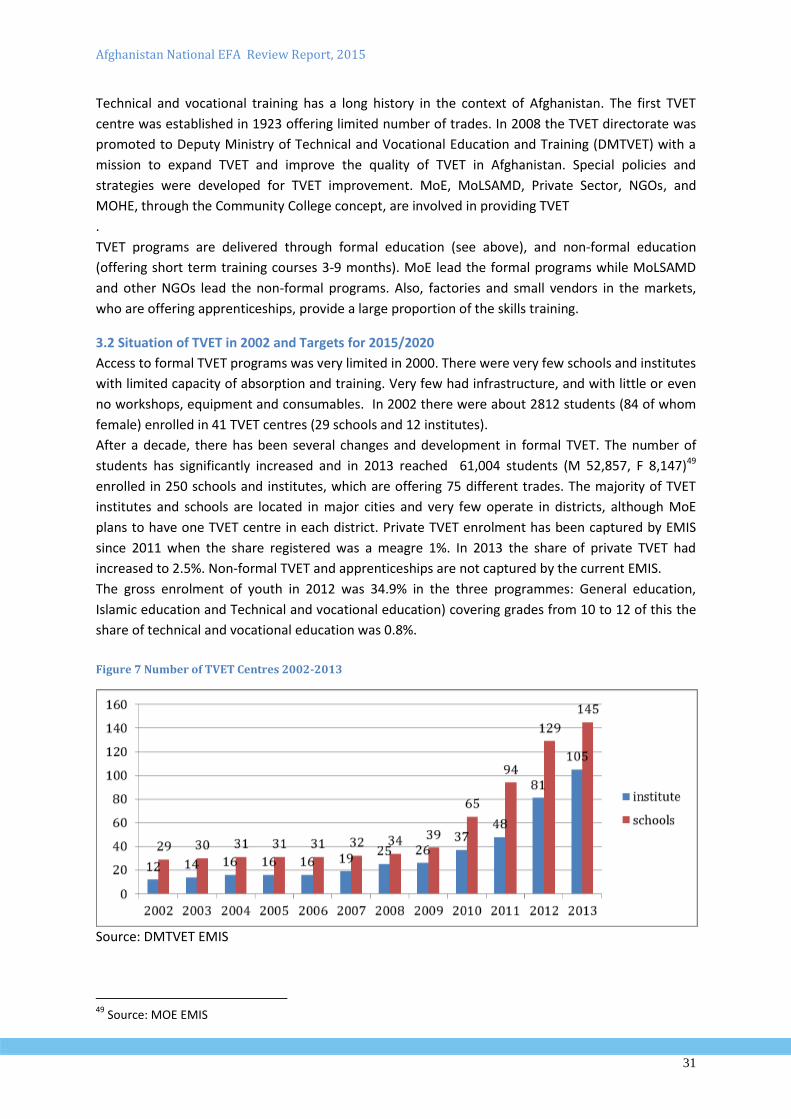
Afghanistan National EFA Review Report, 2015
31
Technical and vocational training has a long history in the context of Afghanistan. The first TVET
centre was established in 1923 offering limited number of trades. In 2008 the TVET directorate was
promoted to Deputy Ministry of Technical and Vocational Education and Training (DMTVET) with a
mission to expand TVET and improve the quality of TVET in Afghanistan. Special policies and
strategies were developed for TVET improvement. MoE, MoLSAMD, Private Sector, NGOs, and
MOHE, through the Community College concept, are involved in providing TVET
.
TVET programs are delivered through formal education (see above), and non-formal education
(offering short term training courses 3-9 months). MoE lead the formal programs while MoLSAMD
and other NGOs lead the non-formal programs. Also, factories and small vendors in the markets,
who are offering apprenticeships, provide a large proportion of the skills training.
3.2 Situation of TVET in 2002 and Targets for 2015/2020
Access to formal TVET programs was very limited in 2000. There were very few schools and institutes
with limited capacity of absorption and training. Very few had infrastructure, and with little or even
no workshops, equipment and consumables. In 2002 there were about 2812 students (84 of whom
female) enrolled in 41 TVET centres (29 schools and 12 institutes).
After a decade, there has been several changes and development in formal TVET. The number of
students has significantly increased and in 2013 reached 61,004 students (M 52,857, F 8,147)49
enrolled in 250 schools and institutes, which are offering 75 different trades. The majority of TVET
institutes and schools are located in major cities and very few operate in districts, although MoE
plans to have one TVET centre in each district. Private TVET enrolment has been captured by EMIS
since 2011 when the share registered was a meagre 1%. In 2013 the share of private TVET had
increased to 2.5%. Non-formal TVET and apprenticeships are not captured by the current EMIS.
The gross enrolment of youth in 2012 was 34.9% in the three programmes: General education,
Islamic education and Technical and vocational education) covering grades from 10 to 12 of this the
share of technical and vocational education was 0.8%.
Figure 7 Number of TVET Centres 2002-2013
Source: DMTVET EMIS
49
Source: MOE EMIS
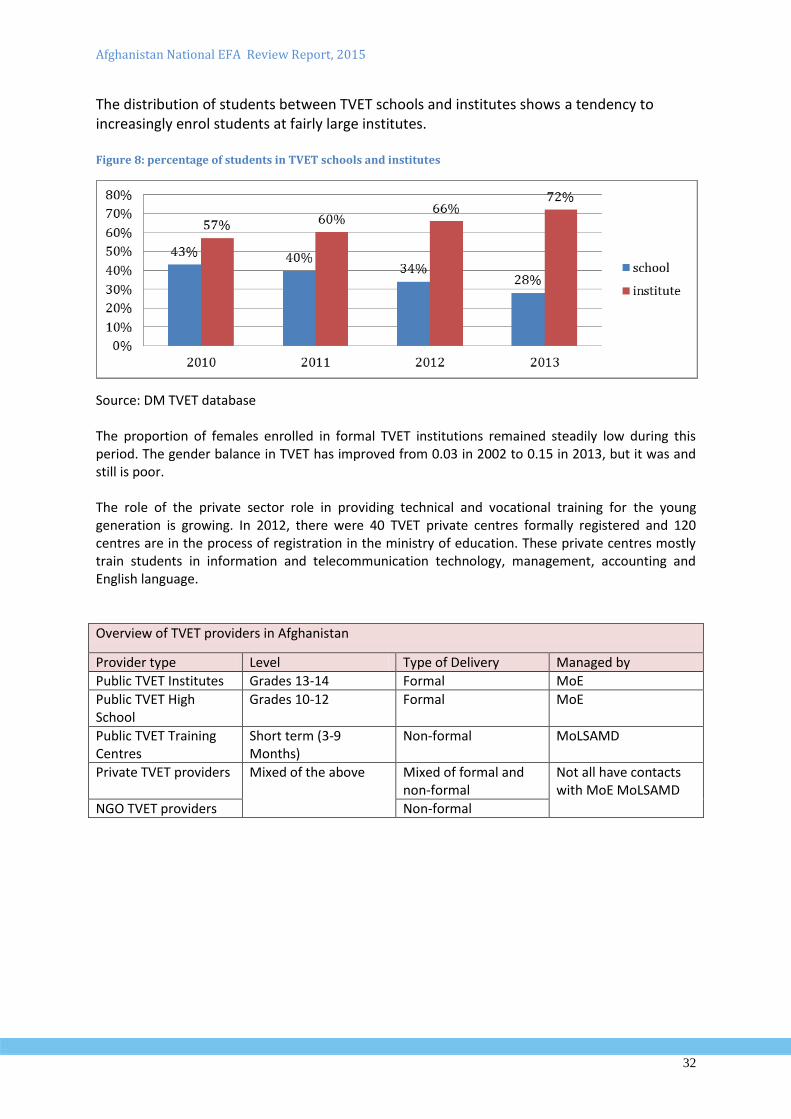
Afghanistan National EFA Review Report, 2015
32
The distribution of students between TVET schools and institutes shows a tendency to increasingly enrol students at fairly large institutes. Figure 8: percentage of students in TVET schools and institutes
Source: DM TVET database The proportion of females enrolled in formal TVET institutions remained steadily low during this period. The gender balance in TVET has improved from 0.03 in 2002 to 0.15 in 2013, but it was and still is poor. The role of the private sector role in providing technical and vocational training for the young generation is growing. In 2012, there were 40 TVET private centres formally registered and 120 centres are in the process of registration in the ministry of education. These private centres mostly train students in information and telecommunication technology, management, accounting and English language.
Overview of TVET providers in Afghanistan
Provider type Level Type of Delivery Managed by
Public TVET Institutes Grades 13-14 Formal MoE
Public TVET High School
Grades 10-12 Formal MoE
Public TVET Training Centres
Short term (3-9 Months)
Non-formal MoLSAMD
Private TVET providers Mixed of the above Mixed of formal and non-formal
Not all have contacts with MoE MoLSAMD
NGO TVET providers Non-formal
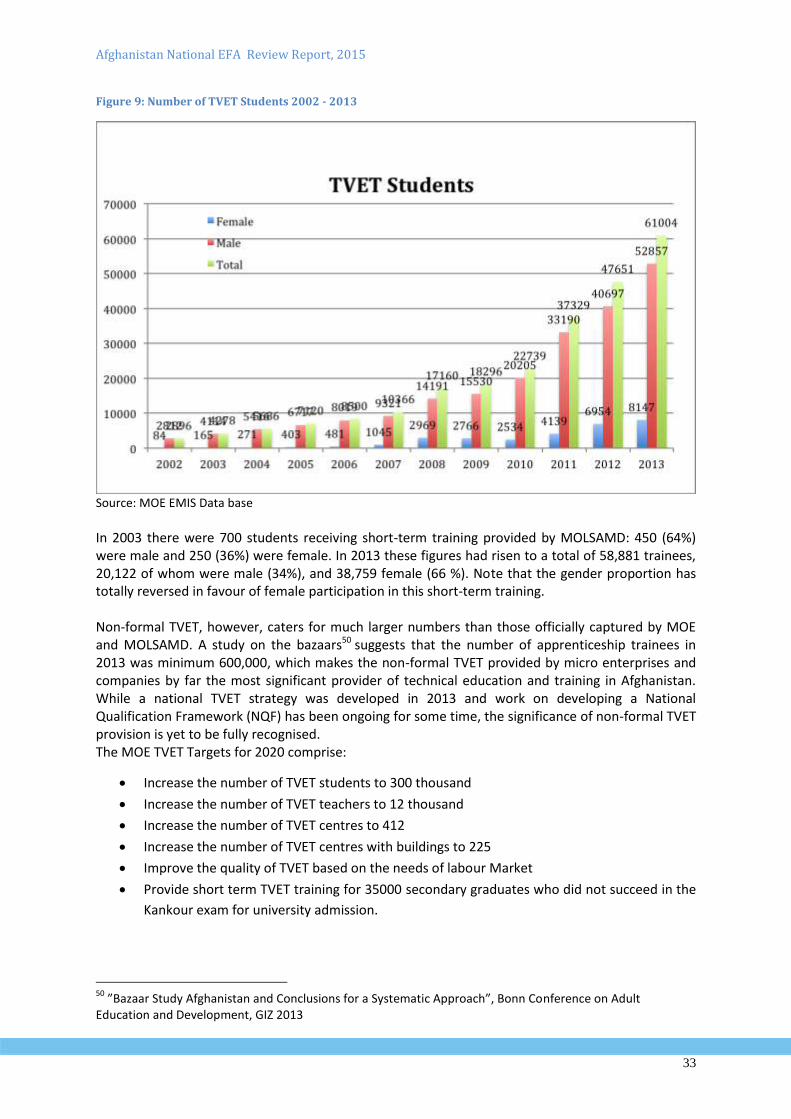
Afghanistan National EFA Review Report, 2015
33
Figure 9: Number of TVET Students 2002 - 2013
Source: MOE EMIS Data base
In 2003 there were 700 students receiving short-term training provided by MOLSAMD: 450 (64%) were male and 250 (36%) were female. In 2013 these figures had risen to a total of 58,881 trainees, 20,122 of whom were male (34%), and 38,759 female (66 %). Note that the gender proportion has totally reversed in favour of female participation in this short-term training. Non-formal TVET, however, caters for much larger numbers than those officially captured by MOE and MOLSAMD. A study on the bazaars50 suggests that the number of apprenticeship trainees in 2013 was minimum 600,000, which makes the non-formal TVET provided by micro enterprises and companies by far the most significant provider of technical education and training in Afghanistan. While a national TVET strategy was developed in 2013 and work on developing a National Qualification Framework (NQF) has been ongoing for some time, the significance of non-formal TVET provision is yet to be fully recognised. The MOE TVET Targets for 2020 comprise:
Increase the number of TVET students to 300 thousand
Increase the number of TVET teachers to 12 thousand
Increase the number of TVET centres to 412
Increase the number of TVET centres with buildings to 225
Improve the quality of TVET based on the needs of labour Market
Provide short term TVET training for 35000 secondary graduates who did not succeed in the
Kankour exam for university admission.
50
”Bazaar Study Afghanistan and Conclusions for a Systematic Approach”, Bonn Conference on Adult Education and Development, GIZ 2013
Afghanistan National EFA Review Report, 2015
34
3.3 Strategies to increase enrolment
The TVET system will encourage a more dynamic development of TVET through outcome-based organisation, access to occupational assessment leading to recognized qualifications, integration of formal, non-formal and informal TVET. Apprenticeship training provided at enterprises is where the bulk of training takes place within the TVET system. Experience suggests that it leads to better training outcomes, practical skills, work attitudes and increased employment of graduates. Increased attention will be paid to training for self-employment and entrepreneurship skills51. Currently, most TVET schools and institutes are male dominated and female participation is lower due to low parental awareness about TVET and factors such as cultural, economic, security, and few female teachers further compound it. The TVET system will promote gender equality in access to TVET opportunities. TVET institutions will develop proactive gender policies in order to promote opportunities for girls and women in TVET. Strategies will include specific outreach and awareness raising about TVET opportunities to females and their families, the provision of female-only dormitories and inclusive education practices. Quality of TVET So far quality assurance has been pursued through a number of supply-side intervention areas: the development of qualified teachers competent both in subject matter and methodology, relevant and market driven curriculum, a conducive environment, as well as the provision of well equipped workshops, dorms and labs. In the future, more emphasis will be paid to the outcomes of TVET.. The national TVET system will be organized as an outcome based system. Upon completion of TVET programmes, learners’ competencies will be measured through occupational assessment, which is to be based on national occupational standard skills (NOSS). The latter are yet to be fully developed, but a process is on going under the National Skills Development Programme (NSDP). The outcomes and NOS skills will be specified in the national qualification framework (NQF), which will fall under the future authority of the Afghanistan National Qualification Authority (ANQA). TVET Teachers The total number teachers in DMTVET reached to 2706 by the end of 2013 out of which 20% are female. In order to address quality, short-term capacity building training programs have been organized for 922 teachers (184 female) in 2013. 25 teachers were sent abroad for Master degree and 103 teachers sent to in-country private universities for Bachelor degrees.
51
Afghanistan National Strategy for Technical and Vocational Education and Training (TVET), MOE/MOLSAMD, 2014
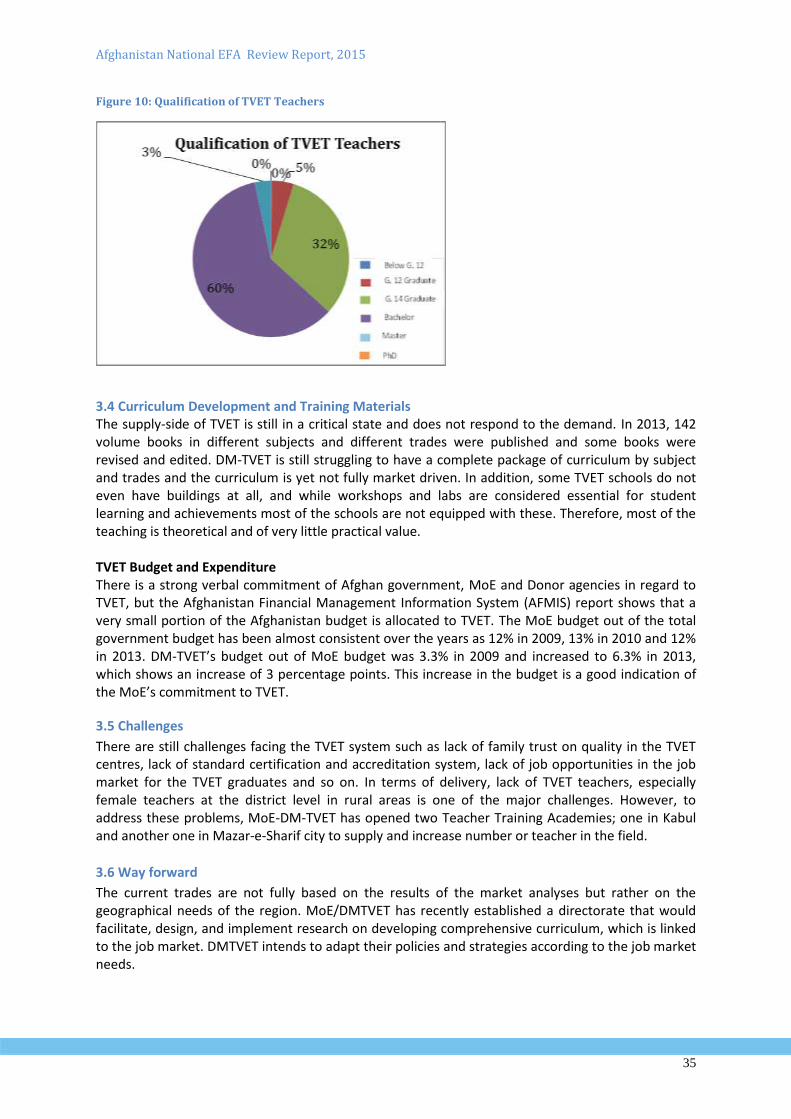
Afghanistan National EFA Review Report, 2015
35
Figure 10: Qualification of TVET Teachers
3.4 Curriculum Development and Training Materials The supply-side of TVET is still in a critical state and does not respond to the demand. In 2013, 142 volume books in different subjects and different trades were published and some books were revised and edited. DM-TVET is still struggling to have a complete package of curriculum by subject and trades and the curriculum is yet not fully market driven. In addition, some TVET schools do not even have buildings at all, and while workshops and labs are considered essential for student learning and achievements most of the schools are not equipped with these. Therefore, most of the teaching is theoretical and of very little practical value. TVET Budget and Expenditure There is a strong verbal commitment of Afghan government, MoE and Donor agencies in regard to TVET, but the Afghanistan Financial Management Information System (AFMIS) report shows that a very small portion of the Afghanistan budget is allocated to TVET. The MoE budget out of the total government budget has been almost consistent over the years as 12% in 2009, 13% in 2010 and 12% in 2013. DM-TVET’s budget out of MoE budget was 3.3% in 2009 and increased to 6.3% in 2013, which shows an increase of 3 percentage points. This increase in the budget is a good indication of the MoE’s commitment to TVET.
3.5 Challenges
There are still challenges facing the TVET system such as lack of family trust on quality in the TVET centres, lack of standard certification and accreditation system, lack of job opportunities in the job market for the TVET graduates and so on. In terms of delivery, lack of TVET teachers, especially female teachers at the district level in rural areas is one of the major challenges. However, to address these problems, MoE-DM-TVET has opened two Teacher Training Academies; one in Kabul and another one in Mazar-e-Sharif city to supply and increase number or teacher in the field.
3.6 Way forward
The current trades are not fully based on the results of the market analyses but rather on the geographical needs of the region. MoE/DMTVET has recently established a directorate that would facilitate, design, and implement research on developing comprehensive curriculum, which is linked to the job market. DMTVET intends to adapt their policies and strategies according to the job market needs.
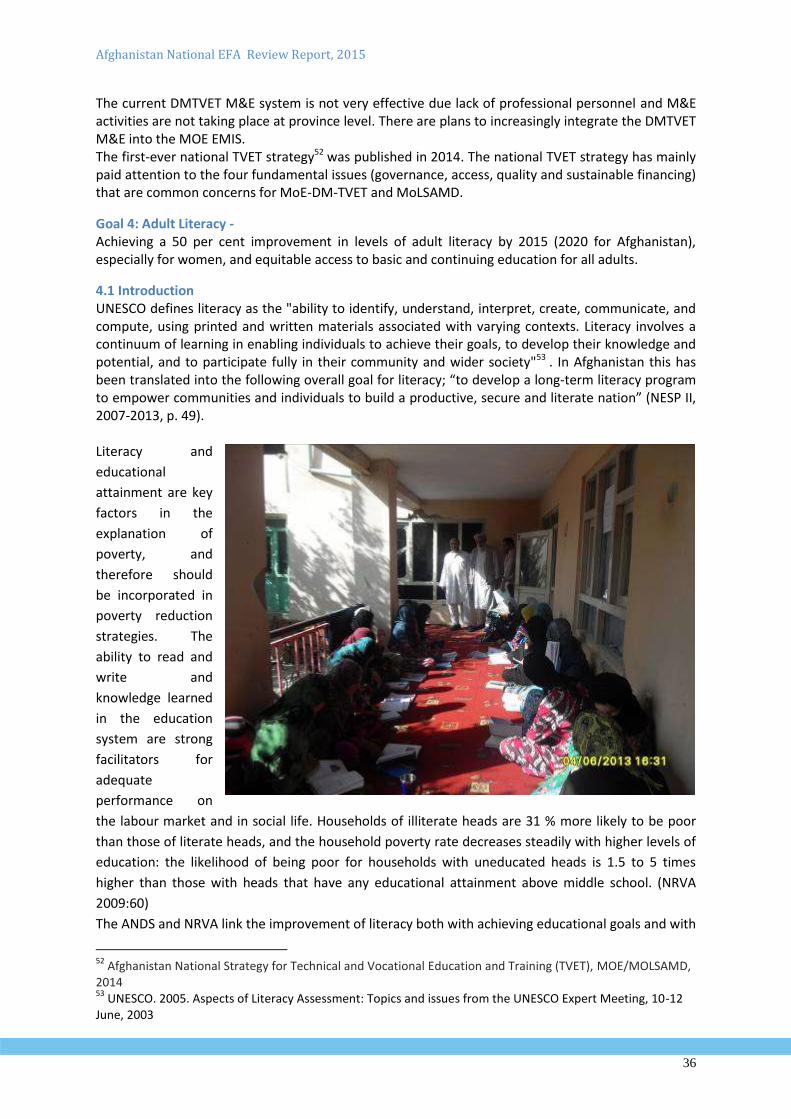
Afghanistan National EFA Review Report, 2015
36
The current DMTVET M&E system is not very effective due lack of professional personnel and M&E activities are not taking place at province level. There are plans to increasingly integrate the DMTVET M&E into the MOE EMIS. The first-ever national TVET strategy52 was published in 2014. The national TVET strategy has mainly paid attention to the four fundamental issues (governance, access, quality and sustainable financing) that are common concerns for MoE-DM-TVET and MoLSAMD.
Goal 4: Adult Literacy - Achieving a 50 per cent improvement in levels of adult literacy by 2015 (2020 for Afghanistan), especially for women, and equitable access to basic and continuing education for all adults.
4.1 Introduction UNESCO defines literacy as the "ability to identify, understand, interpret, create, communicate, and compute, using printed and written materials associated with varying contexts. Literacy involves a continuum of learning in enabling individuals to achieve their goals, to develop their knowledge and potential, and to participate fully in their community and wider society"53 . In Afghanistan this has been translated into the following overall goal for literacy; “to develop a long-term literacy program to empower communities and individuals to build a productive, secure and literate nation” (NESP II, 2007-2013, p. 49). Literacy and
educational
attainment are key
factors in the
explanation of
poverty, and
therefore should
be incorporated in
poverty reduction
strategies. The
ability to read and
write and
knowledge learned
in the education
system are strong
facilitators for
adequate
performance on
the labour market and in social life. Households of illiterate heads are 31 % more likely to be poor
than those of literate heads, and the household poverty rate decreases steadily with higher levels of
education: the likelihood of being poor for households with uneducated heads is 1.5 to 5 times
higher than those with heads that have any educational attainment above middle school. (NRVA
2009:60)
The ANDS and NRVA link the improvement of literacy both with achieving educational goals and with
52
Afghanistan National Strategy for Technical and Vocational Education and Training (TVET), MOE/MOLSAMD, 2014 53
UNESCO. 2005. Aspects of Literacy Assessment: Topics and issues from the UNESCO Expert Meeting, 10-12 June, 2003
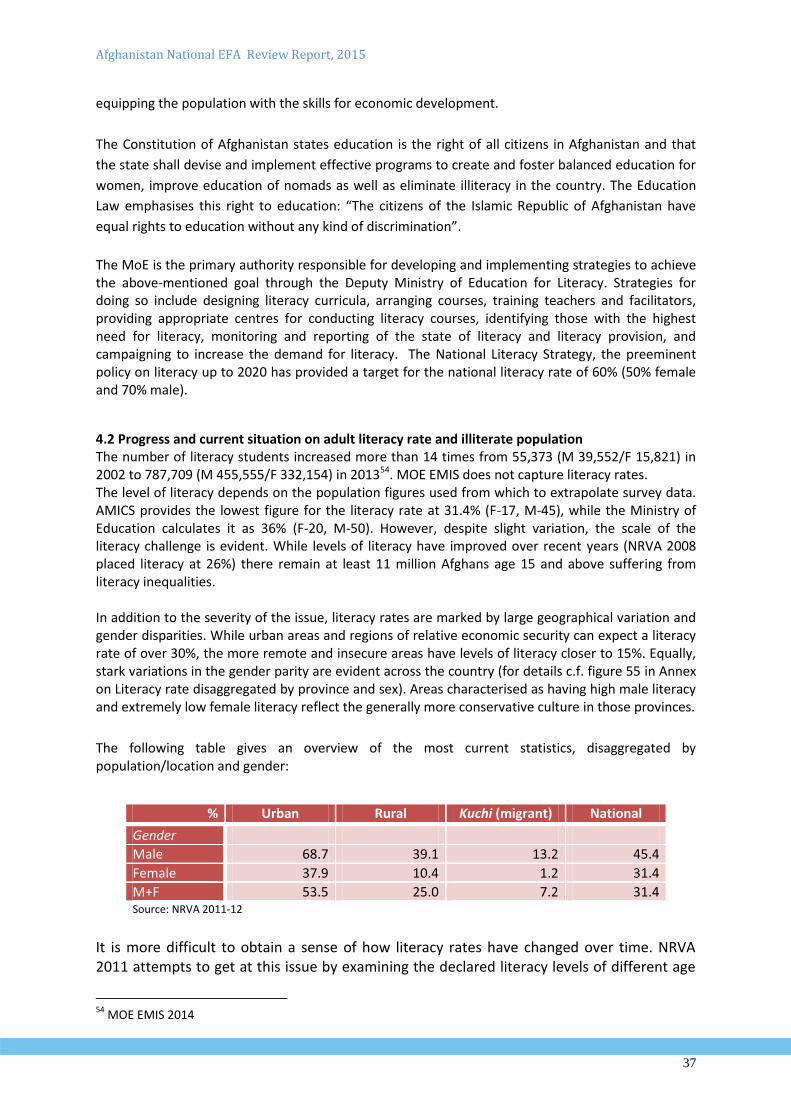
Afghanistan National EFA Review Report, 2015
37
equipping the population with the skills for economic development.
The Constitution of Afghanistan states education is the right of all citizens in Afghanistan and that
the state shall devise and implement effective programs to create and foster balanced education for
women, improve education of nomads as well as eliminate illiteracy in the country. The Education
Law emphasises this right to education: “The citizens of the Islamic Republic of Afghanistan have
equal rights to education without any kind of discrimination”.
The MoE is the primary authority responsible for developing and implementing strategies to achieve the above-mentioned goal through the Deputy Ministry of Education for Literacy. Strategies for doing so include designing literacy curricula, arranging courses, training teachers and facilitators, providing appropriate centres for conducting literacy courses, identifying those with the highest need for literacy, monitoring and reporting of the state of literacy and literacy provision, and campaigning to increase the demand for literacy. The National Literacy Strategy, the preeminent policy on literacy up to 2020 has provided a target for the national literacy rate of 60% (50% female and 70% male).
4.2 Progress and current situation on adult literacy rate and illiterate population The number of literacy students increased more than 14 times from 55,373 (M 39,552/F 15,821) in 2002 to 787,709 (M 455,555/F 332,154) in 201354. MOE EMIS does not capture literacy rates. The level of literacy depends on the population figures used from which to extrapolate survey data. AMICS provides the lowest figure for the literacy rate at 31.4% (F-17, M-45), while the Ministry of Education calculates it as 36% (F-20, M-50). However, despite slight variation, the scale of the literacy challenge is evident. While levels of literacy have improved over recent years (NRVA 2008 placed literacy at 26%) there remain at least 11 million Afghans age 15 and above suffering from literacy inequalities. In addition to the severity of the issue, literacy rates are marked by large geographical variation and gender disparities. While urban areas and regions of relative economic security can expect a literacy rate of over 30%, the more remote and insecure areas have levels of literacy closer to 15%. Equally, stark variations in the gender parity are evident across the country (for details c.f. figure 55 in Annex on Literacy rate disaggregated by province and sex). Areas characterised as having high male literacy and extremely low female literacy reflect the generally more conservative culture in those provinces.
The following table gives an overview of the most current statistics, disaggregated by population/location and gender:
% Urban Rural Kuchi (migrant) National
Gender
Male 68.7 39.1 13.2 45.4
Female 37.9 10.4 1.2 31.4
M+F 53.5 25.0 7.2 31.4 Source: NRVA 2011-12
It is more difficult to obtain a sense of how literacy rates have changed over time. NRVA 2011 attempts to get at this issue by examining the declared literacy levels of different age
54
MOE EMIS 2014
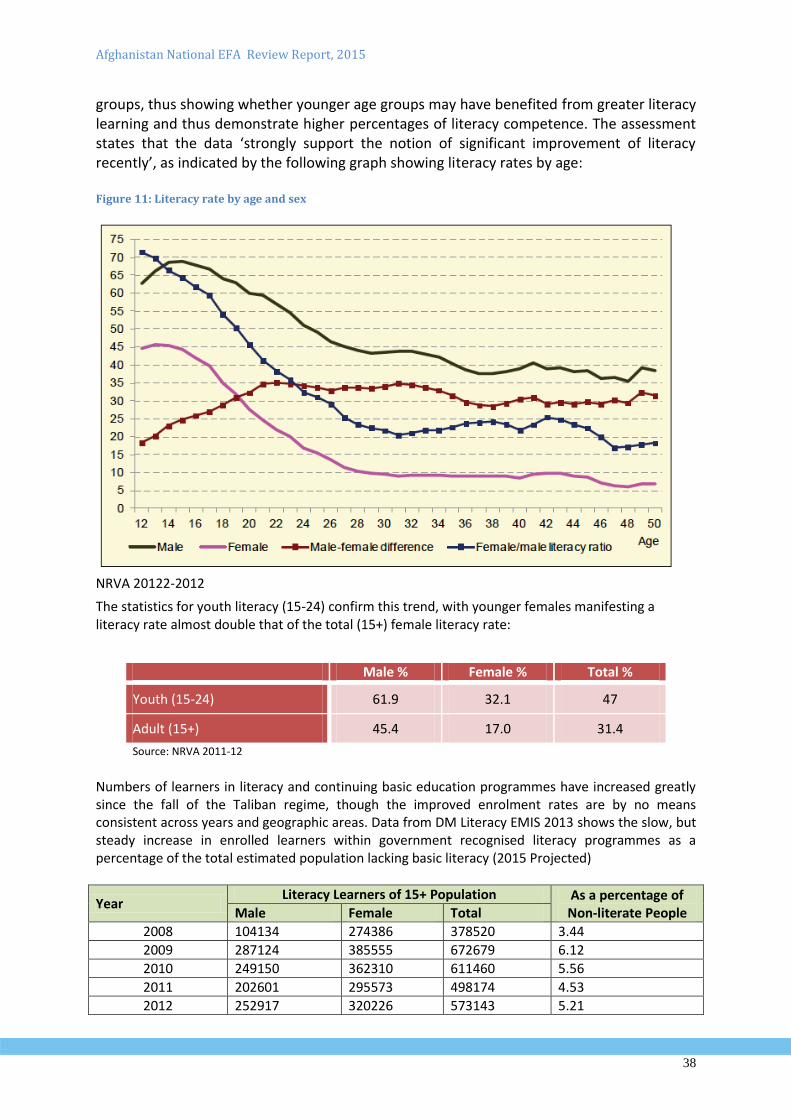
Afghanistan National EFA Review Report, 2015
38
groups, thus showing whether younger age groups may have benefited from greater literacy learning and thus demonstrate higher percentages of literacy competence. The assessment states that the data ‘strongly support the notion of significant improvement of literacy recently’, as indicated by the following graph showing literacy rates by age: Figure 11: Literacy rate by age and sex
NRVA 20122-2012
The statistics for youth literacy (15-24) confirm this trend, with younger females manifesting a literacy rate almost double that of the total (15+) female literacy rate:
Male % Female % Total %
Youth (15-24) 61.9 32.1 47
Adult (15+) 45.4 17.0 31.4
Source: NRVA 2011-12
Numbers of learners in literacy and continuing basic education programmes have increased greatly since the fall of the Taliban regime, though the improved enrolment rates are by no means consistent across years and geographic areas. Data from DM Literacy EMIS 2013 shows the slow, but steady increase in enrolled learners within government recognised literacy programmes as a percentage of the total estimated population lacking basic literacy (2015 Projected)
Year Literacy Learners of 15+ Population As a percentage of
Non-literate People Male Female Total
2008 104134 274386 378520 3.44
2009 287124 385555 672679 6.12
2010 249150 362310 611460 5.56
2011 202601 295573 498174 4.53
2012 252917 320226 573143 5.21
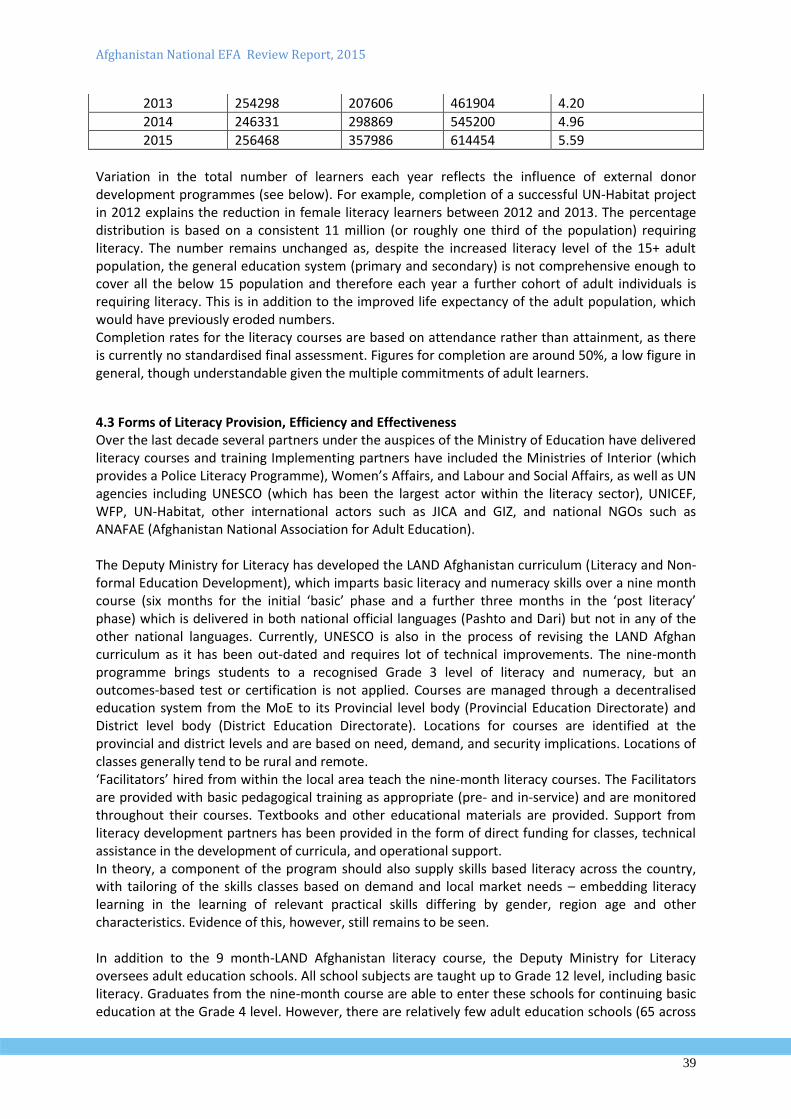
Afghanistan National EFA Review Report, 2015
39
2013 254298 207606 461904 4.20
2014 246331 298869 545200 4.96
2015 256468 357986 614454 5.59
Variation in the total number of learners each year reflects the influence of external donor development programmes (see below). For example, completion of a successful UN-Habitat project in 2012 explains the reduction in female literacy learners between 2012 and 2013. The percentage distribution is based on a consistent 11 million (or roughly one third of the population) requiring literacy. The number remains unchanged as, despite the increased literacy level of the 15+ adult population, the general education system (primary and secondary) is not comprehensive enough to cover all the below 15 population and therefore each year a further cohort of adult individuals is requiring literacy. This is in addition to the improved life expectancy of the adult population, which would have previously eroded numbers. Completion rates for the literacy courses are based on attendance rather than attainment, as there is currently no standardised final assessment. Figures for completion are around 50%, a low figure in general, though understandable given the multiple commitments of adult learners.
4.3 Forms of Literacy Provision, Efficiency and Effectiveness Over the last decade several partners under the auspices of the Ministry of Education have delivered literacy courses and training Implementing partners have included the Ministries of Interior (which provides a Police Literacy Programme), Women’s Affairs, and Labour and Social Affairs, as well as UN agencies including UNESCO (which has been the largest actor within the literacy sector), UNICEF, WFP, UN-Habitat, other international actors such as JICA and GIZ, and national NGOs such as ANAFAE (Afghanistan National Association for Adult Education). The Deputy Ministry for Literacy has developed the LAND Afghanistan curriculum (Literacy and Non-formal Education Development), which imparts basic literacy and numeracy skills over a nine month course (six months for the initial ‘basic’ phase and a further three months in the ‘post literacy’ phase) which is delivered in both national official languages (Pashto and Dari) but not in any of the other national languages. Currently, UNESCO is also in the process of revising the LAND Afghan curriculum as it has been out-dated and requires lot of technical improvements. The nine-month programme brings students to a recognised Grade 3 level of literacy and numeracy, but an outcomes-based test or certification is not applied. Courses are managed through a decentralised education system from the MoE to its Provincial level body (Provincial Education Directorate) and District level body (District Education Directorate). Locations for courses are identified at the provincial and district levels and are based on need, demand, and security implications. Locations of classes generally tend to be rural and remote. ‘Facilitators’ hired from within the local area teach the nine-month literacy courses. The Facilitators are provided with basic pedagogical training as appropriate (pre- and in-service) and are monitored throughout their courses. Textbooks and other educational materials are provided. Support from literacy development partners has been provided in the form of direct funding for classes, technical assistance in the development of curricula, and operational support. In theory, a component of the program should also supply skills based literacy across the country, with tailoring of the skills classes based on demand and local market needs – embedding literacy learning in the learning of relevant practical skills differing by gender, region age and other characteristics. Evidence of this, however, still remains to be seen. In addition to the 9 month-LAND Afghanistan literacy course, the Deputy Ministry for Literacy oversees adult education schools. All school subjects are taught up to Grade 12 level, including basic literacy. Graduates from the nine-month course are able to enter these schools for continuing basic education at the Grade 4 level. However, there are relatively few adult education schools (65 across
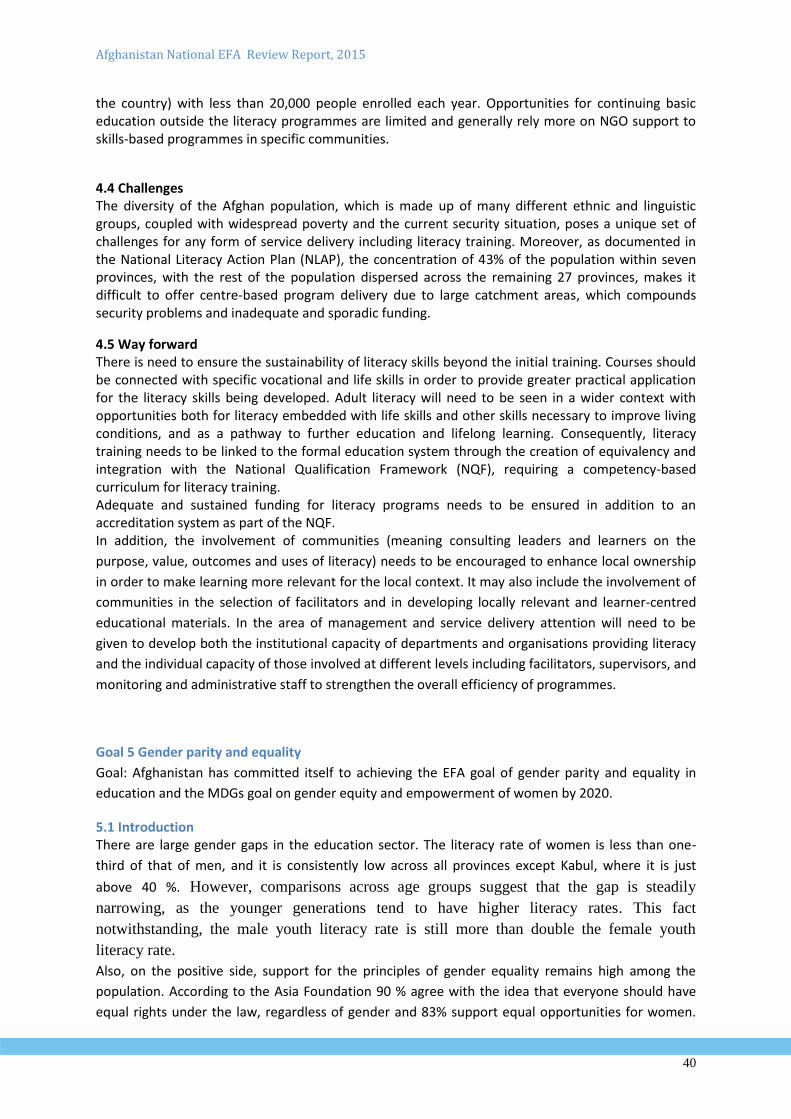
Afghanistan National EFA Review Report, 2015
40
the country) with less than 20,000 people enrolled each year. Opportunities for continuing basic education outside the literacy programmes are limited and generally rely more on NGO support to skills-based programmes in specific communities.
4.4 Challenges The diversity of the Afghan population, which is made up of many different ethnic and linguistic groups, coupled with widespread poverty and the current security situation, poses a unique set of challenges for any form of service delivery including literacy training. Moreover, as documented in the National Literacy Action Plan (NLAP), the concentration of 43% of the population within seven provinces, with the rest of the population dispersed across the remaining 27 provinces, makes it difficult to offer centre-based program delivery due to large catchment areas, which compounds security problems and inadequate and sporadic funding.
4.5 Way forward There is need to ensure the sustainability of literacy skills beyond the initial training. Courses should be connected with specific vocational and life skills in order to provide greater practical application for the literacy skills being developed. Adult literacy will need to be seen in a wider context with opportunities both for literacy embedded with life skills and other skills necessary to improve living conditions, and as a pathway to further education and lifelong learning. Consequently, literacy training needs to be linked to the formal education system through the creation of equivalency and integration with the National Qualification Framework (NQF), requiring a competency-based curriculum for literacy training. Adequate and sustained funding for literacy programs needs to be ensured in addition to an accreditation system as part of the NQF. In addition, the involvement of communities (meaning consulting leaders and learners on the
purpose, value, outcomes and uses of literacy) needs to be encouraged to enhance local ownership
in order to make learning more relevant for the local context. It may also include the involvement of
communities in the selection of facilitators and in developing locally relevant and learner-centred
educational materials. In the area of management and service delivery attention will need to be
given to develop both the institutional capacity of departments and organisations providing literacy
and the individual capacity of those involved at different levels including facilitators, supervisors, and
monitoring and administrative staff to strengthen the overall efficiency of programmes.
Goal 5 Gender parity and equality
Goal: Afghanistan has committed itself to achieving the EFA goal of gender parity and equality in
education and the MDGs goal on gender equity and empowerment of women by 2020.
5.1 Introduction There are large gender gaps in the education sector. The literacy rate of women is less than one-
third of that of men, and it is consistently low across all provinces except Kabul, where it is just
above 40 %. However, comparisons across age groups suggest that the gap is steadily
narrowing, as the younger generations tend to have higher literacy rates. This fact
notwithstanding, the male youth literacy rate is still more than double the female youth
literacy rate.
Also, on the positive side, support for the principles of gender equality remains high among the
population. According to the Asia Foundation 90 % agree with the idea that everyone should have
equal rights under the law, regardless of gender and 83% support equal opportunities for women.
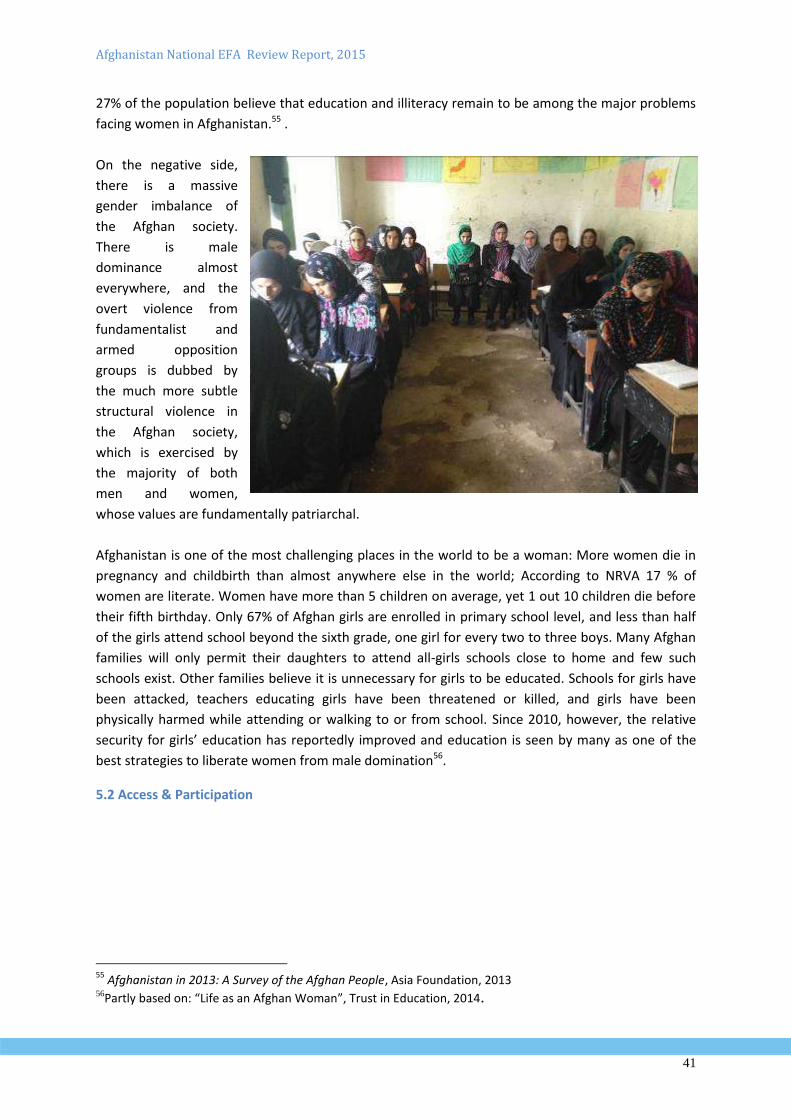
Afghanistan National EFA Review Report, 2015
41
27% of the population believe that education and illiteracy remain to be among the major problems
facing women in Afghanistan.55 .
On the negative side,
there is a massive
gender imbalance of
the Afghan society.
There is male
dominance almost
everywhere, and the
overt violence from
fundamentalist and
armed opposition
groups is dubbed by
the much more subtle
structural violence in
the Afghan society,
which is exercised by
the majority of both
men and women,
whose values are fundamentally patriarchal.
Afghanistan is one of the most challenging places in the world to be a woman: More women die in
pregnancy and childbirth than almost anywhere else in the world; According to NRVA 17 % of
women are literate. Women have more than 5 children on average, yet 1 out 10 children die before
their fifth birthday. Only 67% of Afghan girls are enrolled in primary school level, and less than half
of the girls attend school beyond the sixth grade, one girl for every two to three boys. Many Afghan
families will only permit their daughters to attend all-girls schools close to home and few such
schools exist. Other families believe it is unnecessary for girls to be educated. Schools for girls have
been attacked, teachers educating girls have been threatened or killed, and girls have been
physically harmed while attending or walking to or from school. Since 2010, however, the relative
security for girls’ education has reportedly improved and education is seen by many as one of the
best strategies to liberate women from male domination56.
5.2 Access & Participation
55
Afghanistan in 2013: A Survey of the Afghan People, Asia Foundation, 2013 56Partly based on: “Life as an Afghan Woman”, Trust in Education, 2014.
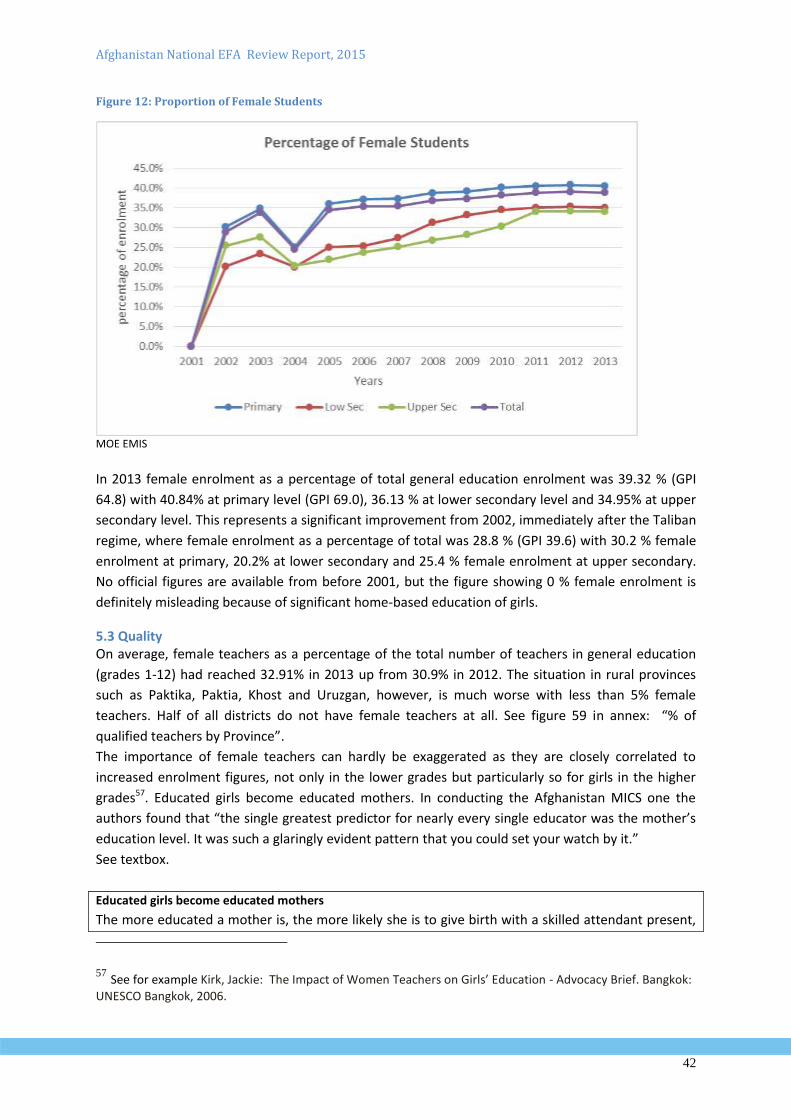
Afghanistan National EFA Review Report, 2015
42
Figure 12: Proportion of Female Students
MOE EMIS
In 2013 female enrolment as a percentage of total general education enrolment was 39.32 % (GPI
64.8) with 40.84% at primary level (GPI 69.0), 36.13 % at lower secondary level and 34.95% at upper
secondary level. This represents a significant improvement from 2002, immediately after the Taliban
regime, where female enrolment as a percentage of total was 28.8 % (GPI 39.6) with 30.2 % female
enrolment at primary, 20.2% at lower secondary and 25.4 % female enrolment at upper secondary.
No official figures are available from before 2001, but the figure showing 0 % female enrolment is
definitely misleading because of significant home-based education of girls.
5.3 Quality On average, female teachers as a percentage of the total number of teachers in general education
(grades 1-12) had reached 32.91% in 2013 up from 30.9% in 2012. The situation in rural provinces
such as Paktika, Paktia, Khost and Uruzgan, however, is much worse with less than 5% female
teachers. Half of all districts do not have female teachers at all. See figure 59 in annex: “% of
qualified teachers by Province”.
The importance of female teachers can hardly be exaggerated as they are closely correlated to
increased enrolment figures, not only in the lower grades but particularly so for girls in the higher
grades57. Educated girls become educated mothers. In conducting the Afghanistan MICS one the
authors found that “the single greatest predictor for nearly every single educator was the mother’s
education level. It was such a glaringly evident pattern that you could set your watch by it.”
See textbox.
Educated girls become educated mothers
The more educated a mother is, the more likely she is to give birth with a skilled attendant present,
57 See for example Kirk, Jackie: The Impact of Women Teachers on Girls’ Education - Advocacy Brief. Bangkok:
UNESCO Bangkok, 2006.
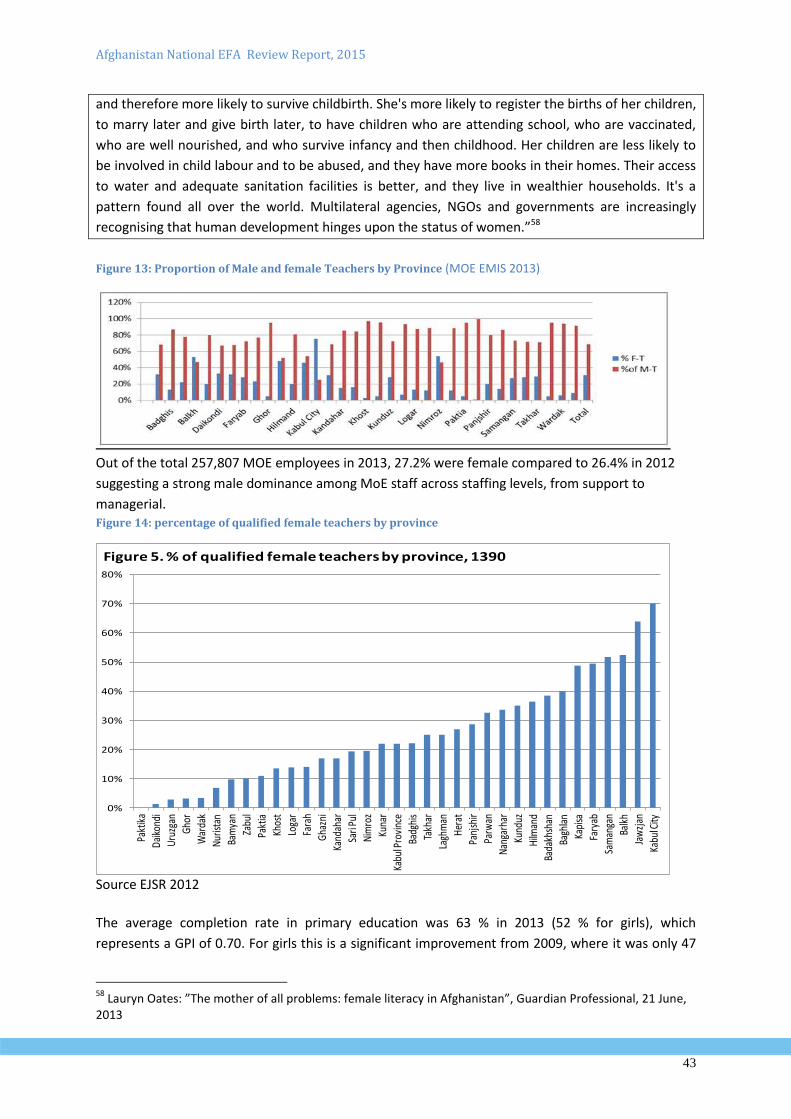
Afghanistan National EFA Review Report, 2015
43
and therefore more likely to survive childbirth. She's more likely to register the births of her children,
to marry later and give birth later, to have children who are attending school, who are vaccinated,
who are well nourished, and who survive infancy and then childhood. Her children are less likely to
be involved in child labour and to be abused, and they have more books in their homes. Their access
to water and adequate sanitation facilities is better, and they live in wealthier households. It's a
pattern found all over the world. Multilateral agencies, NGOs and governments are increasingly
recognising that human development hinges upon the status of women.”58
Figure 13: Proportion of Male and female Teachers by Province (MOE EMIS 2013)
Out of the total 257,807 MOE employees in 2013, 27.2% were female compared to 26.4% in 2012
suggesting a strong male dominance among MoE staff across staffing levels, from support to
managerial. Figure 14: percentage of qualified female teachers by province
0%
10%
20%
30%
40%
50%
60%
70%
80%
Pakt
ika
Dai
kond
i
Uru
zgan
Gho
r
War
dak
Nur
istan
Bam
yan
Zabu
l
Pakt
ia
Khos
t
Loga
r
Fara
h
Gha
zni
Kand
ahar
Sari
Pul
Nim
roz
Kuna
r
Kabu
l Pro
vinc
e
Badg
his
Takh
ar
Lagh
man
Her
at
Panj
shir
Parw
an
Nan
garh
ar
Kund
uz
Hilm
and
Bada
khsh
an
Bagh
lan
Kapi
sa
Fary
ab
Sam
anga
n
Balk
h
Jaw
zjan
Kabu
l City
Figure 5. % of qualified female teachers by province, 1390
Source EJSR 2012
The average completion rate in primary education was 63 % in 2013 (52 % for girls), which
represents a GPI of 0.70. For girls this is a significant improvement from 2009, where it was only 47
58
Lauryn Oates: ”The mother of all problems: female literacy in Afghanistan”, Guardian Professional, 21 June, 2013
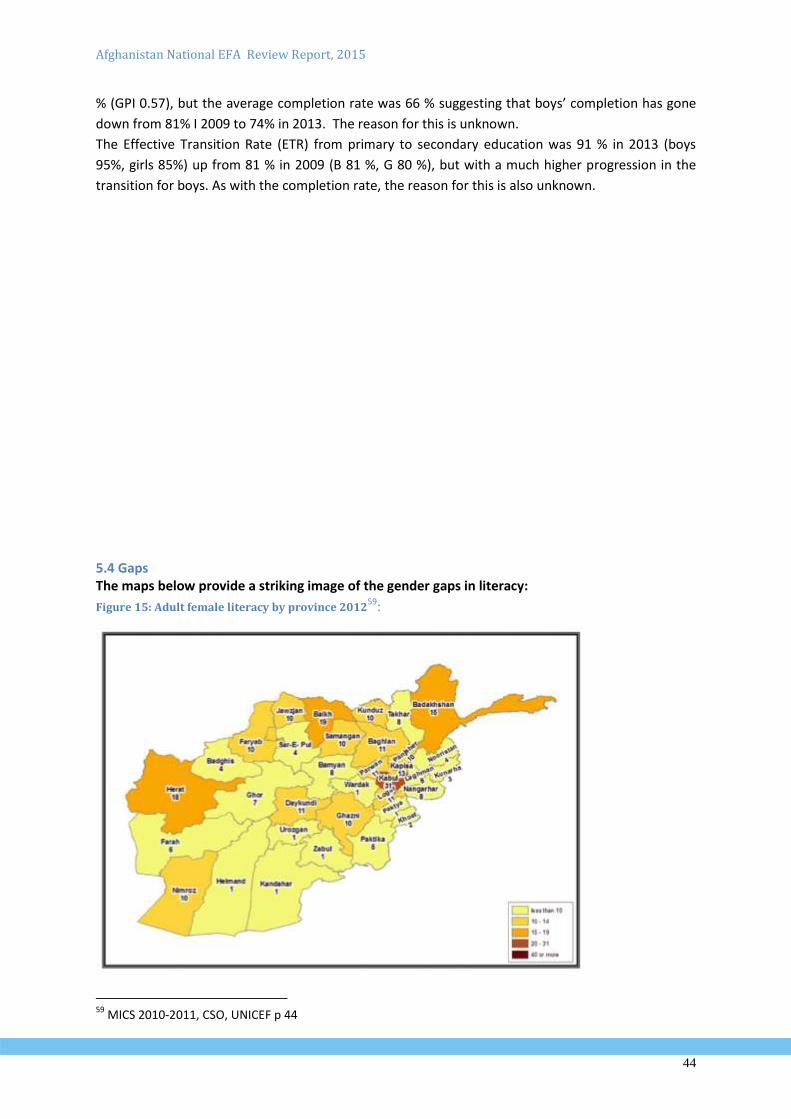
Afghanistan National EFA Review Report, 2015
44
% (GPI 0.57), but the average completion rate was 66 % suggesting that boys’ completion has gone
down from 81% I 2009 to 74% in 2013. The reason for this is unknown.
The Effective Transition Rate (ETR) from primary to secondary education was 91 % in 2013 (boys
95%, girls 85%) up from 81 % in 2009 (B 81 %, G 80 %), but with a much higher progression in the
transition for boys. As with the completion rate, the reason for this is also unknown.
5.4 Gaps The maps below provide a striking image of the gender gaps in literacy:
Figure 15: Adult female literacy by province 201259:
59
MICS 2010-2011, CSO, UNICEF p 44
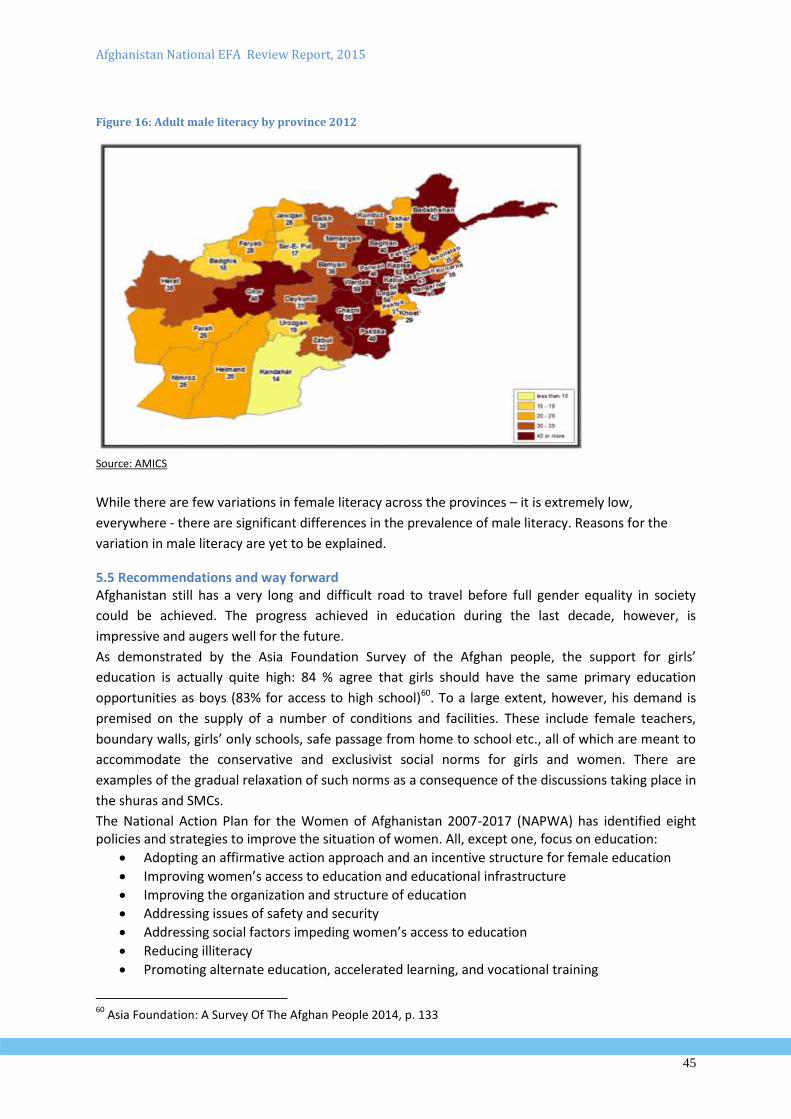
Afghanistan National EFA Review Report, 2015
45
Figure 16: Adult male literacy by province 2012
Source: AMICS
While there are few variations in female literacy across the provinces – it is extremely low,
everywhere - there are significant differences in the prevalence of male literacy. Reasons for the
variation in male literacy are yet to be explained.
5.5 Recommendations and way forward Afghanistan still has a very long and difficult road to travel before full gender equality in society
could be achieved. The progress achieved in education during the last decade, however, is
impressive and augers well for the future.
As demonstrated by the Asia Foundation Survey of the Afghan people, the support for girls’
education is actually quite high: 84 % agree that girls should have the same primary education
opportunities as boys (83% for access to high school)60. To a large extent, however, his demand is
premised on the supply of a number of conditions and facilities. These include female teachers,
boundary walls, girls’ only schools, safe passage from home to school etc., all of which are meant to
accommodate the conservative and exclusivist social norms for girls and women. There are
examples of the gradual relaxation of such norms as a consequence of the discussions taking place in
the shuras and SMCs.
The National Action Plan for the Women of Afghanistan 2007-2017 (NAPWA) has identified eight policies and strategies to improve the situation of women. All, except one, focus on education:
Adopting an affirmative action approach and an incentive structure for female education
Improving women’s access to education and educational infrastructure
Improving the organization and structure of education
Addressing issues of safety and security
Addressing social factors impeding women’s access to education
Reducing illiteracy
Promoting alternate education, accelerated learning, and vocational training
60
Asia Foundation: A Survey Of The Afghan People 2014, p. 133
Afghanistan National EFA Review Report, 2015
46
Utilizing education to promote the overall well-being of women The way forward is marked by the number of practical interventions and strategic plans, which have
been developed in recent years to address the gender disparities in education, e.g. the
establishment of the Girls’ Education Directorate, the accelerated learning programs for girls, the
establishment of girls’ only schools, priority to construction of girls schools and the provision of
facilities, the recruitment of female teachers with high incentives, a quota system in the teacher
education centres for female students, the establishment of dormitories and providing incentives for
girls. In the National Policy for Technical and Vocational Education and Trainings it is also
importantly mentioned that gender equity and improvement of female education is the main
principle of the Policy, especially in providing educational opportunity and service delivery. This
policy also focuses on non-discrimination in providing TVET.
Goal 6 Improving the Quality of Education Improving all aspects of the quality of education and ensuring excellence of all so that recognized and measurable learning outcomes are achieved by all, especially in literacy, numeracy and essential life skills.
6.1 Introduction
The real measure of good schooling is the quality of learning outcomes, and recently MOE has
piloted a scheme of learning assessment in grades 6 and 361 with the aim of developing institutional
capacity and systematic national assessment systems. Many countries, however, find quality hard to
define and hard to measure. Accordingly, quality is often discussed in terms of the quality of inputs –
buildings, textbooks and teachers – rather than the ability of individual students, to read, to write, to
learn how to think and to act as productive and responsible citizens.
Several variables have been associated with quality of learning outcomes, which include factors such
as quantity (teacher: pupil ratio) and quality of teachers (level of teacher training); the internal
efficiency of the education system (repetition, drop out and completion rates), instructional time,
availability and condition of school infrastructure as well as availability of teaching resources. The
assumption is that better educational inputs will generally result in better learning outcomes.
Please refer to the section “Efficiency” p. 26 for detailed data on some of these parameters. The
survival rate to the last grade of primary (grade 6) was 58 % (60 % boys, 54 % girls) in 2013
suggesting that 4 out of 10 pupils who enrol in grade 1 do not reach grade 6 of primary education.
The NESP III envisages the following strategies for improving the quality of education: monitoring
the quality of education by standardized assessment tests, increasing the number of qualified
teachers, provision of quality teacher training, revision of textbooks, utilizing educational
technologies, reforming academic supervision, and increasing teaching hours. The MoE will
specifically focus on the quality of education in grade 1 to 3 to ensure that can read and write
fluently at the end of grade 3.
MoE has built a large number of schools and provided equipment and facilities to the existing
schools to increase teaching hours and contribute to the quality education.
A national curriculum for primary, lower secondary and upper secondary is developed and revised
based on the evidence from the field after testing the textbooks in the classrooms. Besides, teacher
61
With technical assistance from ACER and financed by EQUIP.
Afghanistan National EFA Review Report, 2015
47
guides and science kits are prepared and distributed to the school to be used in teaching and
learning processes.
The National TVET Strategy outlines a roadmap for quality improvement in the TVET system, one of
the four main pillars of the National TVET Strategy. It is framed in terms of an outcomes-based
approach, national standards, the need for a national qualification authority and framework,
accreditation of TVET institutions, modular curriculum, and competency-based training.
6.2 Measuring Learning While it is important that all children have access to and remain in school, it is equally crucial that
those enrolled acquire the relevant cognitive skills. EFA goal 6 focuses on improving all aspects of the
quality of education and ensuring excellence of all, so that recognized and measurable learning
outcomes are achieved by all, especially in literacy, numeracy and essential life skills.
Improvement in education quality is one of the important goals, which has been a priority for the
Ministry of Education. MOE has invested largely in the improvement of education quality through
consultation with students, teachers, parents, scholars and experts and by using national and
international experience. The investments include in-service and pre-service trainings for teachers,
introduction of new supervision and support system for teaching process, strengthening school
management, development of new curriculum, textbooks and teacher guides based on active
learning approaches, provision of science kits and other learning materials and improving schools
facilities and infrastructure are the major initiatives to enhancing quality of education.
Assessing learning outcomes in Afghanistan is currently a challenge since the education system does
not yet have standardized performance tests or national examinations at primary or secondary
school.
However, the current available evidence from various studies indicates poor learning outcomes. For
instance, a study by Save the Children found that only 43% of a sample of children in grade 3 could
read with comprehension. This poor performance is a concern in itself since reading with
comprehension is an important skill that is required for the entire student learning process for all
subjects. The study was not nation-wide and was conducted in Bamyan, Nangarhar, Kabul , Faryab ,
Balkh , and Kandahar provinces . Another study, however, suggests a gradual improvement in
learning achievement based on test results from 2009 and 2011 in Language and Maths at grades 3
and 662. Currently, a comprehensive learning assessment study is being conducted by ACER, an
Australian consultant for EQUIP, a large WB sponsored MOE programme.
The good news is that the Ministry of Education in 2014 completed data collection for learning
achievements for 6,000 grade six learners on three learning areas (numeracy, literacy and life skills)
and is in the process of expanding the pilot to gradually cover grades 3 and 9. MOE institutional
capacity is being built and data is In the process of being analysed. It is hoped that the information
will provide an indication of the extent, nature and quality of learning amongst the Afghan children.
62
Mansory, A.: A Study of DT3 Program: Teaching quality and Students’ Learning achievements, 2011
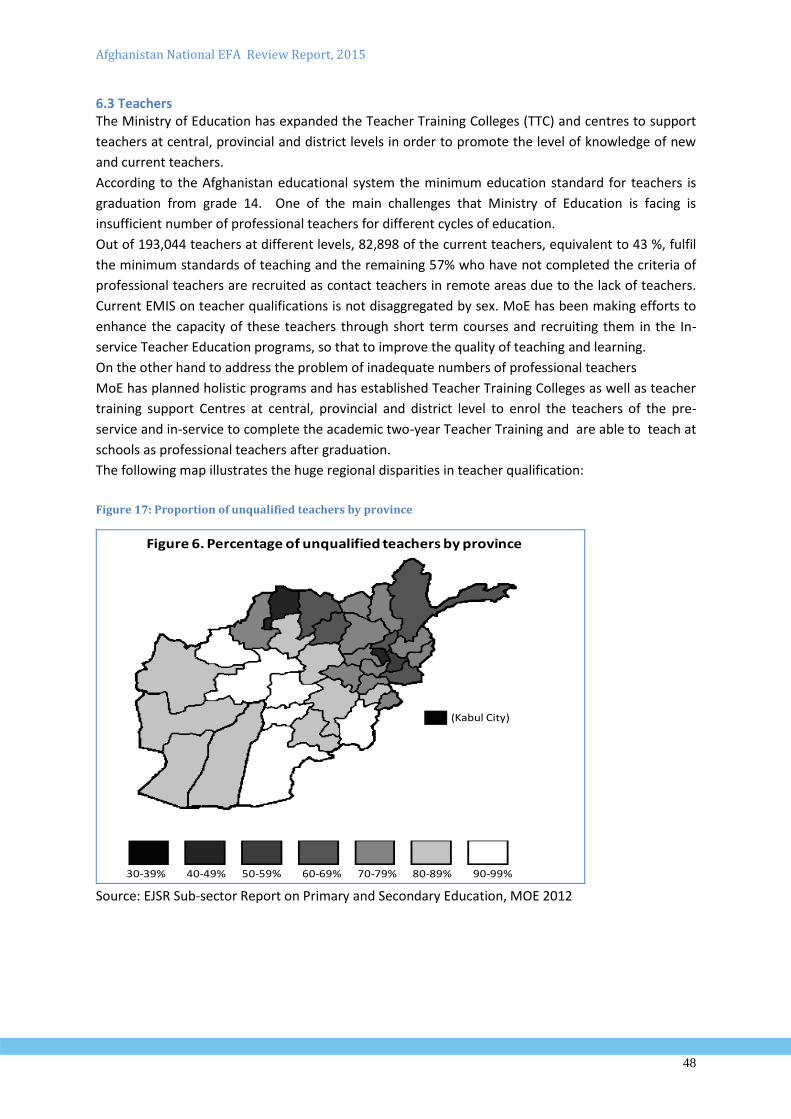
Afghanistan National EFA Review Report, 2015
48
6.3 Teachers The Ministry of Education has expanded the Teacher Training Colleges (TTC) and centres to support
teachers at central, provincial and district levels in order to promote the level of knowledge of new
and current teachers.
According to the Afghanistan educational system the minimum education standard for teachers is
graduation from grade 14. One of the main challenges that Ministry of Education is facing is
insufficient number of professional teachers for different cycles of education.
Out of 193,044 teachers at different levels, 82,898 of the current teachers, equivalent to 43 %, fulfil
the minimum standards of teaching and the remaining 57% who have not completed the criteria of
professional teachers are recruited as contact teachers in remote areas due to the lack of teachers.
Current EMIS on teacher qualifications is not disaggregated by sex. MoE has been making efforts to
enhance the capacity of these teachers through short term courses and recruiting them in the In-
service Teacher Education programs, so that to improve the quality of teaching and learning.
On the other hand to address the problem of inadequate numbers of professional teachers
MoE has planned holistic programs and has established Teacher Training Colleges as well as teacher
training support Centres at central, provincial and district level to enrol the teachers of the pre-
service and in-service to complete the academic two-year Teacher Training and are able to teach at
schools as professional teachers after graduation.
The following map illustrates the huge regional disparities in teacher qualification:
Figure 17: Proportion of unqualified teachers by province
(Kabul City)
30-39% 40-49% 50-59% 60-69% 70-79% 80-89% 90-99%
Figure 6. Percentage of unqualified teachers by province
Source: EJSR Sub-sector Report on Primary and Secondary Education, MOE 2012
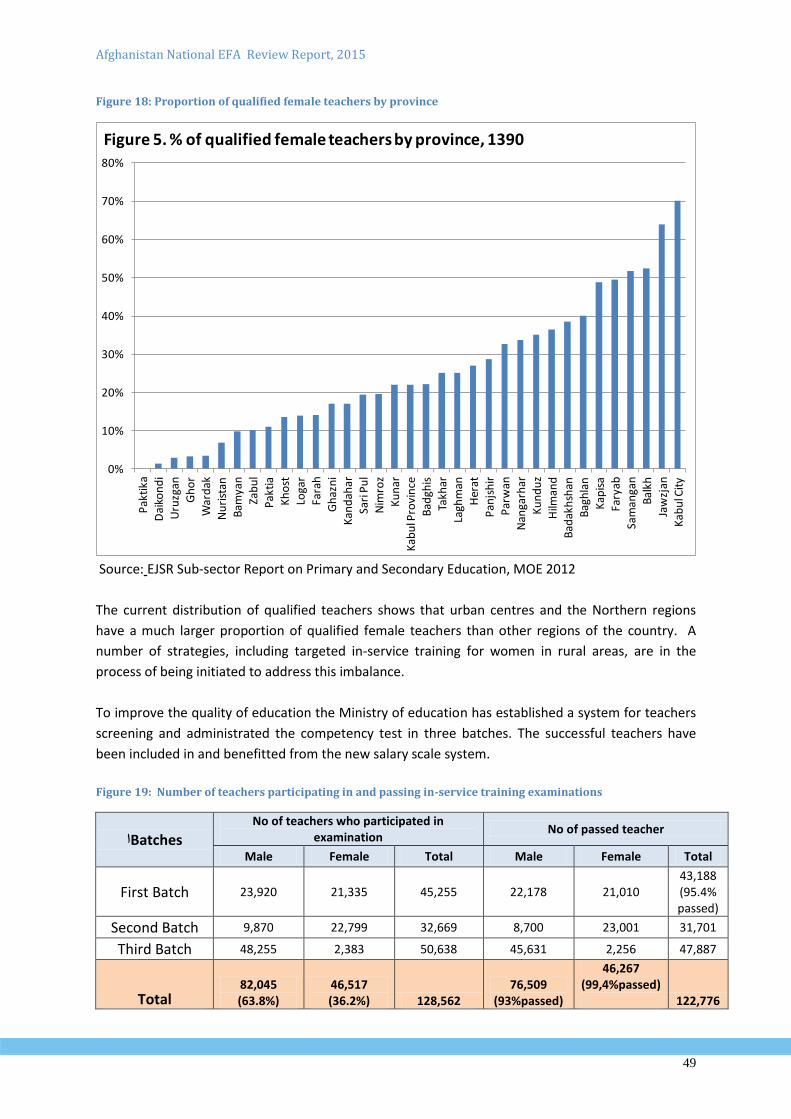
Afghanistan National EFA Review Report, 2015
49
Figure 18: Proportion of qualified female teachers by province
0%
10%
20%
30%
40%
50%
60%
70%
80%
Pak
tika
Dai
kon
di
Uru
zgan
Gh
or
War
dak
Nu
rist
an
Bam
yan
Zab
ul
Pak
tia
Kh
ost
Loga
r
Fara
h
Gh
azn
i
Kan
dah
ar
Sari
Pu
l
Nim
roz
Ku
nar
Kab
ul P
rovi
nce
Bad
ghis
Takh
ar
Lagh
man
Her
at
Pan
jsh
ir
Par
wan
Nan
garh
ar
Ku
nd
uz
Hilm
and
Bad
akh
shan
Bag
hla
n
Kap
isa
Fary
ab
Sam
anga
n
Bal
kh
Jaw
zjan
Kab
ul C
ity
Figure 5. % of qualified female teachers by province, 1390
Source: EJSR Sub-sector Report on Primary and Secondary Education, MOE 2012
The current distribution of qualified teachers shows that urban centres and the Northern regions
have a much larger proportion of qualified female teachers than other regions of the country. A
number of strategies, including targeted in-service training for women in rural areas, are in the
process of being initiated to address this imbalance.
To improve the quality of education the Ministry of education has established a system for teachers
screening and administrated the competency test in three batches. The successful teachers have
been included in and benefitted from the new salary scale system.
Figure 19: Number of teachers participating in and passing in-service training examinations
Batchesا No of teachers who participated in
examination No of passed teacher
Male Female Total Male Female Total
First Batch 23,920 21,335 45,255 22,178 21,010 43,188 (95.4% passed)
Second Batch 9,870 22,799 32,669 8,700 23,001 31,701
Third Batch 48,255 2,383 50,638 45,631 2,256 47,887
Total 82,045 (63.8%)
46,517 (36.2%) 128,562
76,509 (93%passed)
46,267 (99,4%passed)
122,776
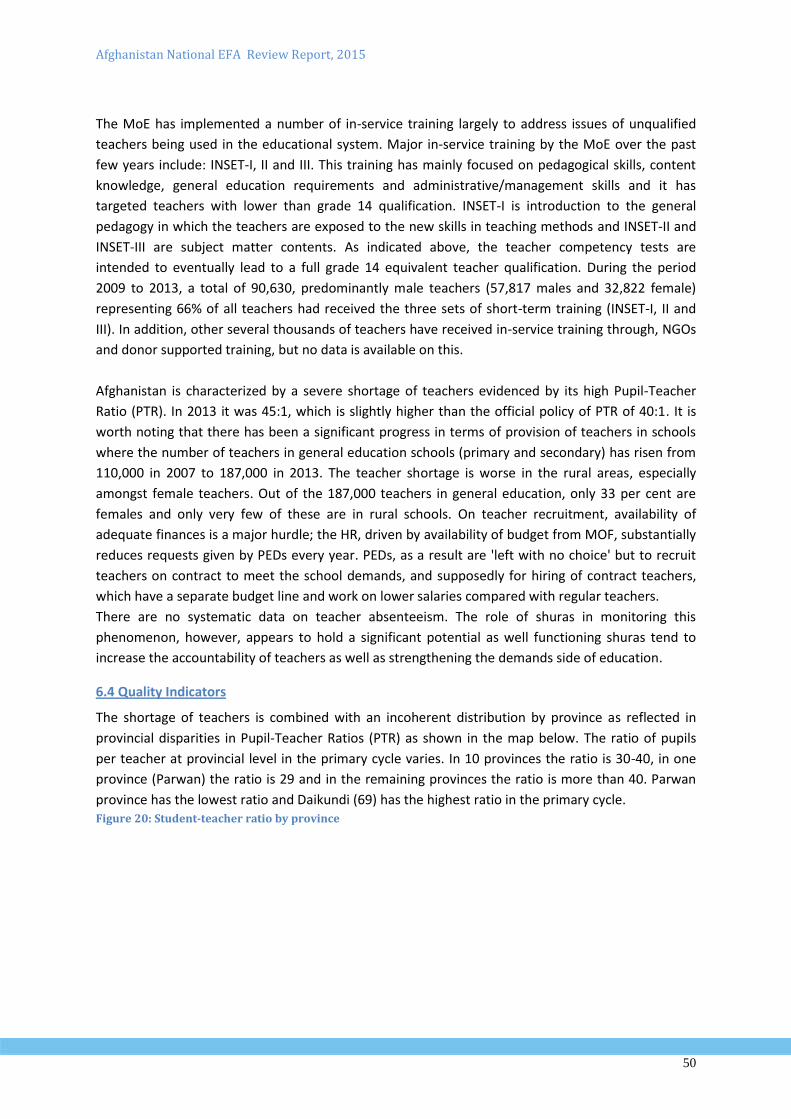
Afghanistan National EFA Review Report, 2015
50
The MoE has implemented a number of in-service training largely to address issues of unqualified
teachers being used in the educational system. Major in-service training by the MoE over the past
few years include: INSET-I, II and III. This training has mainly focused on pedagogical skills, content
knowledge, general education requirements and administrative/management skills and it has
targeted teachers with lower than grade 14 qualification. INSET-I is introduction to the general
pedagogy in which the teachers are exposed to the new skills in teaching methods and INSET-II and
INSET-III are subject matter contents. As indicated above, the teacher competency tests are
intended to eventually lead to a full grade 14 equivalent teacher qualification. During the period
2009 to 2013, a total of 90,630, predominantly male teachers (57,817 males and 32,822 female)
representing 66% of all teachers had received the three sets of short-term training (INSET-I, II and
III). In addition, other several thousands of teachers have received in-service training through, NGOs
and donor supported training, but no data is available on this.
Afghanistan is characterized by a severe shortage of teachers evidenced by its high Pupil-Teacher
Ratio (PTR). In 2013 it was 45:1, which is slightly higher than the official policy of PTR of 40:1. It is
worth noting that there has been a significant progress in terms of provision of teachers in schools
where the number of teachers in general education schools (primary and secondary) has risen from
110,000 in 2007 to 187,000 in 2013. The teacher shortage is worse in the rural areas, especially
amongst female teachers. Out of the 187,000 teachers in general education, only 33 per cent are
females and only very few of these are in rural schools. On teacher recruitment, availability of
adequate finances is a major hurdle; the HR, driven by availability of budget from MOF, substantially
reduces requests given by PEDs every year. PEDs, as a result are 'left with no choice' but to recruit
teachers on contract to meet the school demands, and supposedly for hiring of contract teachers,
which have a separate budget line and work on lower salaries compared with regular teachers.
There are no systematic data on teacher absenteeism. The role of shuras in monitoring this
phenomenon, however, appears to hold a significant potential as well functioning shuras tend to
increase the accountability of teachers as well as strengthening the demands side of education.
6.4 Quality Indicators
The shortage of teachers is combined with an incoherent distribution by province as reflected in
provincial disparities in Pupil-Teacher Ratios (PTR) as shown in the map below. The ratio of pupils
per teacher at provincial level in the primary cycle varies. In 10 provinces the ratio is 30-40, in one
province (Parwan) the ratio is 29 and in the remaining provinces the ratio is more than 40. Parwan
province has the lowest ratio and Daikundi (69) has the highest ratio in the primary cycle. Figure 20: Student-teacher ratio by province
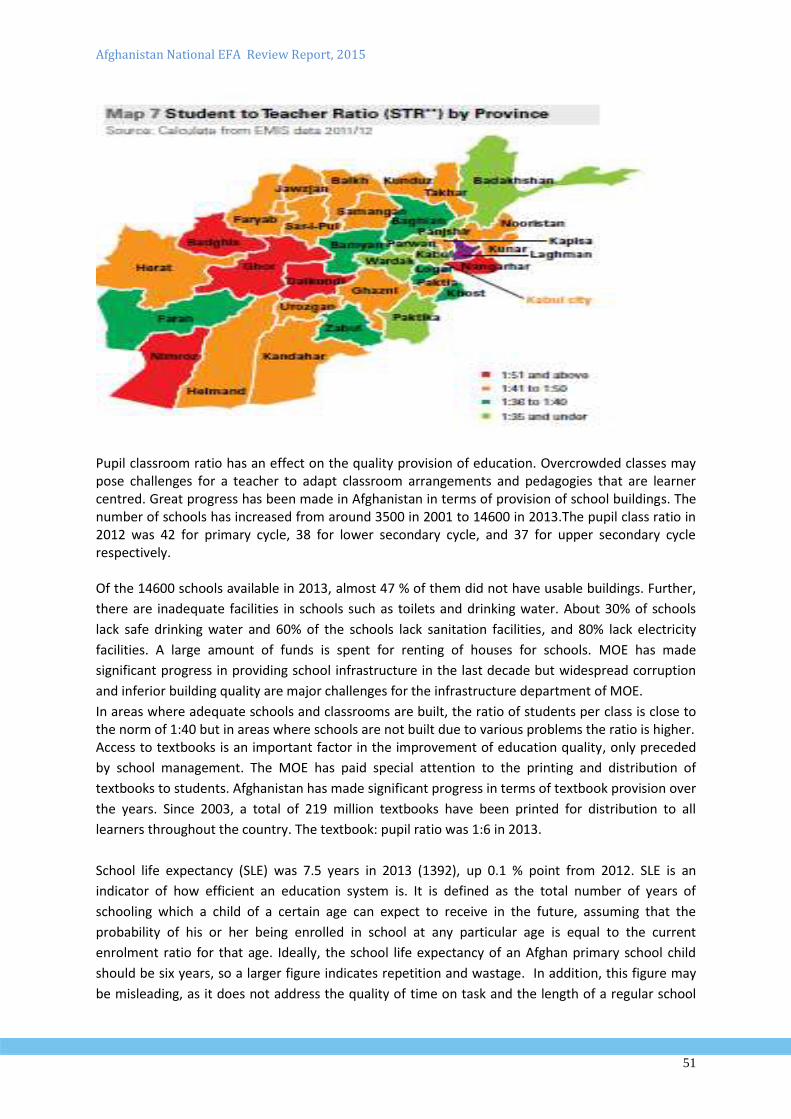
Afghanistan National EFA Review Report, 2015
51
Pupil classroom ratio has an effect on the quality provision of education. Overcrowded classes may pose challenges for a teacher to adapt classroom arrangements and pedagogies that are learner centred. Great progress has been made in Afghanistan in terms of provision of school buildings. The number of schools has increased from around 3500 in 2001 to 14600 in 2013.The pupil class ratio in 2012 was 42 for primary cycle, 38 for lower secondary cycle, and 37 for upper secondary cycle respectively. Of the 14600 schools available in 2013, almost 47 % of them did not have usable buildings. Further,
there are inadequate facilities in schools such as toilets and drinking water. About 30% of schools
lack safe drinking water and 60% of the schools lack sanitation facilities, and 80% lack electricity
facilities. A large amount of funds is spent for renting of houses for schools. MOE has made
significant progress in providing school infrastructure in the last decade but widespread corruption
and inferior building quality are major challenges for the infrastructure department of MOE.
In areas where adequate schools and classrooms are built, the ratio of students per class is close to the norm of 1:40 but in areas where schools are not built due to various problems the ratio is higher. Access to textbooks is an important factor in the improvement of education quality, only preceded
by school management. The MOE has paid special attention to the printing and distribution of
textbooks to students. Afghanistan has made significant progress in terms of textbook provision over
the years. Since 2003, a total of 219 million textbooks have been printed for distribution to all
learners throughout the country. The textbook: pupil ratio was 1:6 in 2013.
School life expectancy (SLE) was 7.5 years in 2013 (1392), up 0.1 % point from 2012. SLE is an
indicator of how efficient an education system is. It is defined as the total number of years of
schooling which a child of a certain age can expect to receive in the future, assuming that the
probability of his or her being enrolled in school at any particular age is equal to the current
enrolment ratio for that age. Ideally, the school life expectancy of an Afghan primary school child
should be six years, so a larger figure indicates repetition and wastage. In addition, this figure may
be misleading, as it does not address the quality of time on task and the length of a regular school
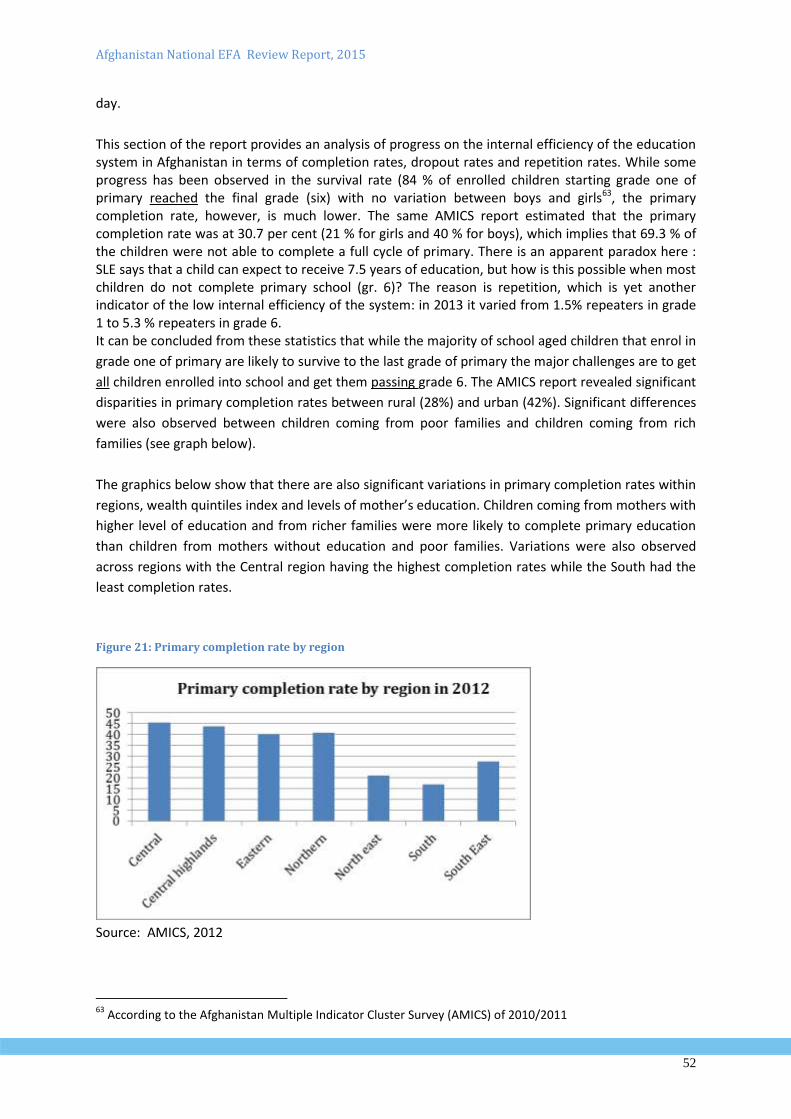
Afghanistan National EFA Review Report, 2015
52
day.
This section of the report provides an analysis of progress on the internal efficiency of the education system in Afghanistan in terms of completion rates, dropout rates and repetition rates. While some progress has been observed in the survival rate (84 % of enrolled children starting grade one of primary reached the final grade (six) with no variation between boys and girls63, the primary completion rate, however, is much lower. The same AMICS report estimated that the primary completion rate was at 30.7 per cent (21 % for girls and 40 % for boys), which implies that 69.3 % of the children were not able to complete a full cycle of primary. There is an apparent paradox here : SLE says that a child can expect to receive 7.5 years of education, but how is this possible when most children do not complete primary school (gr. 6)? The reason is repetition, which is yet another indicator of the low internal efficiency of the system: in 2013 it varied from 1.5% repeaters in grade 1 to 5.3 % repeaters in grade 6. It can be concluded from these statistics that while the majority of school aged children that enrol in
grade one of primary are likely to survive to the last grade of primary the major challenges are to get
all children enrolled into school and get them passing grade 6. The AMICS report revealed significant
disparities in primary completion rates between rural (28%) and urban (42%). Significant differences
were also observed between children coming from poor families and children coming from rich
families (see graph below).
The graphics below show that there are also significant variations in primary completion rates within
regions, wealth quintiles index and levels of mother’s education. Children coming from mothers with
higher level of education and from richer families were more likely to complete primary education
than children from mothers without education and poor families. Variations were also observed
across regions with the Central region having the highest completion rates while the South had the
least completion rates.
Figure 21: Primary completion rate by region
Source: AMICS, 2012
63
According to the Afghanistan Multiple Indicator Cluster Survey (AMICS) of 2010/2011
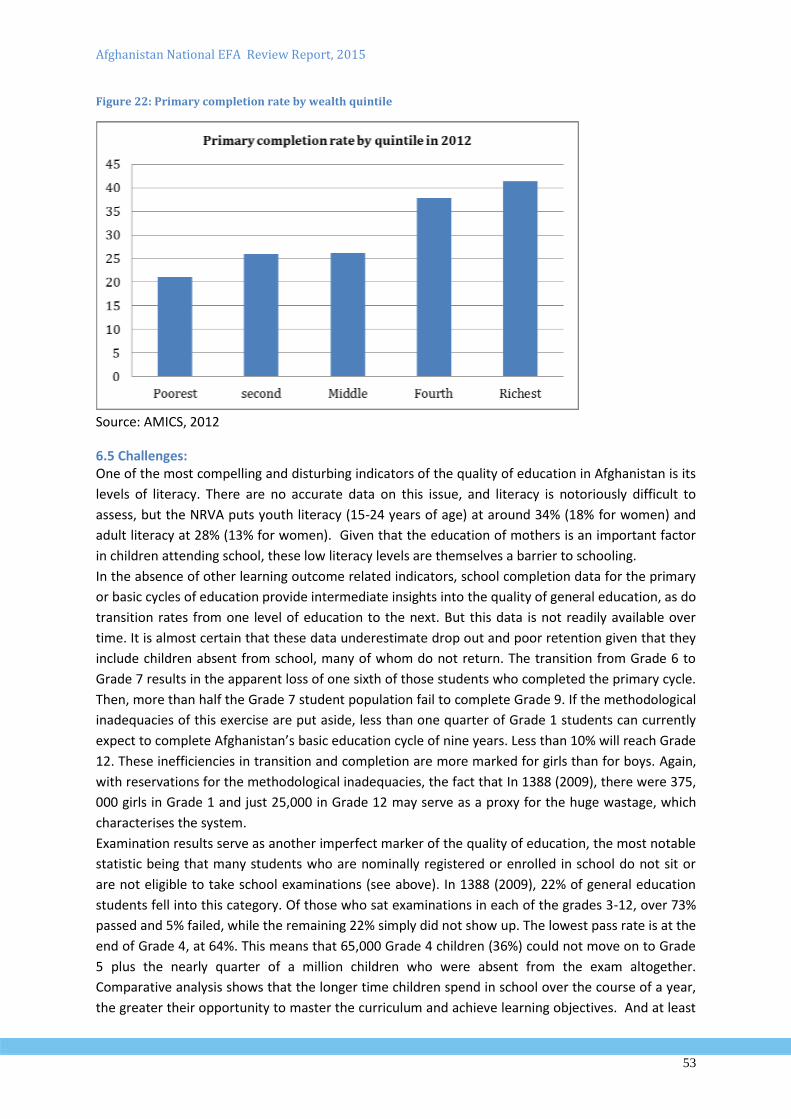
Afghanistan National EFA Review Report, 2015
53
Figure 22: Primary completion rate by wealth quintile
Source: AMICS, 2012
6.5 Challenges: One of the most compelling and disturbing indicators of the quality of education in Afghanistan is its
levels of literacy. There are no accurate data on this issue, and literacy is notoriously difficult to
assess, but the NRVA puts youth literacy (15-24 years of age) at around 34% (18% for women) and
adult literacy at 28% (13% for women). Given that the education of mothers is an important factor
in children attending school, these low literacy levels are themselves a barrier to schooling.
In the absence of other learning outcome related indicators, school completion data for the primary
or basic cycles of education provide intermediate insights into the quality of general education, as do
transition rates from one level of education to the next. But this data is not readily available over
time. It is almost certain that these data underestimate drop out and poor retention given that they
include children absent from school, many of whom do not return. The transition from Grade 6 to
Grade 7 results in the apparent loss of one sixth of those students who completed the primary cycle.
Then, more than half the Grade 7 student population fail to complete Grade 9. If the methodological
inadequacies of this exercise are put aside, less than one quarter of Grade 1 students can currently
expect to complete Afghanistan’s basic education cycle of nine years. Less than 10% will reach Grade
12. These inefficiencies in transition and completion are more marked for girls than for boys. Again,
with reservations for the methodological inadequacies, the fact that In 1388 (2009), there were 375,
000 girls in Grade 1 and just 25,000 in Grade 12 may serve as a proxy for the huge wastage, which
characterises the system.
Examination results serve as another imperfect marker of the quality of education, the most notable
statistic being that many students who are nominally registered or enrolled in school do not sit or
are not eligible to take school examinations (see above). In 1388 (2009), 22% of general education
students fell into this category. Of those who sat examinations in each of the grades 3-12, over 73%
passed and 5% failed, while the remaining 22% simply did not show up. The lowest pass rate is at the
end of Grade 4, at 64%. This means that 65,000 Grade 4 children (36%) could not move on to Grade
5 plus the nearly quarter of a million children who were absent from the exam altogether.
Comparative analysis shows that the longer time children spend in school over the course of a year,
the greater their opportunity to master the curriculum and achieve learning objectives. And at least
Afghanistan National EFA Review Report, 2015
54
80% of class time needs to be spent on learning. Most countries mandate between 700 to 900
formal hours of instruction during each year of primary and lower secondary education. The old
curriculum was designed in such a way that it provoked students for rote learning, while the new
curriculum along with the new approach of teaching currently provides more opportunity for active
learning methods in the classrooms.
There is little systematic evidence of the overall quality of teaching /learning in the classrooms
collected by MoE, but evidence from the German funded BEPA in the Northern provinces as well as
the study from Mansoor (DT3 study 2011) suggest a robust correlation between teacher INSET and
pedagogical support on one side and student learning achievement on the other.
In Afghanistan, the Education Law mandates MOE to determine the beginning and the closing of the
school year in different climatic zones and to set the number of weekly teaching hours. There is no
readily available data on days in school and hours of learning but three factors appear to suggest
that Afghanistan is at the lower end of the spectrum of learning time. First, between 101 and 175
days are designated holiday periods, varying according to climate zone. Second, 36% of all general
schools operate more than one shift (1388/2009 data). Three hundred and forty six schools operate
three shifts or more. Third, absenteeism from the classroom, for a complex of reasons, by both
teachers and students, necessarily interrupts and shortens learning time.
NESP I planned, ambitiously, that by 1389 (2010), 70% of teachers would have passed a competency
test; a new secondary curriculum would be taught; national testing systems to assess learning
achievements would be operational; and that over 90% of schools would have appropriate facilities
for boys and girls. While progress has been made, and is being made, it is still not at the rate
intended.
The problems with quality could be summarised:
Schools functional in 3 shifts
Lack of 60% professional teachers
High ratio of students per teacher
Lack of lab technician in most of the schools
Lack of standard laboratories
Lack of equipped computer labs
6.6 Recommendations As enrolment increases, there is evident need to address further aspects of quality improvement The type of solutions to address these problems range from improving teacher quality and management in schools, improving physical infrastructure, curriculum development as well as the provision of appropriate teaching and learning materials, labs and libraries. Specific solutions addressing the latter comprise:
Providing support to school management councils and management training of head teachers
Continue and strengthen community outreach efforts, focusing on active school shuras (school management committees) and community participation..
Distributing textbooks and teachers' guides to the school level
Improving the quality of teachers, including content mastery as well as improved pedagogical skills
Continuing to improve and update the curriculum
Increasing the hours of instruction, especially in crowded urban areas
Afghanistan National EFA Review Report, 2015
55
Improving the system of teacher supervision
Improving assessment of learning achievement
Ensure merit-based recruitment and promotion of head teachers and institutional managers.
Division of grade nine graduate in two fields (science and social science)
Establishment of standard science centres and educational technology centres at each province
Establishment of standard lab and computer room. Allocation of more post for teachers and lab technicians
EFA Goals Summing up
Goal 1: ECCE Low priority to pre-primary education in legislative frameworks (ECCE is not compulsory) and low
budget allocation.
Lack of a holistic and complimentary approach to ECCE programs
Evidence from other Asian countries indicates that attending in ECCE programs increases the
likelihood of completing primary grades. In Afghanistan where dropout rate is high and a large
number of students leave the school in the primary grades expanded and universalizing ECCE
program will be the key to foster education in other levels. Afghanistan needs to put more pace to
the process and make ECCE programmes accessible to all children of the relevant age group.
Goal 2: UPE The EFA goal 2 aims at universal access to primary education. Logically, this objective can only be
achieved if the children currently out of school (currently 3.5 million) are brought into the schools.
Still, however, the situation of out-of-school children and early school leavers is a serious concern.
Enrolment patterns show glaring disparities in the access to schooling as well as in retention and
completion. The reasons are many and comprise, inter alia, inadequate school supply and long
distances to school in rural areas, poverty, shortage of teachers, especially female teachers, and
insufficient number of girls’ only schools
Equality of rights to education entails putting measures in place aimed at reducing the current
gender, provincial and socioeconomic disparities in educational access, and improving retention and
learning outcomes at all levels of the system. Consequently, future strategies will focus on analysing
and addressing the bottlenecks that prevent out of school children from enrolling in schools.
Strategies focusing on multiple pathways for education will be strengthened and an approach
focused on equity and quality improvement (cf. below) will continue to be the overarching strategy
to achieve education for all children.
Goal 3 The Learning Needs of Youth and Adults Afghanistan still suffers from the legacy of years of neglect of the learning needs of the majority of
the population. The low literacy rates are evidence of this, and the same are the relatively low level
of opportunities for skills training and vocational education.
The TVET system has been neglected and it is grossly inadequate to respond to the needs. A robust
TVET system can be an effective tool for economic growth by providing a steady supply of skilled
workers especially in critical sectors such as agriculture, mining and infrastructure; it can encourage
an entrepreneurial culture, especially among women, and create more work opportunities for others,
Afghanistan National EFA Review Report, 2015
56
and by providing opportunities for young people it can act as a deterrent against radicalism and
insurgency.
GoIRA should commit to expanding the opportunities for a wide range of skills training for economic
activities as well as for life skills and citizenship. Such training could be non-formal and linked to the
acquisition of functional literacy.
Moreover, the GoIRA should commit to build a market-driven TVET system through the Afghanistan
National Qualifications Framework (ANQF) and the National Vocational Education and Training
Board (NVETB).
It should establish the Afghanistan National Qualifications Framework (ANQF) and the National
Vocational Education and Training Board (NVETB) as the foundation for national training standards.
Goal 4 Literacy Youth and adult literacy rates in Afghanistan are among the lowest in the world. In 2012 adult literacy stood at 31.4 % (17% female and 42% male). Youth (15-24) statistics indicate a positive trend, with youth female literacy almost double the rate compared to the whole population. The numbers of female literacy facilitators dropped by 24% from 1389/2010 to 1390/2011 – with a corresponding drop of 17% in the number of female learners. Commitments to literacy should be explicitly included in the National Priority Programmes, by including adult literacy in NPP-2 Education for All and increasing the scope of occupational literacy in NPP-1 Sustainable Decent Work. Literacy should be funded at least at the level of the NEIP targets: 2.3% of the education operating budget and 8% of the development budget, through the government budget and external aid.
Goal 5: Gender Parity and Equity in Education The provision of education is inequitable. In addition to the gender gap, there are rural-urban and regional disparities. Poverty is a strong predictor of inequitable provision of education as is vulnerability in general. Children and people with disabilities, ethnic minorities and nomadic children have significantly lower rates of access and attendance. As a first step in addressing inequity, a proper mapping based on EMIS data disaggregated by gender, ethnicity, geography, poverty and vulnerability should be developed in order to inform policy and managerial interventions. As a second step, clear equity and gender parity benchmarks should be identified and included in the strategic plan results framework. As a third step, budget allocations and annual work plans should reflect the priority on equity.
Goal 6: Quality The quality of education needs serious attention. High drop-out figures, low retention and completion figures as well as the results from several tests of student learning all lead to the fact that learning achievement is much more below than the desired levels. Continued attention to quality inputs like curriculum, textbooks/learning materials as well as qualified teachers is an essential condition for student learning, but this is far from sufficient. In addition, continued professional development, pedagogical support to and mentoring of, teachers are expected to improve learning. Local participation in all forms of management and supervision has shown to improve accountability and performance, and there needs to be more autonomy at institutional level in the school system and in higher education. It is recommended to accelerate efforts towards decentralisation through
Afghanistan National EFA Review Report, 2015
57
school management training for head teachers and managers and provide support to the establishment of SMCs and shuras. Performance assessment by objective standards (e.g. achievement tests) will also increase accountability and facilitate managerial intervention to improve learning achievement.
3. Review of EFA Strategies and Sector Management
MOE response to the EFA goals Afghanistan adopted the EFA goals in2005 but the 2015 targets were modified in light of the specific country situation with a neglected education system after years of civil war and Taliban rule opposed to education. MOE has undergone several major restructuring exercises since 2001, when Taliban were overthrown. The current central level structure reflects an attempt to develop an administrative structure, the mandate of which mirrors the functional requirements of a modern system of education. The General Directorate of General and Islamic Education has the main responsibility for goal 2, universalising primary education, while the MOE Deputy Ministry of TVET is responsible for the formal provision of technical and vocational education, and MOLSAMD is responsible for a multitude of short-term job-oriented training courses. A National Qualifications Framework (NQF) is in the process of being developed, initially for the TVET sub-sector, but later on the NQF will cover the whole sector. The Deputy Ministry of Literacy is responsible for policy development and regulation of literacy and adult education. A large number of NGOs provide services in this field, and UNESCO plays a prominent role in supporting the development of policies in literacy. For instance, in 2013, UNESCO assisted the MoE, in launching the National Literacy Strategy, to set out a framework for the expansion of literacy and to unify various national and international agents, toward the coordinated goal. In the skills development sub-sector, UNESCO in 2014 through Cap-EFA programme jointly with the MoE, the Ministry of Labour, Social Affairs, Martyrs, and Disabled (MoLSAMD) launched the National TVET Strategy, which is the first ever sector-wide TVET plan for the country, setting out a national framework and common platform from which to implement TVET programmes over the next five years. Gender equity in technical and vocational education and training (TVET) (which includes formal and non-formal skills development programmes) is a main principle of the National TVET Strategy, especially in providing equitable educational opportunities and service delivery to women and girls. The National Literacy Strategy and the National TVET strategy are both vehicles for aligning international aid to the national agenda and increasing donor support for literacy and skills development. Goal 5 gender and equity are crosscutting issues, which are addressed by all departments and supported by the Ministry of Women’s’ Affairs (MOWA). The country has a National Action Plan for Women of Afghanistan (NAPWA) to guide the interventions in this field. Goal 6 on quality is being addressed by the TED and the Curriculum Department of MOE and by printing large numbers of free textbooks; the latter is still heavily dependent on donor support, however. In addition, a pilot project on learning assessment is being implemented under MOE with the assistance of EQUIP and ACER, an Australian consultant. While the current departmental structure to a large degree corresponds to the functional division of labour, policy development and the implementation of policy still leave a lot to be desired. One problem with regard to policy making in the MoE is the gap between policy and practice. Efforts are continuously being made towards a systematic supervision and evaluation of policy implementation and it is hoped that these will help fill the gap. In addition to the monitoring and evaluation activities of the M&E Unit of the MOE Planning Directorate, the Academic Council in Educational Research and Policy Development is mandated to carry out basic academic research in order to inform policy development and analysis. Research funding, however, is limited and so is the number of studies emerging from this Academic Council.
Afghanistan National EFA Review Report, 2015
58
Sector Management The management of the education sector is shared between four major ministries: MOE, MOHE, MOLSAMD, and MOWA. All four ministries participate in the Human Resource Development Board (HRDB) with representation from DPs, who comprise external donors, as well as international and national NGOs working in education. In addition, the Chamber of Commerce occasionally attends the HRDB.
Planning: The planning capacity of the MoE has increased significantly. The MoE has developed two national strategic plans so far that have been effective in fundraising and improving coordination within the ministry. The first one was developed with significant TA from UNESCO IIEP, while the second one was an endogenously led process. In addition, an Interim Plan was developed for 2011-2013 that facilitated Afghanistan’s participation in the Global Partnership for Education (GPE) program. In 2012, the Planning and Evaluation General Department established a two-year program for developing the capacity of its employees in planning, M&E, and reporting. Despite these improvements, the MoE’s capacity in planning is still low at sub-national level. Planning is centralized and participation of school administrators and district officials in planning is limited; employees at district level often do not know about the MoE plans; accurate and updated data and information are not available for planning; budgeting is not integrated; and there are huge gaps between plans and implementation. Furthermore, development partners do not fully share the information on their external projects, and joint planning between the MoE and development partners is still negligible. Lately, a diploma course in planning to district and provincial managers is providing professional training to a key group of MOE staff, who have so far been neglected from CPD.
EMIS: During 2012, the MoE developed the EMIS system at the provincial level and the provincial staff (school supervisors and EMIS officers) collected school data and entered them into database of Provincial Education Departments. The central EMIS office is responsible for data verification. EMIS data are now available on the EMIS website.64 Nevertheless, the EMIS in 2012 was still facing challenges: the accuracy of EMIS data is not yet satisfactory; data are not always available on time; data on some key educational indicators such as net enrolment ratios cannot be accurately computed because of lack of reliable population data, while data on repetition rate, dropout rate, and enrolment of children with disabilities are not available. The NER data based on sample surveys is, however, available from AMIC surveys. The MoE has not been able to survey some schools due to insecurity and logistical problems.
The MoE organizational Structure: The MoE revisits its organizational structure annually. Structure related issues include: (1) the structure at the central level is too large: there are four thousand employees working in the centre; (2) in some cases, the size of provincial and district education offices does not match the size of the education system in the area; for example, there are four inspectors in every province, while there are significant differences in the size of provinces; and (3) the job descriptions of many positions are not clear and updated. Currently the MOE Department of Planning and Evaluation (DoPE) develops operational plans, but the Finance Department prepares and finalizes annual budgets, which hinders a proper implementation of the plans and achieving the MoE’s goals. The budgeting process has to become integrated with the planning process. In addition, the financial coordination between the MoF and MOE is not always conducive to smooth service delivery.
64
www.EMIS.af
Afghanistan National EFA Review Report, 2015
59
Sector Monitoring, Evaluation, and Reporting: The MoE held the first Education Joint Sector Review (EJSR) for 2011 in 2012 with participation of MoHE, MoLSAMD, development partners, civil society, and private sector. A second EJSR was held in 2013. The EJSR will take place annually to review the education sector’s progress and challenges, and to offer recommendations for improving the sector. The MoE and its donors have hired external consultants to evaluate a few key educational projects and activities. For example, the evaluation of EQUIP , the evaluation of the teacher education program and EMIS system are in progress. In 2012, the MoE launched a large program to develop the capacity of provincial staff in monitoring and reporting, and it has trained 1,016 employees so far. This training program should be evaluated before expanding the program.
ICT All MoE departments at the centre are equipped with ICT technology, and many MoE employees at the centre have access to the Internet. Although the provincial departments have been equipped with computers and printers, they are not connected to the Internet. District education offices and schools are not equipped with computers and printers, and do not have access to the Internet, mostly because of a lack of budget and lack of electricity. In 2012, the ICT department completed a project to build the necessary ICT infrastructure in the Provincial Education Departments to facilitate the decentralization of EMIS to the provincial level. The department has also conducted ICT training for the provincial staff.
HR Total number of positions (both teaching and administration positions) allocated to the MoE was 247,966 in 2012 and 258,996 in 2013. The positions allocated to the MoE are 31% of total positions (over 70% of civil servants) within the government. During the last few years, the government has increased the number of MoE positions by 11,000 annually, which is less than what is needed (25,000 annually). The percentage of female employees has increased only by 3% during the last five years, and in 2012 only 26% of employees were female. The increase in 2012 was 1.6%, which was a bit higher than in the previous years.
Strengthened financial system The MoE has computerized the financial system in 2009/2010. So far, 115,000 (45%) employees receive their salaries in their bank accounts. Despite this achievement, many teachers get their salaries late.
Development budget execution: Spending development budget is a key challenge for the ministry. The MoE could only spend 32.2% of its developmental budget in 2012. The following reasons are given for the low spending: (1) delays in providing money by donors, (2) time-consuming procurement process, (3) issuing budgets for multi-year projects in the first year, (4) delays in transferring the budget from the Ministry of Finance (MoF) to the MoE, (5) lack of available funding in provincial banks, (6) low capacity of MoE departments in developing proposals and determining specifications, (7) technical issues in some contracts, (8) corruption, and (9) unrealistic planning or budgeting, and (10) insecurity that prevents project implementation.
Capacity development: Capacity development has been a priority for the Ministry. In 2012, 2,295 employees (1,809 male, 486 female) attended different short-term training workshops such as computer skills, management,
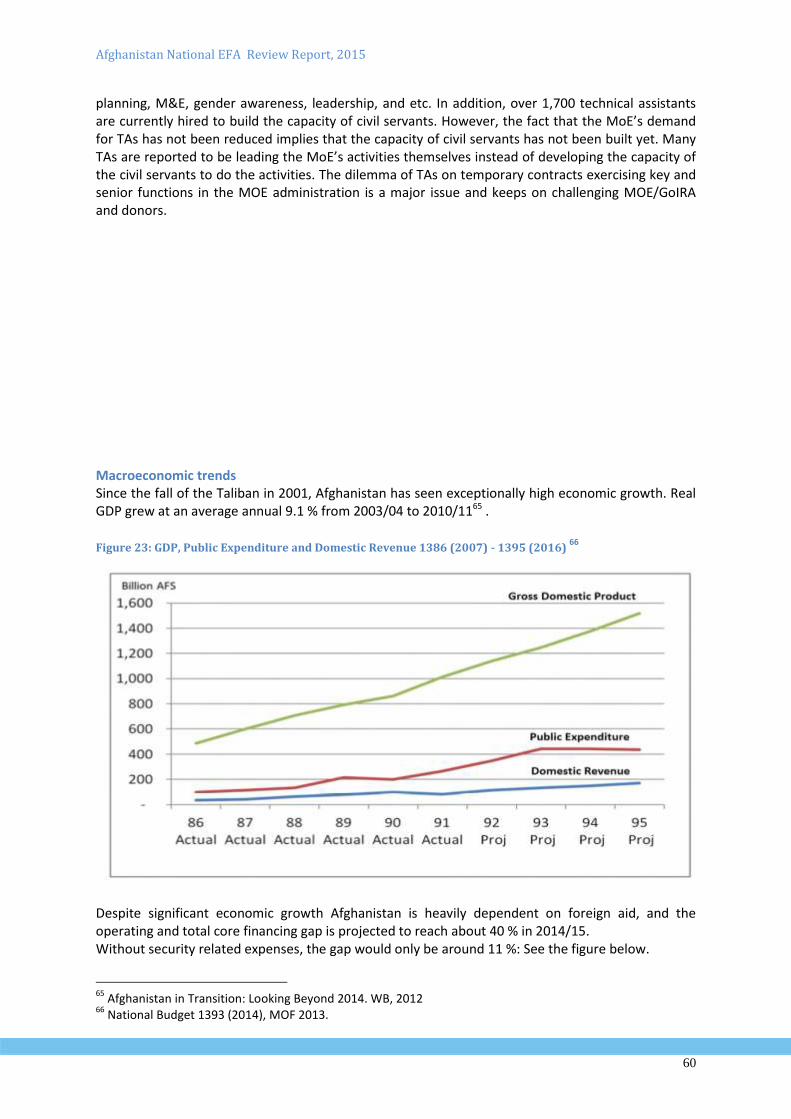
Afghanistan National EFA Review Report, 2015
60
planning, M&E, gender awareness, leadership, and etc. In addition, over 1,700 technical assistants are currently hired to build the capacity of civil servants. However, the fact that the MoE’s demand for TAs has not been reduced implies that the capacity of civil servants has not been built yet. Many TAs are reported to be leading the MoE’s activities themselves instead of developing the capacity of the civil servants to do the activities. The dilemma of TAs on temporary contracts exercising key and senior functions in the MOE administration is a major issue and keeps on challenging MOE/GoIRA and donors.
Macroeconomic trends Since the fall of the Taliban in 2001, Afghanistan has seen exceptionally high economic growth. Real GDP grew at an average annual 9.1 % from 2003/04 to 2010/1165 . Figure 23: GDP, Public Expenditure and Domestic Revenue 1386 (2007) - 1395 (2016)
66
Despite significant economic growth Afghanistan is heavily dependent on foreign aid, and the operating and total core financing gap is projected to reach about 40 % in 2014/15. Without security related expenses, the gap would only be around 11 %: See the figure below.
65
Afghanistan in Transition: Looking Beyond 2014. WB, 2012 66
National Budget 1393 (2014), MOF 2013.
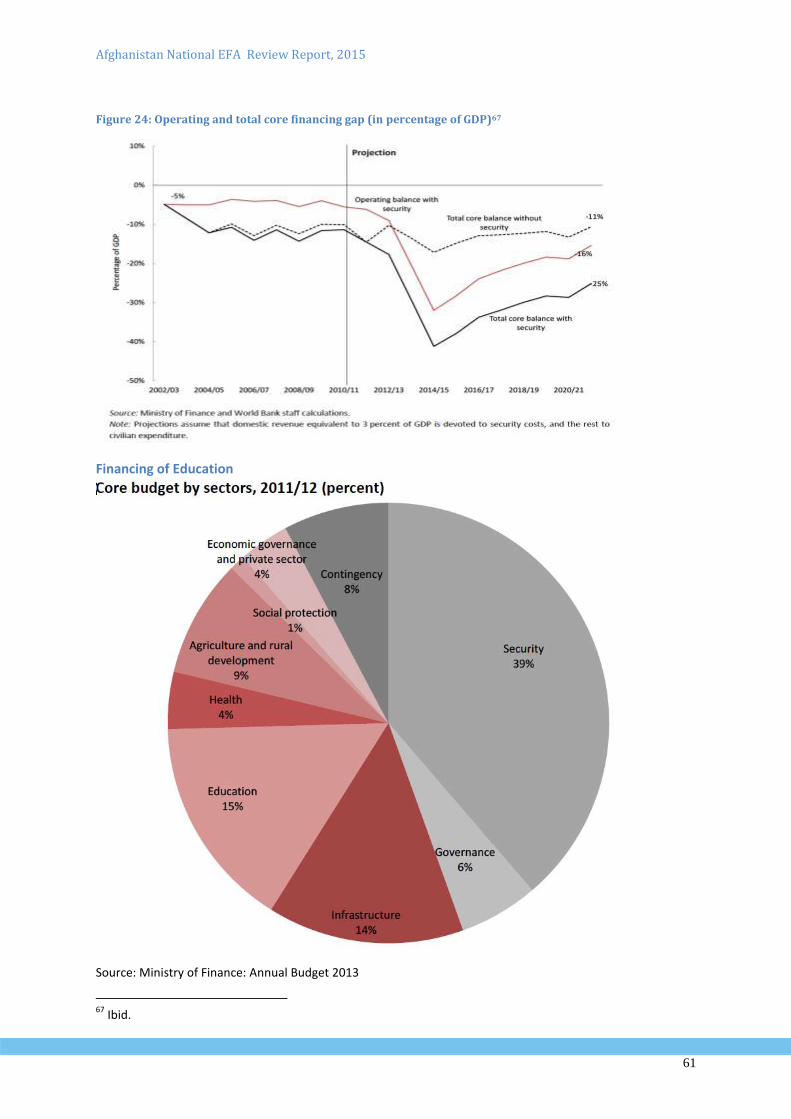
Afghanistan National EFA Review Report, 2015
61
Figure 24: Operating and total core financing gap (in percentage of GDP)67
Financing of Education
Source: Ministry of Finance: Annual Budget 2013
67
Ibid.
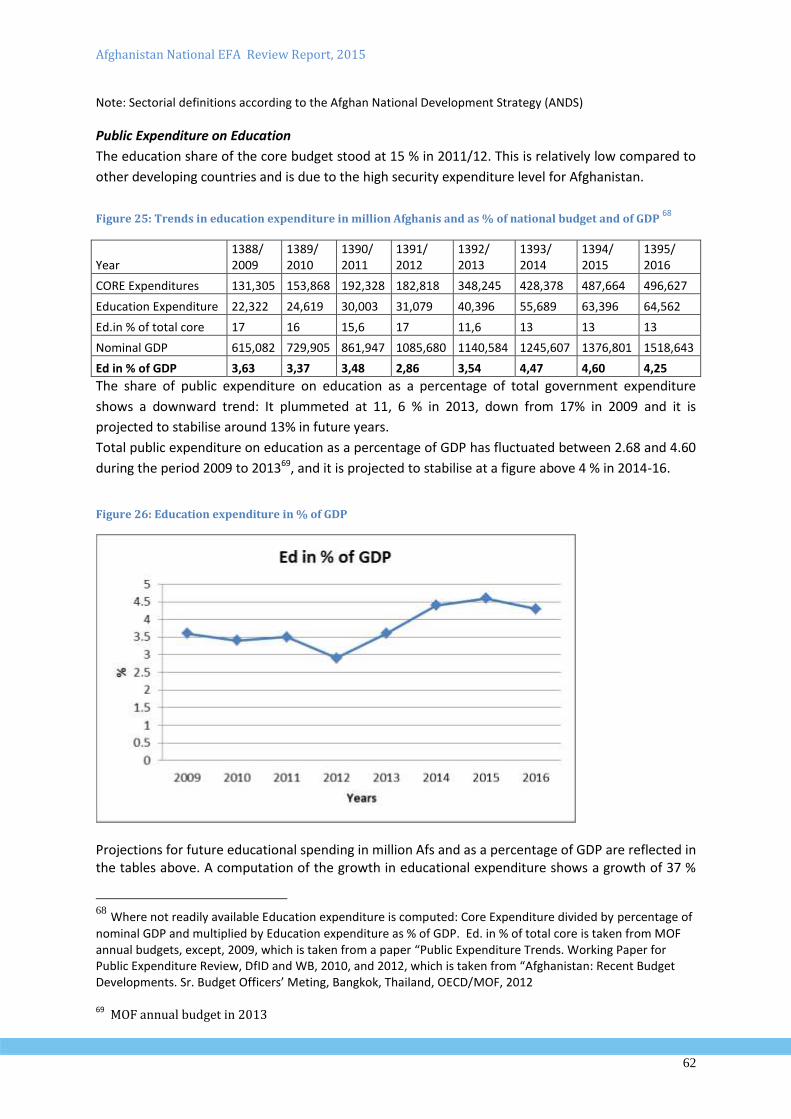
Afghanistan National EFA Review Report, 2015
62
Note: Sectorial definitions according to the Afghan National Development Strategy (ANDS)
Public Expenditure on Education
The education share of the core budget stood at 15 % in 2011/12. This is relatively low compared to
other developing countries and is due to the high security expenditure level for Afghanistan.
Figure 25: Trends in education expenditure in million Afghanis and as % of national budget and of GDP 68
Year 1388/ 2009
1389/ 2010
1390/ 2011
1391/ 2012
1392/ 2013
1393/ 2014
1394/ 2015
1395/ 2016
CORE Expenditures 131,305 153,868 192,328 182,818 348,245 428,378 487,664 496,627
Education Expenditure 22,322 24,619 30,003 31,079 40,396 55,689 63,396 64,562
Ed.in % of total core 17 16 15,6 17 11,6 13 13 13
Nominal GDP 615,082 729,905 861,947 1085,680 1140,584 1245,607 1376,801 1518,643
Ed in % of GDP 3,63 3,37 3,48 2,86 3,54 4,47 4,60 4,25
The share of public expenditure on education as a percentage of total government expenditure
shows a downward trend: It plummeted at 11, 6 % in 2013, down from 17% in 2009 and it is
projected to stabilise around 13% in future years.
Total public expenditure on education as a percentage of GDP has fluctuated between 2.68 and 4.60
during the period 2009 to 201369, and it is projected to stabilise at a figure above 4 % in 2014-16.
Figure 26: Education expenditure in % of GDP
Projections for future educational spending in million Afs and as a percentage of GDP are reflected in the tables above. A computation of the growth in educational expenditure shows a growth of 37 %
68
Where not readily available Education expenditure is computed: Core Expenditure divided by percentage of
nominal GDP and multiplied by Education expenditure as % of GDP. Ed. in % of total core is taken from MOF annual budgets, except, 2009, which is taken from a paper “Public Expenditure Trends. Working Paper for Public Expenditure Review, DfID and WB, 2010, and 2012, which is taken from “Afghanistan: Recent Budget Developments. Sr. Budget Officers’ Meting, Bangkok, Thailand, OECD/MOF, 2012 69
MOF annual budget in 2013
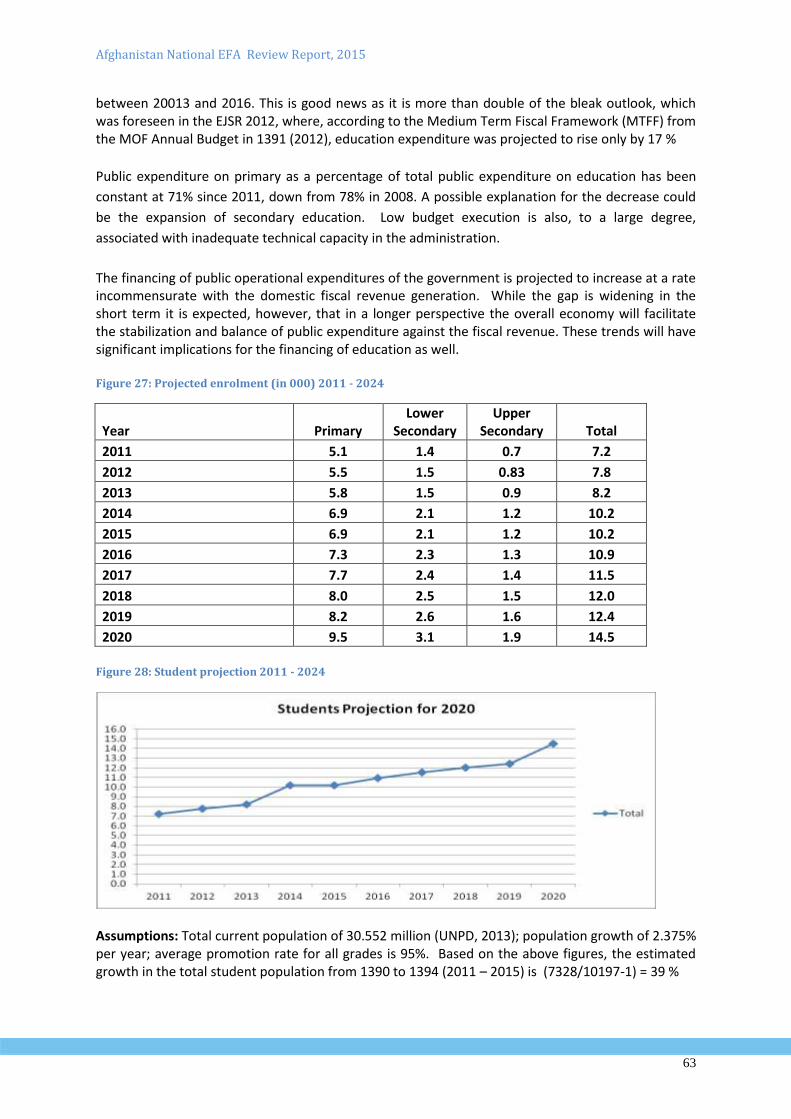
Afghanistan National EFA Review Report, 2015
63
between 20013 and 2016. This is good news as it is more than double of the bleak outlook, which was foreseen in the EJSR 2012, where, according to the Medium Term Fiscal Framework (MTFF) from the MOF Annual Budget in 1391 (2012), education expenditure was projected to rise only by 17 %
Public expenditure on primary as a percentage of total public expenditure on education has been
constant at 71% since 2011, down from 78% in 2008. A possible explanation for the decrease could
be the expansion of secondary education. Low budget execution is also, to a large degree,
associated with inadequate technical capacity in the administration.
The financing of public operational expenditures of the government is projected to increase at a rate incommensurate with the domestic fiscal revenue generation. While the gap is widening in the short term it is expected, however, that in a longer perspective the overall economy will facilitate the stabilization and balance of public expenditure against the fiscal revenue. These trends will have significant implications for the financing of education as well. Figure 27: Projected enrolment (in 000) 2011 - 2024
Year Primary Lower
Secondary Upper
Secondary Total
2011 5.1 1.4 0.7 7.2
2012 5.5 1.5 0.83 7.8
2013 5.8 1.5 0.9 8.2
2014 6.9 2.1 1.2 10.2
2015 6.9 2.1 1.2 10.2
2016 7.3 2.3 1.3 10.9
2017 7.7 2.4 1.4 11.5
2018 8.0 2.5 1.5 12.0
2019 8.2 2.6 1.6 12.4
2020 9.5 3.1 1.9 14.5
Figure 28: Student projection 2011 - 2024
Assumptions: Total current population of 30.552 million (UNPD, 2013); population growth of 2.375% per year; average promotion rate for all grades is 95%. Based on the above figures, the estimated growth in the total student population from 1390 to 1394 (2011 – 2015) is (7328/10197-1) = 39 %
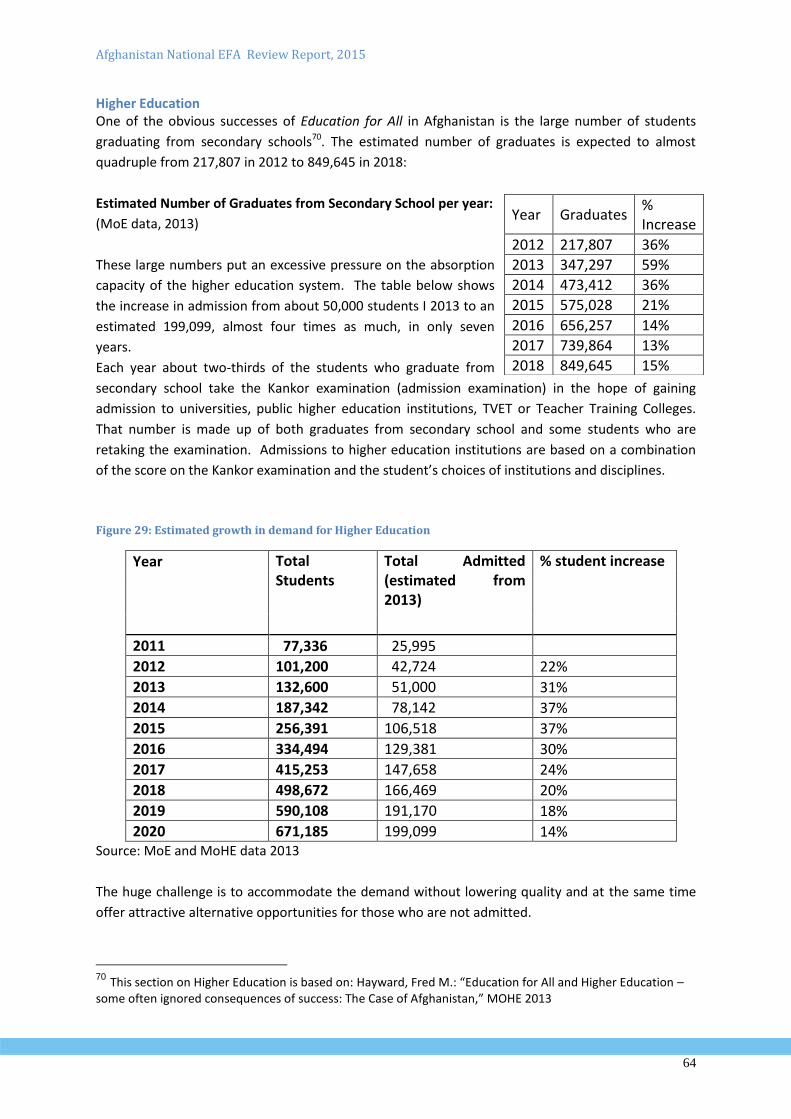
Afghanistan National EFA Review Report, 2015
64
Higher Education One of the obvious successes of Education for All in Afghanistan is the large number of students
graduating from secondary schools70. The estimated number of graduates is expected to almost
quadruple from 217,807 in 2012 to 849,645 in 2018:
Estimated Number of Graduates from Secondary School per year:
(MoE data, 2013)
These large numbers put an excessive pressure on the absorption
capacity of the higher education system. The table below shows
the increase in admission from about 50,000 students I 2013 to an
estimated 199,099, almost four times as much, in only seven
years.
Each year about two-thirds of the students who graduate from
secondary school take the Kankor examination (admission examination) in the hope of gaining
admission to universities, public higher education institutions, TVET or Teacher Training Colleges.
That number is made up of both graduates from secondary school and some students who are
retaking the examination. Admissions to higher education institutions are based on a combination
of the score on the Kankor examination and the student’s choices of institutions and disciplines.
Figure 29: Estimated growth in demand for Higher Education
Year Total Students
Total Admitted (estimated from 2013)
% student increase
2011 77,336 25,995
2012 101,200 42,724 22%
2013 132,600 51,000 31%
2014 187,342 78,142 37%
2015 256,391 106,518 37%
2016 334,494 129,381 30%
2017 415,253 147,658 24%
2018 498,672 166,469 20%
2019 590,108 191,170 18%
2020 671,185 199,099 14% Source: MoE and MoHE data 2013
The huge challenge is to accommodate the demand without lowering quality and at the same time
offer attractive alternative opportunities for those who are not admitted.
70 This section on Higher Education is based on: Hayward, Fred M.: “Education for All and Higher Education – some often ignored consequences of success: The Case of Afghanistan,” MOHE 2013
Year Graduates % Increase
2012 217,807 36%
2013 347,297 59%
2014 473,412 36%
2015 575,028 21%
2016 656,257 14%
2017 739,864 13%
2018 849,645 15%
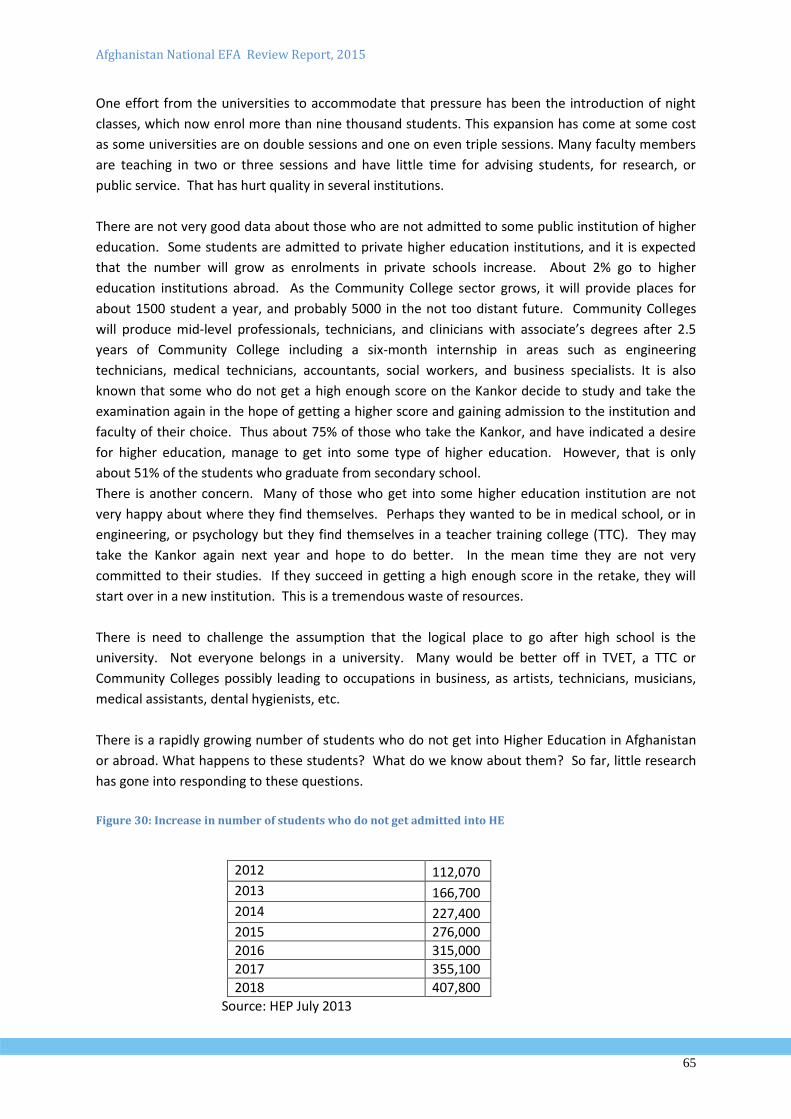
Afghanistan National EFA Review Report, 2015
65
One effort from the universities to accommodate that pressure has been the introduction of night
classes, which now enrol more than nine thousand students. This expansion has come at some cost
as some universities are on double sessions and one on even triple sessions. Many faculty members
are teaching in two or three sessions and have little time for advising students, for research, or
public service. That has hurt quality in several institutions.
There are not very good data about those who are not admitted to some public institution of higher
education. Some students are admitted to private higher education institutions, and it is expected
that the number will grow as enrolments in private schools increase. About 2% go to higher
education institutions abroad. As the Community College sector grows, it will provide places for
about 1500 student a year, and probably 5000 in the not too distant future. Community Colleges
will produce mid-level professionals, technicians, and clinicians with associate’s degrees after 2.5
years of Community College including a six-month internship in areas such as engineering
technicians, medical technicians, accountants, social workers, and business specialists. It is also
known that some who do not get a high enough score on the Kankor decide to study and take the
examination again in the hope of getting a higher score and gaining admission to the institution and
faculty of their choice. Thus about 75% of those who take the Kankor, and have indicated a desire
for higher education, manage to get into some type of higher education. However, that is only
about 51% of the students who graduate from secondary school.
There is another concern. Many of those who get into some higher education institution are not
very happy about where they find themselves. Perhaps they wanted to be in medical school, or in
engineering, or psychology but they find themselves in a teacher training college (TTC). They may
take the Kankor again next year and hope to do better. In the mean time they are not very
committed to their studies. If they succeed in getting a high enough score in the retake, they will
start over in a new institution. This is a tremendous waste of resources.
There is need to challenge the assumption that the logical place to go after high school is the
university. Not everyone belongs in a university. Many would be better off in TVET, a TTC or
Community Colleges possibly leading to occupations in business, as artists, technicians, musicians,
medical assistants, dental hygienists, etc.
There is a rapidly growing number of students who do not get into Higher Education in Afghanistan
or abroad. What happens to these students? What do we know about them? So far, little research
has gone into responding to these questions.
Figure 30: Increase in number of students who do not get admitted into HE
2012 112,070
2013 166,700
2014 227,400
2015 276,000
2016 315,000
2017 355,100
2018 407,800
Source: HEP July 2013
Afghanistan National EFA Review Report, 2015
66
There is a growing crisis of unemployment. Large numbers of graduates from high school do not find
jobs. The National Risk and Vulnerability Assessment in 2007-8 estimated that the unemployment
rate was a modest 7.1 %, which would be 823,000 people. 71 That estimate is surely an
underestimate. The Minister of Economic Affairs, Abdul Hadi Arghandiwal, reported that 48% of
Afghanistan’s labour force is unemployed or have only seasonal jobs.72 The MoLSAMD reports that
Afghanistan needs to create 500,000 jobs a year to deal with the employment problems which is not
happening.
A number of Afghans find jobs abroad, either through legitimate brokers who operate under the
rules of the Government of Afghanistan or through illegal middlemen, brokers, or acquaintances,
some of whom charge high fees and put them at risk once they arrive abroad.
There have been reports of an “exodus” from Afghanistan ever since 2000. For the most part, it
seems not to have materialized. However, the fear resulting from the announcement of the
withdrawal of most combat troops in 2014 has once again revived these concerns.
Illegal work in the poppy fields has drawn many young Afghans to its lucrative day wages. That is a
risky job, however, as the government increases its efforts to eradicate poppy fields, and an
unknown number of workers have been killed.73 Some also join gangs that ply the countryside
involved in robbery and kidnapping.
The unemployed are also easy targets for recruitment by the Taliban both as their resentment grows
about lack of jobs and what they see as the failures of the government. A growing number of young
people are increasingly unhappy with the current government and its chronic corruption. The
number of unemployed continues to grow as donors begin to leave with the drawdown of troops.
This is likely to become an even more serious problem unless solutions are found for the
unemployed. It is clear that many young people who join the Taliban do so more for economic
reasons than for ideological ones.
Questions have been raised as to how higher education should respond to the huge increase in
students from secondary school? There is no easy solution to the crisis. However, increasing
numbers of students in universities and higher education institutions without increasing quality
would be counterproductive. Already, the progress made in improving quality over the last five
years, has been hurt by the far too rapid increase in enrolments. Only by increasing the quality of
instruction will Afghanistan have the kinds of quality graduates needed to attract investment and
foster economic growth.
71
ILO, (2012), “Afghanistan: Time to move to Sustainable Jobs,” Study on the State of Employment in Afghanistan, p. 5. 72
Minister of Economy Abdul Hadi Arghandiwal, comments at the ILO/MoLSAMD conference on “Creating Sustainable Jobs,” May 7, 2013, Serena Hotel 73
Haseeb Maudoodi, (2013), “Unemployed Afghans Find Job Opportunity in Poppy Harvests,” The Voice of Afghanistan, April 6, 2013, p. 1, http://tolonews.com/en/afghanistan/10044--unemployed-afghans-fin...
Afghanistan National EFA Review Report, 2015
67
Thus the relative success of education for all must be followed by a major commitment of funds both
to continue to raise the quality of higher education; 2) to expand its facilities, and 3) to encourage
students in secondary school to think about a range of post-secondary options including TVET,
teacher training, community colleges, and other training options. While EFA has not yet been
achieved, this fact does not justify delays in investments in the higher levels of education. At the
same time, efforts must be expanded to insure that programs are relevant to employers,
government and business, that they really do meet international standards (as required), and that
student are encouraged to be entrepreneurial so that many of them use the skills, professional
knowledge, and the creativity sparked by education to establish their own businesses and
professions to help fill the many critical needs of Afghanistan with solutions to problems in areas
such as agriculture, engineering, business, finance, mining, and countless others. This requires a
major emphasis on teaching entrepreneurship and encouraging innovation.
Ideally, university and higher education institutional enrolments should not be allowed to grow
more than 10% a year for the foreseeable future. While higher education overall (including TVET,
TTC, and Community Colleges) should continue to admit about 25% of those taking the Kankor, the
enrolment should be directed to TVET and Community Colleges with the biggest slack taken up by
the new Community Colleges which are focused on employment. TVET should become more
oriented to jobs, enforce the limits on movement on to higher education, and significantly improve
quality. TTCs should focus more clearly on teacher training and avoid becoming a way station for
those who want to go on to university education and have no interest in teaching.
Secondary education should also focus more clearly on preparing many of their students for the
workforce with more writing in school, better language skills (including in Dari and Pashtu),
improved math and science skills and an understanding of what students might do for themselves as
entrepreneurs. They should not just look at government for jobs, but look at business, industry,
agriculture, commerce and their own initiatives and creativity.
Security Afghanistan stands second last (157 of 158 countries) according to the 2012 Global Peace Index74,
which ranks countries according to their peacefulness. The index is based on a range of indicators
from a nation’s level of military expenditure to its relations with neighbouring countries and the
level of respect for human rights. The index has been tested against a range of potential “drivers” or
determinants of peace including levels of democracy and transparency, education and national
wellbeing. The MoE has established a Directorate of Security and Protection to raise awareness
about security issues, develop protection systems and coordinate with security institutions, and -
maybe most importantly - mobilize the local community for the protection of schools and students.
The overall political situation, however, remains uncertain. Presidential elections have just been
completed in June 2014 and the so-called “transition”, where the withdrawal of foreign military
troops is being progressively replaced by Afghan National security forces poses a wide range of
challenges and uncertainties for the future.
In this situation, the overall policy and strategic priorities as indicated by the ANDS as well as the
commitments already made to the EFA and MDG goals are expected to remain. How the political
74 Global Peace Index 2012 (web-based), Institute for Economics and Peace
Afghanistan National EFA Review Report, 2015
68
situation will develop, however, and how the population and the market will respond to the new
reality is yet to be seen.
Challenges Post-2015 and Government Priorities
Major emerging development challenges for Afghanistan include a continuously growing demand for
education, not the least at the higher education (HE) level. This is one of the results of the relative
success of the EFA policy in Afghanistan, but due to capacity constraints in HE it also poses an
enormous challenge. This takes place in a volatile political situation in the wake of the 2014
elections; the imminent pull out of international troops, which may cause weakened security and
government control in certain regions. It also includes prospects for reduced economic growth, as
investments are diminishing, partly as a reaction to the latent threat to domestic security. With
possible reductions in foreign aid and reduced domestic resource mobilisation and fiscal revenue,
this is likely to negatively impact on the financing of public expenditure, including education. In
addition to these challenges there is widespread poverty and social exclusion, and a rapidly growing
population.
These challenges will need to be considered when setting government priorities Post 2015
Education has the potential to positively contributing to the creation of a non-violent political
climate, and it is one of the key elements of social and economic development of Afghanistan in the
future.
4. Conclusions and Recommendations
Significant progress since 2001 but problems remain During the last decade, Afghanistan has witnessed an impressive development of the education
sector in its totality. From enrolment of only one million students, mainly boys, in 2001 enrolment
now stands at close to 9 million students, of whom almost 3.4 million are girls. Higher education has
grown from 7,900 students in 2001 to more than 132,000 in 2013.
While significant progress has been made in improving more equitable access to education over the
last decade, and towards achieving the EFA targets, Afghanistan’s point of departure was particularly
unfavourable in comparison with most other countries and massive and committed efforts are
needed to bring Afghanistan closer towards the EFA goal of UPE. The large number of out-of-school
children, the alarmingly low literacy rate and the inequitable distribution of educational provision
together with low security in large parts of the country still constitute significant challenges to the
education system of Afghanistan. In addition, the relative success of the EFA programme has also
led to three major challenges, one has to do with the quality of education, its relevance and
students’ learning achievement, another has to do with the financing of the ever growing number of
students, and the third has to do with absorbing the large number of secondary graduates into the
labour market and higher education institutions.
Large numbers out of school Afghanistan faces severe challenges with regard to expanding access to quality education over the
coming decade. An estimated 3.3 million of primary school-aged children are still out of school.
Enabling greater access will mean reaching children in remote areas, attracting all seven year old
children into the system, re-integrating permanent absentees, providing safe learning spaces, and
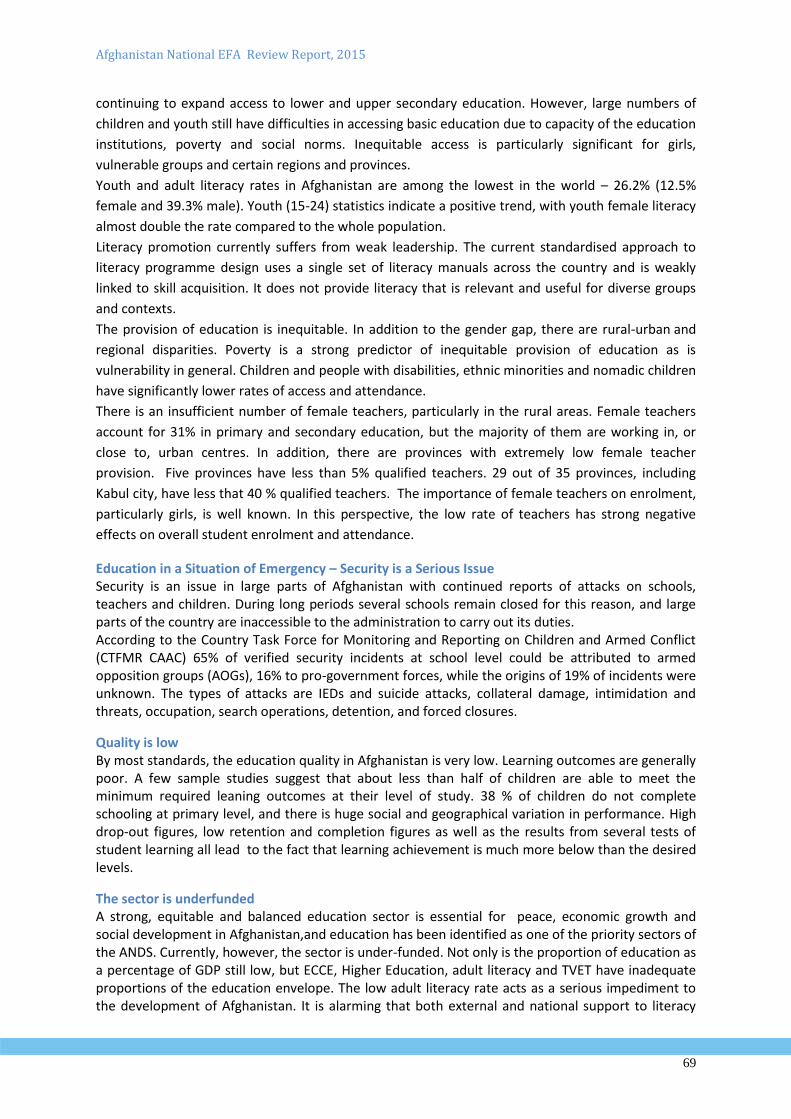
Afghanistan National EFA Review Report, 2015
69
continuing to expand access to lower and upper secondary education. However, large numbers of
children and youth still have difficulties in accessing basic education due to capacity of the education
institutions, poverty and social norms. Inequitable access is particularly significant for girls,
vulnerable groups and certain regions and provinces.
Youth and adult literacy rates in Afghanistan are among the lowest in the world – 26.2% (12.5%
female and 39.3% male). Youth (15-24) statistics indicate a positive trend, with youth female literacy
almost double the rate compared to the whole population.
Literacy promotion currently suffers from weak leadership. The current standardised approach to
literacy programme design uses a single set of literacy manuals across the country and is weakly
linked to skill acquisition. It does not provide literacy that is relevant and useful for diverse groups
and contexts.
The provision of education is inequitable. In addition to the gender gap, there are rural-urban and
regional disparities. Poverty is a strong predictor of inequitable provision of education as is
vulnerability in general. Children and people with disabilities, ethnic minorities and nomadic children
have significantly lower rates of access and attendance.
There is an insufficient number of female teachers, particularly in the rural areas. Female teachers
account for 31% in primary and secondary education, but the majority of them are working in, or
close to, urban centres. In addition, there are provinces with extremely low female teacher
provision. Five provinces have less than 5% qualified teachers. 29 out of 35 provinces, including
Kabul city, have less that 40 % qualified teachers. The importance of female teachers on enrolment,
particularly girls, is well known. In this perspective, the low rate of teachers has strong negative
effects on overall student enrolment and attendance.
Education in a Situation of Emergency – Security is a Serious Issue Security is an issue in large parts of Afghanistan with continued reports of attacks on schools, teachers and children. During long periods several schools remain closed for this reason, and large parts of the country are inaccessible to the administration to carry out its duties. According to the Country Task Force for Monitoring and Reporting on Children and Armed Conflict (CTFMR CAAC) 65% of verified security incidents at school level could be attributed to armed opposition groups (AOGs), 16% to pro-government forces, while the origins of 19% of incidents were unknown. The types of attacks are IEDs and suicide attacks, collateral damage, intimidation and threats, occupation, search operations, detention, and forced closures.
Quality is low By most standards, the education quality in Afghanistan is very low. Learning outcomes are generally poor. A few sample studies suggest that about less than half of children are able to meet the minimum required leaning outcomes at their level of study. 38 % of children do not complete schooling at primary level, and there is huge social and geographical variation in performance. High drop-out figures, low retention and completion figures as well as the results from several tests of student learning all lead to the fact that learning achievement is much more below than the desired levels.
The sector is underfunded A strong, equitable and balanced education sector is essential for peace, economic growth and social development in Afghanistan,and education has been identified as one of the priority sectors of the ANDS. Currently, however, the sector is under-funded. Not only is the proportion of education as a percentage of GDP still low, but ECCE, Higher Education, adult literacy and TVET have inadequate proportions of the education envelope. The low adult literacy rate acts as a serious impediment to the development of Afghanistan. It is alarming that both external and national support to literacy
Afghanistan National EFA Review Report, 2015
70
development is diminishing. Plans to reach up to four million adults with literacy in the coming years would require quadrupling the current expenditure. Evidence from other developing countries suggests that significant gains in educational quality development require determined allocations to education as a proportion of at least 3.5% of GDP. Afghanistan has made significant progress towards this and it is projected to rise even further. In the current situation, however, this may not be sufficient. The current balance of MoE budget allocations is reproductive rather than developmental, with inadequate funding for non-salary costs to maintain quality in learning materials, infrastructure, maintenance and quality control.
The Tidal Wave of Secondary graduates The number of graduates from lower secondary is projected to be more than 1.8 million and the number of upper secondary education graduates more than one million in 2015. By 2020 these numbers are estimated to be more than 3 million lower secondary and 1.3 million higher secondary graduates. Higher Education cannot absorb this increasing number of graduates and neither does the labour market need academic graduates in such large numbers. The economy, however, needs mid-level technicians inter alia for small and medium size enterprises and there is need for a diversity of basic skills for entrepreneurship and for the informal sector as well.
The Sector and MOE needs better Capacity, Managerial Coordination and Vertical Integration The current level of coordination among deputy ministries and different departments is not satisfactory. In addition, there are unclear lines of command and reporting between MOE central level and PED. The MoE is heavily dependent on technical assistants (TAs). Over 1,700 technical assistants are currently hired to build the capacity of civil servants. Many TAs are reported to be leading the MoE’s activities themselves instead of developing the capacity of the civil servants to do the activities.
Recommendations on the Way Forward
Increasing Access Increase access to educationwith almost half of all children out of school, and alarmingly low adult literacy rates, in particular for women, and with a fast growing demand for higher education there is need for focused and concerted efforts to address the situation. Community focus, gender equity and decentralisation are key elements of this. It is recommended to focus on the development of school management and SMCs/shuras in order to improve accountability and raise the demand for education at village level. In addition, a focus on recruiting/training more female teachers and having girls’ only schools, in combination with community-based outreach classes and teachers, as well as community focused school construction are seen as very promising ways to address the problem. At the higher education level, increased financial and administrative decentralization and autonomy are critical. Specific recommendations include: Expand and strengthen community-based education (CBE) to increase access for children in remote areas and for girls, at least in the short-term, with appropriate capacity in the MoE. Expanding the provision of quality community-based education with recognized equivalency would also allow children to (re-) join mainstream education. Strengthen ECCE/ECD as way of investing early in a child’s overall development and to ensure school readiness Conduct a systematic needs assessment and school mapping exercise. This should include the
development of guidelines and educational interventions for vulnerable groups like kuchis, linguistic
minorities, IDPs, and children with special education needs.
Afghanistan National EFA Review Report, 2015
71
Increase access to quality physical learning spaces: the Ministry and its partners must continue to build schools and classrooms, with proper water and sanitation facilities. As part of this effort, consideration should be given to increasing the number of small-scale projects constructed by communities and to provide improved guidance, monitoring and control. Develop a school construction plan for three years: Since the initial survey of construction location, finalizing the building design and procurement is time-consuming for school infrastructural development, the list of priorities for construction of schools should be developed for three years and the priorities should not be allowed to change once the list is finalized. The list of construction priorities should be fixed at least for three years. At the managerial level efforts should be continued to:
Strengthen EMIS to improve planning and decision-making,
Revise the permanent absent policy to improve enrolment data by eliminating over a million
students permanently absent (it is recommended to have a standard definition of dropout that can
be used in the EMIS and household surveys, i.e. clearly stating that after a specific period (e.g. 6
months) a child is deemed as having dropped out and therefore considered as out of school).
Improving Literacy Commitments to literacy should be explicitly included in the National Priority Programmes, by including adult literacy in NPP-2 Education for All (EFA) and increasing the scope of occupational literacy in NPP-1 Sustainable Decent Work. The National Literacy Action Plan 2012-2015 (NLAP) estimates that total fund requirement would be at least US$ 300 million to provide comprehensive literacy combined with vocational training to 2.1 million adults. Financing of NLAP would be from government core funding, grant support from donors, resource support from the corporate sector and community contributions. Adult literacy needs to be seen in a wider context with opportunities both for literacy embedded
with life skills and other skills necessary to improve living conditions, and as a pathway to further
education and lifelong learning.
To address weak leadership a clear strategic direction must be articulated so that stakeholders will share complementary goals and maximise collaboration. Determined organisational restructuring, strong partnership with civil society and inter-ministerial cooperation, capacity building and the allocation of substantively larger budget allocations are needed, if this sub-sector is to realise its huge potential. The LIFE Coordination Group should be further developed at national and provincial levels as an open, inclusive and egalitarian mechanism; an on-going mechanism for consultation, planning and management of joint literacy/skill initiatives should be established between MoE and MoLSAMD. Literacy provision must focus on women, both learners and facilitators, with relevant content and support such as child care arrangements. The relevance of the education offered could be improved through more consultations with the direct beneficiaries, i.e. students and learners, as well as the indirect beneficiaries, i.e. potential employers, families, the community etc. Curriculum reform should be undertaken in formal and non-formal education, to include relevant and useable knowledge that will attract and motivate learners of all ages. The definition of levels of literacy and numeracy competence should be included in the proposed Afghan National Qualifications Framework Monitoring and reporting should be improved by increasing LD capacity to ensure quality of data and improved analysis. In order to strengthen the evidence base for planning literacy, interventions like the the Afghan Literacy Assessment Survey (ALAS) or similar should be funded to a higher level.
Afghanistan National EFA Review Report, 2015
72
Map all literacy stakeholders for their comparative advantage, using the LIFE Coordination Group as an inclusive space for this process. Literacy should be promoted at the community level (e.g. shura, CDC, etc.) to foster ownership such that community leaders and institutions actively support literacy programmes.
Reducing Inequity Continue efforts to increase equity in education: The participation of girls and women in the education system is alarmingly low by all standards. In addition, large proportions of vulnerable groups, including children with disabilities, and certain geographical areas are left out of the education system. In order to inform managerial action, the EMIS must be designed to gauge disparities. It is recommended to introduce a system of GIS-based school mapping based on disaggregated data classified by sex, rural/urban, province/district, private/public, language and ethnicity. In addition, social efforts should be initiated to support and increase the number of female teachers. For students at secondary level and above, dormitories for female students are urgently needed. At the community level, social awareness campaigns on the importance of girls’ education should be launched and routinely applied. As a first step in addressing inequity, a proper mapping based on EMIS data disaggregated by gender, ethnicity, geography, poverty and vulnerability should be developed in order to inform policy and managerial interventions. The provision of education to girls and women needs special attention, and female teachers are a prerequisite to girls’ and women’s access to education and achieving the MDGs. Support for female learners and educators must include safety for women, improved health care, equal employment opportunities for women, good working conditions and skills training. Female leaders and managers should be the object of targeted measures to engage women as head teachers, literacy managers and heads of academic departments.
More Female teachers It is well known that female teachers are essential with regard to increasing overall access to education, in particular for girls. Therefore, it is critical to intensify efforts to increase their number, especially in remote and rural areas. Current teacher hiring practice is too formalistic and acts as an impediment to recruiting additional female teachers. Allowing female secondary students from grade 8 and above to teach in community based schools and classes have generated promising experience. If such teaching practice is combined with accredited in-service training these young female teachers are likely to stay and teach in their own communities, which in the long run would address the rural urban imbalance of female teachers. Other promising interventions include scholarships for girl students at secondary level and above. In addition, well guarded female dormitories and hostels at girls’ only schools and colleges as well as practical and logistical help to their transport between home and school/college has proven to be helpful. Finally, awareness raising campaigns targeted at communities through shuras is seen as a promising intervention.
Improving Security More attention needs to be paid to the identification of peaceful settlement mechanisms of conflicts and disagreements. While overall security and protection is the responsibility of the army and the police, a political approach seeking negotiated settlement of conflicting interests, particularly at the local level, seems to hold significant potential for Afghanistan. The MoE has established a Directorate of Security and Protection to raise awareness about security issues, develop protection systems and coordinate with security institutions, and - maybe most importantly - mobilize the local community for the protection of schools and students. In order to address the security issue, MoE has developed a set of policy guidelines aimed at
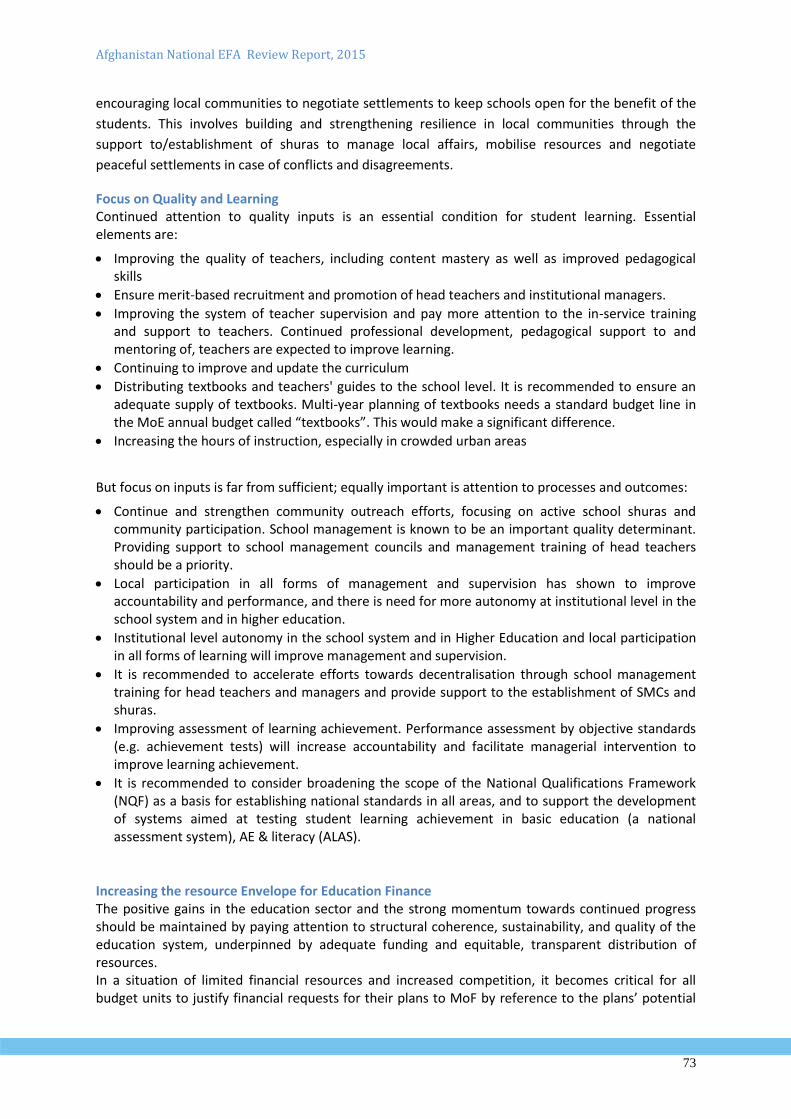
Afghanistan National EFA Review Report, 2015
73
encouraging local communities to negotiate settlements to keep schools open for the benefit of the
students. This involves building and strengthening resilience in local communities through the
support to/establishment of shuras to manage local affairs, mobilise resources and negotiate
peaceful settlements in case of conflicts and disagreements.
Focus on Quality and Learning Continued attention to quality inputs is an essential condition for student learning. Essential elements are:
Improving the quality of teachers, including content mastery as well as improved pedagogical skills
Ensure merit-based recruitment and promotion of head teachers and institutional managers.
Improving the system of teacher supervision and pay more attention to the in-service training and support to teachers. Continued professional development, pedagogical support to and mentoring of, teachers are expected to improve learning.
Continuing to improve and update the curriculum
Distributing textbooks and teachers' guides to the school level. It is recommended to ensure an adequate supply of textbooks. Multi-year planning of textbooks needs a standard budget line in the MoE annual budget called “textbooks”. This would make a significant difference.
Increasing the hours of instruction, especially in crowded urban areas
But focus on inputs is far from sufficient; equally important is attention to processes and outcomes:
Continue and strengthen community outreach efforts, focusing on active school shuras and community participation. School management is known to be an important quality determinant. Providing support to school management councils and management training of head teachers should be a priority.
Local participation in all forms of management and supervision has shown to improve accountability and performance, and there is need for more autonomy at institutional level in the school system and in higher education.
Institutional level autonomy in the school system and in Higher Education and local participation in all forms of learning will improve management and supervision.
It is recommended to accelerate efforts towards decentralisation through school management training for head teachers and managers and provide support to the establishment of SMCs and shuras.
Improving assessment of learning achievement. Performance assessment by objective standards (e.g. achievement tests) will increase accountability and facilitate managerial intervention to improve learning achievement.
It is recommended to consider broadening the scope of the National Qualifications Framework (NQF) as a basis for establishing national standards in all areas, and to support the development of systems aimed at testing student learning achievement in basic education (a national assessment system), AE & literacy (ALAS).
Increasing the resource Envelope for Education Finance The positive gains in the education sector and the strong momentum towards continued progress should be maintained by paying attention to structural coherence, sustainability, and quality of the education system, underpinned by adequate funding and equitable, transparent distribution of resources. In a situation of limited financial resources and increased competition, it becomes critical for all budget units to justify financial requests for their plans to MoF by reference to the plans’ potential
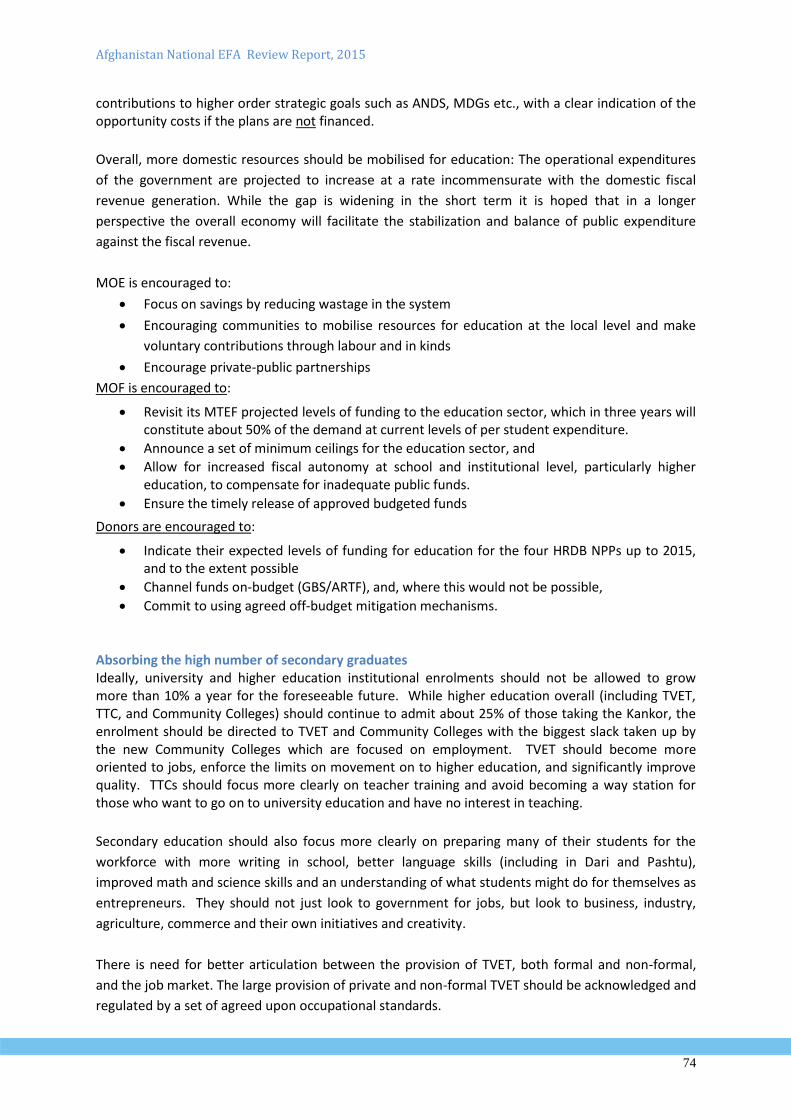
Afghanistan National EFA Review Report, 2015
74
contributions to higher order strategic goals such as ANDS, MDGs etc., with a clear indication of the opportunity costs if the plans are not financed.
Overall, more domestic resources should be mobilised for education: The operational expenditures
of the government are projected to increase at a rate incommensurate with the domestic fiscal
revenue generation. While the gap is widening in the short term it is hoped that in a longer
perspective the overall economy will facilitate the stabilization and balance of public expenditure
against the fiscal revenue.
MOE is encouraged to:
Focus on savings by reducing wastage in the system
Encouraging communities to mobilise resources for education at the local level and make
voluntary contributions through labour and in kinds
Encourage private-public partnerships
MOF is encouraged to:
Revisit its MTEF projected levels of funding to the education sector, which in three years will constitute about 50% of the demand at current levels of per student expenditure.
Announce a set of minimum ceilings for the education sector, and
Allow for increased fiscal autonomy at school and institutional level, particularly higher education, to compensate for inadequate public funds.
Ensure the timely release of approved budgeted funds
Donors are encouraged to:
Indicate their expected levels of funding for education for the four HRDB NPPs up to 2015, and to the extent possible
Channel funds on-budget (GBS/ARTF), and, where this would not be possible,
Commit to using agreed off-budget mitigation mechanisms.
Absorbing the high number of secondary graduates Ideally, university and higher education institutional enrolments should not be allowed to grow more than 10% a year for the foreseeable future. While higher education overall (including TVET, TTC, and Community Colleges) should continue to admit about 25% of those taking the Kankor, the enrolment should be directed to TVET and Community Colleges with the biggest slack taken up by the new Community Colleges which are focused on employment. TVET should become more oriented to jobs, enforce the limits on movement on to higher education, and significantly improve quality. TTCs should focus more clearly on teacher training and avoid becoming a way station for those who want to go on to university education and have no interest in teaching.
Secondary education should also focus more clearly on preparing many of their students for the
workforce with more writing in school, better language skills (including in Dari and Pashtu),
improved math and science skills and an understanding of what students might do for themselves as
entrepreneurs. They should not just look to government for jobs, but look to business, industry,
agriculture, commerce and their own initiatives and creativity.
There is need for better articulation between the provision of TVET, both formal and non-formal,
and the job market. The large provision of private and non-formal TVET should be acknowledged and
regulated by a set of agreed upon occupational standards.
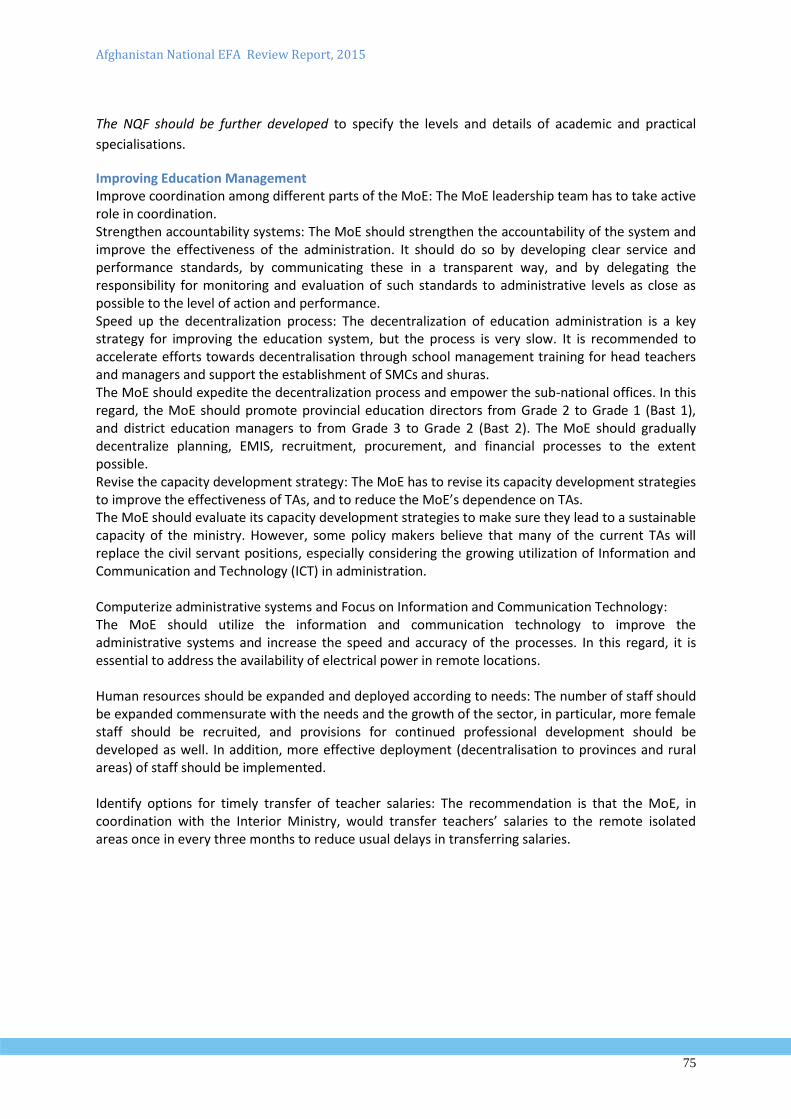
Afghanistan National EFA Review Report, 2015
75
The NQF should be further developed to specify the levels and details of academic and practical
specialisations.
Improving Education Management Improve coordination among different parts of the MoE: The MoE leadership team has to take active role in coordination. Strengthen accountability systems: The MoE should strengthen the accountability of the system and improve the effectiveness of the administration. It should do so by developing clear service and performance standards, by communicating these in a transparent way, and by delegating the responsibility for monitoring and evaluation of such standards to administrative levels as close as possible to the level of action and performance. Speed up the decentralization process: The decentralization of education administration is a key strategy for improving the education system, but the process is very slow. It is recommended to accelerate efforts towards decentralisation through school management training for head teachers and managers and support the establishment of SMCs and shuras. The MoE should expedite the decentralization process and empower the sub-national offices. In this regard, the MoE should promote provincial education directors from Grade 2 to Grade 1 (Bast 1), and district education managers to from Grade 3 to Grade 2 (Bast 2). The MoE should gradually decentralize planning, EMIS, recruitment, procurement, and financial processes to the extent possible. Revise the capacity development strategy: The MoE has to revise its capacity development strategies to improve the effectiveness of TAs, and to reduce the MoE’s dependence on TAs. The MoE should evaluate its capacity development strategies to make sure they lead to a sustainable capacity of the ministry. However, some policy makers believe that many of the current TAs will replace the civil servant positions, especially considering the growing utilization of Information and Communication and Technology (ICT) in administration. Computerize administrative systems and Focus on Information and Communication Technology: The MoE should utilize the information and communication technology to improve the administrative systems and increase the speed and accuracy of the processes. In this regard, it is essential to address the availability of electrical power in remote locations. Human resources should be expanded and deployed according to needs: The number of staff should be expanded commensurate with the needs and the growth of the sector, in particular, more female staff should be recruited, and provisions for continued professional development should be developed as well. In addition, more effective deployment (decentralisation to provinces and rural areas) of staff should be implemented. Identify options for timely transfer of teacher salaries: The recommendation is that the MoE, in coordination with the Interior Ministry, would transfer teachers’ salaries to the remote isolated areas once in every three months to reduce usual delays in transferring salaries.
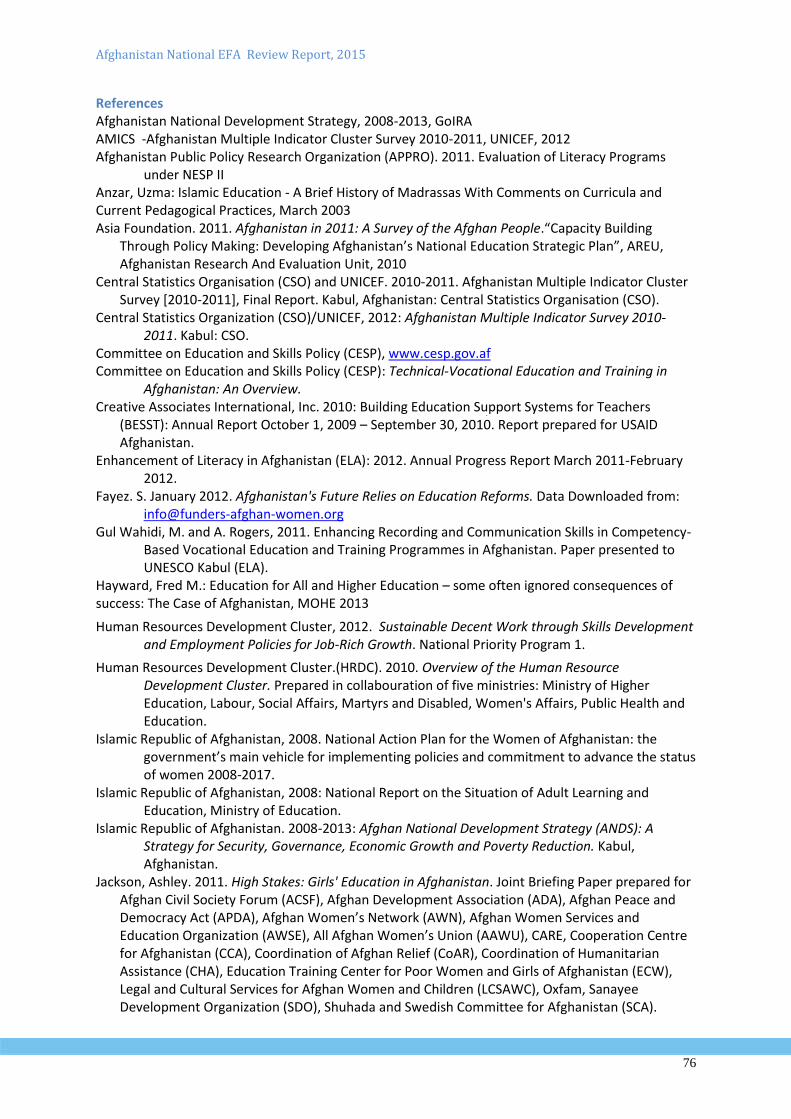
Afghanistan National EFA Review Report, 2015
76
References Afghanistan National Development Strategy, 2008-2013, GoIRA AMICS -Afghanistan Multiple Indicator Cluster Survey 2010-2011, UNICEF, 2012 Afghanistan Public Policy Research Organization (APPRO). 2011. Evaluation of Literacy Programs
under NESP II Anzar, Uzma: Islamic Education - A Brief History of Madrassas With Comments on Curricula and Current Pedagogical Practices, March 2003 Asia Foundation. 2011. Afghanistan in 2011: A Survey of the Afghan People.“Capacity Building
Through Policy Making: Developing Afghanistan’s National Education Strategic Plan”, AREU, Afghanistan Research And Evaluation Unit, 2010
Central Statistics Organisation (CSO) and UNICEF. 2010-2011. Afghanistan Multiple Indicator Cluster Survey [2010-2011], Final Report. Kabul, Afghanistan: Central Statistics Organisation (CSO).
Central Statistics Organization (CSO)/UNICEF, 2012: Afghanistan Multiple Indicator Survey 2010-2011. Kabul: CSO.
Committee on Education and Skills Policy (CESP), www.cesp.gov.af Committee on Education and Skills Policy (CESP): Technical-Vocational Education and Training in
Afghanistan: An Overview. Creative Associates International, Inc. 2010: Building Education Support Systems for Teachers
(BESST): Annual Report October 1, 2009 – September 30, 2010. Report prepared for USAID Afghanistan.
Enhancement of Literacy in Afghanistan (ELA): 2012. Annual Progress Report March 2011-February 2012.
Fayez. S. January 2012. Afghanistan's Future Relies on Education Reforms. Data Downloaded from: [email protected]
Gul Wahidi, M. and A. Rogers, 2011. Enhancing Recording and Communication Skills in Competency-Based Vocational Education and Training Programmes in Afghanistan. Paper presented to UNESCO Kabul (ELA).
Hayward, Fred M.: Education for All and Higher Education – some often ignored consequences of success: The Case of Afghanistan, MOHE 2013
Human Resources Development Cluster, 2012. Sustainable Decent Work through Skills Development and Employment Policies for Job-Rich Growth. National Priority Program 1.
Human Resources Development Cluster.(HRDC). 2010. Overview of the Human Resource Development Cluster. Prepared in collabouration of five ministries: Ministry of Higher Education, Labour, Social Affairs, Martyrs and Disabled, Women's Affairs, Public Health and Education.
Islamic Republic of Afghanistan, 2008. National Action Plan for the Women of Afghanistan: the government’s main vehicle for implementing policies and commitment to advance the status of women 2008-2017.
Islamic Republic of Afghanistan, 2008: National Report on the Situation of Adult Learning and Education, Ministry of Education.
Islamic Republic of Afghanistan. 2008-2013: Afghan National Development Strategy (ANDS): A Strategy for Security, Governance, Economic Growth and Poverty Reduction. Kabul, Afghanistan.
Jackson, Ashley. 2011. High Stakes: Girls' Education in Afghanistan. Joint Briefing Paper prepared for Afghan Civil Society Forum (ACSF), Afghan Development Association (ADA), Afghan Peace and Democracy Act (APDA), Afghan Women’s Network (AWN), Afghan Women Services and Education Organization (AWSE), All Afghan Women’s Union (AAWU), CARE, Cooperation Centre for Afghanistan (CCA), Coordination of Afghan Relief (CoAR), Coordination of Humanitarian Assistance (CHA), Education Training Center for Poor Women and Girls of Afghanistan (ECW), Legal and Cultural Services for Afghan Women and Children (LCSAWC), Oxfam, Sanayee Development Organization (SDO), Shuhada and Swedish Committee for Afghanistan (SCA).
Afghanistan National EFA Review Report, 2015
77
JICA. 2011. The Project on Improvement of Literacy Education Management in Afghanistan (LEAF2). 1st Year Work Completion Report.
JICA. 2012. The Project on Improvement of Literacy Education Management in Afghanistan (LEAF2). Progress Report – 2, May 2012.
Karlsson, Pia & Amir Mansory : Islamic and Modern Education in Afghanistan - Conflictual or Complementary? Institute of International Education Stockholm University
Literacy Initiative for Empowerment (LIFE), 2008. Where Literacy Stands. Needs Assessment Report for the Islamic Republic of Afghanistan.
Mansory, Amir with Susan Wardak and Gul Mohammad Gulzai. 2011. A study of the DT3 program - Teaching quality and students’ learning achievements. Mimeo.
Matsumoto, Y. 2011. UNESCO Kabul’s capacity development work in literacy: an irreconcilable dilemma? In Sigsgaard, M. (ed). 2011. On the road to resilience: capacity development with the Ministry of Education in Afghanistan. Paris: International Institute for Educational Planning.
Ministry of Education (MoE), www.moe.gov.af Ministry of Education, Afghanistan. Introduction of Technical and Vocational Education in
Afghanistan: Development Project in TVET Sector, 2012-2012. Ministry of Education, Afghanistan. National Education Interim Plan, 2011-2013 Ministry of Education: 1387/2008. Education Law. Ministry of Education: 2010. National Education Strategic Plan (NESP) 2010-2014, Department of
Planning and Evaluation. Ministry of Education: 2013. National Education Strategic Plan (NESP III) 2014-2019., Department of
Planning and Evaluation. Ministry of Education, 2011: Afghanistan Education for All National Monitoring Report, 2011.
Ministry of Education, 2011: 1389/2010 Annual Progress Report, Kabul. Ministry of Education.2011. Country Presentation Afghanistan: Summary Documentation.
Presentation prepared for the Global Partnership for Education. Ministry of Education, 2011. Education for All. National Priority Program 2 Ministry of Education,,2011. Proposal to the Global Partnership for Education (GPE) for a Catalytic
Contribution Towards Implementation of Afghanistan’s Education Interim Plan (NEIP). Mimeo. Ministry of Education. 2012. 1390/2011 Annual Progress Report. Kabul. Ministry of Education. 2012. Education Quality Improvement Program (EQUIP) Semi Annual
Narrative Progress Report, July 1st, 2011 till December 31st, 2011. Mimeo. Ministry of Education/Literacy Department. 2008. Literacy - Tool for Sustainable Development and
Key to Lifelong Learning. Afghanistan National Literacy Action Plan 1389- 1393 [2010 – 14]. Ministry of Finance. National Priority Programs. http://mof.gov.af/en/page/3976
http://mof.gov.af/en/page/3976 accessed 22 May 2012accessed 22 May 2012. Ministry of Labour, Social Affairs, Martyrs and Disabled, Afghanistan. 2011 Progress Report. Ministry of Labour, Social Affairs, Martyrs and Disabled, Afghanistan. Strategic Plan, 2012-2014
(draft). Ministry of Labour, Social Affairs, Martyrs and Disabled, Afghanistan, National Skills Development
Program (NSDP). May 2009. Baseline Data for the Quality of TVET Provision in Afghanistan. Ministry of Labour, Social Affairs, Martyrs and Disabled, Afghanistan, National Skills Development
Program (NSDP). NSDP 2011 Progress Report. Ministry of Labour, Social Affairs, Martyrs and Disabled, Afghanistan. 31 May 2007. National Skills
Development Program Strategy for the Afghanistan National Development Strategy. Ministry of Labour, Social Affairs, Martyrs and Disabled, National Skills Development Program
(NSDP), Ministry of Education, Afghanistan, Canadian International Development Agency (CIDA), Deutsche Gesellschaft für Internationale Zusammenarbeit (GIZ). 7-9 May 2012. First National TVET Exhibition (brochure)
Afghanistan National EFA Review Report, 2015
78
Ministry of Labour, Social Affairs, Martyrs & Disabled. Committee on Education and Skills Policy. Submitted by Committee on Education and Skills Policy. Kabul, Afghanistan.
Ministry of Labour, Social Affairs, Martyrs & Disabled. February 2011. Output 1 Draft Structure and Model of Qualifications Framework (ANQF) for Afghanistan. Submitted by CINOP Advies B.V. Project: VPO/CESP/949/FBS. Kabul, Afghanistan.
Ministry of Labour, Social Affairs, Martyrs & Disabled. June 2011. Meeting Minutes of Committee on Education and Skills Policy-Afghanistan National Qualifications Framework and Learning Outcomes. Prepared by Technical Advisory Group. Kabul, Afghanistan.
National Literacy Action Plan 2012-2015, Literacy Department, MOE National Skills Development Program (NSDP), www.nsdp.gov.af National TVET Strategy, MOE and MOLSAMD, 2013
NRVA. 2005. National Risk and Vulnerability Assessment 2005. Ministry of Rehabilitation and Development and the Central Statistics Office, Kabul.
NRVA. 2009. National Risk and Vulnerability Assessment 2007/8: A profile of Afghanistan. Kabul: ICON INSTITUTE GmbH & Co. KG Consulting Group.
NRVA. 2013, National Risk and Vulnerability Assessment 2011/12: A Survey of the Afghan People. CSO, Kabul
Packer, Steve, Terry Allsop, Elizabeth Dvorak-Little, Tony Preston Stanley and Anders Wirak, 2010. Education Sector Analysis Afghanistan 2010. prepared for Adam Smith International.
Rogers, A. 2011. Afghanistan Mission August-September 2011: Vocational Skills Training and Literacy.
Sachsse, Michael. 26 August 2010. Towards a Viable National Vocational Education and Training System.
Save the Children: Study on Early Childhood Programmes in Afghanistan, 2013 Schur, W. 2011. New Skills for Afghanistan: A Contribution to Individual Empowerment, Community
and Civil Society Development and Stability in Afghanistan. Adult Education and Development 77 (Supplement):15-28.
Teacher Education Department of the Ministry of Education. 2012. Semi-Annual Progress Report. Mimeo.
U.S. Census Bureau, International Data Base. 2011. Data downloaded from: http://www.census.gov/idb/country.php. UNDP: Human Development Report 2013
UNESCO. 2004. The Plurality of Literacy and its implications for policies and programmes. [Education Sector Position Paper ]. Paris: UNESCO.
UNESCO. 2005. Aspects of Literacy Assessment: Topics and issues from the UNESCO Expert Meeting, 10-12 June, 2003
UNESCO Bangkok and UNICEF. 2013. Asia-Pacific End of Decade Notes on Education for All: EFA Goal 2, Universal Primary Education. Bangkok: UNESCO.
UNESCO. 2005. Literacy for Life. EFA Global Monitoring Report 2006. Paris: UNESCO. UNESCO. s.d. ‘Literacy for Empowering Afghan Police’ (LEAP). Concept Note. UNESCO? National Technical and Vocational Education and Training (TVET) Strategy for Afghanistan:
The needs of tomorrow’s workforce, 2012-2017 (draft). UNESCO?. s.d. Establishing Community Colleges in Afghanistan: Executive Summary (draft). USAID. 2010. Institutional Analysis of the National Literacy Center. Learning for Community
Empowerment Programme-2. Kabul: UN Habitat. Wageningen UR Centre for Development Innovation and People in Need. 23 September 2011.
Agricultural TVET: Improving Agricultural Education in Afghanistan. World Bank. 2011. Second Education Quality Improvement Programme (EQUIP II) Implementation
Mission Review: Aide Memoire. Mimeo. World Bank. 2012. Afghanistan in Transition: Looking beyond 2014. Kabul: World Bank. World Bank. 2012. World Development Indicators. Database online. Data downloaded from:
http://data.worldbank.org/data-catalog/world-development-indicators.
Afghanistan National EFA Review Report, 2015
79
5. Annexes
Goal 1 Expanding ECCE (Early Childhood Care and Education) 1.1. Gross Enrolment Ratio (GER) in pre-primary education and other ECCE programs by sex It is estimated that around 2.6 million children are at age 4-6 in Afghanistan in 2013 while in 2000 it was 1.7 million. Children age 0-6 constitute 10.2% of total settled population (25.5 million) of the state in 2013. The total number of students/child in pre-school programs is 40 thousands (60% girls) and including the number of children learning in mosques it becomes 1.2 million in 2013. The current Gross Enrolment Ratio in pre-primary education stood at 1.6% in 2013 (boys 1.9%/girls 1.1%). Noteworthy, the number of children in ECCE programs has increased 7- fold between 2003 and 2013. Despite the low gross enrolment in pre-primary the number of students has significantly increased. 1.2. Percentage of new entrants to primary Grade 1 who have attended some form of organized ECCE program, by sex Data is not available. 1.3. Enrolment in private pre-primary education and other private ECCE programs as a percentage of total enrolment in pre-primary education and other ECCE programs (in main report) 1.4. Percentage of trained teachers in pre-primary education and other ECCE programs with required academic qualifications to teach at pre-primary education and/or ECCE according to national standards, by sex The figures from NGOs show that in terms of qualification most of teachers/caregivers (99%) are below grade 12. The majority of ECCE teachers, however, received some form of training 97% in 2012 and 99% in 2013, (source: Save the Children). The training was short term on pedagogical aspects on how to master and manage groups and basic care-givers techniques. Almost all ECCE teachers/care givers are female. 1.5. Public expenditure on pre-primary education and other ECCE programs as a percentage of total public expenditure on education It is estimated that almost 1,305,000 USD was spent in pre-primary programs in 2013. This amount only describes expenditure made by NGOs and private providers. It constitutes 0.3% of total MoE expenditure on education. MoLSAMD75 has a budget allocation for care and education of children of 0-5 years old, and Ministry of Haj spends a portion of budget on education of children age below 7 years. The review report, however, has not been able to obtain these expenditures. 1.6. Pupil/Teacher Ratio (PTR) in pre-primary education (and/or Children-Caregiver Ratio in early childhood care programs) On average the pupil teacher ratio in pre-primary programs was 22:1 in 2013. Most of the pre-primary teachers are female and only 2% are male. The reasons could be explained: 1) teachers in these programs are seen as caregivers and this is perceived as a female job; 2) the payment is low and males could easily access higher paid jobs; 3) most ECCE programs have tried to improve female employment.
Goal 2 Universalization of primary/basic education 2.1. Gross Intake Rate (GIR) in primary education, by sex
75
Ministry of Labour, Social Affairs, Martyrs and Disabled
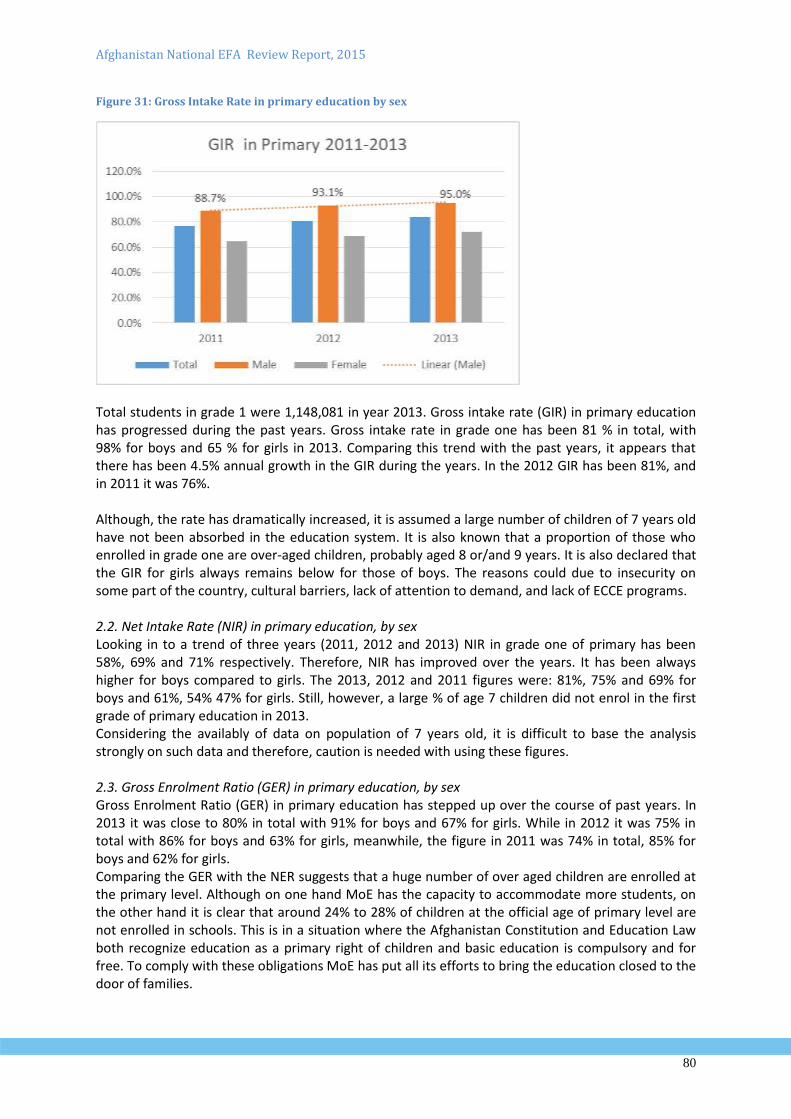
Afghanistan National EFA Review Report, 2015
80
Figure 31: Gross Intake Rate in primary education by sex
Total students in grade 1 were 1,148,081 in year 2013. Gross intake rate (GIR) in primary education has progressed during the past years. Gross intake rate in grade one has been 81 % in total, with 98% for boys and 65 % for girls in 2013. Comparing this trend with the past years, it appears that there has been 4.5% annual growth in the GIR during the years. In the 2012 GIR has been 81%, and in 2011 it was 76%. Although, the rate has dramatically increased, it is assumed a large number of children of 7 years old have not been absorbed in the education system. It is also known that a proportion of those who enrolled in grade one are over-aged children, probably aged 8 or/and 9 years. It is also declared that the GIR for girls always remains below for those of boys. The reasons could due to insecurity on some part of the country, cultural barriers, lack of attention to demand, and lack of ECCE programs. 2.2. Net Intake Rate (NIR) in primary education, by sex Looking in to a trend of three years (2011, 2012 and 2013) NIR in grade one of primary has been 58%, 69% and 71% respectively. Therefore, NIR has improved over the years. It has been always higher for boys compared to girls. The 2013, 2012 and 2011 figures were: 81%, 75% and 69% for boys and 61%, 54% 47% for girls. Still, however, a large % of age 7 children did not enrol in the first grade of primary education in 2013. Considering the availably of data on population of 7 years old, it is difficult to base the analysis strongly on such data and therefore, caution is needed with using these figures. 2.3. Gross Enrolment Ratio (GER) in primary education, by sex Gross Enrolment Ratio (GER) in primary education has stepped up over the course of past years. In 2013 it was close to 80% in total with 91% for boys and 67% for girls. While in 2012 it was 75% in total with 86% for boys and 63% for girls, meanwhile, the figure in 2011 was 74% in total, 85% for boys and 62% for girls. Comparing the GER with the NER suggests that a huge number of over aged children are enrolled at the primary level. Although on one hand MoE has the capacity to accommodate more students, on the other hand it is clear that around 24% to 28% of children at the official age of primary level are not enrolled in schools. This is in a situation where the Afghanistan Constitution and Education Law both recognize education as a primary right of children and basic education is compulsory and for free. To comply with these obligations MoE has put all its efforts to bring the education closed to the door of families.
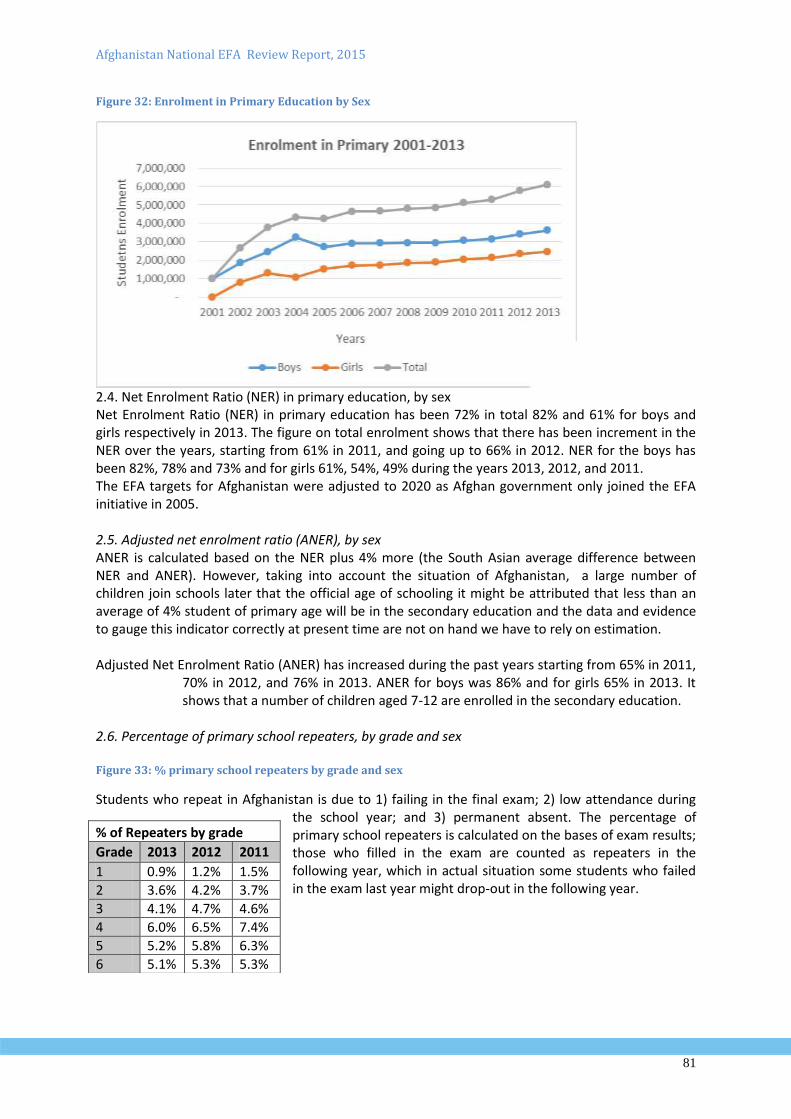
Afghanistan National EFA Review Report, 2015
81
Figure 32: Enrolment in Primary Education by Sex
2.4. Net Enrolment Ratio (NER) in primary education, by sex Net Enrolment Ratio (NER) in primary education has been 72% in total 82% and 61% for boys and girls respectively in 2013. The figure on total enrolment shows that there has been increment in the NER over the years, starting from 61% in 2011, and going up to 66% in 2012. NER for the boys has been 82%, 78% and 73% and for girls 61%, 54%, 49% during the years 2013, 2012, and 2011. The EFA targets for Afghanistan were adjusted to 2020 as Afghan government only joined the EFA initiative in 2005. 2.5. Adjusted net enrolment ratio (ANER), by sex ANER is calculated based on the NER plus 4% more (the South Asian average difference between NER and ANER). However, taking into account the situation of Afghanistan, a large number of children join schools later that the official age of schooling it might be attributed that less than an average of 4% student of primary age will be in the secondary education and the data and evidence to gauge this indicator correctly at present time are not on hand we have to rely on estimation. Adjusted Net Enrolment Ratio (ANER) has increased during the past years starting from 65% in 2011,
70% in 2012, and 76% in 2013. ANER for boys was 86% and for girls 65% in 2013. It shows that a number of children aged 7-12 are enrolled in the secondary education.
2.6. Percentage of primary school repeaters, by grade and sex Figure 33: % primary school repeaters by grade and sex
Students who repeat in Afghanistan is due to 1) failing in the final exam; 2) low attendance during the school year; and 3) permanent absent. The percentage of primary school repeaters is calculated on the bases of exam results; those who filled in the exam are counted as repeaters in the following year, which in actual situation some students who failed in the exam last year might drop-out in the following year.
% of Repeaters by grade
Grade 2013 2012 2011
1 0.9% 1.2% 1.5%
2 3.6% 4.2% 3.7%
3 4.1% 4.7% 4.6%
4 6.0% 6.5% 7.4%
5 5.2% 5.8% 6.3%
6 5.1% 5.3% 5.3%
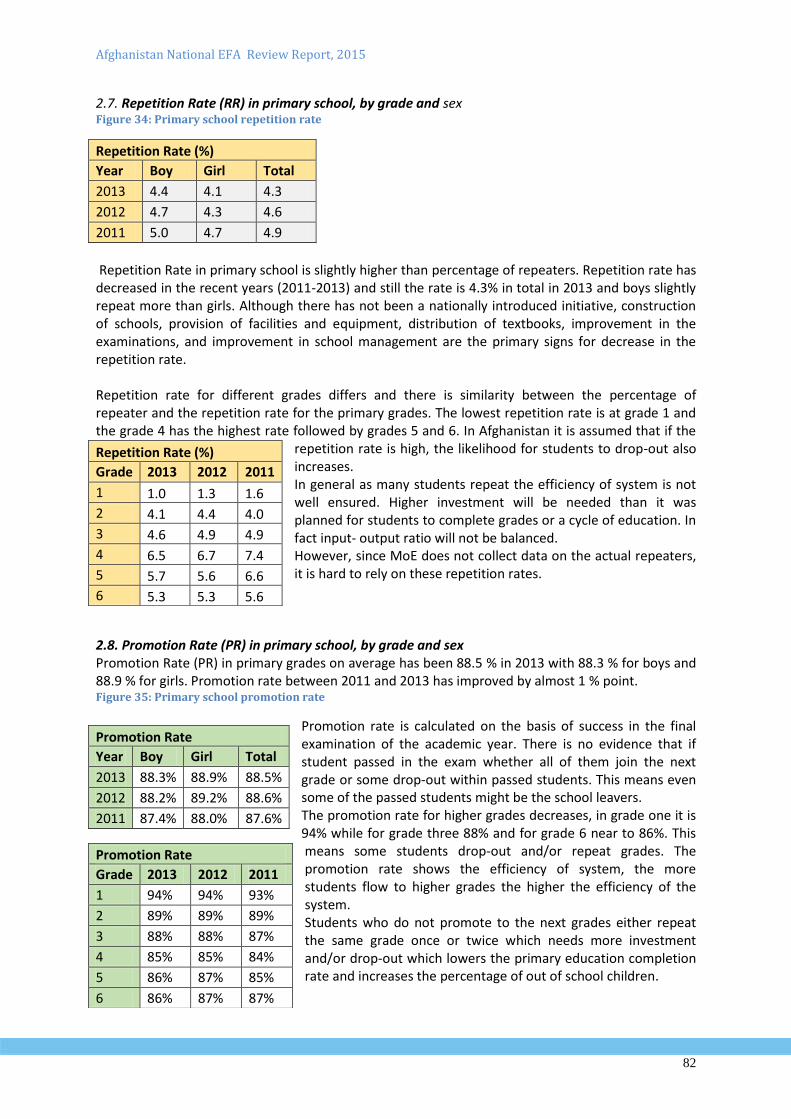
Afghanistan National EFA Review Report, 2015
82
2.7. Repetition Rate (RR) in primary school, by grade and sex Figure 34: Primary school repetition rate
Repetition Rate (%)
Year Boy Girl Total
2013 4.4 4.1 4.3
2012 4.7 4.3 4.6
2011 5.0 4.7 4.9
Repetition Rate in primary school is slightly higher than percentage of repeaters. Repetition rate has decreased in the recent years (2011-2013) and still the rate is 4.3% in total in 2013 and boys slightly repeat more than girls. Although there has not been a nationally introduced initiative, construction of schools, provision of facilities and equipment, distribution of textbooks, improvement in the examinations, and improvement in school management are the primary signs for decrease in the repetition rate. Repetition rate for different grades differs and there is similarity between the percentage of repeater and the repetition rate for the primary grades. The lowest repetition rate is at grade 1 and the grade 4 has the highest rate followed by grades 5 and 6. In Afghanistan it is assumed that if the
repetition rate is high, the likelihood for students to drop-out also increases. In general as many students repeat the efficiency of system is not well ensured. Higher investment will be needed than it was planned for students to complete grades or a cycle of education. In fact input- output ratio will not be balanced. However, since MoE does not collect data on the actual repeaters, it is hard to rely on these repetition rates.
2.8. Promotion Rate (PR) in primary school, by grade and sex Promotion Rate (PR) in primary grades on average has been 88.5 % in 2013 with 88.3 % for boys and 88.9 % for girls. Promotion rate between 2011 and 2013 has improved by almost 1 % point. Figure 35: Primary school promotion rate
Promotion rate is calculated on the basis of success in the final examination of the academic year. There is no evidence that if student passed in the exam whether all of them join the next grade or some drop-out within passed students. This means even some of the passed students might be the school leavers. The promotion rate for higher grades decreases, in grade one it is 94% while for grade three 88% and for grade 6 near to 86%. This means some students drop-out and/or repeat grades. The promotion rate shows the efficiency of system, the more students flow to higher grades the higher the efficiency of the system. Students who do not promote to the next grades either repeat the same grade once or twice which needs more investment and/or drop-out which lowers the primary education completion rate and increases the percentage of out of school children.
Repetition Rate (%)
Grade 2013 2012 2011
1 1.0 1.3 1.6
2 4.1 4.4 4.0
3 4.6 4.9 4.9
4 6.5 6.7 7.4
5 5.7 5.6 6.6
6 5.3 5.3 5.6
Promotion Rate
Year Boy Girl Total
2013 88.3% 88.9% 88.5%
2012 88.2% 89.2% 88.6%
2011 87.4% 88.0% 87.6%
Promotion Rate
Grade 2013 2012 2011
1 94% 94% 93%
2 89% 89% 89%
3 88% 88% 87%
4 85% 85% 84%
5 86% 87% 85%
6 86% 87% 87%
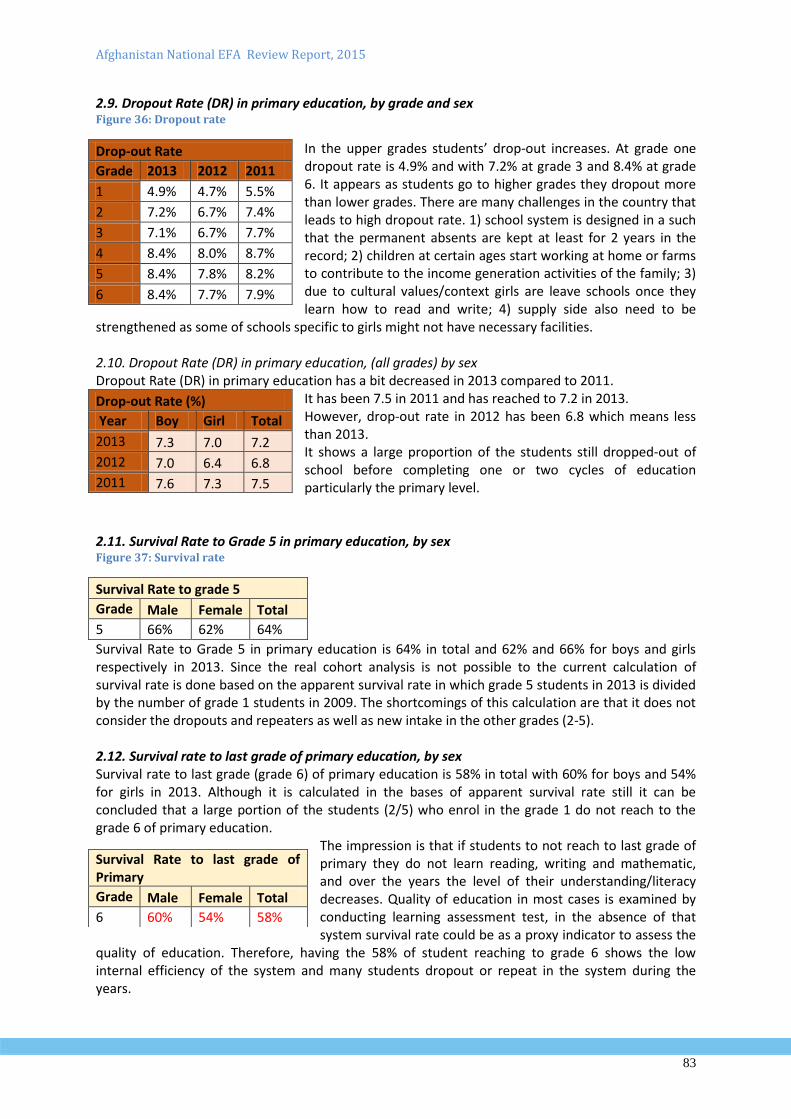
Afghanistan National EFA Review Report, 2015
83
2.9. Dropout Rate (DR) in primary education, by grade and sex Figure 36: Dropout rate
In the upper grades students’ drop-out increases. At grade one dropout rate is 4.9% and with 7.2% at grade 3 and 8.4% at grade 6. It appears as students go to higher grades they dropout more than lower grades. There are many challenges in the country that leads to high dropout rate. 1) school system is designed in a such that the permanent absents are kept at least for 2 years in the record; 2) children at certain ages start working at home or farms to contribute to the income generation activities of the family; 3) due to cultural values/context girls are leave schools once they learn how to read and write; 4) supply side also need to be
strengthened as some of schools specific to girls might not have necessary facilities. 2.10. Dropout Rate (DR) in primary education, (all grades) by sex Dropout Rate (DR) in primary education has a bit decreased in 2013 compared to 2011.
It has been 7.5 in 2011 and has reached to 7.2 in 2013. However, drop-out rate in 2012 has been 6.8 which means less than 2013. It shows a large proportion of the students still dropped-out of school before completing one or two cycles of education particularly the primary level.
2.11. Survival Rate to Grade 5 in primary education, by sex Figure 37: Survival rate
Survival Rate to grade 5
Grade Male Female Total
5 66% 62% 64%
Survival Rate to Grade 5 in primary education is 64% in total and 62% and 66% for boys and girls respectively in 2013. Since the real cohort analysis is not possible to the current calculation of survival rate is done based on the apparent survival rate in which grade 5 students in 2013 is divided by the number of grade 1 students in 2009. The shortcomings of this calculation are that it does not consider the dropouts and repeaters as well as new intake in the other grades (2-5). 2.12. Survival rate to last grade of primary education, by sex Survival rate to last grade (grade 6) of primary education is 58% in total with 60% for boys and 54% for girls in 2013. Although it is calculated in the bases of apparent survival rate still it can be concluded that a large portion of the students (2/5) who enrol in the grade 1 do not reach to the grade 6 of primary education.
The impression is that if students to not reach to last grade of primary they do not learn reading, writing and mathematic, and over the years the level of their understanding/literacy decreases. Quality of education in most cases is examined by conducting learning assessment test, in the absence of that system survival rate could be as a proxy indicator to assess the
quality of education. Therefore, having the 58% of student reaching to grade 6 shows the low internal efficiency of the system and many students dropout or repeat in the system during the years.
Drop-out Rate
Grade 2013 2012 2011
1 4.9% 4.7% 5.5%
2 7.2% 6.7% 7.4%
3 7.1% 6.7% 7.7%
4 8.4% 8.0% 8.7%
5 8.4% 7.8% 8.2%
6 8.4% 7.7% 7.9%
Drop-out Rate (%)
Year Boy Girl Total
2013 7.3 7.0 7.2
2012 7.0 6.4 6.8
2011 7.6 7.3 7.5
Survival Rate to last grade of Primary
Grade Male Female Total
6 60% 54% 58%
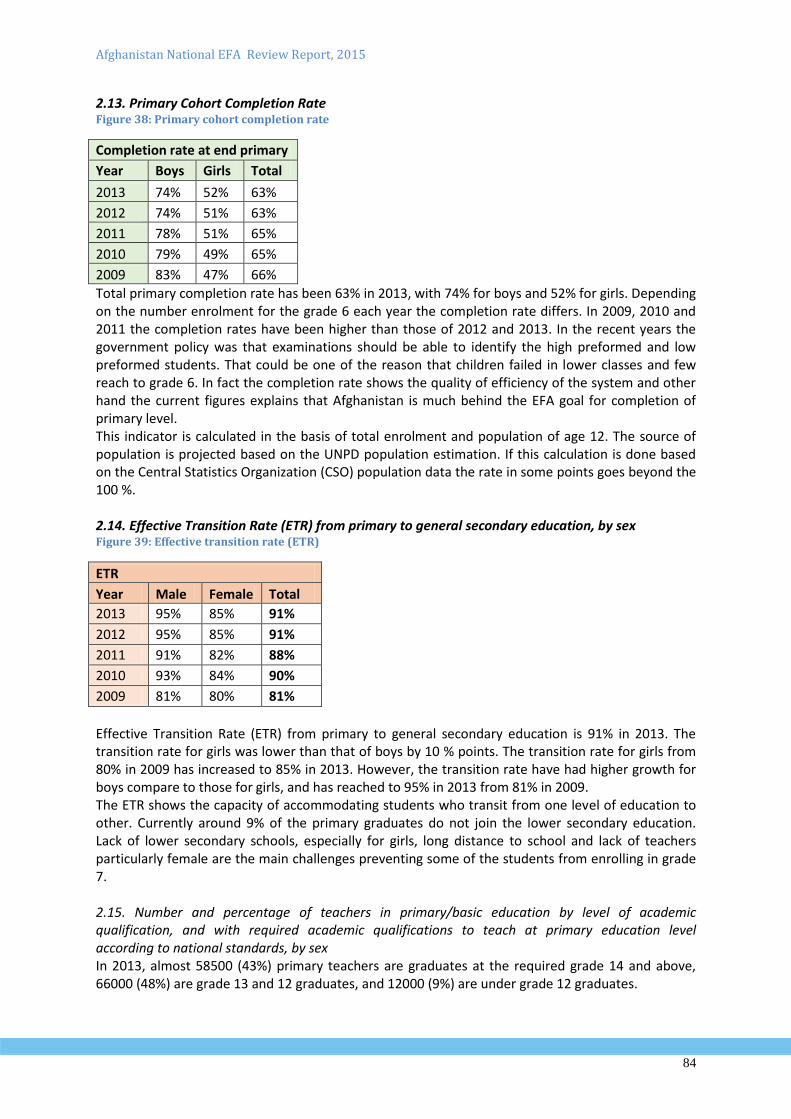
Afghanistan National EFA Review Report, 2015
84
2.13. Primary Cohort Completion Rate Figure 38: Primary cohort completion rate
Completion rate at end primary
Year Boys Girls Total
2013 74% 52% 63%
2012 74% 51% 63%
2011 78% 51% 65%
2010 79% 49% 65%
2009 83% 47% 66%
Total primary completion rate has been 63% in 2013, with 74% for boys and 52% for girls. Depending on the number enrolment for the grade 6 each year the completion rate differs. In 2009, 2010 and 2011 the completion rates have been higher than those of 2012 and 2013. In the recent years the government policy was that examinations should be able to identify the high preformed and low preformed students. That could be one of the reason that children failed in lower classes and few reach to grade 6. In fact the completion rate shows the quality of efficiency of the system and other hand the current figures explains that Afghanistan is much behind the EFA goal for completion of primary level. This indicator is calculated in the basis of total enrolment and population of age 12. The source of population is projected based on the UNPD population estimation. If this calculation is done based on the Central Statistics Organization (CSO) population data the rate in some points goes beyond the 100 %. 2.14. Effective Transition Rate (ETR) from primary to general secondary education, by sex Figure 39: Effective transition rate (ETR)
ETR
Year Male Female Total
2013 95% 85% 91%
2012 95% 85% 91%
2011 91% 82% 88%
2010 93% 84% 90%
2009 81% 80% 81%
Effective Transition Rate (ETR) from primary to general secondary education is 91% in 2013. The transition rate for girls was lower than that of boys by 10 % points. The transition rate for girls from 80% in 2009 has increased to 85% in 2013. However, the transition rate have had higher growth for boys compare to those for girls, and has reached to 95% in 2013 from 81% in 2009. The ETR shows the capacity of accommodating students who transit from one level of education to other. Currently around 9% of the primary graduates do not join the lower secondary education. Lack of lower secondary schools, especially for girls, long distance to school and lack of teachers particularly female are the main challenges preventing some of the students from enrolling in grade 7. 2.15. Number and percentage of teachers in primary/basic education by level of academic qualification, and with required academic qualifications to teach at primary education level according to national standards, by sex In 2013, almost 58500 (43%) primary teachers are graduates at the required grade 14 and above, 66000 (48%) are grade 13 and 12 graduates, and 12000 (9%) are under grade 12 graduates.
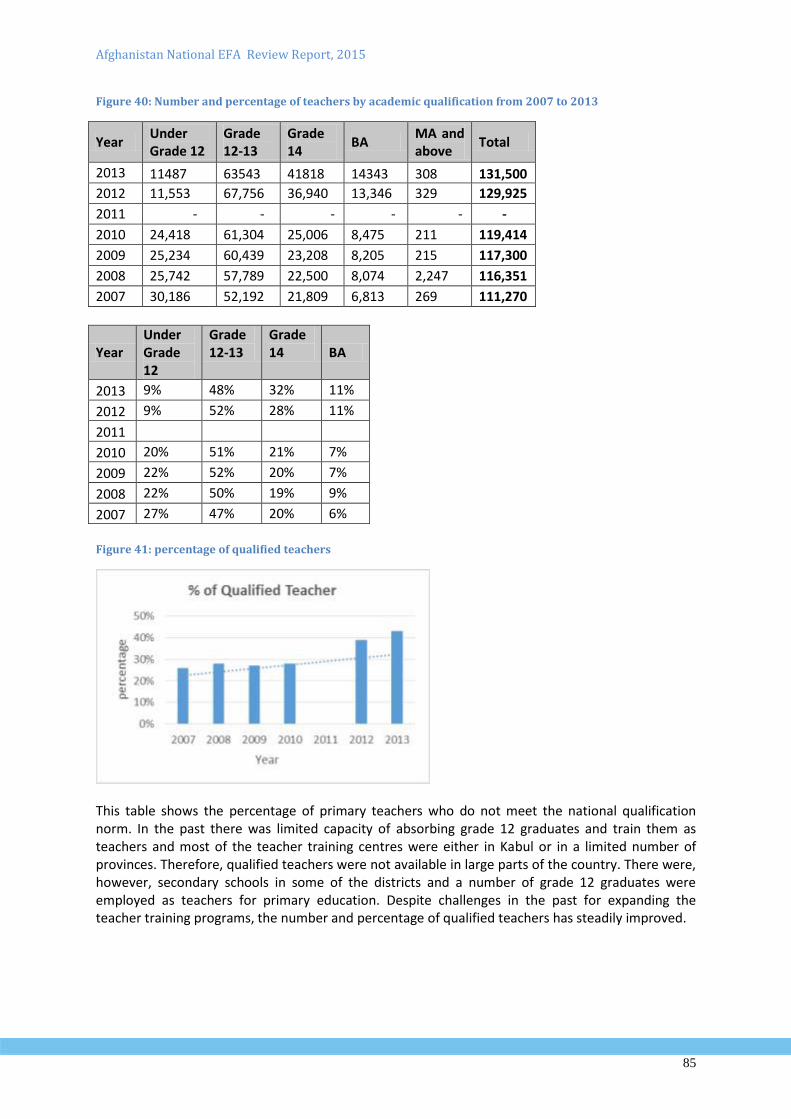
Afghanistan National EFA Review Report, 2015
85
Figure 40: Number and percentage of teachers by academic qualification from 2007 to 2013
Year Under Grade 12
Grade 12-13
Grade 14
BA MA and above
Total
2013 11487 63543 41818 14343 308 131,500
2012 11,553 67,756 36,940 13,346 329 129,925
2011 - - - - - -
2010 24,418 61,304 25,006 8,475 211 119,414
2009 25,234 60,439 23,208 8,205 215 117,300
2008 25,742 57,789 22,500 8,074 2,247 116,351
2007 30,186 52,192 21,809 6,813 269 111,270
Year Under Grade 12
Grade 12-13
Grade 14 BA
2013 9% 48% 32% 11%
2012 9% 52% 28% 11%
2011
2010 20% 51% 21% 7%
2009 22% 52% 20% 7%
2008 22% 50% 19% 9%
2007 27% 47% 20% 6%
Figure 41: percentage of qualified teachers
This table shows the percentage of primary teachers who do not meet the national qualification norm. In the past there was limited capacity of absorbing grade 12 graduates and train them as teachers and most of the teacher training centres were either in Kabul or in a limited number of provinces. Therefore, qualified teachers were not available in large parts of the country. There were, however, secondary schools in some of the districts and a number of grade 12 graduates were employed as teachers for primary education. Despite challenges in the past for expanding the teacher training programs, the number and percentage of qualified teachers has steadily improved.
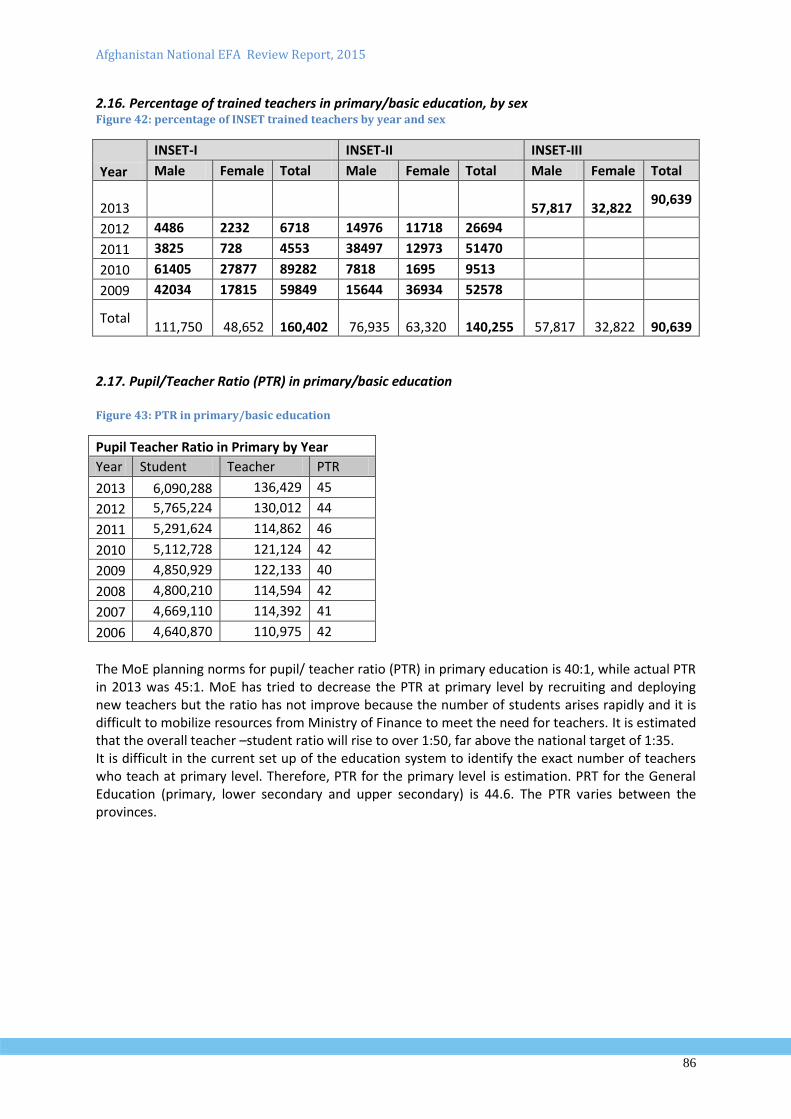
Afghanistan National EFA Review Report, 2015
86
2.16. Percentage of trained teachers in primary/basic education, by sex Figure 42: percentage of INSET trained teachers by year and sex
Year
INSET-I INSET-II INSET-III
Male Female Total Male Female Total Male Female Total
2013
57,817
32,822
90,639
2012 4486 2232 6718 14976 11718 26694
2011 3825 728 4553 38497 12973 51470
2010 61405 27877 89282 7818 1695 9513
2009 42034 17815 59849 15644 36934 52578
Total 111,750 48,652
160,402 76,935
63,320
140,255 57,817 32,822
90,639
2.17. Pupil/Teacher Ratio (PTR) in primary/basic education Figure 43: PTR in primary/basic education
Pupil Teacher Ratio in Primary by Year
Year Student Teacher PTR
2013 6,090,288 136,429 45
2012 5,765,224 130,012 44
2011 5,291,624 114,862 46
2010 5,112,728 121,124 42
2009 4,850,929 122,133 40
2008 4,800,210 114,594 42
2007 4,669,110 114,392 41
2006 4,640,870 110,975 42
The MoE planning norms for pupil/ teacher ratio (PTR) in primary education is 40:1, while actual PTR in 2013 was 45:1. MoE has tried to decrease the PTR at primary level by recruiting and deploying new teachers but the ratio has not improve because the number of students arises rapidly and it is difficult to mobilize resources from Ministry of Finance to meet the need for teachers. It is estimated that the overall teacher –student ratio will rise to over 1:50, far above the national target of 1:35. It is difficult in the current set up of the education system to identify the exact number of teachers who teach at primary level. Therefore, PTR for the primary level is estimation. PRT for the General Education (primary, lower secondary and upper secondary) is 44.6. The PTR varies between the provinces.
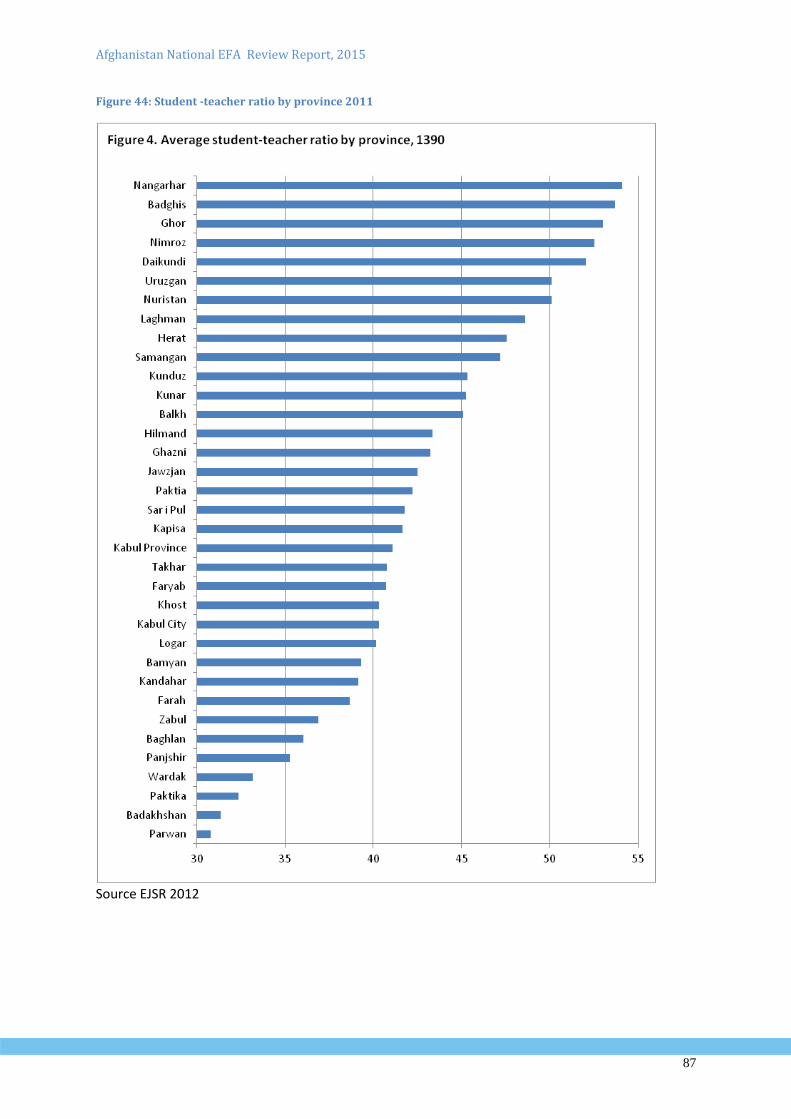
Afghanistan National EFA Review Report, 2015
87
Figure 44: Student -teacher ratio by province 2011
Source EJSR 2012
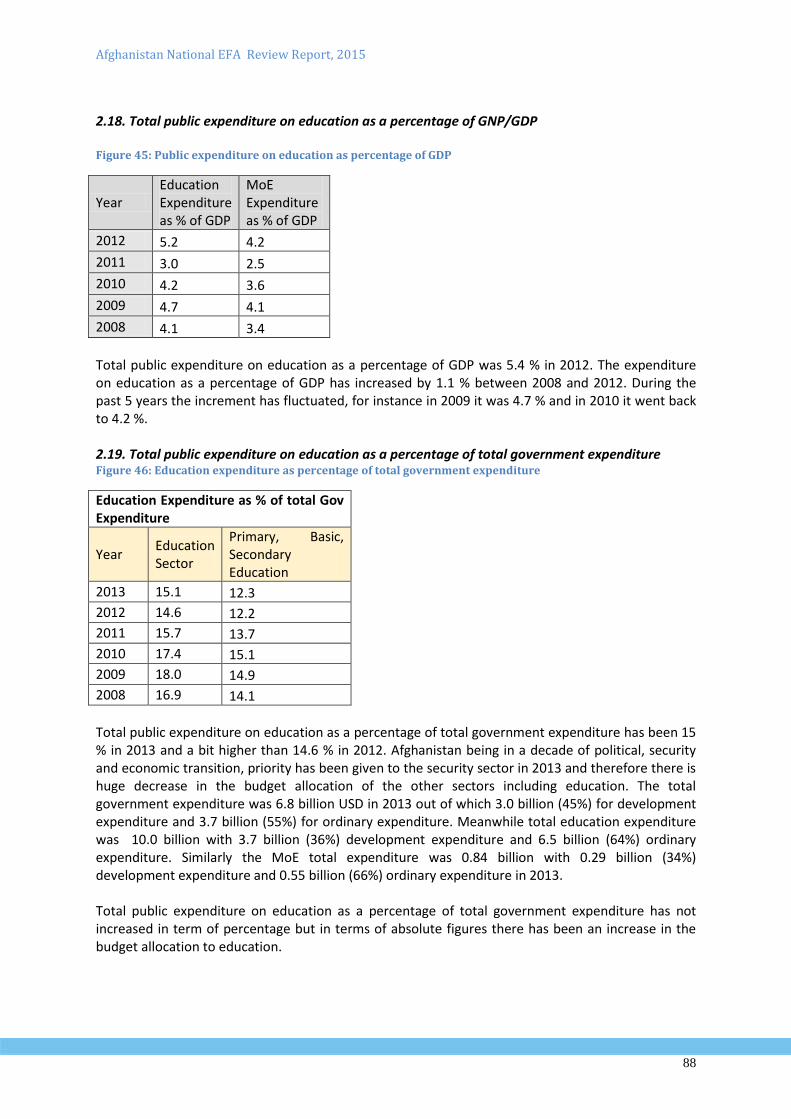
Afghanistan National EFA Review Report, 2015
88
2.18. Total public expenditure on education as a percentage of GNP/GDP Figure 45: Public expenditure on education as percentage of GDP
Year Education Expenditure as % of GDP
MoE Expenditure as % of GDP
2012 5.2 4.2
2011 3.0 2.5
2010 4.2 3.6
2009 4.7 4.1
2008 4.1 3.4
Total public expenditure on education as a percentage of GDP was 5.4 % in 2012. The expenditure on education as a percentage of GDP has increased by 1.1 % between 2008 and 2012. During the past 5 years the increment has fluctuated, for instance in 2009 it was 4.7 % and in 2010 it went back to 4.2 %. 2.19. Total public expenditure on education as a percentage of total government expenditure Figure 46: Education expenditure as percentage of total government expenditure
Education Expenditure as % of total Gov Expenditure
Year Education Sector
Primary, Basic, Secondary Education
2013 15.1 12.3
2012 14.6 12.2
2011 15.7 13.7
2010 17.4 15.1
2009 18.0 14.9
2008 16.9 14.1
Total public expenditure on education as a percentage of total government expenditure has been 15 % in 2013 and a bit higher than 14.6 % in 2012. Afghanistan being in a decade of political, security and economic transition, priority has been given to the security sector in 2013 and therefore there is huge decrease in the budget allocation of the other sectors including education. The total government expenditure was 6.8 billion USD in 2013 out of which 3.0 billion (45%) for development expenditure and 3.7 billion (55%) for ordinary expenditure. Meanwhile total education expenditure was 10.0 billion with 3.7 billion (36%) development expenditure and 6.5 billion (64%) ordinary expenditure. Similarly the MoE total expenditure was 0.84 billion with 0.29 billion (34%) development expenditure and 0.55 billion (66%) ordinary expenditure in 2013. Total public expenditure on education as a percentage of total government expenditure has not increased in term of percentage but in terms of absolute figures there has been an increase in the budget allocation to education.
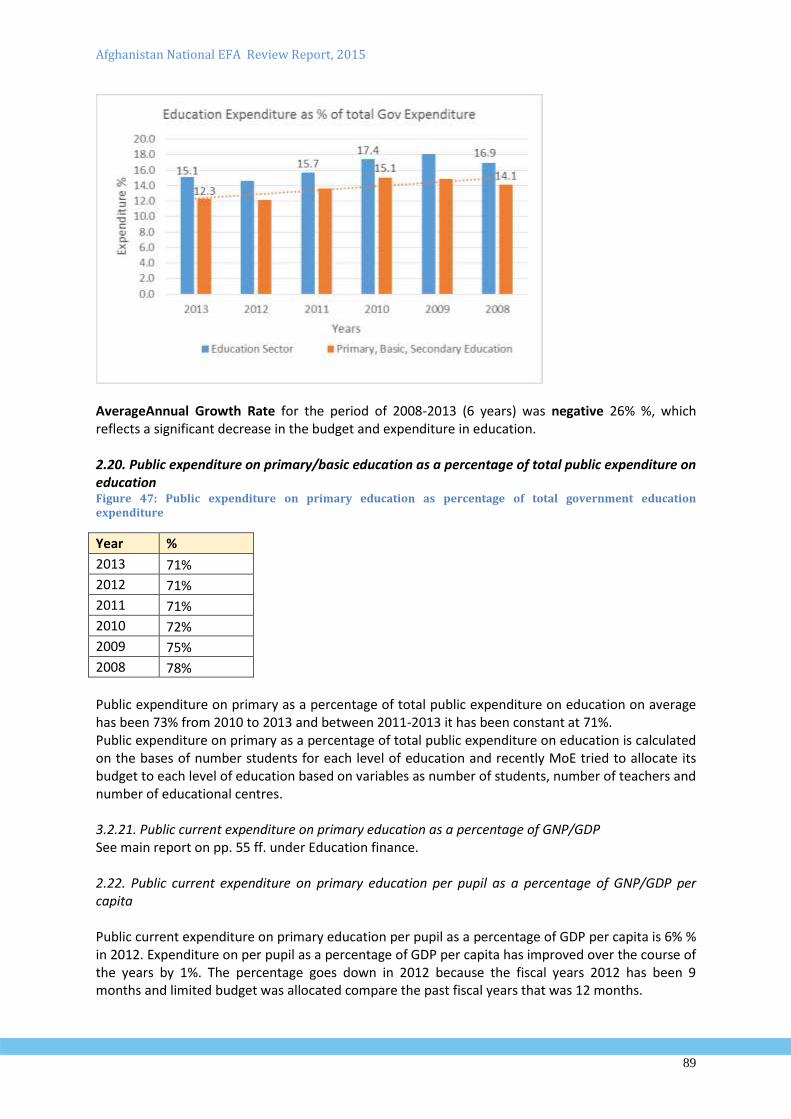
Afghanistan National EFA Review Report, 2015
89
AverageAnnual Growth Rate for the period of 2008-2013 (6 years) was negative 26% %, which reflects a significant decrease in the budget and expenditure in education. 2.20. Public expenditure on primary/basic education as a percentage of total public expenditure on education Figure 47: Public expenditure on primary education as percentage of total government education expenditure
Year %
2013 71%
2012 71%
2011 71%
2010 72%
2009 75%
2008 78%
Public expenditure on primary as a percentage of total public expenditure on education on average has been 73% from 2010 to 2013 and between 2011-2013 it has been constant at 71%. Public expenditure on primary as a percentage of total public expenditure on education is calculated on the bases of number students for each level of education and recently MoE tried to allocate its budget to each level of education based on variables as number of students, number of teachers and number of educational centres. 3.2.21. Public current expenditure on primary education as a percentage of GNP/GDP See main report on pp. 55 ff. under Education finance. 2.22. Public current expenditure on primary education per pupil as a percentage of GNP/GDP per capita Public current expenditure on primary education per pupil as a percentage of GDP per capita is 6% % in 2012. Expenditure on per pupil as a percentage of GDP per capita has improved over the course of the years by 1%. The percentage goes down in 2012 because the fiscal years 2012 has been 9 months and limited budget was allocated compare the past fiscal years that was 12 months.
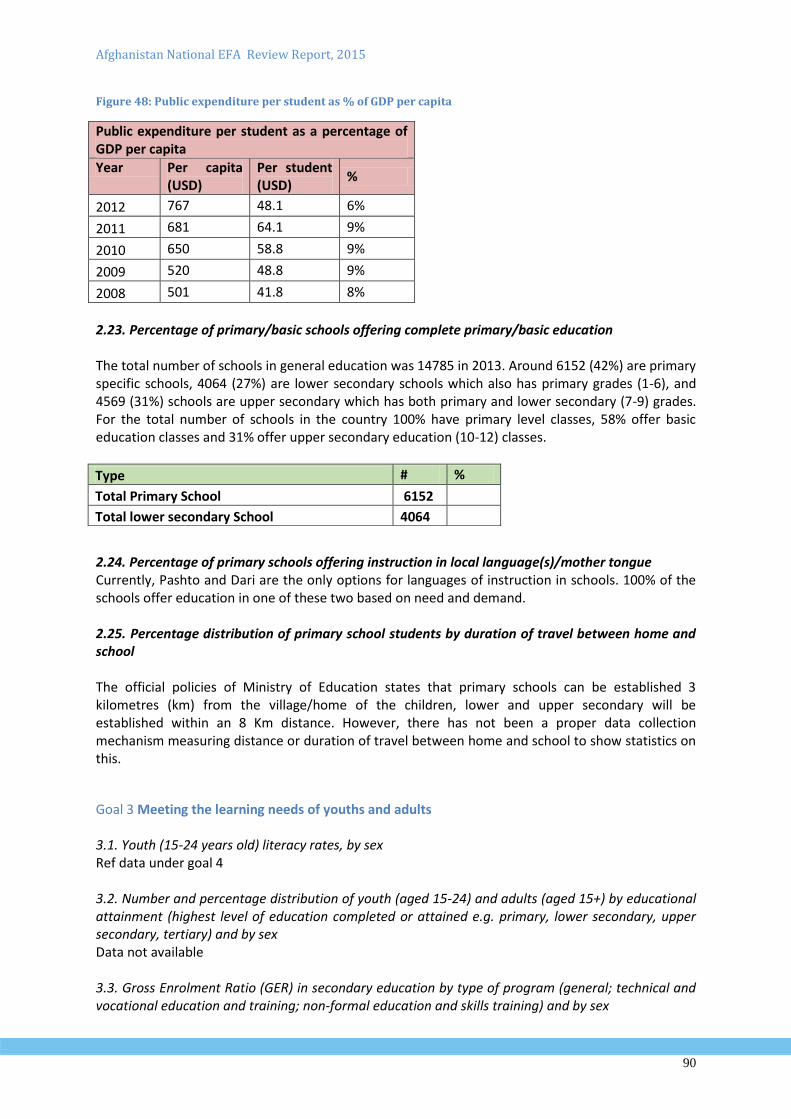
Afghanistan National EFA Review Report, 2015
90
Figure 48: Public expenditure per student as % of GDP per capita
Public expenditure per student as a percentage of GDP per capita
Year Per capita (USD)
Per student (USD)
%
2012 767 48.1 6%
2011 681 64.1 9%
2010 650 58.8 9%
2009 520 48.8 9%
2008 501 41.8 8%
2.23. Percentage of primary/basic schools offering complete primary/basic education The total number of schools in general education was 14785 in 2013. Around 6152 (42%) are primary specific schools, 4064 (27%) are lower secondary schools which also has primary grades (1-6), and 4569 (31%) schools are upper secondary which has both primary and lower secondary (7-9) grades. For the total number of schools in the country 100% have primary level classes, 58% offer basic education classes and 31% offer upper secondary education (10-12) classes.
2.24. Percentage of primary schools offering instruction in local language(s)/mother tongue Currently, Pashto and Dari are the only options for languages of instruction in schools. 100% of the schools offer education in one of these two based on need and demand. 2.25. Percentage distribution of primary school students by duration of travel between home and school The official policies of Ministry of Education states that primary schools can be established 3 kilometres (km) from the village/home of the children, lower and upper secondary will be established within an 8 Km distance. However, there has not been a proper data collection mechanism measuring distance or duration of travel between home and school to show statistics on this.
Goal 3 Meeting the learning needs of youths and adults 3.1. Youth (15-24 years old) literacy rates, by sex Ref data under goal 4 3.2. Number and percentage distribution of youth (aged 15-24) and adults (aged 15+) by educational attainment (highest level of education completed or attained e.g. primary, lower secondary, upper secondary, tertiary) and by sex Data not available 3.3. Gross Enrolment Ratio (GER) in secondary education by type of program (general; technical and vocational education and training; non-formal education and skills training) and by sex
Type # %
Total Primary School 6152
Total lower secondary School 4064
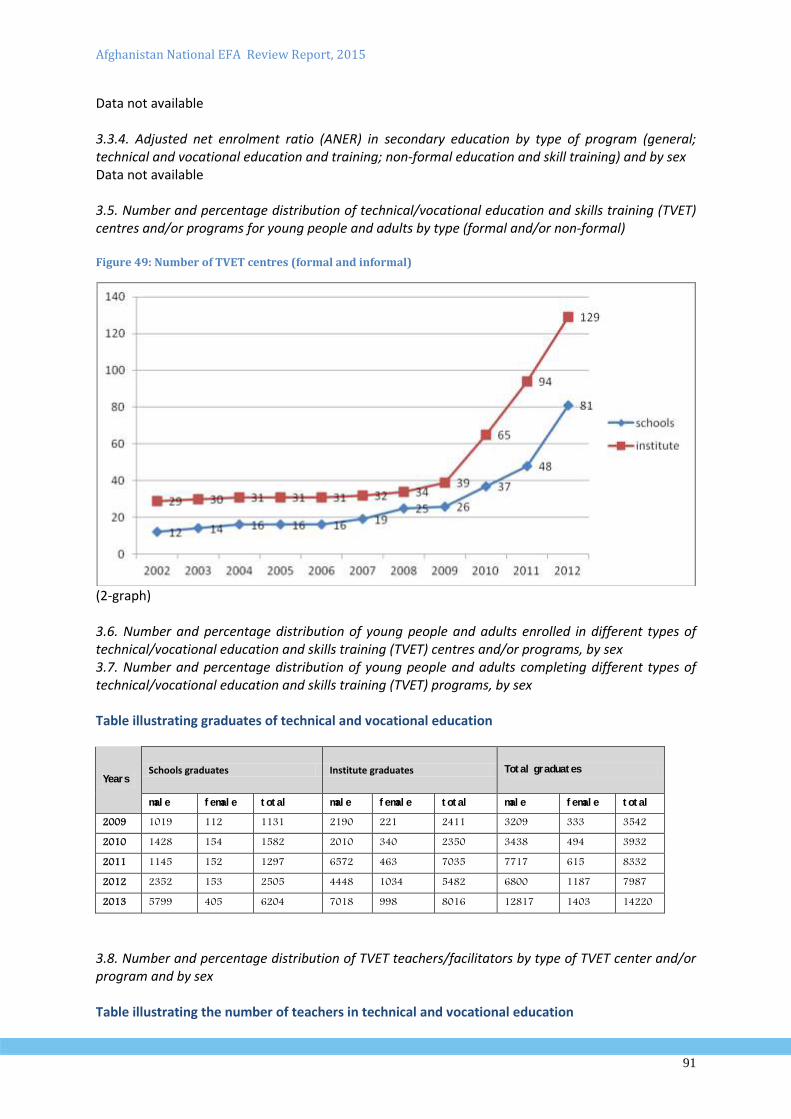
Afghanistan National EFA Review Report, 2015
91
Data not available 3.3.4. Adjusted net enrolment ratio (ANER) in secondary education by type of program (general; technical and vocational education and training; non-formal education and skill training) and by sex Data not available 3.5. Number and percentage distribution of technical/vocational education and skills training (TVET) centres and/or programs for young people and adults by type (formal and/or non-formal) Figure 49: Number of TVET centres (formal and informal)
(2-graph) 3.6. Number and percentage distribution of young people and adults enrolled in different types of technical/vocational education and skills training (TVET) centres and/or programs, by sex 3.7. Number and percentage distribution of young people and adults completing different types of technical/vocational education and skills training (TVET) programs, by sex Table illustrating graduates of technical and vocational education
Years Schools graduates Institute graduates Tot al graduat es
mal e f emal e t ot al mal e f emal e t ot al mal e f emal e t ot al 2009 1019 112 1131 2190 221 2411 3209 333 3542 2010 1428 154 1582 2010 340 2350 3438 494 3932 2011 1145 152 1297 6572 463 7035 7717 615 8332 2012 2352 153 2505 4448 1034 5482 6800 1187 7987 2013 5799 405 6204 7018 998 8016 12817 1403 14220
3.8. Number and percentage distribution of TVET teachers/facilitators by type of TVET center and/or program and by sex Table illustrating the number of teachers in technical and vocational education
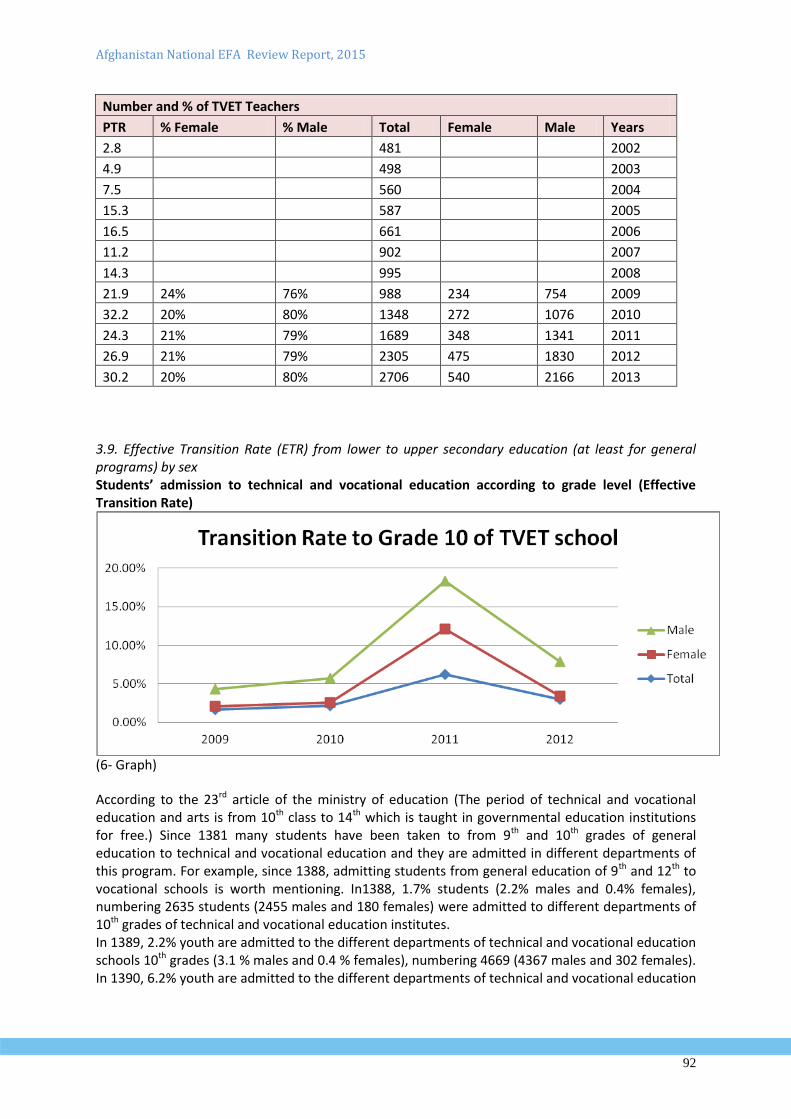
Afghanistan National EFA Review Report, 2015
92
Number and % of TVET Teachers
PTR % Female % Male Total Female Male Years
2.8 481 2002
4.9 498 2003
7.5 560 2004
15.3 587 2005
16.5 661 2006
11.2 902 2007
14.3 995 2008
21.9 24% 76% 988 234 754 2009
32.2 20% 80% 1348 272 1076 2010
24.3 21% 79% 1689 348 1341 2011
26.9 21% 79% 2305 475 1830 2012
30.2 20% 80% 2706 540 2166 2013
3.9. Effective Transition Rate (ETR) from lower to upper secondary education (at least for general programs) by sex Students’ admission to technical and vocational education according to grade level (Effective Transition Rate)
(6- Graph)
According to the 23rd article of the ministry of education (The period of technical and vocational education and arts is from 10th class to 14th which is taught in governmental education institutions for free.) Since 1381 many students have been taken to from 9th and 10th grades of general education to technical and vocational education and they are admitted in different departments of this program. For example, since 1388, admitting students from general education of 9th and 12th to vocational schools is worth mentioning. In1388, 1.7% students (2.2% males and 0.4% females), numbering 2635 students (2455 males and 180 females) were admitted to different departments of 10th grades of technical and vocational education institutes. In 1389, 2.2% youth are admitted to the different departments of technical and vocational education schools 10th grades (3.1 % males and 0.4 % females), numbering 4669 (4367 males and 302 females). In 1390, 6.2% youth are admitted to the different departments of technical and vocational education
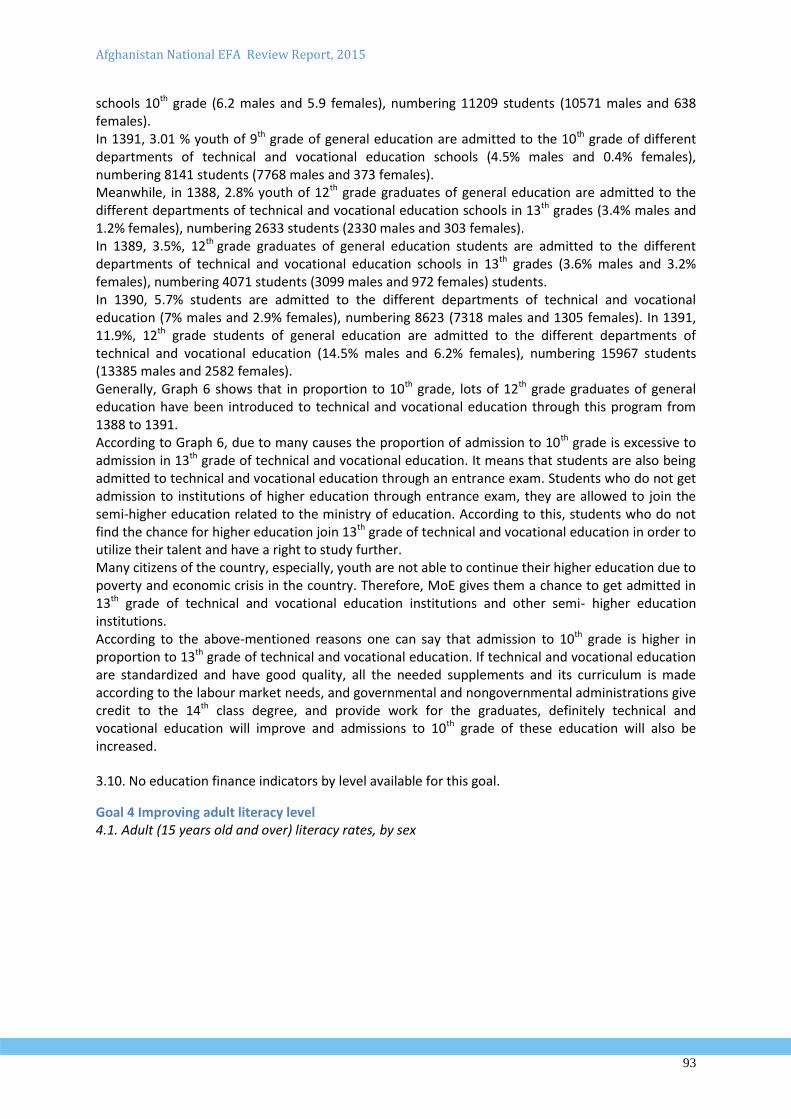
Afghanistan National EFA Review Report, 2015
93
schools 10th grade (6.2 males and 5.9 females), numbering 11209 students (10571 males and 638 females). In 1391, 3.01 % youth of 9th grade of general education are admitted to the 10th grade of different departments of technical and vocational education schools (4.5% males and 0.4% females), numbering 8141 students (7768 males and 373 females). Meanwhile, in 1388, 2.8% youth of 12th grade graduates of general education are admitted to the different departments of technical and vocational education schools in 13th grades (3.4% males and 1.2% females), numbering 2633 students (2330 males and 303 females). In 1389, 3.5%, 12th grade graduates of general education students are admitted to the different departments of technical and vocational education schools in 13th grades (3.6% males and 3.2% females), numbering 4071 students (3099 males and 972 females) students. In 1390, 5.7% students are admitted to the different departments of technical and vocational education (7% males and 2.9% females), numbering 8623 (7318 males and 1305 females). In 1391, 11.9%, 12th grade students of general education are admitted to the different departments of technical and vocational education (14.5% males and 6.2% females), numbering 15967 students (13385 males and 2582 females). Generally, Graph 6 shows that in proportion to 10th grade, lots of 12th grade graduates of general education have been introduced to technical and vocational education through this program from 1388 to 1391. According to Graph 6, due to many causes the proportion of admission to 10th grade is excessive to admission in 13th grade of technical and vocational education. It means that students are also being admitted to technical and vocational education through an entrance exam. Students who do not get admission to institutions of higher education through entrance exam, they are allowed to join the semi-higher education related to the ministry of education. According to this, students who do not find the chance for higher education join 13th grade of technical and vocational education in order to utilize their talent and have a right to study further. Many citizens of the country, especially, youth are not able to continue their higher education due to poverty and economic crisis in the country. Therefore, MoE gives them a chance to get admitted in 13th grade of technical and vocational education institutions and other semi- higher education institutions. According to the above-mentioned reasons one can say that admission to 10th grade is higher in proportion to 13th grade of technical and vocational education. If technical and vocational education are standardized and have good quality, all the needed supplements and its curriculum is made according to the labour market needs, and governmental and nongovernmental administrations give credit to the 14th class degree, and provide work for the graduates, definitely technical and vocational education will improve and admissions to 10th grade of these education will also be increased.
3.10. No education finance indicators by level available for this goal.
Goal 4 Improving adult literacy level 4.1. Adult (15 years old and over) literacy rates, by sex
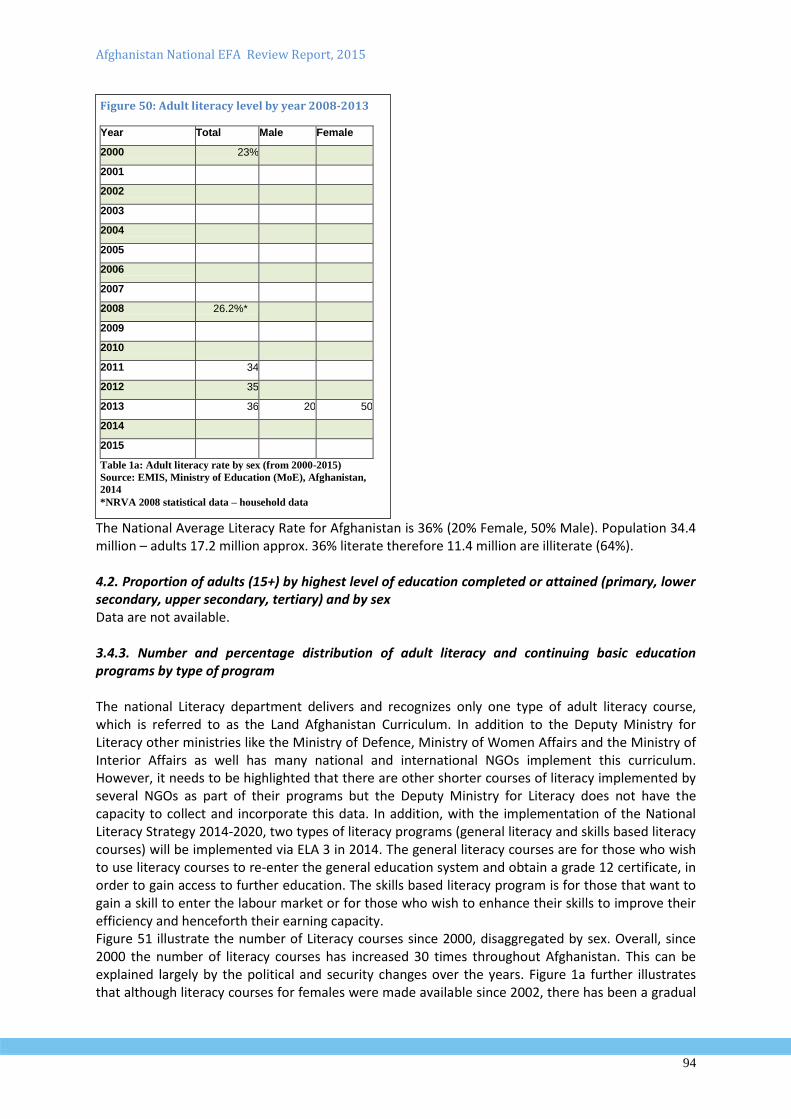
Afghanistan National EFA Review Report, 2015
94
The National Average Literacy Rate for Afghanistan is 36% (20% Female, 50% Male). Population 34.4 million – adults 17.2 million approx. 36% literate therefore 11.4 million are illiterate (64%). 4.2. Proportion of adults (15+) by highest level of education completed or attained (primary, lower secondary, upper secondary, tertiary) and by sex Data are not available. 3.4.3. Number and percentage distribution of adult literacy and continuing basic education programs by type of program The national Literacy department delivers and recognizes only one type of adult literacy course, which is referred to as the Land Afghanistan Curriculum. In addition to the Deputy Ministry for Literacy other ministries like the Ministry of Defence, Ministry of Women Affairs and the Ministry of Interior Affairs as well has many national and international NGOs implement this curriculum. However, it needs to be highlighted that there are other shorter courses of literacy implemented by several NGOs as part of their programs but the Deputy Ministry for Literacy does not have the capacity to collect and incorporate this data. In addition, with the implementation of the National Literacy Strategy 2014-2020, two types of literacy programs (general literacy and skills based literacy courses) will be implemented via ELA 3 in 2014. The general literacy courses are for those who wish to use literacy courses to re-enter the general education system and obtain a grade 12 certificate, in order to gain access to further education. The skills based literacy program is for those that want to gain a skill to enter the labour market or for those who wish to enhance their skills to improve their efficiency and henceforth their earning capacity. Figure 51 illustrate the number of Literacy courses since 2000, disaggregated by sex. Overall, since 2000 the number of literacy courses has increased 30 times throughout Afghanistan. This can be explained largely by the political and security changes over the years. Figure 1a further illustrates that although literacy courses for females were made available since 2002, there has been a gradual
Figure 50: Adult literacy level by year 2008-2013
Year Total Male Female
2000 23% 2001 2002 2003 2004 2005 2006 2007 2008 26.2%* 2009 2010 2011 34 2012 35 2013 36 20 50
2014 2015 Table 1a: Adult literacy rate by sex (from 2000-2015)
Source: EMIS, Ministry of Education (MoE), Afghanistan,
2014
*NRVA 2008 statistical data – household data
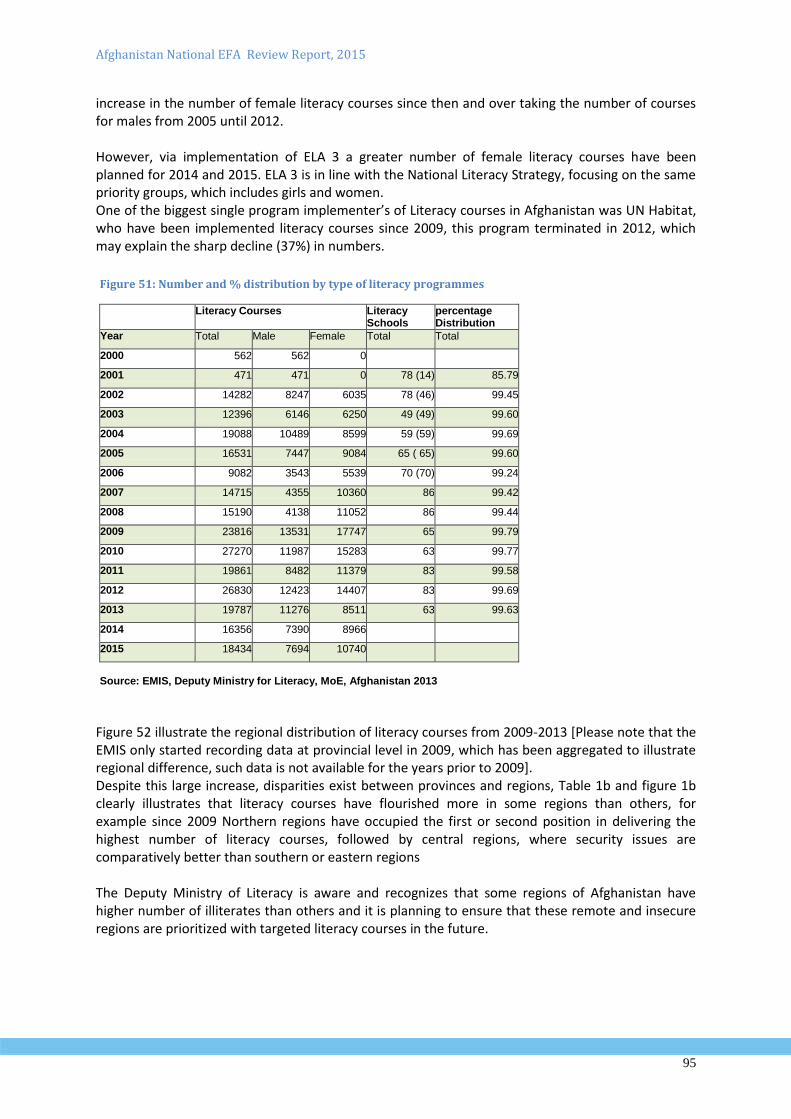
Afghanistan National EFA Review Report, 2015
95
increase in the number of female literacy courses since then and over taking the number of courses for males from 2005 until 2012. However, via implementation of ELA 3 a greater number of female literacy courses have been planned for 2014 and 2015. ELA 3 is in line with the National Literacy Strategy, focusing on the same priority groups, which includes girls and women. One of the biggest single program implementer’s of Literacy courses in Afghanistan was UN Habitat, who have been implemented literacy courses since 2009, this program terminated in 2012, which may explain the sharp decline (37%) in numbers.
Figure 52 illustrate the regional distribution of literacy courses from 2009-2013 [Please note that the EMIS only started recording data at provincial level in 2009, which has been aggregated to illustrate regional difference, such data is not available for the years prior to 2009]. Despite this large increase, disparities exist between provinces and regions, Table 1b and figure 1b clearly illustrates that literacy courses have flourished more in some regions than others, for example since 2009 Northern regions have occupied the first or second position in delivering the highest number of literacy courses, followed by central regions, where security issues are comparatively better than southern or eastern regions The Deputy Ministry of Literacy is aware and recognizes that some regions of Afghanistan have higher number of illiterates than others and it is planning to ensure that these remote and insecure regions are prioritized with targeted literacy courses in the future.
Figure 51: Number and % distribution by type of literacy programmes
Literacy Courses Literacy Schools
percentage Distribution
Year Total Male Female Total Total
2000 562 562 0 2001 471 471 0 78 (14) 85.79
2002 14282 8247 6035 78 (46) 99.45
2003 12396 6146 6250 49 (49) 99.60
2004 19088 10489 8599 59 (59) 99.69
2005 16531 7447 9084 65 ( 65) 99.60
2006 9082 3543 5539 70 (70) 99.24
2007 14715 4355 10360 86 99.42
2008 15190 4138 11052 86 99.44
2009 23816 13531 17747 65 99.79
2010 27270 11987 15283 63 99.77
2011 19861 8482 11379 83 99.58
2012 26830 12423 14407 83 99.69
2013 19787 11276 8511 63 99.63
2014 16356 7390 8966 2015 18434 7694 10740
Source: EMIS, Deputy Ministry for Literacy, MoE, Afghanistan 2013
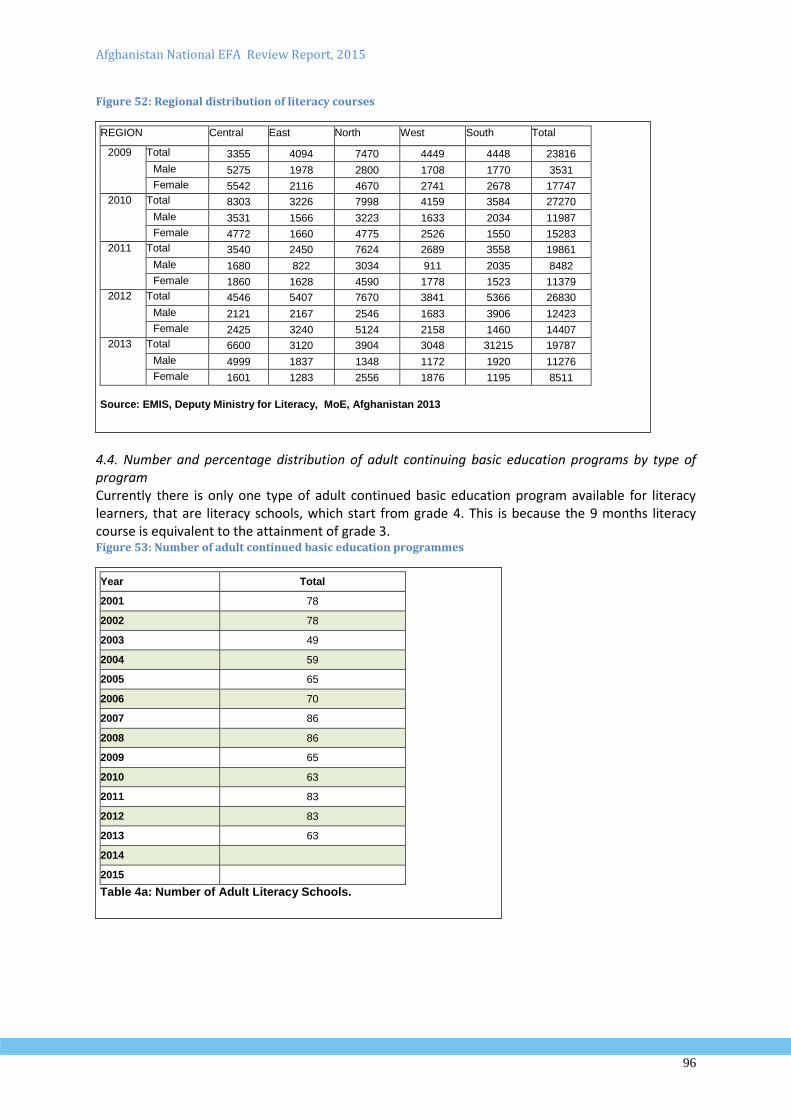
Afghanistan National EFA Review Report, 2015
96
Figure 52: Regional distribution of literacy courses
4.4. Number and percentage distribution of adult continuing basic education programs by type of program Currently there is only one type of adult continued basic education program available for literacy learners, that are literacy schools, which start from grade 4. This is because the 9 months literacy course is equivalent to the attainment of grade 3. Figure 53: Number of adult continued basic education programmes
REGION Central East North West South Total
2009 Total 3355 4094 7470 4449 4448 23816
Male 5275 1978 2800 1708 1770 3531
Female 5542 2116 4670 2741 2678 17747
2010 Total 8303 3226 7998 4159 3584 27270
Male 3531 1566 3223 1633 2034 11987
Female 4772 1660 4775 2526 1550 15283
2011 Total 3540 2450 7624 2689 3558 19861
Male 1680 822 3034 911 2035 8482
Female 1860 1628 4590 1778 1523 11379
2012 Total 4546 5407 7670 3841 5366 26830
Male 2121 2167 2546 1683 3906 12423
Female 2425 3240 5124 2158 1460 14407
2013 Total 6600 3120 3904 3048 31215 19787
Male 4999 1837 1348 1172 1920 11276
Female 1601 1283 2556 1876 1195 8511
Source: EMIS, Deputy Ministry for Literacy, MoE, Afghanistan 2013
Year Total
2001 78
2002 78
2003 49
2004 59
2005 65
2006 70
2007 86
2008 86
2009 65
2010 63
2011 83
2012 83
2013 63
2014
2015 Table 4a: Number of Adult Literacy Schools.
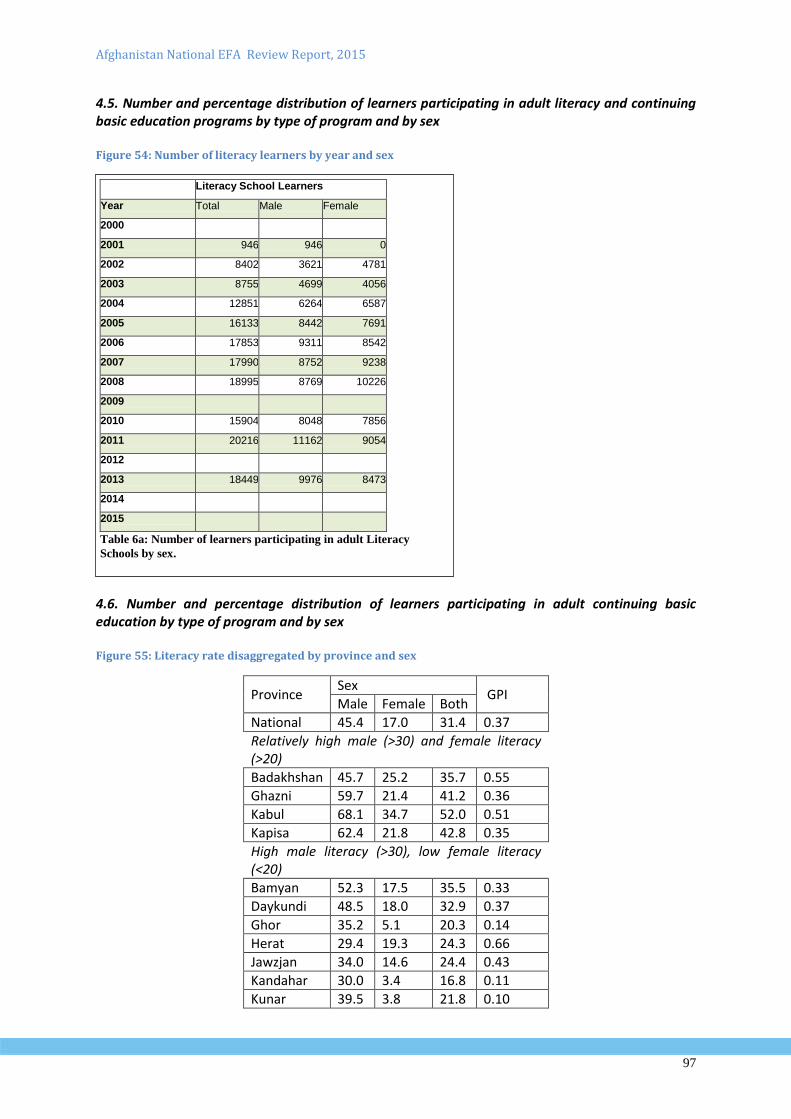
Afghanistan National EFA Review Report, 2015
97
4.5. Number and percentage distribution of learners participating in adult literacy and continuing basic education programs by type of program and by sex Figure 54: Number of literacy learners by year and sex
4.6. Number and percentage distribution of learners participating in adult continuing basic education by type of program and by sex Figure 55: Literacy rate disaggregated by province and sex
Province Sex
GPI Male Female Both
National 45.4 17.0 31.4 0.37
Relatively high male (>30) and female literacy (>20)
Badakhshan 45.7 25.2 35.7 0.55
Ghazni 59.7 21.4 41.2 0.36
Kabul 68.1 34.7 52.0 0.51
Kapisa 62.4 21.8 42.8 0.35
High male literacy (>30), low female literacy (<20)
Bamyan 52.3 17.5 35.5 0.33
Daykundi 48.5 18.0 32.9 0.37
Ghor 35.2 5.1 20.3 0.14
Herat 29.4 19.3 24.3 0.66
Jawzjan 34.0 14.6 24.4 0.43
Kandahar 30.0 3.4 16.8 0.11
Kunar 39.5 3.8 21.8 0.10
Literacy School Learners
Year Total Male Female
2000 2001 946 946 0
2002 8402 3621 4781
2003 8755 4699 4056
2004 12851 6264 6587
2005 16133 8442 7691
2006 17853 9311 8542
2007 17990 8752 9238
2008 18995 8769 10226
2009 2010 15904 8048 7856
2011 20216 11162 9054
2012 2013 18449 9976 8473
2014 2015 Table 6a: Number of learners participating in adult Literacy
Schools by sex.
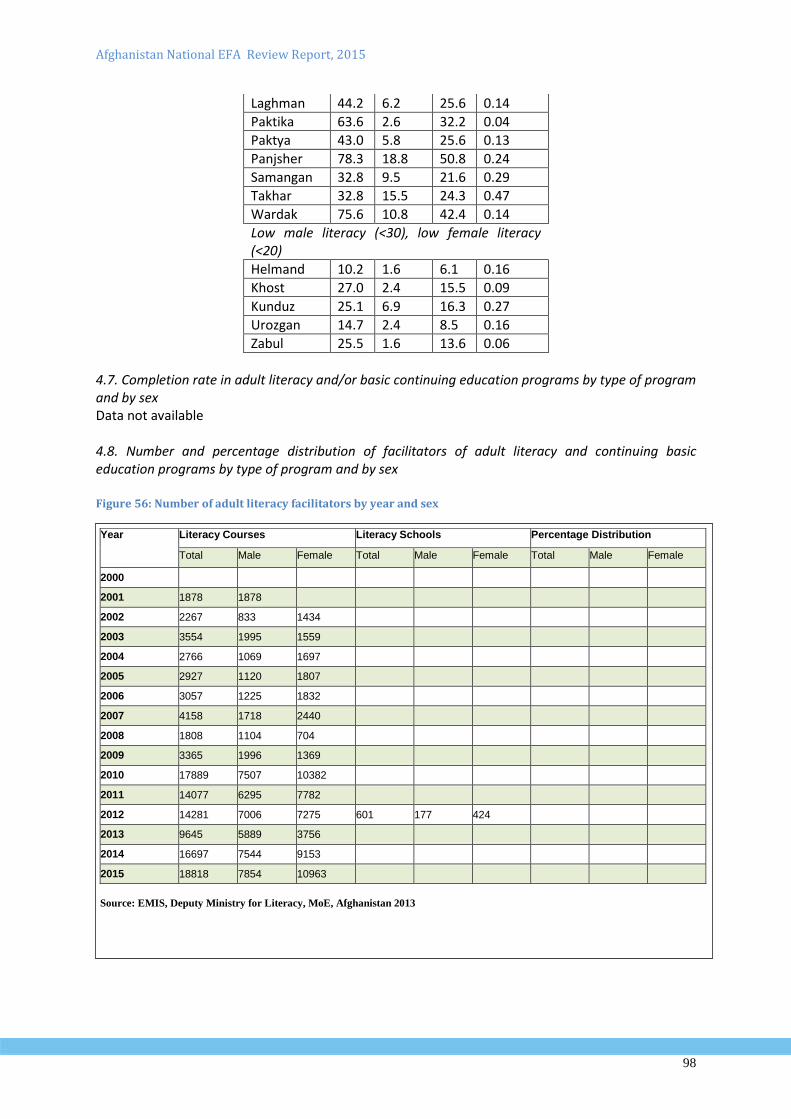
Afghanistan National EFA Review Report, 2015
98
Laghman 44.2 6.2 25.6 0.14
Paktika 63.6 2.6 32.2 0.04
Paktya 43.0 5.8 25.6 0.13
Panjsher 78.3 18.8 50.8 0.24
Samangan 32.8 9.5 21.6 0.29
Takhar 32.8 15.5 24.3 0.47
Wardak 75.6 10.8 42.4 0.14
Low male literacy (<30), low female literacy (<20)
Helmand 10.2 1.6 6.1 0.16
Khost 27.0 2.4 15.5 0.09
Kunduz 25.1 6.9 16.3 0.27
Urozgan 14.7 2.4 8.5 0.16
Zabul 25.5 1.6 13.6 0.06
4.7. Completion rate in adult literacy and/or basic continuing education programs by type of program and by sex Data not available 4.8. Number and percentage distribution of facilitators of adult literacy and continuing basic education programs by type of program and by sex
Figure 56: Number of adult literacy facilitators by year and sex
Year Literacy Courses Literacy Schools Percentage Distribution
Total Male Female Total Male Female Total Male Female
2000
2001 1878 1878
2002 2267 833 1434
2003 3554 1995 1559
2004 2766 1069 1697
2005 2927 1120 1807
2006 3057 1225 1832
2007 4158 1718 2440
2008 1808 1104 704
2009 3365 1996 1369
2010 17889 7507 10382
2011 14077 6295 7782
2012 14281 7006 7275 601 177 424
2013 9645 5889 3756
2014 16697 7544 9153
2015 18818 7854 10963
Source: EMIS, Deputy Ministry for Literacy, MoE, Afghanistan 2013
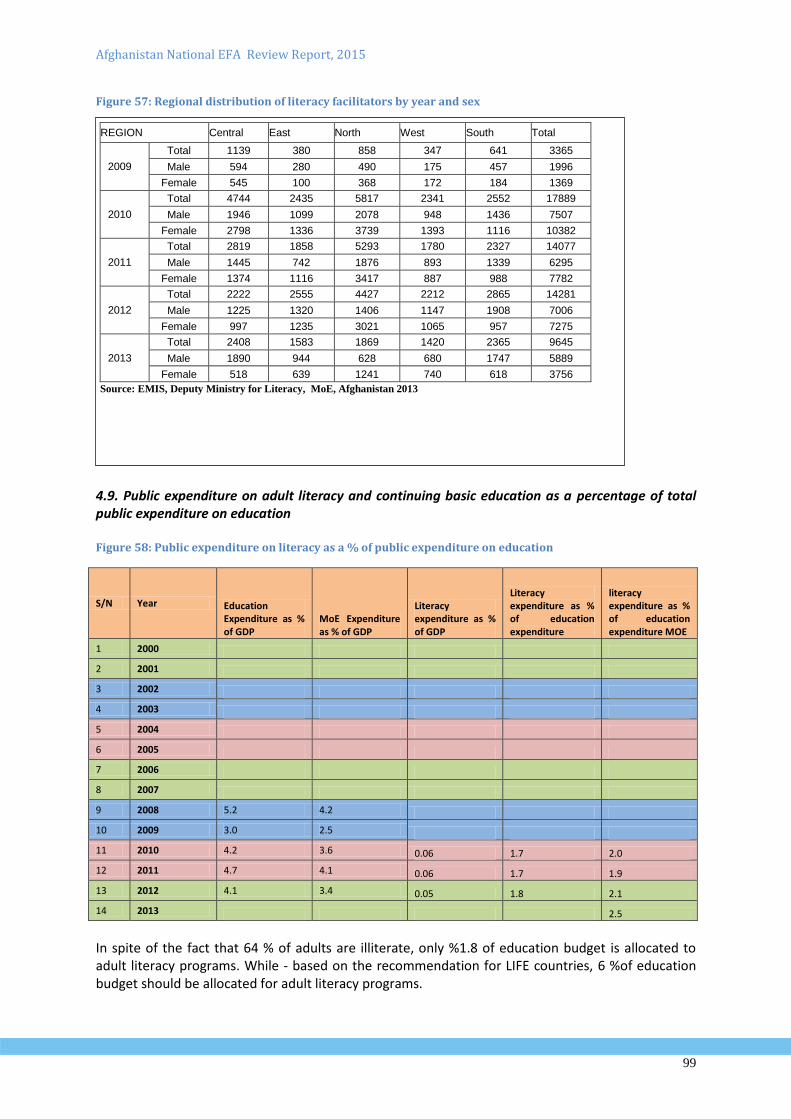
Afghanistan National EFA Review Report, 2015
99
Figure 57: Regional distribution of literacy facilitators by year and sex
4.9. Public expenditure on adult literacy and continuing basic education as a percentage of total public expenditure on education Figure 58: Public expenditure on literacy as a % of public expenditure on education
S/N Year Education Expenditure as % of GDP
MoE Expenditure as % of GDP
Literacy expenditure as % of GDP
Literacy expenditure as % of education expenditure
literacy expenditure as % of education expenditure MOE
1 2000
2 2001
3 2002
4 2003
5 2004
6 2005
7 2006
8 2007
9 2008 5.2 4.2
10 2009 3.0 2.5
11 2010 4.2 3.6 0.06 1.7 2.0
12 2011 4.7 4.1 0.06 1.7 1.9
13 2012 4.1 3.4 0.05 1.8 2.1
14 2013 2.5
In spite of the fact that 64 % of adults are illiterate, only %1.8 of education budget is allocated to adult literacy programs. While - based on the recommendation for LIFE countries, 6 %of education budget should be allocated for adult literacy programs.
REGION Central East North West South Total
2009
Total 1139 380 858 347 641 3365
Male 594 280 490 175 457 1996
Female 545 100 368 172 184 1369
2010
Total 4744 2435 5817 2341 2552 17889
Male 1946 1099 2078 948 1436 7507
Female 2798 1336 3739 1393 1116 10382
2011
Total 2819 1858 5293 1780 2327 14077
Male 1445 742 1876 893 1339 6295
Female 1374 1116 3417 887 988 7782
2012
Total 2222 2555 4427 2212 2865 14281
Male 1225 1320 1406 1147 1908 7006
Female 997 1235 3021 1065 957 7275
2013
Total 2408 1583 1869 1420 2365 9645
Male 1890 944 628 680 1747 5889
Female 518 639 1241 740 618 3756
Source: EMIS, Deputy Ministry for Literacy, MoE, Afghanistan 2013
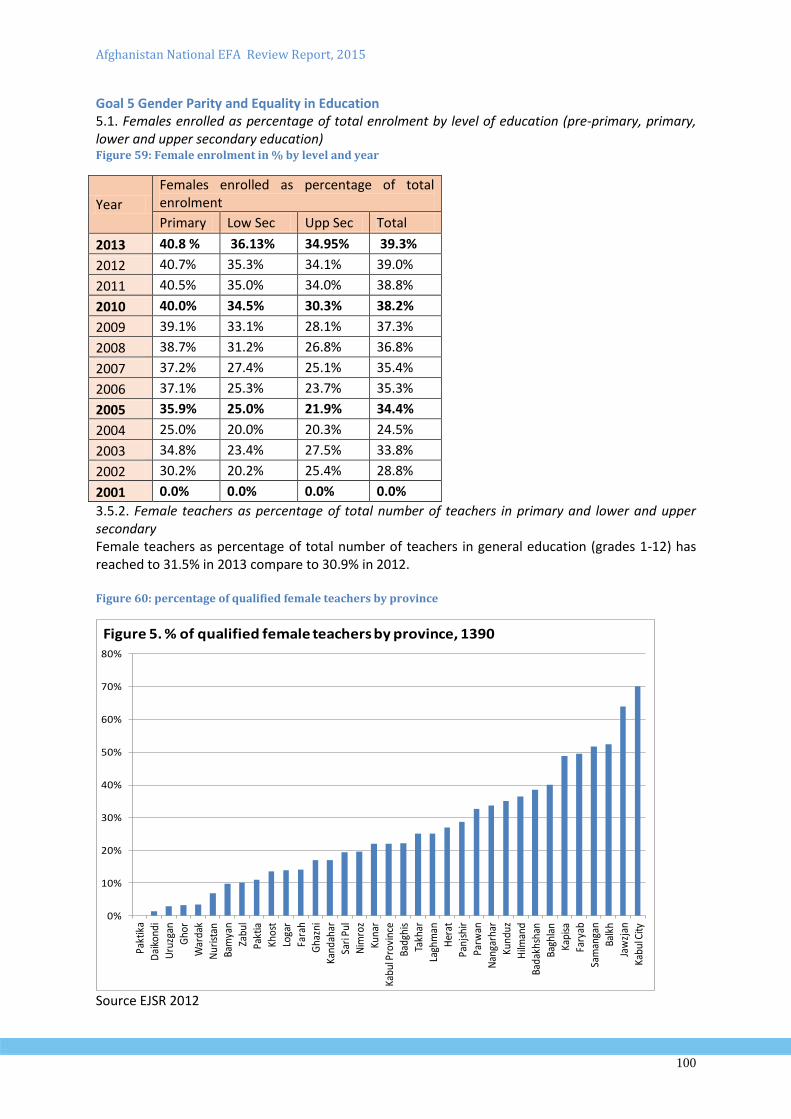
Afghanistan National EFA Review Report, 2015
100
Goal 5 Gender Parity and Equality in Education 5.1. Females enrolled as percentage of total enrolment by level of education (pre-primary, primary, lower and upper secondary education) Figure 59: Female enrolment in % by level and year
Year
Females enrolled as percentage of total enrolment
Primary Low Sec Upp Sec Total
2013 40.8 % 36.13% 34.95% 39.3%
2012 40.7% 35.3% 34.1% 39.0%
2011 40.5% 35.0% 34.0% 38.8%
2010 40.0% 34.5% 30.3% 38.2%
2009 39.1% 33.1% 28.1% 37.3%
2008 38.7% 31.2% 26.8% 36.8%
2007 37.2% 27.4% 25.1% 35.4%
2006 37.1% 25.3% 23.7% 35.3%
2005 35.9% 25.0% 21.9% 34.4%
2004 25.0% 20.0% 20.3% 24.5%
2003 34.8% 23.4% 27.5% 33.8%
2002 30.2% 20.2% 25.4% 28.8%
2001 0.0% 0.0% 0.0% 0.0%
3.5.2. Female teachers as percentage of total number of teachers in primary and lower and upper secondary Female teachers as percentage of total number of teachers in general education (grades 1-12) has reached to 31.5% in 2013 compare to 30.9% in 2012. Figure 60: percentage of qualified female teachers by province
0%
10%
20%
30%
40%
50%
60%
70%
80%
Pakt
ika
Dai
kond
i
Uru
zgan
Gho
r
War
dak
Nur
ista
n
Bam
yan
Zabu
l
Pakt
ia
Khos
t
Loga
r
Fara
h
Gha
zni
Kand
ahar
Sari
Pul
Nim
roz
Kuna
r
Kabu
l Pro
vinc
e
Badg
his
Takh
ar
Lagh
man
Her
at
Panj
shir
Parw
an
Nan
garh
ar
Kund
uz
Hilm
and
Bada
khsh
an
Bagh
lan
Kapi
sa
Fary
ab
Sam
anga
n
Balk
h
Jaw
zjan
Kabu
l City
Figure 5. % of qualified female teachers by province, 1390
Source EJSR 2012
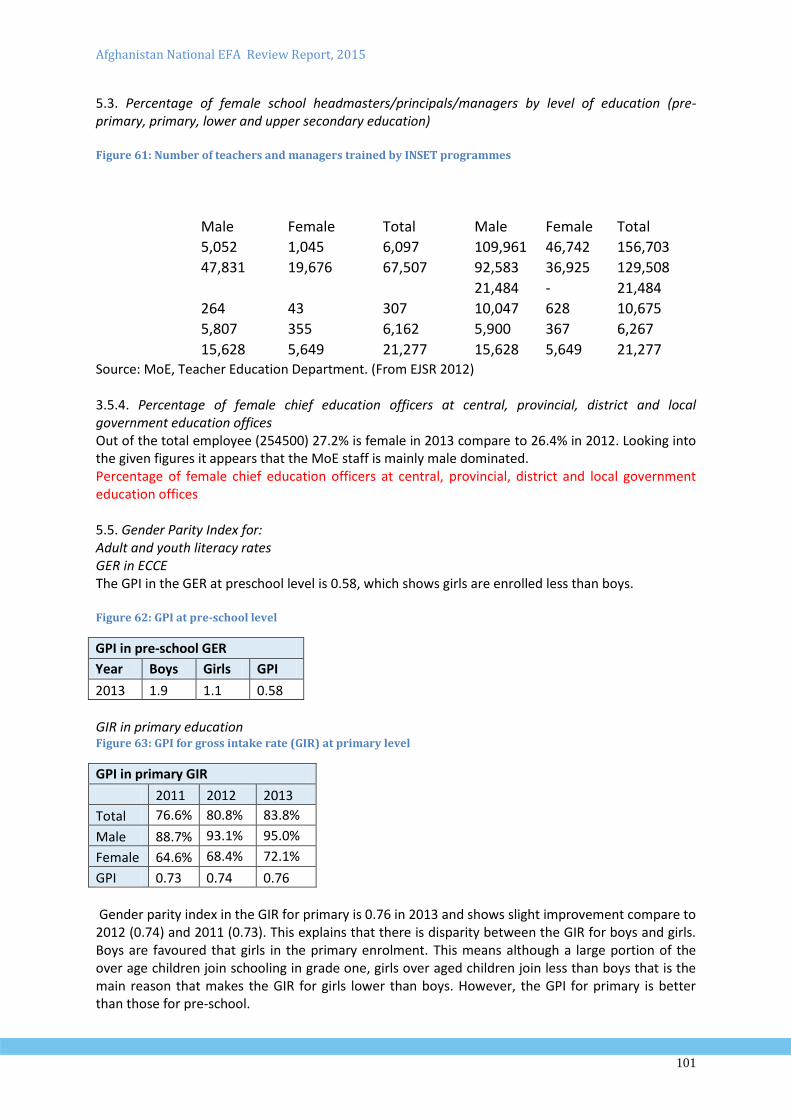
Afghanistan National EFA Review Report, 2015
101
5.3. Percentage of female school headmasters/principals/managers by level of education (pre-primary, primary, lower and upper secondary education) Figure 61: Number of teachers and managers trained by INSET programmes
Training package
Teachers and school managers trained in 1390
Total trained since inception of the activities
Male Female Total Male Female Total
INSET-1 5,052 1,045 6,097 109,961 46,742 156,703
INSET-2 47,831 19,676 67,507 92,583 36,925 129,508
INSET-3 21,484 - 21,484
SMT-1 264 43 307 10,047 628 10,675
SMT-2 5,807 355 6,162 5,900 367 6,267
SMT-3 15,628 5,649 21,277 15,628 5,649 21,277 Source: MoE, Teacher Education Department. (From EJSR 2012) 3.5.4. Percentage of female chief education officers at central, provincial, district and local government education offices Out of the total employee (254500) 27.2% is female in 2013 compare to 26.4% in 2012. Looking into the given figures it appears that the MoE staff is mainly male dominated. Percentage of female chief education officers at central, provincial, district and local government education offices 5.5. Gender Parity Index for: Adult and youth literacy rates GER in ECCE The GPI in the GER at preschool level is 0.58, which shows girls are enrolled less than boys. Figure 62: GPI at pre-school level
GIR in primary education Figure 63: GPI for gross intake rate (GIR) at primary level
GPI in primary GIR
2011 2012 2013
Total 76.6% 80.8% 83.8%
Male 88.7% 93.1% 95.0%
Female 64.6% 68.4% 72.1%
GPI 0.73 0.74 0.76
Gender parity index in the GIR for primary is 0.76 in 2013 and shows slight improvement compare to 2012 (0.74) and 2011 (0.73). This explains that there is disparity between the GIR for boys and girls. Boys are favoured that girls in the primary enrolment. This means although a large portion of the over age children join schooling in grade one, girls over aged children join less than boys that is the main reason that makes the GIR for girls lower than boys. However, the GPI for primary is better than those for pre-school.
GPI in pre-school GER
Year Boys Girls GPI
2013 1.9 1.1 0.58
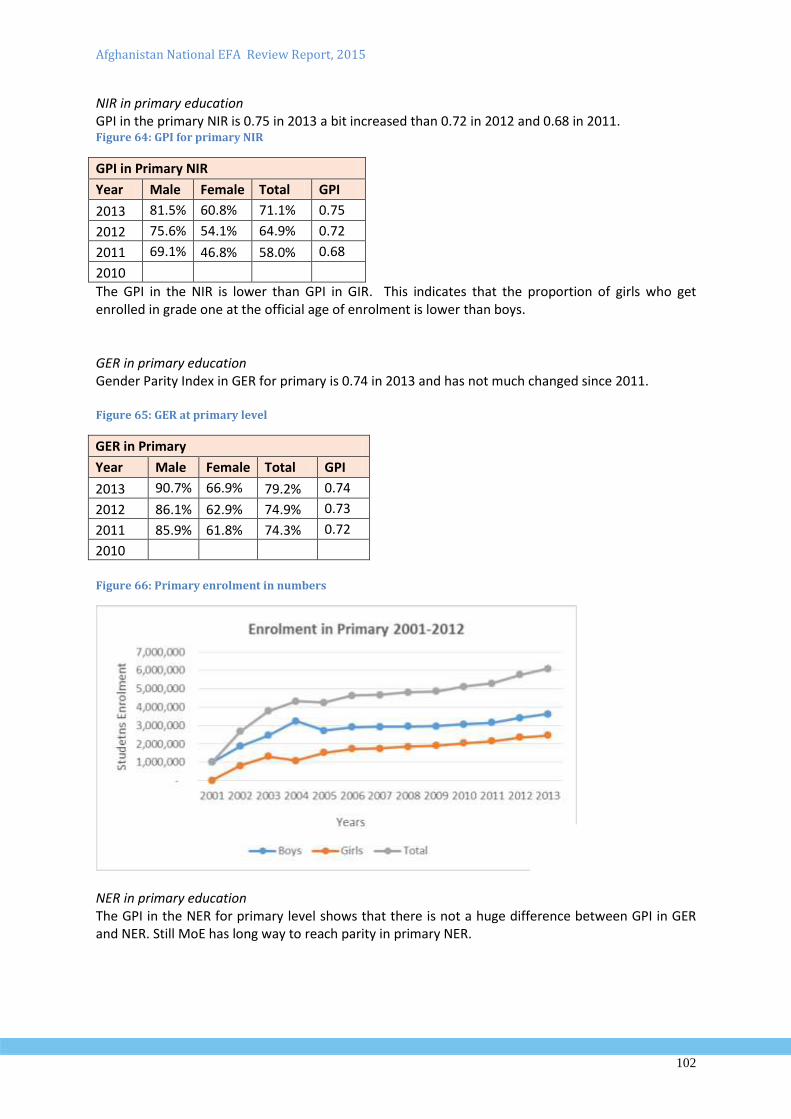
Afghanistan National EFA Review Report, 2015
102
NIR in primary education GPI in the primary NIR is 0.75 in 2013 a bit increased than 0.72 in 2012 and 0.68 in 2011. Figure 64: GPI for primary NIR
GPI in Primary NIR
Year Male Female Total GPI
2013 81.5% 60.8% 71.1% 0.75
2012 75.6% 54.1% 64.9% 0.72
2011 69.1% 46.8% 58.0% 0.68
2010
The GPI in the NIR is lower than GPI in GIR. This indicates that the proportion of girls who get enrolled in grade one at the official age of enrolment is lower than boys. GER in primary education Gender Parity Index in GER for primary is 0.74 in 2013 and has not much changed since 2011. Figure 65: GER at primary level
GER in Primary
Year Male Female Total GPI
2013 90.7% 66.9% 79.2% 0.74
2012 86.1% 62.9% 74.9% 0.73
2011 85.9% 61.8% 74.3% 0.72
2010
Figure 66: Primary enrolment in numbers
NER in primary education The GPI in the NER for primary level shows that there is not a huge difference between GPI in GER and NER. Still MoE has long way to reach parity in primary NER.
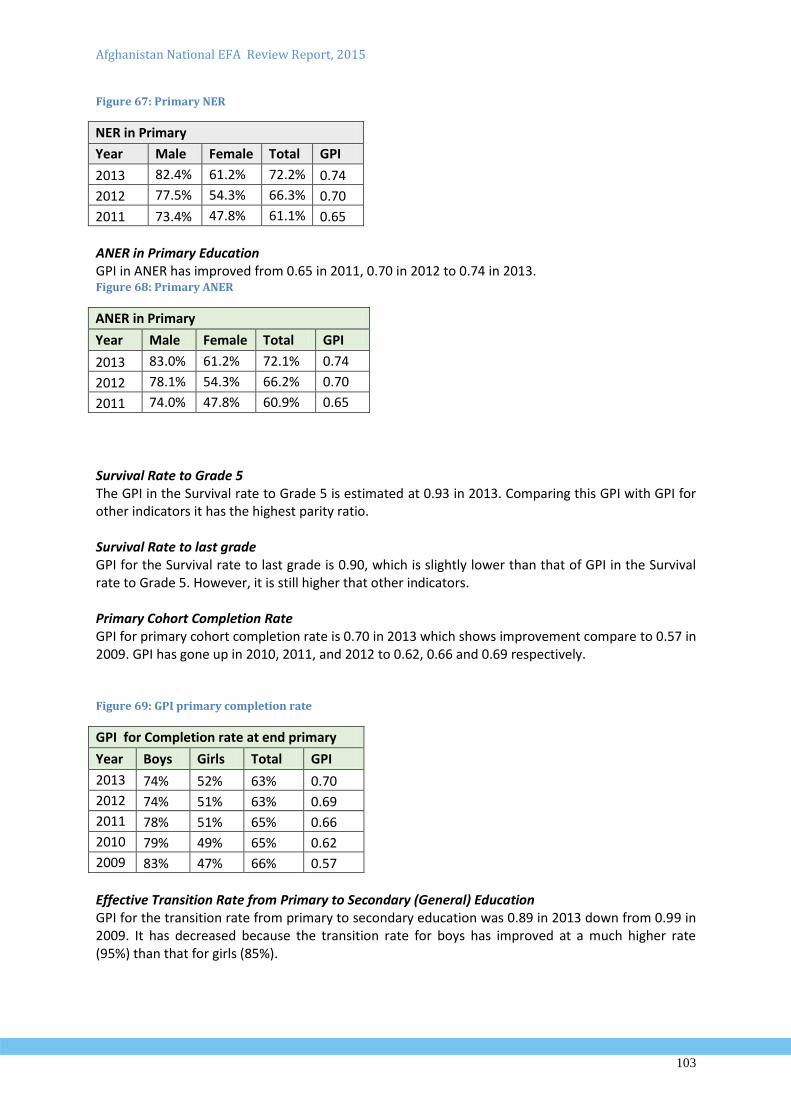
Afghanistan National EFA Review Report, 2015
103
Figure 67: Primary NER
NER in Primary
Year Male Female Total GPI
2013 82.4% 61.2% 72.2% 0.74
2012 77.5% 54.3% 66.3% 0.70
2011 73.4% 47.8% 61.1% 0.65
ANER in Primary Education GPI in ANER has improved from 0.65 in 2011, 0.70 in 2012 to 0.74 in 2013. Figure 68: Primary ANER
ANER in Primary
Year Male Female Total GPI
2013 83.0% 61.2% 72.1% 0.74
2012 78.1% 54.3% 66.2% 0.70
2011 74.0% 47.8% 60.9% 0.65
Survival Rate to Grade 5 The GPI in the Survival rate to Grade 5 is estimated at 0.93 in 2013. Comparing this GPI with GPI for other indicators it has the highest parity ratio. Survival Rate to last grade GPI for the Survival rate to last grade is 0.90, which is slightly lower than that of GPI in the Survival rate to Grade 5. However, it is still higher that other indicators. Primary Cohort Completion Rate GPI for primary cohort completion rate is 0.70 in 2013 which shows improvement compare to 0.57 in 2009. GPI has gone up in 2010, 2011, and 2012 to 0.62, 0.66 and 0.69 respectively. Figure 69: GPI primary completion rate
GPI for Completion rate at end primary
Year Boys Girls Total GPI
2013 74% 52% 63% 0.70
2012 74% 51% 63% 0.69
2011 78% 51% 65% 0.66
2010 79% 49% 65% 0.62
2009 83% 47% 66% 0.57
Effective Transition Rate from Primary to Secondary (General) Education GPI for the transition rate from primary to secondary education was 0.89 in 2013 down from 0.99 in 2009. It has decreased because the transition rate for boys has improved at a much higher rate (95%) than that for girls (85%).
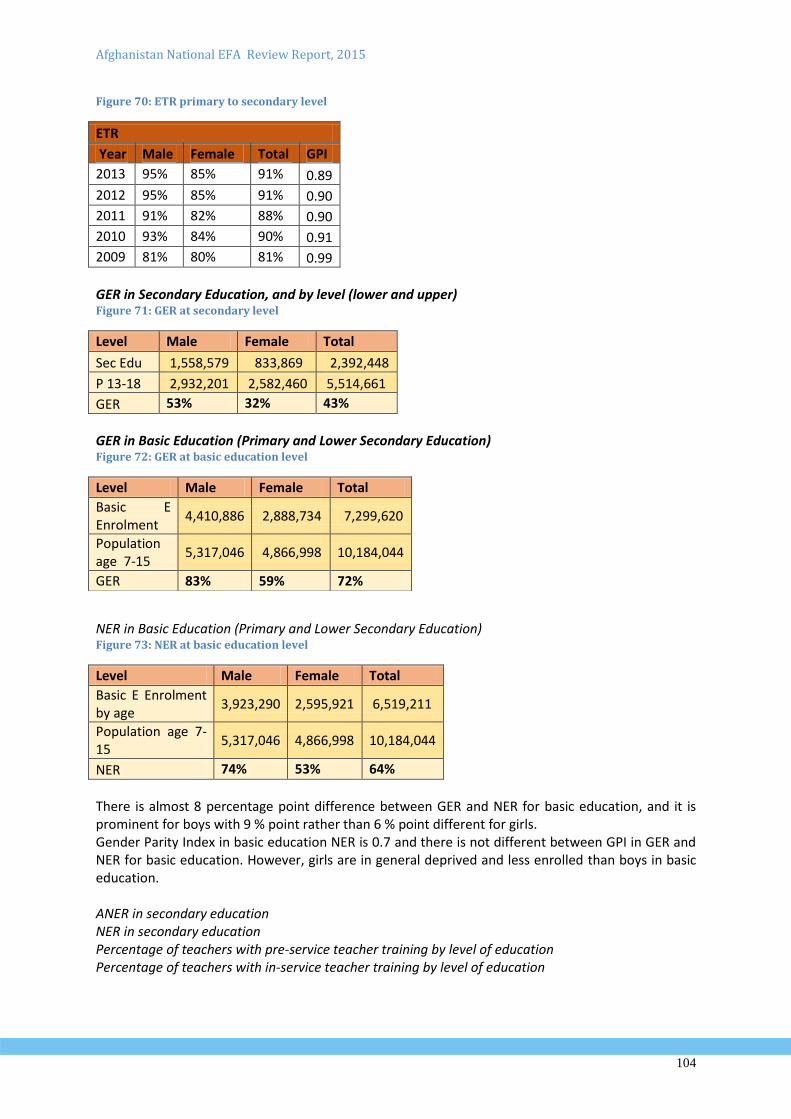
Afghanistan National EFA Review Report, 2015
104
Figure 70: ETR primary to secondary level
ETR
Year Male Female Total GPI
2013 95% 85% 91% 0.89
2012 95% 85% 91% 0.90
2011 91% 82% 88% 0.90
2010 93% 84% 90% 0.91
2009 81% 80% 81% 0.99
GER in Secondary Education, and by level (lower and upper) Figure 71: GER at secondary level
Level Male Female Total
Sec Edu 1,558,579 833,869 2,392,448
P 13-18 2,932,201 2,582,460 5,514,661
GER 53% 32% 43%
GER in Basic Education (Primary and Lower Secondary Education) Figure 72: GER at basic education level
NER in Basic Education (Primary and Lower Secondary Education) Figure 73: NER at basic education level
Level Male Female Total
Basic E Enrolment by age
3,923,290 2,595,921 6,519,211
Population age 7-15
5,317,046 4,866,998 10,184,044
NER 74% 53% 64%
There is almost 8 percentage point difference between GER and NER for basic education, and it is prominent for boys with 9 % point rather than 6 % point different for girls. Gender Parity Index in basic education NER is 0.7 and there is not different between GPI in GER and NER for basic education. However, girls are in general deprived and less enrolled than boys in basic education. ANER in secondary education NER in secondary education Percentage of teachers with pre-service teacher training by level of education Percentage of teachers with in-service teacher training by level of education
Level Male Female Total
Basic E Enrolment
4,410,886 2,888,734 7,299,620
Population age 7-15
5,317,046 4,866,998 10,184,044
GER 83% 59% 72%
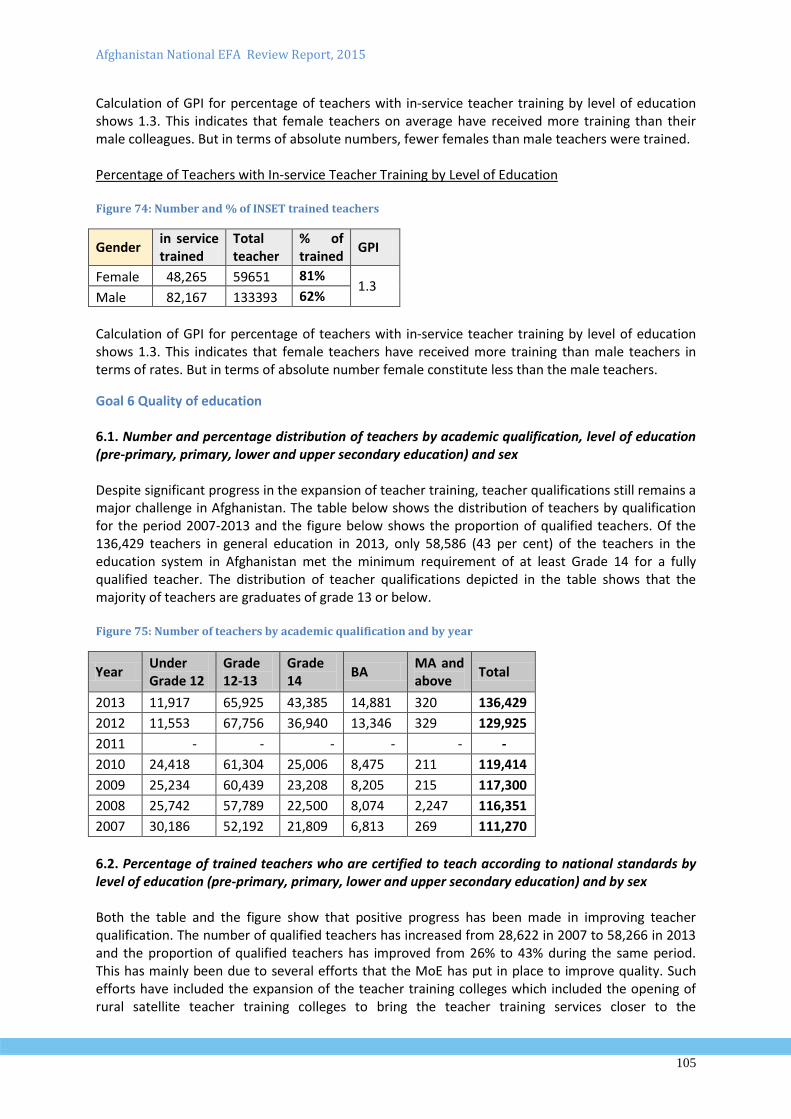
Afghanistan National EFA Review Report, 2015
105
Calculation of GPI for percentage of teachers with in-service teacher training by level of education shows 1.3. This indicates that female teachers on average have received more training than their male colleagues. But in terms of absolute numbers, fewer females than male teachers were trained. Percentage of Teachers with In-service Teacher Training by Level of Education Figure 74: Number and % of INSET trained teachers
Gender in service trained
Total teacher
% of trained
GPI
Female 48,265 59651 81% 1.3
Male 82,167 133393 62%
Calculation of GPI for percentage of teachers with in-service teacher training by level of education shows 1.3. This indicates that female teachers have received more training than male teachers in terms of rates. But in terms of absolute number female constitute less than the male teachers.
Goal 6 Quality of education 6.1. Number and percentage distribution of teachers by academic qualification, level of education (pre-primary, primary, lower and upper secondary education) and sex Despite significant progress in the expansion of teacher training, teacher qualifications still remains a major challenge in Afghanistan. The table below shows the distribution of teachers by qualification for the period 2007-2013 and the figure below shows the proportion of qualified teachers. Of the 136,429 teachers in general education in 2013, only 58,586 (43 per cent) of the teachers in the education system in Afghanistan met the minimum requirement of at least Grade 14 for a fully qualified teacher. The distribution of teacher qualifications depicted in the table shows that the majority of teachers are graduates of grade 13 or below. Figure 75: Number of teachers by academic qualification and by year
Year Under Grade 12
Grade 12-13
Grade 14
BA MA and above
Total
2013 11,917 65,925 43,385 14,881 320 136,429
2012 11,553 67,756 36,940 13,346 329 129,925
2011 - - - - - -
2010 24,418 61,304 25,006 8,475 211 119,414
2009 25,234 60,439 23,208 8,205 215 117,300
2008 25,742 57,789 22,500 8,074 2,247 116,351
2007 30,186 52,192 21,809 6,813 269 111,270
6.2. Percentage of trained teachers who are certified to teach according to national standards by level of education (pre-primary, primary, lower and upper secondary education) and by sex Both the table and the figure show that positive progress has been made in improving teacher qualification. The number of qualified teachers has increased from 28,622 in 2007 to 58,266 in 2013 and the proportion of qualified teachers has improved from 26% to 43% during the same period. This has mainly been due to several efforts that the MoE has put in place to improve quality. Such efforts have included the expansion of the teacher training colleges which included the opening of rural satellite teacher training colleges to bring the teacher training services closer to the
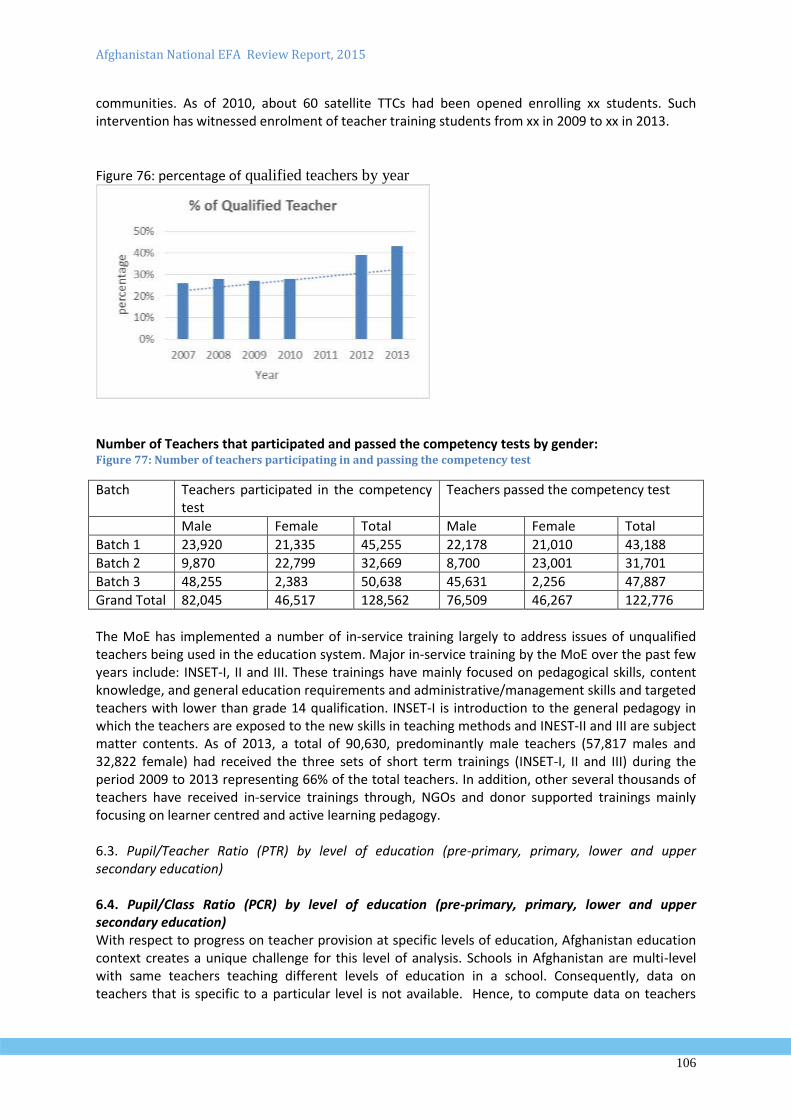
Afghanistan National EFA Review Report, 2015
106
communities. As of 2010, about 60 satellite TTCs had been opened enrolling xx students. Such intervention has witnessed enrolment of teacher training students from xx in 2009 to xx in 2013.
Figure 76: percentage of qualified teachers by year
Number of Teachers that participated and passed the competency tests by gender: Figure 77: Number of teachers participating in and passing the competency test
Batch Teachers participated in the competency test
Teachers passed the competency test
Male Female Total Male Female Total
Batch 1 23,920 21,335 45,255 22,178 21,010 43,188
Batch 2 9,870 22,799 32,669 8,700 23,001 31,701
Batch 3 48,255 2,383 50,638 45,631 2,256 47,887
Grand Total 82,045 46,517 128,562 76,509 46,267 122,776
The MoE has implemented a number of in-service training largely to address issues of unqualified teachers being used in the education system. Major in-service training by the MoE over the past few years include: INSET-I, II and III. These trainings have mainly focused on pedagogical skills, content knowledge, and general education requirements and administrative/management skills and targeted teachers with lower than grade 14 qualification. INSET-I is introduction to the general pedagogy in which the teachers are exposed to the new skills in teaching methods and INEST-II and III are subject matter contents. As of 2013, a total of 90,630, predominantly male teachers (57,817 males and 32,822 female) had received the three sets of short term trainings (INSET-I, II and III) during the period 2009 to 2013 representing 66% of the total teachers. In addition, other several thousands of teachers have received in-service trainings through, NGOs and donor supported trainings mainly focusing on learner centred and active learning pedagogy. 6.3. Pupil/Teacher Ratio (PTR) by level of education (pre-primary, primary, lower and upper secondary education) 6.4. Pupil/Class Ratio (PCR) by level of education (pre-primary, primary, lower and upper secondary education) With respect to progress on teacher provision at specific levels of education, Afghanistan education context creates a unique challenge for this level of analysis. Schools in Afghanistan are multi-level with same teachers teaching different levels of education in a school. Consequently, data on teachers that is specific to a particular level is not available. Hence, to compute data on teachers
Afghanistan National EFA Review Report, 2015
107
that was specific to primary school level, estimations were used based on the number of students in primary. 6.5. Textbook/Pupil Ratio (TPR) by level of education (pre-primary, primary, lower and upper secondary education) and by subject Afghanistan has made significant progress in terms of textbook provision over the years. Since 2003, a total of 219 million textbooks have been printed for distribution to all learners throughout the country and 21 million textbooks were printed for distribution in 2012. The textbook: pupil ratio is currently at 1:6. Data on textbook ratio that is specific to various levels of education is not available. Provision of textbooks to all formal primary schools in all subject areas is an annual government programme. However, enough copies of textbooks to meet all learners enrolled in primary schools nationwide for a 1:1 textbook ratio are printed annually. The challenge for not reaching the 1:1 textbook ratio is mainly related to distribution capacity rather than shortage of the textbooks. 6.6. Current public expenditure on textbooks and other learning materials as a percentage of current public expenditure by level of education (primary, lower and upper secondary education) Refer to section on Public expenditure on education pp. 56 ff. 6.7. Teachers’ compensation as a percentage of current public expenditure by level of education (primary, lower and upper secondary education) 6.8. Percentage of schools with improved water sources by level of education (pre-primary, primary, lower and upper secondary education) 6.9. Percentage of schools with improved sanitation facilities (i.e. with separate toilets for girls) by level of education (pre-primary, primary, lower and upper secondary education) 3.6.10. Percentage of pupils who have mastered nationally defined basic learning competencies (in particular literacy, numeracy and life skills) by grade (e.g. 3rd and last grade of primary education, and 8th grade or last grade of lower secondary education) and by sex
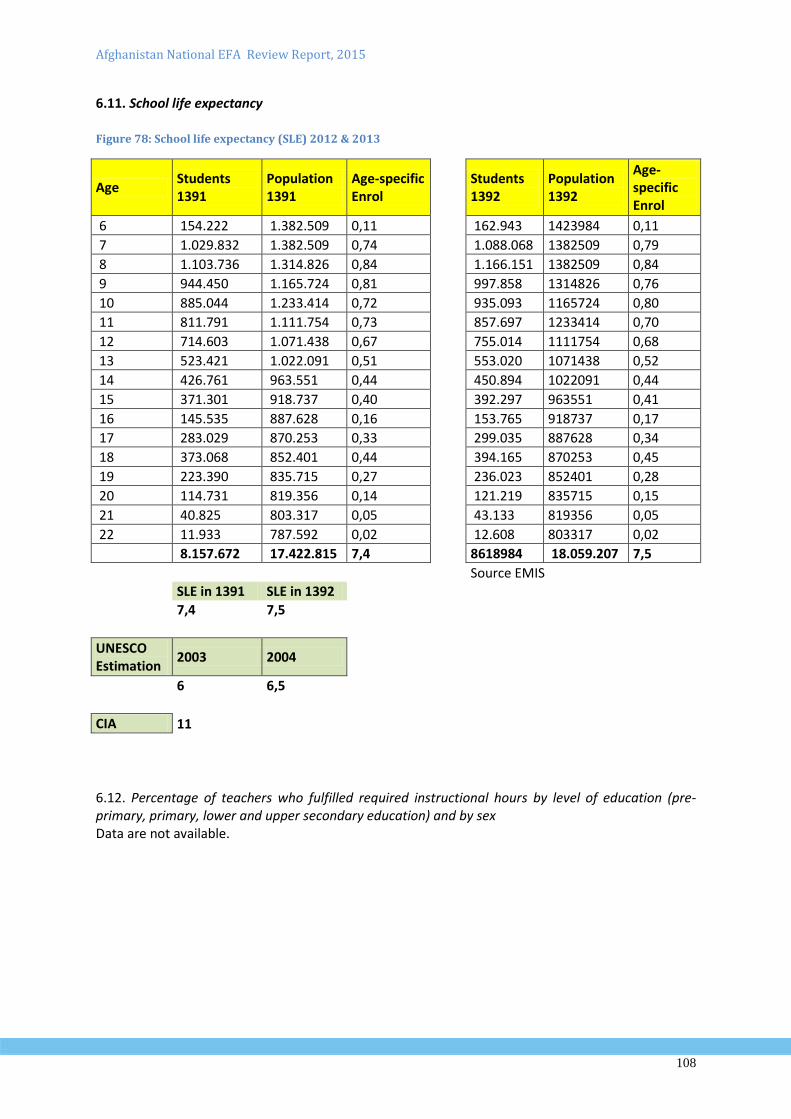
Afghanistan National EFA Review Report, 2015
108
6.11. School life expectancy
Figure 78: School life expectancy (SLE) 2012 & 2013
Age Students 1391
Population 1391
Age-specific Enrol
Students 1392
Population 1392
Age-specific Enrol
6 154.222 1.382.509 0,11 162.943 1423984 0,11
7 1.029.832 1.382.509 0,74 1.088.068 1382509 0,79
8 1.103.736 1.314.826 0,84 1.166.151 1382509 0,84
9 944.450 1.165.724 0,81 997.858 1314826 0,76
10 885.044 1.233.414 0,72 935.093 1165724 0,80
11 811.791 1.111.754 0,73 857.697 1233414 0,70
12 714.603 1.071.438 0,67 755.014 1111754 0,68
13 523.421 1.022.091 0,51 553.020 1071438 0,52
14 426.761 963.551 0,44 450.894 1022091 0,44
15 371.301 918.737 0,40 392.297 963551 0,41
16 145.535 887.628 0,16 153.765 918737 0,17
17 283.029 870.253 0,33 299.035 887628 0,34
18 373.068 852.401 0,44 394.165 870253 0,45
19 223.390 835.715 0,27 236.023 852401 0,28
20 114.731 819.356 0,14 121.219 835715 0,15
21 40.825 803.317 0,05 43.133 819356 0,05
22 11.933 787.592 0,02 12.608 803317 0,02
8.157.672 17.422.815 7,4 8618984 18.059.207 7,5
Source EMIS
SLE in 1391 SLE in 1392
7,4 7,5
UNESCO Estimation
2003 2004
6 6,5
CIA 11
6.12. Percentage of teachers who fulfilled required instructional hours by level of education (pre-primary, primary, lower and upper secondary education) and by sex Data are not available.
Afghanistan National EFA Review Report, 2015
109


