AFFECT - cdc.gov · AFFECT: Anxiety and Depression Kristen Miller United States, National Center...
44
AFFECT: Anxiety and Depression Kristen Miller United States, National Center for Health Statistics
Transcript of AFFECT - cdc.gov · AFFECT: Anxiety and Depression Kristen Miller United States, National Center...
AFFECT: Anxiety and Depression
Kristen MillerUnited States, National Center for Health Statistics

How often do you feel worried, nervous or anxious? Daily, Weekly, Monthly, A few times a year, or Never?
Do you take medication for these feelings?
Thinking about the last time you felt worried, nervous or anxious, how would you describe the level of these feelings: a little, a lot, or somewhere in between a little and a lot?
If somewhere in between: Would you say the depression was closer to a little, closer to a lot, or exactly in the middle?

How often do you feel depressed? Daily, weekly, monthly, a few times a year, or never?
Do you take medication for depression?
Thinking about the last time you felt depressed, how depressed did you feel, a little, a lot, or somewhere in between a little and a lot?
If somewhere in between: Would you say the depression was closer to a little, closer to a lot, or exactly in the middle?

Granada Group Findings

Constructs: Explanations for feelings
Anxiety Depression
1. Diagnosed anxiety
1. Stress/worry: family, financial, health, workload
2. Feelings of depression
3. Antsy/positive
1. Diagnosed depression
2. Stress/worry: family, financial, health, workload
3. Mood-related/Fleeting
4. Grief

How often do you feel worried, nervous or anxious?
How often do you feel depressed?
DailyWeeklyMonthly
A few times per yearNever
DependsOther
Always/Very FrequentlyMissing
0 10 20 30 40

Constructs:
Anxiety Depression
Stress or Stress or Worries Worries
Clinical Clinical Anxiety Depression
Mood-Feelings of related/Fledepression eting
Antsy, Positive or GriefProductive Energy
0 20 40 60 80 0 20 40

Anxiety construct by Reported frequency
Antsy, Positive or Productive
Energy
Stress or Worries
DepressionDiagnosed
Clinical Anxiety
A few/year 13
Monthly 1 9
Weekly 1 12 1
Daily 2 15 3 5

Depression construct by Reported frequency
Mood-related/Fleeting
Stress or Worries
GriefClinical,
Diagnosed Depression
A few times a year 6 13 1
Monthly 5 6 1
Weekly 1 3 2 2
Daily 1 8 3

Do you take medication for these feelings? (N=
Do you take medication for depression?
70No 71
Yes 12
Refused 1
Missing 11
0 20 40 60 80

Medication: Do you take medication for these feelings?
Anxiety Depression
Prescribed medicines for anxiety: e.g. zoloft, prozac, sleeping pills
Self-admin. remedies: herbal medicines (e.g. valerian), teas, alcohol
Prescribed medicines
Unlike anxiety, no herbal meds or sleeping pills included
Some confusion over reporting anxiety meds vsdepression meds

Frequency: Anxiety & Depression Response Categories:
A few R’s asked about meanings of response categories. e.g. what does daily mean? Does it mean constant? e.g. If it happens a few times a week, does that mean
weekly?
Some R’s answer “a few times a year,” which turns out to be “Never.”
(Turns into False Positive reports; depending on answer to intensity of “last time” could wrongly characterize someone)

Reference Period: How often do you feel …? (For unspecified question)
Anxiety Depression
Current Moment
11
9
20No time frame/generally
Past month3
8
18
Past year
33 Other 27

Thinking about the last time you felt worried, nervous or anxious, how would you describe the level of these feelings?
Thinking about the last time you felt depressed, how depressed did you feel?
A little
Closer to a little
Exactly in the middle
Closer to a lot
A lot
Missing/Not asked
0 10 20 30 40

Intensity: Anxiety & DepressionMagnitude/Level : Mostly, not clear why levels were picked (For Anxiety) Range of rationales provided: (Primarily for Depression)
Amount of impact Ability to recover Speed of recovery The level of importance Only worry about the small things Only worry about serious issues
Time Frame Considered: Varies across respondents, even when specified R’s not always consistent in the way they use time frame

Reference Period: Thinking about the last time you felt …,? (For specified question)
Anxiety Depression
Literally, the last time
3 4 No specific time
42
22 37The most severe
1421
Other
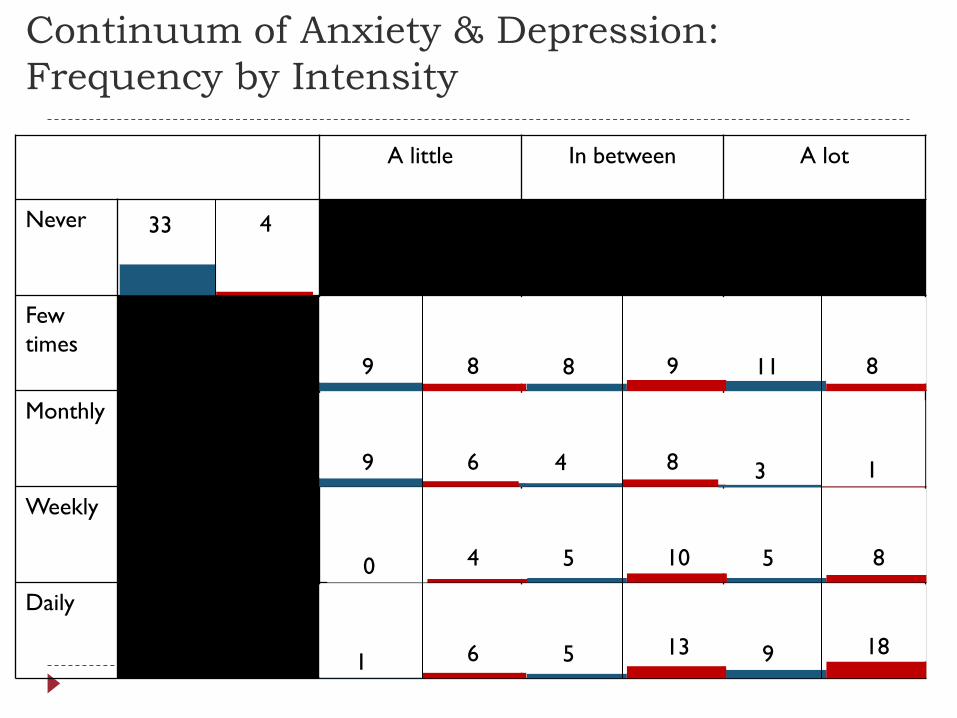
Continuum of Anxiety & Depression: Frequency by Intensity
A little In between A lot
Never 33 4
Few times
9 8 8 9 11 8
Monthly
9 6 4 8 3 1
Weekly
0 4 5 10 5 8
Daily
1 6 5 13 9 18

Depression: Continuum based on narrative
None Low Medium High Unable to Code
18 16 11 5 26
Not based on answers to survey questions; only story Impact on life Ability to get through the depression Needing outside help to cope

Depression: Narrative vs. Survey Question
None Low Medium HighUnable to
Code
Never 13 1 1 11
FewTimes/Little 3 3 1
FewTimes/Between 1 2 3
Daily/Little 1
FewTimes/Alot 1 1 4
Monthly/Between 1 2
Monthly/Little 1 4 1 1
Monthly/Alot 1
Weekly/Between 1 3
Weekly/Alot 2 2
Daily/Between 2 1 1
Daily/Alot 1 3 2 1
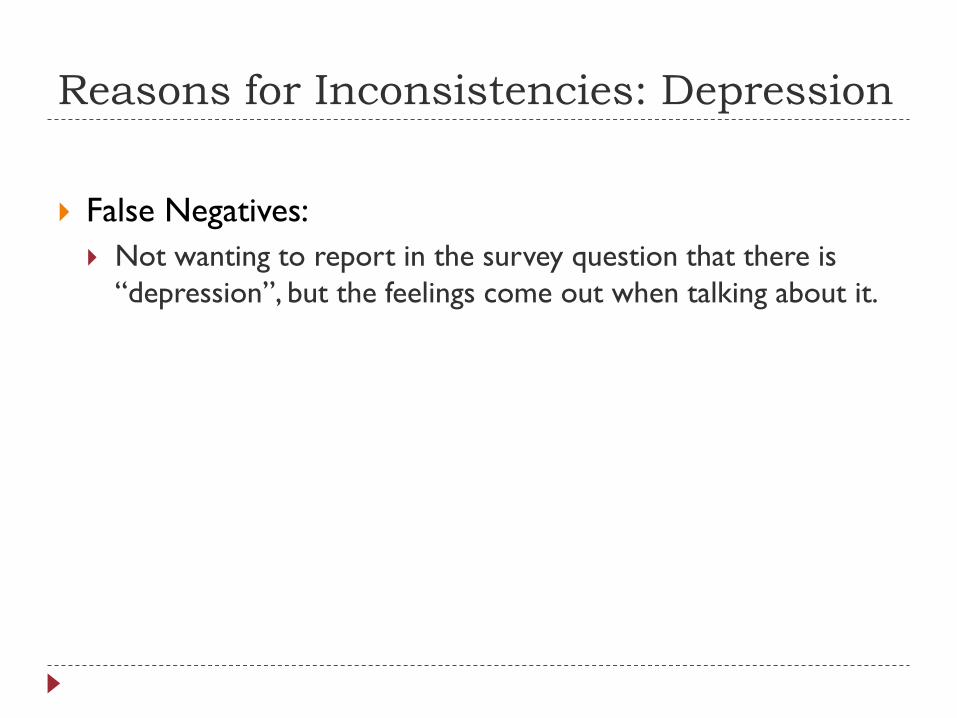
Reasons for Inconsistencies: Depression
False Negatives: Not wanting to report in the survey question that there is
“depression”, but the feelings come out when talking about it.

Reasons for Inconsistencies: Depression
False Positives: Not wanting to say never, instead Few Times = Never. Depression is interpreted as a mood or feelings that are
normal. Therefore respondents can incorporate relatively trivial feelings of sadness.
The respondent is not describing feelings of sadness, depression or lethargy, but rather worry and/or anxiety
Respondents are talking about significant depression but it is not as severe.

Depression: Narrative vs. Survey Question None Low Medium High
Never 13 A A
FewTimes/LittleB/C,B, B 3
FewTimes/Between C 2
Daily/Little 1
FewTimes/Alot 1 1
Monthly/Between 1
Monthly/Little C 4 1
Monthly/Alot 1
Weekly/Between 1
Weekly/Alot 2 2
Daily/Between E, D 1 1
Daily/Alot C E, E, E 2
A. Not reportingB. Few Times = NeverC. Depression as
normal feelingsD. Worry and/or
anxietyE. Significant but not as
severe.

Anxiety: Continuum based on narrative
None Low Medium High Unable to Code
7 21 22 13 26
Not based on answers to survey questions; only story Impact on life Ability to get through the depression Needing outside help to cope

Anxiety: Narrative vs. Survey Question None Low Medium High Difficult to Code
Never 1 1 1
FewTimes/Little 4 4
FewTimes/Between 1 2 1
Monthly/Little 2 2 2
FewTimes/Alot 1 3 2
Monthly/Between 3 1
Weekly/Little 3
Daily/Little 1 1 4
Monthly/Alot 2 1
Weekly/Between 5 1 1
Weekly/Alot 1 3 3
Daily/Between 5
Daily/Alot 4 11 3

Reasons for Inconsistencies: Anxiety
False Negatives: Not reporting anxiety, but the feelings come out when
talking about it. (not clear why)
Could be coded differently

Reasons for Inconsistencies: Anxiety
False Positives: Not wanting to say never, instead Few Times = Never. “Normal” Feelings: Liberal definition of construct Fleeting “Normal”
Could be coded differently

Anxiety: Narrative vs. Survey Question None Low Medium High
Never 1 A
FewTimes/Little B,C,B/C,B/C 4
FewTimes/Between B 2
Monthly/Little 2 2
FewTimes/Alot B C, B,B 2
Monthly/Between C,C, D
Weekly/Little D,D,D
Daily/Little 1 E
Monthly/Alot C,C
Weekly/Between 5 1
Weekly/Alot C 3
Daily/Between C,D,D,D,D,
Daily/Alot C,D,D,D 11
A. Not reportingB. Few Times =
NeverC. Normal feelingsD. Could be
coded differently

ESCAP Field Test Findings

ESCAP: Summary of Affect Cognitive Findings
Granada Group: less detailed information, similar findings
Some interpretations potentially out of scope
Consistency question problematic
Medication question problematic
Variation in basis for answers (which may be related to socio-cultural factors)

Anxiety: Frequency
Frequency Kazakhstan CambodiaSri
Lanka Maldives Mongolia PhilippinesAll
CountriesNever 31.9% 39.7% 78.4% 46.6% 35.4% 54.3% 47.3%
Few times a year
22.9 28.7 7.5 27.3 25.6 25.3 23.0
Monthly 13.6 14.5 2.7 5.7 12.8 10.8 10.1
Weekly 17.6 9.2 2.1 9.0 12.4 7.7 9.7
Daily 13.3 7.4 8.1 11.0 13.6 1.7 9.3
Refused 0.2 0.0 0.1 0.1 0.1 0.0 0.1
Don’t know 0.5 0.5 1.1 0.4 0.3 0.2 0.5
100 100 100 100 100 100 100
N (1000) (1008) (1000) (1013) (1222) (1066) (6309)
Table 1. Frequency of anxiety by country.

Anxiety: IntensityIntensity by Country
Kazakhstan Cambodia Sri Lanka Maldives Mongolia PhilippinesAll
CountriesA little 64.0% 62.7% 54.4% 39.4% 65.6% 83.5% 62.4%
Closer to a little
4.9 2.0 2.0 1.7 4.3 1.4 3.0
In between
10.2 18.6 6.4 15.1 6.8 6.8 11.0
Closer to a lot
6.7 2.2 2.0 1.1 5.1 0.4 3.3
A lot 12.9 14.1 34.8 40.9 16.9 7.2 19.2
Refused 0.2 0.0 0.0 0.0 0.3 0.0 0.1
Don’t know
1.2 0.5 0.5 1.9 1.0 0.6 1.0
100 100 100 100 100 100 100
N (675) (603) (204) (536) (785) (486) (3289)

Anxiety:Joint distribution of anxiety frequency and intensity
A few times a
year
Monthly Weekly Daily DK/REF
A little 1087 423 328 214 1
Closer to a little
35 25 27 12 0
In between 122 85 95 59 0
Closer to a lot 22 16 39 33 0
A lot 163 86 122 259 0
DK/REF 22 3 3 7 1
Note. Polychoric correlation = .42

Additional Probe Questions
Please tell me which of the following statements, if any, describe your feelings.
1. My feelings are caused by the type and amount of work I do.
2. Sometimes the feelings can be so intense that my chest hurts and I have trouble breathing.
3. These are positive feelings that help me to accomplish goals and be productive.
4. The feelings sometimes interfere with my life, and I wish that I did not have them.
5. If I had more money or a better job, I would not have these feelings.
6. Everybody has these feelings; they are a part of life and are normal.

Additional Probe Questions
In-Scope, Valid Interpretations
1. Chest Hurts: Sometimes the feelings can be so intense that my chest hurts and I have trouble breathing.
2. Interfere: The feelings sometimes interfere with my life, and I wish that I did not have them
3. Clinical: I have been told by a medical professional that I have anxiety.
Out-of-Scope, Not Valid Interpretations
1. Positive: These are positive feelings that help me to accomplish goals and be productive.
2. Normal: Everybody has these feelings; they are a part of life and are normal.

Percentage of Reporting Anxiety Characteristics
90
80
70
60
50
40
30
20
10
0
Positive Normal Chest Interfere Clinical

AnxietyPercent reporting various descriptions of anxiety by country
Kazakhstan CambodiaSri
Lanka Maldives Mongolia Philippines
Out-of-Scope, Not Valid Interpretations
Positive 50.3% 47.8% 12.6% 51.7% 82.5% 32.4%
Normal 81.5 71.3 75.4 86.7 85.7 81.2
In-Scope, Valid Interpretations
Chest hurts
21.4 72.3 30.9 37.0 50.6 20.3
Interfere 52.2 65.0 85.4 54.8 72.8 33.5
Clinical 11.8 16.8 3.0 28.4 18.6 11.5Note. Chi-square p <.05 for all rows in the table.

“Validity” Variable for all countries
Error: Only Positive &/or Normal
Valid: Only Clinical, Interfere, &/or Chest Hurts
Mix
0 500 1000 1500 2000 2500

“Validity” by countries
100%90%
50 47 25 19 1636
80%70%60%50%40%30%20%10%0%
192
ValidMixError
344 327613
431127
208235
14217 10741

Reports of Anxiety by Country
80
70
60
50
40 Total Reports of 30
20
Anxiety"Valid" Reports of Anxiety
10
0

Depression: Frequency
Frequency Kazakhstan CambodiaSri
Lanka Maldives Mongolia PhilippinesAll
CountriesNever 68.4% 46.6% 87.3% 58.3% 46.8% 62.7% 61.2%
Few times a year
22.2 26.9 6.8 22.3 27.4 23.9 21.8
Monthly 5.0 13.9 1.5 4.3 10.7 5.3 6.9
Weekly 2.5 5.9 0.7 7.4 10.2 5.6 5.6
Daily 1.5 6.7 2.8 7.1 4.8 2.3 4.2
Refused 0.0 0.0 0.1 0.1 0.0 0.0 0.0
Don’t know 0.4 0.1 0.8 0.4 0.1 0.3 0.3
100 100 100 100 100 100 100
N (1000) (1008) (1000) (1013) (1222) (1066) (6309)
Table 1. Frequency of anxiety by country.

Depression: IntensityIntensity by Country
Kazakhstan Cambodia Sri Lanka Maldives Mongolia PhilippinesAll
CountriesA little 34.0% 66.7% 45.8% 32.9% 65.9% 71.8% 56.3%
Closer to a little
8.3 2.2 0.9 3.1 5.1 2.8 4.0
In between
22.1 15.6 11.0 13.7 6.8 6.8 12.1
Closer to a lot
7.7 1.5 0.9 0.5 5.9 1.3 3.2
A lot 26.9 13.8 39.8 48.9 15.9 16.6 23.8
Refused 0.3 0.0 0.0 0.0 0.0 0.5 0.1
Don’t know
0.6 0.2 1.7 1.0 0.6 0.3 0.6
100 100 100 100 100 100 100
N (312) (537) (118) (417) (650) (397) (2431)
Chi-square = 420.45, 20 df, p < .05

Depression:Joint distribution of depression frequency and intensity
A few times a
year
Monthly Weekly Daily DK/REF
A little 893 250 162 63 0
Closer to a little 58 19 13 5 0
In between 145 69 55 25 0
Closer to a lot 29 24 17 8 0
A lot 239 74 103 161 0
DK/REF 11 0 1 2 1
Note. Polychoric correlation = .38

Conclusion Frequency and Intensity appear to be 2 important
concepts that tap into different aspects of affect Some overlap in constructs, but also tapping different
phenomena Appears: Anxiety potential for more over-reports;
Depression potential for more under-reports Concern about cultural comparability

Recommendation Keep the questions as they are
More work to: Understand cross-cultural differences Determine appropriate cut-off points Understand the error