
Aesthetic and value judgment of neotenous objects: Cuteness as a ...
120
Aesthetic and value judgment of neotenous objects: Cuteness as a design factor and its effects on product evaluation by Sookyung Cho A dissertation submitted in partial fulfillment of the requirements for the degree of Doctor of Philosophy (Design Science) at The University of Michigan 2012 Doctoral Committee: Professor Richard D. Gonzalez, Co-Chair Associate Professor Carolyn Yung-Jin Yoon, Co-Chair Professor Phoebe C. EllsworthAssociate Professor Jan-Henrik Andersen
Transcript of Aesthetic and value judgment of neotenous objects: Cuteness as a ...

Aesthetic and value judgment of neotenous objects: Cuteness as a design factor and its effects on product evaluation
by
Sookyung Cho
A dissertation submitted in partial fulfillment of the requirements for the degree of
Doctor of Philosophy (Design Science)
at The University of Michigan 2012
Doctoral Committee:
Professor Richard D. Gonzalez, Co-Chair Associate Professor Carolyn Yung-Jin Yoon, Co-Chair Professor Phoebe C. EllsworthAssociate Professor Jan-Henrik Andersen

© Sookyung Cho

ii
DEDICATION
To Gemma

iii
ACKNOWLEDGEMENTS
I’d like to thank my two advisors, Richard Gonzalez and Carolyn Yoon, deeply for their
supportive encouragement and intellectual stimulation throughout. I am very grateful to
two committee members, Phoebe Ellsworth and Jan-Henrik Andersen, for astute and
insightful criticism; to Bill Gehring, Venket Ramaswamy, and Panos Papalambros, for
motivating my academic progress; to Design Science/Marketing/Psychology cohorts
Jihye Kim, Christine Kang, Elliott Manzon, Pouya Ethsani and Nicky Newton, for their
generous support in various aspects; and to Shaw Lacy, Laura Hunter, and Keryn
Thompson-Kolar, for their proofreading and editing. Finally, this manuscript would not
have been created without support from my family. Special thanks to Liam and Lena for
their support in physical and biological conditions by keeping me awake through
countless nights and staying positive through oxytocin; to Anco for his prototypicality of
wholesome neoteny; and last, but not least, to Austin Lee, the source of my inspiration,
for his mentoring research skills in social science and for his devoted partnership.
iv
TABLE OF CONTENTS
DEDICATION .................................................................................................................... ii
ACKNOWLEDGEMENTS ............................................................................................... iii
LIST OF TABLES ........................................................................................................... viii
LIST OF APPENDICES .................................................................................................... ix
ABSTRACT ....................................................................................................................... xi
Chapter 1 Introduction ........................................................................................................ 1
Neoteny and aesthetic judgment ..................................................................................... 5
Neoteny and value judgment .......................................................................................... 8
Chapter 2 Norming study .................................................................................................. 13
Literature review: Dimensions of cuteness ................................................................... 13
1) Size – smallness .................................................................................................... 13
2) Shape – roundness ................................................................................................ 14
3) Structure – simplicity ............................................................................................ 14
4) Color and texture – lightness and softness ........................................................... 15

v
5) Proportion – wideness .......................................................................................... 15
6) Arrangement – tiltedness ...................................................................................... 15
7) Metaphor – anthropomorphism ............................................................................ 16
8) Border – thickness ................................................................................................ 16
Hypotheses .................................................................................................................... 18
Method .......................................................................................................................... 18
Results ........................................................................................................................... 19
Discussion ..................................................................................................................... 21
Chapter 3 Parametric study ............................................................................................... 22
Parametric study: Designing a cute rectangle ............................................................... 23
Hypotheses ................................................................................................................ 23
Method ...................................................................................................................... 24
Results ....................................................................................................................... 25
Discussion ................................................................................................................. 26
Parametric coding study ................................................................................................ 31
Method ...................................................................................................................... 31
Results ....................................................................................................................... 31
vi
Discussion ..................................................................................................................... 33
Chapter 4 Cultural semantic study .................................................................................... 35
Literature review: Meaning of cuteness ........................................................................ 35
Method .......................................................................................................................... 39
Results ........................................................................................................................... 40
Discussion ..................................................................................................................... 43
Chapter 5 Asymmetric dominance .................................................................................... 46
Literature review: Asymmetric dominance effect ........................................................ 47
Trade-off contrasts .................................................................................................... 47
Extremeness aversion ................................................................................................ 49
Culture, attitudes, and preference shifts .................................................................... 50
Hypothesis..................................................................................................................... 50
Method .......................................................................................................................... 51
Participants ................................................................................................................ 52
Procedure and measurement ..................................................................................... 53
Stimuli and manipulation check ................................................................................ 53
Results ........................................................................................................................... 54

vii
Interaction between culture and gender .................................................................... 58
Discussion ..................................................................................................................... 60
Chapter 6 Conclusion ........................................................................................................ 65
Appendices ........................................................................................................................ 68
References ....................................................................................................................... 103

viii
LIST OF TABLES
Table 2-1 Examples of mean ratings for perceived cuteness ............................................ 20
Table 2-2 Examples of mean ratings for positive aesthetics ............................................. 20
Table 3-1 Significant regression coefficients in model 1 ................................................. 32
Table 3-2 Significant regression coefficients in model 2 ................................................. 33
Table 4-1 Mean differences of overall perceived cuteness and meanings in two countries
........................................................................................................................................... 41
Table 4-2 Mean difference of perceived cuteness and meanings for the 33rd rectangle in
two countries ..................................................................................................................... 41
Table 5-1 Cultural difference on perceived neoteny ......................................................... 57
Table 5-2 Gender difference on perceived neoteny of stimuli ......................................... 58

ix
LIST OF APPENDICES
Appendix 1-1: Neotenic cues in young animals ............................................................... 68
Appendix 1-2: Juvenilization of the artifact design - the case of Mickey Mouse and
Teddy Bears ...................................................................................................................... 69
Appendix 1-3: Police Mascots in Japan ............................................................................ 70
Appendix 2-1: Examples of mini products ....................................................................... 71
Appendix 2-2: Examples of round-shaped products ......................................................... 72
Appendix 2-3: Examples of simplification ....................................................................... 73
Appendix 2-4: Examples of soft colored products ........................................................... 74
Appendix 2-5: Examples of experiment stimuli with manipulated proportion ................ 75
Appendix 2-6: Examples of old and new logo designs ..................................................... 76
Appendix 2-7: Examples of anthropomorphic products ................................................... 77
Appendix 2-8: Examples of thick-border drawings .......................................................... 78
Appendix 2-9: Stimuli sets for norming test ..................................................................... 79
Appendix 3-1: Screenshot of the cute rectangle design program ..................................... 88
x
Appendix 3-2: Final figure with average values of each dimension ................................ 89
Appendix 4-1: 32 Rectangles representing dimensional characteristics (ex. HHHHH: light
and pale in color, wide in proportion, tilted in angle, round in shape, and small in size) 90
Appendix 4-2: The perceived cuteness mean differences between High and Low
condition of each dimension, by culture ........................................................................... 92
Appendix 5-1: Stimuli and manipulation checks .............................................................. 95
Appendix 5-2: Preference shifts in choice sets ................................................................. 96
Appendix 5-3: Cultural difference in perceived cuteness of Alarm clock ........................ 97
Appendix 5-4: Overall cuteness ratings between gender by culture ................................. 98
Appendix 5-5: Gender and cultural differences in perceived cuteness of alarm clock .... 99
Appendix 5-6: Gender and cultural differences in perceived cuteness of Cars .............. 100
Appendix 5-7: Z-tests of cultural difference in perceived meaning ............................... 101

xi
ABSTRACT
From the perspective of evolutionary psychology, neoteny entails the specific
appearance and traits of babies that tend to trigger protective behaviors by adults. Based
on Lorenz (1970), five dimensions of neotenic cues were examined. The following
exploratory study was designed to identify whether those determinants of perceived
cuteness could be applied to abstract geometric forms. Participants were asked to design a
cute rectangle by adjusting the size, proportion, roundness, rotation, and color of the
figure. The outcome figures indicated a propensity toward forms that were relatively
small, round-cornered, slightly tilted, and light-colored. Findings support the idea that
smallness, roundness, tiltedness, and lightness of color can serve as determinants of
perceived cuteness in artifact design. However, the evaluation of neotenic designs was
mediated by the meaning of cuteness, and this pattern was supported by data collected in
two countries, the United States and Korea. This cultural difference can be accounted for
by an attitude toward youthfulness.
Furthermore, cultural differences in aesthetic judgment of cuteness in design and
its influence on product choice were investigated. The asymmetric dominance paradigm
was adapted to understand how the cuteness of a product influences choice behavior
among consumers. The study examined whether the introduction of a cute product would
trigger an attraction, a compromise, or a polarization effect on existing products. The

xii
findings suggest a cultural dependence based on how cuteness is evaluated: the attraction
effect of a cute decoy was reversed – i.e., in the U.S., the cute decoy seemed to attract the
choice share of the cute product, while in Korea, the cute decoy contributed to an
increase in the choice share of the non-cute product rather than the cute dominating
product. The attraction, compromise, and polarization effects were more pronounced in
the U.S. where cuteness was more negatively evaluated.

1
Chapter 1
Introduction
In Critique of the power of judgment, Kant (2001) proposed that aesthetic
judgment should mediate how we behave based on what we know. Kant’s insight that
aesthetic judgment affects all decision making influenced the early development of this
dissertation. The main interest of this dissertation is in investigating an axiological model
of aesthetic judgment. Particularly, neotenic cues were investigated to demonstrate how
objective characteristics result in positive aesthetic affections and polarized valences on
products in choice situations. In what follows, three points will be addressed: why this
topic is meaningful, what the specific research questions are, and how the research was
designed.
Decision making has been studied in many aspects (e.g., Gordon, 1996), but
aesthetic judgment has hardly been considered a significant factor. Aesthetic judgment is
subjective in a way that it involves sensory experience, but it is also based on an
objective cause initiated by the perception of the outside world. This object-oriented
aesthetic judgment plays a significant role when choices are made in the marketplace.
Consumer products, for example, are presented in various forms designed thoughtfully to
attract individuals’ preferences. Despite the modern design philosophy of “form follows
function” (Sullivan, 1896), it is still easy to see that the aesthetics of an object contribute

2
to the consumer’s decision beyond the product’s utilitarian purpose (e.g., Solomon, 1983;
Veryzer & Hutchinson, 1998). Thus, the aesthetic judgment pronounced upon the product
design needs to be investigated in the frame of decision making.
Moreover, to obtain the objectivity of aesthetic judgment in a decision making
context, neotenic cues were regarded as a salient objective characteristic that generates an
automatic positive feeling of pleasure. The perception of neoteny explicates one of the
outstanding innate releasing mechanisms in animal behavior (Lorenz, 1970) and this
ethological observation is compatible with an evolutionary perspective of inanimate
artifact design. The gradual juvenilization of Mickey Mouse (Gould, 1980) and teddy
bears (Hinde & Barden, 1985) supports an idea that even artifacts have been redesigned
illustrating a human propensity toward neotenous features.
Thus, the present research explores the following:
1) Whether neoteny can be an objective attribute that reveals the existence of
hardwired automata (innate releasing mechanism).
2) Whether an anthropomorphic analogy can be applied to the perception of
neotenic objects, so that babyish features in living creatures can be effective in
artifact design.
3) The dimensions of perceived neoteny and their hierarchy.
4) Whether the positive aesthetic response caused by neotenic design is
compatible with other design attributes in the human value system.
5) Whether the valence of neoteny operates as a significant factor in the
evaluation of design.

3
To answer these questions, the dissertation consists of four empirical studies. The
first three empirical studies focus on aesthetic judgment. First, a norming study was
conducted to examine the role of a set of dimensions on perceived neoteny. This first
study used artificial stimuli to provide more careful control. Based on the dimensions of
perceived neoteny that emerged from this study, the second study involved parametric
variation designed to answer how much variance of each dimension would contribute to
the mental representation of cuteness. An abstract geometric form, a rectangle, was given
to participants, and they were asked to design a cute rectangle by adjusting sliders in an
interactive manner to manipulate each dimension of neoteny, e.g., smallness and
roundness. The third study demonstrates the role of cultural factors in perceptions of
neotenic forms. As the results will show, these three studies contribute to our
understanding of factors contributing to judgments of neotenic designs.
The last axiological study applied the asymmetric dominance paradigm to
demonstrate changes in market share when a new product is introduced, especially when
its attributes are inferior or superior to the pre-existing options in the choice set. As an
objective scale of aesthetics, perceived neoteny was manipulated to show this well-
known contextual effect in the decision-making area. Furthermore, this study guided us
toward a deeper understanding of individuals’ (seemingly irrational) decision-making
processes in the transition from aesthetic judgment to value judgment at the level of
cognition, behavior, and emotion.
The main contribution of this research is a plausible and empirically validated
explanation for one of the transcendental factors of appealing design and the contextual
effect of design evaluation. Human aesthetic judgment is not only based on innate

4
releasing mechanisms but also on acculturated ones, which reflect a sophisticated value
system in social contexts. From a practical perspective, the outcome of this dissertation
will help designers understand what forms are appealing as well as how to systemically
manipulate the positive effects of design.
5
Neoteny and aesthetic judgment
From an evolutionary perspective, neotenic traits are attractive due to their
association with youth. Accordingly, animals are endowed by natural selection to have a
special ability to recognize youth, who have certain features to make them noticed and
appreciated. The representative signaling features of neoteny that trigger such a reaction
are “a relatively large head, predominance of the brain capsule, large and low-lying eyes,
bulging cheek region, short and thick extremities, a springy elastic consistency, and
clumsy movements” (Lorenz, 1970, pp.135-141, see Appendix 1-1: Neotenic cues in
young animals).
Neoteny helps ensure the survival of newborn creatures (Etcoff, 1999; Morris,
Reddy, & Bunting, 1995). Numerous studies on neotenous features have demonstrated
the evidence for a special innate releasing mechanism. Neotenous features have been
found to produce behavioral as well as physiological reactions, particularly including
positive aesthetic judgments.
First, for example, images of cute babies elicit more positive evaluations than
images of less cute babies. Adults prefer infantile appearance (Hildebrandt & Fitzgerald,
1978; Sternglanz, Gray, & Murakimi, 1977); adults have positive affect toward babyish
features, such as high-pitched vocalization (Spindler, 1961) and babyish profiles
(Gardner & Wallach, 1965). Cuter infants are rated as more favorable and healthy (Casey
& Ritter, 1996; Karraker & Stern, 1990; Stephan & Langlois, 1984), and consequently
more adoptable (Volk & Quinsey, 2002). Cute, chubby-faced infants facilitate more
parental nurturing behavior (Bogin, 1988) and engender stronger motivation for
caretaking than those with narrower faces (Glocker et al., 2009; McCabe, 1988).

6
When it comes to the baby-face effect, the neonetic features of large eyes, a small
nose, and a small chin were positively correlated with attractiveness ratings (Korthase &
Trenholme, 1982) as well as with positive judgments such as the perception of sociability,
healthiness, and fidelity (Cunningham, 1986). The disarming effect of a baby face
(Zebrowitz, 1997) has been demonstrated by the tendency of baby-faced people to
receive more lenient sentences than mature-faced offenders (Berry & Zebrowitz-
McArthur, 1988), to be perceived as more trustworthy in a public relations crisis (Duffy
& Burton, 2000; Gorn, Jiang, & Johar, 2008), and to instill increased perceptions of
warmth in the case of black CEOs (Livingston & Pearce, 2009).
Behavioral and physiological data also support the pre-programmed automatic
reaction mechanism to neoteny. A cute baby image encourages adult tolerance (McCabe,
1988) and protectiveness (Alley, 1983). Furthermore, women especially seem to be more
sensitive to neotenic traits. Possible explanations are raised female hormone levels
(Lobmaier, Sprengelmeyer, Wiffen, & Perrett, 2010) and an activated brain system that
mediates reward processing and appetitive motivation, especially among non-parturient
women (Glocker et al., 2009).
Observations of artifact designs provide further evidence of the efficacy of
neoteny on human preference. Lorenz (1970) proposed that an anthropomorphic analogy
enables the automated positive reaction to be prompted not only by babies but also
inanimate objects such as animal dolls – with clear-cut abstraction of these characters,
cute dolls can offer alternative outlets for the maternal drive of childless women. The
power of neoteny is illustrated by cases involving two representative anthropomorphic
artifacts. Mickey Mouse and the teddy bear underwent progressive juvenilization by

7
increases in eye size, head length, and cranial vault size (Gould, 1980) or by lowering the
position of the eyes and raising the position of the nose (Hinde & Barden, 1985). These
examples (see Appendix 1-2: Juvenilization of Mickey Mouse and Teddy Bear) show
how design can change to reflect the human propensity toward cuteness.
However, even though the effects of neoteny are partially understood, it is not
clear what makes something look younger, or how one would design something cute.
Measures of perceived cuteness of existing products may not directly suggest what design
factors should increase cuteness (i.e., would not necessarily lead to a causal model for
neoteny). An empirical investigation requires testing the possibility of extending the
implications from these prior studies into the design scheme of inanimate objects. To
achieve this goal, the first three studies explore form factors underlying perceived
neotenic design.

8
Neoteny and value judgment
The following question concerns how aesthetic judgment in response to neoteny
influences one’s value judgment of objects: Will positive effects from neotenic stimuli
determine a positive evaluation? If not, in what context would people assess this neoteny
negatively despite positive aesthetic affects?
The faculty of desire – the judgment whether it is valuable – provides us with
immediate practical reasons to behave and can be mediated by the feeling of pleasure (i.e.,
aesthetic judgment, Kant, 2001). The value judgment is a decision-making process of
whether people would choose a product in the market, and what people choose is
assumed to be based on the fact that people put more value on that product to elicit a
greater preference to it than to other options.
First, the positive aesthetics caused by neotenic features tends to lead us to judge
objects more positively. This has influenced animal breeding. Pet rabbits, for example,
have been selectively bred to produce cuter ones. These rabbits’ smaller size and shorter
legs make them less able to survive in nature. At zoos, people invest more energy into the
conservation of cute and attractive animals, such as giant pandas. These animals often
function as flagship species to attract substantial funds (Eveleth, 2010; Frynta, Lisková,
Bültmann, & Burda, 2010; Stokes, 2006).
A more convincing speculation on the value of neoteny has been discussed in
evolutionary and developmental biology. First, throughout evolution, human adults have
had more neotenic features, both in juvenile appearance and in behavioral plasticity, than
other primates (we look more like chimp and gorilla infants rather than adults of those
9
species). Second, due to the emphasis on learning, human behaviors require our minds to
remain creative and adaptable, which can be categorized as a juvenile feature.
Furthermore, Brin (1994) pointed out that neoteny (“curiosity and plasticity of behavior”)
or paedomorphosis (“becoming child-shaped”) had also influenced the cycle of human
sexual selection, especially for women. According to Brin (1994), because of
sophisticated human social structure, human species have extended childhoods that put a
burden on their mothers, leading women to prefer monogamy. However, due to the
scarcity of male partners with nurturing traits like tenderness and protectiveness, human
females have been engaged in rivalry over “access to suitable mates.” As a result, females
have developed neotenous features to attract males by showing reproductive advantage as
a young creature (Brin, 1994), such as soft skin and hair, high-pitched voice, or relatively
small size compared to males, which would seem to be counterintuitive means by which
to promote their generativeness. These illustrate how the human propensity to neoteny
transferred into “survival” values in social context.
However, the value associated with neoteny may suggest the dissociation between
aesthetic judgment and axiological judgment, that what we perceive as pleasant may not
correspond to what we desire. Three factors can be counted: subjective attitude toward
nurturing, objective product semiotics, and socio-cultural contexts. Basically, neoteny
entails human innate and immediate positive reaction, but the direction of valuation may
not correspond to what our encoded intuition suggests. The first dissociation can be stated
in terms of the individual’s attitude toward nurturing behavior, so that gender difference
is predicted. The next factors will be related to the socio-political, cultural context,
especially in competitive situation. The more the society is competitive and needs

10
flexibility, the more neotenous features may be required. Another gender-related factor
may be suggested by the rigidity of the social structure. The more females depend on the
monogamy system and compete with each other for access to a suitable (i.e. supportive
and nurturing) mate, the more females may be inclined to neoteny.
In addition, despite that irresistible innate mechanism corresponding to neoteny
and its unconscious influence throughout biological and ecological evolution, neoteny
does not always lead to positive evaluation. Especially when neoteny is associated with
other types of objective attributes, such as quality or price, in value system, it may not
operate as a key factor prioritized for positive evaluation. The round shaped VW New
Beetle seemed to be more valued by females, resulting in a new design with less round
and with less neotenic features being suggested for the 2012 model, to attract male
consumers (Patton, 2011). In Korea and Japan, various mascot designs with babyish
features have been used for the police (see Appendix 1-3: Police Mascots in Japan);
however, those would likely not be effective in the United States. Information delivered
through less attractive websites may be perceived as more trustworthy (Scobleizer, 2008,
as cited in Hoegg, Alba, & Dahl, 2010). Hence, the question raised is how aesthetic value
can be placed in the structure of value; the aesthetic value from neoteny seems to be
determined by objective cues and considered as intrinsic, but in terms of consumer
behavior it seems rather contextual and subjective.
This dissociation between aesthetic and axiological judgment of artifact designs
seems to have been accelerated by the postmodern movement. Especially from the
perspective of design as communication, the designed objects are depicted as the
representation of the process between the intention of designers and the interpretation of

11
users (Crilly, Good, Matravers, & Clarkson, 2008). This means the product semantics, the
meaning of the product, are dependent on the user’s context (Krippendorff, 2006).
However, in postmodernity, the product semiotics has been deconstructed by regarding
design as signs and symbols in social contexts. Both postmodern designers and users
suggested novel semantics of products, which have not been included the traditional
value set. For example, in modernism, the good form of the product was believed to be
determined by functionality (e.g.. “Form follows function,” Sullivan, 1896); however,
this phrase may not serve as intended when the product design adopts the emotional and
sensual pleasure of use. The neotenic design of highly utilitarian products may not be
possible in the framework of modernism, but recent design trends reflect these
phenomena (cute rifles or cute hand drills). The incongruence of design attributes
(neotenic appearance vs. powerful performance), in the past, may have been considered
“bad design” (Hartman, 1967); however, in various social contexts it can now be
acceptable as “good design.”
Therefore, the axiological approach of neotenic design highlights the importance
of investigating the mechanism of value judgment of designs. Particularly, two
perspectives are proposed for that purpose: 1) positive aesthetics caused by neotenic
design is compatible with other design attributes in the human value system, and 2) the
valence of neoteny operates as a significant factor in the evaluation of design. The use of
asymmetric dominance paradigm can contribute such understanding of the value of
neotenic designs. The asymmetric dominance effect can show that individuals tend to
modify the relative weight of one particular attribute to the other depending on what
kinds of choice sets are available. Neoteny is varied as one comparable attribute in order

12
to observe how aesthetic judgments of the objects would affect the process of value
judgment.
In sum, to investigate the underlying structure of people’s evaluation of neotenic
designs, two studies were designed to show that the subjective value of artifact design is
also dependent on both the objective form factors and subjective semantics. Two studies
were grounded on findings from an initial norming study demonstrating that positive
aesthetic judgment can be manipulated by formal design dimensions of neoteny such as
size, roundness, structure, proportion, and color, as well as cultural semantics. The
axiology study involving the asymmetric dominance paradigm investigated whether
aesthetic attributes, such as neoteny of artifacts, operate in the same way as more
traditional attributes in decision making.

13
Chapter 2
Norming study
Starting with Lorenz’s description of babyish characteristics, eight dimensions of
cuteness in design were initially considered: size, shape, structure, color, proportion,
arrangement, metaphor, and border. We consider these eight dimensions directly relevant
to the explicit formal characteristics that we test empirically in our present research.
Literature review: Dimensions of cuteness
1) Size – smallness
Smaller objects are expected to be evaluated as cuter than larger ones. The lexical
meaning of the word “cute” has evolved to describe small objects (Barratt, 2009). Lorenz
(1970) also commented that cute features seemed to be related to the suffix of “-chen,”
whose meaning is smallness in German (e.g., robin with “Rotkehlchen,” squirrel with
“Eichhörnchen,” and rabbit with “Kaninchen,” pp.154-5). The positive association
between cuteness and smallness can be found in the marketing industry: It has been
termed “mini-branding.” This technique focuses on selling a miniature version of full-
sized products. Examples include miniature M&M bags; mini cupcakes; and DoCoMo
telecom company’s mini phone icons (Lindstrom, 2000; Moskin, 2011). See Appendix 2-
1: Examples of mini products. The success of these products exemplifies the positive
effect of small size in the design of cute products.

14
2) Shape – roundness
Objects with rounded corners will be evaluated as cuter than objects with sharp
edges. Round-edged or curved visual objects are preferred to sharp-edged objects (Bar &
Neta, 2006). Roundness characterizes the main physical features of babies, such as round
cheeks and rounded body shapes (Lorenz, 1970). In industrial design, for example, the
new Volkswagen Beetle looks cute due to its rounder outlines (Angier, 2006), and its
redesigned 2012 model was intended to look less cute, or mature, by reducing its
roundness and reviving the sharp edges (Patton, 2011). In the 1980s, the graphic user
interface design for Apple computer with round-cornered icons looked cuter than the
icons in Microsoft Windows. Since then, rounded rectangles have been retained in the
design style of Apple computers (Lang, 2009). See Appendix 2-2: Examples of round
shaped products.
3) Structure – simplicity
Simple objects will be evaluated as cuter than complex objects. From the
viewpoint of developmental biology, young creatures are relatively simpler than mature
ones, and a simple shape indicates immaturity with potential for developing into a
complex form (Harris, 2000). Thus, it can be inferred that simplicity is associated with
undifferentiated youth form and thereby is linked to cuteness. For example, Hello Kitty, a
Japanese feline character, is perceived as cute because of its simplified form with an
omitted neck and mouth, as well as shortened extremities (Roach, 1999). See Appendix
2-3: Examples of simplification.

15
4) Color and texture – lightness and softness
Objects with soft colors and textures will be perceived as cuter than objects with
strong colors and rough textures. Light color is perceived as cute because babies typically
have paler skin and hair than their parents (Etcoff, 1999; Frost, 1989). Pale colors
commonly found in newborn baby products often are referred to as “baby pink” or “baby
blue.” In contrast, dark blue and dark gray are perceived as far from cute (Wright &
Rainwater, 1962). In terms of textures, Lorenz (1970) proposed that the soft skin of a
baby is related to the perception of cuteness. See Appendix 2-4: Examples of soft-colored
products.
5) Proportion – wideness
Objects with plump and chubby body shapes will be perceived as cute (Lorenz,
1970); the greater width-to-height ratio is perceived as being cuter than a thin and narrow
shape. When Glocker and colleagues (2009) manipulated the ratio between the width and
the height of babies’ faces, narrow faces were rated less cute compared to rotund faces by
participants in the United States. Particular proportions between body parts may also
serve to enhance the perception of cuteness, such as a large head in relation to the body
(e.g., bobble-heads) or a relatively low position of the eyes (Lorenz, 1970). See Appendix
2-5: Examples of experiment stimuli with manipulated proportion.
6) Arrangement – tiltedness
Objects with an irregular arrangement will look cuter than objects with an orderly
arrangement. For example, if letters are arranged in a zigzag line, they look cuter than the
letters in a straight line. This may be partially explained by the association of a zigzag
line with clumsy behavior of toddlers (Lorenz, 1970). Recent design trends in some brand

16
logos reflect the propensity toward cute-looking arrangement of characters. For example,
Baskin-Robbins ice cream and Cheer laundry detergent changed their logos to
incorporate zigzag characters (Marsh, 2009) that look cuter and friendlier. See Appendix
2-6: Examples of old and new logo designs.
7) Metaphor – anthropomorphism
Objects reflecting anthropomorphic metaphors will look cuter than objects that
are not anthropomorphized. Anthropomorphic features influence people to treat objects
as if they were alive (Chandler & Schwarz, 2010). We speculate that an object is more
likely to be perceived as cute when it is categorized as a living thing, because the
characteristics that define cuteness originally are those associated with one’s offspring.
See Appendix 2-7: Examples of anthropomorphic products.
8) Border – thickness
Objects with thick borders will look cuter than objects with thin borders. For
example, images on children’s books are often represented with thick outlines that make
them look cuter. Thick extremities (i.e., arms and legs), for instance, can be viewed as a
feature that suggests cuteness (Lorenz, 1970). One reason may be that a thick outline is
associated with protectiveness. Another reason may be that the thick border contrasts
with the inner area to help the latter be perceived as relatively small. See Appendix 2-8:
Examples of thick-bordered drawings.
To summarize, the hypothesis is that the perception of cuteness is related to the
following features of an object: smallness, roundness, simplicity, lightness and softness,
wideness, zigzag pattern arrangement, anthropomorphism, and border thickness. It should
be noted that these dimensions are not orthogonal and may interact with each other or

17
influence the perception of cuteness in a hierarchical order. In addition, an
anthropomorphic analogy may contribute to the perception of cute objects by objective
characteristics of mammalian babies. The above features are abstracted from neotenic
features that seem to contribute to perceptions of cuteness of inanimate objects, but it is
hard to ascertain the extent to which we can generalize about these features. Small, round,
simple, light-colored, chubby, tilted, anthropomorphic, or thick-bordered forms are more
likely to be perceived as cute objects, but need not necessarily be representative of babies.
Therefore, it is questionable whether these cuteness features are objective attributes that
reveal the existence of hardwired automata (innate releasing mechanism) evoked by
babies.
In order to investigate the psychological effects associated with neotenic features
in inanimate object design, we conducted an initial norming study. This study tests
whether cuteness features of babies, when translated into a design language and used to
create visual forms, evoke similar mental representations and cognitive processes. To
explore mental representations of cuteness, the norming study examined whether or not
the perceived cuteness of objects would be correlated with positive affect associated with
aesthetic judgments such as attractiveness. The study also tested the hypothesis that
participants would judge the cuteness of each artifact by the particular formal visual
characteristics reviewed above.
Out of the eight cuteness dimensions, the following five were selected in order to
examine their contribution to the perceptions of cuteness: smallness, roundness, lightness,
wideness, and simplicity. The reduction to five was to make the task more manageable
for the participants and to control for extraneous variables. The thickness of the border

18
was closely related to the perceived smallness of the inner area. The tiltedness was also
eliminated from the study because it is not directly related to the formal characteristics of
the design per se; rather, it is related to the display style or observer’s perspective.
Further, the anthropomorphic metaphor was excluded due to its broad network of
semantic associations, which would make it difficult to observe the effects of other
fundamental dimensions.
Hypotheses
H1: Perceived cuteness will be greater when the object is smaller than larger
(H1a), rounder than sharper (H1b), more simple than more complex (H1c),
lighter than darker (H1d), and wider than taller (H1e).
H2: Perceived cuteness will be correlated with positive aesthetic judgment such as
attractiveness of the design.
Method
A total of 119 U.S. undergraduate students (70% female, Mage = 21.84)
participated in one of two online survey tasks in a laboratory setting. Five dimensions
were tested, each with two levels: 1) small vs. large, 2) round vs. sharp, 3) simple vs.
complex, 4) light- vs. dark-colored, and 5) wide vs. tall. The data were collected through
two tests, and 102 images comprised the total set of images that were selected for use in
the experiments. The products (34 images: 10 for roundness, 6 for proportion, 8 for
simplicity, 8 for size, 2 for color) and the font faces (24 images: 6 for roundness, 6 for
proportion, 6 for simplicity, 6 for size) were collected from the Internet, and the
geometric shapes (34 images: 10 for roundness, 6 for proportion, 8 for simplicity, 8 for
size, 2 for color) were created with a computer program (Adobe Photoshop). The images

19
were edited to be the same size and were displayed on a white background. The
participants were asked to rate each image on 7-point bipolar scales measuring
attractiveness, cuteness, pleasantness, complexity, and appealingness. The task took less
than 3 minutes.
In the first test, participants were presented 24 stimuli in randomized order. For
instance, during the survey, a participant encountered both small and large alarm clocks,
one by one, in a randomized order such that both levels of size were included in the set of
24 stimuli. The participants (ngroup1 = 32, ngroup2 = 33, ngroup3 = 35) were shown one of
three groups of 24 images selected from the total set of 72 images. Each group of 24
images represented 3 categories (geometric form, font-face, product) x 4 dimensions
(roundness, proportion, simplicity, size) x 2 types (cute, less cute). Each group received
one pair from each of the cells.
In the second test, 19 participants were each shown 30 images (3 categories
{geometric form, font-face, product} x 4 dimensions {roundness, size, simplicity, color}
x 2 types {cute, less cute}) and 3 extra pairs of roundness-geometry, roundness-product,
and color-product were added. See Appendix 2-9: Stimuli sets for norming test.
Results
The data were consistent with H1. Significant differences in perceptions of
cuteness were found across various dimensions. The small-sized object was perceived as
cuter than the large one (H1a); the round object was perceived as cuter than the sharp one
(H1b); the simple form was perceived as marginally cuter than the complex one (H1c);
the light-colored object was perceived as cuter than the dark-colored one (H1d); and the

20
chubby-proportioned object was perceived as cuter than the narrow one (H1e). See Table
2-1.
M (SE) M (SE) t-value(df)
Small/Large
3.77(1.42)
5.92(1.19)
4.07(12) p = .002
Round/Sharp
2.92(1.61)
4.69(1.75)
4.68(12) p = .001
Simple/Complex
4.79(1.67)
3.50(1.45)
2.09(13) p = .06
Light/Dark
5.77 (1.24)
4.08(1.85)
2.97(12) p = .01
Wide/Tall
3.70(1.51)
4.61(1.44)
3.14(32) p = .004
Table 2-1 Examples of mean ratings for perceived cuteness
M (SD) M (SD) t-value(df)
Small/Large
3.82(1.01)
4.20(1.03)
2.50(31) p = .02
Round/Sharp 3.42(1.53)
4.30(1.64)
3.19(31) p = .003
Simple/Complex 4.79(1.29)
3.84(1.38)
4.00(32) p < .001
Light/Dark 5.44(1.09)
4.41(1.14)
2.42(12) p = .03
Wide/Tall (Rotund/Narrow)
3.73(1.46)
4.75(1.26) 3.85(32) p = .001
Table 2-2 Examples of mean ratings for positive aesthetics

21
H2 was also supported. Cuter shapes were assessed to be more aesthetically
positive. The cuter stimuli were rated higher on all three aesthetic judgment scales of
attractiveness, pleasantness, and appeal (Cronbach α = .88, r = .83). See Table 2-2.
Discussion
Five dimensions of cuteness – small size, roundness, simplicity, light color, and
wide proportions – were found to be relevant for the perception of cuteness. Results of
the norming study yielded comparative evaluations of cute-design factors; however, the
results cannot account for parametric variation (i.e., how much of a difference in cute-
design factors will contribute to judgments such as attractiveness). For example, a smaller
object is more likely to be perceived as cuter than a larger object, but we do not know
how much smaller it would have to be before it is perceived as cute, nor do we know the
parametric relation between size and cuteness. Hence, the next parametric study utilized
quantitative scales to assess how people respond to variations in dimensions. A second
issue with the norming study was that the stimuli varied on many dimensions other than
the five that were considered. The next study aimed to address this issue by maintaining a
standard structure across all stimuli and primarily varying only the dimensions under
consideration.

22
Chapter 3
Parametric study
Whereas previous studies on aesthetic judgments adopted the method of choice by
asking participants to choose one option from several alternatives for the preferred shape,
the present study used the method of production. Fechner (1876, as cited in McManus,
1980) suggested three experimental methods for empirical aesthetics: method of choice,
method of production, and method of application. Aesthetic judgment can be measured
by asking participants to select the most pleasing form in a series of pairs (method of
choice); by asking them to draw or construct shapes of the most pleasing proportions
(method of production); or by analyzing works of art or other artifacts for use of a
specific proportion like the golden ratio (method of application). The method of choice
has been dominant in experimental designs due to its amenability to controlled
environment testing; however, it lacks sufficient ecological validity to capture real-world
aesthetic decision-making (Whitfield & de Destefani, 2011). Thus, in order to answer the
question of how participants respond to variations in cuteness dimensions with
quantitative scales, the method of production was used.
A very simple geometric shape, the rectangle, was chosen as the initial form of
design. This simple abstract form was used to rule out any bias from the prototypical
semiotic visual representation. For example, if people were asked to modify the design of
a car to make it cuter, the prototype of a cute-designed car such as the VW New Beatle

23
may influence the representation of the cuteness concept, and if an image of a cat were
presented as the basic stimuli to be made cuter, people’s reaction may be influenced by
Hello Kitty styled anthropomorphic feline images. These types of influences would make
the data difficult to interpret because the designs may have been contaminated by such
prior mental associations.
The choice of the rectangle as the source of design activity limited the cuteness
dimensions to five experimental scales. It enabled us to exclude the manipulation of
anthropomorphic metaphor and simplicity. At the same time, it allowed us to include
tiltedness in order to provide participants an opportunity to manipulate the displayed
angle of their cute rectangle. Thus, the following five dimensions were selected:
smallness, roundness, lightness of color, wideness and tiltedness.
Parametric study: Designing a cute rectangle
Hypotheses
H1: The size of cute rectangles will be smaller than the default initial rectangle.
H2: Cute rectangles will have rounded corners rather than sharp corners.
H3: Cute rectangles will be horizontally long – wider than tall.
H4: Cute rectangles will be tilted from (rather than be parallel to) the frame of
reference.
H5: The color of cute rectangles will be lighter and softer than 50% gray.

24
Method
1) Participants and procedure
A total of 143 students at the University of Michigan (Mage = 21, 59.4% male)
participated in the design task. Each participant was shown a default figure interactive
computer program (Macromedia Flash 8). Each participant was initially shown a square
(50% gray, sharp-cornered, 120 x 120 pixel2) at the top center of the screen (sized 550 x
600 pixel2). This figure was accompanied by nine sliders that enabled one to modify the
size, horizontal and vertical proportions, roundness of the corners, angle to display, the
red-green-blue color combination, and contrast to background (Alpha). See Appendix 3-
1: Screenshot of the cute rectangle design program.
Participants could adjust each parameter by moving the thumb of the slide bars
with a mouse in any direction to modify the rectangle on the screen, which showed real-
time updates to the rectangle design. The design process continued until participants
pressed the submit button at the bottom of the screen. There was no time limit for this
design task.
2) Study variables
Smallness (area scale). The area of the rectangle was computed by the
multiplication of the length (the x-axis) and the height (the y-axis), which were calculated
from the ‘size,’ ‘x-scale,’ and ‘y-scale’ sliders. The area of the rectangle varied from 1 (1
x 1 pixel2) to 57600 (240 x 240 pixel2).
Wideness (linear ratio). The proportion was computed as the ratio between the
height and the width (y/x). The range of the possible ratio was between 1/240 and 240.
When the ratio was close to 1, the designed cute rectangles looked more like squares.

25
Roundness. The corners of the rectangle were rounded using a slider bar, and the
maximum arcs of radius made the rectangle look like a circle.
Tiltedness (rotation). Participants could tilt the rectangle from 0° to 90°. The
initial value was 90°; smaller value indicated a more extreme rotation.
Lightness (RGB component of the color) and paleness (Alpha, contrast to the
background color). Lightness of color was operationally defined as the average of the
RGB code. The smaller values of lightness turned the color darker – in hexadecimal code,
#000000(0, 0, 0) is black, #FFFFFF(255, 255, 255) is white, and #808080(128, 128, 128)
is 50% gray. To measure the preference for the pale color, contrast to background was
measured with a scale of 0 to 100, as Alpha. For example, 100% means that the original
color is presented, 90% means 10% of background color is added to the original color,
and zero means original color is transparent, or showing 100% background color. The
small contrast indicated the paler color.
Results
The data were consistent with our predictions that a cute form would be
determined by a relatively small size (H1), rounded corners (H2), lightness in color (H5)
and tilted angle (H4), but inconsistent with the hypothesis of wideness (H3). The
Appendix 3-2 shows the final designed figure with average values of each dimension.
The cute rectangles were designed as significantly smaller than the size of the
initial default rectangle, Marea = 18839.68, SDarea = 12281.08, t14400(142) = 4.32, p < .001.
The distribution of the radii of the corners was slightly negatively skewed (skew = -0.50,
SD = .14), suggesting that participants preferred large radius value for the corners.
Participants also colored the rectangle significantly lighter than 50% gray, Mlightness =

26
146.24, SDlightness = 44.53, t128(142) = 4.90, p < .001. The descriptive analysis of the
contrast confirmed that participants adjusted the color so that it was lower contrast (i.e.,
paler) than the original (Malpha = 65.31, SDalpha = 24.36). Also, people tended to tilt the
rectangle to make it cuter (Mrotation = 65.06, SDrotation = 27.95). However, participants
designed the cute rectangle slightly wider than a square. Further, we observed a gender
difference. Female participants designed the cute rectangle to be closer to a square
(Mratio_female = 1.02, SDratio_female = .36) more often than did male participants (Mratio_male =
1.46, SDratio_female = 1.27), Welch t(102.41) = 2.98, p = .004.
A factor analysis was performed to examine the underlying commonality between
dimensions of alpha, rotation, radius, size, ratio X, ratio Y, and lightness. Principal
components extraction was used with Varimax rotation in correlation method. Two
factors were extracted, which explained 45.72% of variance. Factor one (smallness) is
perceived smallness – e.g., size (.67), ratio (ratio X = .66; ratio Y = .77) and lightness
(-.44). Factor two is perceived softness – e.g., alpha (.48), rotation (.76), and radius (-.71).
Discussion
The results supported the hypotheses about the cuteness dimensions of smallness
and softness. The cute shapes produced by participants revealed that a smaller, lighter,
softer, rounder, and more tilted shape is perceived as cuter. However, it is not clear that a
wide rectangle is preferred as cuter than a square. A gender difference partly contributed
to this result, showing a discrepancy between the females’ and males’ perception of cute
rectangles; females preferred squares while males preferred wider rectangles although
less wide than the golden ratio (1:1.618).
27
Preferred proportion of rectangles: One possible theory relates the cute-looking
proportion to the Fibonacci numbers in nature (Doczi, 1981). The Fibonacci numbers
form an integer sequence with each subsequent number, that is, the sum of the previous
two numbers in the sequence; representing the ratio between two consecutive numbers
will ultimately reach the golden ratio. The numbers start with 0 and 1, followed by 2, 3, 5,
8, 13, 21, and so on. If the initial ratio were counted with first two 1s, the proportion will
be of the square, 1 to 1. With an initial ratio of 1 and 2 (1:2) or 2 and 3 (2:3), the
proportions will be of the wide rectangle. However, further research is needed to explain
why a ratio of 1:1 or 1:2 would be treated as the initial ratio and linked to the perception
of cuteness, especially when considering its relation vis-a-vis gender differences.
McManus (1980) found that rectangles and triangles with the golden ratio, as well
as squares, were preferred. According to McManus (1980), the problem of proportion in
aesthetics has been explained by two theoretical approaches: 1) with idealism (because
the golden ratio is harmonious) or 2) with empiricism (because it is empirically prevalent
in nature). A great deal of research has replicated and discussed the correlation between
attractiveness and the golden ratio, but no reasonable explanation has so far been
provided for the preference over squares. Nonetheless, the tendency to prefer squarer
figures in specific individual cultural groups has been discussed. Nienstedt and Ross
(1951) found that people over age 60 preferred squares, and Berlyne (1970, as cited in
McManus, 1980) found that this tendency exists most frequently in Japanese participants
and also in some Canadian participants.
The present study observed a gender difference, which revealed a discrepancy
between the females’ and males’ perceptions of cute rectangles. The females’ sensitivity

28
to cuteness may enable them to distinguish cuteness better than males, but more research
is needed to understand the gender difference.
Round shape: The preference for round shapes was explained by an avoidance
behavior away from sharp edged forms. For example, curved car interior design (Leder &
Carbon, 2005) was preferred by participants, and 50 years of car exterior designs (Carbon,
2010) revealed that fashion or trend as well as personal taste might moderate this
preference. Silvia and Barona (2009) recently demonstrated this propensity toward round
shapes against any other type of polygon.
Confirming the findings of Aronoff and colleagues (1992), which suggested that
V-shaped corners are associated with threat and round corners with warmth, Bar and Neta
(2006) demonstrated the preference for round-shaped objects based on the hypothesis that
sharp transitions in contour may evoke a sense of threat so as to trigger a negative bias.
An fMRI study further supported their hypothesis by showing higher activation in the
amygdala when participants perceived an angular form (Bar & Neta, 2007).
In addition, cultural differences in approaches to conflict resolution have been
found to affect preference for round or angular shapes. The classification study of logo
and trademark design by Zhang and collabrators (2006) illustrated that collectivistic
cultures, where harmony is valued, tend to prefer round-shaped design, while
individualistic cultures, where confrontation is valued, have more angular-shaped designs.
When participants were primed with independent self-construal, they rated angular
shapes as more attractive, presumably due to their confrontational approach to conflict
resolution, whereas participants with interdependent self-construal rated round shapes as
more attractive, which reflects a compromise approach. These explanations about the

29
preference for round shapes are congruent with the hypothesis that a cute object is
perceived to be harmless and triggers interdependent self-construal and more empathetic
attitudes toward others.
This parametric study showed that the factors perceived as cute in baby animals
are compatible with those that lead to cuteness perceptions of inanimate objects. In other
words, the interpretation of neotenic features into design language can lead to effective
guidelines to design objects in a cute form. For example, the appearance of a consumer
product is perceived as cuter if it is designed in a smaller size relative to its competitor.
Obviously, there are limits to this effect, as two competitors can iterate back and forth to
make their designs smaller until some limit is reached. In addition, the perception of
cuteness was found to increase if the product 1) has round corners with radius less than
25% of the edges, 2) is tilted no more than 30 arc degrees from the horizontal axis, 3) is
light or pale colored (ideally brighter than 50% gray and around 30% transparent from
the original color), and 4) is equilateral: a cube or square form for females, a little wider
rectangle for males.
This study also suggested that it is possible to vary the perceived attractiveness by
manipulating the determinants of cuteness. Previous studies have reported a positive
correlation between neotenous features and attractiveness (e.g., Korthase & Trenholme,
1982; Zebrowitz, 1997) and this study demonstrated that cute shapes can be designed
with visual traits like small size, round shape and light color. These findings can provide
a logical foundation for how to create cute stimuli, something that product designers have
been doing instinctively (Demirbilex & Sener, 2003; Leder & Carbon, 2005; Ludden &
Schifferstein, 2007).
30
The next research question examines which cuteness dimensions significantly
predict perceptions of cuteness. In other words, among the five factors of size, proportion,
roundness, angle, and color, which would be the greatest contributor to perceived
cuteness of the rectangle? This extends the results from production to perception. To
answer this research question, experienced visual designers were invited to code the 143
rectangles produced by participants.

31
Parametric coding study
Method
Three experienced graphic designers (Mexperience = 19 yrs.) were asked to rate the
cuteness of the 143 rectangles produced by participants. The stimuli were presented as a
hard copy of the rectangles on 4-inch by 5.5-inch white cards. The coders categorized the
rectangles into 9 ordered groups, with 1 as the least cute to 9 as the cutest. The process
took 10 to 14 minutes for each coder, and the coders were compensated for their
participation with $5 gift cards.
Results
To investigate the predictors of perceived cuteness, a standard multiple regression
was performed between a cuteness score as the dependent variable, and Size, Ratio,
Colors, Alpha, Rotation, and Radius as independent variables. The dependent variable of
cuteness was calculated by the sum of three coder’s ratings (Cronbach α = .66).
Normality, linearity and homoscedasticity of residuals were assumed following
examination of diagnostics. Possible multicollinearity and singularity among the IVs
were ruled out, which could be a concern following the result of the factor analysis in
Parametric study; none of the tolerances approach zero and collinearity diagnostics
showed no multicollinearity (by applying the criteria suggested by Belsley, Kuh, &
Wlsch, 1980).
We ran two regression models using the 9-level categorization dependent variable.
One model used the predictor variables that correspond to the sliders manipulated by the
designer participants (i.e., the predictor space corresponds to the slider parameterization).
A second model used predictors that are nonlinear combinations of the slider variables to
32
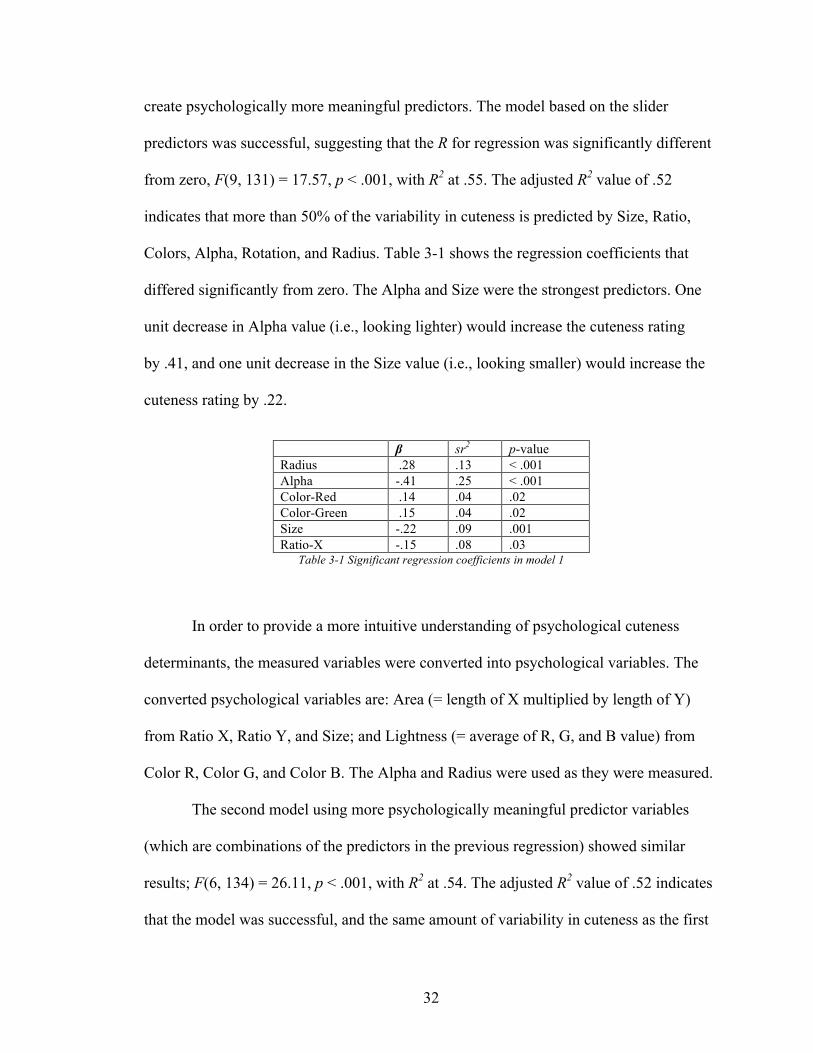
create psychologically more meaningful predictors. The model based on the slider
predictors was successful, suggesting that the R for regression was significantly different
from zero, F(9, 131) = 17.57, p < .001, with R2 at .55. The adjusted R2 value of .52
indicates that more than 50% of the variability in cuteness is predicted by Size, Ratio,
Colors, Alpha, Rotation, and Radius. Table 3-1 shows the regression coefficients that
differed significantly from zero. The Alpha and Size were the strongest predictors. One
unit decrease in Alpha value (i.e., looking lighter) would increase the cuteness rating
by .41, and one unit decrease in the Size value (i.e., looking smaller) would increase the
cuteness rating by .22.
β sr2 p-value Radius .28 .13 < .001 Alpha -.41 .25 < .001 Color-Red .14 .04 .02 Color-Green .15 .04 .02 Size -.22 .09 .001 Ratio-X -.15 .08 .03
Table 3-1 Significant regression coefficients in model 1
In order to provide a more intuitive understanding of psychological cuteness
determinants, the measured variables were converted into psychological variables. The
converted psychological variables are: Area (= length of X multiplied by length of Y)
from Ratio X, Ratio Y, and Size; and Lightness (= average of R, G, and B value) from
Color R, Color G, and Color B. The Alpha and Radius were used as they were measured.
The second model using more psychologically meaningful predictor variables
(which are combinations of the predictors in the previous regression) showed similar
results; F(6, 134) = 26.11, p < .001, with R2 at .54. The adjusted R2 value of .52 indicates
that the model was successful, and the same amount of variability in cuteness as the first
33
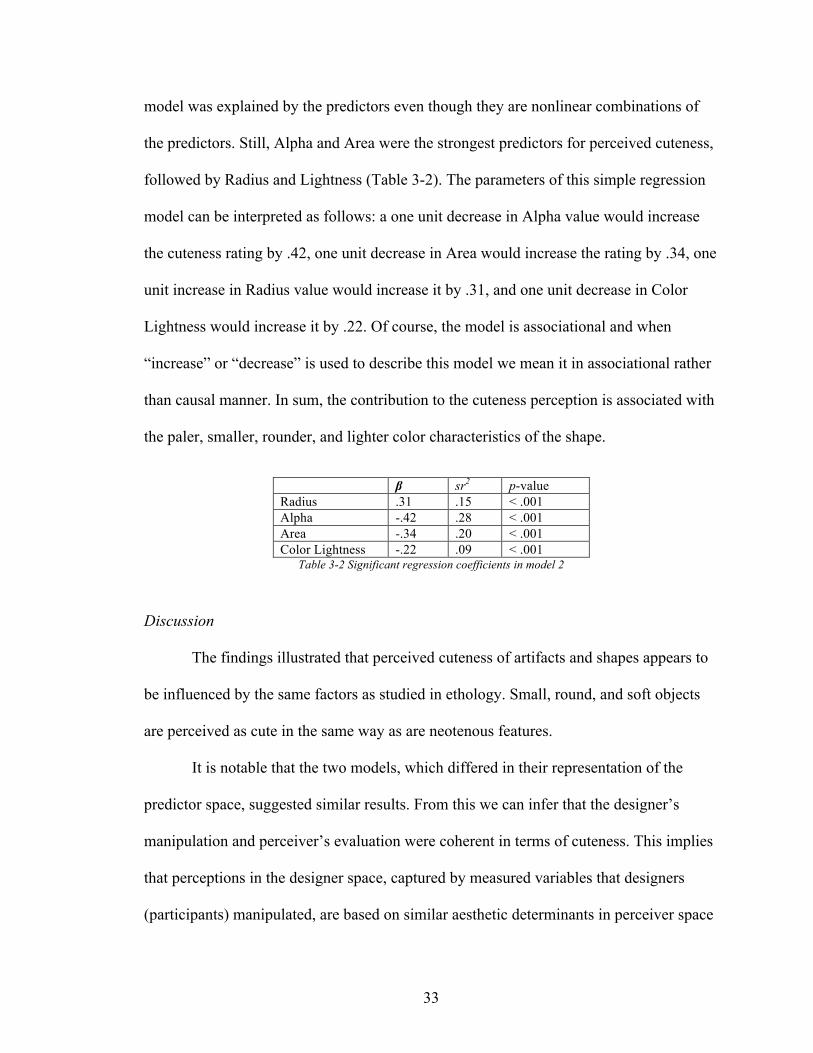
model was explained by the predictors even though they are nonlinear combinations of
the predictors. Still, Alpha and Area were the strongest predictors for perceived cuteness,
followed by Radius and Lightness (Table 3-2). The parameters of this simple regression
model can be interpreted as follows: a one unit decrease in Alpha value would increase
the cuteness rating by .42, one unit decrease in Area would increase the rating by .34, one
unit increase in Radius value would increase it by .31, and one unit decrease in Color
Lightness would increase it by .22. Of course, the model is associational and when
“increase” or “decrease” is used to describe this model we mean it in associational rather
than causal manner. In sum, the contribution to the cuteness perception is associated with
the paler, smaller, rounder, and lighter color characteristics of the shape.
β sr2 p-value Radius .31 .15 < .001 Alpha -.42 .28 < .001 Area -.34 .20 < .001 Color Lightness -.22 .09 < .001
Table 3-2 Significant regression coefficients in model 2
Discussion
The findings illustrated that perceived cuteness of artifacts and shapes appears to
be influenced by the same factors as studied in ethology. Small, round, and soft objects
are perceived as cute in the same way as are neotenous features.
It is notable that the two models, which differed in their representation of the
predictor space, suggested similar results. From this we can infer that the designer’s
manipulation and perceiver’s evaluation were coherent in terms of cuteness. This implies
that perceptions in the designer space, captured by measured variables that designers
(participants) manipulated, are based on similar aesthetic determinants in perceiver space

34
(what the coders perceived). It was not obvious a priori that this would be the case, given
that the two sets of predictors were nonlinear transformations of each other.
The present findings suggest that the quantification of the objective aesthetics of
artifacts, as related to cuteness, can be systematically investigated. In future research, it
would be useful to examine correlations between cuteness and other attributes to improve
overall quality judgments of artifact design.
35
Chapter 4
Cultural semantic study
Before proceeding to value judgment, we will revisit the question of whether the
neotenic design factors are sufficient to create a positive aesthetic judgment. As briefly
mentioned, the mechanism of aesthetic judgment is based on both objective causes and
subjective associations. The dimensional studies above support the hypothesis that the
neotenic cues are the objective cause of appealing design, but subjective association
should be another axis of aesthetic judgment. This inquiry comes with the traditional
question about nature and nurture: Is the feeling of pleasure an innate mechanism, or is it
learned and acculturated in a social context?
To consider this question, the meaning of cuteness is reviewed from the various
perspectives. This process provides hints of how and why neoteny may be linked to
positive or negative connotation in the real world.
Literature review: Meaning of cuteness
The word “cute” has a positive meaning across cultures in general. In Asian
languages, it refers to lovable, pretty, sweet, and tiny: “可愛” in Chinese; “かわいい” in
Japanese (Kenkyusha’s New Collegiate Japanese-English Dictionary, 1983); and

36
“귀여운” in Korean. In some European languages, it is not very different: pretty, nice,
and sweet in the French “mignon” (Collins Robert French Paperback Dictionary, 1989)
and small, nice, and agreeable in the German “niedlich” (Wörterbuch der deutschen
Sprache, 2001). In contemporary English, “cute” has a meaning besides attractive and
childlike: It also can mean mentally sharp (Merriam-Webster Online Dictionary, 2010).
Originating from the Latin “acus,” meaning a needle, the word “cute” referred to an acute
angle, and that meaning was expanded to incorporate mental sharpness or quick-
wittedness. In the meanwhile, the meaning shifted from “the manipulative and devious
adult” to “the lively charm of the willful child” (Cross, 2004, p. 43; see Barratt, 2009;
Ngai, 2005) and includes “attractive, pretty, charming” in American slang.
However, the reaction to cuteness differs depending on cultures: generally
positive in Asian culture, but relatively negative in the United States. The best example of
a positive reaction is Japanese ‘kawaii’ culture. In Japan, even the most masculine
individuals are responsive to cuteness. It is not uncommon for truck drivers to display
Hello Kitty-style figurines on their dashboards. Police officers are depicted as cute
mascots on public safety announcements and a recruitment advertisement for the
Japanese Army features cuddly cartoon characters (Angier, 2006; Garger, 2007). In
American culture, by contrast, the connotation of cuteness is relatively negative. Cuteness
connotes helplessness, vulnerability, and powerlessness (Roach, 1999). Even worse,
cuteness can be a cultural decoy that amplifies cultural amnesia – namely, that cute,
appealing images wipe our memories of painful historical and political realities (Newitz,
2002).

37
A possible explanation for this polarized evaluation on cuteness may be due to
cultural differences in power distance. Power distance is the extent to which less-
powerful members of a society accept that power is distributed unequally. Japan is an
example of a higher power-distance culture, while the United States is a lower power-
distance country (Hofstede, 1983). Because of Japan’s rigid hierarchical social structure,
Kawaii culture, with its assuaging effect, prevails there (Mcveigh, 2000; Roach, 1999). In
the United States, however, the appreciation of cuteness is criticized as exaggerated
positivity (Ngai, 2005) or as an inferior form of beauty (Papanek, 1995). However, this
explanation is not plausible when it comes to the far lower power-distance country. Many
European countries, including Austria, Denmark, and Norway, are grouped among the
lowest power-distance countries, but their attitude toward cuteness is not reported to be as
negative as that of the United States.
Rather, this cultural difference may be more relevant to the temporal long-term
versus short-term orientation. In terms of the societies’ time horizon, most Confucian
tradition countries, such as China, Japan, and Korea, put more value on the future than
the past. Since anticipating rewards is important in their value system, the capacity for
adaptation is encouraged. On the contrary, in short-term oriented countries, such as the
United States, the past and present are much more important. Reciprocation and fulfilling
social obligations are more valued in the United States (Hofstede, 2001). Hence, the
neotenic cues may be welcomed in the long-term oriented culture, because of the
flexibility that enables its members to learn and adapt; while cuteness may be avoided in
the short-term oriented culture, because it is seen as signaling immaturity, an inability to
reciprocate.

38
If this temporal interpretation of cultural semantics is compatible with a spatial
perspective, it may be reasonable to adopt a well-known social psychological explanation
with respect to how people process information: the holistic or analytic view. The
members of the long-term oriented society may tend to adopt a holistic view, because
they are trained to consider first the relationship with others and future consequences.
Therefore, it can be hypothesized that the appealing or appalling effect of cuteness would
be determined by the cultural semantics: A culture with a holistic and long-term oriented
view is more accepting of the softness and flexibility of cuteness than is a culture with an
analytic and short-term oriented view that is relatively intolerant of the immaturity and
vulnerability signaled by cuteness.
In addition, this cultural difference can be discussed in terms of self-construal:
independent or interdependent. Again, in the more interdependent culture, the members
may regard the younger generation as their future and have a more generous evaluation of
youthfulness. However, a less positive evaluation can be expected in an independent
culture, because the individuals in such a culture may attach less importance to the
extended self, or we, with the young generation.
Therefore, the reaction to neoteny can be hypothesized as follows:
H1: Perceived cuteness of geometric shapes with neotenic cues will not be
different across cultures, but the meaning of cuteness will vary across the two
cultures.

39
H2: Neotenic designs are evaluated differently in accordance with attitude toward
babies. The more positive attitude will be correlated with a positive
evaluation on neoteny.
Method
The stimuli are 33 rectangles out of 143 in the norming study, which represent
one rectangle with mean values of each dimension and 32 rectangles with the distinctive
dimensional characteristics by the combination of High and Low conditions in the five
dimensions (HHHHH to LLLLL). The high condition means there is a stronger neotenic
cue, e.g., light and pale in color, wide in proportion, tilted in angle, round in shape, and
small in size. The decision for the 32 rectangles was made by Z-score, choosing a
stimulus with more abnormal values on each dimension, such as greater than 2 Z-score.
See Appendix 4-1: 32 rectangles representing dimensional characteristics.
Participants were asked to rate the perceived cuteness of each rectangle and other
related connotations on 7-point scales. The nine semantic differential scales included
perceived attractiveness, sensibility, masculinity, strength, positivity, activity, likeability,
friendliness, and warmth (Extremely unattractive vs. extremely attractive, Extremely silly
vs. Extremely sensible, Extremely feminine vs. Extremely masculine, Extremely weak vs.
Extremely strong, Extremely positive vs. Extremely negative, Very active vs. Very passive,
Very friendly vs. Very hostile, Extremely unlikeable vs. Extremely likeable, Very cold vs.
Very warm). The order of variables was counterbalanced.
To investigate cultural differences, the attitude toward youthfulness,
anthropological cultural identity (by nationality), interdependent or independent self

40
construal (Singelis, 1994), and the tendency of the holistic/analytic set of mind – i.e., the
letter recognition test (Kühnen & Oyserman, 2002) – were measured as subjective
variables.
All study variables and instructions were translated into Korean for Korean
participants.
Participants
Thirty-two American U.S. college students and 26 Koreans were recruited via the
Internet. 32 American participants (Mage = 24.16, Male 50%) were recruited via Amazon
Mechanical Turk. The participants were U.S. residents and with approval rates above 95
percent on previous MTurk tasks. 78.1% had no design experience; there was one design
student and four with less than 3 years of design experience. Ethnic breakdowns were
68.8% Caucasian, 12.5% Asian, 9.4% African-American, 6.3% Hispanic, and one
participant selected as multiracial. Twenty-six Korean subjects (Mage = 25.44, Male
53.8%) were recruited via a forum website. 80.8% had no design experience. Two were
design students, one with less than 3 years of design experience, and one with more than
3 years of design experience.
The participants were compensated up to $5 for taking part in the 30-minute
online survey.
Results
The data supported H1 – the perceived cuteness of the rectangles was not
different from each other, but the perceived meanings were different. In general, Korean
participants rated the 32 rectangles as being more silly (t(52) = 2.21, p = .03) and weaker

41
(t(51) = 1.93, p = .06) than did Americans (see Table 4-1). However, the rectangle with
the average values of each dimension (the 33rd rectangle) was evaluated by participants in
the U.S. as being more silly (t(56) = -2.71, p = .01), feminine (t(56) = -2.03, p = .05), and
passive (t(56) = 1.97, p = .05) than by Korean participants (see Table 4-2).
MU.S.(SD U.S.) MKorea(SD Korea) t-value(df) Cuteness 129.87(12.09) 131.05(15.47) t(50) = -.31, p = .76 Silly vs. Sensible 130.40(12.13) 123.04(12.22) t(52) = 2.21, p = .03* Feminine vs. Masculine 123.79(12.85) 123.17(8.92) t(47.79) = .20, p = .85 Weak vs. Strong 129.26(16.26) 120.82(14.83) t(51) = 1.93, p = .06** Positive vs. Negative 123.54(14.83) 121.88(10.18) t(50) = .46, p = .65 Active vs. Passive 132.94(15.50) 130.00(7.54) t(45.60) = .92, p = .36 Unattractive vs. Attractive
131.82(16.68) 134.45(17.75) t(48) = -.54, p = .59
Friendly vs. Hostile 119.66(15.68) 118.91(11.31) t(49) = .19, p = .75 Unlikeable vs. Likable 135.83(16.84) 133.54(16.86) t(52) = -.50, p = .62 Cold vs. Warm 130.38(13.208) 131.67(9.29) t(48) = -.38, p = .70 (* p < .05, ** p < .10)
Table 4-1 Mean differences of overall perceived cuteness and meanings in two countries
MU.S.(SD U.S.) MKorea(SD Korea) t-value(df) Cuteness 4.88(1.62) 4.80(1.52) t(55) = .18, p = .86 Silly vs. Sensible 3.88(1.41) 4.81(1.17) t(56) = -2.71, p = .009* Feminine vs. Masculine 3.47(1.69) 4.35(1.57) t(56) = -2.03, p = .05** Weak vs. Strong 4.03(1.60) 4.42(1.30) t(56) = -1.00, p = .32 Positive vs. Negative 3.22(1.43) 3.56(1.26) t(56) = -.94, p = .35 Active vs. Passive 4.03(1.58) 3.27(1.31) t(56) = 1.97, p = .05 Unattractive vs. Attractive
4.63(1.58) 3.27(1.31) t(56) = -.79, p = .43
Friendly vs. Hostile 3.09(1.53) 2.96(1.15) t(56) = .37, p = .72 Unlikeable vs. Likable 4.47(1.78) 4.65(1.36) t(56) = -.44, p = .66 Cold vs. Warm 4.23(1.65) 4.12(1.45) t(55) = .27, p = .79 (* p < .05, ** p < .10)
Table 4-2 Mean difference of perceived cuteness and meanings for the 33rd rectangle in two countries
There was little difference in the product semantics between the two countries. A
factor analysis was performed to examine the underlying commonality between the
perceived meanings of the rectangles measured by nine semantic differential scales.
Principal components extraction was used with Varimax rotation in correlation method.
In the case of the U.S. participants, three factors were extracted, which explained 83.89%
of variance in total (46.01%, 20.08%, and 11.24% of variance respectively). Factor one

42
suggested a meaning of a strong and warm shape with the loading factors of sensible
(.68), strong (.67), attractive (-.85), likable (.96), positive (-.85), and warm (.91). Factor
two was about an unfriendly masculine shape with the loading factors of masculine (.83)
and hostile (.72). Factor three depicted a passive shape (passive, .95). Similarly, three
factors were extracted in the case of the Korean participants as well, explaining 77.34%
of total variance (46.01%, 20.08%, and 11.24% respectively). Factor one suggested a
meaning of a friendly, likeable shape with the loading factors of positive (-.63), attractive
(.79), friendly (-.89), and likeable (.84). Factor two explains a strong and warm shape
with the loading factors of sensible (.87), strong (.89), and warm (.70). Factor three was
associated with a feminine (-.74) and passive (.93) meaning.
The perceived cuteness was mainly predicted by likeability in Korea, while no
significant predictor was found in the U.S. A standard multiple regression was
performed with perceived cuteness as the dependent variable and nine other semantic
differential scales as independent variables. Normality, linearity and homoscedasticity of
residuals were assumed. The model with the Korean data was successful, suggesting that
R for regression was significantly different from zero, F(9, 7) = 4.21, p = .04, with R2
at .84. The adjusted R value of .64 indicated that more than 64% of the variability in
cuteness is predicted by this model. One unit increase in likeability would increase the
perceived cuteness rating by .99 (standardized beta β = .99, unstandardized beta β = .92).
However, the model with the U.S. data was not successful. R for regression was not
significantly different from zero, F(9, 8) = 1.50, p = .29, with R2 at .63.
In the U.S., for each dimension, perceived cuteness in High conditions was rated
differently in perceived cuteness than in Low conditions. However, in Korea, only

43
lightness and angle showed statistically different rating in perceived cuteness between
High and Low conditions. In both cultures, relatively darker and less tilted (Low
condition of lightness and angle) were perceived as cuter than were light and tilted shapes,
which seems contradictory to the prediction. It suggested that the perceived cuteness
might be in a quadrille, instead of a linear, correlation in some dimensions. The mean
differences in perceived cuteness, by High and Low condition, for each dimension are
presented in Appendix 4-2.
The data were consistent with H2. A cultural difference was observed in the
attitude toward babies; positive for Koreans (Mattitude = 39.66), negative for Americans
(Mattitude = 31.80), t(52) = -4.75, p < .001. By performing a median split on attitudes
towards babies (median = 32), the group with more positive attitude (Mattitude > 32) was
found to evaluated the cute stimuli as more positive (Mattitude_positive = 119.23,
Mattitude_negative = 127.39, t(42) = 2.01, p = .05) and more active (Mattitude_positive = 127.68,
Mattitude_negative = 136.16, t(45) = 2.38, p = .02) than the group with more negative attitude.
However, the difference in self-construals and holistic/analytic mind sets did not reveal
significant differences. Gender difference also did not account for the perceived semantic
differences.
Discussion
The findings suggested that different reactions to neotenic objects across the two
cultures were not related to distinct perception of cuteness but rather to different
meanings ascribed to cuteness. This cultural discrepancy in semantics of neoteny was
replicated by the pattern of results for attitudes towards babies.

44
It implies that the model of how aesthetic judgments function is indeed related to
objective cues stimulating pre-programmed automatic human behavior but is also
mediated by the cognitive processes linking pre-existing knowledge and experience. The
finding highlights an anthropomorphic innate process of value judgment. Evaluations of
pure geometric shapes like the rectangles were correlated with attitudes towards a living
creature. In this study, the neotenic cues were successfully manipulated with inanimate
objects to evoke positive or negative affect, which presumably reflected protective
tendencies towards infants that would serve to propagate the human species.
However, the present research has several limitations. The findings illustrated the
effect of neoteny with the pure geometric forms, detached mundane metaphors rather
than what would be found in everyday artifacts. This may suggest a lack of applicability.
An axiological judgment in real life may be more often related to the complex tiers of
self-image and social symbolism (Solomon, 1983). Another limitation involves the
experimental design of the dimensions of neoteny. The stimuli selected as the
representations of each dimension are not sufficient to show contrasted neotenic
characteristics. Since the stimuli were designed as cute rectangles, even rectangles in low
conditions may have been cute enough to be perceived as such. High conditions, on the
other hand, may be extreme exemplars, which would not reflect the subtleness in
perceived cuteness. Another limitation of this semantic study in terms of a dimensional
point view entails potential interactions among dimensions. This study could not analyze
which specific dimension would be associated with particular positive or negative
meaning. It may be that perceptions of the object tend to form a gestalt such that human

45
perceptions tend to synthesize each dimension into a higher percept, such as unity or
prototypicality (Veryzer and Hutchison, 1998).
To overcome the limitations of mundane reality, the subsequent study was
designed with consumer products in choice situations to focus on the axiological
judgment of neotenic designs. This paved the way to investigate whether aesthetic value
of neotenic designs can be juxtaposed with other (design) attributes and evaluated at the
same level.

46
Chapter 5
Asymmetric dominance
To examine context effects on choice behavior with neotenic designs, the
asymmetric dominance paradigm was adopted as a framework. Asymmetric dominance
effects (Huber, Payne, & Puto, 1982), or decoy effects (Huber, 1983), represent context
effects in choice. These types of effects occur in choice within two different sets of
choices. One set involves a choice between a pair of options where neither is superior to
the other, but each partly dominates the other in one attribute. The second set of options
adds a decoy that is not superior to the target product on either of the two attributes, but is
better than the other competitor in one attribute. Choice in this second set involves
selection from a set of three options. One effect the decoy can have is to draw greater
preference to its dominating target product by subtracting significant choice share from
the competitor. The decoy can generate other kinds of effects on choice on the other two
options (as compared to the set where the decoy is not presented), such as it can lead to a
compromise effect rather than an attraction effect. These types of “decoy effects” are
viewed as a type of context effect because the presence of the decoy in the choice set
changes the choice context relative to the choice set that does not include the decoy. We

47
now turn to a short literature review describing these types of context effects in more
detail.
Literature review: Asymmetric dominance effect
Simonson and Tversky (1992) hypothesized that the underlying mechanism of the
asymmetric dominance effect was based on trade-off contrast and extremeness aversion.
This means that an individual’s tendency will be 1) to contrast trade-offs when they try to
compare two incompatible criteria, or 2) to avoid extreme choices because of increased
potential loss caused by different weighing dimensions in a given context. First, trade-off
contrast refers to a subject’s strategy of contrasting trade-offs, or unit exchange rates,
between two dimensions demonstrated by local contrast, background contrast,
enhancement, and detraction trade-offs. Second, extremeness aversion follows from the
well-established finding that anticipated losses loom larger than the corresponding
anticipated gains (Tversky & Kahneman, 1991). In the context of choice sets with
extreme alternatives, loss aversion operates in a way that disadvantages are weighted
more heavily than the corresponding advantages. In order to avoid such a feeling of
heavy loss from extreme options, the middle option is preferred, which has relatively
small advantages and small disadvantages compared to the extremes with a relatively
large advantage and a large disadvantage. This effect has been called an “extremeness
aversion.”
Trade-off contrasts
The local contrast effect is that people will make a choice by comparing one
currently available option against other options, whereas the background contrast
involves the use of people’s experience or previous knowledge. For example, when

48
Procter & Gamble introduced Luvs, a relatively low-priced disposable diaper brand, it
may have increased sales of Pampers, a relatively high-priced diaper brand, due to a local
contrast effect. The comparison between Luvs and Pampers actually led consumers to
place greater weight on the high-priced Pampers (Huber & Puto, 1983). Under the effect
of background contrast, when subjects previously had paid $4 per one kilobyte of
memory and then were exposed to the cheaper option of $2 per one kilobyte of memory
(half price), the subjects more often chose the $2 option than when they had experienced
the same $2 option followed by $0.50 per kilobyte of memory. The same $2 option is
perceived as more preferable depending on what the subject previously experienced as
background information (Simonson & Tversky, 1992).
However, enhancement effects can occur if some options are more attractive than
other options, particularly when people have no strong preference for other options. It
means an attractive alternative will be evaluated favorably in any comparison. Detraction
effects will be expected if the alternative is less attractive than other options and, even
worse, it cannot draw a strong preference. This suggests that the less-attractive alternative
will not be selected regardless of which option is presented. A familiar choice situation
provides a good example: gasoline choice at a gas station. Assuming that three classes of
unleaded gasoline were provided, such as 1) a low quality (lower octane 87) but at the
cheapest price of $1 per gallon, 2) a middle quality (90 octane) at the middle price of
$1.50 per gallon, and 3) a high quality (93 octane) at a high price of $3 per gallon.
Subjects would be more likely to choose the middle option with 90 octane gasoline when
its price ($1.50 per gallon) is close to the lower price ($1) when compared with the higher
price ($3). An enhancement effect occurred in the option of 90 octane at $1.50, because it

49
is superior to the 87 octane at $1 and cheaper than the 93 octane at $3. Whereas, a
detraction effect would be expected if the middle option (90 octane) were priced at $2.50
– then it would be less likely to be selected, because its price would be perceived as more
expensive (in unit price) compared to what would be gained with the lower ($1) option
(Simonson & Tversky, 1992). These four types of trade-off contrast show how people
convert the values of an object into a comparable common axis throughout their
subjective weighing, in terms of two independent dimensions that are originally
incomparable. These different patterns of trade-off contrasts follow from a relatively
simple and straightforward model of choice, which predicts the settings under which
these different patterns will arise.
Extremeness aversion
Simonson and Tversky (1992) discussed two forms of extremeness aversion:
compromise and polarization. A compromise effect showed that an option will rarely be
chosen when it is the most superior in one dimension but the most inferior in the other
dimension at the same time, because the loss caused by inferiority would be perceived as
greater than the gain caused by superiority. Instead, the second-best or the middle option
is likely to be preferred, because it is perceived as a safer option with not too much loss
and not too much gain. That seemed to be what happened when Anheuser-Busch
introduced the super-premium brand Michelob. The promotion of this extremely high-
quality and high-priced beer may have made the second-premium option of Budweiser
seem less extreme, less expensive, and less elite, so as to be chosen more than expected
under compromise effect (Huber & Puto, 1983).

50
A polarization effect occurs when one dimension is perceived as more important
than the other. In this case, the consumers would simply ignore the less important
attribute for their choice dimension but only consider the first seemingly important
attribute. Thus, individuals’ preference would be shifted to the best option in the primary
attribute as if there were only one dimension to be considered. For example, when the
attributes vary in quality and price, consumers may find the lowest quality more aversive
than the highest price. In this case, quality is regarded as the focal dimension. The
individuals’ preference would be polarized in terms of quality, so that the high quality
option would be chosen regardless of how high the price is, in order to avoid the lower
quality option.
Culture, attitudes, and preference shifts
The role of a neotenic decoy may vary across cultures, depending on the local
attitude toward youthfulness. Consumers in cultures that view youthfulness positively are
more likely to appreciate neotenic designs and to choose them. The enhanced attraction
effects may be due to the positive attitude toward the dimension (Malaviya & Sivakumar,
1998). However, consumers in cultures that view neoteny of designs relatively negatively
are more likely to focus on other product attributes such as functionality or quality rather
than the cuteness attribute (Ha, Park, & Ahn, 2009; Mourali, Bockenholt, & Laroche,
2007; Ratneshwar, Shocker, & Stewart, 1987). Thus, it was predicted that the context
effects are moderated by culture.
Hypothesis
A decoy may be manipulated to generate these different context effects.
Depending on the topology of the decoy, where and how the decoy is placed relative to

51
the other options, the subjective weighing of the attributes could vary, thus influencing an
individual’s choice and evaluation. In this sense, the next set of experiments will test
whether neoteny of design operates in a manner similar to typical attributes in a choice
task. We know that functional attributes (like a digital camera’s megapixels) lead to these
kinds of context effects, but one key questions explored in the following study is whether
neoteny behaves like other attributes. It could be that neoteny is a fuzzy, vague, attribute
that is dismissed in choice (thus not leading to context effects) or neoteny acts like typical
attributes (thus leading to context effects).
More formally, the hypotheses were:
H1: When compared with choice of a less cute product, choice of a cute product
will be proportionally greater with, rather than without, a cute decoy that is
inferior in quality.
H2: When compared with choice of a cuter product, choice of a less cute product
will be proportionally greater with, rather than without, a less cute decoy that
is superior in quality.
H3: Preference shifts are greater in cultures that hold more positive views of
cuteness.
Method
Korea was selected as a culture that holds more generally positive views of
cuteness in comparison to the United States, which was selected to represent a culture
with less positive views of cuteness (Harris, 1999; Moreall, 1999; Ngai, 2005; Papanek,
1995). The selection of these cultures for our study was consistent with what is noted in

52
various literature about the differential sensitivity to cuteness in different cultures (Angier,
2006; Garger, 2007; Lee, 2005).
Participants
A total of 347 participants joined the experiment. One hundred eighty-eight
Korean participants (Mage = 21 years, females 52%, students 96.3%) participated in a 10-
minute online survey in exchange for compensation of $1.50 (10 Dotori, which is an
amount of cyber cash).
In the United States, 159 participants (Mage = 21 years, females 50%, students
94.3%) participated in a lab experiment. The ethnic composition was 52% Caucasian,
34% Asian/Pacific Islander, 5% African American, 1 Hispanic, and 12 multiracial. They
were compensated $10 in exchange for participating in a 50-minute series of experiments,
which included the present experimental task that took less than 10 minutes to complete.
Participants were asked to choose one alarm clock or one car from a given choice
set. Each choice question was randomly selected from one of three types: 1) a binary core
set with a cute design (target C) and a less cute design (Competitor B); 2) a trinary choice
set including Decoy A (least cute) and the binary core set; or 3) a trinary choice set
including Decoy D (cutest or second cutest) and the binary core set. Each choice was
followed by rating questions about each of the four product images (Target C, Competitor
B, Decoy A, and Decoy D). The order of the rating questions was randomized. The
experiment was a between-subject design with type of choice set as a factor.

53
Procedure and measurement
Participants were asked to choose one option from a choice set, followed by four
rating questions for each of the four product images shown in the choice set. The choice
question had two or three product images, depending on the question type. Information
about the other dimensions of the product characteristics – durability rating (alarm clock)
or safety rating (car) – was provided beneath each image. Participants were instructed to
consider the non-design dimension as follows: “Below you will find three alarm clocks.
Each alarm clock is accompanied by its durability rating, with 5 stars indicating the
highest durability. If you were to buy one of them, which one would you choose?”
Participants then evaluated four product images that were part of the choice question.
Even if only two or three images were used in the previous choice set, the participants
evaluated all four stimuli in that product category.
Participants were asked to rate how each product looked using 7-point scales
measuring cuteness, attractiveness, valuation, and self-relevance: three cuteness rating
items (not at all cute/very cute, very retro/very modern, very dull/very creative), three
attractiveness rating items (not at all attractive/very attractive, not at all cool/very cool,
very outmoded/very stylish), three valuation items (very cheap/very expensive, very
useless/very useful, highly unnecessary/highly necessary), and one self-relevance item
(highly irrelevant to me/highly relevant to me). The order of the rating items was
counterbalanced. For Korean subjects, the items were translated into Korean.
Stimuli and manipulation check
Perception of neoteny for each product was successfully manipulated, with the
rounder, light-colored, and small-sized stimuli selected as being cuter. The stimuli were

54
eight product images collected on the Internet: four alarm clocks and four cars. Both in
Korea and in the United States, the stimuli were evaluated in the same order in terms of
cuteness. See Appendix 5-1 Stimuli and manipulation check.
For alarm clocks, the ascending order of the perceived cuteness showed Decoy A
(least cute; MU.S. = 3.04, MKorea = 2.51), Competitor B (less cute; MU.S. = 3.38, MKorea =
2.92), Decoy D (cute; MU.S. = 3.62, MKorea = 3.01), and Target C (cutest; MU.S. = 4.63,
MKorea = 5.10). Thus, the Decoy A served as a compromise decoy (the extreme option of
the least cute and high durability dimensions) and Decoy D operated as a cute inferior
decoy (cute but not cuter than the target, and durable but not exceeding the durability of
the target).
For cars, the ascending order of the perceived cuteness was Decoy A (least cute;
MU.S. = 3.82, MKorea = 2.66), Competitor B (less cute; MU.S. = 4.25, MKorea = 3.40), Target
C (cute; MU.S. = 4.54, MKorea = 4.99), and Decoy D (cutest; MU.S. = 4.99, MKorea = 5.95).
Both Decoy A and Decoy D operated as compromise decoys.
Results
The data were consistent with our prediction (H3) for the alarm clock (Appendix
5-3: Cultural difference on perceived cuteness of Alarm Clock): A cute alarm clock in the
cuteness-positive culture attracted a greater share than in the cuteness-negative culture
(62.90% in Korea vs. 20.70% in the United States, p < .0001 by test on proportions).
However, the attraction effect of a cute decoy was reversed: In the culture in which
cuteness was positively perceived, the cute decoy contributed to an increasing preference
for a non-cute product rather than a cute product. In the United States, the cute inferior

55
Decoy D did not show a statistically significant attraction effect toward the cute target C
(20.70% to 25.00%), but in Korea, the same Decoy D contributed not to increasing the
preference of the cute Target C but to decreasing the preference (62% to 46.6%).
When a non-cute decoy was introduced, however, the polarization effect toward
the quality attribute was observed in both cultures (replicating the traditional effect across
both cultures). The least cute and superior alarm clock was chosen most (Decoy AU.S. =
66.0%; AKorea = 29.5%), followed by the less cute (Alarm Clock BU.S. = 26.4%; BKorea =
24.4%) and the cute target (Alarm Clock CU.S. = 7.5%; CKorea = 46.2%). In the United
States, the preference shifts are significant when the least cute Decoy A was introduced.
The choice of less cute Competitor B was reduced from 79.30% to 26.40% (z = 6.56, p
< .001) and the choice of the cute Target C was also reduced from 20.70% to 7.50% (z =
2.04, p = .04). In Korea, a number of participants (46.2%) stayed with the choice of the
cute Target C; however, the least cute Decoy A attracted more choice (29.5%) than did
the less cute B (24.4%), showing the pattern of polarization effect. But only the choice
shift of Target C under the introduction of the least cute Decoy A (from 62.90% to
46.20%, z = 2.01, p = .04) was statistically significant.
The fact that cute Decoy D turned out to be a decoy for the less cute Competitor B
led us to focus on the cross-cultural difference in the ratings of perceived cuteness. The
ratings of perceived cuteness were polarized among Koreans. The cute Target C in Korea
was rated significantly cuter than in the United States (t(302.33) = 2.83, p = .006) and the
remaining choices comprising least cute Decoy A (t(308.36) = -3.49, p = .001), less cute
Competitor B (t(344) = -3.09, p = .002), and cute Decoy D (t(345) = -3.93, p < .001) were
evaluated as significantly less cute than in the United States. This resulted in the cute

56
Decoy D becoming closer to the less cute Competitor B, such that Competitor B was
rated marginally cuter than the cute Decoy D (t(158) = -1.90, p = .06) in the United States,
whereas in Korea no significant difference was observed in perceived cuteness of the two
products. See Appendix 5-2: Preference shifts in choice sets.
However, for cars, these cultural differences did not emerge. When it comes to
cars, both cultures showed a propensity toward non-cute design (81.2% in the United
States vs. 77.8% in Korea). Compromise effects were observed in the choice set with the
cutest inferior Decoy D. The cutest Decoy D attracted preference for the Target C from
18.8% to 26.3% (though this did not reach statistical significance, p = .35) in the United
States and from 22.2% to 26.2% (also not statistically significant, p = .60) in Korea. As
expected, by adding the least cute Decoy A, polarization effects were demonstrated. The
least cute and superior Decoy A attracted the most preference in both cultures (Car AKorea
= 63.3%, Car BKorea = 15.0%, Car CKorea = 21.7%; Car AU.S. = 56.3%, Car BU.S. = 33.8%,
Car CU.S.= 9.9%).
Although the influence on choice shifts was not observed for cars, the difference
in cuteness ratings across cultures was again found. The Korean participants rated
cuteness for the non-cute Cars A and B significantly lower than did the U.S. participants
(the least cute Decoy A, Welch t(291.17) = 7.38, p < .001; the less cute Competitor B,
Welch t(317.07) = 4.44, p < .001), but rated cuteness higher for the cute Cars C and D
(the cute Target C, Welch t(290.57) = -2.79, p = .006; the cutest Decoy D, Welch
t(252.89) = -7.11, p < .001). See Appendix 5-3: Cultural difference on perceived neoteny
of design.

57
Stimuli Perceived cuteness
MU.S. MKorea t-value(df) Alarm A (The least cute decoy) 3.05 2.51 3.49(308.36)* Alarm B (The less cute competitor) 3.38 2.92 3.09 (344)* Alarm C (The cutest target) 4.63 5.10 -2.78(302.33)* Alarm D (The cute decoy) 3.62 3.01 3.93(345)** Car A (The least cute decoy) 3.80 2.66 7.46 (262.67)** Car B (The less cute competitor) 4.15 3.40 4.75 (324)** Car C (The cute target) 4.29 4.99 -3.35(256.09)* Car D (The cutest decoy) 4.70 5.95 -6.93(219.95)** * p < .05, ** p < .001
Table 5-1 Cultural difference on perceived neoteny
Gender differences on cuteness ratings were observed in both cultures, with
females rating the cute stimuli higher and males rating the non-cute stimuli higher.
With alarm clocks in the United States, female participants rated the cutest
product as being significantly cuter than did male participants (Alarm Clock C, Mfemale =
5.14, Mmale = 4.11, Welch t(145.49) = -3.90, p < .001); and in Korea, except for the cutest
product, males rated less-cute products as being cuter than did females (Alarm Clock A,
Mfemale = 2.35, Mmale = 2.69, t(186) = 1.87, p = .07; Alarm Clock B, Mfemale = 2.63, Mmale =
3.24, t(185) = 3.11, p = .002; Alarm Clock D, Mfemale = 2.76, Mmale = 3.28, t(186) = 2.45,
p = .02).
With cars, the same pattern was found in Korea – the cute stimuli were rated
higher by females (Car C, Mfemale = 5.40, Mmale = 4.53, Welch t(166.50) = -3.78, p < .001;
Car D, Mfemale = 6.11, Mmale = 5.78, t(185) = -1.93, p = .05), whereas the non-cute stimuli
were rated higher by males (Car A, Mfemale = 2.45, Mmale = 2.89, t(185) = 2.51, p = 0.01).
However, American females rated car stimuli to be cuter than did males across the board.

58
This result supports findings about female sensitivity to cute objects (Glocker et
al., 2009). Just as females are sensitive to babies from an evolutionary perspective, the
object with cute cues may trigger instinctive responses, which may not be found in the
males.
Stimuli Perceived cuteness U.S. Korea
MFemale MMale t(df) MFemale MMale t(df) Alarm A 2.89 3.22 1.35(156) 2.35 2.69 1.87(186) Alarm B 3.47 3.29 -.81(157) 2.63 3.24 3.11(185)* Alarm C 5.14 4.11 -3.90(145.49)* 5.16 5.03 -.64 (186) Alarm D 3.58 3.67 .42(157) 2.76 3.28 2.45(186)* Car A 4.05 3.34 -3.10(144.58)* 2.45 2.89 2.51(185)* Car B 4.33 3.72 -2.47(151)* 3.29 3.51 1.10(185) Car C 4.61 4.20 -1.23(152) 5.40 4.53 -3.78 (166.51)** Car D 5.00 4.34 -2.11(105.92)* 6.11 5.78 -1.94(185) * p < .05, ** p < .001
Table 5-2 Gender difference on perceived neoteny of stimuli
Interaction between culture and gender
The interaction effect of culture by gender could be found in the overall rating of
cuteness about alarm clocks but not about cars. With alarm clock stimuli, the main effect
of culture (F(1, 341) = 9.82, p = .002) and the interaction effect between gender and
culture (F(1, 341) = 8.52, p = .004) were observed. Overall, the females’ ratings were
significantly different by culture; the females in the United States rated the neoteny of the
stimuli higher than did the females in Korea. The males’ ratings were not different
between the two countries (see Appendix 5-4: Overall cuteness ratings between gender
by culture). Further investigation revealed that there was no significant difference
between genders in terms of the cuteness rating pattern in Korea; both Korean females
and males rated the neoteny of the cutest stimulus (Alarm Clock C) significantly higher
than they did the rest of the relatively less-cute stimuli (Alarm Clocks A, B, and D). The
same pattern was depicted in the ratings of the females in the United States, whereas the

59
U.S. males did not show this kind of sensitivity (See Appendix 5-4: Overall cuteness
ratings between gender by culture).
However, with the car stimuli, no cultural main effect was observed. Instead, the
main effect of gender (F(1, 317) = 13.04, p < .001) and the interaction effect of gender by
culture (F(1, 317) = 5.93, p = .02) were observed. Overall, the cuteness ratings in the
United States were much higher than in Korea; however, females in both cultures rated
the neotenous stimuli higher than did the males. The gender difference of neotenous
stimuli ratings in the United States is more salient than in Korea. See Appendix 5-5:
Gender and cultural differences in perceived cuteness of Alarm Clock.
Even though Korean females rated cute stimuli (Cars C and D) higher than
Korean males did, and higher than less-cute stimuli (Cars A and B), the gender difference
in Korea was not significant. However, the gender difference in the United States was
significant: American females rated the neotenous stimuli much higher than American
males did, across all stimuli. The polarized evaluation of neoteny – higher ratings for cute
stimuli (Cars C and D) and lower ratings for less cute stimuli (Cars A and B) – was
observed in comparison of culture by gender (see Appendix 5-6: Gender and cultural
differences in perceived cuteness of Cars). Both of Korean males and females showed
these polarized evaluation patterns.
To investigate the predictors of perceived cuteness, a multiple regression was
performed with perceived cuteness as the dependent variable and perceptions of
modernity, creativity, necessity, quality, coolness, stylishness, attractiveness,
60
expensiveness, usefulness, and relevance as predictors. The data for Alarm Clock C, the
cutest rated stimuli, were used.
Although attractiveness was a common predictor for perceived cuteness, the other
predictors exhibited different patterns across the two cultures. In the United States, the
significant predictors were attractiveness (unstandardized coefficient B = .33, sr2 = .06, p
= .003) and coolness (B = .28, sr2 = .04, p = .02), while in Korea they were modernity (B
= .22, sr2 = .06, p = .001), attractiveness (B = .38, sr2 = .08, p < .001), and stylishness (B
= .35, sr2 = .06, p = .001). This suggests that perceived cuteness may be correlated with
different constructs across cultures.
Further analysis of the correlation between perceived cuteness and other measured
constructs confirmed the cultural difference in the meaning of cuteness. U.S. participants
tended to positively correlate perceived cuteness with other constructs significantly more
than Korean participants did. Most of the stimuli illustrated the cultural discrepancy of
how cuteness would be correlated with other constructs, but the difference did not
apparently show in the cutest stimuli, i.e., Alarm Clock C and Car D (see Appendix 5-7:
Z-tests of cultural difference in perceived meaning).
Discussion
Our prediction about cultural difference in choice shifts was partially supported
by the data. Regardless of product category, compromise effects were demonstrated and
attraction effects for alarm clocks showed cultural differences. This difference can be
explained by the discrepancy in perceived cuteness and its association to other constructs.
The cuteness ratings were more polarized in South Korea, with non-cute products

61
evaluated as less cute, and cute products evaluated as cuter than in the United States. This
type of sensitivity was observed across gender; that is, in females’ relatively higher
ratings for cute products and lower ratings for non-cute products. It is interesting to
observe the cultural effects of cuteness, even by gender, suggesting that the gender
differences, seemingly rooted in evolutionary factors, have a cultural discrepancy.
However, further empirical testing is needed before the findings can be generalized to
other East Asian and Western cultures.
The findings highlight the axiological question about the design dimension. This
experiment demonstrated that neotenic features can be included in valuation process in
the same way as other attributes of the product. However, when compared to quality
attributes, why did cute stimuli and non-cute stimuli show different effects? A
compromise effect was demonstrated by cute stimuli, but a polarization effect was shown
by non-cute stimuli. It turns out that this design dimension operates in a similar manner to
price when it is compared to quality. People are more averse to low quality than high
price, according to Simonson and Tversky (1992). It seems that loss aversion would
operate in a hierarchical way in a value system, with the stronger aversion in one value
dimension compared to the other. Why would quality be the prioritized dimension for
loss aversion, rather than price or design? In accordance with hierarchical loss aversion,
the cutest product with the inferior quality did not gain much proportion of preference,
but the superior quality with the least cute design was chosen most. The deficit in quality
may be perceived as a greater loss than can be compensated for by the gains from the
cute design.

62
Maybe better quality is always preferable, and quality isn’t traded with other
dimensions? Another explanation is that the product category may influence the pre-
disposition toward giving greater weight to quality; what about decorative and temporary
fashion items that will be used only once, such as an exhibition façade, a party item, or a
Halloween costume? If the main purpose were allocated to pleasure of use more than
technical functions, people’s choices would be different from what we observed in the
choice patterns with the utilitarian products.
The cultural context as an axiological factor is another finding to be pondered. For
the attraction effects, the data supported the hypothesis only in the United States but not
in Korea. More interesting is the effect of the decoy, which was expected to attract more
shares to the cute target by drawing more preference to the less-cute competitor. Closer
investigation into the location of the decoy revealed that such a choice behavior was
rooted in aesthetic judgment differences. The cuteness ratings in Korea were more
polarized than in the United States, with non-cute products being evaluated as less cute,
and cute products as cuter. Two questions follow: 1) Why does one culture show more
sensitive reactions to the cute design than the other? 2) Why does the decoy shift choice
in opposite directions as a result of the cultural differences in aesthetic judgment?
The first question can be rephrased as the following: how can aesthetic judgment
be different across cultures, if it is hardwired? It shows that aesthetic judgment is not only
determined by objective cause, but also affected by a cognitive process, like an
association with contextual semantics that have been acculturated throughout an
individual’s whole life experience. Even though the aesthetic judgment is triggered by the
same objective stimuli, the different judgment would be created according to semiotics.

63
Therefore, the product semantics would not be the same all the time, because it is based
on our renewed experience throughout aesthetic judgment.
The different attitudes toward the cute design may be rooted in the meaning of
cuteness in the cultures. The emotion evoked by cute objects, like youthfulness, may be
positive or negative in a given sociocultural context. In an individualistic culture, people
feel cuteness suggests weakness, helplessness and immaturity. These people may
consider cuteness to be sad, pitiful, or silly. However, to members of community in an
interdependent culture, youthfulness refers to potential, energy, and innocence. Hence,
the attitude toward young individuals may influence the attitude toward axiological
judgment on neotenic design. In individualistic cultures, such as the United States has,
the infant may be considered a powerless individual and be associated with negative
feelings, but in collectivistic cultures, such as Korea has, the baby would be considered as
the extended self and be accompanied by a feeling of protectiveness. With an
anthropomorphic analogy, this difference in the attitude toward youthfulness may
influence perception of cuteness on products and its evaluation. The neotenic design
would be chosen more willingly in cultures with a positive attitude toward youthfulness.
The second question involves culture as a mediator in aesthetic and value
judgments. Why was the same stimulus, the less cute decoy (i.g., Alarm clock D),
evaluated differently by culture? It was expected to function to attract preference of the
cute target (Alarm Clock C), but when it was evaluated closer to the less-cute competitor
(Alarm Clock B), it worked as the decoy for that less-cute competitor. The initial
predisposition to cute design may push a decoy to a less-cute category, by coding the

64
decoy as a non-cute product. Value judgment is influenced by aesthetic judgment, which
is colored by the individual’s cultural background.
This also explains the sensitivity to neotenic designs observed in acculturated
gender difference; that is, in females’ relatively higher ratings for cute products and lower
ratings for non-cute products. It is interesting to observe cultural effects of cuteness, even
for gender, suggesting that the gender difference in this case has a cultural component in
addition to evolutionary components.
In conclusion, the present findings point to the importance of including higher-
level holistic perceptions of objects in consumer choice and decision-making models. The
same design may be perceived as cuter or less cute across different cultural contexts, and
may also be evaluated more or less positively by consumers. Depending on what products
are being compared, the value of design cannot simply be predicted by one factor, such as
gender, product category, or perceived attractiveness. Finally, this study demonstrates
that neoteny behaves much like a standard attribute or dimension in choice. Aesthetic
attribute of design can lead to standard choice effects such as asymmetric dominance
effects. The neoteny of design needs not be thought as a superfluous concept, but one that
can be used creatively in design to promote consumer utility and influence choice.

65
Chapter 6
Conclusion
The four studies in this dissertation support the evolutionary view that neotenic
cues are objectively related to positive aesthetic judgment and they influence human
choice behavior related to value judgments. Smallness, roundness, wideness, lightness,
tiltedness, simplicity, thick-border, and anthropomorphism were suggested as the eight
dimensions of perceived neoteny. Differences in cultural meaning ascribed to neotenic
objects were predicted and supported by data revealing that the difference was mainly
associated with individual’s attitude toward youthfulness. The decision-making paradigm
of asymmetric dominance was adapted to demonstrate the axiological influence of cute
designs. Asymmetric dominance effects showed that the perceived cuteness of
neighboring products led to preference shifts in the context of compensating for the other
attributes.
Several implications for the study of aesthetics and axiology can be noted:
1) Aesthetic judgment can be influenced by objective characteristics, such as neotenic
cues, that may be biologically bound. However, aesthetic judgment is mediated by
subjective meaning. This process is related to an attitude toward cuteness, which can vary
as a function of culture.

66
2) The value judgment of a product can be assessed by its aesthetic. The objective
aesthetics associated with neoteny made it possible to examine the compatibility of an
aesthetic attribute with other attributes that have been shown to influence choice behavior.
For example, a neotenic decoy can attract, compromise and polarize the choices of the
target cute product.
However, the studies could not successfully propose the complete mechanism to
predict the direction of the contrast effect, either toward positive or negative evaluation.
The effect on consumer behavior about neotenic designs can be analyzed further in the
future by two possible accounts: approach-avoidance and cheat-detection. The approach-
avoidance paradigm entails the human tendency to approach the beneficial and to avoid
the harmful. This can suggest the emotional reaction toward the neotenic cues, which
may explicate the needs of nurturing but implicate the burdens of caregivers. The reaction
can be affirmed if the object pleased the individual satisfactorily, but negated if the object
could not return enough rewards to the individual who expected sufficient payback for
his or her investment. Because the neotenic cues are evolved in a way that is certainly
beneficial to the youngster but may not be so beneficial to the adult, the reactors to the
neotenic object can assess their behaviors either as unsatisfactory in terms of self-interest
or as satisfactory in terms of altruism. Furthermore, this reciprocating related cognitive
mechanism can elucidate the negative reaction toward the neotenic cues. Through the
survival mechanism, the human mind must have developed inferential procedures to
detect cheaters, who do not reciprocate in social exchanges (Cosmides, 1989). Therefore,
under the evolutionary biological point of view, the neoteny takes advantage of the
automatic releasing mechanism, indeed, but at the same time operates the observer’s
67
special cognitive mechanism to protect oneself from the potential cost outweighing the
benefit. In other words, the cute design may thrive through its seemingly innocent
appearance or function by stimulating the consumer’s nurturing instinct, or it can be
dismissed as a cheater who may hide unfairness by contradicting the consumer’s
anticipation.
Future works will be placed to elucidate those underlying cognitive mechanisms
and to suggest a predictive behavioral model with the valuation of aesthetic judgment.
Based on the dimensional study and initial findings from the contextual effect of neotenic
design, it is hoped that this series of scientific design studies can provide the answers for
how the human mind transfers the intrinsic value of neoteny into extrinsic values in social
contexts.

68
Appendices
Appendix 1-1: Neotenic cues in young animals
Schema eliciting human parental care responses. Left: head proportions perceived as “loveable’ (child, jerboa, Pekinese dog, robin). Right: related heads which do not elicit the parental drive (man, hare, hound, golden oriole). Lorenz (1970, p. 155)

69
Appendix 1-2: Juvenilization of the artifact design - the case of Mickey Mouse and Teddy Bears
a. Design history of Mickey Mouse, Gould (1981)
b. The Teddy Bears (Steiff 1905 vs. 2009)

70
Appendix 1-3: Police Mascots in Japan
Retrieved from http://injapan.gaijinpot.com/play/culture/2010/10/26/japans-police-mascots/

71
Appendix 2-1: Examples of mini products
a. Fun-size M&Ms, Snickers, and mini cupcakes
b. DoCoMo phone screen icons

72
Appendix 2-2: Examples of round-shaped products
a. Volkswagen new Beetle 2009
b-1. Mac system in 1984 b-2. Windows 101 in 1985
c-1. Apple Newton GUIs 1990s c-2. Microsoft Windows GUIs 1990s

73
Appendix 2-3: Examples of simplification
a. Apple logo design
b. Mercedes-Benz logo design

74
Appendix 2-4: Examples of soft colored products
a. Soft-colored manicure
b. Soft-colored Japanese candy

75
Appendix 2-5: Examples of experiment stimuli with manipulated proportion
Stimuli of least cute, less cute, and cute baby faces (from left to right; Glocker et al. (2009)

76
Appendix 2-6: Examples of old and new logo designs
Old and new brand logo design (left: old, right: new)

77
Appendix 2-7: Examples of anthropomorphic products
a. Recycling symbols (left: anthropomorphic, right: non-anthropomorphic)
b. Laptop computer (left: anthropomorphic, right: non-anthropomorphic)

78
Appendix 2-8: Examples of thick-border drawings
Drawings of children’s book

79
Appendix 2-9: Stimuli sets for norming test
Product (12 pairs, 24 images)
Font-face (12 pairs, 24 images)
Geometric form (12 pairs, 24 images)
Size (small vs. large)
3 pairs (6 images)
3 pairs (6 images)
3 pairs (6 images)
Roundness (round vs. sharp)
3 pairs (6 images)
3 pairs (6 images)
3 pairs (6 images)
Simplicity (simple vs. complex)
3 pairs (6 images)
3 pairs (6 images)
3 pairs (6 images)
Proportion (wide vs. tall)
3 pairs (6 images)
3 pairs (6 images)
3 pairs (6 images)
a. Stimuli set for norming test 1
Product (6 pairs, 12 images)
Font-face (3 pairs, 6 images)
Geometric form (6 pairs, 12 images)
Size (small vs. large)
1 pair (2 images)
1 pair (2 images)
1 pair (2 images)
Roundness (round vs. sharp)
2 pairs (4 images)
1 pair (2 images)
2 pairs (4 images)
Simplicity (simple vs. complex)
1 pair (2 images)
1 pair (2 images)
1 pair (2 images)
Color (light vs. dark)
2 pairs (4 images)
None 2 pairs (4 images)
b. Stimuli set for norming test 2

80
c. Stimuli for norming test 1 – Geometric forms

81
d. Stimuli for norming test 2 – Font faces

82
e. Stimuli for norming test 1 - products

83
f. Stimuli for norming test 2
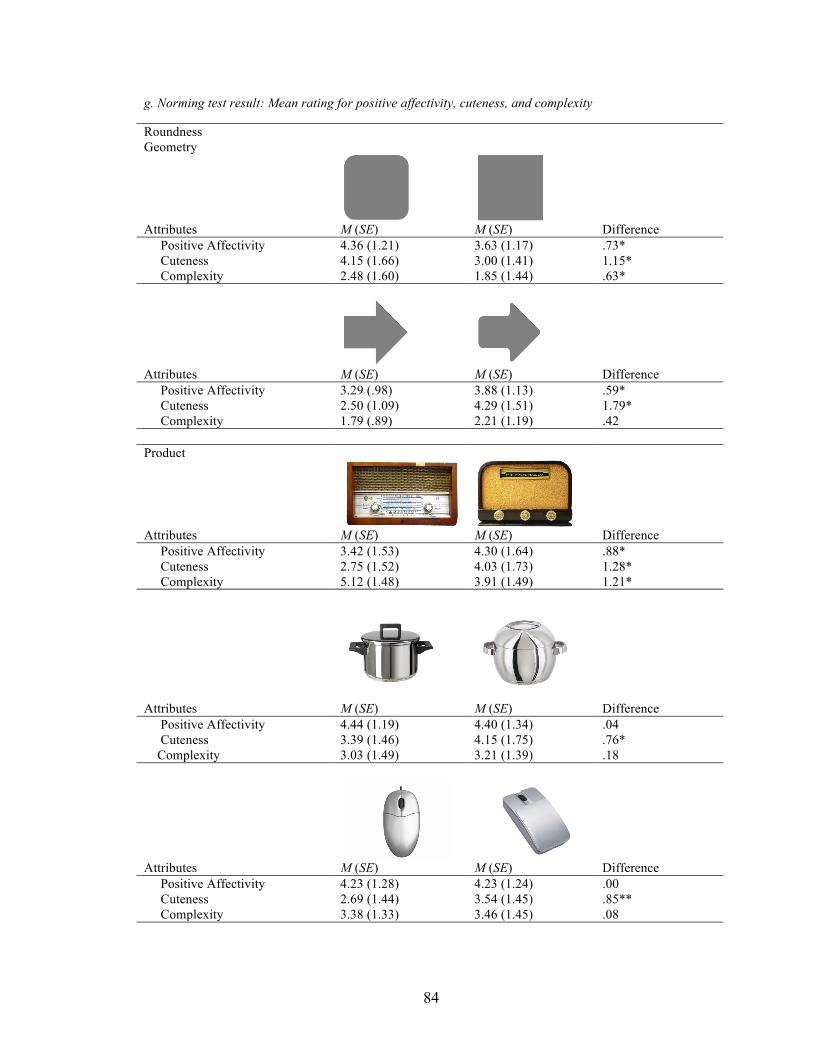
84
g. Norming test result: Mean rating for positive affectivity, cuteness, and complexity
Roundness Geometry
Attributes M (SE) M (SE) Difference Positive Affectivity 4.36 (1.21) 3.63 (1.17) .73* Cuteness 4.15 (1.66) 3.00 (1.41) 1.15* Complexity 2.48 (1.60) 1.85 (1.44) .63*
Attributes M (SE) M (SE) Difference Positive Affectivity 3.29 (.98) 3.88 (1.13) .59* Cuteness 2.50 (1.09) 4.29 (1.51) 1.79* Complexity 1.79 (.89) 2.21 (1.19) .42 Product
Attributes M (SE) M (SE) Difference Positive Affectivity 3.42 (1.53) 4.30 (1.64) .88* Cuteness 2.75 (1.52) 4.03 (1.73) 1.28* Complexity 5.12 (1.48) 3.91 (1.49) 1.21*
Attributes M (SE) M (SE) Difference Positive Affectivity 4.44 (1.19) 4.40 (1.34) .04 Cuteness 3.39 (1.46) 4.15 (1.75) .76* Complexity 3.03 (1.49) 3.21 (1.39) .18
Attributes M (SE) M (SE) Difference Positive Affectivity 4.23 (1.28) 4.23 (1.24) .00 Cuteness 2.69 (1.44) 3.54 (1.45) .85** Complexity 3.38 (1.33) 3.46 (1.45) .08
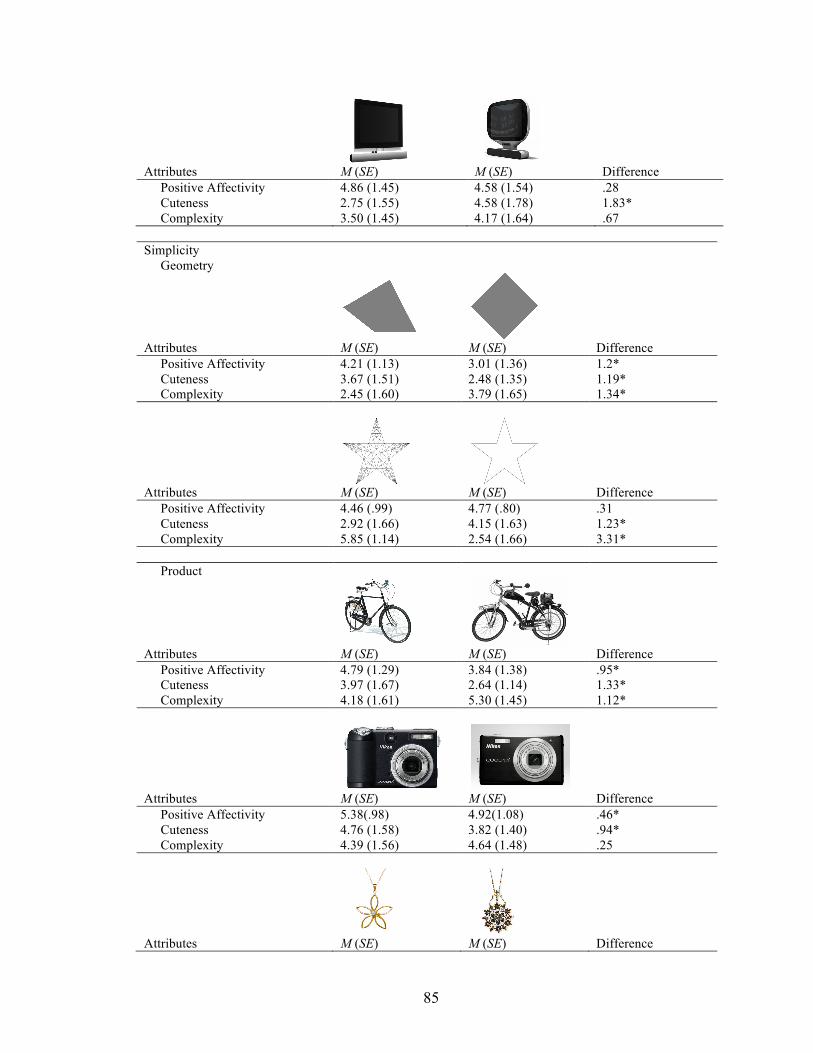
85
Attributes M (SE) M (SE) Difference Positive Affectivity 4.86 (1.45) 4.58 (1.54) .28 Cuteness 2.75 (1.55) 4.58 (1.78) 1.83* Complexity 3.50 (1.45) 4.17 (1.64) .67 Simplicity Geometry
Attributes M (SE) M (SE) Difference Positive Affectivity 4.21 (1.13) 3.01 (1.36) 1.2* Cuteness 3.67 (1.51) 2.48 (1.35) 1.19* Complexity 2.45 (1.60) 3.79 (1.65) 1.34*
Attributes M (SE) M (SE) Difference Positive Affectivity 4.46 (.99) 4.77 (.80) .31 Cuteness 2.92 (1.66) 4.15 (1.63) 1.23* Complexity 5.85 (1.14) 2.54 (1.66) 3.31* Product
Attributes M (SE) M (SE) Difference Positive Affectivity 4.79 (1.29) 3.84 (1.38) .95* Cuteness 3.97 (1.67) 2.64 (1.14) 1.33* Complexity 4.18 (1.61) 5.30 (1.45) 1.12*
Attributes M (SE) M (SE) Difference Positive Affectivity 5.38(.98) 4.92(1.08) .46* Cuteness 4.76 (1.58) 3.82 (1.40) .94* Complexity 4.39 (1.56) 4.64 (1.48) .25
Attributes M (SE) M (SE) Difference

86
Positive Affectivity 4.86 (1.33) 4.57 (1.51) .29 Cuteness 4.79 (1.67) 3.50 (1.45) 1.29** Complexity 3.00 (1.30) 6.07 (1.07) 3.07*
Attributes M (SE) M (SE) Difference Positive Affectivity 3.58 (1.37) 3.86 (1.28) .28 Cuteness 2.42 (1.31) 3.00 (1.54) .58** Complexity 5.08 (2.07) 4.08 (1.38) 1.00 Color Geometry
Attributes M (SE) M (SE) Difference Positive Affectivity 3.95 (1.19) 4.64 (1.33) .69* Cuteness 2.85 (1.14) 4.54 (1.39) 1.69* Complexity 3.08 (1.32) 3.54 (1.13) .46* Product
Attributes M (SE) M (SE) Difference Positive Affectivity 4.41 (1.14) 5.44 (1.09) 1.03* Cuteness 4.08 (1.85) 5.77 (1.24) 1.69* Complexity 2.62 (1.39) 2.85 (1.46) .23 Size Geometry
Biggest Smallest Attributes M (SE) M (SE) Difference Positive Affectivity 3.54 (.95) 3.64 (.83) .10 Cuteness 2.92 (1.19) 3.69 (1.03) .77* Complexity 2.69 (1.49) 2.85 (1.35) .16
Biggest Smallest Attributes M (SE) M (SE) Difference Positive Affectivity 3.66 (1.11) 4.06 (1.11) .40**

87
Cuteness 2.24 (1.42) 4.18 (1.47) 1.94* Complexity 2.00 (1.39) 2.09 (1.57) .09
Biggest Smallest Attributes M (SE) M (SE) Difference Positive Affectivity 3.83 (.99) 4.19 (1.01) .36* Cuteness 3.15 (1.33) 4.45 (1.64) 1.30* Complexity 2.00 (1.58) 2.18 (1.76) .18
Biggest Smallest Attributes M (SE) M (SE) Difference Positive Affectivity 4.40 (1.36) 4.70 (1.02) .30** Cuteness 3.54 (1.60) 4.89 (1.16) 1.35* Complexity 2.97 (1.67) 3.26 (1.72) .29 Product
Attributes M (SE) M (SE) Difference Positive Affectivity 5.56 (.94) 5.08 (1.06) .48** Cuteness 3.77 (1.42) 5.92 (1.19) 2.15* Complexity 4.23 (1.30) 4.77 (1.24) .54
Biggest Smallest Attributes M (SE) M (SE) Difference Positive Affectivity 4.49 (1.45) 4.66 (1.22) .17 Cuteness 3.82 (1.61) 5.00 (1.44) 1.18* Complexity 3.45 (1.60) 3.52 (1.60) .07
Attributes M (SE) M (SE) Difference Positive Affectivity 4.20 (1.17) 4.45 (1.19) .25 Cuteness 3.03 (1.36) 5.34 (1.58) 2.31* Complexity 4.03 (1.51) 3.22 (1.66) .81* * p < .05, ** p < .10

88
Appendix 3-1: Screenshot of the cute rectangle design program

89
Appendix 3-2: Final figure with average values of each dimension

90
Appendix 4-1: 32 Rectangles representing dimensional characteristics (ex. HHHHH: light and pale in color, wide in proportion, tilted in angle, round in shape, and small in size)

91

92
Appendix 4-2: The perceived cuteness mean differences between High and Low condition of each dimension, by culture
Korea Mhigh Mlow t-value (p) Lightness 59.50 71.54 t(21) = -5.82 (p < .001)* Proportion 65.82 65.23 t(21) = .36 (p = .72) Roundness 65.45 65.59 t(21) = .08 (p = .93) Tiltedness 62.36 68.36 t(21) = -2.95 (p = .008)* Smallness 67.13 65.79 t(23) = 1.44 (p = .16)
a. Mean differences by High vs. Low conditions in Korea
U.S. Mhigh Mlow t-value (p) Lightness 58.47 71.40 t(29) = -4.94 (p < .001)* Proportion 66.03 63.03 t(29) = 1.87 (p = .07) Roundness 66.87 63.00 t(29) = 2.04 (p = .05) Tiltedness 61.90 68.17 t(29) = -3.83 (p = .001)* Smallness 65.30 63.00 t(29) = 1.89 (p = .07)
b. Mean differences by High vs. Low conditions in the U.S.
Merged Mhigh Mlow t-value (p) Lightness 58.90 71.46 t(51) = -7.25 (p < .001)* Proportion 66.94 64.42 t(51) = 1.57 (p = .12) Roundness 66.27 64.10 t(51) = 1.66 (p = .10) Tiltedness 61.98 68.38 t(51) = -4.86 (p < .001)* Smallness 66.11 64.24 t(53) = 2.38 (p = .02)*
c. Overall mean differences by High vs. Low conditions

93
Appendix 4-2: The perceived cuteness mean differences between High and Low conditions of each dimension (cont.)
MS F-value (p) Lightness 247.48 F(1, 50) = 49.86 (p < .001)* Proportion 59.95 F(1, 50) = 29.81 (p < .001)* Roundness 5.52 F(1, 50) = 2.02 (p = .16) Tiltedness .61 F(1, 50) = .30 (p = .58) Smallness 5.39 F(1, 50) = 3.16 (p = .08) Lightness * country .31 F(1, 50) = .06 (p =.80) Proportion * country 6.87 F(1, 50) = 3.41 (p =.07) Roundness * country 6.36 F(1, 50) = 2.33 (p = .13) Tiltedness * country .04 F(1, 50) = .02 (p = .89) Smallness * country 1.96 F(1, 50) = 1.15 (p = .29) Lightness * Proportion 3.09 F(1, 50) = 2.01 (p = .16) Lightness * Roundness .24 F(1, 50) = .10 (p = .76) Lightness * Tiltedness 64.83 F(1, 50) = 22.54 (p < .001)* Lightness * Smallness 45.57 F(1, 50) = 11.40 (p = .001)* Proportion * Roundness 33.55 F(1, 50) = 14.82 (p < .001)* Proportion * Tiltedness 3.81 F(1, 50) = 2.72 (p =.11) Proportion * Smallness 107.98 F(1, 50) = 51.40 (p < .001)* Roundness * Tiltedness 10.54 F(1, 50) = 4.28 (p = .04)* Roundness * Smallness 18.85 F(1, 50) = 11.45 (p = .001)* Tiltedness * Smallness 15.05 F(1, 50) = 8.84 (p = .005)* Lightness * Proportion * country 1.03 F(1, 50) = .668 (p = .42) Lightness * Roundness * country 1.83 F(1, 50) = .74 (p = .39) Lightness * Tiltedness * country .009 F(1, 50) = .003 (p = .96) Lightness * Smallness * country .61 F(1, 50) = .30 (p = .58) Proportion * Roundness * country .11 F(1, 50) = .05 (p = .83) Proportion * Tiltedness * country 6.67 F(1, 50) = 4.76 (p =.03)* Proportion * Smallness * country .10 F(1, 50) = .47 (p =.83) Roundness * Tiltedness * country .23 F(1, 50) = .09 (p = .76) Roundness * Smallness * country .08 F(1, 50) = .05 (p = .83) Tiltedness * Smallness * country .03 F(1, 50) = .02 (p = .89) Tiltedness * Roundness * Smallness 6.22 F(1, 50) =3.26 (p = .08) Proportion * Roundness * Smallness .000 F(1, 50) = .00 (p = .99) Proportion * Tiltedness * Smallness .93 F(1, 50) = .61 (p = .44) Proportion * Tiltedness * Roundness .34 F(1, 50) = .19 (p = .67) Lightness * Roundness * Smallness 1.64 F(1, 50) = .28 (p = .26) Lightness * Tiltedness * Smallness 6.85 F(1, 50) = 4.48 (p = .04)* Lightness * Tiltedness * Roundness 73.26 F(1, 50) = 42.09 (p < .001)* Lightness * Proportion * Smallness 26.26 F(1, 50) = 14.84 (p < .001)* Lightness * Proportion * Roundness 3.13 F(1, 50) = 1.16 (p = .29) Lightness * Proportion * Tiltedness 11.84 F(1, 50) = 8.56 (p = .005)* Tiltedness * Roundness * Smallness * country .10 F(1, 50) = .05 (p = .82) Proportion * Roundness * Smallness * country .03 F(1, 50) = .02 (p = .89) Proportion * Tiltedness * Smallness * country 1.91 F(1, 50) = 1.26 (p = .27) Proportion * Tiltedness * Roundness * country .57 F(1, 50) = .31 (p = .58)

94
Lightness * Roundness * Smallness * country .42 F(1, 50) = .33 (p = .57) Lightness * Tiltedness * Smallness * country 2.00 F(1, 50) = 1.31 (p = .26) Lightness * Tiltedness * Roundness * country 5.11 F(1, 50) = 2.94 (p = .09) Lightness * Proportion * Smallness * country .007 F(1, 50) = .004 (p = .95) Lightness * Proportion * Roundness * country 6.38 F(1, 50) = 2.36 (p = .13) Lightness * Proportion * Tiltedness * country 2.03 F(1, 50) = 1.47 (p = .23) Lightness * Tiltedness * Roundness * Smallness .59 F(1, 50) = .21 (p = .65) Lightness * Proportion * Roundness * Smallness 2.46 F(1, 50) = 1.09 (p = .30) Lightness * Proportion * Tiltedness * Roundness 1.22 F(1, 50) = .71 (p = .40) Proportion * Tiltedness * Roundness * Smallness 113.04 F(1, 50) = 78.11 (p < .001)* Lightness * Tiltedness * Roundness * Smallness * country
.189 F(1, 50) = .07 (p = .80)
Lightness * Proportion * Roundness * Smallness * country
.80 F(1, 50) = .36 (p = .55)
Lightness * Proportion * Tiltedness * Roundness * country
.009 F(1, 50) = .005 (p = .94)
Proportion * Tiltedness * Roundness * Smallness * country
28.53 F(1, 50) = 19.72 (p < .001)*
Lightness * Proportion * Tiltedness * Roundness * Smallness
37.18 F(1, 50) = 25.57 (p < .001)*
Proportion * Tiltedness * Roundness * Smallness * Smallness * country
.04 F(1, 50) = .03 (p = .87)
d. Main and interaction effect of High vs. Low conditions among each dimension by culture

95
Appendix 5-1: Stimuli and manipulation checks
Stimuli and manipulation check (Alarm Clocks)
Stimuli and manipulation check (Car)

96
Appendix 5-2: Preference shifts in choice sets
Preference shifts in choice sets (Alarm Clock, U.S.)
Preference shifts in choice sets (Alarm Clock, Korea)
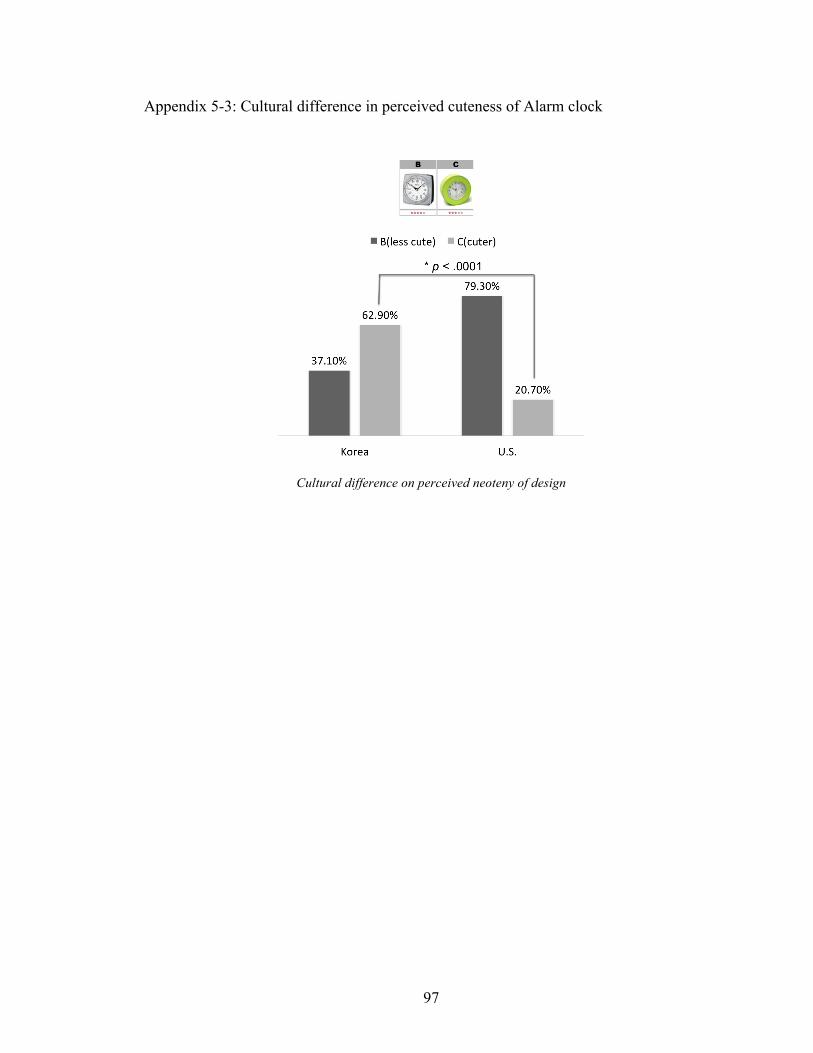
97
Appendix 5-3: Cultural difference in perceived cuteness of Alarm clock
Cultural difference on perceived neoteny of design

98
Appendix 5-4: Overall cuteness ratings between gender by culture
Overall cuteness ratings of alarm clock between gender by culture
Overall cuteness ratings of car between gender by culture

99
Appendix 5-5: Gender and cultural differences in perceived cuteness of alarm clock
Gender and cultural differences in perceived cuteness of alarm clock (U.S.)
Gender and cultural differences in perceived cuteness of alarm clock (Korea)

100
Appendix 5-6: Gender and cultural differences in perceived cuteness of Cars
Gender and cultural differences in perceived cuteness of Cars (U.S.)
Gender and cultural differences in perceived cuteness of Cars (Korea)

101
Appendix 5-7: Z-tests of cultural difference in perceived meaning
Car A U.S. (n = 138) Korea (n = 183) Z-test p Modern* 0.49 0.22 2.72 0.01 Creative* 0.63 0.45 2.19 0.03 Cool* 0.63 0.36 3.16 0.002 Stylish* 0.60 0.38 2.59 0.01 Attractive** 0.70 0.37 4.21 < .001 Expensive 0.44 0.14 1.63 2.93 Useful 0.40 0.24 1.54 0.12 necessary 0.33 0.30 0.21 0.83 relevant 0.53 0.36 1.93 0.05 Car B U.S. (n = 139) Korea (n = 181) Z-test p modern 0.35 0.19 1.56 0.12 Creative* 0.58 0.37 2.32 0.02 Cool** 0.56 0.20 3.71 < .001 Stylish** 0.57 0.14 4.5 < .001 Attractive** 0.64 0.26 4.37 < .001 Expensive* 0.29 -0.03 2.91 0.004 Useful** 0.46 -0.003 4.34 < .001 necessary 0.41 0.30 1.11 0.28 Relevant* 0.51 0.28 2.44 0.01 Car C U.S. (n = 139) Korea (n = 182) Z-test p Modern* 0.43 0.15 2.69 0.007 Creative** 0.68 0.27 4.97 < .001 Cool** 0.80 0.29 6.98 < .001 Stylish** 0.79 0.20 7.58 < .001 Attractive** 0.85 0.31 8.13 < .001 Expensive** 0.53 -0.06 5.67 < .001 Useful* 0.41 0.19 2.23 0.03 Necessary** 0.44 0.09 3.32 0.001 Relevant** 0.59 0.25 3.8 0.0001 Car D U.S. (n = 138) Korea (n = 180) Z-test P modern 0.31 0.35 -0.41 0.68 creative 0.54 0.57 -0.43 0.67 cool 0.68 0.63 0.76 0.45 Stylish* 0.70 0.55 2.08 0.04 attractive 0.77 0.72 0.87 0.38 expensive 0.48 0.37 1.17 0.24 useful 0.40 0.42 -0.17 0.87 necessary 0.44 0.48 -0.45 0.65 relevant 0.50 0.48 0.2 0.84

102
Alarm A U.S. (n = 157) Korea (n = 183) Z-test p Modern* 0.42 0.22 2.09 0.04 Creative 0.58 0.45 1.57 0.12 Cool** 0.64 0.36 3.49 0.0002 Stylish* 0.57 0.38 2.17 0.03 Attractive* 0.60 0.37 2.74 0.003 Expensive* 0.43 0.14 2.89 0.004 Useful 0.26 0.24 0.15 0.88 Necessary 0.36 0.30 0.52 0.6 Relevant 0.34 0.36 -0.16 0.87 Alarm B U.S. (n = 158) Korea (n = 182) Z-test p Modern 0.43 0.25 1.74 0.08 Creative 0.50 0.50 -0.01 0.99 Cool 0.58 0.42 1.94 0.05 Stylish 0.55 0.41 1.63 0.10 Attractive 0.51 0.47 0.52 0.60 Expensive 0.36 0.30 0.62 0.54 Useful 0.33 0.24 0.89 0.37 Necessary 0.21 0.26 -0.47 0.64 Relevant 0.37 0.30 0.73 0.47 Alarm C U.S. (n = 157) Korea (n = 184) Z-test p Modern 0.37 0.49 -1.42 0.16 Creative 0.58 0.43 1.85 0.06 Cool* 0.70 0.56 2.01 0.04 Stylish 0.63 0.64 -0.24 0.81 attractive 0.69 0.67 0.42 0.67 expensive 0.43 0.29 1.53 0.13 useful 0.29 0.45 -1.72 0.09 necessary 0.29 0.39 -1.05 0.29 relevant 0.39 0.39 -0.08 0.94 Alarm D U.S. (n = 159) Korea (n = 184) Z-test p Modern** 0.56 0.22 3.76 0.0002 Creative* 0.69 0.52 2.48 0.01 Cool** 0.76 0.53 3.61 0.0003 Stylish** 0.76 0.54 3.62 0.0003 Attractive* 0.76 0.58 3.21 0.001 Expensive* 0.57 0.34 2.73 0.006 Useful 0.37 0.26 1.1 0.27 Necessary 0.41 0.29 1.21 0.23 Relevant 0.48 0.30 1.93 0.05 * p < .05, ** p < .001

103
References
Alley, T. R. (1983). Age-related changes in body proportions, body size, and perceived cuteness. Perception and Motion Skills, 56, 615-622.
Angier, N. (2006, January 3). The cute factor. New York Times. Retrieved from http://www.nytimes.com/2006/01/03/science/03cute.html
Aronoff, J., Woike, B. A., & Hyman, L. M. (1992). Which are the stimuli in facial displays of anger and happiness: configurational bases of emotion recognition. Journal of Personality and Social Psychology, 62(6), 1050-1066.
Bar, M., & Neta, M. (2006). Humans prefer curved visual objects. Psychological Science, 17(2001), 645-648.
Barratt, B. (2009). How sharp is cute? Bonzer! Retrieved July 27, 2000, from http://www.bonzerplus.org.au/?p=2962
Belsley, D. A., Kuh, E., & Wlsch, R. E. (1980). Regression diagnostics: Identifying influential data and sources of collinearity. New York: John Wiley & Sons.
Berry, D. S., & Zebrowitz-McArthur, L. (1988). What’s in a Face?: Facial maturity and the attribution of legal responsibility. Personality and Social Psychology Bulletin, 14(1), 23-33. doi:10.1177/0146167288141003
Bogin, B. (1988). Patterns of human growth. Cambridge: Cambridge University Press.
Brin, D. (1994). Neoteny and two-way sexual selection in human evolution: Paleo-anthropological speculation on the origins of secondary-sexual traits, male nurturing, and the child as a sexual image. Journal of Social and Evolutionary Systems, 18(3), 257-276.
Carbon, C.-C. (2010). The cycle of preference: long-term dynamics of aesthetic appreciation. Acta Psychologica, 134(2), 233-44. Elsevier B.V. doi:10.1016/j.actpsy.2010.02.004
Casey, R. J., & Ritter, J. M. (1996). How infant appearance informs: Child care providers’ responses to babies varying in appearance of age and attractiveness. Journal of Applied Developmental Psychology, 495-518.
Chandler, J., & Schwarz, N. (2010). Use does not wear ragged the fabric of friendship: Thinking of objects as alive makes people less willing to replace them. Journal of Consumer Psychology, 20(2), 138-145.

104
Crilly, N., Good, D., Matravers, D., & Clarkson, P. (2008). Design as communication: Exploring the validity and utility of relating intention to interpretation. Design Studies, 29(5), 425-457. doi:10.1016/j.destud.2008.05.002
Cross, G. (2004). The cute and the cool. Oxford: Oxford University Press.
Cunningham, M. R. (1986). Measuring the physical in physical attractiveness: Quasi-experiments on the sociobiology of female facial beauty. Journal of Personality and Social Psychology, 50(5), 925-935.
cute. (2010). In Merriam-Webster Online Dictionary. Retrieved June 12, 2010, from http://www.merriam-webster.com/dictionary/cute
Demirbilex, O., & Sener, B. (2003). Product design, semantics and emotional response. Ergonomics, 46(13), 1346-1360. doi:10.1080/00140130310001610874
Doczi, G. (1981). The power of limits: Proportional harmonies in Nature, art, and architecture. Shambhala Publications.
Duffy, S. a, & Burton, D. (2000). Cartoon characters as tobacco warning labels. Archives of Pediatrics & Adolescent Medicine, 154(12), 1230-6. Retrieved from http://www.ncbi.nlm.nih.gov/pubmed/11115308
Etcoff, N. (1999). Survival of the prettiest. New York: Doubleday.
Eveleth, R. (2010). Zoo illogical: Ugly animals need protection from extinction, too. Scientific American, (December), 9-10.
Frost, P. (1989). Human skin color: The sexual differentiation of its social perception. Mankind Quarterly, XXX(1&2), 3-16.
Frynta, D., Lisková, S., Bültmann, S., & Burda, H. (2010). Being attractive brings advantages: The case of parrot species in captivity. PloS one, 5(9), e12568. doi:10.1371/journal.pone.0012568
Gardner, B. T., & Wallach, L. (1965). Shapes of figures identified as a baby’s head. Perceptual and Motor Skills, 20, 135-142.
Garger, I. (2007, March). Global psyche: One nation under cute. Psychology Today. Retrieved from http://www.psychologytoday.com/articles/200703/global-psyche-one-nation-under-cute
Glocker, M. L., Langleben, D. D., Ruparel, K., Loughead, J. W., Valdez, J. N., Griffin, M. D., Sachser, N., et al. (2009). Baby schema modulates the brain reward system in nulliparous women. Proceedings of the National Academy of Sciences of the United States of America, 106(22), 9115-9. doi:10.1073/pnas.0811620106
Gordon, C. P. (1996). Adolescent decision making: A broadly based theory and its application to the prevention of early pregnancy. Adolescence, 31(123), 561-584.
Gorn, G. J., Jiang, Y., & Johar, G. V. (2008). Babyfaces, trait inferences, and company evaluations in a public relations crisis. Journal of Consumer Research, 35(1), 36-49. doi:10.1086/529533
Gould, S. J. (1980). The Panda’s thumb. Middlesex: Penguin Books.

105
Harris, D. (2000). Cute, quaint, hungry, and romantic: The aesthetics of consumerism. Cambridge: Da Capo Press.
Hartman, R. S. (1967). The Axiometric structure of intrinsic value. The Journal of Value Inquiry, 81-101.
Hildebrandt, K. A., & Fitzgerald, H. E. (1978). Adults’ responses to infants varying in perceived cuteness. Behavioural Processes, 3, 159-172.
Hinde, R. A., & Barden, L. A. (1985). The evolution of the teddy bear. Animal Behaviour, 33, 1371-1373.
Hoegg, J., Alba, J. W., & Dahl, D. W. (2010). The good, the bad, and the ugly: Influence of aesthetics on product feature judgments. Journal of Consumer Psychology, 20(4), 419-430. Society for Consumer Psychology. doi:10.1016/j.jcps.2010.07.002
Hofstede, G. (1983). The cultural relativity of organizational practices and theories. Journal of International Business Studies, 14.
Hofstede, G. (2001). Culture’s consequences: comparing values, behaviors, institutions, and organizations across nations (2nd ed.). Thousand Oaks, CA: SAGE Publication.
Huber, J. (1983). Market boundaries and product Choice: Illustrating attraction and substitution effects. Journal of Consumer Research, 10(1), 31-44.
Huber, J., Payne, J. W., & Puto, C. (1982). Adding asymmetrically dominated alternatives: Violations of regularity and the similarity hypothesis. Journal of Consumer Research, 9(1), 90-98.
Kant, I. (2001). Critique of the power of judgment. (P. Guyer & E. Matthews, Trans.). Cambridge: Cambridge University Press.
Karraker, K. H., & Stern, M. (1990). Infant physical attractiveness and facial expression: Effects on adult perceptions. Basic and Applied Social Psychology, 11(4), 371-385. doi:10.1207/s15324834basp1104
Korthase, K. M., & Trenholme, I. (1982). Perceived age and perceived physical attraction. Perceptual and Motor Skills, 54, 1251-1258.
Krippendorff, K. (2006). The semantic turn: A new foundation for design. CRC Press.
Kühnen, U., & Oyserman, D. (2002). Thinking about the self influences thinking in general: Cognitive consequences of salient self-concept. Journal of Experimental Social Psychology, 38(5), 492-499. doi:10.1016/S0022-1031(02)00011-2
Lang, K. (2009). Realizations of rounded rectangles. Retrieved Jul. 28, 2009, from http://www.uiandus.com/2009/07/27/theories/realizations-of-rounded-rectangles
Leder, H., & Carbon, C.-C. (2005). Dimensions in appreciation of car interior design. Applied Cognitive Psychology, 19(5), 603-618. doi:10.1002/acp.1088
Lindstrom. (2000). Mini-branding comes to the net. ClickZ. Retrieved March 2, 2000, from http://www.clickz.com/821661
Livingston, R. W., & Pearce, N. A. (2009). The teddy-bear effect: Does having a baby face benefit black chief executive officers? Psychological Science, 20(10), 1229-36. doi:10.1111/j.1467-9280.2009.02431.x

106
Lobmaier, J. S., Sprengelmeyer, R., Wiffen, B., & Perrett, D. I. (2010). Female and male responses to cuteness, age and emotion in infant faces. Evolution and Human Behavior, 31(1), 16-21. Elsevier Inc. doi:10.1016/j.evolhumbehav.2009.05.004
Lorenz, K. (1970). Studies in animal and human behaviour. (R. Martin, Trans.) (pp. 115-195). Cambridge MA: Harvard University Press.
Ludden, G. D. S., & Schifferstein, H. N. J. (2007). Effects of visual-auditory incongruity on product expression and surprise. International Journal of Design, 1(3), 29-39.
McCabe, V. (1988). Facial proportions, perceived age, and caregiving. In T. R. Alley (Ed.), Social and applied aspects of perceiving faces (pp. 89-95). Hillsdale NJ: Lawerence Earlbaum Associations.
McManus, I. C. (1980). The aesthetic of simple figures. British Journal of Psychology, 71, 505-524.
Mcveigh, B. J. (2000). How Hello Kitty commodifies the cute, cool and camp: “Consumutopia” versus “Control” in Japan. Journal of Material Culture, 5(2), 225-245.
mignon. (1989). In Collins Robert French Paperback Dictionary, London: Collins.
Morris, P. H., Reddy, V., & Bunting, R. C. (1995). The survival of the cutest: Who’ s responsible for the evolution of the Teddy Bear ? Animal Behaviour, 50, 1697-1700.
Moskin, J. (2011, October 25). Small wonders. The New York Times, pp. 9-12.
Newitz, A. (2002, July 2). The apotheosis of cute. July 2. 2006. Retrieved July 3, 2010, from http://www.sfbg.com/36/17/news_cute.html
Ngai, S. (2005). The cuteness of the Avant-Garde. Critical Inquiry, 31, 811-847.
Nienstedt, C. W. J., & Ross, S. (1951). Preferences for rectangular proportions in college students and the aged. Journal of Genetic Psychology, 78(2), 153-158.
Papanek, V. (1995). The green imperative: Ecology and ethics in Design and Architecture. Thames & Hudson.
Patton, P. (2011, April 18). 2012 Volkswagen Beetle: A bug with a rampaging Y chromosome. The New York Times. Retrieved from http://wheels.blogs.nytimes.com/2011/04/18/2012-volkswagen-beetle-a-bug-with-a-rampaging-y-chromosome/
Roach, M. (1999). Cute Inc. Wired 7.12. Retrieved July 27, 2009, from http://www.wired.com/wired/archive/7.12/cute.html
Silvia, P. J., & Barona, C. M. (2009). Do people prefer curved objects? Angularity, expertise, and aesthetic preference. Empirical Studies of the Arts, 27(1), 25-42.
Simonson, I., & Tversky, A. (1992). Choice in context: Tradeoff contrast and extremeness aversion. Journal of Marketing Research, 29(3), 281-295.
Solomon, M. R. (1983). Symbolic products social stimuli: Interactionism perspective. Journal of Consumer Research, 10(3), 319-329.

107
Spindler, G. (1961). Other: Male-selection: A study of complementary needs. Robert F. Winch. American Anthropologist, 63(3), 666. doi:10.1525/aa.1961.63.3.02a00630
Stephan, C. W., & Langlois, J. H. (1984). Baby beautiful: Adult attribution of infant competence as a function of infant attractiveness. Child Development, 55(576-585).
Sternglanz, S. H., Gray, J. L., & Murakami, M. (1977). Adult preference for infantile facial features: An ethological approach. Animal Behaviour, 25, 108-115.
Stokes, D. L. (2006). Things we like: Human preferences among similar organisms and implications for conservation. Human Ecology, 35(3), 361-369. doi:10.1007/s10745-006-9056-7
Sullivan, L. H. (1896). The tall office building artistically considered. Lippincott’s Magazine, (March), 1-12. Retrieved from http://academics.triton.edu/faculty/fheitzman/tallofficebuilding.html
Tversky, A., & Kahneman, D. (1991). Loss aversion in riskless choice: A reference-dependent model. Quarterly Journal of Economics, 160(4), 1039-455.
Veryzer, R. W. J., & Hutchinson, J. W. (1998). The influence of unity and prototypicality on aesthetic responses to new product design. Journal of Consumer Research, 24(4), 374-394.
Volk, A., & Quinsey, V. L. (2002). The influence of infant facial cues on adoption preferences. Human Nature, 13(4), 437-455.
Whitfield, T. W. A., & de Destefani, L. R. (2011). Mundane aesthetics. Psychology of Aesthetics, Creativity, and the Arts, 5(3), 291-299. doi:10.1037/a0023038
Wright, B., & Rainwater, L. (1962). The meanings of color. Journal of General Psychology, 67, 89-99.
Zebrowitz, L. A. (1997). Reading faces: Window to the soul? Boulder CO: Westview Press.
Zhang, Y., Feick, L., & Price, L. J. (2006). The impact of self-construal on aesthetic preference for angular versus rounded shapes. Personality & Social Psychology Bulletin, 32(6), 794-805. doi:10.1177/0146167206286626
かわいい. (1983). In New Collegiate Japanese-English Dictionary. Tokyo: Kenkyusha Ltd.