AES/TG/10-08 Bunter Reservoir Quality for Geothermal ...
73
AES/TG/10-08 Bunter Reservoir Quality for Geothermal Applications in the Zuid Holland Area June 2010 Olakunle Bukola Ogunjimi
Transcript of AES/TG/10-08 Bunter Reservoir Quality for Geothermal ...

AES/TG/10-08 Bunter Reservoir Quality for Geothermal Applications in the
Zuid Holland Area
June 2010 Olakunle Bukola Ogunjimi

ii
Bunter Reservoir Quality for Geothermal Applications
MSc Graduation Thesis of Olakunle Bukola OGUNJIMI. June, 2010.
Title : Bunter Reservoir Quality for Geothermal Applications in the
Zuid Holland Area
Author(s) : Olakunle Bukola Ogunjimi
Date : June 2010
Professor(s) : Dr. Gert Jan Weltje
Supervisor(s) : Dr. Bert Dijksman, Dr. Gert Jan Weltje
TA Report number : AES/TG/10-08
Postal Address : Section for Petroleum Geosciences
Department of Applied Earth Sciences
Delft University of Technology
P.O. Box 5028
The Netherlands
Telephone : (31) 15 2781328 (secretary)
Telefax : (31) 15 2781189
Copyright ©2010 Section for Petroleum Geosciences
All rights reserved.
No parts of this publication may be reproduced,
Stored in a retrieval system, or transmitted,
In any form or by any means, electronic,
Mechanical, photocopying, recording, or otherwise,
Without the prior written permission of the
Section for Petroleum Geosciences

iii
Bunter Reservoir Quality for Geothermal Applications
MSc Graduation Thesis of Olakunle Bukola OGUNJIMI. June, 2010.
Acknowledgement
This project has been carried out during a graduation thesis position created by the
Exploration and Appraisal Unit of the Subsurface Evaluation Department at Panterra
Geoconsultants B.V. in Leiderdorp, The Netherlands. I am very grateful, not only for the
opportunity to carry out this project in this company but also for the opportunity to gain a
much needed industrial work experience while the project lasted.
I would like to thank my external supervisor, Dr. Bert Dijksman for his guidance and
mentorship through out the period of the project and to all staff members of the Exploration
and Appraisal Unit. They were always ready to assist me when ever the need arose.
My University supervisor, Dr. Gert Jan Weltje, was of great help and guidance in the
achievement of this project. He was instrumental to the easy facilitation and coordination
between TU Delft and Panterra Geoconsultants B.V., without which the graduation thesis will
not have been possible. I appreciate your constructive comments and criticism.
Lastly, I will like to appreciate all my lecturers and colleagues from the Faculty of
Civil Engineering and Geosciences for all their input into my academic and professional
development.
Olakunle Bukola Ogunjimi
June, 2010.

iv
Bunter Reservoir Quality for Geothermal Applications
MSc Graduation Thesis of Olakunle Bukola OGUNJIMI. June, 2010.
Abstract
With the continued growth of world population comes the need for more energy resources to
quench the thirst of the energy insatiable world we live in. Geothermal energy is green and is a
sustainable way of providing our energy needs. Formation water at depths greater than 3,000m
in the Netherlands is a potential source of energy to generate electricity. Over the study area
observed formations are buried deep enough to reach water temperatures in excess of 1000C,
and this could conceivably be used for the generation of electricity with very low CO2
emissions.
Four seismic surveys L3NAM1985P (146.6km2), L3NAM1991A (414.5km
2), Z3NAM1990D
(762.2km2) and Z3AMC1989A (544.6km
2) were interpreted and integrated with well data
including well tops to help in this evaluation.
The Detfurth and Volpriehausen (Triassic) of the West Netherlands Basin in the Zuid Holland
area are established to be potentially good reservoirs for geothermal development. This is due
to the fact that stratigraphically, they are the deepest sandstones and consequently most likely
to reach sufficient depths. These objectives are too deep to be visible and adequately
interpretable on seismic due to the low impedance contrast and because it is overlain by the
strong reflectors of the evaporates of the Upper Germanic Triassic. Therefore, surfaces for
these objectives were generated based on formation markers in the wells that intersected the
Triassic using 3D gridding in Jewel Suite.
Generally, the reservoir interval from the top of the Detfurth to the base of the Volpriehausen
contains enough thick sequences of porous sands. The gross thickness ranges from 95m in
well VAL-01 to 163m in P15-14. Two porosity/permeability relationships have been used for
calculating N/G at various permeability cut-offs of 0.1mD, 1mD, 10mD and 100mD. Net sand
ranges from 0.14m to 58.04m for 10mD and 0.1mD permeability cut-offs respectively.
The zone in and around Wells MON-03, P18-A-02, P15-01 and P15-14 show the best
reservoir intervals based on average porosity and N/G values. Based on different scenarios the
average porosity ranges from 6.5% to 16.2% and N/G ranges from 0.6% to 30.8%. Primary
porosity and permeability are generally low in the mapped area, but it is expected that
permeability and connectivity are enhanced locally through fracturing. The objective is highly
faulted, and hence this will serve as conduit for water leading to a higher level of connectivity
and water production. Heterogeneity remains an issue of concern due the high level of Vcl in
some of the intervals. But it is believed that they will generally not serve as a barrier or baffle
to flow, i.e. it will reduce the vertical permeability but not the important horizontal
permeability.
The objectives in the mapped area suggest that aeolian and fluvial facies occupy more than
50% of the rock unit. Aeolian sandstones are known for their excellent reservoir qualities.
They are well sorted with good porosity and permeability. This means that a larger part of the
rock unit within the mapped area is of good reservoir quality.
The focus of the oil industry is on the structural highs. Prospective areas for geothermal
exploitation occur in lows. The lows have no well penetrations and are usually considerably
deeper than the much shallower oil fields. It is, however, suspected that structuration and
formation of highs and lows is relatively late and that diagenesis predates structuration. This
would imply that the shallow oil fields have porosities representative of much greater depths.
This is borne out by the fact that there is hardly any relationship of porosity against depth.
When this proves to be accurate it would have a very positive effect on the development of
geothermal energy, since this reduces the uncertainties involved in a project like this.

v
Bunter Reservoir Quality for Geothermal Applications
MSc Graduation Thesis of Olakunle Bukola OGUNJIMI. June, 2010.
Table of Contents Acknowledgements.................................................................................................................................................iii
Abstract...................................................................................................................................................................iv
Table of Contents.....................................................................................................................................................v
List of Figures.........................................................................................................................................................vi
List of Tables..........................................................................................................................................................vii
1. INTRODUCTION ........................................................................................................................................... 1
1.1 Project Plan: ......................................................................................................................................... 3 1.2 Deliverables: ......................................................................................................................................... 3
2. REGIONAL GEOLOGY ................................................................................................................................. 7
2.1 Overview of the Triassic Stratigraphy .................................................................................................. 9 2.1.1 Lower Germanic Triassic Group ............................................................................................. 10 2.1.1.2 Main Buntsandstein Subgroup ................................................................................................. 10 2.1.1.2.3 Hardegsen Formation ..................................................................................................... 11
3. AVAILABLE DATA AND METHODS USED ............................................................................................ 13
3.1 Coordinate System .............................................................................................................................. 13 3.2 Seismic Data ....................................................................................................................................... 13 3.3 Well Data ............................................................................................................................................ 14
4 INTERPRETATION AND RESULTS .......................................................................................................... 16
4.1 Seismic Interpretation ......................................................................................................................... 16 4.2 Mapping in Time ................................................................................................................................ 20 4.3 Velocity Model ................................................................................................................................... 22 4.4 Mapping in Depth ............................................................................................................................... 23
4.4.1 3D Gridding............................................................................................................................. 23 4.4.2 Depth and Thickness Maps of the Detfurth and Volpriehausen .............................................. 25 4.4.3 Geothermal Gradient/Temperature Maps ................................................................................ 27
4.5 Petrophysical Interpretation of reservoir levels .................................................................................. 29 4.6 Mapping of Reservoir Quality ............................................................................................................ 37
4.6.1 Thickness ................................................................................................................................. 37 4.6.2 Net/Gross ................................................................................................................................. 39 4.6.3 Porosity ................................................................................................................................... 40
4.7 Compilation of Core Data ................................................................................................................... 40 4.7.1 Porosity and Permeability trends and relationships ................................................................. 40 4.7.2 Environment of Deposition ..................................................................................................... 42
4.8 Areas Suitable for Geothermal Exploitation ....................................................................................... 43 4.9 Risks and possible means to reduce risks ........................................................................................... 44 4.10 Volumetrics Reporting ........................................................................................................................ 46
5.0 CONCLUSIONS AND RECOMMENDATIONS ......................................................................................... 47
Reference................................................................................................................................................................48 Appendixes.............................................................................................................................................................50

vi
Bunter Reservoir Quality for Geothermal Applications
MSc Graduation Thesis of Olakunle Bukola OGUNJIMI. June, 2010.
List of Figures
Figure 1.1: Depth in m to the base of the Triassic section in the Netherlands..........................................................1
Figure 1.2: Licences for geothermal energy as at January 1st, 2010 in the Netherlands...........................................4
Figure 1.3a: The study area showing the four seismic surveys interpreted...............................................................5
Figure 1.3b: The study area showing the four seismic surveys............................................................................... ..6
Figure 2.1: Structural elements map of the Netherlands……………………………………………………………8
Figure 2.2: Seismic section running from SW flank of the West Netherlands Basin into the inverted basin...........8
Figure 2.3: Regional cross-section passing through the Central Netherlands Basin.................................................9
Figure 2.4: Characteristic trap situation in the WNB…………………………………………………………….....9
Figure 2.5: Stratigraphy of the Triassic in the Netherlands....................................................................................12
Figure 3.1: The seventy-nine (79) wells in the study area......................................................................................15
Figure 3.2: The thirty (30) wells that intersected the Triassic in the study area.....................................................15
Figure 4.1: Inline 1004 (L3NAM1991A)...............................................................................................................17
Figure 4.2: Inline 1627 (Z3NAM1990D).............................................................................................. .................17
Figure 4.3a: A regional view of the four levels mapped showing the complex faulting system in the WNB.........18
Figure 4.3b: A regional view of the TM, BP and TT............................................................................................. 18
Figure 4.3c: A regional view of the BP and TT............................................................................................... .......19
Figure 4.3d: A regional view of the TT.............................................................................. ....................................19
Figure 4.4a: Base Tertiary time structural map............................................................................................ ..........20
Figure 4.4b: Texel Marl time structural map..........................................................................................................20
Figure 4.4c: Base Posidonia time structural map.............................................................................................. ......21
Figure 4.4d: Top Triassic time structural map.................................................................................................... ....21
Figure 4.5a: Base Tertiary Velocity Model................................................................................... .........................22
Figure 4.5b: Top Triassic Velocity Model.............................................................................................. ...............23
Figure 4.6: Model Layer Definition........................................................................................................................24
Figure 4.7a: Area used for gridding with lateral and vertical dimensions..............................................................24
Figure 4.7b: 3D Grid of the modelled area............................................................................................................ .25
Figure 4.8a: Detfurth depth map with wells for location...................................................................................... ..26
Figure 4.8b: Volpriehausen depth map with wells for location..............................................................................26
Figure 4.8c: Top Detfurth to Base Volpriehausen thickness map with wells for location......................................27
Figure 4.9a: Detfurth Temperature map with wells for location.............................................................................28
Figure 4.9b: Volpriehausen Temperature map with wells for location...................................................................28
Figure 4.10: Wells used for Correlation and Petrophysical Interpretation.............................................................29
Figure 4.11a: Graph of Poro-Perm of Wells of interest..........................................................................................30
Figure 4.11b: Graph of Poro-Perm of Wells of interest giving more weight to the good values............................31
Figure 4.12: Correlation Panel 1............................................................................................................................32
Figure 4.13: Correlation Panel 2.............................................................................................. ..............................33
Figure 4.14: Correlation Panel 3...................................................................................................... ......................34
Figure 4.15: Correlation Panel 4.......................................................................... ..................................................35
Figure 4.16: Correlation Panel 5.............................................................................................. ..............................36
Figure 4.17: Correlation Panel 6............................................................................................................................38
Figure 4.18: Por-Perm Detfurth for Wells Q16-08 and VAL-01............................................................................41
Figure 4.19: Por-Perm Volpriehausen for Wells Q13-04, Q13-07-S2, Q16-02, Q16-08 and VAL-01..................41
Figure 4.20: Depositional model for the Lower Buntsandstein and Volpriehausen formations in the southern
Netherlands.............................................................................................................................................................42
Figure 4.21: Area suitable for geothermal exploitation in the Detfurth..................................................................43
Figure 4.22: Area suitable for geothermal exploitation in the Volpriehausen........................................................44
Figure 4.23: Depth Vs Porosity for Wells that intersected the Triassic..................................................................45

vii
Bunter Reservoir Quality for Geothermal Applications
MSc Graduation Thesis of Olakunle Bukola OGUNJIMI. June, 2010.
List of Tables
Table 2.1. Stratigraphic framework of the Triassic in the Netherlands..................................................................10
Table 3.1: Parameters of each of the four seismic surveys interpreted in the project.............................................14
Table 4.1: Gross reservoir thickness for each Well................................................................................................29
Table 4.2a: Gross and Net Thickness of the reservoir intervals in the Wells.........................................................37
Table 4.2b: Gross and Net Thickness of the reservoir intervals in the Wells based on the second scenario..........37
Table 4.3a: N/G, Average Porosity, and Average Volume of Clay calculated in the reservoir intervals in the
Wells........................................................................................................................ ..............................................39
Table 4.3b: N/G, Average Porosity, and Average Volume of Clay calculated in the reservoir intervals in the
Wells based on the second scenario which gives more weight to the good values.................................................39
Figure 4.4a: Volumetrics Report using Sw of 100%..............................................................................................46
Figure 4.4b: Volumetrics Report using Sw of 80%................................................................................................46
Figure 4.4c: Volumetrics Report using Sw of 60%................................................................................................46
1. INTRODUCTION
With the continued growth of world population comes the need for more energy
resources to quench the thirst of the energy insatiable world we live in. In 2009, Prof. John
Beddington, the UK government chief scientist said, “ growing world population will cause a
“perfect storm” of food, energy and water shortages by 2030”. Demand for food and energy
will jump 50% by 2030 and for fresh water by 30%, as the population tops 8.3 billion, he told
the Sustainable Development UK 09 conference in London. Climate change will exacerbate
matters in unpredictable ways, he added.1
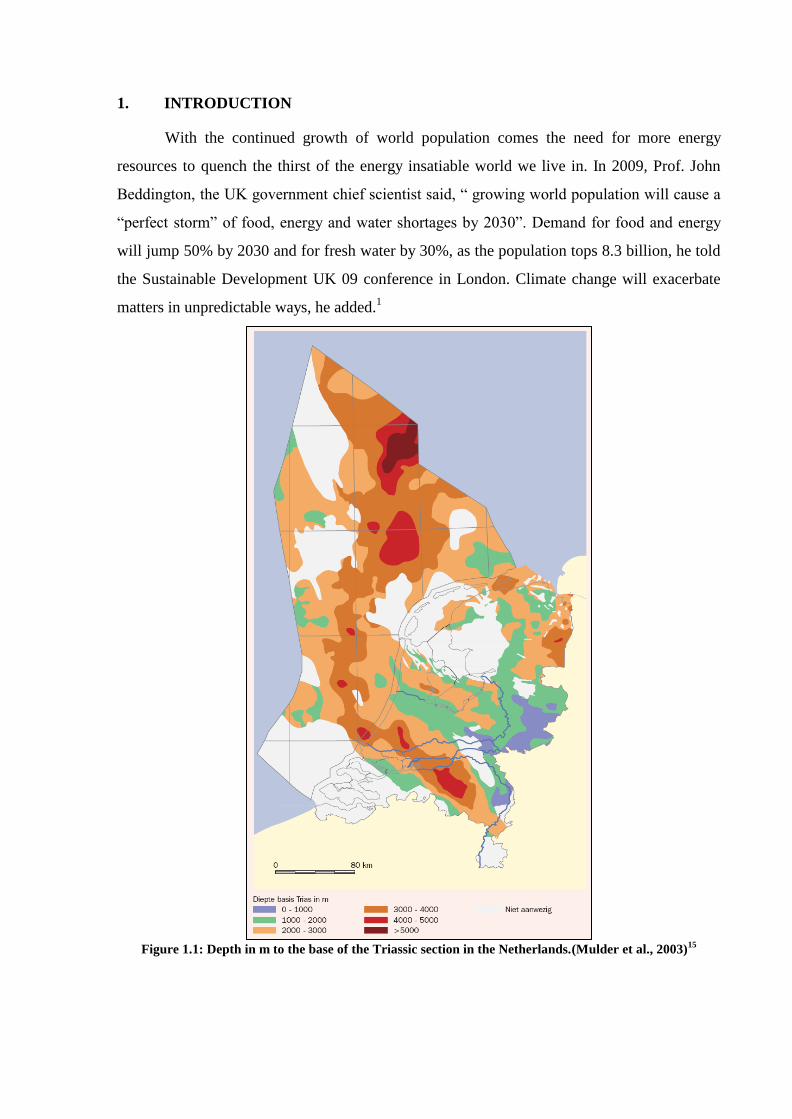
Figure 1.1: Depth in m to the base of the Triassic section in the Netherlands.(Mulder et al., 2003)15
2
Bunter Reservoir Quality for Geothermal Applications
MSc Graduation Thesis of Olakunle Bukola OGUNJIMI. June, 2010.
As a result of the above, other forms of sustainable energy solutions are needed for energy
production. Geothermal energy which is a green source of energy does not burn fuel to
generate electricity, so their emission levels are very low. They release less than 1% of the
carbon dioxide emissions of a fossil fuel plant. Geothermal plants use scrubber systems to
clean the air of hydrogen sulphide that is naturally found in the steam and hot water.
Geothermal plants emit 97% less acid rain-causing sulphur compounds than are emitted by
fossil fuel plants. After the steam and water from a geothermal reservoir has been used, they
are injected back to the earth.2
Therefore, in many ways this source of energy is not only renewable but it is also
“green”, i.e. friendly to the environment. If the trend in worldwide energy demand which
triggered the oil price to rise to around US $ 140 per barrel in July 2008 is anything to go by,
then other forms of sustainable energy resources need to be developed aggressively.
Groundwater at greater depths in the Netherlands is a potential source of energy.
Generally it can be stated that a permeable layer at a depth of 3000 m or more contains water
in excess of 1000C. This implies that the generation of electricity could be considered. The
distribution of the Triassic is shown in Figure 1.1. It occurs over large parts of the
Netherlands. Locally it is buried deep enough ( >3000 m) to have formation water temperature
in excess of 1000C, and this could conceivably be used for the generation of electricity with
very low CO2 emissions. Aquifers that are of potential interest for the heating purposes occur
at depths of less than 100 m to more than 3000 m in Permian, Lower Triassic and Lower
Cretaceous sandstones and in two Tertiary sand units. In total, ca. 90 1018
J (equivalent to
2400 109 m
3 natural gas, i.e. the equivalent of the Groningen Gas Field) of heat in place
(HIP) may be present in these deep reservoirs. The fraction of this energy that may eventually
be produced successfully, however, depends strongly on location-specific reservoir
properties.3
There has been renewed efforts in the recent past by the Delft University of Technology to
produce hot water for heating purposes (Delft Geothermal Project, DAP), but the target
reservoir (Delft Sandstone) is shallow and the water that will be produced is below 1000C,
making it not suitable for electricity generation.14
This project therefore is targeting the
Triassic where it is believed water above 1000C will be present for electricity generation.
This project is aimed at studying the spatial variations of the reservoir quality of the
Bunter sandstone (Triassic) in the Zuid Holland area of the Netherlands. Issues like
environment of deposition, reservoir thickness, net/gross, porosity, permeability will be

3
Bunter Reservoir Quality for Geothermal Applications
MSc Graduation Thesis of Olakunle Bukola OGUNJIMI. June, 2010.
addressed. The results can be used to advise on possibilities for the application of geothermal
energy. The project plan and deliverables are highlighted below.
1.1 Project Plan:
Create an inventory of wells which have intersected the Bunter Section (Location;
Projection System; Deviation data; Well velocity surveys; Log data/interpretations).
Interpretation (Interpretation of four levels: Base Tertiary (BT), Texel Marl (TM),
Base Posidonia (BP), and Top Triassic (TT)); Mapping in time; Velocity modelling;
Mapping in depth; Isopach mapping.
Reservoir Modelling (Petrophysical interpretation of reservoir levels; Porosity and
permeability trends and relationships; Environment of deposition; Thickness;
Net/Gross, Porosity).
1.2 Deliverables:
Identification of areas suitable for geothermal exploitation.
Identification of risks.
Groundwater at greater depths in the Netherlands is a potential source of energy. Based on
subsurface temperature data, several evaluation projects were carried out in the 1980s,
ultimately resulting in a number of inventory and feasibility studies. In 2005 the first
exploration licence was granted and a number of projects are being evaluated presently.4
Figure 1.2 shows the licences for geothermal energy issued by the Dutch Ministry of
Economic Affairs as at January 1st, 2010. Figures 1.3 (a & b) shows the present study area and
a zoomed in view.

4
Bunter Reservoir Quality for Geothermal Applications
MSc Graduation Thesis of Olakunle Bukola OGUNJIMI. June, 2010.
Figure 1.2: Licences for geothermal energy as at January 1st, 2010 in the Netherlands. Source: TNO.

5
Bunter Reservoir Quality for Geothermal Applications
MSc Graduation Thesis of Olakunle Bukola OGUNJIMI. June, 2010.
Figure 1.3a: The study area showing the four seismic surveys interpreted.
N

6
Bunter Reservoir Quality for Geothermal Applications
MSc Graduation Thesis of Olakunle Bukola OGUNJIMI. June, 2010.
Figure 1.3b: The study area showing the four seismic surveys.
N
7
Bunter Reservoir Quality for Geothermal Applications
MSc Graduation Thesis of Olakunle Bukola OGUNJIMI. June, 2010.
2. REGIONAL GEOLOGY
This project is situated in the West Netherlands Basin (WNB). The boundaries of the
WNB are the Zandvoort ridge and the IJmuiden high to the north, the London-Brabant Massif
to the south and it merges with the Roer-Valley Graben towards the south-east (Figure 2.1).
The WNB was formed on the Campine basin and existed from Late Permian till Late
Cretaceous. During the middle and late Triassic tectonic movement, large-scale half-graben
structures were formed. The strongest rifting occurred during the Late Jurassic to Early
Cretaceous.5
During this rifting event tilted faults blocks have been formed and thick fluvial sediment
packages were deposited in the half-grabens. During this formation of the half-grabens, NW-
SE faults patterns were formed. The Late Cretaceous compressive forces (Alpine
compression) reactivated the earlier faults. This resulted in the formation of complex
inversion structures and NNW-SSE fault patterns (Figure 2.2, 2.3). In these structures most of
the oil and gas fields of the WNB (Figure 2.4) are found.6,7
For the purpose of geothermal energy, three main intervals are identified as promising zones:
the Permian Rotliegendes sandstones, the Lower Triassic sandstones and the Lower
Cretaceous sandstones.3 For this study, however, the Lower Triassic sandstones are the target
reservoir. (Figure 1). In the lower Triassic (Lower Germanic Triassic), the Detfurth and
Volpriehausen intervals are best suited for geothermal exploitation. Table 2.1. Further
description of the Triassic and especially this two intervals are given in Chapter 2.1

8
Bunter Reservoir Quality for Geothermal Applications
MSc Graduation Thesis of Olakunle Bukola OGUNJIMI. June, 2010.
Figure 2.1: Structural elements map of the Netherlands. (De Jager, 2007)6
Figure 2.2: Seismic section running from SW flank of the West Netherlands Basin into the inverted basin.
See Fig. 2.1 for location.(De Jager, 2007)6
9
Bunter Reservoir Quality for Geothermal Applications
MSc Graduation Thesis of Olakunle Bukola OGUNJIMI. June, 2010.
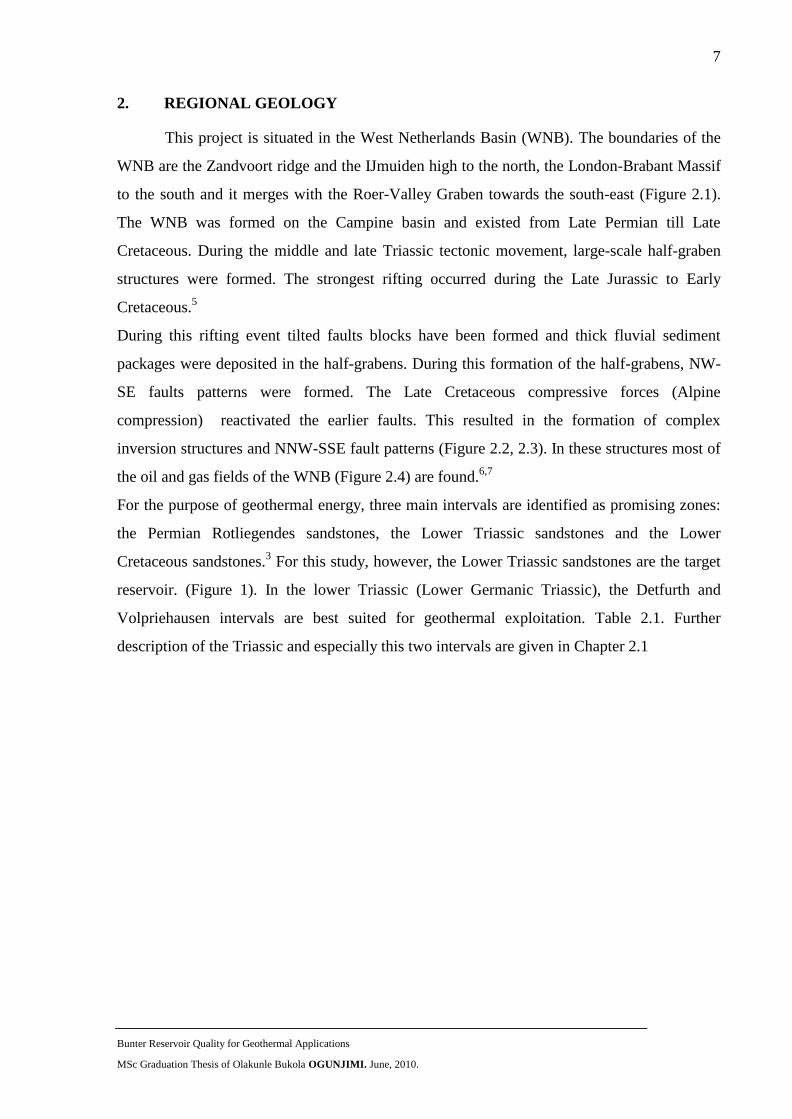
Figure 2.3: Regional cross-section passing through the Central Netherlands Basin. See Fig. 2.1 for
location.(De Jager, 2007)6
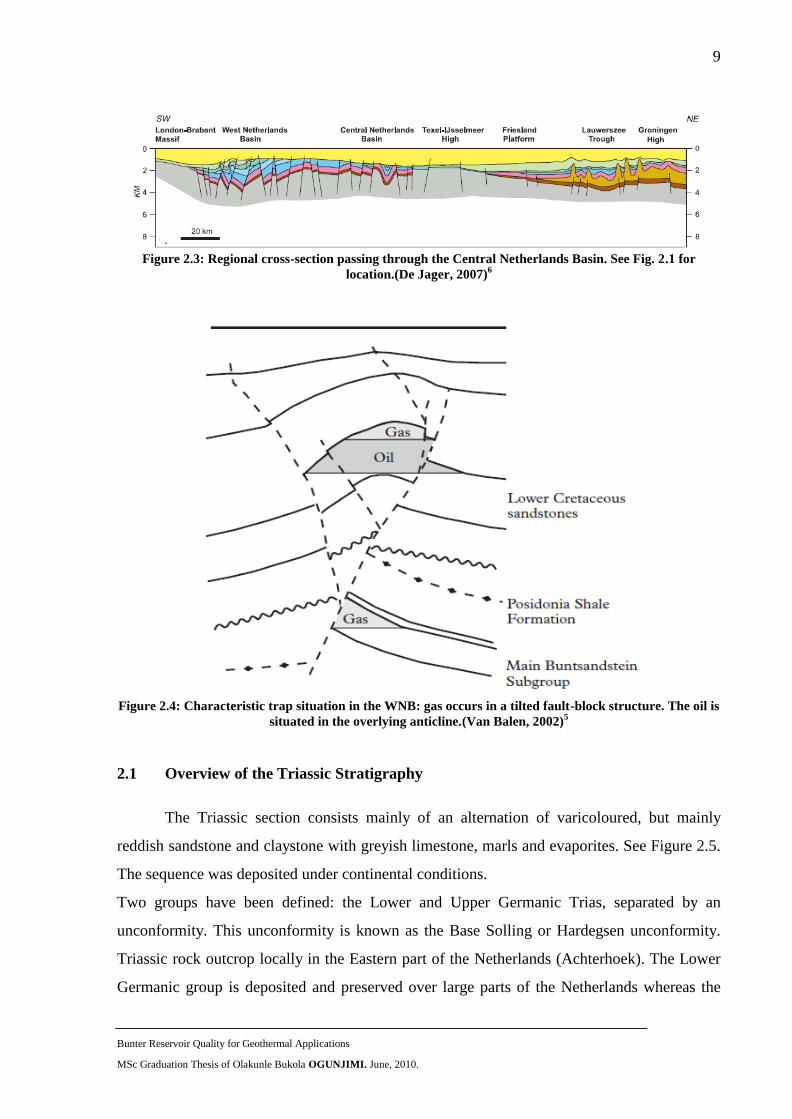
Figure 2.4: Characteristic trap situation in the WNB: gas occurs in a tilted fault-block structure. The oil is
situated in the overlying anticline.(Van Balen, 2002)5
2.1 Overview of the Triassic Stratigraphy
The Triassic section consists mainly of an alternation of varicoloured, but mainly
reddish sandstone and claystone with greyish limestone, marls and evaporites. See Figure 2.5.
The sequence was deposited under continental conditions.
Two groups have been defined: the Lower and Upper Germanic Trias, separated by an
unconformity. This unconformity is known as the Base Solling or Hardegsen unconformity.
Triassic rock outcrop locally in the Eastern part of the Netherlands (Achterhoek). The Lower
Germanic group is deposited and preserved over large parts of the Netherlands whereas the

10
Bunter Reservoir Quality for Geothermal Applications
MSc Graduation Thesis of Olakunle Bukola OGUNJIMI. June, 2010.
upper Germanic group is preserved in the Mesozoic basins. The Triassic lies conformably
over the Zechstein group (Permian) and then unconformably overlain by younger sequences of
the Altena, Nedersaksen, Rijnland and North Sea Groups. The stratigraphic framework of the
Triassic in the Netherlands is shown in Table 2.1. Best reservoirs occur in the Lower
Germanic Trias, which is described in more detail below.
Table 2.1. Stratigraphic framework of the Triassic in the Netherlands. The intervals best suited for
geothermal exploitation are marked in yellow.
2.1.1 Lower Germanic Triassic Group
The sediments of the lower Germanic Triassic Group date from the Early Triassic
(Scythien). Within this group four formations have been defined: The Lower Buntsandstein,
The Volpriehausen, the Detfurth and the Hardegsen Formation. The upper three are also
referred to the the Main Buntsandstein Group.
2.1.1.1 Lower-Buntsandstein Formation
The Lower Buntsanstein Formation consists of a cyclic alternation of fining upward
sequences, from fine grained sandstone to claystone/siltstone. This cyclicity is caused by
periodic changes in the climate. The individual cycles are between 20 and 40 m thick and
show a large geographic extent. The lower Buntsandstein is very constant in thickness and
composition and is because of its transparant character very well correlatable on seismic data.
It is underlain by the Permian carbonates/clastics. Permian evaporites do not occur over the
study area
2.1.1.2 Main Buntsandstein Subgroup
This subgroup consists of three, fining upward formations: the Volpriehausen, the
Detfurth and the Hardegsen Formations. Over the southern part of the Netherlands this
Formation Lithology Thickness m Depth Range m
Sleen Grey Shales and Brown Limestone 45 40-4450
Keuper Evaporites and Claystone >1000 850-3900
Muschelkalk Limestone and Evaporites 500 outcrop-3950
Roet Evaporites, Clay- and Siltstone 300 outcrop-4200
Solling Sand- and Claystone 125 90-4250
Hardegsen Sand- and Claystone 200 680-4350
Detfurth Sand- and Claystone 100 270-4500
Volpriehausen Sand- and Claystone 200 125-4750
Lower Buntsandstein Varicoloured Sand- and Claystone 400 80-5000
Up
pe
r
Ge
rma
nic
Tri
as
Lo
we
r
Ge
rma
nic
Tri
as

11
Bunter Reservoir Quality for Geothermal Applications
MSc Graduation Thesis of Olakunle Bukola OGUNJIMI. June, 2010.
subgroup consists of mainly sands. In contrast with the underlying Lower Buntsandstein
Formation the thicknes can vary considerably. This subgroup overlies the Lower
Buntsandstein with a sharp boundary (minor unconformity) and is unconformably overlain by
the Upper Germanic Trias Group-North Sea Super Group. This subgroup contains the best
reservoir intervals, the Volpriehausen Formation and the Detfurth Formation.
2.1.1.2.1 Volpriehausen Formation
The Volpriehausen Formation occurs widely in the Dutch subsurface. The
Volpriehausen Formation displays its greatest thickness, over 200 m, in the Dutch Central
Graben and the Broad Fourteens Basin. It reaches 100 m in the Ems Low and 150 m in the
Roer Valley Graben. The Volpriehausen Unconformity at the base of the formation locally
cuts up to several tens of meters into the Lower Buntsandstein Formation. It consists of
arkosic sandstones with a quartz content slightly below 50%. It is cemented by high
percentages of calcite and dolomite, especially in its lower part.
2.1.1.2.2 Detfurth Formation
The occurrence of the Detfurth Formation is restricted to the Early Triassic lows as a
result of uplift and erosion prior to deposition of the Solling Formation. The depositional
thickness of the formation displays considerable variation: 60–100 m in the Dutch Central
Graben, 50–80 m in the Ems Low and 20–40 m in the West Netherlands Basin, Roer Valley
Graben and Broad Fourteens Basin. In the West Netherlands Basin and Roer Valley Graben
the formation consists entirely of sandstones.
2.1.1.2.3 Hardegsen Formation
The Hardegsen Formation consists predominantly of siltstones, with subordinate, thin
sandstone beds. Significant amounts of sandstone occur only in the basin-margin area. The
present-day thickness of the formation was strongly influenced by the pre-Solling erosion and
displays strong variations. Only erosional remnants remain; e.g in Ems Low and in the Dutch
Central Graben (well F9-3) up to 200 m occur. In the Broad Fourteens Basin, the West
Netherlands Basin and the Roer Valley Graben, the thickness reaches up to 70 m. During
deposition of the formation, syn-rift subsidence occurred in the Dutch Central Graben, as is
evident from the thickening of individual sequences. In other earlier depocentres, such as the

12
Bunter Reservoir Quality for Geothermal Applications
MSc Graduation Thesis of Olakunle Bukola OGUNJIMI. June, 2010.
Broad Fourteens Basin, the West Netherlands Basin and the Roer Valley Graben, differential
subsidence had ceased.
Figure 2.5: Stratigraphy of the Triassic in the Netherlands. (Source: Stratigraphic Nomenclature of the
Netherlands) 8

13
Bunter Reservoir Quality for Geothermal Applications
MSc Graduation Thesis of Olakunle Bukola OGUNJIMI. June, 2010.
3. AVAILABLE DATA AND METHODS USED
3.1 Coordinate System
The coordinate system used is the Rijksdriehoekstelsel New (RD New), the Dutch
national projection system. Datum is the Netherlands datum. The onshore data were available
in RD while the offshore data were available in UTM (ED50). They UTM (ED50) coordinates
were transformed to RD new (Netherlands datum) for consistency. The transformation was
done in Geographix. The Bessel-ellipsoid (1841) is used and this ellipsoid is projected on
plane with the Double Stereographic projection (first to a sphere with the Gauss-projection
and then to the plane). Note: In Geographix the Netherlands (Molodensky) datum should be
used and not the Amersfoort (Bursa-Wolff) datum.
To transform the old RD system to the new RD system:
X = + 155.000 m
Y = + 463.000 m
Details of the projection systems used are presented in the Appendix under Coordinate
System.
3.2 Seismic Data
Four 3D seismic surveys were interpreted. They were all supplied by TNO in segy format.
They were supplied as different file collections and then merged in Geographix before being
loaded in Tigress Workstation for interpretation. The merged segy files were also later
exported to Jewel Suite for fault interpretation. Each individual survey has been interpreted
and the interpretation was exported and merged during the mapping. They include;
1. L3NAM1985P
2. L3NAM1991A
3. Z3NAM1990D
4. Z3AMC1989A
The seismic parameters of each of the surveys is shown in Table 3.1 and the summary of
parameters used to process each survey and a picture denoting both the SEG and Non SEG
polarities can be seen in the Appendix under Seismic Data.
Seismic data polarity follows the SEGY acquisition convention for L3NAM1985P,
L3NAM1991A, and Z3NAM1990D i.e. an increase in impedance is recorded as an increase in

14
Bunter Reservoir Quality for Geothermal Applications
MSc Graduation Thesis of Olakunle Bukola OGUNJIMI. June, 2010.
pressure for a hydrophone or an upwards movement of the Geophone and is recorded as a
negative number. This polarity has been maintained through processing and display, resulting
in a Reverse SEGY display (normal European display convention).This implies that an
increase in impedance is represented by a negative loop. The data is assumed to be (close to)
zero phase.
However, seismic display polarity follows the Normal SEGY convention for
Z3AMC1989A i.e. an increase in impedance is displayed as a positive loop (normal American
display convention). The data is also assumed to be (close to) zero phase. The shifts applied
can be seen in Table 3.1
No reprocessing has been carried out, i.e. the data is according to the original initial
processing. No processing reports were available. Quality of the data is good i.e. the seismic
resolution is clear enough to help in the interpretation of faults and distinguish important
horizons.
Table 3.1: Parameters of each of the four seismic surveys interpreted in the project.
3.3 Well Data
There were seventy-nine (79) wells in the study area (Figure 3.1 and Appendix under
Well Data). For each well a set of data (Well ID, coordinates, location, KB, status, class, total
depth, completion well logs, reports, velocity information, pressure etc), digital logs,
formation tops, deviation surveys and core data were available from the TNO website
www.nlog.nl
Out of the seventy-nine (79) wells in the study area, only thirty (30) intersected the
Triassic (Figure 3.2 and Appendix under Well Data), but not all of them had the complete
suite of logs needed for petrophysical interpretations.
Minimum Maximum Minimum Maximum Minimum Maximum
L3NAM1985P 245 980 1 567 0s 5s 189 193 No clip applied 10ms Non SEG
L3NAM1991A 700 1440 720 2125 0s 5s 189 193 Clipped at 15000 60ms Non SEG
Z3NAM1990D 1001 1989 68 1736 0s 5s 189 193 Clipped at 6000 60ms Non SEG
Z3AMC1989A 2 1406 1 1641 0s 3.5s 189 193 No clip applied 40ms SEG
INLINE XLINE
3D SEISMIC SURVEYS XLINE BYTE LOCATION
TIME
AMPLITUDES TIMESHIFT POLARITYINLINE BYTE LOCATION

15
Bunter Reservoir Quality for Geothermal Applications
MSc Graduation Thesis of Olakunle Bukola OGUNJIMI. June, 2010.
Figure 3.1: The seventy-nine (79) wells in the study area.
Figure 3.2: The thirty (30) wells that intersected the Triassic in the study area.
N
N

16
Bunter Reservoir Quality for Geothermal Applications
MSc Graduation Thesis of Olakunle Bukola OGUNJIMI. June, 2010.
4 INTERPRETATION AND RESULTS
4.1 Seismic Interpretation
The TNO provided seismic data volumes that were loaded into Tigress software for
horizon interpretation and then later Jewel Suite for fault interpretation. Four seismic surveys
were provided (See area in Figure 3.1b) and in each of the surveys, four levels were mapped.
The levels are; Base Tertiary (BT), Texel Marl (TM), Base Posidonia (BP) and Top
Triassic (TT). The L3NAM1985P, L3NAM1991A and Z3NAM1990D surveys which
covered 146.6 km2, 414.5 km
2 and 767.2 km
2 respectively, were acquired by NAM.
However, the Z3AMC1989A survey which covers an area of 544.6 km2 was initially acquired
by AMOCO and was later taken over by BP.
In this interpretation, all the wells intersecting the Triassic (including well tops) were
integrated with the seismic data to help in interpretation. The Base Tertiary, Texel Marl and
Base Posidonia were interpreted to give a view of the overall structure of the subsurface and
to serve as reference points. The target horizons, which were the Detfurth and Volpriehausen
were too deep to be visible and adequately interpretable on Seismic due to the noisy
reflections at that level (due to the low impedance contrast and because it is overlain by the
strong reflectors of the evaporites of the Upper Germanic Triassic). Therefore, the Top
Triassic was mapped from Seismic and based on the formation markers of the target horizons
in the wells that intersected the Triassic, surfaces for this levels were generated using 3D
gridding in Jewel Suite. Inline 1004 in survey L3NAM1991A shows the geometry of the
levels mapped. Here the TT is offset by normal and reverse faults that have resulted in a series
of highs and lows for this interval. The intense faulting occurs over the entire mapped area
(Figures 4.1 - 4.3) . Also, see Inline 1627 in Survey Z3NAM1990D. In the appendix under
Seismic Interpretation, a more general overview and geometry of the horizons and faults
mapped in this area can be seen. This interpretation is consistent with previous work done in
this area. The occurrence of the Detfurth Formation is restricted to the Early Triassic lows as a
result of uplift and erosion prior to deposition of the Solling Formation. The depositional
thickness of the formation displays considerable variation: 20-40 m in the West Netherlands
Basin. In the WNB the formation consists entirely of sandstones.9
Figures 4.3a – 4.3d gives a
regional view of the four levels mapped in this project. All the various intervals were merged
for all the four surveys and displayed as a single surface. The faulting system is displayed as
well in these pictures.

17
Bunter Reservoir Quality for Geothermal Applications
MSc Graduation Thesis of Olakunle Bukola OGUNJIMI. June, 2010.
Figure 4.1: Inline 1004 (L3NAM1991A). The Top Triassic (TT) is seen here in a series of highs and lows
between fault blocks just like in all the area of the project mapped. This area is between the onshore/coast
line. See Fig. 1.3b for location of survey.
Figure 4.2: Inline 1627 (Z3NAM1990D). The Top Triassic (TT) is seen here in a series of highs and lows
between fault blocks just like in all the area of the project mapped. This area is offshore. See Fig. 1.3b for
location of survey.
BTTM
BP
TT
BTTM
BP
TT
BT
TM
BP
TT
BT
TM
BP
TT

18
Bunter Reservoir Quality for Geothermal Applications
MSc Graduation Thesis of Olakunle Bukola OGUNJIMI. June, 2010.
Figure 4.3a: A regional view of the four levels mapped showing the complex faulting system in the WNB.
For Figures 4.3a-d, the polygons are faults.
Figure 4.3b: A regional view of the TM, BP and TT.
BT
TM
BP
TT
TM
BP
TT

19
Bunter Reservoir Quality for Geothermal Applications
MSc Graduation Thesis of Olakunle Bukola OGUNJIMI. June, 2010.
Figure 4.3c: A regional view of the BP and TT.
Figure 4.3d: A regional view of the TT.
BP
TT
TT

20
Bunter Reservoir Quality for Geothermal Applications
MSc Graduation Thesis of Olakunle Bukola OGUNJIMI. June, 2010.
4.2 Mapping in Time
Based on the seismic interpretation, a time structural map of the four levels mapped
were generated and they are shown in Figures 4.4a – 4.4d
N
Figure 4.4a: Base Tertiary time structural map.
N
Figure 4.4b: Texel Marl time structural map.

21
Bunter Reservoir Quality for Geothermal Applications
MSc Graduation Thesis of Olakunle Bukola OGUNJIMI. June, 2010.
Figure 4.4c: Base Posidonia time structural map.
Figure 4.4d: Top Triassic time structural map.
N
N

22
Bunter Reservoir Quality for Geothermal Applications
MSc Graduation Thesis of Olakunle Bukola OGUNJIMI. June, 2010.
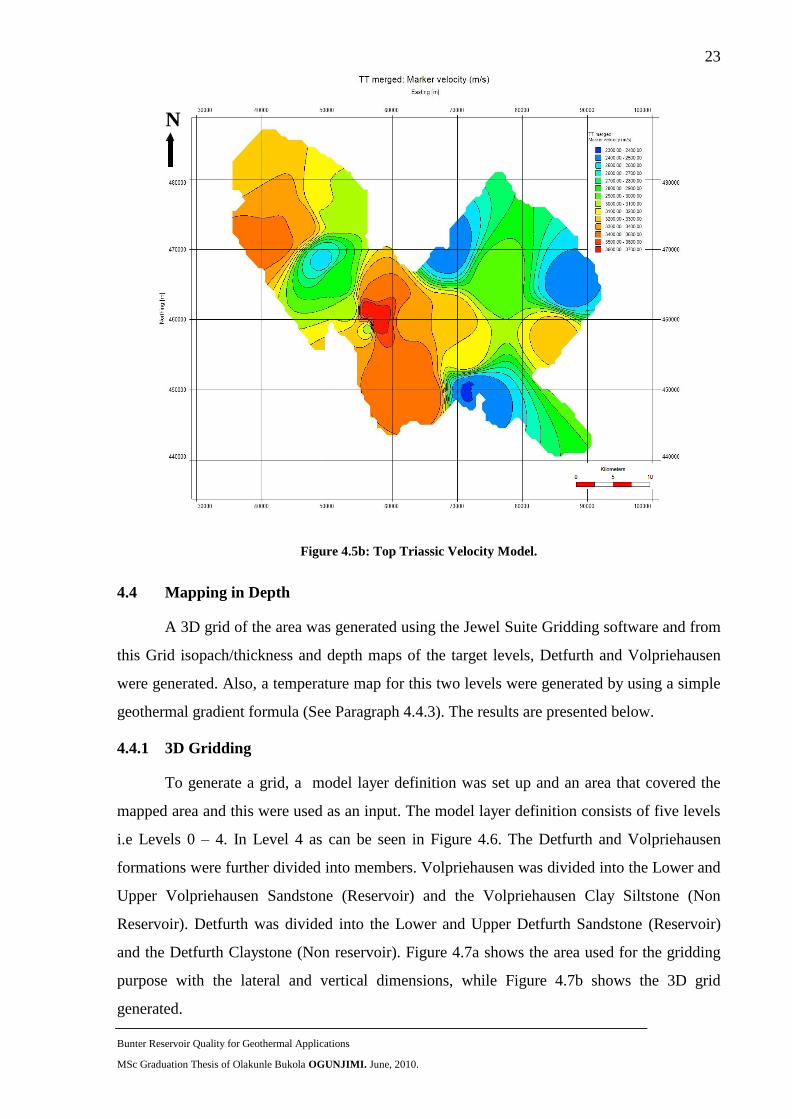
4.3 Velocity Model
In order to convert the faults and horizons mapped in time to depth, a velocity model
was generated based on “Vint from marker depth and horizon time”. The marker depths were
obtained from well tops supplied by TNO and the horizon time generated from the seismic
interpreted horizons. For the interpolation type, a “distance weighted” approach was used with
an interpolator option of power 5 and an underburden velocity of 4000 m/s. Two velocity
models were generated for both the Base Tertiary and Top Triassic for the domain conversion.
The Base Tertiary model looks fine, but the Top Triassic model shows some rather dramatic
changes from 2500 to over 3000 m/s. The higher velocities in general are seen over the deeper
parts and the lower velocities over the shallow fault blocks. In order to solve this problem,
some dummy wells next to the bull‟s eyes were introduced which resulted in a velocity field in
line with the horst and graben pattern.. Figures 4.5a – 4.5b shows the two models used.
Figure 4.5a: Base Tertiary Velocity Model.
N
23
Bunter Reservoir Quality for Geothermal Applications
MSc Graduation Thesis of Olakunle Bukola OGUNJIMI. June, 2010.
Figure 4.5b: Top Triassic Velocity Model.
4.4 Mapping in Depth
A 3D grid of the area was generated using the Jewel Suite Gridding software and from
this Grid isopach/thickness and depth maps of the target levels, Detfurth and Volpriehausen
were generated. Also, a temperature map for this two levels were generated by using a simple
geothermal gradient formula (See Paragraph 4.4.3). The results are presented below.
4.4.1 3D Gridding
To generate a grid, a model layer definition was set up and an area that covered the
mapped area and this were used as an input. The model layer definition consists of five levels
i.e Levels 0 – 4. In Level 4 as can be seen in Figure 4.6. The Detfurth and Volpriehausen
formations were further divided into members. Volpriehausen was divided into the Lower and
Upper Volpriehausen Sandstone (Reservoir) and the Volpriehausen Clay Siltstone (Non
Reservoir). Detfurth was divided into the Lower and Upper Detfurth Sandstone (Reservoir)
and the Detfurth Claystone (Non reservoir). Figure 4.7a shows the area used for the gridding
purpose with the lateral and vertical dimensions, while Figure 4.7b shows the 3D grid
generated.
N

24
Bunter Reservoir Quality for Geothermal Applications
MSc Graduation Thesis of Olakunle Bukola OGUNJIMI. June, 2010.
Figure 4.6: Model Layer Definition.
Figure 4.7a: Area used for gridding with lateral and vertical dimensions.

25
Bunter Reservoir Quality for Geothermal Applications
MSc Graduation Thesis of Olakunle Bukola OGUNJIMI. June, 2010.
Figure 4.7b: 3D Grid of the modelled area.
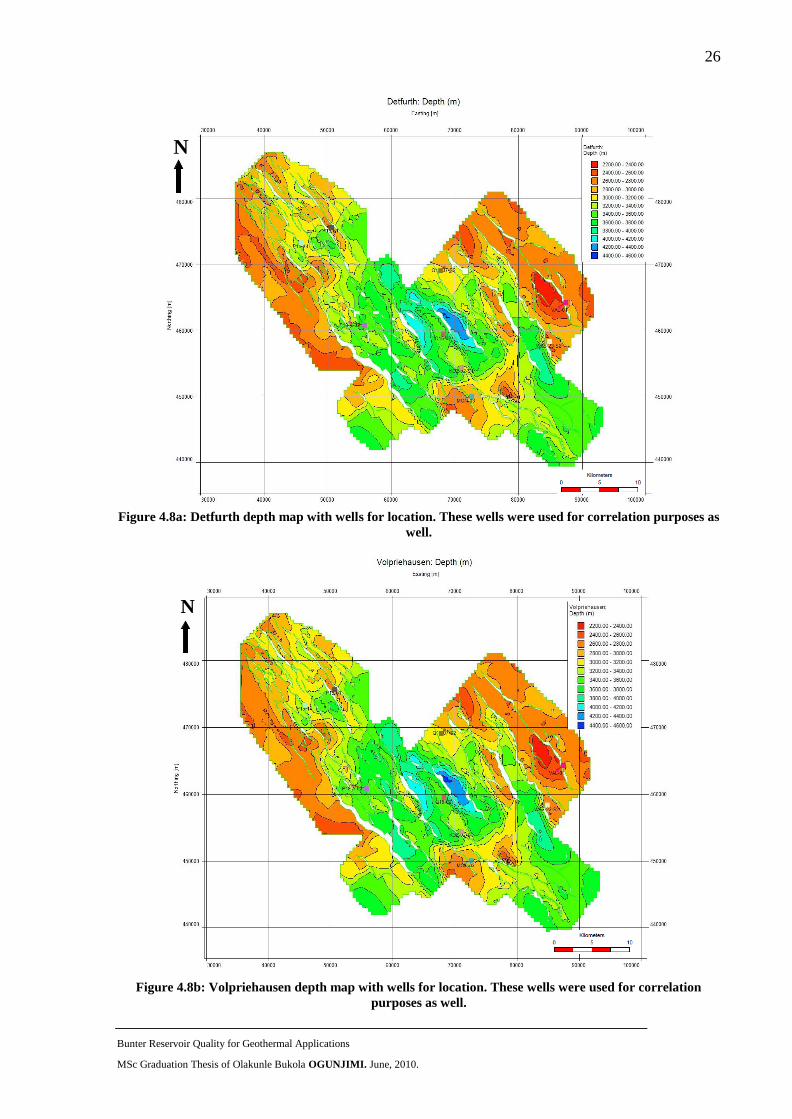
4.4.2 Depth and Thickness Maps of the Detfurth and Volpriehausen
Based on the 3D grid generated, depth and thickness map of the Detfurth and
Volpriehausen Formations were plotted. The map of these levels were arrived at as a result of
the markers that was input into the model layer definition in the Jewel Suite Gridding process.
The gridder interpolated (using triangulated interpolation, see Appendix on 3D Gridding)
between this various marker points in the wells and created a surface out of them. Figures 4.8a
– 4.8b shows the Detfurth and Volpriehausen depth maps respectively, while Figure 4.8c
shows the thickness map of Top Detfurth to Base Volpriehausen. The region close to and
around Well Q16-02 and especially at the middle of the mapped area shows depths that are
greater than 3,000m. This are the kind of reservoir depths required to have formation waters in
excess of 1000C. A general regional trend shows that this reservoir level of interest increases
in thickness towards the offshore realm. This and the reservoir thickness and quality will be
discussed in more detail later in this report.
26
Bunter Reservoir Quality for Geothermal Applications
MSc Graduation Thesis of Olakunle Bukola OGUNJIMI. June, 2010.
Figure 4.8a: Detfurth depth map with wells for location. These wells were used for correlation purposes as
well.
Figure 4.8b: Volpriehausen depth map with wells for location. These wells were used for correlation
purposes as well.
N
N

27
Bunter Reservoir Quality for Geothermal Applications
MSc Graduation Thesis of Olakunle Bukola OGUNJIMI. June, 2010.
Figure 4.8c: Top Detfurth to Base Volpriehausen thickness map with wells for location. The overall trend
shows that the reservoir thickens as you go towards the offshore realm.
4.4.3 Geothermal Gradient/Temperature Maps
Also as an input to the static model, the temperature in the WNB is estimated. Because
this is a regional interpretation, the normal geothermal gradient of 310C/km is used. However,
the average geothermal gradient in the Netherlands is ca. 3 to 40C/100 m down to 2000 m
depth.3
The property calculator is used in Jewel Suite. A new property is created for each depth
surface with an expression:
10+0.031*h i.e. 10+0.031*$Depth$
See appendix on Geothermal Gradient for property calculator.
Updating the property in Jewel Property calculator then generates a temperature map. Figures
4.9a – 4.9b shows the Detfurth and Volpriehausen temperature maps respectively. From these
maps it can be seen that a larger area shows great interest especially at the area in and around
the Q16-02 Well. The temperature estimate at the middle block in the central part of the
survey area and close to the Q16-02 Well is expected to exceed 1400C. This is well above the
required temperature to generate electricity.
N

28
Bunter Reservoir Quality for Geothermal Applications
MSc Graduation Thesis of Olakunle Bukola OGUNJIMI. June, 2010.
Figure 4.9a: Detfurth Temperature map with wells for location. The centre of the mapped area shows very
good prospects.
Figure 4.9b: Volpriehausen Temperature map with wells for location. The centre of the mapped area
shows very good prospects.
N
N

29
Bunter Reservoir Quality for Geothermal Applications
MSc Graduation Thesis of Olakunle Bukola OGUNJIMI. June, 2010.
4.5 Petrophysical Interpretation of reservoir levels
About 30 wells intersected the Triassic (Detfurth and Volpriehausen Formations which
are the target levels) in the study area. Only nine wells had sufficient data for correlation and
petrophysical interpretation purposes because they were the only wells that have core data
(porosity and permeability), GR log, NPHI log, and RHOB log. These wells are evenly spread
over the project area and therefore serve as a good representation of the conditions in the
entire area (Figure 4.10). For the petrophysical interpretation, there was a focus on the interval
of interest which is the Top Detfurth to the Base Volpriehausen for each of the Wells and
calculated the reservoir thickness in each (Table 4.1).
Figure 4.10: Wells used for Correlation and Petrophysical Interpretation.
Table 4.1: Gross reservoir thickness for each Well.
Well Top Detfurth (m) Base Volpriehausen (m) Gross Thickness (m)
MON-03 2966 3097 131
P18-A-02 4165 4309 144
P15-01 2725 2884 159
P15-14 3186 3349 163
KDZ-02-S1 3285 3408 123
Q16-02 3530 3649 119
WAS-23-S2 2662 2788 126
VAL-01 2826 2921 95
Q13-07-S2 3157 3300 143
N

30
Bunter Reservoir Quality for Geothermal Applications
MSc Graduation Thesis of Olakunle Bukola OGUNJIMI. June, 2010.
The Volume of clay, Vcl was calculated in Tigress software using Equation (i), while
the Porosity, PHI, was calculated using the Density method from the PHOB log using
Equation (ii). The Permeability was calculated by making a cross plot of Porosity Vs
Permeability and fitting an exponential trend line as seen in the graph in Figure 4.11a. The
trend line equation generated is:
y = 0.0025e59.279x
Where y is permeability (k) and x is porosity ()
The equation is therefore re-written as k = 0.0025e59.279
This equation was also used to generate values of 0.1mD, 1mD and 10mD permeability cut-
offs. These are plotted in a track on the correlation panels and will be used in describing N/G
later.
.........................................................Equation (i)
......................Equation (ii)
Figure 4.11a: Graph of Poro-Perm of Wells of interest.
minmax
minlog
GRGR
GRGRVClay
mfma
clma
clay
mfma
ma
density V
log

31
Bunter Reservoir Quality for Geothermal Applications
MSc Graduation Thesis of Olakunle Bukola OGUNJIMI. June, 2010.
In order to be able to correlate the reservoir and also investigate the Vcl, PHI and K
values in the level of interest, some correlation panels are shown below (Figure 4.12 - 4.16).
An explanation and description of reservoir geometry and quality is given at the base of each
of the correlation panels. More on reservoir quality is presented in a later chapter. For each of
the panels, the Solling Formation was chosen as the datum. The line of correlation is shown as
the inset map below each correlation panel.
To look at a different scenario to arriving at N/G values, an alternative to the above
graph is considered. One which gives more weight to the good values. The problem here is
that many point occur in the low porosity/permeability range. Poor porosities give poor
permeability measurements, not only low values but also low confidence values, whereas the
higher porosities give better higher confidence permeability values. Therefore, a higher
confidence will be given to the higher porosity points, by eyeballing a relationship which
gives more credit to the higher porosity. The resulting graph is seen in Figure 4.11b. The new
equation is thus:
y = 0.0002e102.78x
Values of 0.1, 1, 10 and 100mD permeability cut-offs were generated. While the
values for 0.1mD cut-off remained the same for the two scenarios, there was a marked
difference in the others. More on this in the N/G section.
Figure 4.11b: Graph of Poro-Perm of Wells of interest giving more weight to the good values.

Figure 4.12: Correlation Panel 1.
The level of interest is from the top Detfurth to the base Volpriehausen. Here the top of the shaly Rogenstein Formation is chosen as the base of the Volpriehausen.
The Triassic is believed to have been deposited in a quiet environment, hence, the thickness does not vary too much throughout the areas correlated. i.e. there is no
sudden change in thickness. A general trend however noticed is that the reservoir thickens as you move from onshore to the offshore parts. See Figures 4.8c,
4.14 and 4.15. As can be seen from the PHI and K plots, the porosity are not that good, but the levels that are porous seem to have an excellent permeability.
This is very crucial for water production. Another good thing that will enhance connectivity here is the faulting pattern. Therefore, even if there are lower
porosities, the high level of faulting will enhance connectivity and hence good water production. MON-03 and Q16-02 have higher porosities and good permeable
levels compared to KDZ-02-S1 and Q13-07-S2 in this correlation panel. Therefore, in the region especially around Q13-07-S2, it is believed that the reservoir
quality will not be very good. This is also visible from the Vcl which is relatively high throughout the objective interval.
SSE N

33
Bunter Reservoir Quality for Geothermal Applications
MSc Graduation Thesis of Olakunle Bukola OGUNJIMI. June, 2010.
Figure 4.13: Correlation Panel 2. This correlation panel also illustrates the fact that as you go offshore, the reservoir level
thickens. The P18-A-02 is in a region were the reservoir is dipping downwards as a result of faulting. One trend that is also
noticed throughout the area correlated is that, the upper portion of the reservoir shows good porosity and permeability values.
Hence, the Detfurth is believed will have a better connectivity and higher water production values and be of better reservoir
quality than the Volpriehausen. The region that falls within and around Wells MON-03, P18-A-02, P15-01 and P15-14, which
is roughly SE of the mapped area, also appear to have better quality when compared to the other parts. More on this will be
explained in the chapter of reservoir quality below.
SE NW

34
Bunter Reservoir Quality for Geothermal Applications
MSc Graduation Thesis of Olakunle Bukola OGUNJIMI. June, 2010.
Figure 4.14: Correlation Panel 3. This correlation panel also illustrates the fact that as , the reservoir interval thickens.
ESE NW

35
Bunter Reservoir Quality for Geothermal Applications
MSc Graduation Thesis of Olakunle Bukola OGUNJIMI. June, 2010.
Figure 4.15: Correlation Panel 4. This correlation panel also illustrates the fact that as you go offshore, the reservoir level thickens.
The reservoir in Well P15-01 is exceptionally good here (good porosity and permeability values, especially in the upper part of the reservoir)
when compared to the other wells.
ESE NW

36
Bunter Reservoir Quality for Geothermal Applications
MSc Graduation Thesis of Olakunle Bukola OGUNJIMI. June, 2010.
Figure 4.16: Correlation Panel 5. This is a regional correlation of the mapped area and once again it can be seen that as you go offshore, the reservoir
thickens and as you get back towards the coast it thins again. The individual levels show no sudden change in thickness and almost appear sheet like in
geometry. Generally, it is believed that, as also seen here, that the Triassic deposits are sheet-like/sheet-sands. This is the reason why the using of an
object-based modelling approach may be difficult in modelling them.

4.6 Mapping of Reservoir Quality
Based on the correlation panels, the thickness map and the petrophysical interpretation of
the reservoir levels, the reservoir quality of the Bunter sandstone in the Zuid Holland area will
be mapped.
4.6.1 Thickness
The gross and net thickness of the reservoir in each of the well intervals studied using
the standard from Figure 4.11a is calculated and shown in the Table 4.2a. Also see Figure
4.8c. The net thickness were calculated based on the 0.1mD, 1mD and 10mD cut-off values of
the N/G. This shows an optimistic to pessimistic case. Generally, the level contains enough
thick sequences to be able to contain large quantities of water needed for daily production.
Table 4.2a: Gross and Net Thickness of the reservoir intervals in the Wells.
Also, based on the second scenario where more weight is given to the good values (Figure
4.11b), the gross and net thicknesses were calculated (Table 4.2b). The 0.1mD cut-off values
remained the same for the two scenarios. The 1 and 10mD cut-off‟s showed an increase in
N/G for each Well. A last cut-off of 100mD for the second scenario also showed that some
wells still had fairly good N/G values. There is also a permeability increase in Scenario 2
which is good for connectivity and more water production. See Correlation Panel 6 (Figure
4.17). Check the appendix on Petrophysical interpretation of reservoir levels for all the other
correlation panels for a comparison between old and new N/G and K values.
Table 4.2b: Gross and Net Thickness of the reservoir intervals in the Wells based on the second scenario.
0.1mD cut-off 1mD cut-off 10mD cut-off
Well Top Detfurth (m) Base Volpriehausen (m) Gross Thickness (m) Net Thickness (m) Net thickness (m) Net thickness (m)
MON-03 2966 3097 131 40.35 9.30 1.05
P18-A-02 4165 4309 144 20.74 4.75 0.14
P15-01 2725 2884 159 58.04 25.28 0.16
P15-14 3186 3349 163 14.67 1.30
KDZ-02-S1 3285 3408 123 8.36
Q16-02 3530 3649 119 26.42
WAS-23-S2 2662 2788 126 3.78
VAL-01 2826 2921 95 4.75
Q13-07-S2 3157 3300 143 3.15
1mD cut-off 10mD cut-off 100mD cut-off
Well Top Detfurth (m) Base Volpriehausen (m) Gross Thickness (m) Net Thickness (m) Net thickness (m) Net thickness (m)
MON-03 2966 3097 131 19.91 7.34 1.97
P18-A-02 4165 4309 144 13.10 4.03 1.87
P15-01 2725 2884 159 38.16 18.92 10.02
P15-14 3186 3349 163 5.22 0.98
KDZ-02-S1 3285 3408 123 1.23
Q16-02 3530 3649 119 1.67
WAS-23-S2 2662 2788 126
VAL-01 2826 2921 95
Q13-07-S2 3157 3300 143

Figure 4.17: Correlation Panel 6. This panel shows the comparison between the base case and the second scenario which gives more weight to the good
values. The second scenario includes K*, 1mD*, 10mD* and 100mD*. Comparing this with K, 1mD and 10mD of the base case immediately shows that there is
an increase in N/G and K values. This therefore shows that given more weight to the higher porosity and permeability values leads to a more optimistic view.
See the appendix on Petrophysical Interpretation of Reservoir Levels for all the other correlation panels for a comparison between old and new N/G and K
values.
SE NW

4.6.2 Net/Gross
See the correlation panel tracks on 0.1mD, 1mD, and 10mD cut-offs to see the actual
reservoir level where there is the net reservoir. It should however be noted that the Wells
MON-03, P18-A-02, P15-01, and P15-14 show the best reservoir intervals based on the Av
Porosity and N/G values as can be seen in Table 4.3a. Therefore, the zone in and around these
wells in the mapped area is believed will have the best reservoir quality. Correlation Panel 2
shows a correlation between MON-02, P18-A-02 and P15-14. There the general trend is that
the level of interest thickens towards the offshore realm. Table 4.3b shows the results for the
second scenario where more weight is given to higher porosity and permeability values.
Table 4.3a: N/G, Average Porosity, and Average Volume of Clay calculated in the reservoir intervals in
the Wells.
Table 4.3b: N/G, Average Porosity, and Average Volume of Clay calculated in the reservoir intervals in
the Wells based on the second scenario which gives more weight to the good values. NB 0.1mD cut-off is
not repeated because they are the same values for the two scenarios.
Av VCl Av Por N/G Av VCl Av Por N/G Av VCl Av Por N/G
MON-03 10.80% 8.60% 30.80% 9.70% 12.20% 7.10% 0% 16.20% 0.80%
P18-A-02 7.80% 9.00% 14.40% 2.60% 12.40% 3.30% 0.80% 15.10% 0.10%
P15-01 15.40% 9.80% 36.50% 8.60% 12.60% 15.90% 2.90% 15.00% 0.10%
P15-14 9.50% 7.90% 9.00% 2.10% 11.40% 0.80%
KDZ-02-S1 7.50% 7.10% 6.80%
Q16-02 5.50% 6.90% 22.20%
WAS-23-S2 6.80% 6.60% 3.00%
VAL-01 0.50% 6.70% 5.00%
Q13-07-S2 9.50% 6.50% 2.20%
0.1mD cutt-off 1mD cut-off 10mD cut-offWell
Av VCl Av Por N/G Av VCl Av Por N/G Av VCl Av Por N/G
MON-03 10.80% 10.50% 15.20% 10.20% 12.60% 5.60% 10.70% 14.90% 1.50%
P18-A-02 6.60% 10.20% 9.10% 2.30% 12.80% 2.80% 1.20% 13.70% 1.30%
P15-01 11.90% 11.40% 24.00% 7.10% 13.30% 11.90% 3.50% 14.50% 6.30%
P15-14 3.80% 9.50% 3.20% 1.50% 11.90% 0.60%
KDZ-02-S1 4.70% 8.50% 1.00%
Q16-02 2.80% 8.20% 1.40%
WAS-23-S2
VAL-01
Q13-07-S2
Well1mD cutt-off 10mD cut-off 100mD cut-off

40
Bunter Reservoir Quality for Geothermal Applications
MSc Graduation Thesis of Olakunle Bukola OGUNJIMI. June, 2010.
4.6.3 Porosity
Primary porosity and permeability are generally low in the mapped area, but it is
expected that permeability and connectivity are enhanced locally through fracturing. The
objective level is highly faulted, and hence this will serve as conduit for water and hence a
higher level of connectivity and more water production. Heterogeneity remains an issue of
concern due to the high level of Vcl in some of the intervals. But it is believed that they will
generally not serve as barrier or baffle to flow, i.e. it will reduce the vertical permeability but
not the more important horizontal permeability
Tables 4.3a and 4.3b shows the average porosity on each level for the two scenarios and this
can also be seen in the PHI track on the correlation panels. Generally, porosity is higher at the
upper part of the reservoir interval. This indicates that the Detfurth will generally have a better
reservoir quality than the Volpriehausen.
4.7 Compilation of Core Data
TNO provided core data which included porosity, permeability and grain density. The
porosity were plotted against permeability and the trends are shown below. Note that only
very few Wells in the study area have core data that reached the Triassic. For this Por-Perm
trend maps, core data from Wells Q13-04, Q13-07-S2, Q16-02, Q16-08, and VAL-01 were
used.
4.7.1 Porosity and Permeability trends and relationships
The Por-Perm trend maps of the Detfurth and Volpriehausen are shown in Figures 4.18
and 4.19. Well Q16-08 has the best values for Detfurth while Well Q16-08 has the best values
for the Volpriehausen. However, there is hardly any relationship in a plot of porosity against
depth (Figure 4.23).

41
Bunter Reservoir Quality for Geothermal Applications
MSc Graduation Thesis of Olakunle Bukola OGUNJIMI. June, 2010.
Figure 4.18: Por-Perm Detfurth for Wells Q16-08 and VAL-01.
Figure 4.19: Por-Perm Volpriehausen for Wells Q13-04, Q13-07-S2, Q16-02, Q16-08 and VAL-01.
Poro-Perm Triassic Detfurth
0.0100
0.1000
1.0000
10.0000
100.0000
1000.0000
0.0000 0.0200 0.0400 0.0600 0.0800 0.1000 0.1200 0.1400 0.1600
Porosity
Perm
eab
ilit
y
Q16-08 Upper DetfurthSandstone
Q16-08 Lower DetfurthSandstone
VAL-01 DetfurthClaystone Member
VAL-01 Lower DetfurthSandstone Member
Well MD (m)
Q16-08 3877-3913
VAL-01 2826-2855
Poro-Perm Triassic Volpriehausen
0.01
0.1
1
10
100
0.0000 0.0200 0.0400 0.0600 0.0800 0.1000 0.1200
Porosity
Perm
eab
ilit
y
Q13-04 Volpriehausen Clay-Siltstone Member (No K Values)
Q13-07-S2 VolpriehausenClaystone
Q16-02 VolpriehausenClaystone
Q16-02 Lower VolpriehausenSandstone
Q13-04 Volpriehausen Clay-Siltstone Member (No K Values)
Q16-08 Upper VolpriehausenSandstone
VAL-01 Volpriehausen Clay-Siltstone Member
VAL-01 Lower VolpriehausenSandstone Member
Well MD (m)
Q13-04 2785-2800
Q13-07-S2 3170-3188
Q16-02 3570-3635
Q16-08 3930-3947
VAL-01 2855-2881

42
Bunter Reservoir Quality for Geothermal Applications
MSc Graduation Thesis of Olakunle Bukola OGUNJIMI. June, 2010.
4.7.2 Environment of Deposition
The Triassic formation was deposited in a semi-arid continental basin. Sediments
reached the P and Q quadrants (which forms a larger part of the studied area in this project) in
braided stream complexes from a hinterland to the southeast. The braided stream complexes
were flanked by Aeolian, interdune, flood-plain and crevasse-splay environments and
terminated in playa lakes.11
In central parts of the basin, redeposition of fluvial sands into dune fields occurred on
a wide scale during dry periods. During low clastic influx, the playa lake expanded again
towards the margin of the basin. The repetition of this processes caused the cyclic alternation
in the Main Buntsandstein subgroup. The larger cycles, represented, for example, by the
Volpriehausen and Detfurth formations, are tectonically driven. The depositional model for
the Lower Buntsandstein and Volpriehausen formations in the southern Netherlands is shown
in Figure 4.20. The yellowish colour indicates predominantly sandstones, while the greenish
colour predominantly siltstones.9
Figure 4.20: Depositional model for the Lower Buntsandstein and Volpriehausen formations in the
southern Netherlands. (Geluk, 2007)9
The Detfurth and Volpriehausen formations in the mapped area suggests that Aeolian
and fluvial facies occupy more than 50% of the rock unit, while the interdune, flood plain,
crevasse splay and playa lake facies occupy the remaining of the rock unit. Aeolian sandstones
are known for their excellent reservoir qualities. They are well sorted with good porosity and
permeability. This means that a larger part of the rock unit within the mapped area is of good
reservoir quality. The percentage of other facies present is believed will not serve as an
obstruction to flow.
Study area

43
Bunter Reservoir Quality for Geothermal Applications
MSc Graduation Thesis of Olakunle Bukola OGUNJIMI. June, 2010.
4.8 Areas Suitable for Geothermal Exploitation
Based on the interpretation and an estimate of temperature, a large part of the mapped
area looks promising and is up to depths of more than 3,000m which is believed will contain
water that is above 1000C needed to produce electricity. The area right around the coast and
the region of the P and Q quadrants looks exceptionally suitable as can be seen from the
temperature estimates in the temperature maps in Figures 4.21 and 4.22. The reservoir quality
here is good as well based on the fact that most of the area within the polygon also falls within
the part of the WNB where it is believed the Detfurth and Volpriehausen Formations have
Aeolian facies that occupy more than 50% of the rock unit.
Figure 4.21: Area suitable for geothermal exploitation in the Detfurth is highlighted in the red polygon
based on expected water temperatures.
N

44
Bunter Reservoir Quality for Geothermal Applications
MSc Graduation Thesis of Olakunle Bukola OGUNJIMI. June, 2010.
Figure 4.22: Area suitable for geothermal exploitation in the Volpriehausen is highlighted in the red
polygon based on expected water temperatures.
4.9 Risks and possible means to reduce risks
As with any new development effort, there are risks and drawbacks associated with it.
A few drawbacks can be foreseen in the Dutch situation. The aquifers, suitable for geothermal
exploitation are the same as the oil and gas-bearing reservoirs, implying considerable overlap.
A deep-seated geothermal project positioned close to a producing oil or gas field or a gas or
CO2 storage facility, therefore may cause subsurface interference. The extraction of
geothermal energy may affect the pressure distribution in or around the oil or gas field or the
storage facility. A recent simulation study (Brouwer et al., 2005) concerning the effects of
overpressure and temperature changes in the Lower Cretaceous IJsselmonde Sandstone
Member, however, shows that, if re-injection of water takes place under overpressure
conditions, the pressure changes in the direct vicinity of the wells due to the extraction of
geothermal energy are limited, i.e. no more than 1 bar at a distance of 1 km. The simulation
also shows that thermo-elastic effects may occur as well, depending on the temperature of the
injected water.13
N

45
Bunter Reservoir Quality for Geothermal Applications
MSc Graduation Thesis of Olakunle Bukola OGUNJIMI. June, 2010.
These may amount to 50 bar if the formation is cooled by more than 500C, which
would locally cause a compaction of 2 to 3 cm at reservoir level (ca. 1100 m); the effects at
surface would be negligible. Such investigations are important in the Netherlands, where
public concern about soil subsidence and seismicity due to gas production plays an important
role in discussions on the use of the underground.3
Another important risk is that the prospective lows have very little well penetration
and are usually considerably deeper than the much shallower oil fields. It is however
suspected that structuration and formation of highs and lows is relatively late and that
diagenesis predates structuration. This would imply that the shallow oil fields have porosities
representative of much greater depths. This is borne out by the fact that there is hardly any
relationship of porosity against depth (Figure 4.23).
Figure 4.23: Depth Vs Porosity for Wells that intersected the Triassic. The porosities are both core and log
derived as illustrated in the legend. They all fit properly apart from VAL-01 log derived porosity which
has some lower values as a result of an high Vcl at the beginning of the reservoir interval in this particular
well. Note that only Wells Q16-02, Q16-08 and VAL-01 had core porosities, all the other well porosities
were derived from logs.

46
Bunter Reservoir Quality for Geothermal Applications
MSc Graduation Thesis of Olakunle Bukola OGUNJIMI. June, 2010.
4.10 Volumetrics Reporting
To determine the volume of water in place in these reservoirs; the N/G, porosity,
reservoir volume and water saturation were all multiplied together using Volumetrics
Reporting in Jewel Suite. To come up with different saturation scenarios, water saturations in
the reservoir were varied at 100%, 80% and 60%. The N/G derived from the 0.1mD cut-off
was used. The volumes of water in place in the reservoirs are presented as volumetric reports
in Tables 4.4a-4.4c. This shows that there is enough water in the reservoir to support daily
water production that is needed for a project like this. Note that in all the tables below, GRV
is Gross Rock Volume, NRV is Net Rock Volume, NPV is Net Pore Volume, and NWPV is
Net Water Pore Volume.
Figure 4.4a: Volumetrics Report using Sw of 100%.
Figure 4.4b: Volumetrics Report using Sw of 80%.
Figure 4.4c: Volumetrics Report using Sw of 60%.
GRV NRV NPV NWPV
m3 m3 m3 m3
Detfurth 4.69E+10 1.07E+10 4.97E+08 4.97E+08
Volpriehausen 1.55E+11 1.90E+10 5.05E+08 5.05E+08
TOTAL 2.02E+11 2.98E+10 1.00E+09 1.00E+09
GRV NRV NPV NWPV
m3 m3 m3 m3
Detfurth 4.69E+10 1.07E+10 4.97E+08 3.98E+08
Volpriehausen 1.55E+11 1.90E+10 5.05E+08 4.04E+08
TOTAL 2.02E+11 2.98E+10 1.00E+09 8.02E+08
GRV NRV NPV NWPV
m3 m3 m3 m3
Detfurth 4.69E+10 1.07E+10 4.97E+08 2.98E+08
Volpriehausen 1.55E+11 1.90E+10 5.05E+08 3.03E+08
TOTAL 2.02E+11 2.98E+10 1.00E+09 6.01E+08

47
Bunter Reservoir Quality for Geothermal Applications
MSc Graduation Thesis of Olakunle Bukola OGUNJIMI. June, 2010.
5.0 CONCLUSIONS AND RECOMMENDATIONS
From regional geology and the study carried out in this project, the Detfurth and
Volpriehausen formations are established to be potentially good reservoirs for
geothermal development.
The target horizons, which were the Detfurth and Volpriehausen were too deep to be
visible and adequately interpretable on Seismic due to the noisy reflections at that level
(due to the low impedance contrast and because it is overlain by the strong reflectors
of the evaporites of the Upper Germanic Triassic). Therefore, the Top Triassic was
mapped from Seismic and based on the formation markers of the target horizons in the
wells that intersected the Triassic, surfaces for this levels were generated using 3D
gridding in Jewel Suite.
The net thickness were calculated based on the 0.1mD, 1mD and 10mD cut-off values
of the N/G. This shows an optimistic to pessimistic case. Generally, the level contains
enough thick sequences to be able to contain large quantities of water needed for daily
production.
Wells MON-03, P18-A-02, P15-01, and P15-14 show the best reservoir intervals
based on the Av Porosity and N/G values. Therefore, the zone in and around these
wells in the mapped area is believed will have the best reservoir quality.
Primary porosity and permeability are generally low in the mapped area, but it is
expected that permeability and connectivity are enhanced locally through fracturing.
The objective level is highly faulted, and hence this will serve as conduit for water
and hence a higher level of connectivity and more water production. Heterogeneity
remains an issue of concern due to the high level of Vcl in some of the intervals. But it
is believed that they will generally not serve as barrier or baffle to flow, i.e. it will
reduce the vertical permeability but not the more important horizontal permeability.
The Detfurth and Volpriehausen formations in the mapped area suggests that Aeolian
and fluvial facies occupy more than 50% of the rock unit, while the interdune, flood
plain, crevasse splay and playa lake facies occupy the remaining of the rock unit.
Aeolian sandstones are known for their excellent reservoir qualities. They are well
sorted with good porosity and permeability. This means that a larger part of the rock
unit within the mapped area is of good reservoir quality.

48
Bunter Reservoir Quality for Geothermal Applications
MSc Graduation Thesis of Olakunle Bukola OGUNJIMI. June, 2010.
Based on the interpretation and an estimate of temperature, a large part of the mapped
area looks promising and is up to depths of more than 3,000m which is believed will
contain water that is above 1000C needed to produce electricity.
The aquifers, suitable for geothermal exploitation here in the Netherlands, are the same
as the oil and gas-bearing reservoirs, implying considerable overlap. A deep-seated
geothermal project positioned close to a producing oil or gas field or a gas or CO2
storage facility, therefore may cause subsurface interference.
As with any new development effort, there are risks and drawbacks associated with it.
The extraction of geothermal energy may affect the pressure distribution in or around
the oil or gas field or the storage facility.
Improvements that can be done to verify some assumptions and also reduce
uncertainties include the provision of cores and FMI/FMS. With these, the modelling
of heterogeneities can be done thereby helping in the understanding of the reservoir
architecture. FMI/FMS will show grain size trends, changes in facies as well as
dipping angle of the layers. This will tell the kind of sedimentary structures that were
formed when the sandstone bodies were deposited.
Renewed interest in geothermal energy, driven by concerns about the sustainability of
the environment and the security of energy supply, shows that with the knowledge from the oil
and gas industry geothermal development can be enhanced. Seismic combined with well data
acquired originally for oil and gas purposes is again becoming of great use for geothermal
projects in the Netherlands.
Another problem is the focus of the oil and gas industry on the structural highs. This is
where the oil and gas is found since it migrates to the surface until it is trapped. For
geothermal purposes the structural lows are the most interesting: this is where the highest
temperatures are found. Therefore to be able to predict the fluid behaviour in the structural
low the reservoir properties are extrapolated from the structural highs. When this proves to be
accurate it would have a very positive effect on the development of geothermal energy, since
this reduces the uncertainties involved with such a project.14
As the governments the world over explore the use of renewables due to a dramatic
increase in gas and oil prices and the need to stay green and avoid worsening climate change,
it is sure that geothermal energy will be a key source of energy to contribute to a future
sustainable society.

49
Bunter Reservoir Quality for Geothermal Applications
MSc Graduation Thesis of Olakunle Bukola OGUNJIMI. June, 2010.
References:
1 Christine McGourty, Science correspondent, BBC News in Global crises „to strike by 2030‟.
Thursday, 19 March 2009. http://news.bbc.co.uk/2/hi/uk_news/7951838.stm
2 US Energy Information Administration energy KIDS, Renewable Geothermal,
http://tonto.eia.doe.gov/kids/energy.cfm?page=geothermal_home-basics-k.cfm
3 Lokhorst, A & Wong, Th. E., 2007: “Geothermal Energy”. In: Wong, Th. E., Batjes, D.A.J.
& De Jager, J., Geology of the Netherlands, Royal Netherlands Academy of Arts and
Sciences, p. 341-346.
4 Geothermal Energy section of the NL Oil and Gas Portal.
http://www.nlog.nl/en/home/geothermy.html
5Van Balen, R.T., et al., 2002: “Modelling the hydrocarbon generation and migration in the
West Netherlands Basin, The Netherlands”. In: Netherlands Journal of Geosciences 79, p. 29-
44.
6 De Jager, J., 2007: “Geological development”. In: Wong, Th. E., Batjes, D.A.J. & De Jager,
J., Geology of the Netherlands, Royal Netherlands Academy of Arts and Sciences, p. 5-26.
7 Den Hartog Jager, D.G., 1996: “Fluviomarine sequences in the Lower Cretaceous of the
West Netherlands Basin: correlation and seismic expression”. In: Rondeel, et al. (eds),
Geology of gas and oil under the Netherlands, Kluwer Academic Publishers, p. 229-241.
8 Van Adrichem Boogaert, H.A. & Kouwe, W.F.P., 1993: “Stratigraphic nomenclature of the
Netherlands, revision and update by RGD and NOGEPA”. In: Mededelingen Rijks
Geologische Dienst (RGD), nr 50.
9 Geluk, M.C., 2007: “Triassic”. In: Wong, Th. E., Batjes, D.A.J. & De Jager, J., Geology of
the Netherlands, Royal Netherlands Academy of Arts and Sciences, p. 85-106.
10 Schlumberger Log Interpretation, Volume 1-Principles. 1972 Edition.
11 Ames R. & Farfan P.F., 1996: “The environments of deposition of the Triassic Main
Buntsandstein Formation in the P and Q quadrants, offshore the Netherlands”. In: Rondeel, et
al. (eds), Geology of gas and oil under the Netherlands, Kluwer Academic Publishers, p. 167-
178.
12 G. Diephuis, 2006: Basic and Advanced Geophysics, Geophysical Education & Advice.
13Brouwer, G.K., Lokhorst, A. & Orlic, B., 2005. Geothermal heat and abandoned gas
reservoirs in the Netherlands. Proceedings World Geothermal Congress 2005, Antalya, Turkey
(24–29 April). International Geothermal Association, CD-ROM, art. 1177.

50
Bunter Reservoir Quality for Geothermal Applications
MSc Graduation Thesis of Olakunle Bukola OGUNJIMI. June, 2010.
14Smits, P.F., 2008: “MSc Thesis: Construction of an integrated reservoir model using the
Moerkapelle field for geothermal development of the Delft sandstone”. TU Delft.
15Mulder, E. de, Geluk, M.C., Ritsema, I., Westerhoff, W.E., Wong, T.E. (Eds), 2003. De
ondergrond van Nederland, Geologie van Nederland, deel 7; Peeters, Herent, België; 379 pp.

51
Bunter Reservoir Quality for Geothermal Applications
MSc Graduation Thesis of Olakunle Bukola OGUNJIMI. June, 2010.
Appendixes:
1. Introduction
Please note that this appendix contains a full description of the methods used and reported in
this research work. This appendix should be used as an additional resource to the main paper
if more details are required.
2. Coordinate System
The coordinate system used is the Rijksdriehoekstelsel New (RD New), The Dutch national
projection system. To transform the old RD system to the new RD system:
X = + 155.000 m
Y = + 463.000 m
Figure 1: RD New Projection System Parameters

52
Bunter Reservoir Quality for Geothermal Applications
MSc Graduation Thesis of Olakunle Bukola OGUNJIMI. June, 2010.
Figure 2: Parameters datum ‘Amersfoort’ (Molodensky). This datum is called ‘Netherlands’ in
Geographix.
Figure 3: Parameters datum ED50.

53
Bunter Reservoir Quality for Geothermal Applications
MSc Graduation Thesis of Olakunle Bukola OGUNJIMI. June, 2010.
3. Seismic Data
Four 3D seismic surveys were interpreted. They were all supplied by TNO in segy format.
They were supplied as different file collections and then merged in Geographic before being
loaded in Tigress Workstation for interpretation. Figures 4-7 shows a summary of parameters
used to process data from each survey.
Figure 4: Summary of parameters used to process data from survey L3NAM1985P.
Figure 5: Summary of parameters used to process data from survey L3NAM1991A.

54
Bunter Reservoir Quality for Geothermal Applications
MSc Graduation Thesis of Olakunle Bukola OGUNJIMI. June, 2010.
Figure 6: Summary of parameters used to process data from survey Z3NAM1990D.
Figure 7: Summary of parameters used to process data from survey Z3AMC1989A.

55
Bunter Reservoir Quality for Geothermal Applications
MSc Graduation Thesis of Olakunle Bukola OGUNJIMI. June, 2010.
Figure 8: Polarity Convections
4. Well Data
There were seventy-nine (79) wells in the study area. For each well a set of data (Well
ID, coordinates, location, KB, status, class, total depth, completion well logs, reports, velocity
information, pressure etc), digital logs, formation tops, deviation surveys and core data were
available from the TNO website www.nlog.nl

56
Bunter Reservoir Quality for Geothermal Applications
MSc Graduation Thesis of Olakunle Bukola OGUNJIMI. June, 2010.
Table 1: List of wells in the study area showing Well ID, Coordinates, Location, Class, Status, Total
Depth, Available Well Data etc.

57
Bunter Reservoir Quality for Geothermal Applications
MSc Graduation Thesis of Olakunle Bukola OGUNJIMI. June, 2010.
5 Seismic Interpretation
A general overview and geometry of the horizons and faults mapped in this area can be
seen from Figures 9-12. This interpretation is consistent with previous work done in this area.
Figure 9: A general overview and geometry of the horizons and faults mapped in survey L3NAM1985P.
Figure 10: A general overview and geometry of the horizons and faults mapped in survey L3NAM1991A.

58
Bunter Reservoir Quality for Geothermal Applications
MSc Graduation Thesis of Olakunle Bukola OGUNJIMI. June, 2010.
Figure 11: A general overview and geometry of the horizons and faults mapped in survey Z3NAM1990D.
Figure 12: A general overview and geometry of the horizons and faults mapped in survey Z3AMC1989A.

59
Bunter Reservoir Quality for Geothermal Applications
MSc Graduation Thesis of Olakunle Bukola OGUNJIMI. June, 2010.
5 3D Gridding
In the Jewel gridding process, there are three ways in which interpolation between data
points are done. They include Triangulated Interpolation, Distance weighted, and Ordinary
Kriging. Figure 13 shows the Jewel surface gridding workflow settings.
Figure 13: A picture showing the Jewel gridding surface workflow settings. The interpolation types are
shown in the red rectangular box.

60
Bunter Reservoir Quality for Geothermal Applications
MSc Graduation Thesis of Olakunle Bukola OGUNJIMI. June, 2010.
5 Geothermal Gradient
Also as an input to the static model, the temperature in the WNB is estimated. Because
this is a regional interpretation, the normal geothermal gradient of 310C/km is used. However,
the average geothermal gradient in the Netherlands is ca. 3 to 40C/100 m down to 2000 m
depth.3 The property calculator is used in Jewel Suite (Figure 14). A new property is created
for each depth surface with an expression:
10+0.031*h i.e. 10+0.031*$Depth$
Figure 14: Jewel property calculator used to generate a temperature map for the various levels.
5 Petrophysical Interpretation of reservoir levels
Based on the second scenario where more weight is given to the good values, the gross
and net thicknesses were calculated. The 0.1mD cut-off values remained the same for the two
scenarios. The 1mD and 10mD cut-off‟s showed an increase in N/G for each Well. These
comparisons can be seen for all the correlation Panels. See Figures 15-20.

Figure 15: Correlation Panel 6.
SSE N

63
Bunter Reservoir Quality for Geothermal Applications
MSc Graduation Thesis of Olakunle Bukola OGUNJIMI. June, 2010.
Figure 16: Correlation Panel 7.
SE NW

64
Bunter Reservoir Quality for Geothermal Applications
MSc Graduation Thesis of Olakunle Bukola OGUNJIMI. June, 2010.
Figure 17: Correlation Panel 8.
ESE NW

65
Bunter Reservoir Quality for Geothermal Applications
MSc Graduation Thesis of Olakunle Bukola OGUNJIMI. June, 2010.
Figure 18: Correlation Panel 9.
ESE NW

66
Bunter Reservoir Quality for Geothermal Applications
MSc Graduation Thesis of Olakunle Bukola OGUNJIMI. June, 2010.
Figure 19: Correlation Panel 10.

Figure 20: Correlation Panel 11.
NE NNW