
AES/GE/10-18 Environmental Management of Drilling Mud...
152
AES/GE/10-18 Environmental Management of Drilling Mud 18 th June 2010 Amir M. Shaikh
Transcript of AES/GE/10-18 Environmental Management of Drilling Mud...

AES/GE/10-18 Environmental Management of Drilling Mud
18th June 2010 Amir M. Shaikh
Title : Environmental Management of Drilling Mud
Author(s) : Amir M. Shaikh
Date : 18th June, 2010 Professor(s) : Dr. Hans de Ruiter & Dr. Temo Heimovarra Supervisor(s) : Dr. Ference MadaiTA Report number : AES/GE/10-18
Postal Address : Section for Geo–Engineering Department of Applied Earth SciencesDelft University of TechnologyP.O. Box 5028The Netherlands
Telephone : (31) 15 2781328 (secretary)Telefax : (31) 15 2781189
Copyright ©2010 Section for Geo-Engineering
All rights reserved.No parts of this publication may be reproduced,Stored in a retrieval system, or transmitted, In any form or by any means, electronic,Mechanical, photocopying, recording, or otherwise,Without the prior written permission of the Section for Geo-Engineering

University of Miskolc
European Geotechnical and Environmental Course 2008-2010
“Environmental Management of Drilling Mud”
Master’s Thesis
January - 2010
Amir Mahmood Shaikh

Delft University of Technology
DIPLOMA THESIS ASSIGNMENT
FOR
AMIR M. SHAIKH (EGEC 2008-2010)
“Environmental Management of Drilling Mud”
The thesis work on environmental aspects of Drilling Mud in Mineral Exploration will introduce
the major aspects of management of drilling mud that is nowadays an important environmental
concern during the hydrocarbon exploration industry.
According to the European legislation, the used drilling mud is a kind of mining waste;
therefore it is a subject to the 21/2006/EC “mining waste” directive. Also the focus must also
be given to European Union and Hungarian regulations like EU Directive “2000/60/EC” for
Water Frame Work, and Government of Hungary regulations for groundwater protection
“219/2004 (VII. 21)”.
The drilling mud as a liquid material cannot be disposed on a waste disposal / landfill facility.
An effective form of handling of the used drilling mud is to settle the solid part for disposal. In
this case the real problem is the management of the liquid part, which can be reinjected into
underground strata. This way of drilling mud management involves a series of environmental
and geotechnical questions: what are the geotechnical properties of strata that will be suitable
to accommodate this drilling waste. The reinjected mud cannot interfere with underground
water resources. What are the technical requirements for this operation? What is the
composition of the solid parts? In addition to waste minimization efforts, liquid reinjection is the
most efficient way to minimize surface environmental impact, based on long term liability
concept.
Summarizing, this work would enhance the knowledge about the environmental aspects of the
exploration activity with emphasis on the Environmental Management of Drilling Mud.
Faculty Advisor: Dr. Ferenc Madai
Deadline: January, 2010.
Delft, December 10, 2009.
Ir. J.J. de Ruiter
Associate professor Mining Engineering Programs.

i
ACKNOWLEDGEMENTS
First of all, I am grateful to my God (almighty ALLAH), and its all because of ALLAH’s
continuous support, and energy that I successfully completed my all activities in time.
A report that gathers and attempts to consolidate the fundamentals of a whole discipline does
not emerge from a vacuum. Of the many reports, books and articles consulted, those found
influential in shaping this report are of great importance.
It gives me immense pleasure to record my sincere thanks to my supervisors Dr. Ferenc
Madai, Associate Professor at University of Miskolc, and Dr. Jozsef Dorman, Senior
Technical Advisor (fluid technology), MOL Group, Szolnok, Hungary, who gave their consent
to guide us for completion of this thesis report. They had been very encouraging and
cooperative, while the work was carried out.
I am furthermore highly appreciative to Dr. Istvan Berczi, Dr. Tibor Szabo, Dr. J. Federer,
and all the colleagues at the Department of Mineralogy and Petrology, and Department of
Geology at Miskolc University, who gave their precious time and supported me in all the ways
they can for the achievement of my goal and compilation of this thesis report.
Amir Mahmood Shaikh

ii
DEDICATION
I wish to dedicate this thesis report to the teachers, engineers, friends, EGEC fellows, and
EMMEP members and alumni from whom I have learned.
My Father and Mother, who have always been a major source of inspiration and who made me
capable of what I am now.
All member of my family for their affection and support, which means so much to me. Specially,
my fiancé whose patience, understanding, and encouragement were essential to completion of
this thesis.

iii
STATEMENT OF ORIGINALITY
I declare that this thesis is my own work and it has not been previously accepted for a higher
degree. Any material which has been copied verbatim is contained within quotation marks or
the source cited. In addition, I declare that I have consulted all of the referenced material.
Signed:
Miskolc. January, 2010.

Table of Acronyms
iv
API American Petroleum Institute LCM Lost Circulation Material
ASTM American Society for Testing and Materials
LWD Logging While Drilling
BAT Best Available Techniques LWD Landspraying While Drilling
BEP Best Environmental Practices MBC Mix Bury Cover
cfm Cubic Feet Per Meter MoE Ministry of Environment
cP Centipoise (Unit for Viscosity) mPa.s Milli Pascal Second (1 cP = 1 mPa·s)
CRI Cutting Re-Injection MWD Measuring While Drilling
CSR Contaminated Sites Regulation NORM Naturally Occurring Radioactive Material
DEM Discrete Element Modeling NPDES National Pollutant Discharge Elimination System
DFL Drilling Fluid Lubricant OBM Oil Based Mud
EC European Commission OGWR Oil and Gas Waste Regulation
ECD Equivalent Circulating Density OPF Organic Phase (Drilling) Fluids
EFD Environmentally Friendly Drilling OSPAR Oslo and Paris Conventions
ELGs Effluent Limitations Guidelines PHPA Partially Hydrolyzed Polyacrylamide
E&P Exploration And Production PSD Particle Size Distribution
EMA Environmental Management Act psi Pounds Per Square Inch
EPA Environmental Protection Agency ROP Rates Of Penetration
FBG Formation Breakdown Gradient SBF Synthetic Based (Drilling) Fluid
FROBM Flat Rheology Oil Based Muds SBM Synthetic Based (Drilling) Mud
HIAF Highly Inhibitive Aqueous Fluid SDU Slurry Disposal Unit
HPWBM High Performance Water Based Mud
WBM Water Based (Drilling) Mud
HWR Hazardous Waste Regulation WDR Waste Discharge Regulation

v
SUMMARY
With day to day increase in demand for mineral resources, and to meet the industrial
and economical requirements, the mineral exploration and production companies are
participating actively for innovation of technologies and introducing more environmental
friendly practices, along with maximization of their profits.
This thesis work summarizes the environmental management of drilling fluids that are
the most important part of any hydrocarbon exploration and production activity. The type
and composition of the drilling fluids, and drilling techniques, helps the reader to identify
the basic concepts of drilling muds (fluids), and their environmental impacts.
Along with this, the environmental regulations and directives identified in this thesis
report will provide an optimal approach to the environmental friendly exploration activity.
The introduction to modern techniques for exploration, innovation of new high
performance environmental friendly drilling fluids, will increase the vision of the reader
towards the best available techniques.
The liquid and cuttings reinjection in the subsurface (into deep geological formations), in
the form of slurry, is the new technique and is normally used, to meet the environmental
regulations at many offshore and onsite exploration sites, to preserve the other usable
resources, like water and avoid the spreading of contamination in the subsurface. For
this, the geotechnical requirements, and the injection techniques are discussed in this
thesis, so that the goal for sustainable environment may be approached by
environmental friendly drilling waste disposal practices.
In the end, recommendations are based on the previous history and current scenarios
of the oil and gas exploration activities, and also the future aspects of eco friendly
exploration and production techniques, for appropriate management of the drilling
wastes (solids / fluids).
vi
Table of Contents
Introduction ........................................................................................................................... I
Chapter No.1: Drilling Fluids and Technologies
1.0 Introduction ....................................................................................................................... 1
1.1 General Types of Drilling Mud........................................................................................... 1
1.2 Functions of Drilling Mud................................................................................................... 4
1.3 Typical Composition of Drilling Fluid ................................................................................. 6
1.4 Properties of Drilling Mud.................................................................................................. 8
1.5 Selection of Drilling Fluid................................................................................................. 10
1.6 Maintenance of Drilling Mud............................................................................................ 11
1.7 Solid Control or Removal Techniques............................................................................. 12
Chapter No.2: Drilling Fluids Related Environmental Issues And Regulations
2.0 Introduction ..................................................................................................................... 18
2.1 Non Water Quality Environmental Impacts of Muds ....................................................... 19
2.2 Environmental Regulations and Directives ..................................................................... 19
2.3 Acceptable Disposal Options For Drilling Mud................................................................ 20
2.4 Regulation and Authorization of Waste Discharges........................................................ 21
2.5 API’s Management Practice for Drilling Pollution Prevention ......................................... 22
2.6 US EPA Hierarchy for Waste Management .................................................................... 23
2.7 Current Environmental Regulations (Domestic).............................................................. 25
Chapter No.3: Drilling Waste (Solid & Liquid) Reduction Techniques
3.0 Introduction ..................................................................................................................... 29
vii
3.1 Waste Minimization in Drilling Operations....................................................................... 29
3.2 Drilling Practices that Minimize Generation of Drilling Wastes ....................................... 32
3.3 Reuse, Recylcing, or Reduction Techniques for Drilling Fluids ...................................... 34
Chapter No.4: Waste Disposal Issues
4.0 Introduction ..................................................................................................................... 36
4.1 Toxicity Assessment ...................................................................................................... 36
4.2 Waste Handling Prior To Disposal .................................................................................. 37
4.3 Handling of Solid Wastes ................................................................................................ 38
4.4 Solid Waste Disposal ...................................................................................................... 38
4.5 Handling of Liquid Wastes .............................................................................................. 41
4.6 Liquid Waste Disposal..................................................................................................... 42
4.7 Laboratory Tests - Composition of Disposable Drilling Fluid .......................................... 45
Chapter No.5: Environmental Friendly Drilling Fluid Technologies
5.0 Introduction ..................................................................................................................... 48
5.1 Hgh Performance Water Based Muds ............................................................................ 48
5.2 Inhibitive Water Based Muds .......................................................................................... 49
5.3 Third Generation Inhibitve Fluids .................................................................................... 49
5.4 High Performance Muds ................................................................................................. 50
5.5 Vegetable and Plant Oil Based Muds ............................................................................. 51
5.6 High Performance Ester Based Drilling Fluids ................................................................ 51
5.7 Olefin Based Environmental Friendly Drilling Muds ........................................................ 52
5.8 Aphron Drilling Fluids ...................................................................................................... 52
5.9 Enviornmental Friendly High Performance Drilling Fluid Lubricant................................. 53
viii
Chapter No.6: Advanced Drilling Waste Management Technologies
6.0 Introduction ..................................................................................................................... 54
6.1 Best Avaliable Techniques.............................................................................................. 54
6.2 Best Environmental Practice ........................................................................................... 55
6.3 BAT and BEP for CRI Drill Cuttings and Produced Water .............................................. 57
6.4 Low Impact Drilling Operation ......................................................................................... 58
6.5 Methodology for EFD ...................................................................................................... 60
Chapter No.7: Cuttings (Fracture) Re-injection
7.0 Introduction ..................................................................................................................... 62
7.1 History of CRI.................................................................................................................. 62
7.2 CRI Technology ............................................................................................................. 63
7.3 CRI Operation and Technical Design Issues .................................................................. 64
7.4 Types of Slurry Injection.................................................................................................. 67
7.5 Slurry Properties ............................................................................................................. 68
7.6 CRI Operating Considerations ........................................................................................ 69
7.7 Geotechincal and Geomechanical Issues....................................................................... 69
7.8 Lithology Concerns ......................................................................................................... 70
7.9 Geology Evaluation and Contaminant Assurance .......................................................... 71
7.10 Potential Uncertanities and Limitations of CRI ............................................................. 71
Chapter No.8: Practical Potential of Cuttings (Fracture) Re-injection
8.0 Introduction ..................................................................................................................... 75
8.1 Selection and Design Criteria.......................................................................................... 75
8.2 Geological Conditions ..................................................................................................... 75
8.3 Permeability Issues......................................................................................................... 76
ix
8.4 Presence of Wellbores and Subsurface Discontinuities.................................................. 77
8.5 Depth of Well................................................................................................................... 77
8.6 Fracture Growth and Propagation................................................................................... 77
8.7 Pumping Tests ................................................................................................................ 80
8.8 Size Distribution of Cuttings Slurry.................................................................................. 81
8.9 Enhancement in Slurry Properties .................................................................................. 81
8.10 Wellbore Integrity .......................................................................................................... 82
8.11 Monitoring and Verification............................................................................................ 83
8.12 Logging Methods Applicable to Slurry Injection ............................................................ 84
8.13 Slurry Injection Database.............................................................................................. 85
8.14 Advantages and Disadvantages of CRI ........................................................................ 85
Chapter No.9: Experiments and Experiences for CRI
9.0 Introduction ..................................................................................................................... 86
9.1 Sample Collection ........................................................................................................... 86
9.2 Slurrification Tests........................................................................................................... 87
9.3 Flow Behavior of Slurries ................................................................................................ 91
9.4 Conclusions From Tests ................................................................................................ 94
9.5 Cuttings Re-Injection (Slurry Re-Injection) Experiences ................................................ 94
Chapter No. 10: Conclusions and Recommendations .................................................... 97
List of References
Appendices
i
INTRODUCTION
This thesis report gives a brief introduction to the environmental management of drilling fluids that is one
of the major environmental concerns for the hydrocarbon exploration and production industry. The main
goals of this study are;
• To introduce different types of drilling fluids (muds) and their constituents.
• Focus on the environmental directives and regulations set by state for drilling waste disposal.
• Introduce the drilling waste minimization techniques and advanced environmental friendly
technologies for drilling fluid usage and disposal.
• Identify the methodology for effective handling of the used drilling mud by reinjection in the
Geosphere, by fulfilling the geotechnical and environmental requirements.
To achieve these goals, the published and unpublished literature is reviewed, and also the available
professional papers discussing drilling fluids, relevant environmental regulations, drilling waste disposal
techniques and cuttings re-injection were consulted. Few of the experiments were also performed to
achieve the desired goals. The summary of the activities is presented in this thesis report.
This study work is composed of two parts. One is the major thesis report of ten chapters containing the
focused issues and a second short report containing the relevant appendixes.
In chapter 1, the introduction to drilling fluids is mentioned. It includes the different types of drilling
fluids used in the petroleum exploration and production activities. The functions and selection criteria,
helps the reader to decide about the best possible fluid system, to be opted for this activity. The chapter
contains a section for maintenance of the drilling fluid, that focuses on the solid removal techniques
employed during the drilling operations, so that the age of the drilling fluid system, must be enhanced and
have cost effective operation. The idea of this chapter is to introduce the complexity and importance of
the drilling fluids for the optimization of drilling operation in hydrocarbon industry.
Chapter 2 describes the environmental impacts of the drilling fluids and the control measures designed by
the governments or local authorities. The impact of drilling mud on soil and water is discussed briefly in
this section, so that the importance of environmental affects of drilling muds must be realized by reader.
As such, there is no separate regulation or directive in Europe for the petroleum industry exploration or

ii
drilling waste, but the regulation for extraction industry is used as a guideline for environmental
management. In EU, every country also has their own regulations for extraction industry waste
management, but they are not strictly focused on the oil and gas drilling operation. However, USA has
specific regulations for environmental management of drilling fluids, and they are more likely adopted by
different exploration companies.
The introduction to drilling waste disposal and reduction techniques are focused in Chapter 3 and 4. The
drilling mud is combination of number of chemicals and fluids, when it is prepared to meet the complex
requirements of drilling. However, when the issue comes to disposal of this liquid, it is combination of
solids (cuttings from subsurface) and fluids with lot of changes in their chemical and physical properties.
There are lot of techniques and regulations set up for the minimization of this waste, however, still the
optimum results are not achieved, because of production profits and high cost of implementation of these
practices. The disposal of drilling mud is basically deeply related to the solids and liquid constituents. So,
I have focused on handling and disposal of both solid and liquid parts of drilling muds, which is normally
known as drilling waste.
With the innovation of technology and strictness of environmental regulations, the research and
development in the field of innovating new types of drilling fluid and waste handling techniques have
inclined, and the overview to these methods and technologies is elaborated in Chapter 5 and 6. The
purpose of these chapters is to introduce user to the environmental friendly high performance drilling
waste management techniques. These fluids like inhibitive water based muds and environmental friendly
high performance DFL are used by the E&P operators, and substantial results were obtained. Along with
this the low impact drilling techniques have not only reduced adverse environmental impact of drilling
waste but also helped the operators to save cost of operations.
Chapter No. 7 and 8, focus on a comparatively new technique for management of drilling fluids. The
technology is in use since last decade but there is number of issues like geological aspects of disposal site,
slurry properties and hydraulic fracture generation in the formation, that always keep a question in the
mind of operators. More than 300 activities were tried for cutting re-injection, or drilling waste disposal in
the formation, that is in subsurface. A minor portion of these jobs resulted in failure or further damage to
environment and E&P activity at the site. However, with proper planning and study being performed,
these problems are sorted out and the failure rates have almost reached to zero. These chapters focus of
the basics of the Cuttings Re-injection (slurry re-injection), that is the most suitable and appropriate
method for disposal of drilling fluids.

iii
Few of the experiments were conducted, to reassure the slurrification and the rheological properties of the
drilling fluids, which are discussed in Chapter No. 9. The results were as per expectations and the linear
rheology of the drilling fluid samples depicts that the slurrification phase of the CRI is ideal. However,
it’s not only about slurrification, but we also have to consider lithological and geological aspects of the
formation. The well condition and the other sensitive parameters, like cementing, well bore stability, pore
pressures, hydraulic pressures, fracturing and contaminant preservation assurance are few of the most
important aspects of CRI.
On the basis of referred texts, experiments and history of environmental management for drilling fluids,
the recommendations and concluding words are presented in Chapter No. 10.
This thesis study is compiled in Hungary, where this CRI technique is not implemented due to
environmental regulations, so the most of the practical aspects were referenced from the texts containing
the practical information from the countries and sites where CRI is allowed. However, the relevant
laboratory experiments and studies were performed to provide an optimum solution for the drilling fluids
waste management.

Chapter No.1 Drilling Fluids and Technologies
1
CHAPTER No. 1: DRILLING FLUIDS AND TECHNOLOGIES
1.0. INTRODUCTION
Drilling mud, also known as “Drilling fluid”, is a complex (multi-component) and multifunctional
liquid, used to drill boreholes into the earth. Mostly used while drilling oil and natural gas wells
(exploration and production) by drilling rigs. Drilling fluids are often used for much simpler boreholes,
such as water wells. The main functions of drilling fluids include providing hydrostatic pressure to
prevent formation fluids from entering into the well bore, keeping the drill bit cool and clean during
drilling, carrying out drill cuttings and suspending the drill cuttings while drilling is paused. Along with
this, the drilling fluid avoids formation damage and limits corrosion.
1.1. GENERAL TYPES OF DRILLING MUD
Many types of drilling fluids are used on a day to day basis, depending on various factors like
geology of exploration area, well stability and environmental conditions. Some wells require that different
types to be used at different parts in the bore hole, or that some types of drilling muds are used in
combination with other (Darley and George 1988). The various types of fluid generally fall into a few
broad categories.
• Air / Water (polymer): Compressed air (or gas) is pumped either down the bore holes’ annular
space or down the drill string itself. In the same way, with water added to increase viscosity, flush
the hole, provide more cooling, and/or to control dust. Specially formulated chemicals (foaming
agent, polymer, etc.) are added to the water & air mixture to create specific conditions.
• Water Based Mud (WBM): A most basic water based mud system begins with water, and then
clays and other chemicals are incorporated into the water to create a homogenous suspension (with
varying viscosity). The clay is usually a combination of native clays that are dispersed into the fluid
while drilling, or specific types of clay that are processed and sold as additives for the WBM
system. The most common of these is bentonite, frequently referred to in the oilfield as "gel". Gel
likely makes reference to the fact that while the fluid is being pumped, it can be very thin and free
flowing, though when pumping is stopped, the static fluid builds a "gel" structure that resists flow.
When an adequate pumping force is applied to "break the gel", flow resumes and the fluid returns to
its previously free flowing state.

Chapter No.1 Drilling Fluids and Technologies
2
• Oil Based Mud (OBM): Oil based mud can be a mud where the base fluid is a hydrocarbon product
such as diesel fuel. Oil based muds are used for many reasons, some being enhanced shale
inhibition, improved temperature stability, increased lubricity. The use of oil based muds has
special considerations. These include cost and environmental considerations. Synthetic based fluid
is a mud where the base fluid is synthetic oil. This is most often used on offshore rigs because it has
the properties of an oil based mud, but the toxicity of the fluid is much less, biodegradability is
much better than diesel based fluid.
Broadly, drilling fluids are classified according into above listed three types on the basis of primary
component, and having different characteristics, as highlighted in Appendix–I (Darley and George 1988).
1.1.1. Air Based Fluids
Under a restricted set of conditions, air can be used as the drilling fluid when drilling through
formations having little or no permeability to water (and in case of severe or total loss of circulation).
Although classified as “air” drilling, several types of gases are actually used.
• Dry Air: Air is compressed and pumped down the drill pipe at 0.24m3/sec to 0.38m3/sec. The
returned air is blown out the “blooie” line to a pit designed to retain the dust and cuttings. Dry air is
preferred for fast drilling in dry, hard rock conditions with no water influx.
• Mist: Mist drilling follows the same format as dry air drilling, but brine water is injected into the air
stream. This is the method of choice when drilling wet formations with minimal water influx. The
brine mist is injected to minimize reaction of the formation with fresh water influx.
• Foam: Foam drilling follows the same format as mist drilling, but with a foaming agent introduced
into the mist stream. Foam is preferred when drilling stable formations that may have a moderate
influx of water.
1.1.2. Water Based Muds
Water based drilling fluids are the most commonly used of the mud systems. They are generally
less expensive and less difficult to maintain then the oil based muds, and in some physical types of
systems, they are almost as shale inhibitive. These are fluids where water is the continuous phase. The
water may be fresh, brackish or seawater, whichever is most convenient and suitable to the system or is
available. The following designations are normally used to define the classifications of water based
drilling fluids:

Chapter No.1 Drilling Fluids and Technologies
3
• Non Inhibited means that the fluid contains no additives to inhibit hole problems.
• Inhibited means that the fluid contains inhibiting ions such as chloride, potassium or calcium or a
polymer which suppresses the breakdown of the clays by charge association and or encapsulation.
• Dispersed means that thinners have been added to scatter chemically the bentonite (clay) and
reactive drilled solids to prevent them from building (excessive) viscosity.
• Non Dispersed means that the clay particles are free to find their own dispersed equilibrium in the
water phase.
If a water based fluid is used, the water will tend to enter the formation and change the mechanical
properties of rock. These changes can be minimized by using an inhibited water based fluid. The inhibited
water based systems however cannot totally prevent water wetting of the rock pores.
1.1.3. Oil Based Muds
Oil based muds were developed to prevent water from entering the pore spaces of shales and
causing swelling/hydration. There are several advantages and disadvantages of oil based mud system. The
advantages include the followings;
• Shale inhibition & thermal stability,
• Kick detection & formation evaluation,
• Resistance to chemical contamination (salts, anhydrite),
• CO2 and H2S can easily be removed with the addition of lime and sulfide scavenger.
Disadvantages of oil based mud systems include the followings;
• High initial cost,
• Pollution control & disposal,
• Barite sagging and slow rates of penetration.
Oil based muds contain three phases: oil, brine, and solids phase.

Chapter No.1 Drilling Fluids and Technologies
4
• Oil Phase: The oil phase is the continuous phase in which every thing else in the system is mixed.
The oil can be diesel, mineral oil, or one of the new types of synthetic oils.
• Brine Phase: The brine phase is present in the system as a high concentration salt solution that is
emulsified into the base oil. Usually, a solution of calcium chloride is used because it gives a
greater flexibility in adjusting the concentration of the salts. Dissolved salt decreases water activity
and increases osmotic pressure for better shale stabilization.
• Solids Phase: The solids phase includes the weight material, viscosifier, and fluid loss reducers. A
primary requirement for this phase is that it remains oil wet. Compounds exclusively developed for
this purpose are included in the oil mud makeup.
1.2. FUNCTIONS OF DRILLING MUD
In hydrocarbon exploration and production activities, drilling mud is a fluid used to drill
boreholes to encounter deep geological formations. The main functions of drilling muds include providing
hydrostatic pressure to prevent formation fluids from entering into the well bore, keeping the drill bit cool
and clean during drilling, carrying out drill cuttings and suspending the drill cuttings while drilling is
paused and the drilling assembly is brought in and out of the hole (Martin and Max, 1996). The drilling
mud used for a particular job is selected to avoid formation damage and to limit corrosion (David, 2007).
However, the detailed overview of the functions of drilling fluids is mentioned below:
1.2.1. Control Formation Pressures
If formation pressure increases, mud density also increases, often with the use of barite (or other
weighting materials) to balance pressure and keep the wellbore stable. Unbalanced formation pressures
will cause a blowout from pressured formation fluids. Alongwith this, hydrostatic pressure controls the
stresses caused by tectonic forces; these may make wellbores unstable even when formation fluid pressure
is balanced. Hydrostatic pressure depends on mud weight and true vertical depth (TVD). If hydrostatic
pressure is greater than or equal to formation pressure, formation fluid will not flow into the wellbore.
1.2.2. Remove Cuttings From Well
Drilling fluid carries the rock excavated by the drill bit up to the surface. Its ability to do so
depends on cutting size, shape, and density, and speed of fluid traveling up the well (annular velocity).
These considerations are analogous to the ability of a stream to carry sediment; large sand grains in a slow
moving stream settle to the stream bed, while small sand grains in a fast moving stream are carried along
with the water.
Chapter No.1 Drilling Fluids and Technologies
5
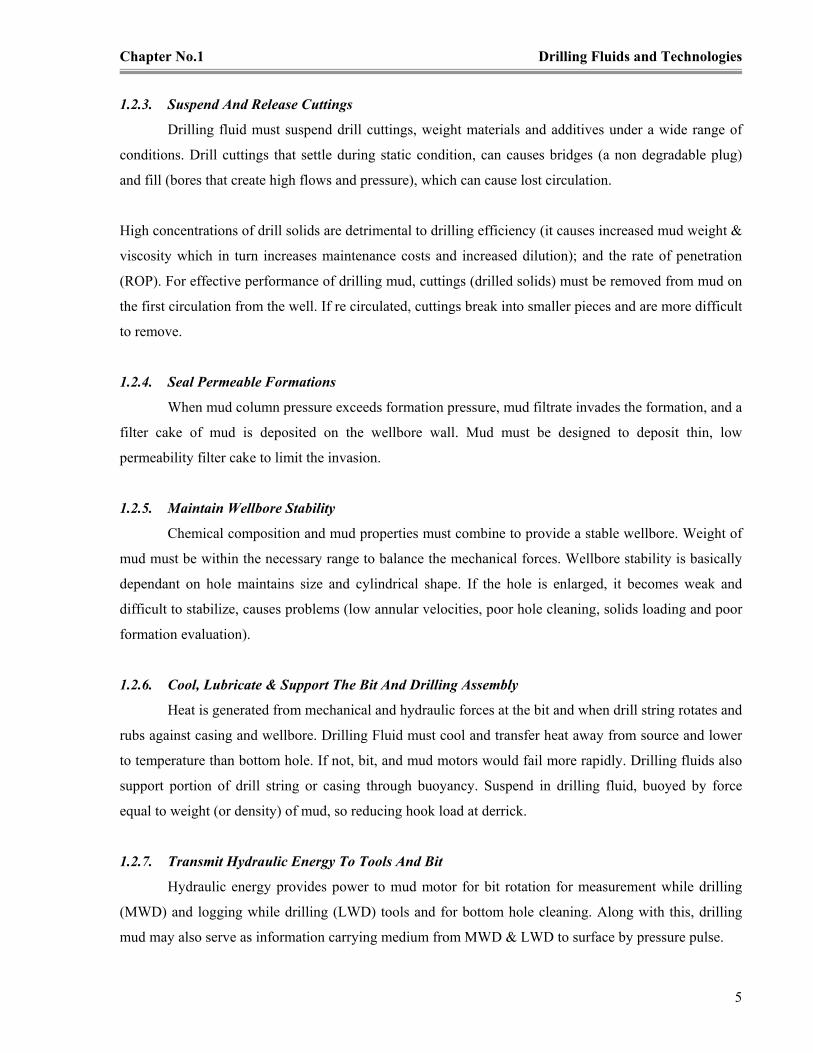
1.2.3. Suspend And Release Cuttings
Drilling fluid must suspend drill cuttings, weight materials and additives under a wide range of
conditions. Drill cuttings that settle during static condition, can causes bridges (a non degradable plug)
and fill (bores that create high flows and pressure), which can cause lost circulation.
High concentrations of drill solids are detrimental to drilling efficiency (it causes increased mud weight &
viscosity which in turn increases maintenance costs and increased dilution); and the rate of penetration
(ROP). For effective performance of drilling mud, cuttings (drilled solids) must be removed from mud on
the first circulation from the well. If re circulated, cuttings break into smaller pieces and are more difficult
to remove.
1.2.4. Seal Permeable Formations
When mud column pressure exceeds formation pressure, mud filtrate invades the formation, and a
filter cake of mud is deposited on the wellbore wall. Mud must be designed to deposit thin, low
permeability filter cake to limit the invasion.
1.2.5. Maintain Wellbore Stability
Chemical composition and mud properties must combine to provide a stable wellbore. Weight of
mud must be within the necessary range to balance the mechanical forces. Wellbore stability is basically
dependant on hole maintains size and cylindrical shape. If the hole is enlarged, it becomes weak and
difficult to stabilize, causes problems (low annular velocities, poor hole cleaning, solids loading and poor
formation evaluation).
1.2.6. Cool, Lubricate & Support The Bit And Drilling Assembly
Heat is generated from mechanical and hydraulic forces at the bit and when drill string rotates and
rubs against casing and wellbore. Drilling Fluid must cool and transfer heat away from source and lower
to temperature than bottom hole. If not, bit, and mud motors would fail more rapidly. Drilling fluids also
support portion of drill string or casing through buoyancy. Suspend in drilling fluid, buoyed by force
equal to weight (or density) of mud, so reducing hook load at derrick.
1.2.7. Transmit Hydraulic Energy To Tools And Bit
Hydraulic energy provides power to mud motor for bit rotation for measurement while drilling
(MWD) and logging while drilling (LWD) tools and for bottom hole cleaning. Along with this, drilling
mud may also serve as information carrying medium from MWD & LWD to surface by pressure pulse.
Chapter No.1 Drilling Fluids and Technologies
6
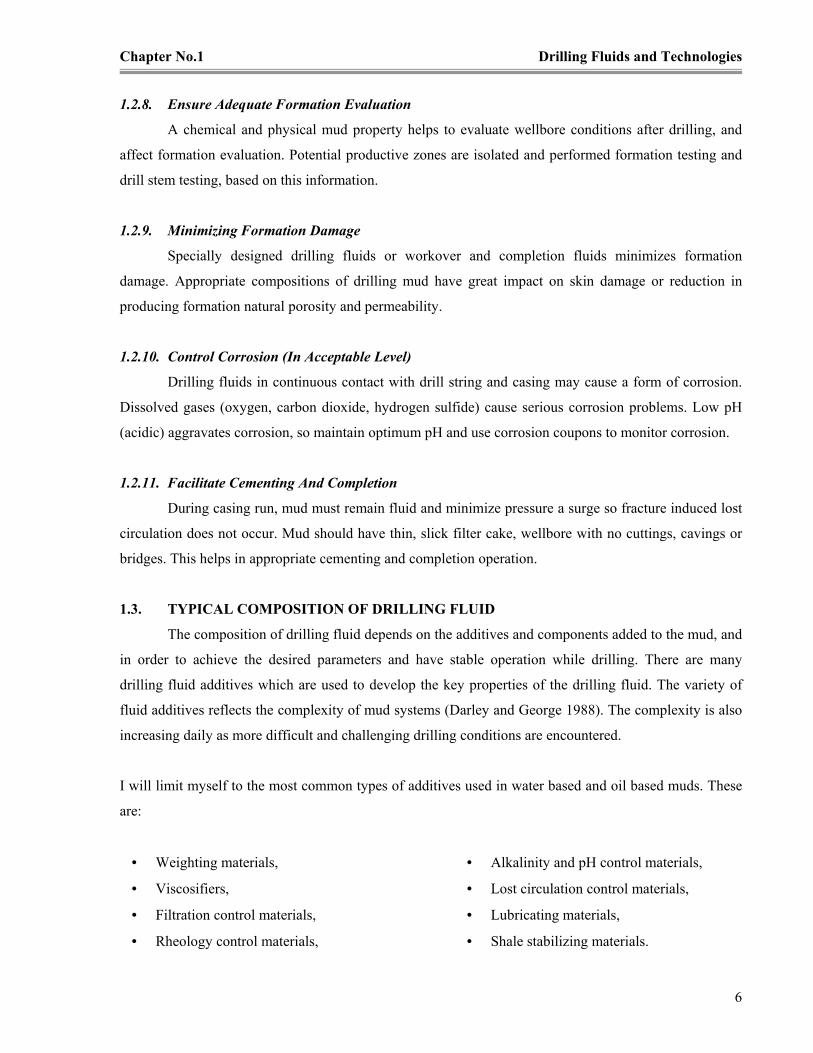
1.2.8. Ensure Adequate Formation Evaluation
A chemical and physical mud property helps to evaluate wellbore conditions after drilling, and
affect formation evaluation. Potential productive zones are isolated and performed formation testing and
drill stem testing, based on this information.
1.2.9. Minimizing Formation Damage
Specially designed drilling fluids or workover and completion fluids minimizes formation
damage. Appropriate compositions of drilling mud have great impact on skin damage or reduction in
producing formation natural porosity and permeability.
1.2.10. Control Corrosion (In Acceptable Level)
Drilling fluids in continuous contact with drill string and casing may cause a form of corrosion.
Dissolved gases (oxygen, carbon dioxide, hydrogen sulfide) cause serious corrosion problems. Low pH
(acidic) aggravates corrosion, so maintain optimum pH and use corrosion coupons to monitor corrosion.
1.2.11. Facilitate Cementing And Completion
During casing run, mud must remain fluid and minimize pressure a surge so fracture induced lost
circulation does not occur. Mud should have thin, slick filter cake, wellbore with no cuttings, cavings or
bridges. This helps in appropriate cementing and completion operation.
1.3. TYPICAL COMPOSITION OF DRILLING FLUID
The composition of drilling fluid depends on the additives and components added to the mud, and
in order to achieve the desired parameters and have stable operation while drilling. There are many
drilling fluid additives which are used to develop the key properties of the drilling fluid. The variety of
fluid additives reflects the complexity of mud systems (Darley and George 1988). The complexity is also
increasing daily as more difficult and challenging drilling conditions are encountered.
I will limit myself to the most common types of additives used in water based and oil based muds. These
are:
• Weighting materials,
• Viscosifiers,
• Filtration control materials,
• Rheology control materials,
• Alkalinity and pH control materials,
• Lost circulation control materials,
• Lubricating materials,
• Shale stabilizing materials.

Chapter No.1 Drilling Fluids and Technologies
7
1.3.1. Weighting Materials
Weighting materials or densifiers are solids material which when suspended or dissolved in water
will increase the mud weight. Most weighting materials are insoluble and require viscosifiers to enable
them to be suspended in a fluid. Clays and polymers are the most common viscosifier. Mud weights
higher than water are required to control formation pressures and to help combat the effects of sloughing
or heaving shales that may be encountered in stressed areas. The specific gravity of the material controls
how much solids material (fractional volume) is required to produce a certain mud weight. Appendix–II
(Table A.1) gives a list of commonly used weighting materials.
1.3.2. Viscosifiers
The ability of drilling mud to suspend drill cuttings and weighting materials depends entirely on
its viscosity. With low viscosity, all the weighting material and drill cuttings would settle to the bottom of
the hole as soon as circulation is stopped. One can think of viscosity as a structure built within the water
or oil phase which suspends solid material. In practice, there are many solids which can be used to
increase the viscosity of water or oil. The effects of increased viscosity can be felt by the increased
resistance to fluid flow; in drilling this would manifest itself by increased pressure losses in the
circulating system. The list of some of the viscosifying materials used for drilling fluids is given in
Appendix–II (Table A.2).
1.3.3. Rheology Control Materials
When efficient control of excessive viscosity and gel development cannot be achieved by control
of viscosifier concentration, materials called "thinners", "dispersants", and/or "deflocculants" are added to
drilling muds. These materials cause a change in the physical and chemical interactions between solids
and / or dissolved salts such that the viscous and structure forming properties of the drilling fluid are
reduced.
Thinners are also used to reduce filtration and cake thickness, to counteract the effects of salts, to
minimize the effect of water on the formations drilled, to emulsify oil in water, and to stabilize mud
properties at elevated temperatures. Materials commonly used as thinners in clay based drilling fluids are
classified as:
• Tannins, Lignitic materials or Lignosulfonates,
• Low molecular weight, synthetic or water soluble polymers.

Chapter No.1 Drilling Fluids and Technologies
8
1.3.4. Filtration Control Materials
Filtration control materials are used to reduce the amount of fluid that will be lost from the
drilling fluid into a subsurface formation caused by the differential pressure between the hydrostatic
pressure of the fluid and the formation pressure. Bentonite, polymers, starches, thinners and deflocculants
perform function as filtration control agents.
1.3.5. Alkalinity And Ph Control Materials
The pH affects several mud properties; like detection and treatment of contaminants such as
cement and soluble carbonates; and solubility of many thinners and divalent metal ions such as calcium
and magnesium. Alkalinity and pH control additives include: NaOH, KOH, Ca(OH)2, NaHCO3 and
Mg(OH)2. These are compounds used to attain a specific pH and to maintain optimum pH and alkalinity
in water based drilling fluids.
1.3.6. Lubricating Materials
Lubricating materials (lubricants) are used mainly to reduce friction between the wellbore and the
drillstring. This will in turn reduce torque and drag which is essential in highly deviated and horizontal
wells. Lubricants include: oil (diesel, mineral, animal, or vegetable oils), surfactants, graphite, asphalt,
gilsonite, polymer and glass beads.
1.3.7. Shale Stabilizing Materials
Shale stabilization is achieved by the prevention of water contacting the open shale section. This
can occur when the additive encapsulates the shale or when a specific ion such as potassium actually
enters the exposed shale section and neutralizes the charge on it. Shale stabilizers include: high molecular
weight polymers (PHPA), hydrocarbons, potassium and calcium salts (e.g. KCl) and glycols.
1.3.8. Lost Circulation Control Materials
There are numerous types of lost circulation material (LCM) available which can be used
according to the type of losses experienced. Typical LCM materials used are mentioned in Appendix–II
(Table A.3).
1.4. PROPERTIES OF DRILLING MUD
The basic properties of drilling mud are discussed here to help us estimate the importance of each
factor that may affect the well operation and cost of the hydrocarbon exploration activity (Darley and
George, 1988).
Chapter No.1 Drilling Fluids and Technologies
9
1.4.1. Density Of Mud
The function of mud density includes providing hydrostatic pressure to prevent formation fluids
from entering into the wellbore. Density also helps to balance the pore pressure, and the pore pressure
depends on the depth of the porous formation, the density of the formation fluids, and the geological
conditions. The hydrostatic pressure gradient of formation fluids varies from 9.8kPa/m to over 12kPa/m
depending on the salinity of the water. The densities of common mud components are mentioned in
Appendix–III (Table A.4). Also, the density provides additional wellbore support to maintain borehole
stability. The buoyant effect of the mud on the drill cuttings increases with its density, helping transport
them in the annulus, but retarding settling at the surface. For drilling mud, normally equivalent circulating
drilling is used, and is given as;
(1)
Where;
ECD is Equivalent Circulating Density (kg/m3).
MW is Fluid Mud Density (kg/m3).
PAPL is Annular Pressure Loss (kPa)
TVD is True Vertical Depth (m).
1.4.2. Flow Properties
The flow properties of the drilling fluid play a vital role in the success of the drilling operation.
These properties are primarily responsible for removal of the drill cuttings, but influence drilling progress
in many other ways. Unsatisfactory flow properties can lead to such serious problems as bridging the
hole, filling the bottom of the hole with drill cuttings, reduced penetration rate, hole enlargement, stuck
pipe, loss of circulation, and even a blowout.
Drilling hydraulics optimization is key issue in cuttings transport, bottom hole cleaning and also effective
in improved rate of penetration. The flow behavior of fluids is governed by flow regimes, the
relationships between pressure and velocity. There are two such flow regimes, namely laminar flow,
which prevails at low flow velocities and is a function of the viscous properties of the fluid, and turbulent
flow, which is governed by the inertial properties of the fluid and is only indirectly influenced by the
viscosity. Pressure increases with velocity increase much more rapidly when flow is turbulent than when
it is laminar.
TVD
PMWECD APL×+= 100

Chapter No.1 Drilling Fluids and Technologies
10
1.4.3. Viscosity
The viscosity of the liquid phase is increased by addition of any soluble material. Although
calculated from measurements at relatively low shear rates, the plastic viscosity is an indicator of high
shear rate viscosities. Consequently, it tells us something about the expected behavior of the mud at the
bit. Plastic Viscosity represents the viscosity of a mud when extrapolated to infinite shear rate on the basis
of the mathematics of the Bingham plastic model.
Many of the water soluble polymers used for fluid loss control are quite effective in increasing the plastic
viscosity. Both salt water based muds and oil based muds tend to have high plastic viscosities. The high
shear rate viscosity must be reduced. To accomplish this, we should minimize the plastic viscosity. A
decrease in plastic viscosity should signal a corresponding decrease in the viscosity at the bit, resulting in
higher penetration rate. As long as these particles are large and relatively unhydrated, their effect on
viscosity is small. Minimum plastic viscosities can be achieved only to the degree that the mud is kept
free of drilled solids. The guideline for plastic viscosity of water base muds at various mud weights is
given in Appendix–III (Table A.5).
1.4.4. pH
Most of the additives / systems have their ideal pH for optimum performance. The optimum
control of some mud systems is based on pH, as is the detection and treatment of certain contaminants. A
mud made with bentonite and fresh water, for example, will have a pH of 8 to 9. Contamination by
cement raises the pH from 10 to 11, and treatment with an acidic poly phosphate will bring the pH back to
8 or 9, other reasons for pH control include maintenance of lime treated mud’s, mitigation of corrosion,
and effective use of thinners.
1.4.5. Alkalinity
Alkalinity measurements are made to determine the amount of caustic and / or lime in treated
muds. Measurements of the alkalinity of water samples, and of filtrates of very lightly chemically treated
muds, can be used to calculate the concentration of hydroxyl (OH-), carbonate (CO32-), and bicarbonate
(HCO3-) ions in solution.
1.4.6. Cation Exchange Capacity
The methylene blue test indicates the amount of active clay in a mud system or a sample of shale.
The test measures the total cation exchange capacity of the clays present and is useful in conjunction with
the determination of solids content as indication for colloidal character of clay minerals.

Chapter No.1 Drilling Fluids and Technologies
11
1.5. SELECTION OF DRILLING FLUID
Selection of the best drilling fluid to meet anticipated conditions will minimize well costs and
reduce the risk of catastrophes such as stuck drill pipe, loss of circulation, and gas kicks. Consideration
must be given to obtaining adequate formation evaluation (Darley and George, 1988).
The following information should be collected and used when selecting drilling fluid or fluids for a
particular well;
• Geological plot of the prognosis lithology.
• Offset well data (drilling completion reports, mud recaps, mud logs etc.) from similar wells in the
area to help establish successful mud systems, problematic formations, and potential hazards,
estimated drilling time, etc.
• Geomechanical aspects like pore pressure or fracture gradient plots to establish the minimum or
maximum mud weights to be used on the whole well (operating window).
• Casing design programme and casing seat depths. The casing scheme effectively divides the well
into separate sections; each hole section may have similar formation types, similar pore pressure
regimes or similar reactivity to mud.
• Meeting the environmental regulations, and restrictions that might be enforced in the area i.e.
government legislation in the area, environmental concerns, etc.
Selection characteristics of different drilling fluids are briefly mentioned in Annexure–III (Table A.6).
1.6. MAINTENANCE OF DRILLING MUD
The main purpose of drilling mud treatment systems is to remove the suspended solids (drill
cuttings) entrained in mud. High solids or sand content increases the fluid density, leading to following
problems:
• High fluid density causes pressure in the formation of the borehole. This pressure drives the drilling
fluid through the filter cake into the formation, leads to excessive drilling fluid loss to the
formation, and extends well development time required to remove the mud from the formation.
• As the fluid density increases, the pressure required to move the fluid down/up the borehole also
increases, leading to high mud pump pressure requirements.
• If the gravel pack is emplaced in the annulus through drilling fluid with a high sand content, the
fines will be entrained in the gravel pack leading to reduced well yields.
Chapter No.1 Drilling Fluids and Technologies
12
• High solids or sand content also leads to significant abrasion in the drill tooling as the fine particles
are recirculating through the mud pump and drill string. Washed out drill strings and mud pump
valves, along with leaking swivel packing, are caused by the recirculation of sand through system.
• With the increase of solid contents, the drilling rate decreases. The excess solids leads to increased
rheology pressure losses (high pumping pressure), potential formation fracture (induced fractures),
resulting in formation damage.
• Chemical treatment is also performed to control the major drilling fluid properties within required
range.
1.7. SOLIDS CONTROL OR REMOVAL TECHNIQUES
The solids control is accomplished by a series of weirs and settling pits that allowed the solids to
naturally settle out by using gravity (James and Others, 1999). This was the first solids control technique
ever used. Today’s drilling rigs are equipped with special mechanical solids control equipment, like; shale
shakers (sand trap), hydro cyclones and centrifuges to remove fine drilled solids. The clean mud then
flowed into a suction pit to be re pumped down hole. Few of the major benefits of low solids in drilling
mud are;
• Increased drilling penetration rate,
• Increase bit or back reamer life,
• Reduce triplex mud pump, mud motor & surface equipment maintenance cost, and
• Reduced clean up & haul off or disposal cost.
An improved solids control system processes the OBM or SBM contaminated cuttings discarded from the
primary and secondary shale shakers through a “cuttings dryer” (e.g., vertical or horizontal centrifuge,
squeeze press mud recovery unit, High G linear shaker). The cuttings from the cuttings dryer are
discharged and the recovered OBM or SBM is sent to the fines removal unit. This, consequently, will
reduce the pollutant loadings and the potential of the waste to cause anoxia (lack of oxygen) in the
receiving sediment. The most common methods used for controlling the solids in the drilling mud are;
• Mechanical treatment,
• Chemical treatment,
• Dilution of mud with water, or
• Discard mud & mix new mud.
Chapter No.1 Drilling Fluids and Technologies
13
1.7.1. Identification And Treatment Of Mud Contaminants
The most common chemical contaminants of water base muds are:
• Cement,
• Calcium or Magnesium,
• Salt,
• Carbonates and Bicarbonates.
All of these contaminants cause the mud to flocculate, resulting in increased yield point, gel strength, and
fluid loss. Since the physical effects on the mud are much the same, chemical analysis of the mud and
filtrate is necessary to identify which contaminant is present (James and Others, 1999).
1.7.2. Physical Properties Of Solids In Drilling Fluids
The types and quantities of solids (insoluble components) present in drilling mud systems play
major roles in the fluid’s density, viscosity, filter cake quality or filtration control, temperature stability
and other chemical and mechanical properties. Drilled solids, consisting of rock and low yielding clays,
are incorporated into the mud continuously while drilling. To a limited extent, they can be tolerated and
may even be beneficial.
Dispersion of clay bearing drilled solids creates highly charged colloidal particles (< 2mm) that generate
significant viscosity, particularly at low shear rates, which aids in suspension of all solids (ASME Shale
Shaker Committee, 2005). The classification of particles is mentioned in shown highlighted in Table 1.1.
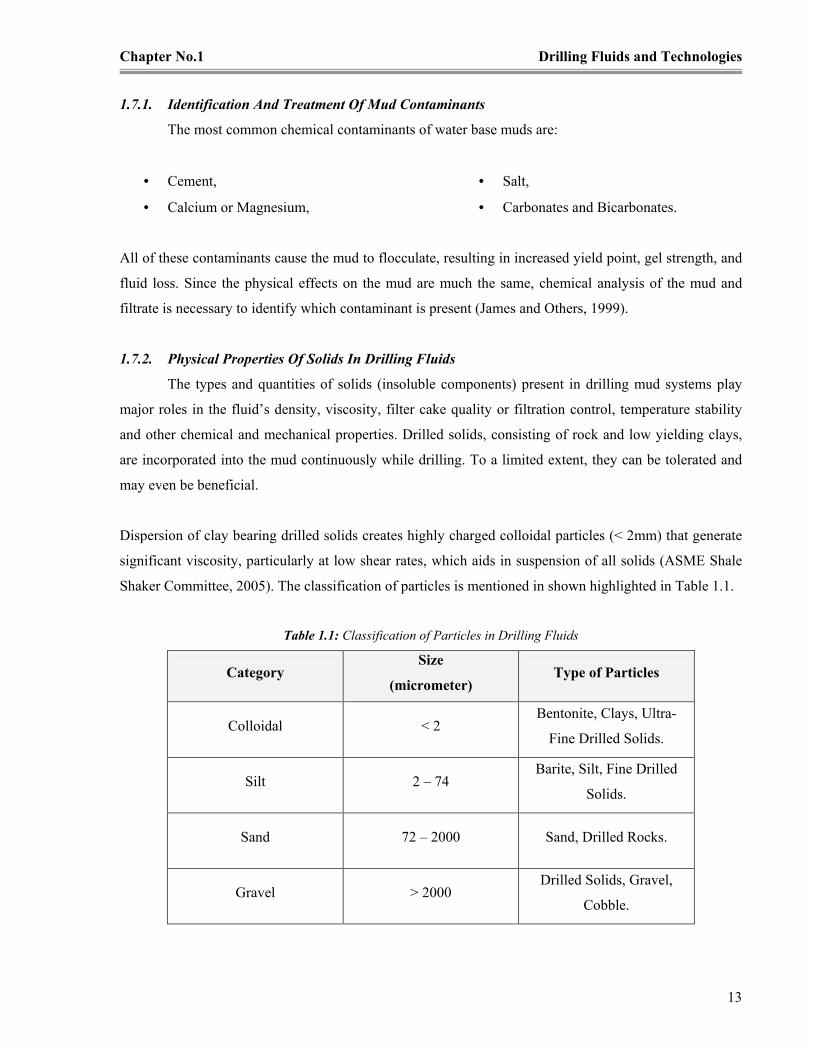
Table 1.1: Classification of Particles in Drilling Fluids
Category Size
(micrometer) Type of Particles
Colloidal < 2 Bentonite, Clays, Ultra-
Fine Drilled Solids.
Silt 2 – 74 Barite, Silt, Fine Drilled
Solids.
Sand 72 – 2000 Sand, Drilled Rocks.
Gravel > 2000 Drilled Solids, Gravel,
Cobble.

Chapter No.1 Drilling Fluids and Technologies
14
1.7.3. Separation Of Drilled Solids From Drilling Fluids
Different mud densities require different strategies to maintain the concentration of drilled solids
within an acceptable range (ASME Shale Shaker Committee, 2005). Whereas, low mud densities may
require only mud dilution in combination with a simple mechanical separator, high mud densities may
require a more complex strategy, like:
• Chemical treatment to limit dispersion of the drilled solids (e.g., use of a shale inhibitor or
deflocculant like lignosulfonate),
• More frequent dilution of the drilling fluid with base fluid, and
• More complex solids removal equipment, such as mud cleaners and centrifuges.
In either case, solids removal is one of the most important aspects of mud system control, since it has a
direct bearing on drilling efficiency and represents an opportunity to reduce overall drilling costs. Solids
removal on the rig is accomplished by one or more of the following techniques:
• Screening: Shale shakers, gumbo removal devices.
Figure 1.1: Shale Shaker (Left) and Shale Shaker in Operation (Right)
• Hydrocycloning: Desanders, desilters, mud-cleaners.
Figure 1.2: Desander (Left) and Multistage Mud cleaner (Right)

Chapter No.1 Drilling Fluids and Technologies
15
• Centrifugation: Scalping and decanting centrifuges.
Figure 1.3: Centrifuge (Left) and Centrifuge in Operation (Right)
Often these are accomplished using separate devices, but in most cases these processes are combined, as
in the case of the mud cleaner, which is a bank of hydrocyclones mounted over a vibrating screen.
Another important hybrid device is the cuttings dryer (also called a rotating shaker), which is a centrifuge
fitted with a cone shaped shaker; this apparatus is used to separate cuttings from OBM or SBM and strip
most of the mud from the cuttings’ surfaces before disposal. The general arrangement of solid liquid
separation equipments and equipments use for different type of drilling fluids, are highlighted in
Appendix–IV.
Additional devices can help to enhance solids removal efficiency. For example, a vacuum or atmospheric
degasser is sometimes installed (before any centrifugal pumps, typically between the shakers and
desanders) to remove entrained air that can cause pump cavitation and reduction in mud density.
Dewatering units usually employ a flocculation tank with a polymer to flocculate all solids and settling
tanks to generate solids free liquid that is returned to the active system. Classification of solid liquid
separation equipment is shown below;
Figure 1.4: Classification of Solid Liquid Separation

Chapter No.1 Drilling Fluids and Technologies
16
With the advent of closed loop systems, dewatering of WBMs has received strong impetus, and it has
been found useful to add a dewatering unit downstream of a conventional solids control system. In a
typical closed loop system the cuttings from the shale shakers and hydro cyclones are collected in a sealed
concrete pit (removed by excavator for disposal). Excess of drilling fluid is pumped into collector pits as
shown in figure 1.5, and processed by dewatering unit.
Figure 1.5: Sealed Concrete Pit (Left) and Collector Pits (Right)
The effluent from dewatering unit is clear water (or brine) and can be used for dilution or as make-up
water to prepare new fluid. In addition to waste minimization, the reduction of fresh-water consumption is
the major concern for dewatering.
Figure 1.6: Effluent Treated Water / Brine
1.7.4. Coagulation And Flocculation
Coagulation and flocculation are organic parts of chemically enhanced dewatering. The two
words are often used interchangeably because both processes lead to increases of the effective particle
size with the accompanying benefits of higher settling or flotation rates, higher permeability of filtration
cakes, or better particle retention in deep bed filters. There is, however, a subtle difference between
coagulation and flocculation.
Chapter No.1 Drilling Fluids and Technologies
17
Coagulation is a process which brings particles into contact to form agglomerates. The suspension is
destabilized by addition of inorganic chemicals such as hydrolysis coagulants like alum or ferric salts, or
lime, and the subsequent agglomeration can produce particles up to 1mm in size. Some of the coagulants
simply neutralize the surface charges on the primary particles, others suppress the electric double layer
(electrolytes such as NaCl, MgSO4) or some even combine with the particles through complex formation.
Flocculation uses flocculating agents, usually in the form of natural or synthetic poly electrolytes of high
molecular weight, which interconnect and enmesh the colloidal particles into giant flocs up to 10mm in
size. Flocculating agents have undergone very fast development in the past three decades and this has led
to a remarkable improvement in the use and performance of many types of separation equipment. As such
agents are relatively expensive the correct dosage is critical and has to be optimized.
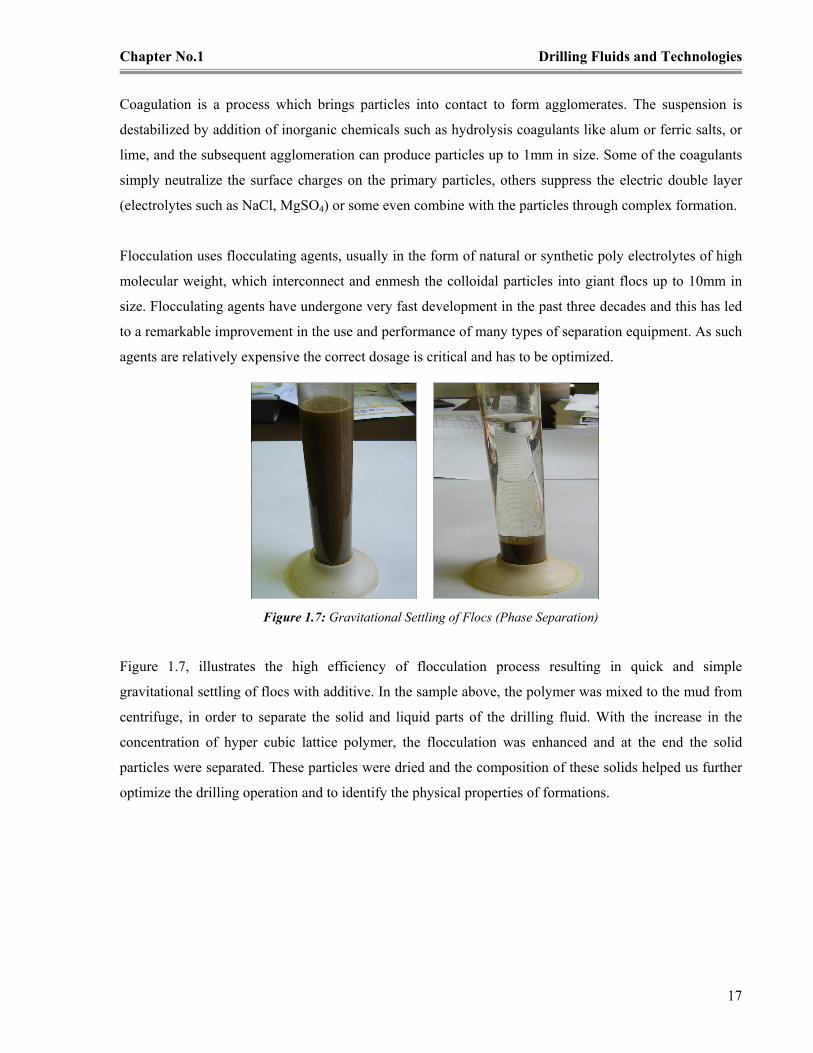
Figure 1.7: Gravitational Settling of Flocs (Phase Separation)
Figure 1.7, illustrates the high efficiency of flocculation process resulting in quick and simple
gravitational settling of flocs with additive. In the sample above, the polymer was mixed to the mud from
centrifuge, in order to separate the solid and liquid parts of the drilling fluid. With the increase in the
concentration of hyper cubic lattice polymer, the flocculation was enhanced and at the end the solid
particles were separated. These particles were dried and the composition of these solids helped us further
optimize the drilling operation and to identify the physical properties of formations.

Chapter No. 2 Drilling Fluids Related Environmental Issues and Regulations
18
CHAPTER No. 2: DRILLING FLUIDS RELATED ENVIRONMENTAL ISSUES AND
REGULATIONS
2.0. INTRODUCTION
Drilling waste consists of waste drilling fluid, drilled cuttings with associated drilling fluid, and,
to a lesser extent, miscellaneous fluids such as excess cement, spacers, and a variety of other fluids. The
amount of drilling waste depends on a number of factors. These include hole size, solids control
efficiency, the ability of the drilling fluid to tolerate solids, the ability of the drilling fluid to inhibit
degradation or dispersion of drilled cuttings, and the amount of drilling fluid retained on the drilled
cuttings. During drilling operations, two major drilling wastes are generated:
• Cuttings (rock mass)
• Drilling fluids
There are essentially three main categories of drilling fluids: oil based fluids (OBF’s), synthetic based
fluids (SBF’s) and water based fluids (WBF’s). OBF’s have been traditionally used for their high
performance characteristics but tend to have a poor environmental performance in terms of their
ecotoxicity and their tendency to persist in cuttings piles.
More recently, SBF’s have been developed to provide similar drilling performance as OBF’s but with
improved ecotoxicity and biodegradation characteristics. WBF’s whilst generally not delivering optimal
performance in more challenging drilling conditions, provide the best environmental performance in
terms of their non toxic nature and enhanced ability to biodegrade rapidly. The oil and gas exploration
uses three types of drilling fluids, all with different technical and environmental properties. The
authorities’ requirements related to the disposal of waste are linked to the following properties:
• Oil based drilling fluids (OBM): Have in most cases the best technical properties. The authorities
do not permit the discharge of OBM and cuttings drilled with oil based drilling fluids. Cuttings
and fluids are taken to shore.
• Water based drilling fluids (WBM): The authorities permit the discharge of used drilling fluid
and cuttings upon application.
• Synthetic drilling fluids (SBM): Based on ether, ester or olefin. They have technical properties
that are similar to oil based drilling fluids in many ways. Discharge of used SBM is not permitted,
but the discharge of cuttings may be permitted upon application.
Chapter No. 2 Drilling Fluids Related Environmental Issues and Regulations
19
2.1. NON WATER QUALITY ENVIRONMENTAL IMPACTS OF MUDS
Non water quality impacts are environmental and safety impacts associated with use and disposal
for different mud types. Impacts include air pollution due to transportation, energy use during
transportation, disposal site factors, potential threat to ground water and worker other impacts from use,
loading and unloading.
Each mud type causes or mitigates a range of indirect environmental impacts associated with its use and
disposal. Indirect impacts appear to be most severe with OBMs and appear to be favorably mitigated by
SBMs. WBMs’ indirect impacts are neutral, while most WBMs are discharged onsite, significant volumes
of WBM waste are still disposed offsite.
Major indirect impacts of offsite waste disposal result from use of OBMs and, to a far lesser extent,
WBMs. OBM disposal may place toxic hydrocarbons and priority pollutants in landfills, where they can
potentially leach into ground water or otherwise leak.
Another significant indirect impact from such disposal is the air pollution generated by the transportation
of large volumes of OBM waste to shore. Increased use of horizontal drilling techniques is another new
practice facilitated with SBMs or OBMs that has notable pollution prevention / reduction impacts.
2.2. ENVIRONMENTAL REGULATIONS AND DIRECTIVES
Special environmental standards, regulations and directives are available for the management,
disposal or alternate use of hydrocarbon exploration and production wastes, specifically drilling muds and
cuttings. Maze of U.S. regulations and regulatory agencies coupled with uncertainty in interpretation of
environmental data and an evolving system of disposal engineering will require industry action to monitor
the area and derive a solid engineering basis for disposal of spent drilling fluid and define the regulations
for disposal of drilling wastes. However, these regulations vary with the region and geographic
limitations. But all the regulations are meant to provide the users with directions for reduction of
environmental pollution due to hydrocarbon exploration and production wastes. Few of the most common
standards include;
• EPA Regulations (U.S. Environmental Protection Agency);
• BLM Regulations (U.S. Bureau of Land Management);
• FEPA (Food and Environmental Protection Act, UK);
• OCR (Offshore Chemical Regulations, UK);

Chapter No. 2 Drilling Fluids Related Environmental Issues and Regulations
20
• Offshore Petroleum Activities (Oil Pollution Prevention and Control) Regulations, UK;
• OSPAR Decision 2000/3 on the Use of Organic phase Drilling Fluids (OPF) and the Discharge of
OPF Contaminated Cuttings;
• Convention on the Prevention of Marine Pollution by Dumping of Wastes and Other Matter 1972
(London Dumping Convention);
• EU Directives (Directive 2006/21/EC of the European Parliament and of the Council on the
management of waste from extractive industries and amending Directive 2004/35/EC);
• EU Directive (Directive 2000/60/EC) – EU Water Framework Directive.
All the regulations have different limitations, however, have almost same standard, testing procedures and
waste disposal limitations, but with substantial minimization in the waste that user deposit into the
environment. So that, the impact of drilling waste must not create an environmental setback, in order to
achieve a sustainable environmental policies.
2.3. ACCEPTABLE DISPOSAL OPTIONS FOR DRILLING MUD
As per different environmental regulations and directives, a summarized form of the disposal
options for hydrocarbon drilling wastes (solids and liquids) is presented in figure 2.1.
Figure 2.1: Disposal Options for Drilling Waste (Solids and Fluids)
The recovered drilling fluid is screened / centrifuged to remove the drill cuttings before being returned to
a storage tank for drilling fluid for later reuse. Upon completion of the drilling of a well, the practice in
the past has been to impound the used drilling fluids in "reserve pits", in on shore locations. The drilling
fluids resulting from the drilling of a number of wells may be placed in the same reserve pits. Hence,
reserve pits may be expected to contain different types of drilling muds, along with cuttings. The contents
of the reserve pits are collectively called "oil field wastes". There have been numerous instances where

Chapter No. 2 Drilling Fluids Related Environmental Issues and Regulations
21
the reserve pits have failed to contain the oil field wastes, with resulting contamination of aquifers, and
other water and land areas.
Government regulations require proper disposal practice with regard to the oil field wastes. The major
polluting constituents in the oil field wastes are hydrocarbons, heavy metals and free caustic. In areas
where regulations are strict, the herein disclosed methods and apparatus will be valuable for individuals or
companies involved in the disposal of the aforementioned oil field wastes. The wastes are separated into
solid and drilling mud slurry components by screening or centrifuging.
The solid components from OBM or SBM are heated to dry and incinerate them. Solids from the WBM
slurries are separated by pH adjustment and use of flocculating or coagulating agents (dewatering). Liquid
components separated from the solids are separated into petroleum and aqueous components. The
petroleum components may be used, if suitable, in preparation of drilling fluids, or may be further
separated or refined for recovery of petroleum constituents (Alberta Energy And Utilities Board, 1996).
2.4. REGULATION AND AUTHORIZATION OF DISCHARGES
The oil and gas waste regulations (OGWR) of United States of America authorize waste
discharges to the environment from upstream oil and gas facilities (Ministry of Environment USA, 2007).
This authorization reduces or eliminates the need for site specific waste discharge approvals or permits
for facilities to which the OGWR applies. The OGWR applies to most upstream oil and gas facilities,
except for larger facilities such as sour gas plants or large compressor stations. The OGWR includes
requirements for the quality of discharges, discharge procedures, ambient air quality resulting from these
discharges, submission of information to the US Ministry of Environment, (MoE) and compliance with
other regulations and guidance.
Figure 2.2: Drill cuttings from Shale shaker
Figure 2.3: Drilling mud slurry from Shale shaker

Chapter No. 2 Drilling Fluids Related Environmental Issues and Regulations
22
The US Environmental Management Act, (EMA) expressly prohibits the discharge of waste to the
environment in a manner that causes pollution. The US Waste Discharge Regulation, (WDR) defines
prescribed industries, trades, businesses, operations, and activities. The upstream oil and gas industry and
the pipeline industry are both “captured” as prescribed activities in the WDR. This means that, for the
vast majority of activities associated with oil and gas operations, some form of authorization under EMA
is required to discharge wastes.
The US Hazardous Waste Regulation (HWR) defines “hazardous waste” and places controls and
restrictions on handling, storing, transporting and disposing of hazardous waste. Authorizations under the
OGWR are subject to the provisions of the HWR. Hazardous waste from the upstream oil and gas
industry may include, but is not limited to, OBM contaminated drill cuttings. It is the operator’s
responsibility to characterize wastes accurately and to handle the waste in accordance with the
regulations.
The US Contaminated Sites Regulation (CSR) defines contaminated sites and contains standards for
contaminants in soil, sediment and water. If these standards are exceeded, the resulting site will be
classified as a contaminated site. The discharge of water based drilling waste must be managed in
accordance with the regulations, which requires that the final concentration of substances in the soil-water
mixture comply with all relevant standards as set out in the Contaminated Sites Regulation. The OGWR
does not authorize discharges to the environment from spills. The Spill Reporting Regulation defines
“spill” by the type and quantity of release, and defines which spills must be reported to the government.
2.5. API’S MANAGEMENT PRACTICE FOR DRILLING POLLUTION PREVENTION
Both management commitment and comprehensive planning are critical to a successful pollution
prevention program (American Petroleum Institute, 1997). Steps to consider in developing and operating
such a program include the following:
•••• Providing management support for ongoing pollution prevention activities through appropriate
policies, actions, communications, and resource commitments.
•••• Developing and implementing a program to improve prevention and early detection and reduce
impacts of spills of crude oil and petroleum products and other accidental releases from
operations.
•••• Developing an inventory of significant releases to air, water, and land; identifying their sources;
and evaluating their impact on human health and the environment.
Chapter No. 2 Drilling Fluids Related Environmental Issues and Regulations
23
•••• Periodically reviewing and identifying pollution prevention options and opportunities, developing
approaches for reducing releases, and setting goals and schedules for reducing releases and
measuring progress; consider the issues of community concerns, technology and economics, and
impact on human health and the environment.
•••• Including pollution prevention objectives in research efforts and in the design of new or modified
operations, processes, and products.
2.6. US EPA HIERARCHY FOR WASTE MANAGEMENT
United States Environmental Protection Agency (EPA) has developed the following hierarchy of
waste management methods to guide generations toward waste minimization. The four waste
management hierarchy steps, in decreasing order of preference are as follows:
1. Source Reduction - reduce the amount of waste at the source through the following:
• Material elimination,
• Inventory management,
• Material substitution,
• Process modification,
• Improved housekeeping,
• Return of unused material to supplier.
2. Recycling or Reuse - reuse and recycle material for the Original or other purpose, like; materials
recovery or energy production; this may occur onsite or offsite, through following methods:
• Reuse,
• Reprocess,
• Reclaim,
• Use as fuel,
• Injection for enhanced recovery,
• Road spreading.
3. Treatment - destroy, detoxify, and neutralize wastes into less harmful substances through the
following methods:
• Filtration,
• Chemical treatment,
• Biological treatment,
• Thermal treatment,
• Chemical stabilization,
• Incineration,
• Landfarming,
• Landspreading.
4. Disposal - dispose of wastes through the following methods:
• Landfills,
• Solidification,
• Burial,
• Underground injection.

Chapter No. 2 Drilling Fluids Related Environmental Issues and Regulations
24
Choosing feasible source reduction and recycling options (i.e., waste minimization) is a smart business
decision. Waste minimization is part of the concept of "Waste Management Hierarchy." The Waste
Management Hierarchy sets out a preferred sequence of waste management options. The first and most
preferred option is source reduction. Source reduction is any activity that reduces or eliminates either the
generation of waste at the source or the release of a contaminant from a process.
The next preferred option is recycling. Recycling is the reclamation of the useful constituents of a waste
for reuse, or the use or reuse of a waste as a substitute for a commercial feedstock or as a feedstock in an
industrial process. Together, source reduction and recycling comprise waste minimization. The last two
options, and least preferred, of the hierarchy are treatment and disposal.
Table 2.1: Drilling Waste Management Hierarchy
Tier 1
Waste Minimization
Tier 2
Reuse or Recycle
Tier 3
Treatment or Disposal
Material substitution. Recycle and reuse oil based and
synthetic based muds.
Land treatment.
Directional drilling.
Road spreading drill cuttings on
lease roads or commercial
roads.
Bioremediation.
Coiled tubing drilling. Evaporation.
Physical separation of drill
cuttings and mud. Burial (pits, landfills).
Closed loop mud systems. Offshore discharge to the
ocean.
Underground injection
(injection below fracture
pressure, slurry injection above
fracture pressure, salt cavern
disposal).
Incineration.
Mud systems designed with
small volumes.
Low temperature thermal
desorption (LTTD) to recover
muds and use treated cuttings
(e.g., concrete aggregate,
construction backfill, or landfill
cover).
Offsite disposal

Chapter No. 2 Drilling Fluids Related Environmental Issues and Regulations
25
Figure 2.4: Waste Hierarchy policy (used by many Operator)
The lists of US EPA, exempt and non - exempt E&P wastes are given in Appendix–V.
2.7. CURRENT ENVIRONMENTAL REGULATIONS (DOMESTIC)
In Hungary the Mining and Geological Bureau of Hungary and its regional organizations, the
district mining inspectorates, are responsible for the public administration tasks concerning mining. The
only regulation regarding the mining or relevant activities waste is depicted in 219/2004. Government
decree groundwater protection and mining waste law, that clearly mentions the protection of water
sources of Hungary, from contaminants generated from extraction industry. No specific law, mentioning
the oil and gas exploration wastes is implemented, however, being in EU, the common directives and
regulations are well implemented in the state. Few of the regulations or directives include;
• EU Directives (Directive 2006/21/EC of the European Parliament and of the Council on the
management of waste from extractive industries and amending Directive 2004/35/EC).
• EU Directive (Directive 2000/60/EC) – EU Water Framework Directive.
• Hungary 219/2004. (VII. 21) Government Decree groundwater protection.
2.7.1. Introduction And Relevant Clauses Of EU Directive (2006/21/EC)
The Communication of the Commission entitled “Safe operation of mining activities: a follow up
to recent mining accidents” sets out as one of its priority actions an initiative to regulate the management
of waste from the extractive industries (European Commission of the European parliament and of the
Council, 2006). This action is designed to complement initiatives pursuant to Directive 2003/105/EC of
the European Parliament and of the Council of 16 December 2003 amending Council Directive 96/82/EC
on the control of major accident hazards involving dangerous substances as well as the production of a
best available technique document covering the management of waste rock and tailings from mining
activities under the auspices of Council Directive 96/61/EC of 24 September 1996 concerning integrated

Chapter No. 2 Drilling Fluids Related Environmental Issues and Regulations
26
pollution prevention and control. In its Resolution of 5 July 2001 concerning that Communication, the
European Parliament strongly supported the need for a Directive on waste from the extractive industries.
Decision No. 1600/2002/EC of the European Parliament and of the Council of 22 July 2002 laying down
the Sixth Community Environment Action Programme sets as the objective for wastes that are still
generated that the level of their hazardousness should be reduced and that they should present as little risk
as possible, that preference should be given to recovery and especially to recycling, that the quantity of
waste for disposal should be minimized and should be safely disposed of, and that waste intended for
disposal should be treated as closely as possible to the place of its generation to the extent that this does
not lead to a decrease in the efficiency of waste treatment operations.
Accordingly, this Directive should cover the management of waste from land based extractive industries,
that is to say, the waste arising from the prospecting, extraction (including the pre production
development stage), treatment and storage of mineral resources and from the working of quarries.
However, such management should reflect the principles and priorities identified in Directive
75/442/EEC, which, continues to apply to any aspects of the management of waste from the extractive
industries which are not covered by this Directive.
Member States should ensure that operators engaged in the extractive industry take all necessary
measures to prevent or reduce as far as possible any negative effects, actual or potential, on the
environment or on human health which are brought about as a result of the management of waste from the
extractive industries. Member States should ensure that operators in the extractive industry draw up
appropriate waste management plans for the prevention or minimization, treatment, recovery and disposal
of extractive waste. Such plans should be structured in such a way as to ensure appropriate planning of
waste management options with a view to minimizing waste generation and its harmfulness, and
encouraging waste recovery. Moreover, waste from the extractive industries should be characterized with
respect to its composition in order to ensure that, such waste reacts only in predictable ways.
Member States should require operators of the extractive industries to apply monitoring and management
controls in order to prevent water and soil pollution and to identify any adverse effect that their waste
facilities may have on the environment or on human health. In addition, for the purposes of minimizing
water pollution, the discharge of waste into any receiving body of water should comply with Directive
2000/60/EC of the European Parliament and of the Council of 23 October 2000, establishing a framework
for Community action in the field of water policy.

Chapter No. 2 Drilling Fluids Related Environmental Issues and Regulations
27
2.7.2. General Requirements
1. EU Member States shall take the necessary measures to ensure that extractive waste is managed
without endangering human health and without using processes or methods which could harm the
environment, and in particular without risk to water, air, soil and fauna and flora, without causing
a nuisance through noise or odors and without adversely affecting the landscape or places of
special interest. Member States shall also take the necessary measures to prohibit the
abandonment, dumping or uncontrolled depositing of extractive waste.
2. EU Member States shall ensure that the operator takes all measures necessary to prevent or
reduce as far as possible any adverse effects on the environment and human health brought about
as a result of the management of extractive waste. This includes the management of any waste
facility, also after its closure, and the prevention of major accidents involving that facility and the
limiting of their consequences for the environment and human health.
3. The measures shall be based on the best available techniques, without prescribing the use of any
technique or specific technology, but taking into account the technical characteristics of the waste
facility, its geographical location and the local environmental conditions.
2.7.3. Hungary - 219/2004. (VII. 21) Government Decree Groundwater Protection
Article 11:
1) Disposal of pollutant is prohibited in the Deep subsurface, or in any way except for (2) is;
2) The underground water, land (3) of the conditions are met, a natural reasons are permanently
unsuitable for other geological formations, and the transmission through which the pollutants are
considered closed storage of hydrocarbons, and in which the hydrocarbon extracted, or extracted:
a) A(1) number of pollutants in accordance with Annex K1 has been re water, which the
prospecting, exploration, exploitation activities are derived from,
b) the composition of natural water injection into hydrocarbon extraction help,
c) Natural gas or liquefied natural gas storage injection into view the groundwater quality of all
existing or future risk of exclusion 13 Permitted fewer than 11.
3) A(2) of the activity license may be granted if, based on a complex evaluation studies also
demonstrated that the reinjection, injection:
a) The activity of and does not include activities other than those from the material, and
b) Groundwater pollution by applying the best available technology, and
c) Does not compromise the environmental factors - particularly the groundwater - quantity and
quality conditions, environmental objectives are met, and
d) a), b) and c) are satisfied, in control.

Chapter No. 2 Drilling Fluids Related Environmental Issues and Regulations
28
The regulation in Hungarian language is presented in Appendix–VI.
Summarizing, the specific regulations or directives for petroleum industry waste management are not
developed in EU as well as in Hungary. Every EU country follows the Directive 2006/21/EC for mining
and extraction waste, along with some of the national (or locally in each country) regulations for
environmental management. However, the combine waste management directives and regulations for
extraction industry is implemented.
Hungary, have the high geothermal gradient and, because of this, most of the tourist visits Hungary for
the thermal baths and hot springs. This is one of the main reasons that the ministry of environment is
more concern with the preservation of Hungarian geothermal resources (ground water). So, the disposal
of drilling waste is not allowed in the sub surface. However, the directives may be regulated, if the
geological conditions are satisfying the criteria for assurance of no contamination flow, or ensuring that
the contaminant will never come in contact with fresh water sources or on soil, to have any kind of
adverse impact on ecological system. Hungary has vast natural gas resources and most of the sites (wells)
after exploration are plugged or the abandoned wells are normally used for storage of natural gas for
strategic purposes. So, it’s quite evident from geological aspects that the same formations, which are
packed enough to retain the gas due to pore pressures and barrier layers, can also be used for disposal of
drilling wastes specially drilling fluids.
However, the extraction industry waste regulations (Directive 2006/21/EC) or water framework
(Directive 2000/60/EC) doesn’t describe the boundaries and limits for hydrocarbon exploration and
production waste management. A separate directive or regulation for hydrocarbon industry waste must be
formulated, so that the management of drilling fluids and other relevant waste must be optimized, under
the light of EU directives and National environmental policies.
In USA, the disposal of fluid injection is permitted in the productive and non productive reservoirs, and
which is completely regulated by the environmental authorities. However, each oil and gas exploration
company has its own environmental policy that also abides with the national drilling waste (liquids)
management regulations.

Chapter No. 3 Drilling Waste (Solid & Liquid) Reduction Techniques
29
CHAPTER No. 3: DRILLING WASTE (SOLID&LIQUID) REDUCTION TECHNIQUES
3.0. INTRODUCTION
Drilling wastes are the second largest volume of waste, behind produced water, generated by the
petroleum industry during exploration and production activity. Operators have employed a variety of
methods for managing these drilling wastes depending on what state and federal regulations allow and
how costly those options are for the well in question. Onshore operations have a wider range of options
than offshore operations (ASME Shale Shaker Committee, 2005). These potentially include
landspreading and landfarming, dewatering and burial onsite, underground injection, incinerating and
other thermal treatment, bioremediation and composting and reuse and recycling. Some of the best
drilling practices used for reduction in drilling waste (solids and fluids) are:
• Focuses on the principles of minimizing environmental impact,
• Enhances environmental performance and maintains market competitiveness,
• Enables proponents to plan and implements practical mitigation approaches that may reduce full
cycle costs of drilling waste management,
• Combines the use of industrial techniques and good housekeeping principles determined to be the
most effective and practical known means of reducing impacts on the environment, and
• Indicates a desired goal of performance and realistic ways to approach that goal.
Waste minimization has been proven to be an effective and beneficial operating procedure. You will find
that there are many economically and technically feasible waste minimization techniques that can be used
in drilling operations. In fact, many oil and gas operators have implemented waste minimization
techniques and have enjoyed benefits such as:
• Reduced operating and waste management costs; and increased revenue,
• Reduced regulatory compliance concerns,
• Reduced potential liability concerns, and
• Improved company image and public relations.
3.1. WASTE MINIMIZATION IN DRILLING OPERATIONS
There are many economically and technically feasible waste minimization techniques that may be
applied to drilling operations. An operator should consider all costs, including waste management and
disposal costs, when evaluating the feasibility of a waste minimization option. For example, a substitute

Chapter No. 3 Drilling Waste (Solid & Liquid) Reduction Techniques
30
product or chemical may cost more, but the savings in waste management and disposal costs will make
the substitution cost effective (Richard and Others. 2007). All of the efforts made for waste minimization
and safe disposal are based on long term liability.
3.1.1. Preplanning
The best place to start waste minimization efforts for a drilling operation is in the planning stages.
The drilling plan should be evaluated for potential waste generation and modified to take advantage of the
other source reduction and recycling options. A discussion of anticipated waste generation and
management should be an integral part of the pre spud meeting. This preplanning can make a significant
impact on the waste management requirements of the drilling operation.
3.1.2. Drill Site Construction and Rigging Up
A preplanning opportunity for a drilling operation is in the construction of the location and roads.
The drilling location and the associated roads should be planned so that they are constructed such that
stormwater runoff is diverted away from the location and that the location's stormwater runoff, which
may be contaminated, is collected. Construction of the location and roads should be planned so that
erosion is minimized. These steps will help minimize the volume of contaminated stormwater runoff to be
managed. Also, the location size should be only as large as absolutely necessary. Location construction
costs, including the cost of the disposition of cleared trees and vegetation, can be reduced. As well, the
image of such an operation, as perceived by the general public, is enhanced.
3.1.3. Pit Design
Another consideration in preplanning for a drilling operation is the design of the drilling fluid
circulating system, active and reserve pits. A major oil company has designed a V shaped pit that
provides advantages with respect to waste generation and operational costs (http://www.rrc.state.tx.us).
The open end of the "V" faces the drilling rig and the cross sectional view looks like a squared off funnel
(about 10 feet deep with the upper 5 feet having slanted walls to a width of about 20 feet).
This V shape design prevents mud from channeling from the discharge point to the suction point, as it
must travel the full length of the pit. Also, because the V shaped pit is long and narrow (each leg is about
110 feet long), it is easier to construct and line, if necessary. In an actual comparison to a conventional
reserve pit (for drilling similar wells using the same drilling rig), the company determined that pit
construction time was reduced by about 40%, water costs for the well were reduced by about 38%, and
the liner costs were reduced by about 43%.
Chapter No. 3 Drilling Waste (Solid & Liquid) Reduction Techniques
31
3.1.4. Product Substitution
Product substitution is one of the easiest and most effective source reduction opportunities.
Vendors are becoming more attuned to operators’ needs in this area and are focusing their efforts on
providing less toxic, yet effective, substitutes.
3.1.5. Using Muds And Additives With Lower Environmental Impacts
Drilling fluids or muds are made up of a base fluid (water, diesel or mineral oil, or a synthetic
compound), weighting agents (most frequently barite is used), bentonite clay to help remove cuttings
from the well and to form a filter cake on the walls of the hole, lignosulfonates and lignites to keep the
mud in a fluid state, and various additives that serve specific functions.
The used mud and cuttings from wells drilled with WBMs can be readily disposed of onsite at most
onshore locations. WBMs and cuttings can also be discharged from platforms in many offshore waters, as
long as they meet current effluent limitations guidelines (ELGs), discharge standards, and other permit
limits. Properly formulated WBMs do not present environmental problems for organisms living in the
water column or on the sea floor.
3.1.6. Drilling Fluid Systems
Improved design and operation of drilling fluid systems can also reduce the need for water. Waste
minimization opportunities, such as solids control and detailed system monitoring, have been proven
effective in reducing the amount of makeup water needed in a drilling operation. Many companies have
found that the substitution of low toxicity glycols, synthetic hydrocarbons, polymers, and esters for
conventional oil based drilling fluids is an effective drilling practice. The use of substitute drilling fluids
eliminates the generation of oil contaminated cuttings and other contamination by the oil based fluid (e.g.,
reserve pit and accidental releases). Drill site closure concerns are also reduced.
3.1.7. Drilling Fluid Additives
Many of the additives used in the past for drilling fluids have contained potential contaminants of
concern such as chromium in lignosulfonates. Also, barite weighting agents may contain concentrations
of heavy metals such as cadmium or mercury. The use of such additives has diminished.
3.1.8. Closed Loop Drilling Fluid Systems
Closed loop drilling fluid systems provides many advantages over conventional earthen reserve
pits. Closed loop drilling fluid systems use series equipment that contain drilling fluids and remove and

Chapter No. 3 Drilling Waste (Solid & Liquid) Reduction Techniques
32
collect cuttings. These systems enhance the operator's ability to monitor fluid characteristics. The result is
more efficient use of the drilling fluid, less drilling waste remaining at the end of the operation and lower
environmental impact.
3.1.9. Mud Runoff From Pulled Drill String
Running drill pipe into and out of the hole can contribute to the volume of waste in the reserve
pit. Lost drilling mud and the excess rigwash required for cleaning waste from the rig floor can be major
contributors and can be minimized. Devices are available that wipe clean the inner diameter of the drill
pipe as it is pulled so that the mud does not run onto the rig floor. Thus, drilling mud losses and the need
for rigwash are reduced.
3.1.10. Dewatering Waste Drilling Fluids
A user can reclaim water from waste drilling fluids by using mechanical and chemical separation
techniques. Large bowl centrifuges, hydrocyclones, and chemical flocculants/coagulants may be used to
dewater waste drilling fluids. The reclaimed water may then be reused, thus reducing the demand on, and
cost of, new water sources. Proper application of dewatering can result in a reduction of the volume of
drilling waste to be managed, thus saving waste management costs, easing site closure concerns and costs,
and reducing future potential liability concerns.
3.2. DRILLING PRACTICES THAT MINIMIZES GENERATION OF DRILLING WASTES
Traditional wells are not drilled from top to bottom at the same diameter but rather in a series of
progressively smaller diameter intervals. The top interval is drilled starting at the surface and has the
largest diameter hole. Drill bits are available in many sizes to drill different diameter holes. The hole
diameter can be 20" or larger for the uppermost sections of the well, followed by different combinations
of progressively smaller diameters. This type of wellbore construction allows the operator to use specific
drilling fluid systems in each section which can fit to actual wellbore conditions while meet with
environmental issues. Appendix–VII gives the overview to the waste calculation and well summary.
3.2.1. Low Impact Drilling Systems
The goal of the low impact drilling systems project is to reduce the environmental impact of rig
operations through integration of low impact site access and site operations. Environmentally Friendly
Drilling Systems (EFD), combines new low impact technologies that reduce the footprint of drilling
activities, integrates lightweight drilling rigs with reduced emission engine packages, addresses on site
waste management, optimizes the systems to fit the needs of specific development sites and provides

Chapter No. 3 Drilling Waste (Solid & Liquid) Reduction Techniques
33
stewardship of the environment. An environmental scorecard is being developed to determine the
tradeoffs associated with implementing low impact drilling technology in environmentally sensitive areas.
The scorecard will assess drilling operations and technologies with respect to air, site, and water and
biodiversity issues. Low environmental impact operations will reduce the environmental footprint of
operations by the adoption of new methods to use in, like;
• Getting materials to and from the rig site (site access),
• Reducing the rig site area,
• Using alternative drilling rig power management systems, and
• Adopting waste management at the rig site.
3.2.2. Extended Reach Drilling
In some situations, it is impractical or too expensive to drill wells from locations directly above
the target formations. For example, offshore drilling is much more expensive than drilling from a shore
based facility. If the target formation is a mile from shore, it may be much more effective to directionally
drill from a shore based location. Another option involves using a single platform or drilling pad to drill
multiple extended reach wells in different directions or to different depths, thereby minimizing the
number of surface well pad facilities, and also indeed, impacting on the waste generated and
transportation of waste to the disposal site.
3.2.3. Horizontal Drilling
Some productive formations are not thick but extend over a large lateral area. Prior to the advent
of directional drilling, such formations were either uneconomical or required multiple wells to recover the
resources. Modern technology allows wells to be drilled and completed in a relatively thin horizontal
layer. A single horizontal well can contact more of the resource and therefore takes the place of several
traditional vertical wells. Because the well bore interval from surface to producing formation is drilled
only once, a horizontal well generates less waste than several vertical wells.
3.2.4. Multiple Laterals
Some formations contain multiple, small, oil bearing zones or zones at several different depths.
To recover these resources using traditional vertical wells would require many wells. With directional
drilling technology, lateral well bores can be drilled off of a main vertical well bore to reach individual
targets. The main well bore is drilled only once, followed by drilling of several smaller diameter laterals.
The total volume of drilling waste is lower than would be generated if several full wells were drilled.
Chapter No. 3 Drilling Waste (Solid & Liquid) Reduction Techniques
34
3.2.5. Closer Spacing Of Successive Casing Strings
The sizes and ultimate volume of cuttings are a function of the type of drill bit and casing
diameters used. In the past, only standard sized bits and casings were available, such that each reduction
in hole size was quite dramatic. The number of available bit and casing size options has increased
dramatically in recent years. Now, adjacent casing strings can fit closer together, so the outer of the two
strings need not be so far from the inner string. This reduces the volume of cuttings generated.
3.2.6. Slimhole Drilling
Slimhole wells are defined as wells in which at least 90% of the hole has been drilled with a bit
six inches or less in diameter. Although slimhole technology has been available since the 1950s, it was
not commonly used because the small diameter well bore restricted stimulation, production, and other
downhole manipulations. Modern technology has overcome these disadvantages. In addition to generating
less drilling waste, slimhole rigs have a smaller footprint on a drilling pad.
3.2.7. Drilling Techniques That Use Less Drilling Fluid
Drilling fluids play an important role in traditional well drilling. However, the fluids become
contaminated by their use. At the end of the drilling job, they must be disposed of or processed for
recycling. For some types of wells, drilling can proceed with minimal or no drilling fluids. In selected
formations, wells can be drilled using air or other gases as the fluid that circulates through drilling system.
Four different types of pneumatic drilling: air dust drilling, air mist drilling, foam drilling, and aerated
mud drilling, may be optimized to meet the requirement. These all rely on gas or blends of gas and mud to
lift cuttings to the surface. Pneumatic drilling often does not require the large surface reserve pits
common to traditional drilling. Thus, this technique can be used in environmentally sensitive areas.
3.2.8. Drilling Fluid Systems That Generate Less Waste
The choice of drilling fluid can affect the overall volume of used muds and cuttings that is
generated. Synthetic based muds (SBMs) drill a cleaner hole than water based muds (WBMs), with less
sloughing, and generate a lower volume of drill cuttings. SBMs are recycled to the extent possible, while
used WBMs are generally discharged to the sea at offshore locations.
3.3. REUSE, RECYCLING, OR REDUCTION TECHNIQUES FOR DRILLING FLUIDS
The drilling mud contains basically solid components and liquid/dissolved components. After the
mechanical separation, the solid part is removed and liquid part that contains very small (< 2microns)
solid particles is again used by mixing in some additives to meet the desired pH, viscosity, gel strength,

Chapter No. 3 Drilling Waste (Solid & Liquid) Reduction Techniques
35
salt contents, density and other properties of the mud in circulation. After the continuous usage of this
fluid, a time comes, when this drilling fluid no more remains usable, or become enough costly to replace
with new one (Richard and Others, 2007).
3.3.1. Reuse Of Muds
Most water based muds (WBMs) are disposed of when the drilling job is finished. In contrast,
many oil based muds (OBMs) and synthetic based muds (SBMs) are recycled when possible. Sometimes
the physical and chemical properties of the used muds have degraded somewhat, and the muds must be
processed to rejuvenate the necessary properties.
In other cases, the muds have been degraded sufficiently that they cannot economically be reused as new
muds, and they must be put to a different type of reuse or final fate. There are many relatively simple
processes that can be used on drilling rigs to capture clean mud that would otherwise be discarded and
return it to use. Recovery of mud during tank cleaning may also allow the mud to be reused.
3.3.2. Recycling Of Drilling Fluids
Drilling fluids comprise the largest waste stream associated with a drilling operation. The cost of
closing a drilling site is increased if waste drilling fluid in a reserve pit must be dewatered and/or
stabilized prior to closure. A better alternative is to recycle or reuse the waste drilling fluid. If feasible,
reuse the waste drilling fluid in another drilling project.
One company has designed a multi well drilling project where the same drilling fluid was used for drilling
each successive well. The result was significant cost savings and greatly reduced waste management
concerns (http://www.rrc.state.tx.us). Another cost effective alternative for reuse of waste drilling fluid is
in plugging or spudding of other wells.

Chapter No. 4 Waste Disposal Issues
36
CHAPTER No. 4: WASTE DISPOSAL ISSUES
4.0. INTRODUCTION
The disposal of hydrocarbon exploration and production drilling muds is one of the major
environmental concerns, for any drilling company. There are many aspects on which the disposal of
drilling waste, which must be considered before drilling waste disposal (Alberta Environment, 2009). A
short summary of these disposal options can be given as flow diagram, shown in Appendix–VIII (Figure
A.1). Few of the aspect that must be taken into consideration prior to drilling waste disposal are;
•••• Location of drilling (offshore or onshore),
•••• Technical practicability (geotechnical aspects),
•••• Government regulations for environmental protection,
•••• Economical aspects or cost,
•••• Ecological and social impacts,
•••• Reputation of drilling company or contractor.
The disposal of drilling muds can be costly. An exemplary expensive disposal technique entails hauling
the drilling mud to a landfill. In a less expensive disposal technique, the drilling mud is injected into a
subterranean formation of an abandoned drilled well after the drilling operation is terminated. However,
because of increasing environmental awareness the latter technique may possess latent problems since the
injected drilling mud remains mobile in the subterranean formation and can potentially migrate to more
environmentally sensitive portions, e.g., potable water aquifers, of the formation.
4.1. TOXICITY ASSESSMENT
A bioassay based toxicity assessment is used as a screen for the presence of components toxic to
life forms which may not be detected by routine chemical analyses, but may be present in the drilling
waste. When toxic effects are identified, the source of the effects must be identified and managed as part
of the overall disposal plan. An evaluation of the potential toxicity is required for both the fluids and
solids or total waste components for all drilling wastes (Alberta Energy and Utilities Board, 1996).
By examining the mud products used and the operations at the well site, the user may determine that
toxicity testing is not required. If the toxicity of the waste cannot be reduced to satisfactory levels, the
drilling waste must be disposed at a licensed waste disposal facility. Additional laboratory testing may be
required to determine if field treatment methods will reduce toxicity. This may include an alternative

Chapter No. 4 Waste Disposal Issues
37
bioassay, aeration, pH adjustment, charcoal addition, flocculation, centrifugation, filtration, chemical
precipitation and chemical oxidation. Subsequent to any infield treatment, the waste must be analyzed to
confirm that the treated waste meets the toxicity requirements. A flow diagram for toxicity assessment is
shown in Appendix–VIII (Figure A.2).
Potential Toxicants: Nine groups of drilling mud additives have been identified as potential toxicants
• Bactericides,
• Corrosion inhibitors,
• Defoamers,
• Emulsifiers,
• Foaming agents,
• Lubricants,
• Polymer stabilizers,
• Shale inhibitors,
• Surfactants.
4.2. WASTE HANDLING PRIOR TO DISPOSAL
After the drilled cuttings are separated from the drilling fluid, the proper handling and
transportation system must be available to continue with the drilling process without hindrance from the
environmental regulations. Normally the liquid part of drilling mud is used again and again till it meets
the requirements of viscosity, density and yield point with additives (Alberta Energy and Utilities Board,
1996). The disposal may be onsite, reinjection into subsurface, remote location, land farming, thermal
treatments and others. However, few of the commonly used units that may be employed by the drilling
company for treatment of drill mud include;
• Cutting dryers,
• Cutting storage facility,
• Cutting washers,
• Vacuum cutting container,
• Vacuum drop tank,
• Crushing units,
• Sampling or Testing units, and / or
• Transportation or Packing unit.
Figure 4.1: Illustration: TWMA (Norway) Integrated Drilling Waste Management system.
Chapter No. 4 Waste Disposal Issues
38
4.3. HANDLING OF SOLID WASTES
Particle size, density, shape, and concentration affect virtually every piece of equipment used to
separate drilled solids and/or weighting material from the drilling fluid. In the theoretically perfect well,
drilled solids reach the surface with the same shape and size that they had when they were created at the
drill bit. In reality, cuttings are degraded by physicochemical interaction with the fluid and mechanical
interaction with other cuttings, the drill string, and the well bore.
Large, dense particles are the easiest to separate using shakers, hydrocyclones, and centrifuges, and the
differences in size and density among different types of particles must be well known to design the
appropriate piece(s) of equipment for the separation process. Solids control equipment should be arranged
so that each piece removes successfully finer solids as shown in Appendix–IV.
Solids removal equipment is arranged so that the larger solids are removed before the smaller solids. Each
piece of equipment should discharge into the next compartment downstream from the suction
compartment. Each compartment in the removal section should backflow from the downstream
compartment into the upstream compartment, except for the sand trap. A flow analysis should show that
all fluid entering the suction compartment of the degasser, desilters, or desanders, from whatever source,
is processed through the equipment.
4.4. SOLID WASTE DISPOSAL
Formation solids contained in a mud system, generally considered to be detrimental to the drilling
operation because they produce high plastic viscosity, yield point and gel strengths and build poor quality
filter cakes. They also occupy space that is needed for barite in high density muds. Drill solids cause
excessive wear in the mud pumps and other rig equipment. Solids control is aimed at economically and
efficiently removing drill solids. This implies removal as soon as possible after they enter the mud
system, while the particles are at their largest size (Alberta Energy and Utilities Board, 1996). After the
separation of liquid and solid part of drilling mud, the commonly separated solid component includes;
•••• Drill cuttings (formation solids);
•••• Clay (heavy metallic impurities);
•••• Mud weighting material (Barite).
However, the composition of these solids and level of contaminant in these solids depends upon the
geological conditions and type of drilling mud used.

Chapter No. 4 Waste Disposal Issues
39
Table 4.1: Commonly opted solid waste disposal or treatment methods
Waste Type Treatment / Disposal Methods
Dewatering and burial on site.
Land spreading and land farming.
Bioremediation.
Incinerating and thermal desorption.
Vermi-composting with worms.
Solids and Cuttings
Cuttings injection in dedicated injection wells, in annuli, or in suitable
formation in development well.
4.4.1. Pits
The use of sealed earthen or lined pits is integral to drilling waste management in many countries.
During onshore drilling operations, the cuttings separated by the shale shaker are sent to a pit called the
reserve pit located near the drill rig. The pit is generally open to the atmosphere, so it also accumulates
stormwater and washwater from the rig. The strategic location of small pits near drilling sites can also
help minimize spillage of waste materials. Unless site characteristics are such that no significant threat to
water resources can occur, liners are generally required. Where pits must be constructed adjacent to water
bodies or on sloping terrain, engineering precautions incorporated into the design will help to ensure pit
integrity. Precautions should be taken to prevent disposal of chemicals, refuse, debris, or other materials
not intended for pit disposal.
4.4.2. Landfills
Landfills are used throughout the world for disposing of large volumes of municipal, industrial,
and hazardous wastes. In landfills, wastes are placed in an engineered impoundment in the ground. At the
end of each day or on some other cycle, the waste is covered with a layer of clean soil or some other inert
cover material. Modern design standards require clay or synthetic liners, although, in some areas, unlined
landfills continue to operate. Landfills can be used for disposing of drilling wastes and other oil field
wastes. In some circumstances, these are offsite commercial operations established to receive wastes from
multiple operators in an oil field (e.g., the West Texas region). In other cases, oil companies with a large
amount of drilling activity in an area may construct and operate private landfills.
Chapter No. 4 Waste Disposal Issues
40
4.4.3. Landfarming
The petroleum exploration and production industry has used land farming to treat oily petroleum
industry wastes for years. Land farming is the controlled and repeated application of wastes to the soil
surface, using microorganisms in the soil to naturally biodegrade hydrocarbon constituents, dilute and
attenuate metals, and transform and assimilate waste constituents.
Land farming can be a relatively low cost drilling waste management approach. Some studies indicate
that land farming does not adversely affect soils and may even benefit certain sandy soils by increasing
their water retaining capacity and reducing fertilizer losses. Inorganic compounds and metals are diluted
in the soil, and may also be incorporated into the matrix (through exchange reactions, covalent bonding,
or other processes) or may become less soluble through oxidation, precipitation, and pH effects. The
attenuation of heavy metals (or the taking up of metals by plants) can depend on clay content and cation-
exchange capacity.
4.4.4. Land Treatment
In land treatment (also known as land spreading), the processes are similar to those in land
farming, where natural soil processes are used to biodegrade the organic constituents in the waste.
However, in land treatment, a one time application of the waste is made to a parcel of land. The objective
is to dispose of the waste in a manner that preserves the subsoil’s chemical, biological, and physical
properties by limiting the accumulation of contaminants and protecting the quality of surface and
groundwater. The landspreading area is based on a calculated loading rate. Landspreading is not intended
for wastes resulting from the use of hydrocarbon based mud systems. Typical methods for landspreading
are:
• Ripping subsoil and spreading and incorporating the waste on site, or
• Spreading (squeezing) the waste on site, drying and incorporating.
4.4.5. Bioremediation
Bioremediation (also known as biological treatment or biotreatment) uses microorganisms
(bacteria and fungi) to biologically degrade hydrocarbon contaminated waste into nontoxic residues. The
objective of biotreatment is to accelerate the natural decomposition process by controlling oxygen,
temperature, moisture, and nutrient parameters. Land application is a form of bioremediation that focuses
on forms of bioremediation technology that take place in more intensively managed programs, such as
composting, vermiculture, and bioreactors.

Chapter No. 4 Waste Disposal Issues
41
Implementation Of Above Techniques at One Site
In 1995, HS Resources, an oil and gas company operating in Colorado obtained a permit for a
noncommercial land farm to treat and recycle the company's nonhazardous oil field wastes, including
drilling muds. At the land farm, wastes mixed with soil contaminated with hydrocarbons from other
facilities are spread in a layer one foot thick or less. Natural bacterial action was enhanced through
occasional addition of commercial fertilizers, monthly tilling (to add oxygen), and watering (to maintain
10-15% moisture content). Treatment is considered complete when hydrocarbon levels reach
concentrations specified by regulatory agencies; not all agencies employ the same acceptability standards.
Water and soil are monitored periodically to confirm that no adverse soil or groundwater impacts
occurred, and records of the source and disposition of the remediated soil were maintained. Estimated
treatment costs, which include transportation, spreading, amendments, and monitoring, were about $4-5
per cubic yard. When the treated material was recycled as backfill, net costs was about $1 per cubic yard.
Capital costs (not included in the treatment cost estimates) were recovered within the first eight months of
operation (Cole and Mark, 2000).
4.4.6. Thermal Treatment Technologies
Thermal technologies use high temperatures to recycle spent OBM or SBM fluids and
hydrocarbon contaminated cuttings. Thermal treatment is also the most efficient treatment for destroying
organics, and it also reduces the volume and mobility of inorganics such as metals and salts. Additional
treatment may be necessary for metals and salts, depending on the final fate of the wastes. Waste streams
high in hydrocarbons, like oil based mud, are good candidates for thermal treatment technology.
4.4.7. Disposal In Salt Caverns
Salt domes are large, fingerlike projections of nearly pure salt that have risen to near the surface.
Bedded salt formations typically contain multiple layers of salt separated by layers of other rocks. Salt
beds occur at depths of 150m to more than 1800m below the surface. Salt caverns used for oil field waste
disposal are created by a process called solution mining.
Well drilling equipment is used to drill a hole from the surface to the depth of the salt formation and a
smaller diameter pipe called tubing is lowered through the middle of the well. This arrangement creates
two pathways into and out of the well. To form a salt cavern, the well operator pumps fresh water through
one of the pipes. As the fresh water comes in contact with the salt formation, the salt dissolves until the
water becomes saturated with salt. Cavern space is created by the removal of the salt-laden brine.

Chapter No. 4 Waste Disposal Issues
42
4.4.8. Discharge To Ocean
In early offshore oil and gas development, drilling wastes were generally discharged from the
platforms directly to the ocean. When water based muds (WBMs) were used, only limited environmental
harm was likely to occur, but when operators employed oil based muds (OBMs) on deeper sections of
wells, the resulting cuttings piles created impaired zones beneath and adjacent to the platforms.
At some North Sea locations, large piles of oil based cuttings remain on the sea floor near the platforms.
Piles of oil based cuttings can affect the local ecosystem in three ways: by smothering organisms, by
direct toxic effect of the drilling waste, and by anoxic conditions caused by microbial degradation of the
organic components in the waste. Current regulatory controls minimize the impacts of permitted
discharges of cuttings.
4.5. HANDLING OF LIQUID WASTE
Drilling muds and wastes associated with hydrocarbon exploration and production activities are
initially stored in pits, and these waste pits must meet the following requirements:
• The pits must be constructed in clayey soils which have a clay and fines content of 28% and 40%
or more, respectively. The clayey soils must extend for at least one meter beyond the bottom and
sides of the pits.
• If suitable soils cannot be located for construction of the entry pit (e.g., deposits of sand or gravel
encountered on the entry portion of the drill) any free drilling mud released in the pit must be
immediately and continually removed during the duration of the drilling operation unless other
mitigate measures (e.g. liners) can be implemented to prevent migration of the fluids.
• Immediately upon completion of drilling, the drilling waste must be removed from the pits and
managed following a method approved and all associated requirements. The pits must then be
backfilled and reclaimed.
• The receiving soil must be assessed to verify that it is suitable to receive drilling wastes and to
determine the mix ratio that will prevent the soil/waste mix from exceeding the endpoints set out.
4.6. LIQUID WASTE DISPOSAL
There are many drilling fluid additives which are used to develop the key properties of the mud
that must be characterized before disposal of liquid waste. The variety of fluid additives reflects the
complexity of mud systems currently in use (California Stormwater Quality Association, 2003). Disposal
of some drilling liquid muds may be subject to specific laws and regulations or to requirements of other

Chapter No. 4 Waste Disposal Issues
43
permits secured for the construction project (e.g., NPDES permits, Coastal Commission permits, etc.).
Liquid waste management does not apply to dewatering operations, solid waste management, hazardous
wastes, or concrete slurry residue. Typical permitted non-stormwater discharges can include: water line
flushing; landscape irrigation; diverted stream flows; rising ground waters; uncontaminated pumped
ground water; discharges from potable water sources; foundation drains, irrigation water, springs, water
from crawl space pumps, footing drains, lawn watering, flows from riparian habitats and wetlands, and
discharges or flows from emergency fire fighting activities.
Table 4.2: Commonly opted drilling liquid waste disposal or treatment methods
Waste Type Treatment / Disposal Methods
Berming and banked containment areas to prevent contact with
stormwater.
Treatment and reuse (slurry injection or close loop system).
Disposal at Commercial Sites
Contaminated Water
(Containing drilling fluid
sediments, runoff from rig
washing and operations, etc.) Priority disposal (i.e., first waste type to be injected or
remediated).
4.6.1. Land Spraying Disposal Method
Landspraying disposal method occurs when the waste (drilling liquids and solids) is sprayed off
site on to topsoil and may or may not be incorporated. The landspraying area is determined based on a
calculated loading rate or a maximum application rate. The goal of landspraying is to dispose of the waste
in a manner that preserves the topsoil’s chemical, biological and physical properties by limiting the
accumulation of salts, and protects the quality of surface water and groundwater. The landspraying and
landspraying while drilling (LWD) disposal criteria appear similar. However, since LWD is limited to
three approved mud systems (fresh water gel, gypsum water, or nitrate gypsum water); many of the
testing requirements for landspraying have been waived for LWD. Typical methods for landspraying are:
• Applying the waste on cultivated land (off site) and incorporating by cultivation, or
• Applying the waste on vegetated land and the waste is not incorporated.
4.6.2. Landspraying While Drilling Disposal
Landspraying while drilling (LWD) is a landspraying disposal method and occurs when drilling
wastes from approved mud systems are sprayed off site onto topsoil at low application rates. The

Chapter No. 4 Waste Disposal Issues
44
application is conducted during the drilling operation. Drilling wastes are sprayed on land at application
rates less than 0.004m3/sq.m. Spraying techniques may include the use of vacuum trucks or similar
equipment. The goal of this disposal method is to dispose of the drilling waste in a manner that preserves
soil chemical, biological, and physical properties, does not harm vegetation, and protects the quality of
the surface water and groundwater. Mud systems presently approved for landspraying while drilling is
limited to water based muds.
The disposal criterion and the required tests or analysis for these different disposal methods are
mentioned in Appendix–IX.
4.6.3. Commercial Disposal Facilities
Oil and gas companies use commercial disposal facilities for various reasons. The primary reason
is that the regulatory agency with jurisdiction may not allow onsite disposal for the type of drilling waste
or the specific location. Examples of inappropriate wastes for onsite disposal may include saltwater muds
or very oily cuttings. Examples of locations that are not appropriate for onsite burial or land application
include areas with high seasonal water tables, marshy environments, or tundra.
The commercial disposal companies use many different approaches for disposing of the wastes they
receive. Landfills and pits represent another important disposal option for oily wastes. Two New Mexico
facilities evaporate the liquid fraction of the waste and then send the solids to landfills. Several other
disposal facilities treat the wastes before disposing of or reusing them. A Texas facility first chemically
stabilizes the waste and then landfills it. Five California facilities biologically or chemically treat waste
and then reuse the residues. Several facilities use thermal treatment or incineration followed by reuse or
disposal of the residues. One California commercial facility evaporates liquid wastes in a surface
impoundment. Several companies in both east and west Texas operate salt caverns for commercial
disposal.
4.6.4. Slurry Injection Of Drilling Wastes
Several different approaches are used for injecting drilling waste fluids into underground
formations for permanent disposal. The slurry injection technology, involves grinding or processing
solids into small particles, mixing them with water or some other liquid to make slurry, and injecting the
slurry into an underground formation at pressures high enough to fracture the rock. The process referred
to here as slurry injection has been given other designations, including slurry fracture injection, fracture
slurry injection, drilled cuttings injection, cuttings reinjection, and grind and inject.
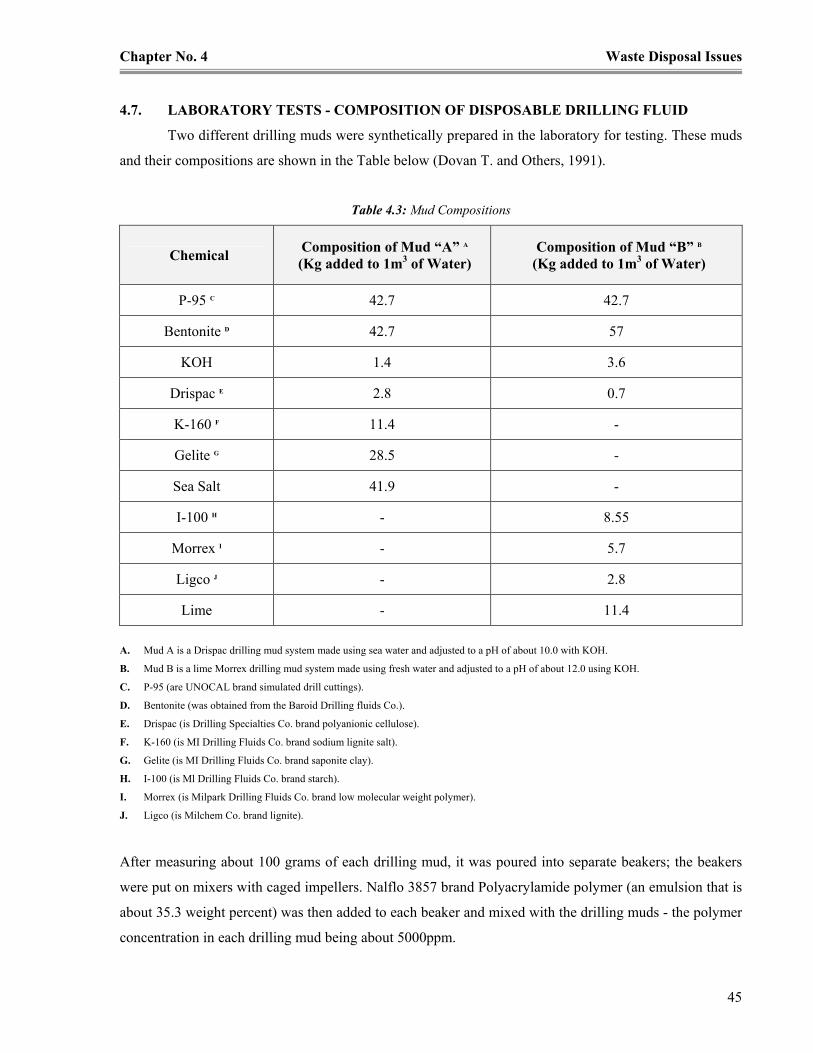
Chapter No. 4 Waste Disposal Issues
45
4.7. LABORATORY TESTS - COMPOSITION OF DISPOSABLE DRILLING FLUID
Two different drilling muds were synthetically prepared in the laboratory for testing. These muds
and their compositions are shown in the Table below (Dovan T. and Others, 1991).
Table 4.3: Mud Compositions
Chemical Composition of Mud “A” A
(Kg added to 1m3 of Water)
Composition of Mud “B” B
(Kg added to 1m3 of Water)
P-95 C 42.7 42.7
Bentonite D 42.7 57
KOH 1.4 3.6
Drispac E 2.8 0.7
K-160 F 11.4 -
Gelite G 28.5 -
Sea Salt 41.9 -
I-100 H - 8.55
Morrex I - 5.7
Ligco J - 2.8
Lime - 11.4
A. Mud A is a Drispac drilling mud system made using sea water and adjusted to a pH of about 10.0 with KOH.
B. Mud B is a lime Morrex drilling mud system made using fresh water and adjusted to a pH of about 12.0 using KOH.
C. P-95 (are UNOCAL brand simulated drill cuttings).
D. Bentonite (was obtained from the Baroid Drilling fluids Co.).
E. Drispac (is Drilling Specialties Co. brand polyanionic cellulose).
F. K-160 (is MI Drilling Fluids Co. brand sodium lignite salt).
G. Gelite (is MI Drilling Fluids Co. brand saponite clay).
H. I-100 (is Ml Drilling Fluids Co. brand starch).
I. Morrex (is Milpark Drilling Fluids Co. brand low molecular weight polymer).
J. Ligco (is Milchem Co. brand lignite).
After measuring about 100 grams of each drilling mud, it was poured into separate beakers; the beakers
were put on mixers with caged impellers. Nalflo 3857 brand Polyacrylamide polymer (an emulsion that is
about 35.3 weight percent) was then added to each beaker and mixed with the drilling muds - the polymer
concentration in each drilling mud being about 5000ppm.

Chapter No. 4 Waste Disposal Issues
46
The polymer or drilling mud mixtures were next put into vials with each vial containing about 15cc of one
of the mixtures (approximately 17 grams). Varying amounts of crosslinker (potassium dichromate) and
reducing agent (sodium thiosulfate) were subsequently added to the vials.
The weight ratio of reducing agent to crosslinker was kept constant at about 3:1. Because the reducing
agent and the crosslinker were both supplied in solid granular form, 10 weight percent solutions of each
were made and the resulting solutions were added to each of the polymer/drilling mud mixtures to form
solidifiable, disposable drilling mud compositions haying a polymer concentration of about 4000ppm.
The vials were shaken to thoroughly mix all the chemicals together and then placed in an oven that was
preheated to about 650oC. The compositions were periodically inspected for gel quality and then returned
to the oven to continue the aging process.
The results of the gel tests are presented below in Table 4.4. The quality of the gels was rated both
quantitatively using a ¼ scale modified ASTM D 217 - 88 standardized test method and qualitatively.
Table 4.4: Penetrometer Readings of Drilling Mud “A” (4000ppm of N-3857 polymer aged at 58oC)
Penetrometer Reading A Dichromate
(ppm)
Thiosulfate
(ppm) Initial 1hour 1day
0 0 Offscale B Offscale Offscale
250 750 Offscale Offscale Offscale
500 1500 Offscale Offscale Offscale
1000 3000 Offscale Offscale 212 (2) C
2000 6000 Offscale Offscale 155 (3)
3000 9000 Offscale Offscale 142 (3)
The results set forth in Table 4.5 show that the hardness of the resulting gel varies depending upon the
concentrations of the crosslink and reducing agents. In addition, the results indicate that gel times can be
delayed from about one hour to about one day or more.

Chapter No. 4 Waste Disposal Issues
47
Table 4.5: Penetrometer Readings of Drilling Mud “B” (4000ppm of N-3857 polymer aged at 58oC)
Dichromate Thiosulfate Penetrometer Reading A
ppm ppm Initial 1hour 1day
10 0 Offscale B 162 C N/T D
250 750 Offscale N/T 94 (5)
500 1500 Offscale 141 N/T
1000 3000 Offscale N/T 91 (5)
2000 6000 Offscale 128 76 (5)
4000 l2000 Offscale 111 N/T
A. Using a quarter scale apparatus,
B. Offscale > 285
C. Number in parentheses denotes subjective gel rating with the offscale readings being equivalent to a (E) on the subjective Gel Rating Scale.
D. N/T denotes no reading taken.
E. Subjective Gel Rating Scale:
1. Watery
2. High Viscosity
3. Weak Gel
4. Elastic Gel
5. Stiff Gel
The other crosslinkable polymers, and crosslinking agents, can be employed in the drilling mud disposal
procedure. Furthermore, instead of being used to form disposable mud compositions, the process can be
employed to form disposable slurry and other disposable mud compositions. As example, slurry includes
muds from industrial evaporation ponds and flocculated by-products of water treatment plants. The same
concentrations of crosslinkable polymers, crosslinking agents, and optional additives employed to form
disposable drilling mud, which is used to form disposable slurry and other disposable mud compositions.

Chapter No. 5 Environmental Friendly Drilling Fluid Technologies
48
CHAPTER No. 5: ENVIRONMENTAL FRIENDLY DRILLING FLUID
TECHNOLOGIES
5.0. INTRODUCTION
There are many developments in the field of oil and gas exploration and production sector, and all
are basically focused to attain the best performance and better environmental results using new types of
equipments, fluids and techniques. One advancement currently under development is synthetic based,
high performance, invert emulsion drilling fluids. These clay free invert emulsion fluids are formulated
without the use of commercial organophilic clays or lignites. The interaction of the components in these
clay free systems is the key to provide a robust gel structure that eliminates the need for excessive
thickening of the mud, helps preventing over treatment. Also, the absence of commercial clay and lignite
naturally reduces the solids content and helps operators achieve faster rates of penetration (ROP).
Traditionally, invert emulsion drilling fluids have been the fluid of choice for drilling demanding wells.
Such highly water sensitive wells require a highly inhibitive fluid to minimize interactions between the
drilling fluid and water sensitive formations. The main driver in the development of alternatives to oil
based systems has been the concern about the environmental impact of using and disposing of these
fluids. As a result, the development of environmentally acceptable water based drilling fluid, which is
capable of insuring high rates of penetration, good lubricity, and low potential for stuck pipe.
5.1. HIGH PERFORMANCE WATER BASED MUDS
A new water based drilling fluid was developed to address shale inhibition problems through a
specialized product approach (Richard and others, 2006). One unique feature of this fluid is that the high
level of inhibition does not rely on any salt. The new fluid incorporates a polyamine shale intercalator and
a shale encapsulator for hydration inhibition. The new fluid performed similar to invert emulsion muds
used to drill offset wells in the area, where troublesome shale sections are encountered. The fluid met the
regulatory standards for the Mix Bury and Cover method of drilled cuttings disposal on location and for
land spraying of whole fluids.
Several water based drilling fluids have been developed over the past ten years with the goal of
approaching the drilling performance of an invert emulsion drilling fluid. These include potassium /
PHPA systems, salt / glycol fluids, cationic systems, calcium chloride polymer systems and silicate based
fluids. However, these fluids have not always been completely successful in inhibiting the hydration of
highly water sensitive formations. Most of the inhibitive water based systems developed in recent years

Chapter No. 5 Environmental Friendly Drilling Fluid Technologies
49
rely on salts for shale inhibition and this presents a significant challenge for disposal of drilling fluid
wastes for land based projects. As a result, operators favor freshwater systems that pass the environmental
criterion for on site disposal.
5.2. INHIBITIVE WATER BASED MUDS
Some of the first inhibitive water based muds were based on cationic exchange inhibition. The
most popular of those systems are the potassium based fluids. Although providing good shale inhibition
due to the K+ ions perfectly fitting between the clay platelets, these fluids appeared to promote dispersion
of certain shales. As result potassium based fluids have been enhanced with the incorporation of an
encapsulating polymer (such as PHPA). A significant improvement in the inhibitive water based mud
(WBM) area was made by a series of “second generation” inhibitive fluids: silicate, glycol and amine
based fluids. Silicates (sodium or potassium) provide very good shale inhibition and wellbore stability by
forming a true shale membrane. However, they are limited by temperature, tolerance to contaminants, and
lubricity.
Glycol fluids provide inhibition by plugging the micro pores or fractures inside the shale. They require
the use of a salt and also may promote dispersion in certain formations. Amine based fluids generate
hydration inhibition, by intercalation between clay platelets. Early amine inhibitors provided limited shale
inhibition.
5.3. THIRD GENERATION INHIBITIVE FLUIDS
A highly inhibitive, salt free, freshwater based fluid system has been developed for land drilling
applications in highly reactive and dispersive shale formations (Doug and Others, 2003). The system
significantly reduces the clay dispersion and hydration without the use of salts. The system components
are newly developed and designed to perform specific functions. The highly inhibitive aqueous fluid
(HIAF) is environmentally friendly for land drilling applications. The system utilizes three components:
1. Shale Inhibitor: The newly developed shale inhibitor is a chloride free amine based
multifunctional molecule, which is environmentally safe, non ionic and completely water soluble.
The unique molecular structure of the shale inhibitor is theorized to function by making a perfect
fit between clay platelets and binding the platelets together.
2. Dispersion/Hydration Suppressant: This is a low molecular weight terpolymer, which exhibits
good biodegradability and low toxicity. The polymeric additive is designed to have a molecular
Chapter No. 5 Environmental Friendly Drilling Fluid Technologies
50
weight and charge density that allow superior inhibition by limiting water penetration into the
clay platelets and binding the platelets together via cationic charges.
3. Fluid Loss Control Agent: This is an ultra low viscosity, modified cellulose polymer, which
allows the use of product for fluid loss control without contributing the excess viscosity. This
polymer also exhibits low toxicity and good biodegradability for land drilling applications. The
design, selection, and concentrations of each component are selected to optimize the fluid loss.
5.4. HIGH PERFORMANCE MUDS
Oil based mud systems have been the fluids of choice for many operators. These systems have
been consistently proven as technically superior to conventional water based muds in the areas of
borehole stability, ionic inhibition, rate of penetration, cuttings condition and sticking avoidance.
Principally, the beneficial technical attributes are derived from the continuous organic phase and with the
benefits being inherent in the base fluid, these muds are often considered easier to maintain and more
tolerant to contaminants such as drill solids.
So called “flat rheology” oil based muds (FROBM) evolved to try to address some of the issues relating
to pressure control in deepwater through ECD management. These fluids have been developed to exhibit
less variance in measured viscosity under the extremes of pressure and temperature often found in
deepwater applications. This is usually achieved by substituting the organo philic clay content of the
OBM with liquid rheology modifiers, complex emulsifier packages, oil wetters and additional stabilizers
in combination with a low kinematic viscosity base oil to provide this “flat rheology” feature. However,
while FROBM’s can provide a more uniform ECD under pressure and temperature extremes, “uniform”
does not necessarily equate to “uniformly low” and the effects of compressibility, lower FBG and gas
compressibility still remain as inherent features of the organic continuous phase.
An alternative approach would be to revert to an aqueous fluid which raises the bar in terms of WBM
drilling performance whilst at the same time mitigating the environmental risks and technical issues
associated with oil based muds in deepwater. In order to be a technically viable alternative to OBM, this
high performance water based mud (HPWBM) would be required to emulate OBM drilling performance
in the areas of shale stability, clay stability, ROP, cuttings encapsulation, sticking avoidance and lubricity.

Chapter No. 5 Environmental Friendly Drilling Fluid Technologies
51
5.5. VEGETABLE AND PLANT OIL BASED MUDS
Due to the poor environmental standing and biodegradation characteristics of conventional oil
based muds, the research is conducted to develop plant and vegetable oil based muds to replace the toxic
OBMs (Cognis Oilfield Chemicals, 2005). Innovative processing and additive techniques led to the
successful formulation of plant and vegetable oil based muds with rheological characteristics similar to
conventional OBMs.
The American Petroleum Industry (API) filtration test, however, indicates much higher fluid loss
properties for both the vegetable and the plant oil based muds compared with mineral OBM. This
problem can be fixed by identifying or developing an appropriate fluid loss additive that is effective in
vegetable and plant oil based muds. These newly developed OBM systems have technical performance
standards similar to conventional OBMs because of their lack of interaction with shale. Their
environmental standing is similar to that of WBMs due to their negligible toxicity effect and highly
biodegradable nature.
5.6. HIGH PERFORMANCE ESTER BASED DRILLING FLUIDS
The drilling fluids containing vegetable esters are developed by Cognis in collaboration with
Baroid, the drilling fluids service company within the Halliburton Energy Services Group (Cognis
Oilfield Chemicals, 2005). Esters ensure that drilling fluids demonstrate outstanding biodegradability,
both aerobically and anaerobically. Reducing the negative effects of oil and gas exploration in the
delicately balanced marine ecosystem is the objective of the national pollutant discharge elimination
system (NPDES).
Ester based formulations do not smell, are not toxic upon inhalation and do not cause skin irritations. The
vegetable esters, obtained from natural resources such as palm kernel oil, are also used in cosmetic
formulations. In drilling fluids, however, they achieve outstanding technical performance, even under
extreme conditions. Even in deep and very cold water, they remain fully pumpable and efficiently
lubricate the drilling bit in all strata of rock formation, even in the case of high speed drilling operations,
and if the drilling is highly deviated.
On the other side, specially designed vegetable ester fluids remain stable at temperatures above 350°F
(176oC). The ester based formulation also provides drilling fluids with sufficiently low viscosity for the
greatest possible equipment safety, even when subjected to high pressure and extreme temperature
fluctuations. Ester based drilling fluids can be tailor made to satisfy the most demanding needs.
Chapter No. 5 Environmental Friendly Drilling Fluid Technologies
52
5.7. OLEFIN BASED ENVIRONMENTAL FRIENDLY DRILLING MUDS
Olefin based mud fluids are clear, odorless products with an aromatic content of less than 0.001%
are made from ethylene compared to the diesel and mineral oil fluids that are refined from crude oil. As
such it offers a “much nicer environment” for rig workers as they are not exposed to volatile organic
compounds such as diesel and benzene.
The olefin muds have a higher flash point of 116oC compared to between 66oC and 76oC for diesel based
muds, making it a safer choice. While BP manufactures two olefin products, the Amodrill 1400 fluid is
more suitable for winters because it has a lower pour point (the lowest temperature at which it will pour)
of 35oC to 40oC. However, the synthetic oil based muds also come with a higher price tag double that of
the cheaper diesel products. That premium, though, can be more than offset by shorter drilling times and
lower remediation costs down the road, Palm suggests.
5.8. APHRON DRILLING FLUIDS
Aphron drilling fluids are being used globally to drill through depleted reservoirs and other under
pressured zones (Growcock and Others, 2006). The primary features of these fluids are their unique low
shear rheology and aphrons (specially designed pressure resistant microbubbles of air). However, aphron
drilling fluids work is not well understood, which limits acceptance of this technology, along with efforts
to optimize the system's performance.
Various laboratory techniques were applied to determine the physicochemical properties of aphrons and
other components in the fluid and how they affect flow through permeable and fractured media. These
included wettability and surface tension, bubble stability, radial and dynamic flow visualization, and fluid
displacement tests. One key discovery was that aphrons can survive compression to at least 281kg/cm2,
whereas conventional bubbles do not survive such a high pressure.
When drilling fluid migrates into a loss zone under the drill bit, aphrons move faster than the surrounding
liquid phase and quickly form a layer of bubbles at the fluid front. At the same time, the shear rate of the
fluid continually decreases and the viscosity is rapidly rising. The combination of the bubble layer and the
rapidly increasing viscosity of the liquid severely curtails fluid invasion. Another key finding of the study
is that aphrons show little affinity for each other or for the mineral surfaces of the pore or fracture;
consequently, the seal they form is soft and their lack of adhesion enables them to be flushed out easily
during production.

Chapter No. 5 Environmental Friendly Drilling Fluid Technologies
53
5.9. ENVIRONMENTAL FRIENDLY HIGH PERFORMANCE DRILLING LUBRICANT
Drilling fluid lubricant (DFL) is a revolutionary product for all drilling applications (Hasting,
2009). DFL is formulated with a proprietary technological component that reacts to any combination of
temperature, pressure and friction that takes place between moving surfaces. DFL is a supplement that
can be incorporated as either a base fluid ingredient or mixed with existing drilling lubricant, and is
available in two DFL formulas, aqueous and non aqueous; water soluble and oil soluble requirements are
addressed.
Drilling fluid lubricant (DFL) molecules form a metal hydride boundary layer on the metal surface that
smoothes asperities and flaws on that surface. The boundary layers formed have a lamellar molecular
structure with easy sheering characteristics that create extremely low levels of boundary friction between
contacting surfaces. DFL's leading edge technology component activates with the inherent changes in
temperature, friction or pressure that takes place between moving surfaces. When the temperature is
altered up or down / pressure or friction is increased, the technology component activates a succession of
chemical reactions to serrate metal soaps. This creates a molecular pile of polar groups that form to
protect metal to metal contact.
DFL starts to activate at temperatures above -26°C, forming a permanent bond only to be reduced over
time as physics dictates. The resulting compound microscopically fills in pits, cracks and an uneven
surface caused by ongoing abrasion and makes the surfaces as near perfectly smooth as possible thus
reducing friction. DFL can be incorporated as either a base fluid ingredient or as a supplement to existing
drilling fluids. Uniform mixing can be assured by running DFL through existing or peripheral surface
sheering pumps; or sheering through the drill bit down hole via circulation. Activation of DFL is
immediate with the changes in temperature or pressure.

Chapter No. 6 Advanced Drilling Waste Management Technologies
54
CHAPTER No.6: ADVANCED DRILLING WASTE MANAGEMENT TECHNOLOGIES
6.0. INTRODUCTION
The best available techniques (BAT) and best environmental practices (BEP) is based on the
waste management hierarchy of avoidance, reduction, reuse, recycling, recovery, and residue disposal
which has been adopted (Expert Group for BAT and BEP, 2004). With regard to the residue disposal
there are different options which can be assessed on a case by case basis by the competent authority for a
holistic evaluation for the selection of the best environmental option. Whereas BAT is mainly focusing at
application of techniques, BEP focuses on environmental control measures and strategies (management
options). A combination of BAT and BEP should be applied for these operations to prevent and minimize
pollution as much as reasonably achievable, i.e. application of the principles of good house keeping and
closing the cycle of use of drilling fluids to avoid spills (Guidi and Gugliermetti, 2008).
6.1. BEST AVAILABLE TECHNIQUES
The use of the best available techniques emphasize on the use of non-waste technology, if
available. The term "best available techniques" means the latest stage of development (state of the art) of
processes, of facilities or of methods of operation which indicate the practical suitability of a particular
measure for limiting discharges, emissions and waste. In determining whether a set of processes, facilities
and methods of operation constitute the best available techniques, special consideration may be given to:
• Comparable processes, facilities or methods of operation which have recently been successfully
tried out;
• Technological advances and changes in scientific knowledge and understanding;
• The economic feasibility of such techniques;
• Time limits for installation in both new and existing plants;
• The nature and volume of the discharges and emissions concerned.
It therefore follows that what is "best available techniques" for a particular process will change with time
in the light of technological advances, economic and social factors, as well as changes in scientific
knowledge and understanding.
BAT is described within the context of the “five R’s” waste management hierarchy elaborated below
(Manny and Wayne, 2005). If future development leads to the production of novel, environmentally
sound products and techniques then BAT and BEP may update this decision to take these into account.
Chapter No. 6 Advanced Drilling Waste Management Technologies
55
• Reduce - The reduction of discharges of contaminated cuttings is the primary focus of this
Decision. Examples of measures to be taken with a view to reducing these discharges are;
1. Prohibition on use in the upper well section, except where technically necessary;
2. Horizontal drilling; and
3. Slim hole drilling.
• Reuse - Operators will choose techniques from a range of options e.g. mud treatment plants, shale
shakers, centrifuges and washing systems for cuttings, i.e. those technologies that maximise reuse
consistent with safe and efficient drilling. Use of mass balance (volumetric) reporting will enable
national authorities to check that reuse is being carried out effectively.
• Recycle & Recover - In order to avoid discharges into the sea, subsurface or on land, of
contaminated cuttings, recycling and recovery measures should be implemented (e.g. recovery for
re use of the organic phase by distillation onshore or offshore, use of shale shakers and
centrifuges).
• Residue disposal - The following options for the disposal of drilling waste and residue should be
considered:
1. Transportation to shore of waste for processing (e.g. Oil recovery and residue disposal);
2. Reinjection of such cuttings;
3. Offshore treatment of such cuttings with the aim of achieving the target technology
standard of 1% OPF fluid by weight on dry cuttings, and the discharge of the cleaned
residue;
4. When cleaned residues of cuttings contaminated with synthetic fluid cannot meet that
standard, national competent authorities may authorize discharge to the sea having regard
to the toxicity, biodegradability and liability to bioaccumulate of the drilling fluid
concerned and of the hydrography of the receiving environment.
6.2. BEST ENVIRONMENTAL PRACTICE
The term "best environmental practice" means the application of the most appropriate
combination of environmental control measures and strategies. In making a selection for individual cases,
at least the following graduated range of measures should be considered:

Chapter No. 6 Advanced Drilling Waste Management Technologies
56
• The provision of information and education to the public and to users about the environmental
consequences of choice of particular activities and choice of products, their use and ultimate
disposal;
• The development and application of codes of good environmental practice which covers all
aspect of the activity in the product's life;
• The mandatory application of labels informing users of environmental risks related to a product,
its use and ultimate disposal;
• Making collection and disposal systems available to the public;
• Avoiding the use of hazardous substances or products and the generation of hazardous waste;
• Recycling, recovery and re-use; and Saving resources, including energy;
• The application of economic instruments to activities, products or groups of products;
• Establishing a system of licensing, involving a range of restrictions or a ban.
In determining what combination of measures constitutes best environmental practice, in general or
individual cases, particular consideration should be given to:
• The environmental hazard of the product and its production, use and ultimate disposal;
• The substitution by less polluting activities or substances;
• The scale of use; and time limits for implementation;
• The potential environmental benefit or penalty of substitute materials or activities;
• Advances and changes in scientific knowledge and understanding;
• Social and economic implications.
It therefore follows that best environmental practice for a particular source will change with time in the
light of technological advances, economic and social factors, as well as changes in scientific knowledge
and understanding. If the reduction of inputs resulting from the use of best environmental practice does
not lead to environmentally acceptable results, additional measures have to be applied and best
environmental practice redefined. The overall goal of this BAT and BEP techniques are to:
• Reduce the input of oil and other waste substances into the environment, resulting from produced
wastes from oil and gas exploration and production installations, with the ultimate aim of
eliminating pollution from those sources;

Chapter No. 6 Advanced Drilling Waste Management Technologies
57
• Ensure that an integrated approach is adopted, so that reduction in oil discharge is not achieved in
a way that causes pollution in other areas and/or other environmental compartments;
• Ensure that effort is made to give priority to actions related to the most harmful components of
produced wastes.
6.3. BAT & BEP FOR CRI OF DRILL CUTTINGS AND PRODUCED WATER
The disposal of drill cuttings and produced water has become a major concern for operators and
environmental controls have been tightened by regulatory authorities. One of the techniques the industry
has developed to overcome the disposal problem is to inject drill cuttings as ground up material into a
subsurface formation where it is likely to remain for the indefinite future. Injection has also been used to
dispose or recycle produced liquid wastes.
6.3.1. Disposal Operation
Few solutions are without some associated risks and the possible impact on the environment of
this disposal route needs to be considered. The risks to be considered are associated with:
• Fracture growth to surface or into and contamination of shallow fresh water aquifers,
• Communication of the induced fracture with existing wells in the field,
• Well integrity or fault re activation,
• Subsequent to completion of the disposal,
• Effectiveness of sealing the injection point,
• Impact of changes in fracture dimensions,
• New wells drilling through fracture containing drill cuttings material, and
• Long term interaction of injected chemicals and the formation.
Specific situations should always be investigated before disposal operations commence. It is
recommended that in all cases the situation for the proposed disposal well should be simulated and
subsequently monitored. Sensible precautions include:
• Modeling of the situation to obtain an understanding of the main features which will affect the
fracture growth and the associated characteristics, and making predictions of injection
characteristics for subsequent monitoring and comparison.

Chapter No. 6 Advanced Drilling Waste Management Technologies
58
• Monitoring the injection parameters (rates and pressures) and comparing with predictions. When
deviations are observed operations would need to cease, at least until it was firmly established
that the deviation did not indicate undue vertical propagation of the fracture.
• During disposal operations the annulus pressures of nearby wells should be monitored to check
for possible fracture intersection with the well. Pressure increase from swelling of reactive clays
should also be modeled and monitored.
• A review of the long term considerations should be made so that the risk to potential potable
water sources would be established prior to any initiation of the disposal fracturing operations.
• Alternative disposal options for use on a contingency basis should be prepared.
6.4. LOW IMPACT DRILLING OPERATION
The goal of the low impact drilling systems project is to reduce the environmental impact of rig
operations through integration of lowimpact site access and site operations (Alfred, 2008). The scorecard
methodology presents an ecological understanding of the tradeoffs associated with producing energy. The
EFD scorecard will be developed in detail for a coastal margin ecosystem and the methodology will be
documented to enable the scorecard to be replicated at other ecosystems wherever reservoirs are
produced. This scorecard methodology is being developed through a series of workshops being held with
ecologists, botanists, wildlife management experts and others in addition to oil and gas industry experts.
An environmental scorecard is being developed to determine the tradeoffs associated with implementing
low impact drilling technology in environmentally sensitive areas. The scorecard will assess drilling
operations and technologies with respect to air, site, and water and biodiversity issues. Low
environmental impact operations will reduce the environmental footprint of operations by the adoption of
new methods to use in;
1. Getting materials to and from the rig site (site access),
2. Reducing the rig site area,
3. Using alternative drilling rig power management systems, and
4. Adopting waste management at the rig site.
The scorecard enables a dialog to be established and maintained among all interested, concerned and
affected stakeholders. In this manner, the oil and gas industry has a new way of seeing itself within the
larger network. The scorecard presented in the paper provides the means to demonstrate the connectivity
between energy production and the affected ecosystem.

Chapter No. 6 Advanced Drilling Waste Management Technologies
59
The environmentally friendly drilling (EFD) program is taking a systems approach to the integration of
currently known but unproven or novel technology in order to develop drilling systems that will have
very limited environmental impact and enable moderate to deep drilling and production operations and
activity with reduced overall environmental impact. The EFD program is identifying and providing the
technology to successfully produce shale gas and tight gas sands while appropriately addressing
environmentally sensitive issues.
The environmentally friendly drilling (EFD) program, combines new low impact technologies that reduce
the footprint of drilling activities, integrates lightweight drilling rigs with reduced emission engine
packages, addresses on-site waste management, optimizes the systems to fit the needs of specific
development sites and provides stewardship of the environment.
Data collected in a previously funded EFD project shed insight on the way the public perceives
environmentally friendly drilling technologies. These data reveal that the majority of citizens are in favor
of eliminating or relaxing governmental regulations that limit oil and natural gas exploration and
production in environmentally sensitive settings as the energy industry adopts and uses a more
environmentally friendly approach.
A significant majority of survey respondents indicated that, as an environmentally friendly approach is
implemented, current governmental regulations should be eliminated or relaxed. In environmentally
sensitive areas such as coastal wetlands, desert ecosystems and hardwood forests, the percentages of
respondents who agreed that current regulations could be eliminated or relaxed (i.e., relaxed greatly,
relaxed moderately or relaxed slightly) were 68%, 72% and 63%, respectively (Richard C. and others,
2009).
In general, it is difficult to select the best combination of EFD technologies for a given site because there
are many possible combinations, many different evaluation criteria, and many different environments.
The program identified critical technologies appropriate for low impact systems (i.e., combination of
technologies) compatible with ecologically sensitive or off limits areas. The EFD program has become an
industry leader and a clearing house of technologies that enable drilling and production with a goal of
zero environmental impact, or as minimal an impact as possible. It has shown that the industry can
achieve more than 90% reduction in environmental impact if low impact technologies are combined into a
complete system.
Chapter No. 6 Advanced Drilling Waste Management Technologies
60
By minimizing the environmental objections to development, companies may encounter less resistance to
development, find permitting efforts less onerous, and realize significant financial savings in field cleanup
and remediation after drilling operations. The results may be less costly development of unconventional
resources and products brought to market in less time with fewer environmental objections.
6.5. METHODOLOGY FOR EFD
The objective of the EFD scorecard is to have a methodology that is meaningful, simple and easy
to implement and understand. Five attributes were identified as meaningful to evaluate: site (soil or
sediment), water, air, biodiversity and societal issues. Each attribute could have several layers or sub-
attributes. As an example, within biodiversity, the potential threat to wildlife due to proximity or timing
of operations could be assessed and minimized. Drilling activities have the potential risk of temporarily
interfering with wildlife. The risk can be mitigated through proper planning and monitoring of operations.
Designated as the environmentally friendly drilling program (EFD), its purpose is to incorporate
engineering and environmental knowledge specifically to reduce environmental impact on ecologically
sensitive areas from oil and gas extraction activities. The first phase of the project is identifying low-
impact technologies for two extreme environmental conditions: desert like ecology environments and a
coastal margin ecosystem. Balancing the value of energy production with social, environmental and
economic considerations will provide a different perspective on the true cost of resource development.
Four primary areas are being addressed for EFD:
1. Transportation equipment and methods. Various approaches were developed for other sensitive
areas and do not require building roads but allow carrying heavy loads with little or no damage to
soils, vegetation, or animals.
2. Drilling equipment and methods. These encompass pad drilling using horizontal, multilateral
drilling and / or extended reach drilling, not only for multiple completions in gas reservoirs but
also for production and gathering lines and disposal systems. The “zero pads” concept uses an
innovative onshore platform to affect a low impact ecological footprint. Improve drilling
equipment efficiency and methodology to reduce greenhouse gas emissions, i.e., zero discharge
concepts. Bring lessons learned offshore to onshore.
3. Production completion systems. Disposal systems are included for mitigation of fluids such as
produced water. U tube concept of trenchless production gathering systems. Waste management
during drilling and production operations life cycle. Low ecological footprint.
Chapter No. 6 Advanced Drilling Waste Management Technologies
61
4. Studies related to environmental management in E&P operations and research on public
perception of impacts from oil and gas explorations in ecologically sensitive or protected area.
Review regulations and potential impact of technology demonstration on regulations and access
to targeted sensitive areas.
Individually, several of these concepts have been developed to varying degrees. The key objective is
synergistic incorporation of current and emerging technologies into an integrated, clean drilling or
production system with no or very limited impact.
The oil and gas industry strives to satisfy global energy demands while safeguarding the environment. To
accomplish its goals, industry must:
• Control emissions,
• Manage local impacts from operations and from using products,
• Protect biodiversity,
• Internalize environmental costs,
• Be transparent and open in communication and decision making.
These low impact drilling techniques provide an opportunity for government, industry and academia to
cooperate to develop technologies and strategies to improve the industry’s environmental apprehension.

Chapter No. 7 Cuttings (Fracture) Re-injection
62
CHAPTER No. 7: CUTTINGS (FRACTURE) RE-INJECTION
7.0. INTRODUCTION
Over the years, waste management technologies have evolved to address environmental solutions
in the most efficient and cost effective techniques (John and Maurice, 2003). As such, cutting re injection
(CRI) nowadays is considered top of the line technology for the final disposal of drilling wastes through
sub surface injection into an engineered designated formation where wastes are permanently contained.
Transporting the wastes to the final disposal well poses a challenge in large development fields, where the
most cost effective solution is often to drill a dedicated injector and convey all produced wastes to the
site. The three main drivers for the selection of a cuttings collection, transport system and re injection
package are regulations, logistics and cost.
Depending on the country, region or marine area, the existing regulations may or may not allow discharge
or transportation of the waste. In some areas where legislations are less stringent, transportation of
generated waste to satellite disposal sites (in land or offshore) is allowed. In highly sensitive areas in
which zero discharge policies are strictly enforced, all generated waste must be stored, treated and
disposed in-situ. Because of such limitations, drilling operations were often limited by the collection
capacity and ability of the CRI system to inject all waste concurrently. The new approach is to decouple
the injection process from the drilling operation, providing a totally independent cost effective process.
For the logistics, the main limitations are determined by rig configuration, availability of space, types of
materials, distance of the material transportation, and safety, which ultimately translate into costs.
Therefore, each operation should be analyzed individually to determine compliance with local
regulations, logistics and cost involved so proper collection, transport and re injection packages are
tailored to fulfill the specific needs of the project. The best approach to provide the most reliable solution
for environmentally safe waste disposal has been identified as the integration of cuttings collection and
pneumatic transport system as part of the CRI package.
7.1. HISTORY OF CRI
Cutting injection technology, initiated in the late 1980s, has been used most frequently in the
United States in regions that exhibit environmental, geological, or hydro geological circumstances that
preclude the disposal of drilling wastes by burial of reserve pits. Examples of these include Tundra
(Alaska - Schmidt et al. 1999) or shallow water tables (coastal Louisiana - Baker et al. 1999; Reed et al.
2001). Slurry injection has been used extensively at offshore platforms in the North Sea (e.g., Minton et
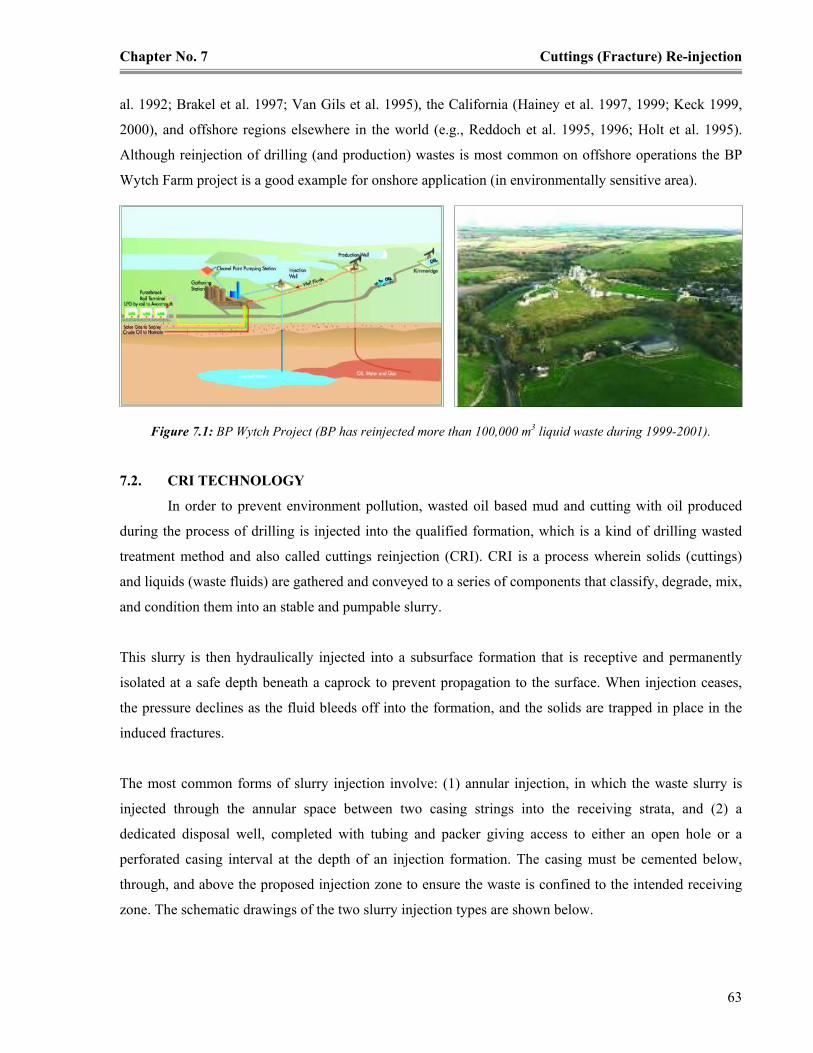
Chapter No. 7 Cuttings (Fracture) Re-injection
63
al. 1992; Brakel et al. 1997; Van Gils et al. 1995), the California (Hainey et al. 1997, 1999; Keck 1999,
2000), and offshore regions elsewhere in the world (e.g., Reddoch et al. 1995, 1996; Holt et al. 1995).
Although reinjection of drilling (and production) wastes is most common on offshore operations the BP
Wytch Farm project is a good example for onshore application (in environmentally sensitive area).
Figure 7.1: BP Wytch Project (BP has reinjected more than 100,000 m3 liquid waste during 1999-2001).
7.2. CRI TECHNOLOGY
In order to prevent environment pollution, wasted oil based mud and cutting with oil produced
during the process of drilling is injected into the qualified formation, which is a kind of drilling wasted
treatment method and also called cuttings reinjection (CRI). CRI is a process wherein solids (cuttings)
and liquids (waste fluids) are gathered and conveyed to a series of components that classify, degrade, mix,
and condition them into an stable and pumpable slurry.
This slurry is then hydraulically injected into a subsurface formation that is receptive and permanently
isolated at a safe depth beneath a caprock to prevent propagation to the surface. When injection ceases,
the pressure declines as the fluid bleeds off into the formation, and the solids are trapped in place in the
induced fractures.
The most common forms of slurry injection involve: (1) annular injection, in which the waste slurry is
injected through the annular space between two casing strings into the receiving strata, and (2) a
dedicated disposal well, completed with tubing and packer giving access to either an open hole or a
perforated casing interval at the depth of an injection formation. The casing must be cemented below,
through, and above the proposed injection zone to ensure the waste is confined to the intended receiving
zone. The schematic drawings of the two slurry injection types are shown below.

Chapter No. 7 Cuttings (Fracture) Re-injection
64
Figure 7.4: Equipment Configuration for CRI
Figure 7.2: Annular Injection into Wells with Multiple
Casing Strings Figure 7.3: Injection into Dedicated injection Well
7.3. CRI OPERATIONS AND TECHNICAL DESIGN ISSUES
The field equipment for a typical CRI project is a Slurry Disposal Unit (SDU) including feed
hopper and conveyance system for the waste material, grinding and slurry mixing components, a water
supply pump, and a high pressure downhole pump. Other critical field elements include a pad with
appropriate over spill contaminant features and an impermeable liner for the SDU, sufficient storage area
(tanks or pits) for the solid and liquid waste, and tanks for the water supply. In addition, appropriate
monitoring equipment to optimize operations, electrical power, and adequate infrastructure to access the
field location are required (M-I-SWACO Broacher, 2003). The equipment configuration for CRI is shown
in figure 7.4.
The target formation must be hydraulically
isolated during CRI operations. Packers are
placed above and below the target interval
to facilitate formation isolation. Before
injection commences, pressure fall off and
step rate tests are performed in order to
evaluate flow behavior and injectivity in the
target formation. The well casing is
perforated beginning at the bottom of the
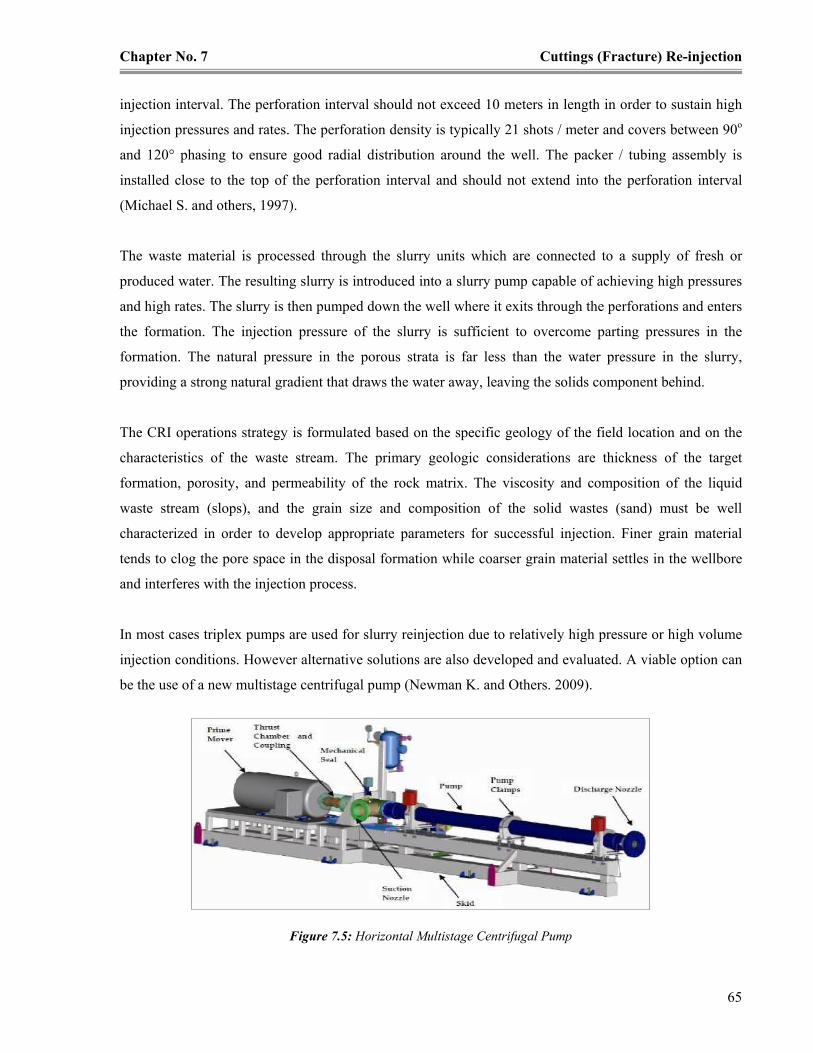
Chapter No. 7 Cuttings (Fracture) Re-injection
65
injection interval. The perforation interval should not exceed 10 meters in length in order to sustain high
injection pressures and rates. The perforation density is typically 21 shots / meter and covers between 90o
and 120° phasing to ensure good radial distribution around the well. The packer / tubing assembly is
installed close to the top of the perforation interval and should not extend into the perforation interval
(Michael S. and others, 1997).
The waste material is processed through the slurry units which are connected to a supply of fresh or
produced water. The resulting slurry is introduced into a slurry pump capable of achieving high pressures
and high rates. The slurry is then pumped down the well where it exits through the perforations and enters
the formation. The injection pressure of the slurry is sufficient to overcome parting pressures in the
formation. The natural pressure in the porous strata is far less than the water pressure in the slurry,
providing a strong natural gradient that draws the water away, leaving the solids component behind.
The CRI operations strategy is formulated based on the specific geology of the field location and on the
characteristics of the waste stream. The primary geologic considerations are thickness of the target
formation, porosity, and permeability of the rock matrix. The viscosity and composition of the liquid
waste stream (slops), and the grain size and composition of the solid wastes (sand) must be well
characterized in order to develop appropriate parameters for successful injection. Finer grain material
tends to clog the pore space in the disposal formation while coarser grain material settles in the wellbore
and interferes with the injection process.
In most cases triplex pumps are used for slurry reinjection due to relatively high pressure or high volume
injection conditions. However alternative solutions are also developed and evaluated. A viable option can
be the use of a new multistage centrifugal pump (Newman K. and Others. 2009).
Figure 7.5: Horizontal Multistage Centrifugal Pump

Chapter No. 7 Cuttings (Fracture) Re-injection
66
The pump performance can be optimized and fitted to operational requirements (Newman K. and Others.
2009).
Figure 7.6: Pump Performance Curves for Horizontal Multistage Centrifugal Pump
Tests have shown that no substantial change in particle size distribution (PSD) occur during slurry
pumping (Newman K. and Others. 2009).
Figure 7.7: Typical PSD curves during testing with WI Slurry
The solids concentration in the slurry can be as high as 30% to 40% by volume for fine grained material
(< 150 µm) and on the order of 20% by volume for coarser materials. CRI is typically accomplished in
periodic stages, generally lasting for 8 to 14 hours of injection with shut in periods lasting from 10 to 72
hours. This allows the stress and pressure fields generated within the formation to redistribute and
dissipate between injection episodes. However, experience has shown that it should be possible to inject
large volumes (> 50,000m3) of waste solids and liquids into the same formation over extended periods of
time.
Chapter No. 7 Cuttings (Fracture) Re-injection
67
7.4. TYPES OF SLURRY INJECTION
There are several different features by which slurry injection (cuttings reinjection) operations can
be distinguished (John and Maurice, 2003).
Injection Mechanism - There are three primary mechanisms by which the slurry can enter the formation.
The first two mechanisms use injection though the annular space between two casings strings of a well.
The well used for annular injection can be one that is being actively drilled, and this has been used for
single onshore wells, exploratory wells, or for the first well in a development program. By far the most
common alternative is to practice annular injection into a well that has previously been drilled and
completed. The well may be producing fluids or may be an active water injection well in a water flood.
Many of the slurry injection jobs listed in the slurry injection database follow this approach. The third
mechanism is injection into a dedicated slurry injection well completed or recompleted specifically for
that purpose. Most often, this type of well is completed with a packer, and injection occurs through a
tubing string.
Continuous or Intermittent Injection - On some jobs, the injection process is continuous. The Grind and
Inject project on the North Slope was designed to inject continuously, 24 hours per day during the winter
months. On some offshore platforms, where drilling occurs continuously and storage space is inadequate
to operate in a daily batch manner, injection must occur continuously as new wells are drilled. In these
cases, injection pressures are carefully monitored so operators can be aware of changes in formation
injectivity and identify incipient problems. Most other injection jobs are designed to inject intermittently.
The intermittent approach can help to repeatedly induce new fractures each day rather than lengthening
the original fracture. This approach minimizes the likelihood that fractures will extend outside of the
targeted formation and may allow for fracture storage of a larger volume of solid material.
Longevity of Injection Program - Many injection jobs are designed to receive wastes from just one well.
On multiwell platforms or onshore well pads, the first well drilled may receive wastes from the second
well. Each successive well has its drilling wastes injected into the previously drilled well. In this mode,
no single injection well is utilized for more than a few weeks or months. The most states that allow
annular injection of drilling wastes also place a 30 to 120 day time limit on the approval to inject into any
given well and may restrict the injected wastes to drilling wastes generated at the same well. Other
injection programs, particularly those in which a dedicated injection well has been constructed, may
operate for months to years.
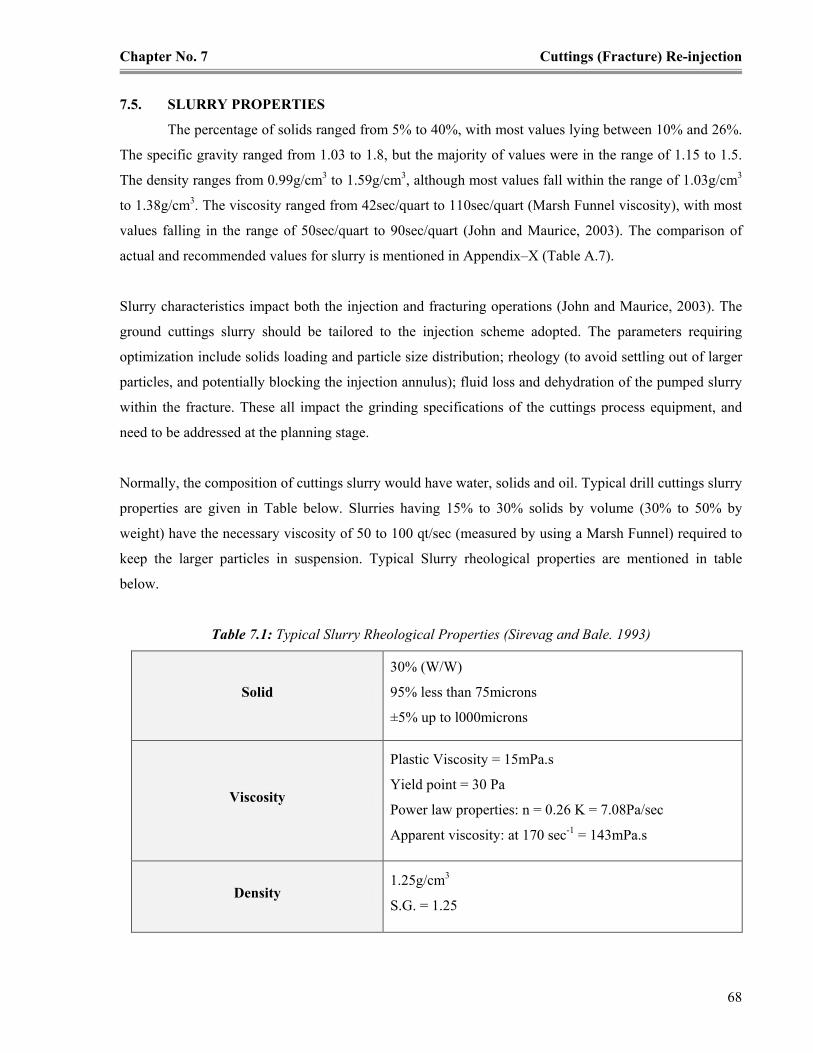
Chapter No. 7 Cuttings (Fracture) Re-injection
68
7.5. SLURRY PROPERTIES
The percentage of solids ranged from 5% to 40%, with most values lying between 10% and 26%.
The specific gravity ranged from 1.03 to 1.8, but the majority of values were in the range of 1.15 to 1.5.
The density ranges from 0.99g/cm3 to 1.59g/cm3, although most values fall within the range of 1.03g/cm3
to 1.38g/cm3. The viscosity ranged from 42sec/quart to 110sec/quart (Marsh Funnel viscosity), with most
values falling in the range of 50sec/quart to 90sec/quart (John and Maurice, 2003). The comparison of
actual and recommended values for slurry is mentioned in Appendix–X (Table A.7).
Slurry characteristics impact both the injection and fracturing operations (John and Maurice, 2003). The
ground cuttings slurry should be tailored to the injection scheme adopted. The parameters requiring
optimization include solids loading and particle size distribution; rheology (to avoid settling out of larger
particles, and potentially blocking the injection annulus); fluid loss and dehydration of the pumped slurry
within the fracture. These all impact the grinding specifications of the cuttings process equipment, and
need to be addressed at the planning stage.
Normally, the composition of cuttings slurry would have water, solids and oil. Typical drill cuttings slurry
properties are given in Table below. Slurries having 15% to 30% solids by volume (30% to 50% by
weight) have the necessary viscosity of 50 to 100 qt/sec (measured by using a Marsh Funnel) required to
keep the larger particles in suspension. Typical Slurry rheological properties are mentioned in table
below.
Table 7.1: Typical Slurry Rheological Properties (Sirevag and Bale. 1993)
Solid
30% (W/W)
95% less than 75microns
±5% up to l000microns
Viscosity
Plastic Viscosity = 15mPa.s
Yield point = 30 Pa
Power law properties: n = 0.26 K = 7.08Pa/sec
Apparent viscosity: at 170 sec-1 = 143mPa.s
Density 1.25g/cm3
S.G. = 1.25

Chapter No. 7 Cuttings (Fracture) Re-injection
69
7.6. CRI OPERATING CONSIDERATIONS
Some of the considerations in the planning stage include:
• Identify suitable cuttings disposal and sealing formations;
• Select surface equipment and design the casing program;
• Design the injection program and contingency planning;
• Prevent plugging in the annulus and the formation;
• Prevent cuttings slurries from breaching to the surface or to drinking water formations;
• Consider the impact on producing wells or future wells;
• Provide quality control and monitor injection procedures;
• Abandon waste disposed of to permanently entomb the waste;
• Obtain regulatory approval and address environmental and safety concerns.
Characteristics of the subsurface environment, sealing formations, injection zone, slurry properties,
drilling plans, subsurface slurry disposal dimensions and other elements directly impact each of these
operational considerations.
7.7. GEOTECHNICAL AND GEOMECHANICAL ISSUES
Slurry injection relies on fracturing, and the permeability of the formation receiving the injected
slurry is a key parameter in determining how readily the rock fractures, as well as the size and
configuration of the fracture (International Society for Soil Mechanics and Geotechnical Engineering,
2005). When the slurry is no longer able to move through the pore spaces, and the injection pressure
continues to be applied, the rocks will crack or fracture. Continuous injection typically creates a large
fracture consisting of a vertical plane that moves outward and upward from the point of injection.
Intermittent injection generates a series of smaller vertical planes that form a zone of fractures around the
injection point. Fractures that extend too far vertically or horizontally from the point of injection can
intersect other well bores, natural fractures or faults, or drinking water aquifers.
Most annular injection jobs inject into shales or other low permeability formations, and most dedicated
injection wells inject into high-permeability sand layers. Regardless of the type of rock selected for the
injection formation, preferred sites will be overlain by formations having the opposite permeability
characteristics (high vs. low). When available, locations with alternating sequences of sand and shales are
good candidates to contain fracture growth.

Chapter No. 7 Cuttings (Fracture) Re-injection
70
7.8. LITHOLOGY CONCERNS
The targeted formation should not contain natural fractures or faults that might communicate or
transport slurry to the surface or to formations containing potable water (Jeff and Apollo Services, 2000).
Additionally, the disposal formation must be associated with some type of seal mechanism that will
adequately restrict the slurry to the specified formation interval. This sealing mechanism can be
reinforced by slurry design.
Fractures modeling have proven useful in estimating the size and shape of the disposal plumes. Seismic
data can be utilized for identification of natural vertical fracturing that could make the project fail and can
be utilized to define the formation properties such as fracture rock strengths, pore pressures, and other
elements crucial to CRI.
Injection Depth - Most injection jobs are done at depths shallower than 1525m, with many falling
between 760m and 1525m. The shallowest injection depth reported is 380m to 390m at Duri, Sumatra in
Indonesia and the deepest is 4663m at an onshore well at Duson, Louisiana. In general, if the depth of
injection is known, it is usually possible to decide if bottomhole pressure or surface pressure is reported
by correcting for the static head in the injection tubing of the injected slurry (~11.4kPa/m to 15.8kPa/m)
and noting that the fracture gradient is on the order of 18.1kPa/m to 20.4kPa/m in most deep
environments (greater than 1525m), and 22.6kPa/m to 27.1kPa/m in shallow (less than 1525m) long term
injection operations. One would expect the bottom hole injection pressure to be equivalent to a fluid
density of from 1677kg/m3 to 2157kg/m3, assuming that fracturing is taking place.
Injection Rate - The injection rate is reported in only about 90 of the records. Many of these reported a
range of injection rates. Nearly all of these records indicated that the lower end of the injection range is
0.013m3/sec or less, and more than half are 0.005m3/sec or less. The lowest reported lower end of a range
is 0.0008m3/sec at the North Sea Asgard platform, while the highest reported lower end of a range is
0.044m3/sec at the Inject Plant at Prudhoe Bay. Most of the upper ends of the range of injection rates are
less than 0.01m3/sec.
Injection Pressure - If the injection depth is given, a calculation correcting for the hydrostatic head of the
waste slurry in the hole can usually be used to decide if the reported injection pressure is bottom hole or
surface. Like the injection rate, many of the records are expressed as ranges. Nearly all of these records
indicated that the lower end of the injection range is 140kg/cm2 or less, and more than half are 84kg/cm2
or less. The lowest reported lower end of a range is 3.5kg/cm2 at an onshore well.

Chapter No. 7 Cuttings (Fracture) Re-injection
71
7.9. GEOLOGY EVALUATION AND CONTAMINANT ASSURANCE
In any drilling waste disposal operation, safe contaminant of the injected waste must be assured.
The extent of the fracture created by CRI operations must be predicted with confidence. This is often
accomplished with hydraulic fracturing simulators. Owing to the large volumes of waste slurry injected,
the created fracture can be very large, thereby making fracture extent prediction critical in containing the
waste to the desired formation. Thorough evaluation of the geology and well information includes
logging, well testing, and core analysis along with rock mechanics testing.
The geomechanics model for hydraulic fracturing simulations must be based on the geology evaluation
results. Hydraulic fracturing simulations are used to identify contaminant formations. Three fracture
contaminant mechanisms are particularly important in selecting disposal formation:
Stress barrier - Formations with fracture gradients larger than the fracture gradient in the target injection
zone can often prevent the fracture from going into the high stress zones. Overlaying formations with
increased fracture gradients such as salt formations are ideal contaminant or sealing formations.
Modulus barrier - The fracture is contained by a limestone formation which has a higher elastic modulus.
Once the fracture approaches or enters the harder or stronger formation, the width of the fracture in and
near the stiffer formation is reduced; hence the frictional pressure is increased, preventing or slowing
fracture growth into the formation.
Permeability barrier - The fracture is contained by a high permeability formation. The fluid leaks into the
high permeability formation and the cuttings particles are left behind, thus preventing the fracture from
growing in the high permeability formation. However, as formation damage increases with continued
slurry injection, this original barrier may not continue to act as a barrier. The key in identifying the
contaminant formation in cuttings re-injection projects is to conduct hydraulic fracturing simulations
based on valid geology and operational data.
7.10. POTENTIAL UNCERTAINTIES AND LIMITATIONS OF CRI
Although fracturing formations for the purpose of stimulating oil production is a mature
technology, portions of CRI, particularly the monitoring aspect, are relatively new technologies, having
benefitted from advances in the last few years. Should a failure in a CRI operation occur, it would be
manifested as injected waste leaving the injection zone and being transported toward the surface. There
are only two possible ways in which this could occur. The first case would be if the injected waste came

Chapter No. 7 Cuttings (Fracture) Re-injection
72
into contact with a wellbore, or a subsurface discontinuity such as a fault. The second case being if an
induced fracture propagated through the confining zone or to the surface. Prevention of the first case
depends largely on the confidence in the geologic review of the site, and in the confidence that all
wellbores or other possible discharge points have been located. Regarding the second case, fracture
propagation theory concludes that a vertically propagating fracture will roll over when the fracture
becomes shallow enough that the least principal stress direction becomes vertical.
7.10.1. Formation Damage Uncertainties
Formation damage and its effect on waste contaminant are even more complicated than rock
strengths because not only does formation damage depend on the formation; it also depends on
formation/injected slurry interaction. Because CRI involves injection of solids laden slurry into permeable
formations, formation damage is different at different stages of an injection project. New fractures are
generated from subsequent injections, and fluid leakoff characteristics for a new fracture are different
from those occurring while propagating previous fractures. Slurry rheology over different injection
batches may vary. These factors cause uncertainty in waste-contaminant assurance and need to be
investigated separately to examine their individual effects on waste contaminant.
As injection progressed, the minimum horizontal stress increased because of solids accumulation and a
poroelastic effect of leak-off fluid in the disposal domain area. The increase of the minimum horizontal
stress depends on the solids volume inside the fracture. The increasing minimum horizontal stress in the
disposal domain could eventually reach the over burden stress or completion pressure limit. Injections
over the overburdens tress make the fracture reorient into an uncontrolled horizontal fracture that could
interfere with nearby wells. A regular flush of the annulus with fresh water is recommended to displace
the solids away from the wellbore and to help maintain the injection pressure as low as possible (Ovalle
A. and Others, 2009).
Figure 7.9: Injection pressure reduction by Fracture over flushing with fresh water.

Chapter No. 7 Cuttings (Fracture) Re-injection
73
Figure 7.9, shows how the surface injection pressure was reduced when properly over flushing the well,
which helped in increasing the well storage capacity and overall life of the injection operation. Bridging
and fracture plugging of solid particles can be reduced by pumping periodically waste water into the
fractured zone. Successful overflush may substantially reduce required injection pressure, as shown
above.
7.10.2. Risks And Risk Management In CRI
Although there are many advantages with cuttings re-injection technology, there are without any
doubt risks or uncertainties associated with CRI operations. Problems have occurred in some CRI
operations and can still occur if not engineered or operated correctly. Some of those include:
• There have been instances where CRI injection wells have become plugged due to improper
slurry rheology and improper operational procedures;
• Accidental releases of injected slurry to the environment have occurred in the past;
• Excessive erosion wear from long-term slurry injection has caused some well integrity failures.
Followings are the major challenges and the lessons learned from CRI projects:
Waste contaminant - Subsurface and fracture simulations are the keys for identifying the suitable
injection zones, waste contaminant and fracture-arrest formations. Good cementing practices also are the
key in the assurance process of waste contaminant, as releases of injected slurry behind casing have
occurred during annulus injections.
Slurry design - Slurry rheology design includes insuring the correct slurry viscosity, solid carrying or
suspension capacity and optimal particle size distribution. The slurry must have adequate viscosity and
carrying capacity to avoid plugging along the wellbore or in the fracture.
Operation procedure design - The injection rate should be high enough to avoid cuttings plugging of the
fracture or settling and forming solid beds the along injection annulus or tubular. Due to the intermittent
nature of CRI operations, the suspended solids-laden slurry sometimes must be displaced with a solid free
fluid to avoid cuttings settling and loss of injectivity when the suspension time is too long.
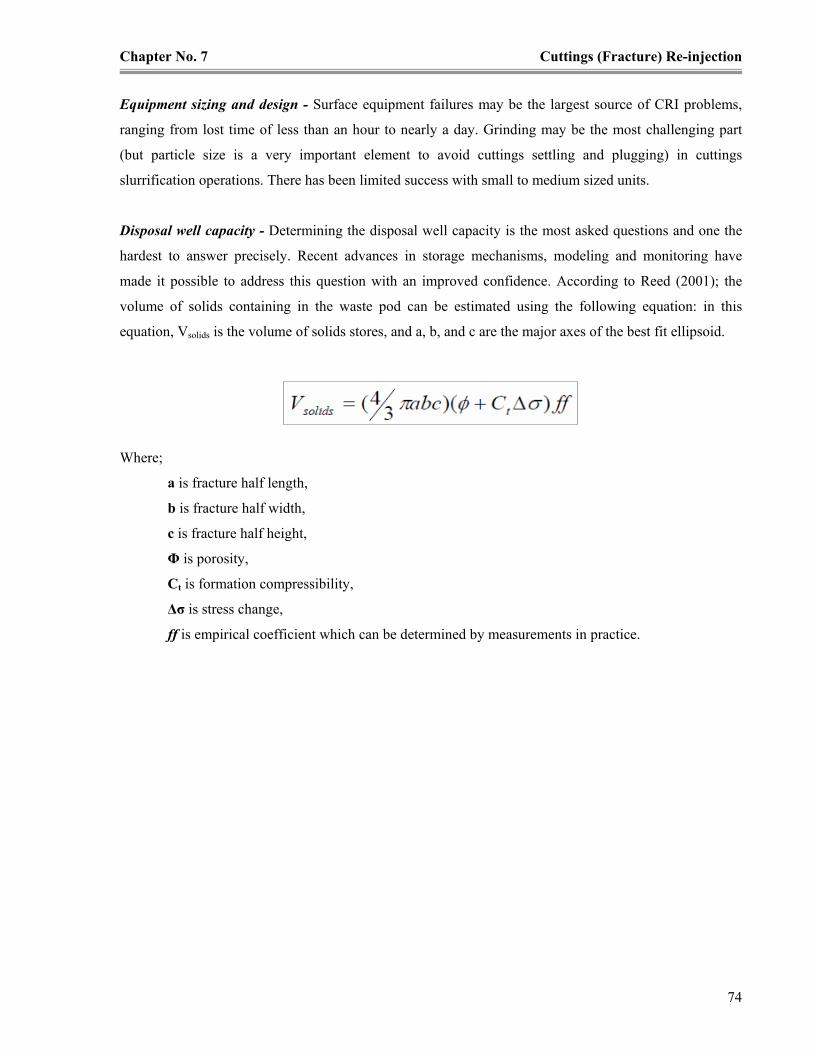
Chapter No. 7 Cuttings (Fracture) Re-injection
74
Equipment sizing and design - Surface equipment failures may be the largest source of CRI problems,
ranging from lost time of less than an hour to nearly a day. Grinding may be the most challenging part
(but particle size is a very important element to avoid cuttings settling and plugging) in cuttings
slurrification operations. There has been limited success with small to medium sized units.
Disposal well capacity - Determining the disposal well capacity is the most asked questions and one the
hardest to answer precisely. Recent advances in storage mechanisms, modeling and monitoring have
made it possible to address this question with an improved confidence. According to Reed (2001); the
volume of solids containing in the waste pod can be estimated using the following equation: in this
equation, Vsolids is the volume of solids stores, and a, b, and c are the major axes of the best fit ellipsoid.
Where;
a is fracture half length,
b is fracture half width,
c is fracture half height,
Φ is porosity,
Ct is formation compressibility,
∆σ is stress change,
ff is empirical coefficient which can be determined by measurements in practice.

Chapter No. 8 Practical Potential of Cuttings (Fracture) Re injection
75
CHAPTER No. 8: PRACTICAL POTENTIAL OF CUTTINGS (FRACTURE) RE-
INJECTION
8.0. INTRODUCTION
The cutting re injection technology, which involves grinding or processing solids into small
particles, mixing them with water or some other liquid to make slurry, and injecting the slurry into an
underground formation at pressures high enough to fracture the rock. The two common forms of slurry
injection are annular injection and injection into a disposal well. Annular injection introduces the waste
slurry through the space between two casing strings (known as annulus). At the lower end of the
outermost casing string, the slurry enters the formation. The disposal well alternative involves injection to
either a section of the drilled hole that is below all casing strings, or to a section of the casing that has
been perforated with a series of holes at the depth of an injection formation.
8.1. SELECTION AND DESIGN CRITERIA
Shallow, low producing existing wells close to the drilling site are preferred to minimize any
adverse effect of reinjection operations on production targets and operational activities. The following are
key screening criteria for disposal injectors.
• Select wells that provide access to a suitable disposal formation,
• Select wells with good quality cement bond integrity across the disposal zone,
• Recently drilled wells to minimize formation reaction and injectivity deterioration with time,
• Avoid wells with small annular clearance between casing strings to avoid excessive erosion and
injection annulus plugging,
• Assess well location, disposal fracture size, and their impact on future development plans, and
• Assess operational integrity of inner and outer casing strings with respect to anticipated injection
pressures.
Wellheads should be designed to withstand the maximum expected erosion and survive erosional wear at
the entry ports. Thread protection bushings, casing jackets, and diverter plates can be used to mitigate
erosion problems.
8.2. GEOLOGICAL CONDITIONS
Different types of rocks have different permeability characteristics (International Society for Soil
Mechanics and Geotechnical Engineering, 2005). Although rocks appear solid, they are made up of many

Chapter No. 8 Practical Potential of Cuttings (Fracture) Re injection
76
grains or particles that are bound together by chemical and physical forces. Under the high pressure found
at depths of several thousand feet, water and other fluids are able to move through the pores between
particles. Some types of rock, such as clays and shale, consist of very small grains, and the pore spaces
between the grains are so tiny that fluids do not move through them very readily. In contrast, sandstone is
made up of cemented sand grains, and the relatively large pore spaces allow fluids to move through them
much more easily.
Cutting re injection or slurry injection relies on fracturing, and the permeability of the formation receiving
the injected slurry is a key parameter in determining how readily the rock fractures, as well as the size and
configuration of the fracture. When the slurry is no longer able to move through the pore spaces, and the
injection pressure continues to be applied, the rocks will crack or fracture. Continuous injection typically
creates a large fracture consisting of a vertical plane that moves outward and upward from the point of
injection. Intermittent injection generates a series of smaller vertical planes that form a zone of fractures
around the injection point. Fractures that extend too far vertically or horizontally from the point of
injection can intersect other well bores, natural fractures or faults, or drinking water aquifers. This
condition is undesirable and should be avoided by careful design, monitoring, and surveillance.
Most annular injection jobs inject into shale or other low permeability formations, and most dedicated
injection wells inject into high permeability sand layers. Regardless of the type of rock selected for the
injection formation, preferred sites will be overlain by formations having the opposite permeability
characteristics (high versus low). When available, locations with alternating sequences of sand and shale
are good candidates to contain fracture growth. Injection occurs into one of the lower layers, and the
overlying low permeability layers serve as fracture containment barriers, while the high permeability
layers serve as zones where liquids can rapidly leak off.
8.3. PERMEABILITY ISSUES
CRI is not suitable for all geologic environments and/or sites. Principally in the offshore
petroleum industry, CRI has been successfully performed using relatively impermeable injection intervals
(i.e., shales), in conjunction with relatively higher permeability barriers as bleed off zones (i.e., sands)
serving to check the vertical extent of fracture propagation. However, considering land based applications
of CRI for the disposal of hazardous waste, there are a number of reasons why the injection interval
should consist of a relatively low stress, moderate to high permeability sand, in conjunction with
relatively lower permeability, higher stress shales, to check the vertical extent of fracture propagation.

Chapter No. 8 Practical Potential of Cuttings (Fracture) Re injection
77
These reasons include:
1. Injection into relatively higher permeability zones, such as sands, favors the production of
shorter, more compact fractures, which concentrate the waste near the wellbore.
2. Injection into relatively higher permeability zones, results in lower pressure buildup in the
reservoir from the fluid portion (bleed off) of the injectate.
3. The lower permeability of the stress barrier shales allows them to serve as effective confining
zones, preventing the permeation of the liquid portion of the injectate into adjacent formations.
8.4. PRESENCE OF WELLBORES AND SUBSURFACE DISCONTINUITIES
Knowledge of the location of wellbores, faults, natural fracture systems, and other possible
subsurface discontinuities must be a critical part of the site evaluation for CRI. The liquid phase of the
injection may intercept production wellbores and utilize the pathway existing between the outside of the
casing and the formation as a means to travel upward to the surface. The suspected intercepted wells are
production wells completed in much deeper horizons. These wells are cemented across and immediately
above the production horizons. However, these wells are typically not cemented at the elevation of the
CRI operation.
8.5. DEPTH OF WELL
If old wells are to be used as injection and producing wells because the reservoir is too deep to be
economically redrilled then lower recoveries may be expected than in cases where new wells are drilled.
Greater depth permits the use of higher pressures and wider well spacings, provided the reservoir rock is
sufficiently laterally uniform. On the other the maximum pressure to be applied in shallow depth reservoir
is limited by the depth of the reservoir. There is a critical pressure beyond which if exceeded by injection
pressure, penetrating water will expand the openings along fractures or other weak zones of the
formation. This will lead to channeling of the injected water or bypass of large portions of the reservoir
matrix. The pressure gradient of 1730kg/m2/m is normally enough.
8.6. FRACTURE GROWTH AND PROPAGATION
The fracture propagation through the confining zone or to the surface is a major geological
concern (Michael and Others, 1997). Prevention of the first case depends largely on the confidence in the
geologic review of the site, and in the confidence that all wellbores or other possible discharge points
have been located. Regarding the second case, fracture propagation theory concludes that a vertically
propagating fracture will roll over when the fracture becomes shallow enough that the least principal

Chapter No. 8 Practical Potential of Cuttings (Fracture) Re injection
78
stress direction becomes vertical. Natural fracture and faults in the formation must be noticed prior to the
cutting reinjection, in order to ensure safe disposal of waste.
Following injection, the height of the fracture can be determined from various types of logs including
temperature logging, and, if the injectate has been tagged by a radioactive isotope, through gamma ray
logging. If the depth of the fracture is shallow enough to enable the use of surface tiltmeters, or if
downhole inclinometers have been employed, the resultant, effectively permanent, change in the surface
displacement can be measured through the use of precision leveling techniques, and the geometry of the
fracture inferred.
8.6.1. Fracture Growth and Shape
A method of plugging a fracture in an inter well area of an underground formation penetrated by
a well bore which comprises the step of injecting a liquid slurry containing meshed solid waste, into said
formation through said well at a pressure in the range from the fracture opening pressure to below the
pressure required to create a fracture therein, said liquid slurry includes water as the carrier fluid
containing about 8.1kg to 11.8kg of meshed solid waste per gallon of water (Andrew and Others, 1996).
Fractures are formed through the deformation of rocks and soils. Fractures may also form from relatively
shallow phenomena such as slope movements, settlement, thermal expansion or the density and volume
changes associated with some chemical processes. Once formed, the permeability may be enhanced by
erosion and chemical dissolution or continued deformation, or the permeability may decrease from
mechanical closure, or fracture wall alteration. The fracturing simulation analysis helps us to predict the
volume of waste that can be disposed and also the expected geological conditions can be predicted.
Figure below gives some fracture simulation analysis (Ovalle and Others, 2009).
Figure 8.1: Fracturing Simulation Analysis (Ovalle and Others, 2009).
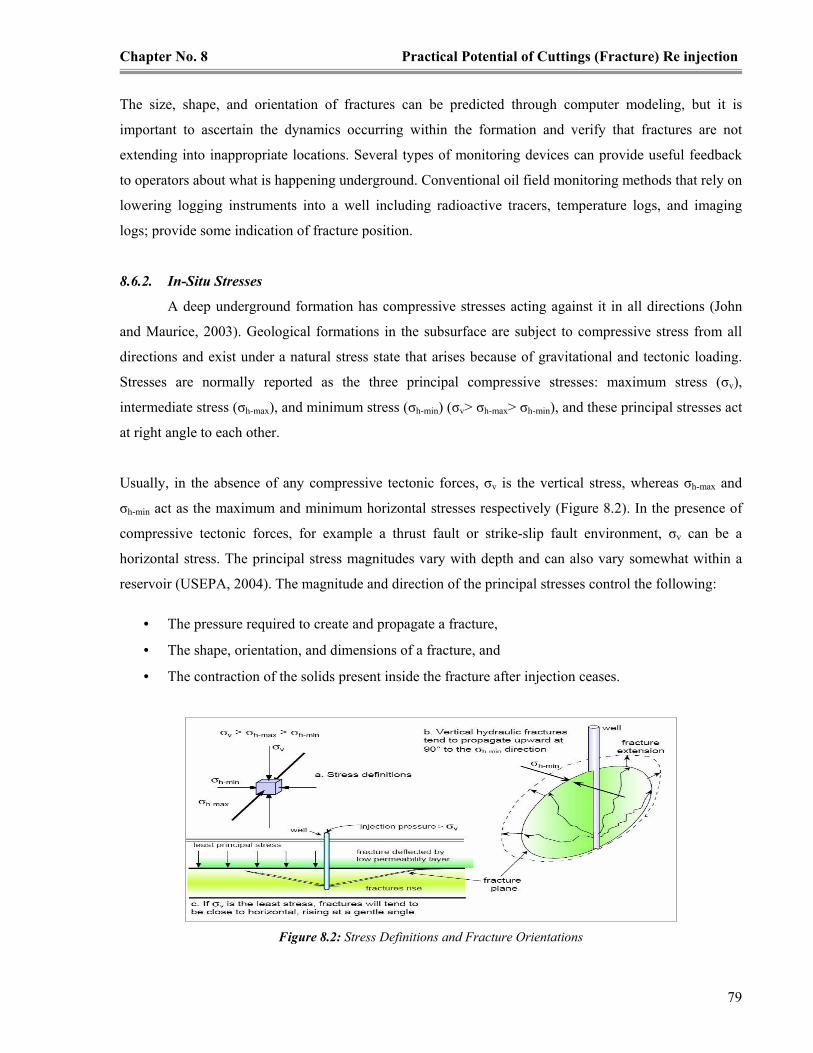
Chapter No. 8 Practical Potential of Cuttings (Fracture) Re injection
79
The size, shape, and orientation of fractures can be predicted through computer modeling, but it is
important to ascertain the dynamics occurring within the formation and verify that fractures are not
extending into inappropriate locations. Several types of monitoring devices can provide useful feedback
to operators about what is happening underground. Conventional oil field monitoring methods that rely on
lowering logging instruments into a well including radioactive tracers, temperature logs, and imaging
logs; provide some indication of fracture position.
8.6.2. In-Situ Stresses
A deep underground formation has compressive stresses acting against it in all directions (John
and Maurice, 2003). Geological formations in the subsurface are subject to compressive stress from all
directions and exist under a natural stress state that arises because of gravitational and tectonic loading.
Stresses are normally reported as the three principal compressive stresses: maximum stress (σv),
intermediate stress (σh-max), and minimum stress (σh-min) (σv> σh-max> σh-min), and these principal stresses act
at right angle to each other.
Usually, in the absence of any compressive tectonic forces, σv is the vertical stress, whereas σh-max and
σh-min act as the maximum and minimum horizontal stresses respectively (Figure 8.2). In the presence of
compressive tectonic forces, for example a thrust fault or strike-slip fault environment, σv can be a
horizontal stress. The principal stress magnitudes vary with depth and can also vary somewhat within a
reservoir (USEPA, 2004). The magnitude and direction of the principal stresses control the following:
• The pressure required to create and propagate a fracture,
• The shape, orientation, and dimensions of a fracture, and
• The contraction of the solids present inside the fracture after injection ceases.
Figure 8.2: Stress Definitions and Fracture Orientations

Chapter No. 8 Practical Potential of Cuttings (Fracture) Re injection
80
The minimum principal stress (σh-min) direction controls the orientation of a fracture, as well as its attitude
(horizontal or vertical). A fracture always propagates perpendicular to the least principal stress (σh-min)
direction (Figure 8.2) because σh-min provides the least resistance against fracture opening. Therefore, if
σh-min is horizontal, the fracture will be vertical and if σh-min is vertical, the fracture will be horizontal.
In the case of a shallow target reservoir, it is commonly observed that the overburden (vertical) stress has
become the least principal stress (σv = σh-min), whereas at a greater depth, it is the intermediate or major
stress (σh-max or σv). The magnitude of the vertical stress is controlled by the density of the overlying
rocks. In a tectonically passive area, poroelastic theory can be used to estimate the magnitude of σh-min.
Injection tests are generally carried out to measure σh-min (USEPA, 2004).
8.7. PUMPING TESTS
Constant rate pumping tests are performed for well. Pressure transducers that can detect water
level changes on the order of 0.1 mm are used to measure drawdown. Measurements in the pumping well
and observation wells are recorded as often as every 10 seconds. Wells that exhibited low yields during
drilling could not be sustained since water levels would fall beneath the upper fracture zone, and well
bore storage effects almost completely dominated the pumping well pressure response.
Observation well pressure transients typically deviated from an ideal confined aquifer response at early
pumping records (Andrew and Others, 1996). Transmissivity calculated from standard semi log pressure
transient analysis are usually similar from well to well. This describes how highly heterogeneous
fractured formations can respond like homogeneous porous formations. Pressure tests and monitoring
plays a vital role in CRI, from beginning to end. Figure 8.3 gives the pressure monitoring curves (Ovalle
and Others, 2009).
Figure 8.3: Pressure Monitoring while CRI Operation

Chapter No. 8 Practical Potential of Cuttings (Fracture) Re injection
81
8.8. SIZE DISTRIBUTION OF CUTTINGS SLURRY
Two things must be ensured for proper slurry particle size distribution. Firstly, to ensure that the
solids remain suspended in the slurry in the annulus/tubing and near wellbore fracture while still
pumpable or when pumping is halted, and secondly, to ensure that the particles are not large enough to
bridge of across the face of the fracture. A relatively fine grind on the cuttings was therefore seen as being
advantageous. This would have the extra benefit of providing inherent viscosity in the slurry, obviating
the need to add viscosifying chemicals.
Table 8.1: Particle Size Distribution Values for Typical Cutting Slurry
Distribution D10 D50 D90
Particle Size 3 µm 9 µm 120 µm
Particle size distribution values of typical mudstone and limestone cuttings slurry are shown in Table
above. With 50% of particles smaller than 9 microns the slurry has the potential for a high viscosity,
easily able to keep the 10% of particles larger than 120microns in suspension.
8.9. ENHANCEMENT IN SLURRY PROPERTIES
Slurry injection has been used successfully in many locations around the world to dispose of
drilling wastes and other solid materials. Although some injection jobs have not worked well, the reasons
for these problems are understood and can be overcome by proper siting, design, and operation. When
slurry injection is conducted at locations with suitable geological conditions and the injection process is
properly monitored, slurry injection can be a very safe disposal method. Because wastes are injected deep
into the earth below drinking water zones, properly managed slurry injection operations should pose
lower environmental and health risks than more conventional surface disposal methods. The observed
benefits resulting from solids rich and very fine particle slurry are many. Some of the more important
ones are given here:
•••• Finely milled and dense slurries are stable with no risk of settling in the process tanks or
pipework or in the well annulus/near wellbore fracture.
•••• Dense slurries require less surface injection pressure.
•••• Dense slurries results in lower volumes to handle on surface and less volume to formation giving
a longer injection life.
•••• Less erosion of equipment due to lower pumping rate and particle size.
•••• Consistent slurry is much less likely to plug or screen of the injection zone.

Chapter No. 8 Practical Potential of Cuttings (Fracture) Re injection
82
8.10. WELL BORE INTEGRITY
Subsurface rocks are under a balanced stress condition before a well is drilled (John and Maurice,
2003). Such equilibrium will be disturbed when a well is drilled. Although drilling fluid can partially
support the wellbore surface, the presence of a wellbore can cause the redistribution of stresses around
borehole. If stress concentration exceeds, the strength of rock, failure in the near wellbore region occurs.
Wellbore stability is a major concern in drilling operations. It is the major cause of nonproductive time
during drilling operation and costs the oil and gas industry more than $6 billion USD worldwide annually
(Yongfeng K. and Others, 2009). With the increasing demand of energy (oil and gas), drilling operations
move to the direction where more and more harsh environments are encountered. With more wells to be
drilled under high pressure and high temperature conditions, the industry expects more severe wellbore
stability problems to occur.
Although wellbore stability has been studied (experimentally and theoretically) for many years, it remains
one of the major challenges for the oil and gas industry due to the complex nature of the drilled
formations. Therefore a better understanding of wellbore stability is of imperative importance for the oil
and gas industry.
Wellbore instability is primarily a function of how rocks respond to the induced stress concentration
around the wellbore during various drilling activities. By considering different failure mechanisms
between the formation and drilling fluid interaction, several major wellbore models have been presented
over the last seventy years. Those models take into account the mechanical, chemical, hydraulic, or
thermal effects between the drilling fluid and the formation, or couple two or more effects in a model. The
time effect is also taken into account in some of the models. In most of the models, the rock is treated as a
continuous material or borehole failure is normally based on single initial failure point.
However, rocks are discontinuous materials formed under an environment of complex stresses. Also, it is
likely an overstatement to say that instability occurs when only one point fails. The rock is modeled as an
assembly of numerous grains bonded by cement like materials, and pore spaces are formed between the
small grains. The dynamics of rock grains is simulated and tracked on a computer. Micro cracks (because
of tensile or shear failure) occurring at stress concentrated zones and their coalescence to form macro
fractures are tracked. The borehole shape and size are tracked with time.
Chapter No. 8 Practical Potential of Cuttings (Fracture) Re injection
83
8.10.1. Common Wellbore Stability Related Problems
The general problems with the common wellbore stability are:
• Tight spots and stuck pipe,
• Hole caving or collapse and pack offs,
• Hole enlargement or shrinkage,
• Lost circulation,
• Wellbore breathing, and / or
• Kick insufficient hole or casing size.
8.10.2. Key Points
The following key points must be considered while dealing with borehole stability;
• Wellbore instability costs are significant,
• Wellbore stability depends on drilling practices, in-situ rock parameters,
• Wellbore instability occurs when the near wellbore stresses exceed rock strengths,
• Wellbore stability analysis needs to be carried out using well logs, and drilling reports, and
• Hole orientation, chemical interaction and temperature can have significant effects on stresses
around the wellbore and can affect breakdown and collapse pressures.
8.11. MONITORING AND VERIFICATION
Monitoring and verification of CRI operations are integral parts of the operation’s quality
assurance process, and often can lead operational procedure changes and minimize or avoid many
problems. The key for managing the potential risks/hazards is to place multiple barriers or controls
between the hazards and undesirable consequences, to prevent the potential hazards from becoming
undesirable consequences.
Multiple quality controls or risk management procedures include valid geology and well data evaluation,
advanced hydraulic fracturing modeling, injection well testing and model validation, and monitoring
during the CRI operation. At a minimum, injection operators should continuously monitor injection
pressure and injection rate. The slurry characteristics (density, composition) should also be frequently
monitored.

Chapter No. 8 Practical Potential of Cuttings (Fracture) Re injection
84
Pressure: Pressure measurement gives a real time indication of what is happening underground. Any
pressure trends that are notably different from those anticipated suggest that the formation is not behaving
in the way predicted. Analysis of pressure behavior allows fracture model predictions to be validated.
Rate and Volume: The rate of injection can be determined by counting the strokes per minute of the
positive displacement pumping unit and multiplying by the displacement of the pump. Total volume can
be determined by multiplying rate times duration.
Slurry Characteristics: Different slurry characteristics like, density can be measured manually at
frequent intervals or can be continuously monitored with nuclear densitometers. Viscosity, particle size
distribution, and solids content can be directly measured at intervals through flowline sampling.
8.12. LOGGING METHODS APPLICABLE TO SLURRY INJECTION
Several types of well bore logging are employed to have safe slurry injection operation. Like;
Radioactive Tracer Logging: The injected solid material is tagged with a radioactive tracer having a short
half life. The tagged material can be located using a gamma ray logging tool if the vertical fracture plane
intersects the well bore axis. However, this gives just a rough approximation of the fracture location
behind the injection well bore because the tagged material may only enter a portion of the fractured zone.
Temperature Logging: Digital temperature gauges can be run downhole on a wire line. A log is run
before injection is started to serve as a baseline and again after injection. The temperature of the slurry is
close to ambient atmospheric temperatures, which are generally cooler than the formation temperatures.
Where the temperature log indicates cooler zones downhole, there is a likelihood that slurry is nearby.
This can also lead to an approximation of the fracture height adjacent to the well bore. Similarly to
radioactive tracer logging, this method is ineffective if the injection well is inclined or if the fracture plane
is horizontal.
Imaging Logs: Formations can be assessed by various imaging tools that are lowered on wire lines. One
tool that was used is a Formation Micro Imaging log that measures changes in resistivity as the tool
passes a fracture. Another advantage of this tool is that it has directional survey capabilities to determine
its location in three dimensions. However, it does require a non cased borehole, and all that the tool can
determine is the fracture geometry at the well bore wall: it can determine nothing about the propagation of
the fracture beyond this small region.

Chapter No. 8 Practical Potential of Cuttings (Fracture) Re injection
85
8.13. SLURRY INJECTION DATABASE
The slurry injection database contains full or partial information on 334 injection jobs from
around the world. The information was distilled from numerous published articles and papers, from
unpublished reports, and from data supplied directly by several producers, service companies, and a
regulatory agency. The three leading areas in which slurry injection is represented in the database are
Alaska (129 records), Gulf of Mexico (66 records), and the North Sea (35 records). There are far more
total wells in the Gulf of Mexico than in the other two areas so that the actual proportion of slurry
injection jobs for Gulf of Mexico wells is probably much lower than for the other two areas.
8.14. ADVANTAGES AND DISADVANTAGES OF CRI
Table below highlights few of the advantages and disadvantages of CRI.
Table 8.2: Advantages and disadvantages of slurry reinjection
Aspects Advantages Disadvantages
Economics
•••• Enables use of a less expensive drilling fluid.
•••• No offsite transportation needed. •••• Ability to dispose of other wastes
that would have to be taken to shore for disposal.
•••• Expensive and labor intensive. •••• Shutdown of equipment can halt
drilling activities.
Operational
•••• Cuttings can be injected if pretreated.
•••• Proven technology.
•••• Extensive equipment and labor requirements.
•••• Application requires receiving
formations with appropriate properties.
•••• Casing and wellhead design
limitations. •••• Variable efficiency. •••• Difficult for exploration wells due
to lack of knowledge of formations.
Environmental
•••• Elimination of seafloor impact. •••• Limits possibility of surface and
ground water contamination.
•••• Increase in air pollution due to large power requirements.
•••• Possible breach to seafloor if not
designed correctly.
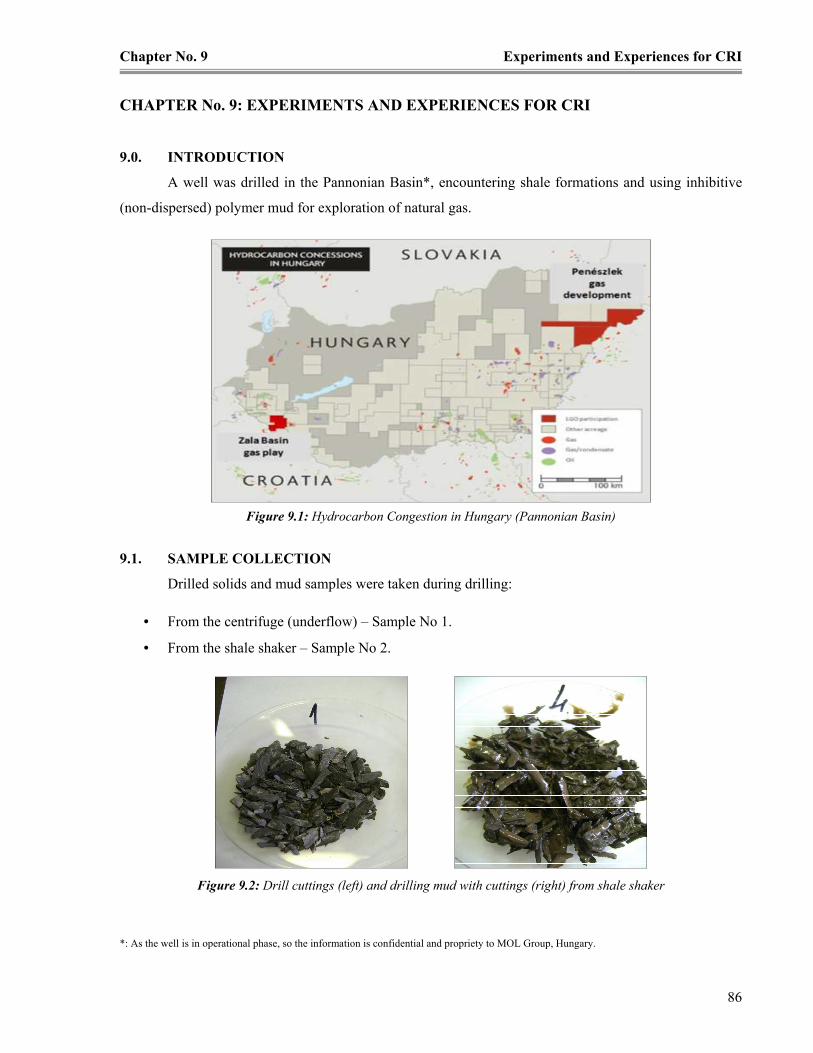
Chapter No. 9 Experiments and Experiences for CRI
86
CHAPTER No. 9: EXPERIMENTS AND EXPERIENCES FOR CRI
9.0. INTRODUCTION
A well was drilled in the Pannonian Basin*, encountering shale formations and using inhibitive
(non-dispersed) polymer mud for exploration of natural gas.
Figure 9.1: Hydrocarbon Congestion in Hungary (Pannonian Basin)
9.1. SAMPLE COLLECTION
Drilled solids and mud samples were taken during drilling:
• From the centrifuge (underflow) – Sample No 1.
• From the shale shaker – Sample No 2.
Figure 9.2: Drill cuttings (left) and drilling mud with cuttings (right) from shale shaker
*: As the well is in operational phase, so the information is confidential and propriety to MOL Group, Hungary.
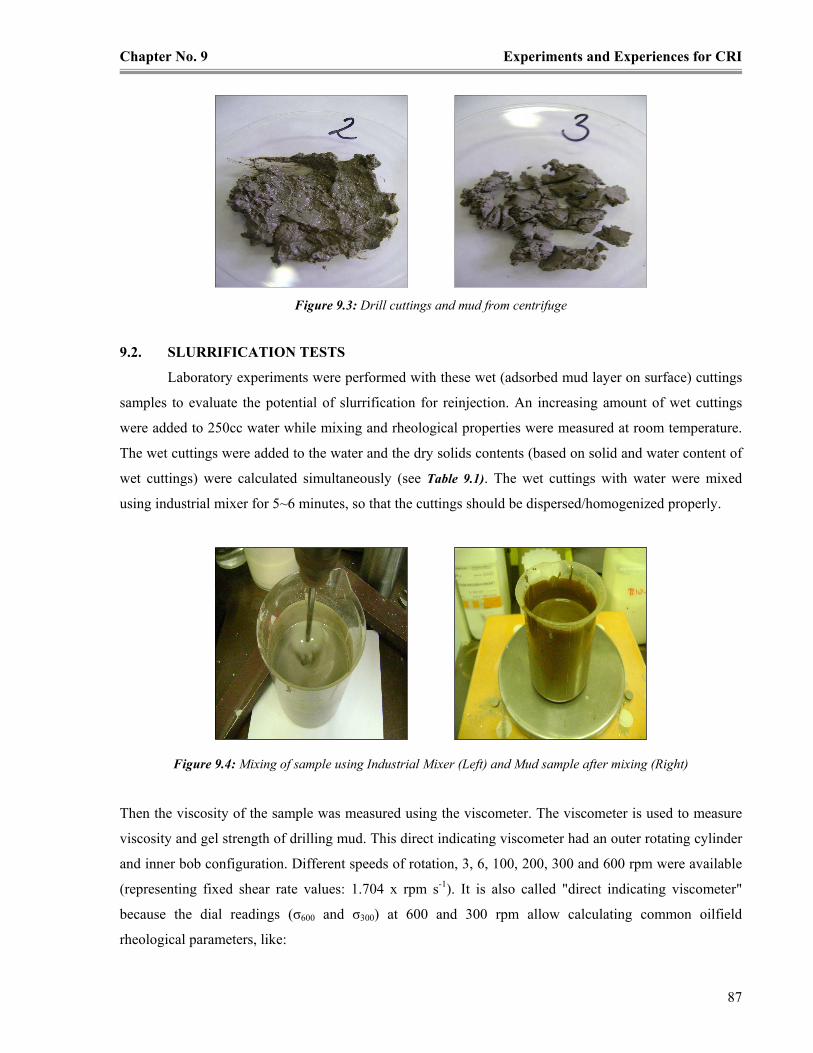
Chapter No. 9 Experiments and Experiences for CRI
87
Figure 9.3: Drill cuttings and mud from centrifuge
9.2. SLURRIFICATION TESTS
Laboratory experiments were performed with these wet (adsorbed mud layer on surface) cuttings
samples to evaluate the potential of slurrification for reinjection. An increasing amount of wet cuttings
were added to 250cc water while mixing and rheological properties were measured at room temperature.
The wet cuttings were added to the water and the dry solids contents (based on solid and water content of
wet cuttings) were calculated simultaneously (see Table 9.1). The wet cuttings with water were mixed
using industrial mixer for 5~6 minutes, so that the cuttings should be dispersed/homogenized properly.
Figure 9.4: Mixing of sample using Industrial Mixer (Left) and Mud sample after mixing (Right)
Then the viscosity of the sample was measured using the viscometer. The viscometer is used to measure
viscosity and gel strength of drilling mud. This direct indicating viscometer had an outer rotating cylinder
and inner bob configuration. Different speeds of rotation, 3, 6, 100, 200, 300 and 600 rpm were available
(representing fixed shear rate values: 1.704 x rpm s-1). It is also called "direct indicating viscometer"
because the dial readings (σ600 and σ300) at 600 and 300 rpm allow calculating common oilfield
rheological parameters, like:

Chapter No. 9 Experiments and Experiences for CRI
88
• Apparent Viscosity (AV) as σ600/2 in mPa.s
• Viscosity at 300 rpm as σ300 in mPa.s
• Plastic viscosity (PV) as σ600 - σ300 in mPa.s
For example, at 600 rpm the dial reading (shear stress) 100 (lb/100ft2) and at 300 rpm the dial reading
(shear stress) 60 (lb/100ft2), the AV and PV is 50 mPa.s and 40 mPa.s respectively.
Figure 9.5: Viscosity measurement of samples using Fann Viscometer
Data in Table 9.1 show that more then 700g of wet cuttings (or 560g on dry basis) can be added to 250cc
water and still gives pumpable slurry, which can be reinjected into deep geological formations.
Slurry properties measured with Fann viscometer are summarized here.
Table 9.1: Solid Drilling Waste (Centrifuge underflow)
Sample No. 1 Solids content: 78.7% (w/w) Water content: 21.3 % (w/w)
Wet waste added
(g) /250cc Water 204 304 404 510 560 610 660 710
Dry solid content
of added waste (g) 160.55 239.25 317.95 401.37 440.72 480.07 519.42 558.77
Fann Dial
Readings (rpm) Shear stress values (lb/100 ft
2, or σx x 0.511 Pa)
600 17 28 46 73 88.5 107 128 148
300 9 16 28 45 55 67 80.5 93
200 7 12.5 22 35 43 53 62 71
100 4.5 8 14 23 28 34 40 46
6 1.5 2.5 3 5 7 9 11.5 14
3 1 1.5 2.5-3 4 6 7 10.5 13.5

Chapter No. 9 Experiments and Experiences for CRI
89
Data in Table 9.2 show that at least 500g of wet cuttings (or 300g on dry basis) can be added to 250cc
water and still gives pumpable slurry, having almost identical rheological properties to the previous one.
Table 9.2: Solid Drilling Waste (From shale shaker)
In the third series of tests the wet cuttings were mixed to spend drilling fluids, a non dispersed polymer
mud and a dispersed system. Measured rheological properties were summarized in Table 9.3.
Table 9.3: Solid Drilling Waste (From shale shaker)
Sample No. 2 Base: Polymer Mud Base: Dispersed Mud
Wet waste added
(g) /250cc Mud 0 33.4 133.5 0 55.3 182
Dry solid content
of added waste (g) 0.00 20.25 80.90 0.00 33.51 110.29
Fann Dial
Readings (rpm) Shear stress values (lb/100 ft
2, or σx x 0.511 Pa)
600 69 86 144 32 44 158
300 52 66 112 17 26 108
200 45 57 97 10 19 87
100 34 44 72 6.5 11 57
6 14.5 18.5 29 2 3 17
3 12.5 15 25.5 2 2 14
Sample No. 2 Solids content: 60.6% (w/w) Water content: 39.4 % (w/w)
Wet waste added
(g) /250 cc Water 100 200 250 300 350 400 450 500
Dry solid content
of added waste(g) 60.60 121.20 151.50 181.80 212.10 242.40 272.70 303.00
Fann Dial
Readings (rpm) Shear stress values (lb/100 ft
2, or σx x 0.511 Pa)
600 16 42 61 81 100 115 130 145
300 10.5 27 40 53 66 77 88 99
200 7.5 20.5 31 41.5 53 61 71 79.5
100 6 14 22 28 35 42 49 55.5
6 2 4 6 8 10 12 15 18
3 1.5 3 4.5 6.5 8 10 13 16

Chapter No. 9 Experiments and Experiences for CRI
90
The particle size distribution was measured for the particle size range of 0.020µm to 2000µm, using laser
beam scattering technique (Mastersizer 2000). Figures 9.6, illustrates the cumulative undersize and
differential particle size distribution curves of slurry composition prepared from discharge of centrifuge.
Figure 9.6: Typical PSD of Sample No. 1
The results for the slurry particle size distribution prepared from mud obtained at the discharge of
centrifuge are highlighted in table below. The specific surface area of the slurry was 0.68m2/g.
Table 9.4: Particle Size Distribution Values for Cutting Slurry from discharge of Centrifuge
Distribution D10 D50 D90
Particle Size 4.5 µm 22 µm 69 µm
The particle size distribution was measured for the particle size range of 0.020µm to 2000µm, using laser
beam scattering technique (Mastersizer 2000). The specific surface area of the slurry was 0.155m2/g.
Figures 9.7, illustrates the cumulative undersize and differential particle size distribution curves of
different slurry compositions prepared from discharge of shale shaker.
Figure 9.7: Typical PSD of Sample No. 2

Chapter No. 9 Experiments and Experiences for CRI
91
The results for the slurry particle size distribution prepared from mud obtained at the discharge of shale
shaker are highlighted in table below.
Table 9.5: Particle Size Distribution Values for Cutting Slurry from discharge of Shale Shaker
Distribution D10 D50 D90
Particle Size 26.5 µm 185 µm 388 µm
Here it is clearly seen that the mean particle size much larger in case of slurrified wet cuttings obtained
from the Shale Shaker.
9.3. FLOW BEHAVIOR OF SLURRIES
Flow behavior the lab prepared waste slurries can be best described with the power law
rheological model. Best fitted simulation data show both n value and K (consistency) index. The Power
Law model (sometimes known as the Ostwald model) is an easy to use model that is ideal for shear
thinning, relatively mobile fluids such as weak gels and low viscosity dispersions. The Power Law model
is a useful rheological model that describes the relationship between viscosity or shear stress and shear
rate over the range of shear rates where shear thinning occurs in a Non Newtonian fluid. This model
quantifies overall viscosity range and degree of deviation from Newtonian behavior. The model is
nothing more than the Newtonian model, with an added exponent on the shear rate term:
(3)
Where;
η = Viscosity, and •
γ = Shear Rate.
K is often known as the consistency coefficient. This describes the overall range of viscosities across the
part of the flow curve that is being modeled. The exponent n is known as the Power Law Index (or
sometimes the Rate Index). For a shear thinning fluid: 0 < n < 1. The more shear thinning the sample, the
closer n is to zero. Also, if the Power Law region includes “1/s” shear rate then K is the viscosity or stress
at that point. The flow curves in figure 9.8 show the relation between shear stress and shear rate for the
specific waste slurries. The flow curves fit very well to the Power Law model. With the help of these
curves we can easily identify the exponential behavior of fluids (slurries) over the range of shear rates.
The viscosities of slurries consistently increase with cuttings loading.
1−•
=n
K γη
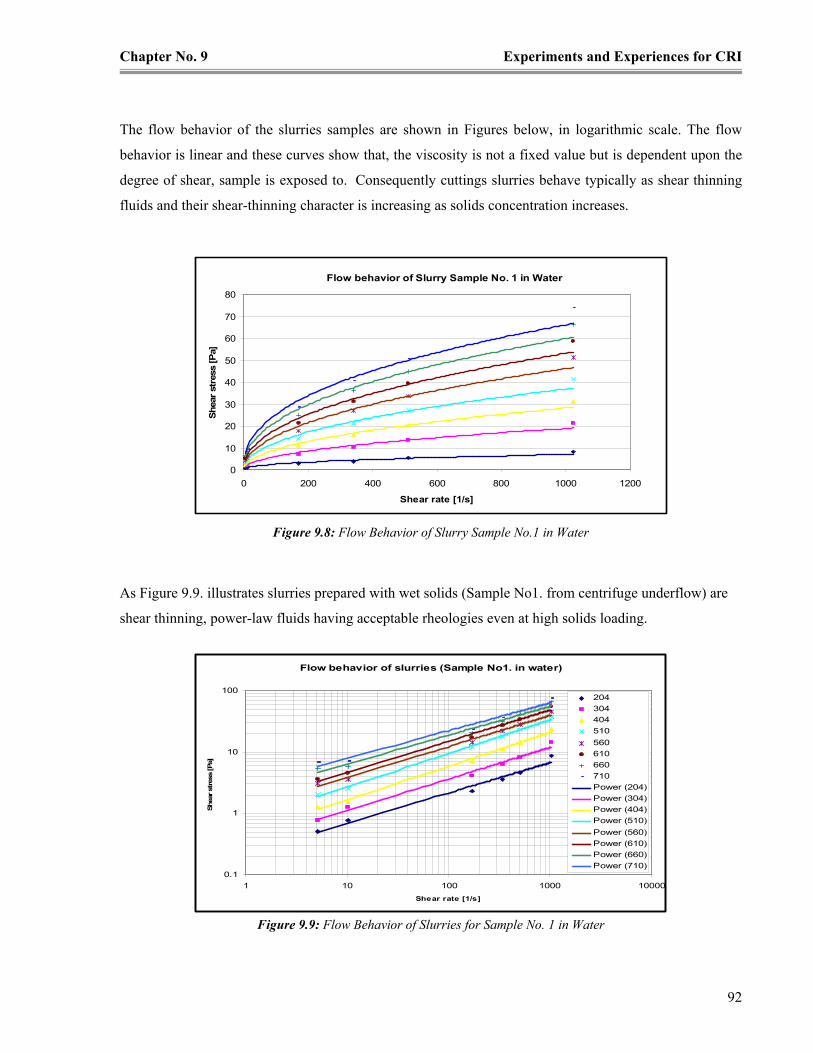
Chapter No. 9 Experiments and Experiences for CRI
92
The flow behavior of the slurries samples are shown in Figures below, in logarithmic scale. The flow
behavior is linear and these curves show that, the viscosity is not a fixed value but is dependent upon the
degree of shear, sample is exposed to. Consequently cuttings slurries behave typically as shear thinning
fluids and their shear-thinning character is increasing as solids concentration increases.
Figure 9.8: Flow Behavior of Slurry Sample No.1 in Water
As Figure 9.9. illustrates slurries prepared with wet solids (Sample No1. from centrifuge underflow) are
shear thinning, power-law fluids having acceptable rheologies even at high solids loading.
Figure 9.9: Flow Behavior of Slurries for Sample No. 1 in Water
Flow behavior of slurries (Sample No1. in water)
0.1
1
10
100
1 10 100 1000 10000
Shear rate [1/s]
Shear stress [Pa]
204
304
404
510
560
610
660
710
Power (204)
Power (304)
Power (404)
Power (510)
Power (560)
Power (610)
Power (660)
Power (710)
Flow behavior of Slurry Sample No. 1 in Water
0
10
20
30
40
50
60
70
80
0 200 400 600 800 1000 1200
Shear rate [1/s]
Shear stress [Pa]
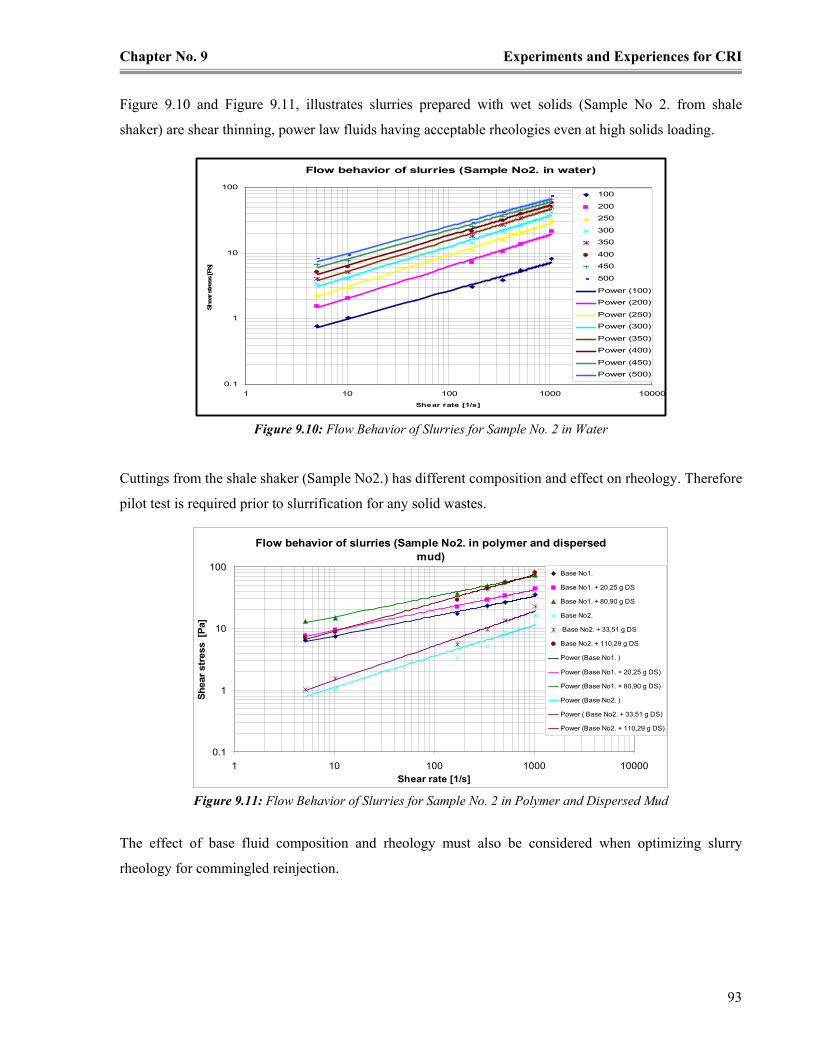
Chapter No. 9 Experiments and Experiences for CRI
93
Figure 9.10 and Figure 9.11, illustrates slurries prepared with wet solids (Sample No 2. from shale
shaker) are shear thinning, power law fluids having acceptable rheologies even at high solids loading.
Figure 9.10: Flow Behavior of Slurries for Sample No. 2 in Water
Cuttings from the shale shaker (Sample No2.) has different composition and effect on rheology. Therefore
pilot test is required prior to slurrification for any solid wastes.
Figure 9.11: Flow Behavior of Slurries for Sample No. 2 in Polymer and Dispersed Mud
The effect of base fluid composition and rheology must also be considered when optimizing slurry
rheology for commingled reinjection.
Flow behavior of slurries (Sample No2. in polymer and dispersed
mud)
0.1
1
10
100
1 10 100 1000 10000
Shear rate [1/s]
Shear stress [Pa]
Base No1.
Base No1. + 20,25 g DS
Base No1. + 80,90 g DS
Base No2.
Base No2. + 33,51 g DS
Base No2. + 110,29 g DS
Power (Base No1. )
Power (Base No1. + 20,25 g DS)
Power (Base No1. + 80,90 g DS)
Power (Base No2. )
Power ( Base No2. + 33,51 g DS)
Power (Base No2. + 110,29 g DS)
Flow behavior of slurries (Sample No2. in water)
0.1
1
10
100
1 10 100 1000 10000
Shear rate [1/s]
Shear stress [Pa]
100
200
250
300
350
400
450
500
Power (100)
Power (200)
Power (250)
Power (300)
Power (350)
Power (400)
Power (450)
Power (500)

Chapter No. 9 Experiments and Experiences for CRI
94
9.4. CONCLUSION FROM TESTS
It can be concluded from above results that slurry preparation for reinjection must be supported
by laboratory tests to achieve the best formulation for specific reinjection conditions. Optimum
rheological properties (at maximum waste loading) play key role in success of reinjection process.
It was also concluded that the (spent) polymer drilling fluid system can incorporate substantially
less cuttings than the dispersed one. Therefore the base fluid properties are important input data in
slurrification design. Power Law modeling shows the linear rheology in all of the samples that the slurry
behavior is consistent in the practical shear rates range. With the consistency in rheological behavior of
slurries, these laboratory results have clearly proved that in addition to drilled cuttings slurrification in
water, commingled reinjection of spent drilling fluids and cuttings can be a viable option for safe disposal
of drilling wastes.
These results and data can further be used to support hydraulic simulation and/or fracture design of the
reinjection process.
9.5. CUTTINGS RE-INJECTION (SLURRY RE-INJECTION) EXPERIENCES
The important parameters recognized by different workers and operating companies for CRI are
the followings:
• Permeability: The capacity to flow fluids will affect both the fluid leak-off rate from the injected
slurry, as well as the rate of flow of generated gases upward through the host medium. The
capacity to leak-off slurry liquid will depend more on horizontal permeability, the efficacy of gas
segregation will depend on vertical permeability and on capillarity.
• Porosity: The storability of any geological material depends upon the porosity. High porosity is
important to accommodate the liquid phase of the injected waste slurry.
• Thickness and Areal Extent: A large thickness and a large areal extent of reservoir rock are
necessary to keep induced fractures contained within the target zone, and to help provide
sufficient volume of storage for the expelled fluids (volumetric capacity with perfect
displacement = thickness × width × length × porosity).
• Reservoir Depth: The injection depth must be sufficient to eliminate all reasonable risk of potable
water contamination, yet not so deep as to require massive pumping capability to sustain fracture
injection.

Chapter No. 9 Experiments and Experiences for CRI
95
• Alternating Sequence of Sandstone and Shale: A shale layer acts as a flow and a stress barrier,
whereas a sandstone layer acts as a rapid fluid leak-off zone. An alternating sequence of
sandstone and shale will limit upward fracture growth because permeable beds above the
injection horizon will enhance leak-off and arrest vertical fracture growth.
• Cap Rock and its Thickness: A thick layer of cap rock (low permeability strata) will act as a
confining unit above the reservoir rock. It will act as a flow and a stress barrier.
• Reservoir Strength: An ideal reservoir rock should be weak in tension (low cohesion or intensely
fractured); it will then offer less resistance against breaking (tensile parting) at low values of
effective stress.
• Reservoir Compressibility: A highly compressible rock will more easily produce thick (wide
aperture) fractures during injection; therefore, it will more easily accommodate large volumes of
solid waste.
• Structural/Tectonic History: A structurally and tectonically passive disposal site will more
securely contain injected waste in the target stratum by eliminating the chances of upward fluid
migration paths through pre-existing fractures and faults.
9.5.1. Experiences of CRI Leakages
Unanticipated leakage to the environment not only creates a liability to the operator, but it also
generally results in a short-term to permanent stoppage of injection at that site. Further, whenever
injection jobs result in leakage, the confidence of regulators who must approve the practice will be
diminished.
Several of the largest injection jobs reported has resulted in leakage. The demonstration phase of the
Grind and Inject Project at Prudhoe Bay, Alaska, operated continuously for portions of 3 years. In 1997,
fluids were observed broaching to the surface at multiple locations near the injection well. Injection was
stopped, and leaked fluids were collected for disposal. The cause of the broaching was believed to be
intersection of the injection plume with other nearby uncemented well bores that lead to the surface. The
project demonstrated that slurry injection is effective in disposing of large volumes of drilling waste but
highlighted the need for guaranteed well bore integrity. The operators of the Grind and Inject Project
drilled three new dedicated injection wells designed and constructed to minimize the potential for
communication of fluids.
At the North Sea Asgard platform, several wells showed leakage at the sea floor. This leakage was
presumed to be due to poor cementing jobs.

Chapter No. 9 Experiments and Experiences for CRI
96
9.5.2. Experiences from Duri Oilfield, Indonesia
The Duri Region in Indonesia is part of a sedimentary basin constituting the northeastern half of
Sumatra. Geologically the basin is quite young in age and immature, and is composed of alternating sand
and shale litho units. The sands are loose and unconsolidated, therefore are suitable candidates for deep
slurry injection operations. In some parts, the Duri oilfield is a faulted anticlinal structure producing the
oil from the structural traps.
Based on the geological data, different well tests, and geophysical logs, experts of Terralog Technologies
Inc selected sandstones of the Pematang and Dalam Formations as target reservoirs for deep slurry
injection operations in the Duri oilfield, Indonesia (TTI2, 2001), and presently TTI is performing
successful injection of slurried oilfield waste in these formations. These formations were evaluated and
the important characteristics of the Pematang and Dalam formations are shown in Table 9.6. The
evaluation results satisfied the minimal requirements for slurry injection and so the injection of oilfield
waste was started (Nadeem, 2005).
Table 9.6: Data for target reservoir in Duri Oilfield
Target Reservoir Pematang Formation Dalam Formation
Permeability (mD) 1800 4700
Reservoir Thickness (m) 21 13
Porosity (%) 18 30
Depth (m) 394 370
Geographical Distance
(km) ~10 ~10

Chapter No. 10 Conclusions and Recommendations
97
CHAPTER No. 10: CONCLUSIONS AND RECOMMENDATIONS
After completion of my thesis work, having some practical knowledge from the experiments and referring
the texts, I would like to highlight some concluding words and recommendations, which can enhance the
current practices for environmental management of drilling muds (fluids).
1. The hydrocarbon exploration and production waste management regulations play a key role in
contributing for preservation of the water resources, and sub surface soil, for any potential use.
Environmental regulations for the disposal of drilling waste must be reviewed, consulting the
experts from relevant fields, to have environmental friendly atmosphere. The specific regulations
in EU for Hydrocarbon exploration and production waste must be formulated to establish clear
boundaries for relevant waste management.
2. The new techniques like Environmental Friendly Drilling and low Impact Drilling must be
implemented by the operators, in order to enhance global efforts for minimization of drilling
waste generation. The role of high performance water based muds and efficient solids control is
dominant in closed loop system drilling system. This system not only enables less waste
generation but also focuses on the preservation of natural resources.
3. The liquid or cuttings re injection is a safe disposal technique and meets with environmental
regulations for waste disposal in most of the exploratory regions. The disposal of oil base cuttings
and rig waste by slurrification and annular injection is a mechanically viable alternative to
conventional land based disposal. The characteristics and chemical composition of the drilling
mud must be clearly identified, so that polymers or gels must be avoided for injection to
subsurface. There is good potential of liquid or cuttings re injection in Hungary, preferentially
into naturally fractured formations.
4. Depleted oilfields are preferred sites for deep injection operations as compared to a virgin area. It
is easy to obtain the required data for the purpose of site assessment from depleted oilfields, and
also such sites provide the ideal geological conditions that are considered to be a prerequisite for
a site for CRI operation. Injection pressures for fracture initiation were as projected by pre-job
fracture analysis. Results of the fracture modeling proved invaluable for use in this environment,
and should be adopted as standard protocol for any future efforts.

Chapter No. 10 Conclusions and Recommendations
98
5. CRI has been used successfully in many locations around the world. Although some injection
jobs have not worked well, the reasons for these problems are understood and can be overcome
by proper siting, design, and operation. CRI can be a very safe disposal method. Because wastes
are injected deep into the earth below drinking water zones, properly managed CRI operations
pose lower environmental and health risks than more conventional surface disposal methods.
6. There is need of further research, development and commercialization in the field of
bioremediation or vermiculture for drilling fluids treatment and disposal. These methods may
come as comparatively cheap, more environmental friendly, with minimum risk of failures that
also might be easily adaptable solutions for all the drilling fluids related environmental issues.

xv
List of References
Books:
1. Darley H. and George R. 1988. Composition and properties of drilling and completion fluids. 5th
ed. Houston: Gulf Professional Publishing. 654p.
2. ASME Shale Shaker Committee. 2005. Drilling fluids processing handbook. Houston: Gulf
Professional Publishing. 693p.
3. James A. and others. 1999. Shale shakers and drilling fluid systems. Houston, USA: Gulf
Publishing Company. 352p.
4. Baker Hughes INTEQ. 1998. Fluid facts engineering handbook. Rev. B. Houston USA: Technical
Communications Group Baker Hughes. 489p.
Papers / Articles:
1. Richard C. and others. 2007. AADE-07-NTCE-54: Minimizing waste during drilling operations.
AADE National Technical Conference and Exhibition held at Houston, USA: American
Association of Drilling Engineers. 10p.
2. Michael S. and others. 1997. SPE 38254: Field experiences with oil field waste disposal through
slurry fracture injection. Annual Western Union Meeting California, USA: Society of Petroleum
Engineers. 10p.
3. Reddoch J. and others. 1996. SPE 35328: Successful drill cuttings reinjection (CRI) case history
with multiple producing wells on a subsea template utilizing low cost natural oil based mud.
Petroleum Conference & Exhibition of Mexico: Society of Petroleum Engineers. 16p.
4. Reddoch J. and others. 1993. SPE/IADC 25755: Onsite disposal of rig generated waste via
slurrification and annular injection. SPE/IADC Drilling Conference, Amsterdam: Society of
Petroleum Engineers. 15p.
5. Doug, F. and others. 2003. AADE-03-NTCE-30: Third generation high performance water based
fluid successfully replaces oil based fluid at Ricinus and Narraway Alberta. Houston, USA:
American Association of Drilling Engineers. 8p.
xvi
6. Dearing, H. and others. 2004. AADE-04-DF-HO-28: Flexible drilling fluid formulation and
application. AADE 2004 Drilling Fluids Conference, Houston, USA: American Association of
Drilling Engineers. 11p.
7. Richard, L. and others. 2006. AADE-06-DF-HO-31: Meeting deepwater challenges with high
performance water based mud. AADE 2006 Fluids Conference, Houston, USA: American
Association of Drilling Engineers. 11p.
8. Ammanullah, M. 2007. Environmentally friendly mud additives for superior drilling fluid design to
meet the current and future technical and environmental challenges. Aberdeen, UK:
Commonwealth Scientific and Research Organization (CSIRO) Petroleum. 4p.
9. John, C. and others. 2006. Designing environmental performance into new drilling fluids and waste
management technology. 13th International Petroleum Environmental Conference San Antonio,
Texas, USA: Candler and Friedheim. 18p.
10. Cognis Oilfield Chemicals. 2005. High performance ester based drilling fluids. Germany: The Oil
and Gas Review 2005. 2p.
11. Karen, B. 2006. Effective drilling waste management reduces well construction costs. JPT July
2006. 2p.
12. Manny. G. and Wayne C. 2005. New reduce, reuse, recycle drilling waste treatment technologies
and programs. Texas, USA: 10p.
13. Richard C. and others. 2008. SPE 114592: Determining environmental tradeoffs associated with
low impact drilling systems. Houston Advanced Research Center, USA: Society of Petroleum
Engineers.15p.
14. Growcock B. and Others. 2006. Recent Advances in Aphron Drilling Fluids. Drilling Conference
held in Miami, Florida, U.S.A: Society of Petroleum Engineers. 7p.
15. Ovalle A. and Others. 2009. SPE 122303. Waste Injection: The environmentally safe and cost
effective solution for ultimate waste disposal. SPE Latin American and Caribbean Petroleum
Engineering Conference, Cartagena, Colombia: Society of Petroleum Engineers. 10p.
16. Alberto P. and Others. 2009. SPE 122180. Well treatment fluids prepared with oilfield produced
water. SPE Annual Technical Conference and Exhibition. New Orleans, USA. Society of
Petroleum Engineers. 25p.
17. Dovan T. and Others. 1991. Drilling mud disposal techniques. Union Oil Company of California,
Los Angeles, USA. 6p.
xvii
18. Richard C. and others. 2009. By adopting low-impact technologies, industry can change
perceptions, open off-limits acreage. Houston Advanced Research Center, USA: Drilling
Contractor.3p.
19. Yongfeng K. and Others. 2009. Wellbore stability: A critical review and introduction to DEM. SPE
Annual Technical Conference and Exhibition, New Orleans, Louisiana, USA. Society of Petroleum
Engineers. 24p.
20. Newman K. and Others. 2009. SPE 122415. Multistage centrifugal pumps for drilling and
production waste injection operation. SPE Asia Pacific Conference, Jakarta, Indonesia. Society of
Petroleum Engineers. 11p.
Other Literature:
1. Alberta Energy and Utilities Board. 1996. Guide 50 - Drilling waste management. Revised Ed.
Alberta, Canada: Alberta Energy And Utilities Board. 143p.
2. Alberta Environment. 2009. Assessing drilling waste disposal areas - Compliance options for
reclamation certification. Alberta, Canada: Alberta Sustainable Resource Development. 34p.
3. United States Environmental Protection Agency. 2000. EPA-542-R-00-003: Innovations in site
characterization: Geophysical investigation at hazardous waste sites. Washington D.C., USA: EPA
Publications. 166p.
4. International Association of Oil and Gas Producers. 2003. Report No: 342 - Environmental aspects
of the use and disposal of non aqueous drilling fluids associated with offshore oil & gas operations.
Brussels, Belgium: OGP Publications. 114p.
5. Drilling and Work Engineering Department. 2006. Saudi Aramco Drilling Manual. Saudi Arabia:
Saudi ARAMCO Drilling and Workover Engineering Department. 1046p.
6. David B. 2007. Drilling fluid. Houston Texas, USA: BP Research. 4p.
7. John H. 2007. Drilling fluid properties & functions. Illinois, USA: CETCO Drilling Products. 7p.
8. Martin V. and Max R.1996. Drilling fluids technology. Revised ed. USA: Exxon Company. 366p.
9. Saskatchewan Energy and Mines. 2009. Saskatchewan drilling waste management guidelines.
Canada: Saskatchewan Energy and Mines, Petroleum Development Branch. 38p.
10. Environmental Resources Management and Consultec. 2005. Environmental impact assessment for
Sasol’s off shore exploration project in blocks 16 and 19. Maputo, Mozambique: Sasol Petroleum
Sofala. 13p.

xviii
11. Ministry of Environment. 2007. Oil and gas waste regulation – Users guide. USA: Environmental
Protection Division. 41p.
12. Environmental Studies Research Funds. 2004. Drilling waste management recommended best
practices. Canada: ESRF Publications. 50p.
13. Government of Northwest Territories. 2006. Waste management. USA: Anchor Field Design. 14p.
14. John A. Veil Argonne National Laboratory. 1998. Data summary of offshore, drilling waste
disposal practices. U.S. EPA and U.S. Department of Energy Office of Fossil Energy. 34p.
15. California Stormwater Quality Association. 2003. WM-10 Liquid waste management. California
Stormwater BMP Handbook. 4p.
16. European Commission of the European parliament and of the Council. 2006. Management of waste
from extractive industries and amending directive 2004/35/EC. Official Journal of EU. 19p.
17. European Commission of the European parliament and of the Council. 2007. Notification by the
Hungarian Government under Directive 94/22/EC of the European Parliament and of the Council
of 30 May 1994 on the conditions for granting and using authorizations for the prospection,
exploration and production of hydrocarbons. Official Journal of European Union. 4p.
18. DG Environment, European Commission. 2001. Management of mining, quarrying and ore-
processing waste in the European Union. BRGM Publications. 88p.
19. Technical Committee, International Society for Soil Mechanics and Geotechnical Engineering.
2005. Geotechnical and geophysical investigations for offshore and near shore development.
America: Edwin Danson, Swan Consultants. 101p.
20. International Association of Oil and Gas Producers. 2003. Report No: 342 - Environmental aspects
of the use and disposal of non aqueous drilling fluids associated with offshore oil & gas operations.
Brussels, Belgium: OGP Publications. 114p.
21. Office of Science, U.S. Department of Energy. 2003. An introduction to slurry injection technology
for disposal of drilling wastes. University of Chicago: Argonne National Laboratory. 20p.
22. Appleyard J. 2006. Impact of liquid waste disposal on potable groundwater resources near Perth.
Western Australia: Environmental Geology 28 (2). 5p.
23. MISWACO Broacher. 2003. Cuttings reinjection. Aberdeen, Scotland: MISWACO Publications.
8p.
24. MISWACO Broacher. 2008. Environmental Solutions. Aberdeen, Scotland: MISWACO
Publications. 135p.
25. John A. and Maurice B. 2003. Evaluation of slurry injection technology for management of drilling
wastes. USA: US Department of energy. 110p.
xix
26. Andrew J. and others. 1996. Hydrogeologic characterization of fractured rock formations: A guide
for groundwater remediators. USA: US Environmental Protection Agency. 12p.
27. Jeff R. and Apollo Services. 2000. Cuttings re-injection can solve disposal problem. USA: Drilling
Contractor. 2p.
28. Pierre, R. and Belco Energy Corporation. 2002. High performance / high temperature water based
fluid drills Wilcox test. Texas, USA: Newpark Drilling Fluids. 3p.
29. Hasting, P. 2009. Drilling fluid lubricant. USA: Winberg Consulting. 5p.
30. John, D. and others. 2006. Assessments of technologies for environmentally friendly drilling
project: land based operations. US Agency. 147p.
31. OSPAR Commission. 2001. Environmental aspects of on and off site injection of drill cuttings and
produced water. OSPAR Convention. 33p.
32. OSPAR Commission. 2002. Guidelines for the consideration of the best environmental option for
the management of OPF contaminated cuttings. OSPAR Convention. 2p.
33. Guidi, G., and Gugliermetti. F. 2008. Proposed criteria to select best available techniques (BATs)
for oil spill response. Department of Fusion and Nuclear Technologies, Italy. 6p.
34. Expert Group for BAT and BEP. 2004. Guidelines on best available techniques and provisional
guidance on best environmental practices relevant to Article 5 and Annex C of the Stockholm
Convention on Persistent Organic Pollutants. Stockholm Convention Committee. 317p.
35. Alfred, W. 2008. Low impact drilling operations. Colorado School of Mines. 7p.
36. Radzuan J. 1994. Disposal of oily cuttings by downhole fracturing injections: slurry product
specification issues. Department of Petroleum Engineering. 5p.
37. John. D. and Williams, T. 2007. Environmentally friendly drilling targets responsible operations in
sensitive locations. USA: Drilling Contractor. 4p.
38. American Petroleum Institute. 1997. API E5: Environmental guidance document - Waste
management in exploration and production operations. 2nd Ed. Washington D.C., USA: API
Publications. 83p.
39. Government of Hungary. 2004. Hungarian Groundwater Regulations 219/2004. (VII. 21.) Korm.
Rendelet a felszín alatti vizek védelmérıl. President Office for Mining and Geology. 35p.
40. Government of Hungary. 1998. Hungarian mining act XLVIII of 1993 on mining consolidated with
government decree No. 203/1998. (XII. 19.). President Office for Mining and Geology. 66p.
41. Cole, E., and S. Mark, 2000, E&P Waste: Manage It Cost Effectively through Land Farming. World
Oil, August Vol. 221, No. 8.

xx
Web Pages:
1. Oil and Gas Education and Working UK.
http://www.ukooa.co.uk/education/
2. Oil Exploration and Discovery Links.
http://www.bydesign.com/fossilfuels/links/html/oil/oil_find.html
3. Waste Minimization in Drilling Operations.
http://www.rrc.state.tx.us/forms/publications/wasteminmanual/wastemindrillingops.php
4. Schlumberger Excellence in Educational Development.
http://www.glossary.oilfield.slb.com/
5. Drilling Waste Management Information System.
http://web.ead.anl.gov/dwm/techdesc/sep/index.cfm
6. Method For Recycling Of Oil Based Drilling Fluid Contaminated With Water And Water
Contaminated With Oil Based Drilling Fluid.
http://www.faqs.org/patents/app/20090184055
7. Method Of Recycling Water Contaminated Oil Based Drilling Fluid.
http://www.patentstorm.us/patents/6977048/fulltext.html

APPENDICES

i
List of Appendices
Appendix – I
Classification of Drilling Fluids According to their Primary Component ................................... I
Classification of Drilling Fluids According to their General Characteristics ........................... II
Appendix – II
Table A.1: Weighting Material and Their Specific Gravity ..................................................... IV
Table A.2: Materials Used as Viscosifier ............................................................................... IV
Table A.3: Materials Used for Circulation Loss Control ..........................................................V
Appendix – III
Table A.4: Densities of Common Mud Components ..............................................................VI
Table A.5: Plastic Viscosity of Water Based Muds ................................................................VI
Table A.6: Selection of Drilling Fluid .....................................................................................VII
Appendix – IV
General Arrangement of Solid Liquid Seperation Equipment ................................................XI
Type of Equipments for Different Drilling Fluids.....................................................................XI
Appendix – V
US EPA List of Non Exempt E&P Waste ..............................................................................XII
US EPA List of Exempt E&P Waste.....................................................................................XIII
Appendix – VI
Hungarian Regulation for Mineral Exploration and Production Water................................. XIV

ii
Appendix – VII
Hydrocarbon Calculation...................................................................................................... XV
Well Summary and Waste Volume ..................................................................................... XVI
Appendix – VIII
Figure A.1: Flow Chart For Disposal of Drilling Waste....................................................... XVII
Figure A.2: Flow Chart For Toxicity Assessment .............................................................. XVIII
Appendix – IX
Loading Criteria for Land Spreading Disposal Method ....................................................... XIX
Required Analysis for Land Spreading Disposal Method..................................................... XX
Loading Criteria for Land Spraying Disposal Method.......................................................... XXI
Required Analysis for Land Spraying Disposal Method ..................................................... XXII
Loading Criteria for Land Spraying While Drilling Disposal Method.................................. XXIII
Required Analysis for Land Spraying While Drilling Disposal Method .............................. XXIII
Appendix – X
Tabel A.7: Comparison of Actual vs. Recommended Slurry Parameters ......................... XXIV
Slurry Processing and Injection Equipment ....................................................................... XXV
Typical Slurry Injection Flow Cycle .................................................................................... XXV
Appendix – XI
Summary Data for Offshore Treatment and Disposal Techniques ................................... XXVI
Assessment of Options for Offshore Treatment and Disposal ........................................ XXVII
Advantages (+) and Disadvantages (-) of Onshore Treatment / Disposal Options......... XXVIII
Appendix – XII
Conversion Table for Oilfield Units and SI Units ............................................................... XXIX
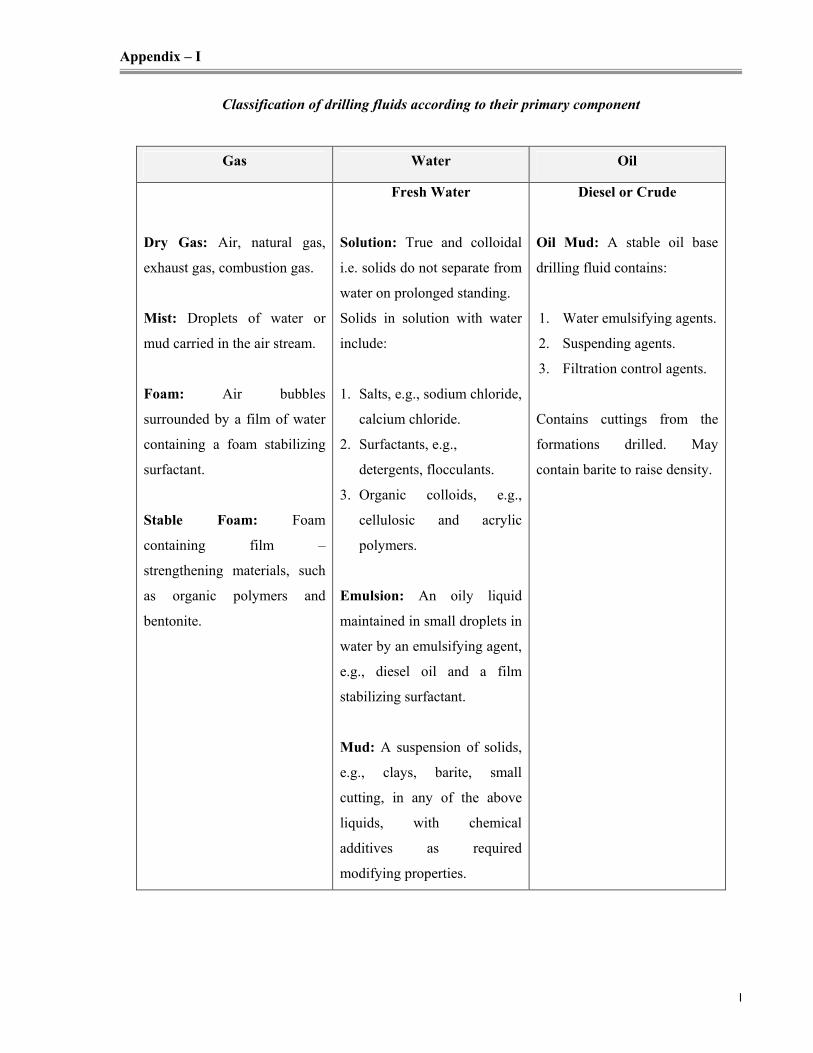
Appendix – I
I
Classification of drilling fluids according to their primary component
Gas Water Oil
Dry Gas: Air, natural gas,
exhaust gas, combustion gas.
Mist: Droplets of water or
mud carried in the air stream.
Foam: Air bubbles
surrounded by a film of water
containing a foam stabilizing
surfactant.
Stable Foam: Foam
containing film –
strengthening materials, such
as organic polymers and
bentonite.
Fresh Water
Solution: True and colloidal
i.e. solids do not separate from
water on prolonged standing.
Solids in solution with water
include:
1. Salts, e.g., sodium chloride,
calcium chloride.
2. Surfactants, e.g.,
detergents, flocculants.
3. Organic colloids, e.g.,
cellulosic and acrylic
polymers.
Emulsion: An oily liquid
maintained in small droplets in
water by an emulsifying agent,
e.g., diesel oil and a film
stabilizing surfactant.
Mud: A suspension of solids,
e.g., clays, barite, small
cutting, in any of the above
liquids, with chemical
additives as required
modifying properties.
Diesel or Crude
Oil Mud: A stable oil base
drilling fluid contains:
1. Water emulsifying agents.
2. Suspending agents.
3. Filtration control agents.
Contains cuttings from the
formations drilled. May
contain barite to raise density.

Appendix – I
II
Classification of Drilling Fluids according to General Characteristics
Mud Type Principle Component General Characteristics
Aqueous Simple Freshwater Freshwater.
Low cost, onshore applications,
fast drilling in stable formations,
need space for solid settling,
flocculants may be used.
Simple Sea Water Seawater. Low cost, offshore applications.
Spud mud Bentonite, water. Low cost, surface hole.
Saltwater
Seawater, brine or saturated
saltwater; saltwater clay,
starch. cellulosic polymer.
Moderate cost, drilling salt and
workovers.
Lime or gyp
Fresh or brackish water;
bentonite, lime, or gypsum,
lignosulfonate.
Moderate cost, shale drilling, and
high temp. tolerance to salt,
anhydrite, cement, drilled solids.
Lignite or lignosulfonate
(chrome or chrome free)
Fresh or brackish water;
bentonite, caustic, lignite or
lignosulfonate.
Moderate cost, shale drilling;
simple maintenance, high temp.
tolerance to salt, anhydrite,
cement.
Potassium
Potassium chloride; potassium
lignite, acrylic, bio or
cellulosic polymer, some
bentonite.
Moderate cost, hole stability; low
tolerance to drilled solids, low-to-
high pH.
Low solids (“nondispersed”
when weighted up)
Fresh to high saltwater,
HMW-polymer, some
bentonite.
High cost, hole stability; low
tolerance to drilled solids, cement
and divalent salts.

Appendix – I
III
Mud Type Principle Component General Characteristics
Asphaltic Diesel oil; asphalt,
emulsifiers, water 2-5%.
Moderate cost, any applications
to 315°C strong environmental
restrictions may apply.
Invert emulsion
Diesel, mineral, or low-
toxicity mineral oil;
emulsifiers, organophilic clay,
modified resins, and soaps, 5-
40% brine.
Highest cost, any applications to
at least 2320C, low maintenance,
environmental restrictions.
Synthetic
Synthetic hydrocarbons or
esters; other products same as
invert emulsion.
Highest cost, any applications to
at least 2320C, low maintenance.

Appendix – II
IV
Table A.1: Weighting Material and their Specific Gravity (Darley and George, 1988).
Material Principal Component Specific Gravity Hardness Moh’s
Scale
Galena PbS 7.4-7.7 2.5-2.7
Hematite Fe2O3 4.9-5.3 5.5-6.5
Magnetite Fe3O4 5.0-5.2 5.5-6.5
Iron Oxide (Manf.) Fe2O3 4.7 -
Ilmenite FeO.TiO2 4.5-5.1 5.6
Barite BaSO4 4.2-4.5 2.5-3.5
Siderite FeCO3 3.7-3.9 3.5-4
Celestite SrSO4 3.7-3.9 3-3.5
Dolomite CaCO3. MgCO3 2.8-2.9 3.5-4
Calcite CaCO3 2.6-2.8 3
Table A.2: Materials used as viscosifiers (Darley and George, 1988).
Material Principal Component
Bentonite Sodium / Calcium Aluminosilicate
CMC Sodium Carboxy – Methyl Cellulose
PAC Poly Anionic Cellulose
Xanthan Gum Extracellullar Microbial Polysaccharide
HEC Hydroxy – Ethyl Cellulose
Guar Gum Hydrophilic Polysaccharide Gum
Resins Hydrocarbon Co–Polymers
Silicates Mixed Metal Silicates
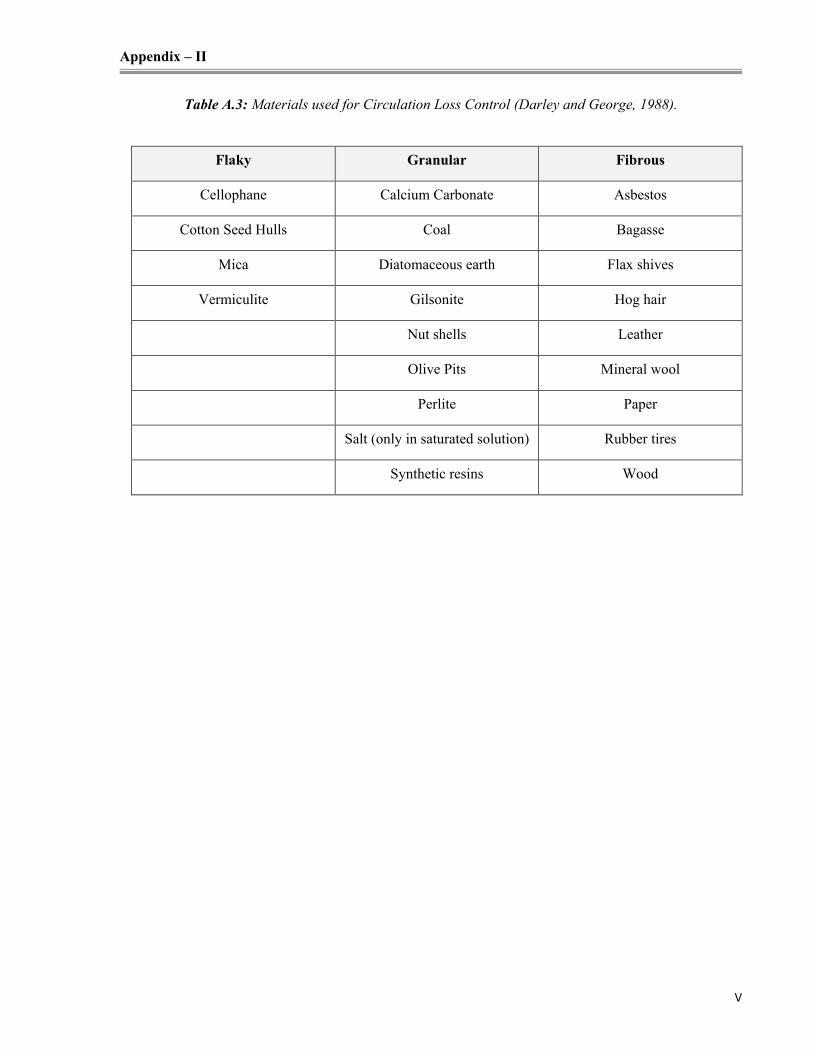
Appendix – II
V
Table A.3: Materials used for Circulation Loss Control (Darley and George, 1988).
Flaky Granular Fibrous
Cellophane Calcium Carbonate Asbestos
Cotton Seed Hulls Coal Bagasse
Mica Diatomaceous earth Flax shives
Vermiculite Gilsonite Hog hair
Nut shells Leather
Olive Pits Mineral wool
Perlite Paper
Salt (only in saturated solution) Rubber tires
Synthetic resins Wood

Appendix – III
VI
Table A.4: Densities of Common Mud Components (Darley and George, 1988).
Material gram/cm3 lb/gal lb/ft
3 lb/bbl kg/m
3
Water 1.0 8.33 62.4 350 1000
Oil 0.8 6.66 50 280 800
Barite 4.3 35.8 268 1500 4300
Clay 2.5 20.8 156 874 2500
Salt 2.2 18.3 137 770 2200
Table A.5: Plastic Viscosity of Water Based Muds (George R. Gray, 1983).
The guidelines for plastic viscosity of water based muds at various mud weights are shown above. The
lower curve represents mud’s that contain only barite and sufficient bentonite to suspend the barite. This
curve should represent minimum plastic viscosities for good mud performance. The viscosity of a mud is
a function of three components:
• Viscosity of the base liquid or continuous phase;
• The size shapes and number of solids particles in the mud (plastic viscosity);
• Inter-particle forces (yield point).

Appendix – III
VII
Table A.6: Selection of Drilling Fluid (Darley and George, 1988).
Classification Principal Ingredients Characteristics
GAS
Dry Air Dry Air.
Fast drilling in dry, hard rock.
No water influx.
Dust.
Mist Air, Water and Mud.
Wet formations but little
water influx.
High annular velocity.
Foam Air, Water, foaming agent.
Stable rock.
Moderate water flow
tolerated.
Stable Foam Air, Water containing polymers
and / or bentonite, foaming agent.
All “reduced pressure”
conditions. Large volumes of
water, big cuttings removed
at low annular velocity.
Select polymer and foaming
agent to afford hole stability
and tolerate salts.

Appendix – III
VIII
Classification Principal Ingredients Characteristics
WATER
Fresh Fresh Water.
Fast drilling in stable
formations.
Need large settling area,
flocculants or ample water
supply and easy disposal.
Salt Sea Water.
Brines for density increase
and lower freezing point.
Limited to low permeability
rocks.
Low Solids Muds
(When barite is added to raise
density of these muds, they are
called “non-dispersed” muds)
Fresh Water, Polymer, Bentonite.
Fast drilling in competent
rocks.
Mechanical solids removal
equipment needed.
Contaminated by cement,
soluble salts.
Spud Mud Bentonite and Water. In expensive.
Salt Water Muds
(Diesel Oil is often added to
these muds, frequently along
with an emulsifying agent)
Sea Water, brine, saturated salt
water, salt water clays, starch, and
cellulosic polymers.
Drill rock salt.
Workovers.
Drilling salts other than halite
may require special treatment.

Appendix – III
IX
Classification Principal Ingredients Characteristics
Lime Muds
(Diesel Oil is often added to
these muds, frequently along
with an emulsifying agent)
Fresh or brackish water, bentonite
(or native clays), lime, chrome –
lignosulfonate.
Lignite sodium chromate and
surfacent for high temperature.
Simple maintenance at
medium densities.
Max. Temp. 1500oC.
Unaffected by anhydrite,
cement (pH 11-12).
Gyp Muds
(Temperature stability of these
muds is increased by removing
calcium and adding lignite and
surfactant)
Same as lime muds, except
substitute gypsum for lime in above
composition.
Shale drilling
Max. Temp 1650oC.
Unaffected by anhydrite,
cement, moderate amount of
salt (pH 9-10).
CL-CLS Muds
(Density of oil muds can be
raised by addition of calcium
carbonate or barite)
(Calcium Chloride is added to
the emulsified water phase to
increase shale stability)
Fresh or brackish water, bentonite,
caustic soda, chrome lignite,
chrome lignosulfonate.
Surfactant added for high
temperature.
Shale drilling.
Simple Maintenance.
Max. Temp. 1800oC.
Same tolerance for
contaminants as gyp muds
(pH 9-10).
Potassium Muds Potassium Chloride, acrylic, bio or
cellulosic polymer, some bentonite.
Hole stability.
Mechanical solids removal
equipment necessary.
Fast drilling at minimum
solids contents (pH 7-8).

Appendix – III
X
Classification Principal Ingredients Characteristics
OIL
Oil
Weathered crude oil.
Asphaltic crude added with soap
and water.
Low pressure well
completion and workover.
Drill shallow, low pressure
productive zone.
Water can be used to increase
density and cutting carrying
ability.
Asphaltic Muds Diesel Oil, asphalt, emulsifiers,
water 2-10%.
The composition of oil muds
can be designed to satisfy any
density and hole stabilization
requirements and temperature
requirements to 3150oC.
Non – Asphaltic Muds (Invert)
Diesel Oil, emulsifiers, oleophilic
clay, modified resins and soaps,
5% - 40% water.
High initial cost and
environmental restrictions,
but low maintenance cost.

Appendix – IV
XI
General arrangement of solid liquid separation equipment
Type of equipment for different drilling fluids
Un-weighted Drilling Fluid Weighted Drilling Fluid
Gumbo removal Gumbo removal
Scalper shakers Scalper Shaker (seldom needed)
Main shale shakers Main Shale Shaker
Desanders Mud Cleaner
Desilters Centrifuge
Centrifuge Dewatering (seldom needed)
Dewatering

Appendix – V
XII
US EPA list of non - exempt exploration and production waste
• Unused fracturing fluids or acids. • Used hydraulic fluids.
• Gas plant cooling tower cleaning wastes. • Waste in transportation pipeline related pits.
• Painting wastes. • Caustic or acid cleaners.
• Oil and gas Service Company wastes such as
empty drums, drum rinsate, sandblast media,
painting wastes, spent solvents, spilled
chemicals, and waste acids.
• Vacuum truck and drum rinsate from trucks
and drums transporting or containing
nonexempt waste.
• Liquid and solid wastes generated by crude oil
and tank bottom reclaimers’. • Boiler refractory bricks.
• Used equipment lubricating oils. • Boiler scrubber fluids, sludges and ash.
• Waste compressor oil, filters, and blowdown. • Incinerator ash.
• Waste solvents. • Laboratory wastes.
• Boiler cleaning wastes. • Sanitary wastes.
• Refinery wastes. • Pesticide wastes.
• Drums, insulation, and miscellaneous solids. • Radioactive tracer wastes.

Appendix – V
XIII
US EPA list of exempt exploration and production waste
• Produced water. • Cooling tower blowdown.
• Pipe scale, hydrocarbon solids, hydrates, and
other deposits removed Iron piping and
equipment prior to transportation.
• Spent filters, filter media, and backwash
(assuming the filter itself is not hazardous).
• Drill cuttings. • Drilling fluids.
• Rigwash. • Produced sand
• Pigging wastes from gathering lines. • Hydrocarbon bearing soil.
• Geothermal production fluids. • Packing fluids.
• Hydrogen sulfide abatement wastes from
geothermal energy production.
• Drilling fluids and cuttings from offshore
operations disposed of onshore.
• Well completion, and stimulation fluids. • Wastes from subsurface gas storage and
retrieval, except for the nonexempt wastes.
• Basic sediment and water and other tank
bottoms from storage facilities that hold
product and exempt waste.
• Constituents removed from produced water
before it is injected or otherwise disposed off.
• Accumulated materials such as hydrocarbons,
solids, sands, and emulsion from production
separators, fluid treating vessels, and
production impoundments.
• Gas plant sweetening wastes for sulfur
removal, including amines, amine filters,
amine filter media, backwash, precipitated
amine sludge, iron sponge and hydrogen
sulfide scrubber liquid and sludge.
• Pit sludges arid contaminated bottoms from
storage or disposal of exempt wastes.
• Materials ejected from a producing well during
the process known as blowdown.
• Gas plant dehydration wastes, including
glycol-based compounds, glycol filters, filter
media, and molecular sieves.
• Gases from the production stream such as
hydrogen sulfide and carbon dioxide, and
volatilized hydrocarbons.
• Liquid hydrocarbons removed from the
production stream but not from oil refining.
• Light organics volatilized from exempt wastes
in reserve pits or impoundments or production
equipment.

Appendix – VI
XIV
Hungarian Regulation for Mineral Exploration and Production Waste
(Government of Hungary, 2004)
Hungarian Language:
219/2004. (VII. 21.) Korm. Rendelet - a felszín alatti vizek védelmérıl
11. § (1) Tilos szennyezı anyagnak mélyinjektálással történı elhelyezése, vagy bármilyen módon történı
mélybesajtolása, kivéve a (2) bekezdésben foglaltakat.
(2) A felszín alatti vízbe, földtani közegbe a (3) bekezdés szerinti feltételek teljesülése esetén, az olyan
természeti okokból más célra tartósan alkalmatlan földtani képzıdménybe, amely a szennyezı anyagok
továbbterjedése szempontjából zártnak tekinthetı szénhidrogén tároló, és amelybıl a szénhidrogént
kitermelik, illetve kitermelték:
a) az olyan az 1. számú melléklet szerinti K1 szennyezı anyagokat nem tartalmazó vizek visszasajtolása,
amelyek a bányászati kutatáshoz, feltáráshoz, kitermeléshez tartozó tevékenységbıl származnak,
b) természetes összetételő vizek besajtolása szénhidrogén kitermelés elısegítésére,
c) a természetes gáz vagy a cseppfolyósított földgáz besajtolása tárolási céllal,
a felszín alatti víz minıségromlás minden jelenlegi vagy jövıbeni veszélyének kizárásával a 13. § szerint
engedélyezhetı.
(3) A (2) bekezdés szerinti tevékenységre engedély akkor adható ki, ha komplex értékelésre támaszkodó
vizsgálatokkal is bizonyított, hogy a visszasajtolás, besajtolás:
a) az adott tevékenységbıl származik és nem tartalmaz az adott tevékenységbıl származótól eltérı
anyagot, és
b) a felszín alatti vizek szennyezésének megelızése az elérhetı legjobb technika alkalmazásával történik,
és
c) nem veszélyezteti a környezeti elemek - különösen a felszín alatti vizek - mennyiségi és minıségi
viszonyait, a környezeti célkitőzések teljesülését, továbbá
d) az a), b) és c) pontokban foglaltak teljesülése ellenırzött.

Appendix – VII
XV
Hydrocarbon Calculation (Alberta Environments, 2009)
EXAMPLE: Enter the drill stem diameter for the drill stem test (DST) section in millimeters, the length
of the DST return in metres, the percent oil content of the DST fluid, the well depth in meters and the mix
ratio. This value must be less than 0.10% (dry weight) in subsoil or 0.50% (dry weight) in topsoil.
* Actual measured oil concentration must be used if available. If only visual descriptions are available
then use the following to estimate oil concentration:
Flecked = 5%, Emulsion = 25%, Oil or oil-cut mud= 100%
Do not include gas-cut mud or mud with no indication of oil.
** Enter the number of parts of soil mixed with one part of waste. For example, for a 3:1 mix ratio
(3 parts soil to 1 part waste) enter “3”.
Inner
Diameter of
Pipe
(mm)
Length of
Drill Stem
Test Return
(m)
Volume of
Returns
(m3)
Oil Content
(%)*
Vol. of Oil
(m3 x 100)
460 20 3.32212 x 0.10% = 0.332212
343 20 1.8470893 x 0.10% = 0.1847089
242 20 0.9194548 x 0.10% = 0.0919455
178 20 0.4974388 x 0.10% = 0.0497439
460 20 3.32212 x 0.50% = 1.66106
242 20 0.9194548 x 0.50% = 0.4597274
Volume of Oil = 2.7793977
¸ 0.6
Well Depth (m) ¸ 3000
Mix Ratio** ¸ 2
Post-Disposal Oil Concentration (%) = 0.0007721

Appendix – VII
XVI
Well Summary and Waste Volume
Casing Size
(in)
Hole Size
(in)
Casing
Program MD (m) TVD (m)
Mud System
(Density / S.G.)
18 ⅝ N/A
~ 20 ~ 20 Hammered
13 ⅜ 17 ½ 500 500
Spud Mud
1.06 – 1.16 SG
EWC : 01 05 04
9 ⅝ 12 ¼ 2291 2200
KCl / Polymer
1.08 – 1.16 SG
EWC : 01 05 08
7 8 ½ 2561 2490
KCl / Polymer
1.08 – 1.14 SG
EWC : 01 05 08
N/A 6 2671 2600
KCl /Polymer
1.04 – 1.07 SG
EWC : 01 05 08
( )
( ) 32.793.0 - 3.3 264 Volume Waste
3.0 - 3.3 Volume Hole Bore Volume Waste
m≅×=
×=
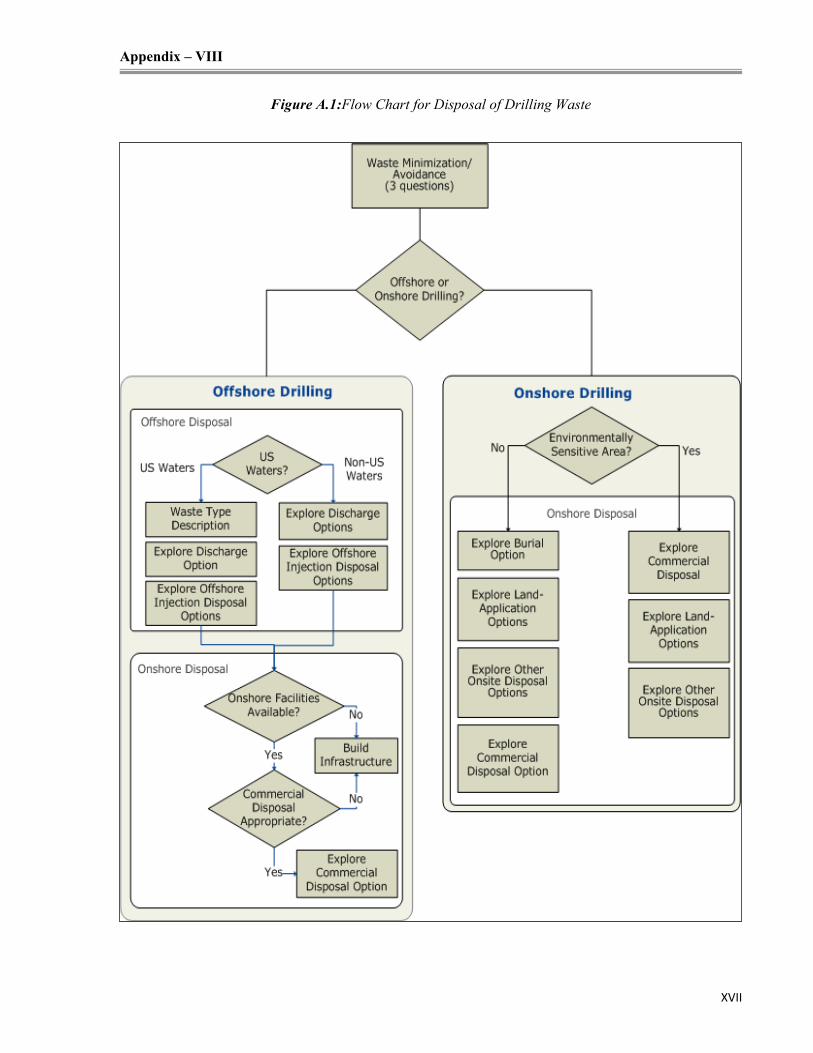
Appendix – VIII
XVII
Figure A.1:Flow Chart for Disposal of Drilling Waste

Appendix – VIII
XVIII
Figure A.2: Flow Chart for Toxicity Assessment
Well must be
drilled with water-
based system
Off-site/
Remote Site
Disposal?
LWD?
Were additives:
- used at concentrations below
toxicity threshold level as
defined on PSAC mud list?
Were any
hydrocarbon flags
raised during drilling
activities?
No toxicity testing
required
Carry out disposal,
adhering to O il and
Gas Handbook
criteria
Toxicity testing of
drilling waste is
required prior to
disposal
Is drilling waste sample
likely to fail toxicity testing
due to presence of
hydrocarbons?
Does drilling waste
sample pass toxicity
testing?
Does drilling waste
sample pass toxicity
testing after charcoal
treatment?
Test drilling waste sample for
hydrocarbons as outlined in Section
4.12
Were
hydrocarbons
detected?
Review mud additives, drilling
operations and completions practices
for possible explanation of toxicity
failure.
Any other reasons for
toxicity failure found?
Treat waste to
elim inate toxic
components
Yes
Yes
No
No
No
Yes
Yes
No
Yes
No
Yes
No
No
Yes
Yes
No
Yes
Dispose of drilling
waste at approved
waste
management
facility
No

Appendix – IX
XIX
Loading Criteria for Land Spreading Disposal Method
Pre Application Conditions Maximum Application Rate
Receiving Subsoil:
Subsoil must be suitable for incorporation.
EC ≤ 4 dS/m
SAR ≤ 8
Waste:
Must pass toxicity assessment if mud additives
require testing, or if hydrocarbon was added to
the mud system.
Trace Elements (in any soil horizon):
Boron 5kg/ha.
Cadmium 1.5kg/ha.
Chromium 100 kg/ha.
Copper 200 kg/ha.
Lead 100 kg/ha.
Nickel 25 kg/ha.
Vanadium 100 kg/ha.
Zinc 300 kg/ha.
Analyses (with incorporation into ≤ 30 cm
subsoil depth):
Chloride 800 kg/ha.
Sodium 500 kg/ha.
Total Nitrogen 400 kg/ha.
Total Dissolved Solids 3500 kg/ha.
Hydrocarbon ≤0.1%
(using a subsoil density of 1700 kg/m3).
Analysis (with incorporation into > 30cm
subsoil depth):
Chloride 1200kg/ha.
Sodium 750 kg/ha.
Total Nitrogen 400kg/ha.
Total Dissolved Solids 5000 kg/ha.
Hydrocarbon ≤ 0.1 %
(using a subsoil density of 1700 kg/m3).

Appendix – IX
XX
Required Analysis for Landspreading Disposal Method
Test Waste Receiving Soil
Electrical Conductivity (EC) Fluids and Solids or Total Waste Required.
Total Dissolved Solids (TDS) Fluids and Solids or Total Waste
Calculated from EC. Not Required.
Sodium Adsorption Ratio
(SAR)
Fluids aid Solids or Total Waste
Na. Ca. Mg; the sodium component is
used for the sodium loading
calculation.
Required(Na, Ca, Mg).
Chloride Fluids and Solids or Total Waste Not Required.
Nitrogen
Fluids or Total Waste
If more than 400 kg nitrogen was
added to the mud system.
Not Required.
Trace Elements
Solids or Total Waste
If trace elements were added to the
mud system in excess of the following
levels:
25 kg boron, 50 kg lead,
0.75 kg cadmium,
12.5kg nickel, 50 kg chromium,
50 kg vanadium,
100 kg copper , 150 kg zinc.
Not Required.
Toxicity Assessment
Fluids and Solids or Total Waste
If mud additives requiring testing
were used, or hydrocarbons were
added to the mud system as indicated.
Not Required.
Hydrocarbon
Solids or Total Waste
If it is a horizontal oil well. If a diesel
spill or if there are hydrocarbons
visible on the sump.
Not Required.

Appendix – IX
XXI
Loading Criteria for Land Spraying Disposal Method
Pre Application Conditions Maximum Application Rate
Receiving Subsoil:
Slope must be less than 5%.
EC ≤ 2 dS/m
SAR ≤ 6
Waste:
Must pass toxicity assessment.
Winter ≤ 20 m3/ha,
Summer ≤ 40 m3/ha,
Solids on Vegetated Lands ≤ 6ton/ha,
Trace Elements:
Boron 5kg/ha,
Cadmium 1.5kg/ha,
Chromium 100 kg/ha,
Copper 200 kg/ha,
Lead 100 kg/ha,
Nickel 25 kg/ha,
Vanadium 100 kg/ha,
Zinc 300 kg/ha.
Analyses (Topsoil):
Chloride 200 kg/ha,
Sodium 250 kg/ha,
Total Nitrogen 200 kg/ha,
Total Dissolved Solids 1800 kg/ha,
Hydrocarbon ≤ 0.5%.
(Incorporated to a depth less than 15cm within
2 weeks using a topsoil density of 1300 kg/m3).
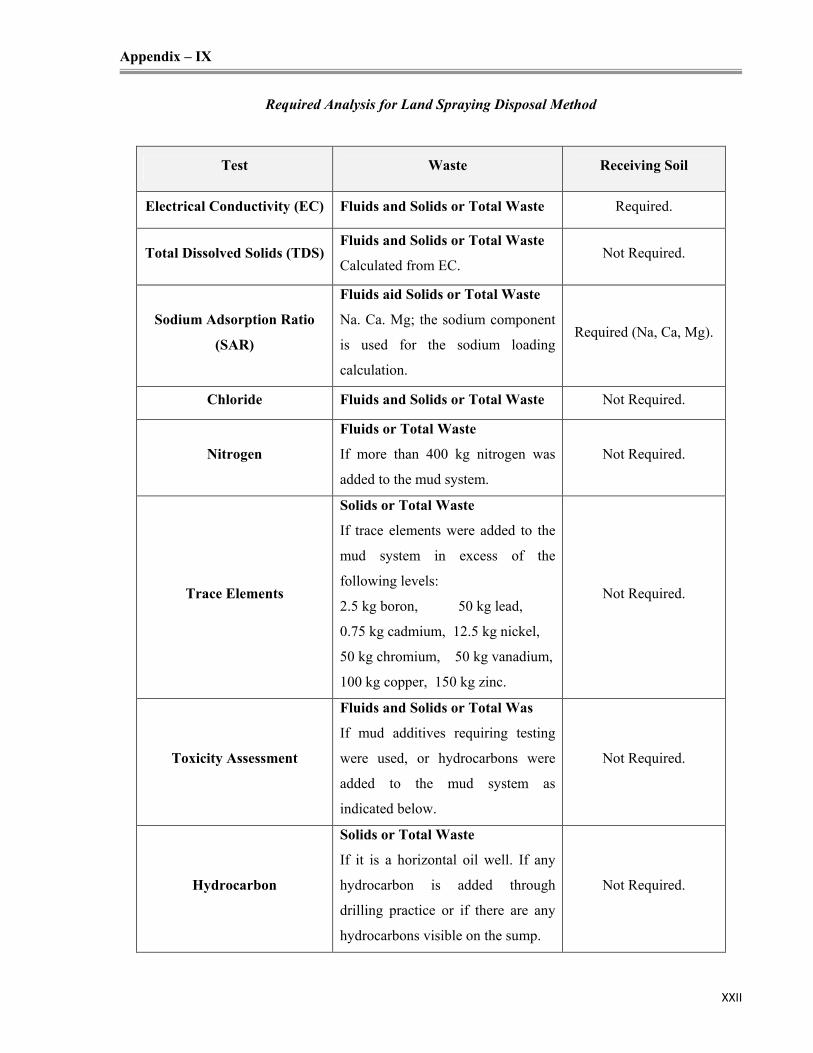
Appendix – IX
XXII
Required Analysis for Land Spraying Disposal Method
Test Waste Receiving Soil
Electrical Conductivity (EC) Fluids and Solids or Total Waste Required.
Total Dissolved Solids (TDS) Fluids and Solids or Total Waste
Calculated from EC. Not Required.
Sodium Adsorption Ratio
(SAR)
Fluids aid Solids or Total Waste
Na. Ca. Mg; the sodium component
is used for the sodium loading
calculation.
Required (Na, Ca, Mg).
Chloride Fluids and Solids or Total Waste Not Required.
Nitrogen
Fluids or Total Waste
If more than 400 kg nitrogen was
added to the mud system.
Not Required.
Trace Elements
Solids or Total Waste
If trace elements were added to the
mud system in excess of the
following levels:
2.5 kg boron, 50 kg lead,
0.75 kg cadmium, 12.5 kg nickel,
50 kg chromium, 50 kg vanadium,
100 kg copper, 150 kg zinc.
Not Required.
Toxicity Assessment
Fluids and Solids or Total Was
If mud additives requiring testing
were used, or hydrocarbons were
added to the mud system as
indicated below.
Not Required.
Hydrocarbon
Solids or Total Waste
If it is a horizontal oil well. If any
hydrocarbon is added through
drilling practice or if there are any
hydrocarbons visible on the sump.
Not Required.
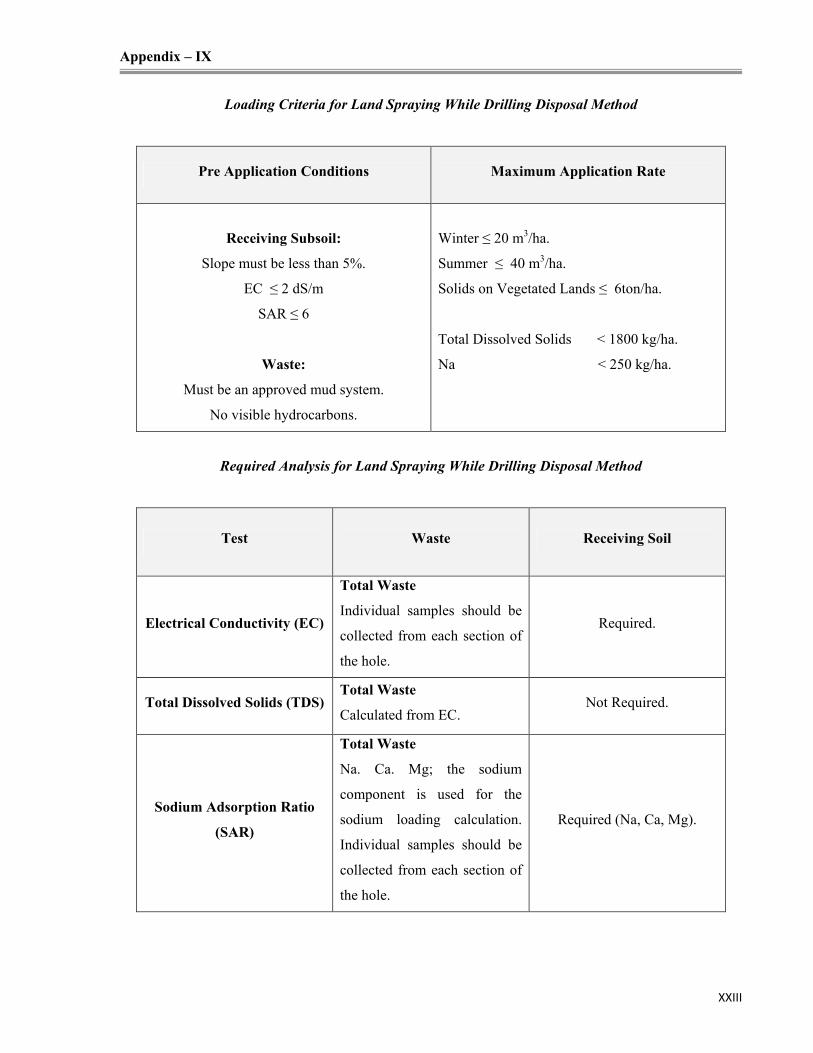
Appendix – IX
XXIII
Loading Criteria for Land Spraying While Drilling Disposal Method
Pre Application Conditions Maximum Application Rate
Receiving Subsoil:
Slope must be less than 5%.
EC ≤ 2 dS/m
SAR ≤ 6
Waste:
Must be an approved mud system.
No visible hydrocarbons.
Winter ≤ 20 m3/ha.
Summer ≤ 40 m3/ha.
Solids on Vegetated Lands ≤ 6ton/ha.
Total Dissolved Solids < 1800 kg/ha.
Na < 250 kg/ha.
Required Analysis for Land Spraying While Drilling Disposal Method
Test Waste Receiving Soil
Electrical Conductivity (EC)
Total Waste
Individual samples should be
collected from each section of
the hole.
Required.
Total Dissolved Solids (TDS) Total Waste
Calculated from EC. Not Required.
Sodium Adsorption Ratio
(SAR)
Total Waste
Na. Ca. Mg; the sodium
component is used for the
sodium loading calculation.
Individual samples should be
collected from each section of
the hole.
Required (Na, Ca, Mg).

Appendix – X
XXIV
Table A.7: Comparison of Actual vs. Recommended Slurry Parameters
Actual Performance Recommended Values
Parameter
Data Summarized from
Slurry Injection
Database
E&P Forum
(1993)
Buller
(1996)
Abou
Sayed
and Quo
(2002)
Crawford
and
Lescrboura
(1993)
Percent solids 5-70 (10-26) 20-40 20-30 - 12-15
Specific gravity 1.03-1.8 (1.15-1.5) 1.2-1.6 - - -
Density
(g/cm3)
0.99-1.59 (1.03-1.38) 1.2-1.59 1.14-1.44 - -
Viscosity -Marsh
Funnel
(sec/quart)
42-110 (50-90) 50-100 60-90 >60 50-70
Particle size
distribution
(D90 µm)
- 300 300 300 300
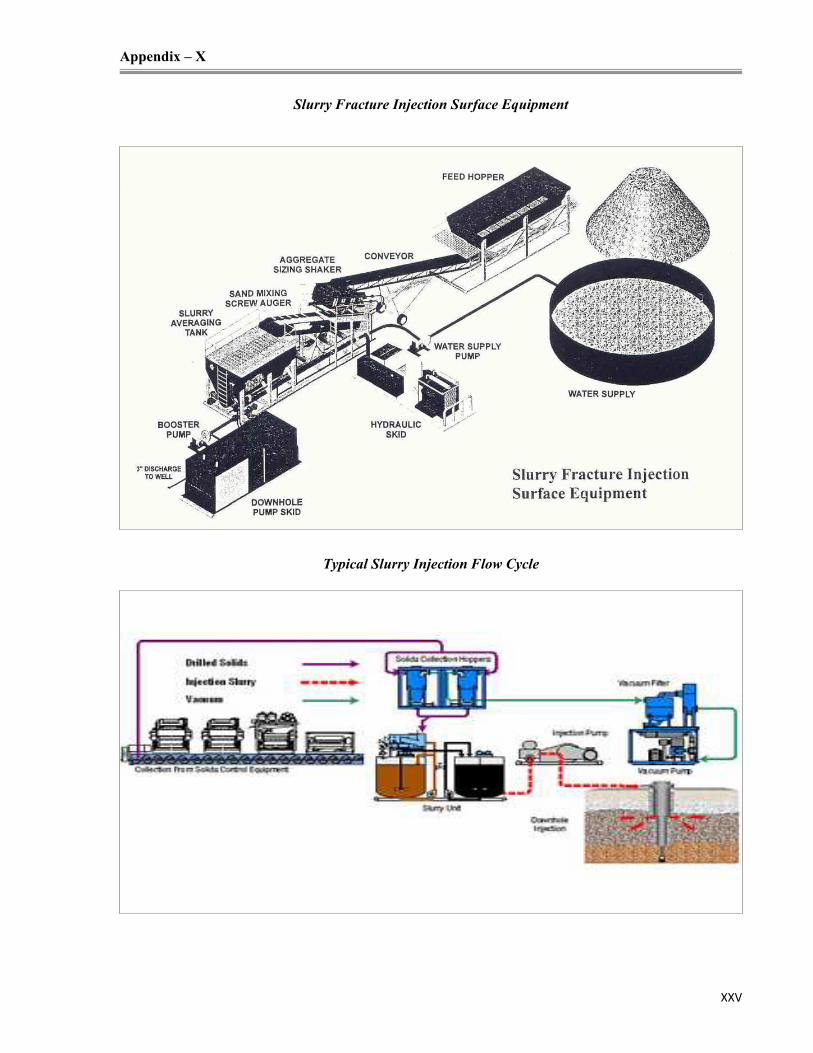
Appendix – X
XXV
Slurry Fracture Injection Surface Equipment
Typical Slurry Injection Flow Cycle

Appendix – XI
X
XV
I
Summary Data for Offshore Treatment and Disposal Techniques
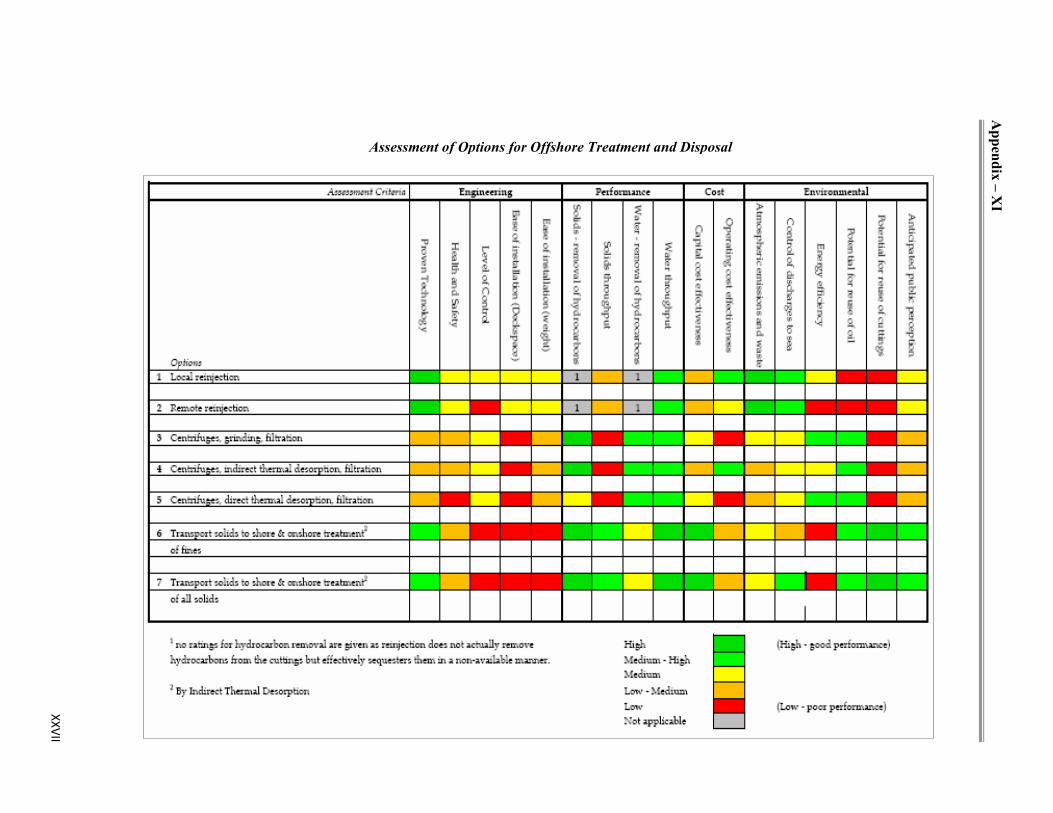
Appendix – XI
X
XV
II
Assessment of Options for Offshore Treatment and Disposal
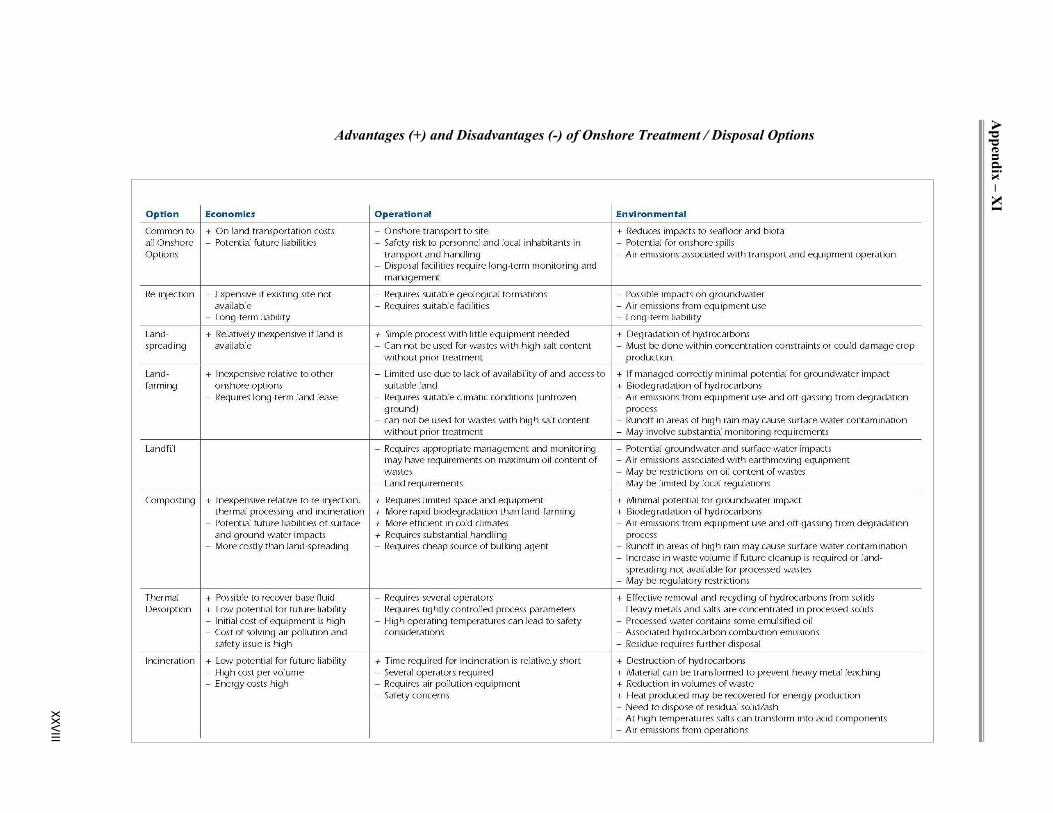
Appendix – XI
X
XV
III
Advantages (+) and Disadvantages (-) of Onshore Treatment / Disposal Options

Appendix – XII
XXIX
Conversion Table for Oilfield units and SI units
Quantity SI Unit Oilfield Unit
Mass 1kg 2.2046225 1bm
Length 0.3048m 1 ft
4046.873 m2 1 acre = 43560 ft2
Area 1 m2 0.0001 hectare
Volume 1 m3
6.2898106 bbl
1 bbl = 5.614583 ft3
1K 1.8R
K= °C+273.15 R=°F+459.67 Temperature
°C = (°F-32)/1.8 °F = 1.8 °C+32
6.894757 kPa 1 psi
1 MPa 145.03774 psi
101.325 kPa 1 atm = 14.69595 psi Pressure
1 bar = 100 kPa 14.503774 psi
Dynamic viscosity 1 mPa.s 1 cp
Density
1000 kg/m3
62.42797 lbm/ft3
8.345405 lbm/gal
Water density at 60°F/1 atm 999.04 kg/m3 62.368 lbm/ft3
Flow Rate 4.719 x 10⁻⁴ m3/s 1 cfm
1.055056 kJ
1 btu
1 btu = 778.169 ft.lbf Energy
1 kWh 3412.14 btu


