
Aerothermal Analysis of a Sample-Return Reentry Capsule
24
Copyright © 2013 Tech Science Press FDMP, vol.9, no.4, pp.461-484, 2013 Aerothermal Analysis of a Sample-Return Reentry Capsule V. Carandente 1 , R. Savino 1 , M. Iacovazzo 1 and C. Boffa 1 Abstract: The article deals with the aerothermal analysis of a sample-return hy- personic capsule reentering on Earth from an interplanetary exploration mission. The main objective of the work is to estimate the heat flux distribution on the cap- sule surface and to perform one-dimensional thermal analyses for its ablative heat shield. After a short review of sample-return missions, the numerical models im- plemented are described and the computational results, obtained along a feasible reentry trajectory, are presented and discussed. Particular attention has been paid to compare the convective stagnation point heat fluxes obtained by means of Com- putational Fluid Dynamic (CFD) analyses with the ones computed with engineer- ing correlations. A further comparison between CFD and with Direct Simulation Monte Carlo (DSMC), in order to investigate the air rarefaction effects, is reported. The article shows an overall satisfactory agreement between engineering corre- lation and numerical results and also presents a preliminary dimensioning of the capsule ablative heat shield at the stagnation point. Keywords: Aerothermodynamics, hypersonic flow, sample-return reentry cap- sule, ablative heat shield. 1 Introduction and objectives The flow field around hypersonic vehicles is characterized by the presence of strong shocks, equilibrium or non-equilibrium gas chemistry, very high temperatures and, as a consequence, by large heat fluxes, requiring a proper designed thermal pro- tection system. For these reasons, the estimation of the reentry flow environment and the correct design of the thermal protection structure is essential for a space mission which considers the atmospheric entry of a spacecraft module. Despite technological progress over time, reentry capsules since the early Mercury program in 1960’s have been characterized by the same basic design concept: a blunt shape protected by a heat shield. Blunt bodies, in fact, are subjected to the 1 Department of Aerospace Engineering (DIAS), University of Naples “Federico II”, Naples, Italy
Transcript of Aerothermal Analysis of a Sample-Return Reentry Capsule

Copyright © 2013 Tech Science Press FDMP, vol.9, no.4, pp.461-484, 2013
Aerothermal Analysis of a Sample-Return ReentryCapsule
V. Carandente1, R. Savino1, M. Iacovazzo1 and C. Boffa1
Abstract: The article deals with the aerothermal analysis of a sample-return hy-personic capsule reentering on Earth from an interplanetary exploration mission.The main objective of the work is to estimate the heat flux distribution on the cap-sule surface and to perform one-dimensional thermal analyses for its ablative heatshield. After a short review of sample-return missions, the numerical models im-plemented are described and the computational results, obtained along a feasiblereentry trajectory, are presented and discussed. Particular attention has been paidto compare the convective stagnation point heat fluxes obtained by means of Com-putational Fluid Dynamic (CFD) analyses with the ones computed with engineer-ing correlations. A further comparison between CFD and with Direct SimulationMonte Carlo (DSMC), in order to investigate the air rarefaction effects, is reported.The article shows an overall satisfactory agreement between engineering corre-lation and numerical results and also presents a preliminary dimensioning of thecapsule ablative heat shield at the stagnation point.
Keywords: Aerothermodynamics, hypersonic flow, sample-return reentry cap-sule, ablative heat shield.
1 Introduction and objectives
The flow field around hypersonic vehicles is characterized by the presence of strongshocks, equilibrium or non-equilibrium gas chemistry, very high temperatures and,as a consequence, by large heat fluxes, requiring a proper designed thermal pro-tection system. For these reasons, the estimation of the reentry flow environmentand the correct design of the thermal protection structure is essential for a spacemission which considers the atmospheric entry of a spacecraft module.
Despite technological progress over time, reentry capsules since the early Mercuryprogram in 1960’s have been characterized by the same basic design concept: ablunt shape protected by a heat shield. Blunt bodies, in fact, are subjected to the1 Department of Aerospace Engineering (DIAS), University of Naples “Federico II”, Naples, Italy

462 Copyright © 2013 Tech Science Press FDMP, vol.9, no.4, pp.461-484, 2013
maximum deceleration at higher altitudes, where the density is lower and the dragforce that they encounter is therefore mostly due to the pressure forces. This resultsin lower heat fluxes, if compared to the ones occurring, at the same conditions, forsharp bodies.
From the beginning of the space exploration era, most of the missions includedsample return, because of the very large interest for the scientific community in thestudy of extraterrestrial samples. The former Soviet Union has a long history ofsuccessful Earth reentry missions. For instance, during the period 1970-1976 therobotic Soviet missions Luna 16, Luna 20 and Luna 24 successfully returned onEarth some samples of lunar soil. Then, during 1996-1997, Earth-Orbital DebrisCollection (ODC) has been deployed on the Mir space station for 18 months. Itused aerogel to capture particles from low-Earth orbit, mainly consisting of inter-planetary dust.
In recent years, NASA Stardust was the first successful space mission that, in 2006,brought to Earth solid extraterrestrial samples collected from a comet, Wild Wild 2[Desai, Lyons, Tooley, and Kangas (2006)]. The Japanese Hayabusa was a samplereturn mission by Japan’s space science agency JAXA, whose objective was toreturn samples from the surface of a small near Earth asteroid. The spacecraft waslaunched in May 2002 and returned to Earth in June 2010 with a reentry velocityof about 12.2 km/s [Brucato, Rotundi, and Epifani (2009)].
Marco Polo is a joint European-Japanese mission study, to return unaltered mate-rials from a Near Earth Object (NEO), the asteroid 1999 JU3. For Marco Polo alaunch in years 2017/2018 and a reentry on Earth in the years 2022/2024 are understudy. The requirements for the Earth Reentry Capsule (ERC) include a maximummass of 30 kg, a ballistic coefficient (i.e. the ratio between the vehicle reentrymass and the reference surface times the drag coefficient) of 70 kg/m2 [Brucato,Rotundi, and Epifani (2009)]. The nominal reentry conditions consist in an inertialentry flight path angle near −10◦ and in a maximum velocity in the order of 13km/s.
The most effective solution for the thermal protection systems of these kind ofvehicles seems to be an ablative heat shield. In the present work Phenolic Impreg-nated Carbon Ablator (PICA) materials, which are part of the Lightweight CeramicAblators (LCAs) family, have been considered for the forebody heat shield of thecapsule. This material consists of a commercially available low density carbonfiber matrix substrate impregnated with a phenolic resin [Tran, Johnson, Rasky,Hui, Hsu, Chen, Chen, Paragas, and Kobayash (1997); Tran (1994)].
The objective of the work is the estimation of the aerothermal loads for a blunt-nosed sphere-conic capsule which could be potentially employed in a sample return

Aerothermal Analysis of a Sample-Return Reentry Capsule 463
mission and the preliminary sizing of its ablative heat shield at the stagnation point.
The work is organized as follows. In Section 2 the capsule geometry and the nu-merical models used to evaluate the reentry trajectory and aerothermal loads arepresented, along with the model implemented to perform one-dimensional thermalanalyses for the ablative heat shield. In Section 3 the computed reentry trajectory ispresented. In Section 4 the aerothermal loads on the capsule, estimated by meansof CFD and DSMC analyses are illustrated. Section 5 reports the main outcomesof the one-dimensional thermal analysis of the capsule ablative heat shield. Finally,Section 6 summarizes the main conclusions of the study.
2 Geometry and Models
The capsule configuration and the different models considered to perform the anal-yses reported in the following paragraphs are summarized below.
2.1 Aerodynamic configuration
According to previous conceptual design studis, the baseline configuration for asample return reentry capsule depicted in Figure 1 has been considered. This con-figuration consists of a sphere-cone with half cone angle of 45◦, a base radius Rb of0.33m and a nose radius Rn of 0.30m.
Figure 1: Capsule baseline configuration
The half cone angle and the nose and base radii have been selected after a trade-offanalysis, which took into consideration the influence of each parameter on mechan-ical and aerothermal loads acting on the capsule and on its aerodynamic stability.

464 Copyright © 2013 Tech Science Press FDMP, vol.9, no.4, pp.461-484, 2013
2.2 Model for reentry trajectories evaluation
Equation 1 characterizes the dynamics of the reentry capsule.
dVdt =−ρV 2
2 · CDSm −gsinγ =−ρV 2
2B −gsinγ
V dγ
dt =(
V 2
r −g)
cosγ
V dφ
dt =−V 2
r cosγ cosφ tanλdHdt =V sinγ
dλ
dt = Vr cosγ sinφ
dΛ
dt = Vr ·
cosγ cosφ
cosλ
(1)
The gravitational acceleration has been assumed to vary (with respect to the cap-sule altitude) according to Equation 2, while air density, pressure and temperatureaccording to the U. S. Standard Atmosphere.
g = g0
(R⊕
R⊕+H
)2
(2)
2.3 Engineering models to evaluate convective and radiative heating
The engineering models to evaluate stagnation point convective heat fluxes includethree different formulations: Sutton and Graves (1971); Tauber (1989); Detra andHidalgo (1961) models, which in the past have shown to reasonably agree withexperiments.
Formulations by Sutton-Graves and Tauber allow one to estimate the convectiveheating at the stagnation-point of axisymmetric blunt bodies. The models considerthe gas mixtures encountered during high velocity planetary entry to be in chemicalequilibrium. These two models are both characterized by Equation 3, where V isthe velocity in m/s, ρ is the atmospheric density in kg/m3, Rn is the nose radius inm and K is a constant derived, for a general gas mixture, as a function of the massfraction, of the molecular weights, and of the individual transport properties. Forthis constant the values of 1.73 · 104 for Sutton-Graves and 1.83 · 104 for Taubermodel are considered, respectively.
qconv = K√
ρ
RnV 3
[Wm2
](3)
The other convective heat transfer correlation has been provided by Detra and Hi-dalgo (see equation 4). It provides an accuracy of 10% for velocities between 1.8km/s and 8 km/s and for altitudes up to 70 km [Detra and Hidalgo (1961)].

Aerothermal Analysis of a Sample-Return Reentry Capsule 465
qconv = 5.16 ·10−5√
ρ
RnV 3.15
[Wm2
](4)
As it will be pointed out in Section 4.1, a significant deviation, between Detra-Hidalgo and the other two proposed models, occurs at altitudes around 60 km,corresponding to the maximum heat flux along the reentry trajectory.
At super-orbital speeds, however, convective heat flux is not the only thermal loadacting on a re-entering capsule. Also radiative heat fluxes are in fact significant forthe thermal protection system. Among the different engineering models for radia-tive heating available in literature, the one provided by Tauber and Sutton (1991)has been considered in the present work. Tauber and Sutton’s engineering correla-tion is reported in Equation 5, being C a constant that depends on the atmosphereand f (V ) tabulated values, functions of both flight velocities V and atmosphericcomposition. The exponents a and b can be either constants, or functions of den-sity and free stream velocity, as specified in [Tauber and Sutton (1991)].
qrad =C ·Ran ·ρb f (V ) (5)
2.4 CFD model for aerothermodynamic analysis
Computational Fluid Dynamics (CFD) analyses represent a key technology for thedesign of entry vehicles or capsules. In order to design vehicles reentering fromspace, in fact, an accurate understanding of all physical phenomena taking place inthe flow field around the hypersonic vehicle is required to assess its aerodynamicand aerothermodynamic performances. CFD allows one to significantly reduce thenumber of in-flight and Plasma Wind Tunnel (PWT) experimental test campaignsand to account for real-gas flow features, which are difficult to reproduce in ground-test facilities. Flight measurements collected during reentry have demonstrated thatreal gas effects, in fact, strongly influence both aerodynamics and aerothermal loads[Anderson (1989); Park (1990)].
During atmospheric descent, reentry vehicles encounter several flow regimes andthermochemical phenomena. In fact, they fly from free molecular to fully contin-uum phases and, when in continuum, from laminar to fully turbulent flows. Whenthe freestream enthalpy is large enough, the flow passing through the bow shockdissociates resulting in a reacting mixture flow around the vehicle. The thermaland chemical characteristics of the gas in the shock layer, i.e. the flow field be-tween the shock-wave and the body, depend on the atomic and molecular structureof the species. For this reason, it is important to predict the composition of the flidmixture surrounding the vehicle [Anderson (1989); Park (1990)].

466 Copyright © 2013 Tech Science Press FDMP, vol.9, no.4, pp.461-484, 2013
For the configuration and the flight conditions considered in the present work, theflow can be considered laminar and in chemical non-equilibrium.
Different models exist in literature for modeling the dissociation and the ionizationphenomena. The one implemented is based on the solution of the Navier-Stokesequations for a chemically reacting mixture composed of eleven species (N2, N,O2, O, NO, N+
2 , N+, O+2 , NO+, e−). In particular, the kinetic parameters of the of
the ionization reactions have been set according to Evans’ model [Evans, Jr., andHubert (1973)], which has been validated in previous works also cross checkingexperimental results [Savino, Paterna, Fumo, and D’Elia (2010)].
Numerical simulations have been performed using the software FLUENT, which isable to solve the laminar Navier-Stokes equations at high temperatures in chemi-cal non-equilibrium, including dissociation and ionization reactions. In this case adensity-based, time implicit, numerical resolution scheme has been used, solvingthe above mentioned field equations, through a control-volume-based technique.In addition, the AUSM (Advanced Upstream Splitting Method) scheme for con-vective numerical fluxes has been employed. The chemical kinetic model has beenimplemented in the software with the same procedure adopted in previous works[Paterna, Monti, Savino, and Esposito (2001); Savino and Fumo (2008); Monti,Savino, and Fumo (2007); Monti, Fumo, and Savino (2005)].
Figure 2: Computational grid
The computational grid used to perform calculations has been realized in a pre-processing phase taking advantage of the software GRIDGEN (see Figure 2). Thegrid is composed of 10800 quadrilateral cells, whose density becomes higher ap-proaching the nose of the capsule. This choice provides the best resolution in themost critical region of the flow field, where in particular high temperature and ve-locity gradients must be considered.

Aerothermal Analysis of a Sample-Return Reentry Capsule 467
Different kinds of conditions have been set for the computational domain bound-aries: a pressure far-field condition was set for the boundary labeled as 1, in orderto model a free stream condition, an axis condition for the symmetry surface (label2), a wall conditions for the surface of the capsule (label 3) and a pressure outletwas set for the downstream surface (not visible in Figure 2).
In particular, on the wall a non slip condition and a constant temperature of 300 Kwere set. Also, CFD analyses have been performed setting either a Non-Catalytic(NC, see Equation 6) and a Fully-Catalytic (FC, Equation 7) condition. In Equa-tion 6 ci represents the concentration of the ith species and n the direction normal tothe wall while, in the first relation in Equation 7, cion,dis stands for the concentrationof the dissociated and ionized species.
Non-Catalytic condition (NC)(
∂ci
∂n
)w= 0 (6)
Fully-Catalytic condition (FC)
(cion,dis)w = 0(cO2)w = 0.22(cN2)w = 0.78
(7)
The fully-catalytic condition includes the influence of the wall recombination reac-tions on the heat flux. In this condition, in fact, the energy stored in the chemicaldegrees of freedom is completely released at the wall, causing additional heating.For a non-catalytic surface, this additional heating does not occur at all.
As we will observe from computational results, non-catalytic heat fluxes at thestagnation point could be even 50% lower than the corresponding fully-catalyticones.
The above two cases represent the best and the worst possible case from the ther-mal heating point of view, but they are not necessarily encountered in practice.Generally, real TPS materials have an intermediate catalyticity.
A grid convergence analysis, in order to ensure the solution independence fromthe mesh fineness, has been performed. The percentage error between significantparameters computed using two different grids at a height of 80 km has been eval-uated. Table 1 shows that the main fluid-dynamic parameter calculated using thecoarse mesh are very similar to the ones obtained from a finer mesh.
2.5 Numerical model for ablative heat shields thermal analyses
Calculating the thermal response of an entry vehicle’s Thermal Protection System(TPS) is very important for its correct sizing. This kind of analysis is particularly

468 Copyright © 2013 Tech Science Press FDMP, vol.9, no.4, pp.461-484, 2013
Table 1: Grid convergence analysis
Coarse mesh Fine mesh Error(10800 cells) (43200 cells)
Drag Coefficient 1.104 1.097 0.64%Stagnation point pressure [kPa] 2.904 2.967 2.1%Stagnation point heat flux [MW/m2] 4.502 4.293 4.9%
significant for ablative heat shields, for which two different effects due to aerody-namic heating have to be considered [Dec and Braun (2006)]. On the one hand theinstantaneous material recession rate has to be estimated and, on the other hand, thein-depth temperature response of the TPS has to be computed, in order to evaluatethe amount of material required as insulation to keep the bondline temperature (i.e.the temperature of the material surface not directly exposed to the flow) below aspecified limit.
For the first analysis the assumption of steady-state ablation has been considered.At each instant of time, for surface temperatures higher than a threshold value,the ablation rate s has been estimated by Equation 8, in which Qhw is the hot wallconvective heat flux acting on the external surface of the material, ρM is the materialdensity and Q∗ the heat of ablation. Then, the total recession has been calculatedby integrating the recession rate over the trajectory.
s =Qhw
ρM ·Q∗ (8)
The hot wall convective heat flux has been obtained from Equation 9, in which Qcw
is the cold wall convective heat flux acting on the material (estimated by means ofone of the models reported in Section 2.3), cp is the material specific heat, Tw thewall temperature and Htot the fluid total enthalpy per unit of mass.
Qhw = Qcw
(1−
cp ·Tw
Htot
)(9)
The in-depth temperature response of the material has been accomplished using afinite-difference formulation for the one-dimensional conduction of energy throughthe material. Equation 10 reports the just mentioned equation, with k the materialthermal conductivity and T its temperature (assumed to be a function of both thetime t and of the spatial coordinate x, defined as depicted in Figure 3).
ρM · cp ·∂T∂ t
=∂
∂x
(k
∂T∂x
)(10)

Aerothermal Analysis of a Sample-Return Reentry Capsule 469
Figure 3: Spatial coordinate system definition for the ablative heat shield thermalanalysis
As initial condition a uniform temperature of 20◦C has been considered while, asboundary conditions, the ones reported in Equation 11 and 12 have been assumed.In particular, the second equation represent the adiabatic condition for the bondlinewall, while, in the first one, the hot wall convective heat flux acting on the materialexternal surface, decreased by the re-radiated flux (being σ the Stephan-Boltzmannconstant and ε the material emissivity), has been specified.
q =−k(
∂T∂x
)x=0
= Qcw
(1−
cp ·Tw
Htot
)−σ · ε ·T 4
w (11)
q =−k(
∂T∂x
)x=L
= 0 (12)
This model has been in particular implemented for Phenolic Impregnated CarbonAblators (PICA). The thermal analysis implemented takes into account the mainthermal property variation (i.e. the thermal conductivity, the specific heat and theeffective heat of ablation) with respect to the temperature or the convective heatflux, basing on the experimental results reported in [Tran, Johnson, Rasky, Hui,Hsu, Chen, Chen, Paragas, and Kobayash (1997)].
The material density variation has been implemented applying the Arrhenius rela-tion [Milos, Chen, and Squire (2006)] (labeled as Equation 13) for each ith compo-nent of the PICA. In Equation 13 B and ψ are constants, E is the activation energy,ρ0 and ρc are the densities of the virgin and char material. The material density

470 Copyright © 2013 Tech Science Press FDMP, vol.9, no.4, pp.461-484, 2013
ρM has been therefore obtained as the weighted mean of its components (in Equa-tion 14 Γ is the resin volume fraction, A and B represent the resin components andC the carbon Fiberform). These parameters have been set according to [Tran, John-son, Rasky, Hui, Hsu, Chen, Chen, Paragas, and Kobayash (1997); Williams andCurry (1992)].
∂ρM,i
∂ t=−
(Bie−
EiRT
)ρ0i
(ρM,i −ρci
ρ0i
)i = A,B,C (13)
ρM = Γ · (ρM,A +ρM,B)+(1−Γ) ·ρM,C (14)
Finally, a further term, labeled as φBlow and calculated on the basis of the modelreported in [Mohammadiun and Kianifar (2011)], has been considered in the Equa-tion 15, in order to take into account the reduced heat flux acting on the materialexposed surface due to the blowing of the ablated PICA.
q =−k(
∂T∂x
)x=0
= Qcw
(1−
cp ·Tw
Htot
)φBlow −σε ·T 4
w (15)
It also has to be underlined that, at each time step, the material thickness δ has beendecreased by the receded material, as reported in Equation 16.
δ (t +dt) = δ (t)−∫ t+dt
ts(τ)dτ (16)
Figure 4: Comparison between the experimental temperature profiles obtained fora test case [Covington (2004)] and numerical profiles from DIAS and FIAT code

Aerothermal Analysis of a Sample-Return Reentry Capsule 471
The validation of the just presented model is shown in Figure 4. Experimentalresults reported in literature for a test case realized in an arc-jet facility [Covington(2004)] have been compared with the outcomes of the “FIAT” code [Covington(2004)] and of the previously discussed model (labeled as “DIAS”). The validationshows a satisfactory agreement between the compared analyses.
3 Reentry trajectory evaluation
The reentry trajectory has been obtained numerically integrating Equations 1, tak-ing advantage of the Euler’s method. On the basis of the computed reentry corridor,obtained imposing the maximum mechanical and thermal loads reported in Table 2,a flight path angle of −8.5◦ and a constant ballistic parameter of 65kg/m2 have beenassumed. The assumption of a constant ballistic parameter is due to the fact that thedrag coefficient, for conventional reentry capsule, is fairly equal to 1 in the layer ofatmosphere under 80 km (i.e. the most interesting for the present study).
Table 2: Maximum tolerable mechanical and thermal loadsMaximum tolerable loads
Heat flux Heat load Deceleration Dynamic pressure[MW/m2] [MJ/m2] [g] [kPa]
15 300 80 800
Initial conditions employed for the reentry trajectory calculation are summarized inTable 3. The initial azimuth angle and latitude have been assumed equal to zero insuch a way to compute an equatorial reentry trajectory.
Table 3: Initial conditions for reentry trajectories calculation
Initial conditionHeight [km] 120
Velocity [km/s] 13.1Flight-path angle [deg] -8.5
From Figure 5 to Figure 7 some relevant flow parameters variation along the com-puted reentry path, including the Mach number, the total specific enthalpy, theaerothermal and mechanical loads acting on the capsule, are plotted.
In Figure 7 the Detra-Hidalgo model for the convective stagnation point heat fluxevaluation has been employed, while Tauber-Sutton correlation has been imple-mented for radiative heating. Figure 7 shows that the range of selected altitudes

472 Copyright © 2013 Tech Science Press FDMP, vol.9, no.4, pp.461-484, 2013
Figure 5: Mach number variation along reentry trajectory
Figure 6: Enthalpy variation along reentry trajectory
for CFD calculations (from 80 to 50 km) includes a significant range of mechan-ical and aerothermal loads. In fact, the stagnation point heat flux monotonically

Aerothermal Analysis of a Sample-Return Reentry Capsule 473
Figure 7: Mechanical and aerothermal loads variation along reentry trajectory
increases in the range of altitudes between 120 km and 63 km (where the heatingpeak is observed). In addition, the maximum heat load resulted to be less than 270MJ/m2. Mechanical and thermal loads acting on the capsule therefore match allthe requirements listed in Table 2.
From Figure 7 it is also important to observe that, although the peak for the aerother-modynamic loads is strictly linked to the amount of deceleration, the maximumvalues for the mechanical and aerothermodynamic loads do not occur at the samealtitude. This represents an important requirement for the successful ending of themission.
According to Figure 5, the requested values to set the boundary conditions in CFDsimulations are presented in Table 4.
Table 4: Boundary and initial condition for CFD simulations
Altitude [km] Mach Number Pressure [Pa] Temperature [k]50 20.46 79.6 27160 35.84 20.5 24570 43.14 4.52 21680 46.24 0.886 198

474 Copyright © 2013 Tech Science Press FDMP, vol.9, no.4, pp.461-484, 2013
4 CFD aerothermodynamic analysis
CFD simulations of the flow field around the reentry capsule have been performedassuming as boundary conditions the ones reported in Table 4 and using the numer-ical models reported in Section 2.4.
4.1 CFD results
In Figure 8 and in Figure 9, as examples of computational results obtained, the massfraction and temperature profiles along the stagnation line, at an altitude of 80kmand for a fully-catalytic case, are shown. Figure 8, in particular, further testify whyNC heat fluxes, compared to FC ones, can be even 50% lower. In fact, as we cansee, the dissociation and ionization phenomena are so developed in the shock layerthat the FC condition on the wall leads to a significant increase of the convectiveheat flux, due to the imposed fully-recombination.
Figure 8: Mass Fraction variation along the stagnation line of atomic and ionizedspecies
As far as the convective stagnation point heat fluxes evaluation is concerned, at thedifferent altitudes analyzed, direct comparisons between the numerical results andsemi-empirical models presented in Section 2.3 have been performed, as plotted inFigure 10.
Figure 10 also shows that the Detra-Hidalgo stagnation point heat flux distribution

Aerothermal Analysis of a Sample-Return Reentry Capsule 475
Figure 9: Temperature variation along the stagnation line
Figure 10: Comparisons between the stagnation point heat flux semi-empirical dis-tributions and CFD results
provides the best agreement with the numerical CFD results, when fully-catalyticconditions are assumed, even if, at the altitude of 60 km, in proximity of the peak
476 Copyright © 2013 Tech Science Press FDMP, vol.9, no.4, pp.461-484, 2013
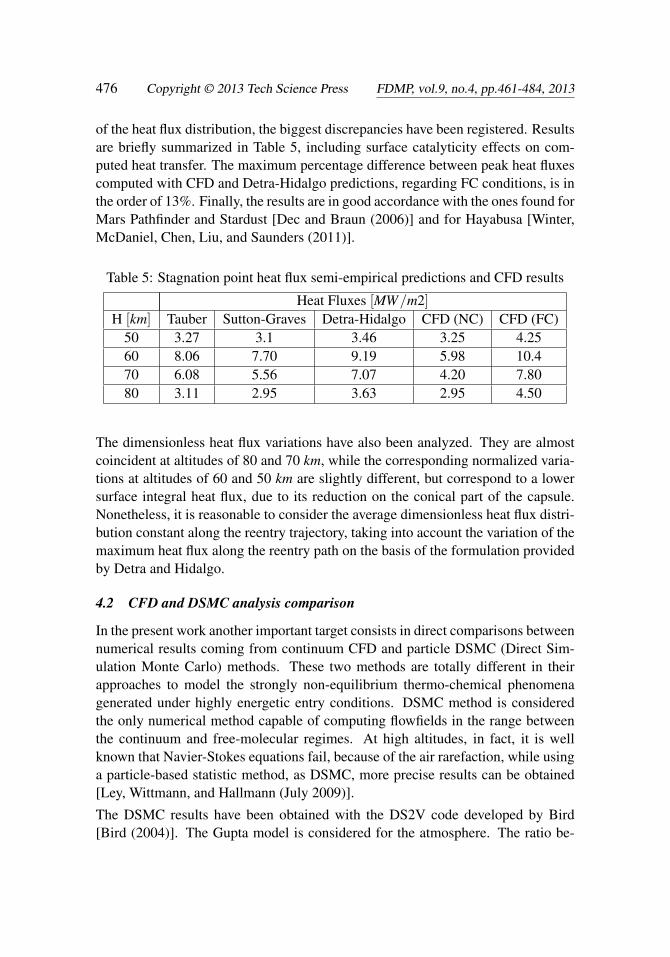
of the heat flux distribution, the biggest discrepancies have been registered. Resultsare briefly summarized in Table 5, including surface catalyticity effects on com-puted heat transfer. The maximum percentage difference between peak heat fluxescomputed with CFD and Detra-Hidalgo predictions, regarding FC conditions, is inthe order of 13%. Finally, the results are in good accordance with the ones found forMars Pathfinder and Stardust [Dec and Braun (2006)] and for Hayabusa [Winter,McDaniel, Chen, Liu, and Saunders (2011)].
Table 5: Stagnation point heat flux semi-empirical predictions and CFD results
Heat Fluxes [MW/m2]H [km] Tauber Sutton-Graves Detra-Hidalgo CFD (NC) CFD (FC)
50 3.27 3.1 3.46 3.25 4.2560 8.06 7.70 9.19 5.98 10.470 6.08 5.56 7.07 4.20 7.8080 3.11 2.95 3.63 2.95 4.50
The dimensionless heat flux variations have also been analyzed. They are almostcoincident at altitudes of 80 and 70 km, while the corresponding normalized varia-tions at altitudes of 60 and 50 km are slightly different, but correspond to a lowersurface integral heat flux, due to its reduction on the conical part of the capsule.Nonetheless, it is reasonable to consider the average dimensionless heat flux distri-bution constant along the reentry trajectory, taking into account the variation of themaximum heat flux along the reentry path on the basis of the formulation providedby Detra and Hidalgo.
4.2 CFD and DSMC analysis comparison
In the present work another important target consists in direct comparisons betweennumerical results coming from continuum CFD and particle DSMC (Direct Sim-ulation Monte Carlo) methods. These two methods are totally different in theirapproaches to model the strongly non-equilibrium thermo-chemical phenomenagenerated under highly energetic entry conditions. DSMC method is consideredthe only numerical method capable of computing flowfields in the range betweenthe continuum and free-molecular regimes. At high altitudes, in fact, it is wellknown that Navier-Stokes equations fail, because of the air rarefaction, while usinga particle-based statistic method, as DSMC, more precise results can be obtained[Ley, Wittmann, and Hallmann (July 2009)].
The DSMC results have been obtained with the DS2V code developed by Bird[Bird (2004)]. The Gupta model is considered for the atmosphere. The ratio be-

Aerothermal Analysis of a Sample-Return Reentry Capsule 477
tween the mean collision separation and the mean free path is less than 1 every-where in the domain, while in the upstream region it is less than 0.2, as suggestedby Bird [Bird (2004)].
Figure 11 and Figure 12 show the comparisons between the pressure coefficientand non-dimensional heat flux distributions along the capsule surface, at the alti-tude of 80 km. Results obtained testify that the two models are in an overall goodagreement. This means that CFD continuum method can be used with reasonableresults also in relatively rarefied regimes, characterized by a low density. It also hasto be underlined that the comparisons between the heat fluxes distributions is par-ticularly satisfactory if compared to the analogous one reported in previous works[Boyd, Trumble, and Wright (2010)]. Further details about DSMC calculations canbe found in [Zuppardi, Savino, Boffa, and Carandente (2012)].
Figure 11: Comparison between DSMC and CFD in the evaluation of the pressurecoefficient distribution along the surface capsule at the altitude of 80 km
5 Thermal analysis for an ablative heat shield
As previously discussed, the heat shield dimensioning for an entry vehicle is acritical issue, in particular for interplanetary missions.

478 Copyright © 2013 Tech Science Press FDMP, vol.9, no.4, pp.461-484, 2013
Figure 12: Comparison between DSMC and CFD in the evaluation of the heat fluxdistribution along the surface capsule at the altitude of 80 km and for fully-catalyticconditions
In the present section a one-dimensional thermal analysis for an ablative PICA heatshield has been carried out on the basis of the numerical model described in Section2.5.
The analysis had been carried out for the stagnation point, assuming the heat fluxvariation reported in Figure 7 but, due to the different uncertainties of the modelsimplemented, considering a 20% margin for the convective and a 100% margin forthe radiative heat flux, respectively. This resulted in a maximum stagnation pointheat flux in the order of 16.6 MW/m2.
In addition, the stagnation pressure time profile, useful to take into account the ma-terial blowing, has been obtained from the dynamic pressure time history consider-ing a pressure coefficient equal to 2 and neglecting the static pressure contribution.
Figure 13 reports the time variation, during the capsule atmospheric reentry, ofthe bondline temperature, for different values of the PICA initial thickness. If amaximum tolerable temperature of 200◦C is assumed, Figure 13 shows that a PICAlayer 4 cm thick is necessary to this scope at the stagnation point.
The one-dimensional analysis can be also applied to the entire heat shield dimen-sioning, properly scaling the stagnation point heat flux by the normalized distribu-tion reported in Figure 12.

Aerothermal Analysis of a Sample-Return Reentry Capsule 479
Figure 13: Bondline temperature variation for different values of the PICA startingthickness
Figure 14: Material thickness and surface temperature variation along the entrytrajectory
The material thickness and the surface temperature variations along the flight pathare shown in Figure 14. The dashed line shows that the surface temperature in-creases for the first 40 seconds (up to about 58 km of altitude, where a maximum

480 Copyright © 2013 Tech Science Press FDMP, vol.9, no.4, pp.461-484, 2013
of about 3300◦C is reached) and then, due to both the heat flux reduction along thetrajectory and to the high re-radiated flux, it starts to decrease.
The solid line, on the other hand, shows the thickness variation for the material, dueto its ablation. Basing on the ablation model described in Section 2.5, the recessionrate has been considered nonzero for surface temperatures higher than a thresholdvalue (which has been assumed equal to 2000 K for the material under investigation[Dec and Braun (2006)]). The total recession has estimated to be of about 6.4 mm.It has to be specified that the initial material thickness in the stagnation point regionis therefore not driven by the total amount of receded material, but by the maximumbondline temperature reached due to the in-depth conduction.
6 Conclusions
The main purpose of the present work was to calculate aerothermal loads occurringduring an Earth reentry of a sample-return capsule from super orbital speeds. CFDanalyses have been performed in four points of the computed reentry trajectory,assuming a possible baseline capsule configuration, both in non-catalytic and infully-catalytic conditions. Due to the large amount of energy characterizing theatmospheric reentry, dissociation and ionization processes are so developed that thefully-catalytic heat flux at the stagnation point at the altitude of 60 km is about twicethe corresponding non-catalytic value. Comparing CFD results at the investigatedaltitudes with three different semi-empirical models a reasonably agreement withthe Detra-Hidalgo correlation was observed.
In addition, direct comparisons between a CFD continuum and a DSMC particlemethod have been considered at an altitude of 80 km. The analysis showed thatCFD can be successfully employed not only in continuum regimes, but also inrelatively rarefied ones, where particle methods give more precise results.
Finally, a one-dimensional thermal analysis for the capsule ablative heat shield hasbeen carried out at the stagnation point, in order to preliminary dimension the ma-terial thickness necessary to maintain the bondline temperature below a maximumtolerable value.
References
Anderson, J. D. (1989): Hypersonic and High Temperature Gas Dynamics.McGraw-Hill.
Bird, G. (2004): The ds2v/3v program suite for dsmc calculations. In Capitelli,M.(Ed): Proceedings of the 24th International Symposium on Rarefied Gas Dy-namics, Monopoli, Italy.

Aerothermal Analysis of a Sample-Return Reentry Capsule 481
Boyd, I.; Trumble, K.; Wright, M. (2010): Modeling of stardust entry at high al-titude, part1: Flowfield analysis, nasa ames research center. Journal of Spacecraftand Rockets, vol. 47, no. 5.
Brucato, J. R.; Rotundi, A.; Epifani, E. M. (2009): Sample return missionsfrom minor bodies: Achievements, future plan and observational support. Earth,Moon and Planets, vol. 105, no. 2-4.
Covington, M. A. (2004): Performance of a light-weight ablative thermal pro-tection material for the stardust mission sample return capsule. In Proceedings ofthe 2nd International Planetary Probe Workshop, NASA Ames Conference Center,Moffett Field, California USA.
Dec, J. A.; Braun, R. D. (2006): An approximate ablative thermal protectionsystem sizing tool for entry system design. In 44th AIAA Aerospace SciencesMeeting and Exhibit, Reno, Nevada.
Desai, P. N.; Lyons, D. T.; Tooley, J.; Kangas, J. (2006): Entry, descent, andlanding operations analysis for the stardust re-entry capsule. Technical Report2006-6410, AIAA, 2006.
Detra, R. W.; Hidalgo, H. (1961): Generalized heat transfer formulas and graphsfor nose cone re-entry into the atmosphere. ARS Journal, vol. 31, pp. 318–321.
Evans, J. S.; Jr., C. J. S.; Hubert, P. (1973): Boundary-layer profiles for a entryof a blunt slender body at high altitude. Technical Report TN D-7332, NASA,1973.
Ley, W.; Wittmann, K.; Hallmann, W. (July 2009): Handbook of SpaceTechnology.
Milos, F. S.; Chen, Y.; Squire, T. H. (2006): Updated ablation and thermalresponse program for spacecraft heatshield analysis. In Proceedings of the 17thThermal and Fluids Analysis Workshop, University of Maryland.
Mohammadiun, H.; Kianifar, A. (2011): Numerical modeling of non-charringmaterial ablation with considering chemical reaction effects, mass transfer and sur-face heat transfer. European Journal of Scientific Research, vol. 54, no. 3, pp.435–447.
Monti, R.; Fumo, M. D. S.; Savino, R. (2005): Thermal shielding of a reentryvehicle by ultra high temperature ceramic materials. Journal of Thermophysicsand Heat Transfer, vol. 20, no. 3, pp. 500–506.
Monti, R.; Savino, R.; Fumo, M. D. S. (2007): Matching flight conditions onsharp leading edges in plasma wind tunnels. Journal of Thermophysics and HeatTransfer, vol. 21, no. 3, pp. 660–664.

482 Copyright © 2013 Tech Science Press FDMP, vol.9, no.4, pp.461-484, 2013
Park, C. (1990): Nonequilibrium Hypersonic Aerothermodynamics. Wiley.
Paterna, D.; Monti, R.; Savino, R.; Esposito, A. (2001): Experimental andnumerical investigation of martian atmosphere entry. Journal of Spacecrafts andRockets, vol. 39, no. 2, pp. 227–236.
Savino, R.; Fumo, M. D. S. (2008): Aerothermodynamic study of ultra-hightemperature ceramic winglet for atmospheric test. AIAA Journal of Thermophysicsand Heat Transfer, vol. 22, no. 4, pp. 669–676.
Savino, R.; Paterna, D.; Fumo, M. D. S.; D’Elia, M. (2010): Plasma-radiofrequency interactions around atmospheric reentry vehicles. modelling andarc-jet simulation. The Open Aerospace Engineering Journal, vol. 3, pp. 76–85.
Sutton, K.; Graves, R. A. (1971): A general stagnation-point convective-heatingequation for arbitrary gas mixtures. Technical Report TR-R-376, NASA, 1971.
Tauber, M. E. (1989): A review of high-speed, convective, heat-transfer compu-tation methods. Technical Report Technical Paper 2914, NASA, 1989.
Tauber, M. E.; Sutton, K. (1991): Stagnation-point radiative heating relationsfor earth and mars entries. Journal of Spacecraft, vol. 28, no. 1, pp. 40–42.
Tran, H. K. (1994): Development of lightweight ceramic ablators and arc jet testresults. Technical Report TM-108798, NASA, 1994.
Tran, H. K.; Johnson, C. E.; Rasky, D. J.; Hui, F. C. L.; Hsu, M. T.; Chen, T.;Chen, Y. K.; Paragas, D.; Kobayash, L. (1997): Phenolic impregnated carbonablators (pica) as thermal protection systems for discovery missions. TechnicalReport TM-110440, NASA, 1997.
Williams, S. D.; Curry, D. M. (1992): Thermal protection materials - thermo-physical property data. Technical Report RP-1289, NASA, 1992.
Winter, M. W.; McDaniel, R. D.; Chen, Y. K.; Liu, Y.; Saunders, D. (2011):Current status on radiation modeling for the hayabusa re-entry. In Workshop onRe-Entry Emission Signatures V, Brisbane, Australia.
Zuppardi, G.; Savino, R.; Boffa, C.; Carandente, V. (2012): Aero-thermo-dynamic analysis of a sample-return capsule in high altitude re-entry path. InProceedings of the 28 th International Symposium on Rarefied Gas Dynamics,Zaragoza July.
Appendix A: Nomenclature
ci mass fraction of the ith specie, [kg/kg]
cp material specific heat, [J/(kg ·K)]

Aerothermal Analysis of a Sample-Return Reentry Capsule 483
f (V ) tabulated values functions used in Equation 5
g gravitational acceleration at the altitude H, [m/s2]
g0 standard gravitational acceleration, [m/s2]
k material thermal conductivity, [W/(m ·K)]
qconv stagnation point convective heat flux, [W/m2]
qrad stagnation point radiative heat flux, [W/m2]
r curvature radius of the trajectory, [m]
s ablation rate, [m/s]
t time, [s]
x spatial coordinate, [m]
B ballistic parameter, [kg/m2]
C atmosphere depending constant used in Equation 5
CD drag coefficient
E activation energy, [J]
H altitude, [m]
Htot fluid total enthalpy per unit of mass, [J/kg]
K constant used in Equation 3 derived for a general gas mixture
Q∗ heat of ablation, [W · s/kg]
Rb base radius, [m]
Rn nose radius, [m]
R⊕ Earth radius, [m]
T surface temperature, [K]
V flight velocity, [m/s]
γ flight path angle, [rad]

484 Copyright © 2013 Tech Science Press FDMP, vol.9, no.4, pp.461-484, 2013
δ material thickness, [m]
ε material emissivity
λ latitude, [rad]
ρ air density, [kg/m3]
σ Stephan-Boltzmann constant, [W/(m2 ·K4)]
φBLOW blowing parameter used in Equation 15
Γ resine volume fraction, [m3/m3]
Λ longitude, [rad]
ψ azimuth angle, [rad]
Subscripts
c char material
cw cold wall
dis dissociated species
hw hot wall
ion ionized species
m material
n direction normal to the wall
o virgin material
w wall
A,B resin components
C carbon Fiberform
Superscripts
a,b exponents used in Equation 5