
Aerospace Supply Chain Overview · 2018-02-15 · Aerospace –Supply Chain Overview September...
31
Aerospace – Supply Chain Overview September 20XX
Transcript of Aerospace Supply Chain Overview · 2018-02-15 · Aerospace –Supply Chain Overview September...

Aerospace – Supply Chain Overview
September 20XX

Table of Contents
Disclaimer: This document is provided for information purposes only. The information is believed to be reliable, but TresVista does not warrant its completeness or accuracy. It should not be used, relied upon, or treated as a substitute for specific professional advice. Opinions, estimates, and assumptions constitute our judgment as of the date hereof and are subject to change without notice. This material is not intended as an offer or solicitation for the purchase or sale of any financial instrument. Additional information is available upon request. Images used in this document are for reference only and may not be reproduced, copied, transmitted or manipulated in any way.
© TresVista Financial Services 20XX
1. Executive Summary
2. Industry Overview
3. Key Growth Drivers
4. Business Dynamics
5. Key Performance Metrics
6. Recent Trends

1. Executive Summary
TresVista Financial Services
4
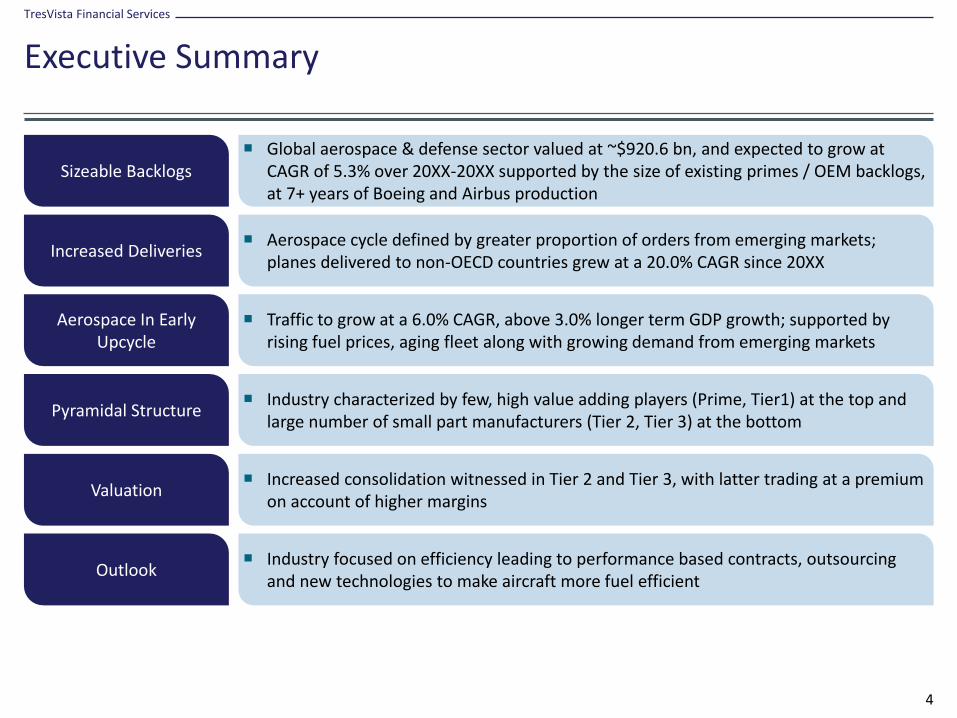
Executive Summary
Sizeable Backlogs Global aerospace & defense sector valued at ~$920.6 bn, and expected to grow at
CAGR of 5.3% over 20XX-20XX supported by the size of existing primes / OEM backlogs, at 7+ years of Boeing and Airbus production
Outlook Industry focused on efficiency leading to performance based contracts, outsourcing
and new technologies to make aircraft more fuel efficient
Valuation Increased consolidation witnessed in Tier 2 and Tier 3, with latter trading at a premium
on account of higher margins
Pyramidal Structure Industry characterized by few, high value adding players (Prime, Tier1) at the top and
large number of small part manufacturers (Tier 2, Tier 3) at the bottom
Aerospace In Early Upcycle
Traffic to grow at a 6.0% CAGR, above 3.0% longer term GDP growth; supported by rising fuel prices, aging fleet along with growing demand from emerging markets
Increased Deliveries Aerospace cycle defined by greater proportion of orders from emerging markets;
planes delivered to non-OECD countries grew at a 20.0% CAGR since 20XX

2. Industry Overview
TresVista Financial Services
6
Introduction
Aerospace & Defense Opportunity
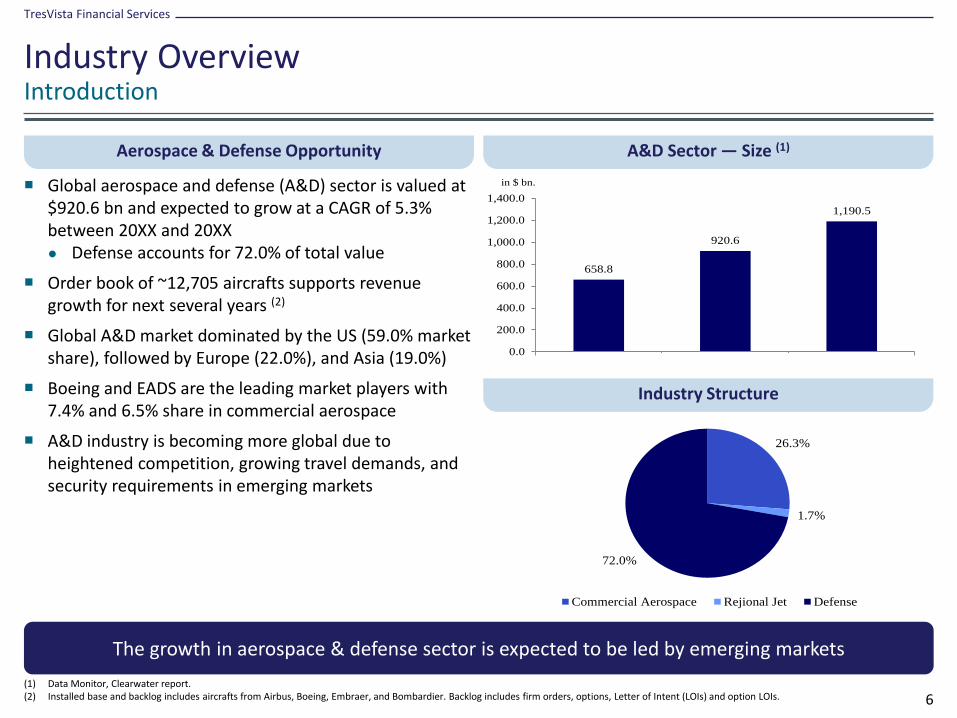
Global aerospace and defense (A&D) sector is valued at $920.6 bn and expected to grow at a CAGR of 5.3% between 20XX and 20XX● Defense accounts for 72.0% of total value
Order book of ~12,705 aircrafts supports revenue growth for next several years (2)
Global A&D market dominated by the US (59.0% market share), followed by Europe (22.0%), and Asia (19.0%)
Boeing and EADS are the leading market players with 7.4% and 6.5% share in commercial aerospace
A&D industry is becoming more global due to heightened competition, growing travel demands, and security requirements in emerging markets
Industry Overview
A&D Sector — Size (1)
Industry Structure
(1) Data Monitor, Clearwater report. (2) Installed base and backlog includes aircrafts from Airbus, Boeing, Embraer, and Bombardier. Backlog includes firm orders, options, Letter of Intent (LOIs) and option LOIs.
The growth in aerospace & defense sector is expected to be led by emerging markets
658.8
920.6
1,190.5
0.0
200.0
400.0
600.0
800.0
1,000.0
1,200.0
1,400.0
2005 2009 2014
in $ bn.
26.3%
1.7%
72.0%
Commercial Aerospace Rejional Jet Defense

TresVista Financial Services
7
Business Segments
Commercial Aerospace (1)
Revenue grew by 11.0% in 20XX
Annual production record of 1,011 deliveries by Boeing and Airbus in 20XX ● 5.2% delivery growth in 20XX
Major players include Airbus, and Boeing
Revenue remained flat with total billing of $15.5 bn in 20XX
Industry backlog (20XX) of ~1,300 aircraft valued at $44.6 bn, with improved fundamentals of late
Major players include Bombardier & Embraer
Industry Overview
Regional Jet (2)
Global defense revenue decreased 3.3% in 20XX
Defense sector in the US remained flat, with Asia and ME driving growth
Major players include Boeing, Lockheed Martin & Northrop Grumman
Defense (3)
(1) Delloite 20XX A&D report, Boeing: Current Market Outlook (20XX-20XX).(2) Bombardier Business Aircraft: Market forecast (20XX-20XX).(3) moneymorning.com.au/20120417/australia-the-pacific-pawn-in-usa-versus-china.html.
Market for regional jets is expected to grow faster than commercial aerospace & defense
19,410
28,580
39,530
0
10,000
20,000
30,000
40,000
50,000
2010 2020 2030
No. of Airplanes
139.0
266.0
382.0
50.0
100.0
150.0
200.0
250.0
300.0
350.0
400.0
2002-2011 2012-2021 2022-2031
in $ bn.
1,003.0 1,066.8
0.0
200.0
400.0
600.0
800.0
1,000.0
1,200.0
2011 2015
in $ bn.

3. Key Growth Drivers

TresVista Financial Services
9
Commercial Aerospace
Traffic and GDP Growth
Air traffic grew at CAGR of 5.0% since 19XX, resilient to recessions, financial crises, Gulf wars, oil shock, and 9/11 attack
Air traffic has been growing at approximately 1.5x-2.5x the global GDP growth rate
Global load factor for airlines are at record high level of ~79.0% and further increase in traffic will be met by fleet expansion
Key Growth Drivers
Historical Traffic Growth (1)
Global Load Factor (2) GDP and Air Traffic (1)
(1) Airbus Global Market Forecast (20XX-20XX).(2) Sector Primer – Bank of America Merrill Lynch dated 13 May, 20XX.(3) RPK: Revenue Passenger Kilometers.
Average global GDP growth of ~3% translates to traffic growth of 6.0% in the long term
0.0
1.0
2.0
3.0
4.0
5.0
6.0
1980 1983 1986 1989 1992 1995 1998 2001 2004 2007 2010
RPKs(3) (trillions)
Gulf War
9/11
Credit crisis
0.0%
10.0%
20.0%
30.0%
40.0%
50.0%
60.0%
70.0%
80.0%
90.0%
-6.0%
-4.0%
-2.0%
0.0%
2.0%
4.0%
6.0%
8.0%
10.0%
Q4
2006
Q3
2007
Q2
2008
Q1
2009
Q4
2009
Q3
2010
Q2
2011
Q1
2012E
Q4
2012E
World real GDP Passenger Traffic

TresVista Financial Services
10
Commercial Aerospace
Emerging Market Drive Traffic Growth
Air traffic growth is shifting from U.S. & Europe to Asia Pacific with China’s air traffic growing at CAGR of 8.7 % in 20XX-20XX
Growth in propensity to travel is estimated to be 4.0x in China and 3.0x in India by 20XX compared to 20XX
Two third of the traffic growth will be generated by emerging economies by 20XX
Key Growth Drivers
Changing Dynamics of Air Travel (1)
Global Traffic Growth (2) Trips per capita in 20XX (1)
(1) Airbus Global Market Forecast (20XX-20XX).(2) Broker Report.
China is estimated to exceed U.S. in air traffic by 20XX
0
2,000
4,000
6,000
8,000
10,000
12,000
14,000
1990 2010 2030
Air Traffic, RPKs (billions)
North America Europe Asia Pac China Middle East Other
0.001
0.010
0.100
1.000
10.000
0.0 10,000.0 20,000.0 30,000.0 40,000.0 50,000.0
UK
GermanyFranceChina 2030
Russia
Brazil
China
Trips per capita - 2010
India 2030
2010 real GDP per capita
India
USA
800.0
600.0
400.0
200.0
-
200.0
400.0400.0
200.0
-
200.0
400.0
600.0
800.0
2010 2011 2012E 2013E 2014E 2015E 2016E
RPM (billions)
Emerging Markets US & Europe
TresVista Financial Services
11
Commercial Aerospace
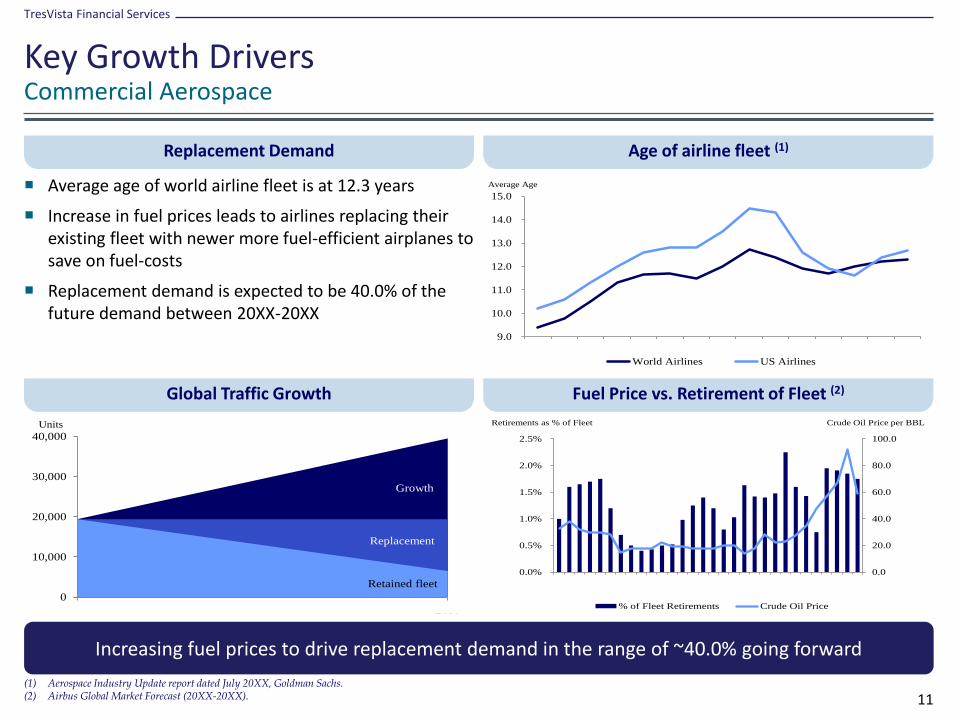
Replacement Demand
Average age of world airline fleet is at 12.3 years
Increase in fuel prices leads to airlines replacing their existing fleet with newer more fuel-efficient airplanes to save on fuel-costs
Replacement demand is expected to be 40.0% of the future demand between 20XX-20XX
Key Growth Drivers
Age of airline fleet (1)
Global Traffic Growth Fuel Price vs. Retirement of Fleet (2)
(1) Aerospace Industry Update report dated July 20XX, Goldman Sachs.(2) Airbus Global Market Forecast (20XX-20XX).
Increasing fuel prices to drive replacement demand in the range of ~40.0% going forward
0.0
20.0
40.0
60.0
80.0
100.0
0.0%
0.5%
1.0%
1.5%
2.0%
2.5%
% of Fleet Retirements Crude Oil Price
Retirements as % of Fleet Crude Oil Price per BBL
9.0
10.0
11.0
12.0
13.0
14.0
15.0
1981 1983 1985 1987 1989 1991 1993 1995 1997 1999 2001 2003 2005 2007 2009
Average Age
World Airlines US Airlines
0
10,000
20,000
30,000
40,000
2010 2030
Units
Growth
Replacement
Retained fleet

TresVista Financial Services
12
Regional Jet
Key Growth Drivers
Affluence Leading to Business Jet Growth ● The number of billionaires reached a record high of
1,231 in 20XX with China showing a y-o-y growth of 66.0%
Aging Fleet● With 24.1% of the fleet above 25 years, there is
increased expectation of replacement in the next decade
Key Growth Drivers
Number of Billionaires (1)
Business Jet Fleet Age (20XX) (1) Business Jet Fleet Forecast (1)
(1) Bombardier Market Forecast (20XX-20XX).
Economic recovery, increased wealth creation & jet utilization will drive the growth for business jets
15,200
21,900
31,500
9,800
14,200
3,100
4,600
427
182
10772 72 62
36 494
428
192178
116 9586 53 56
60
100
200
300
400
500
North
America
Europe China Russia
& CIS
Asia ex.
China
Middle
East
Latin
America
India Africa
2010 2011
3,410
2,8402,690
1,3651,255
1,520 1,590
690970
0
1,000
2,000
3,000
4,000
1-5 6-10 11-15 16-20 21-25 26-30 31-35 36-40 >40
Fleet
Aircraft Age Groups
Avg. Age = 15.9 years

TresVista Financial Services
13
Defense
Key Drivers(1)
US Defense Budget ● U.S. & other developed countries remain the key
driver despite of the defense budget reduction on account of growing fiscal deficit
China’s Increasing Budget ● Increase in China’s military expansion, along with its
neighbors have resulted in increased exports for the U.S. defense industry
Key Growth Drivers
Military Expenditure by Country (20XX) (1)
China vs. U.S. Defense Budget (2) Projected U.S. Military Expenditure (3)
(1) Stockholm International Peace Research Institute (SIPRI).(2) nextbigfuture.com/20XX/XX/china-economic-forecast-to-20XX-and.html.(3) A&D 20XX review – PWC.
China’s rapid military expansion, along with others in Asia, is likely to drive growth
698.0
119.060.0 59.0 59.0 55.0 45.0 45.0 41.0 37.0
412.0
0.0
100.0
200.0
300.0
400.0
500.0
600.0
700.0
800.0
in $ bn.
710.0675.0
620.0 630.0 640.0 660.0
0.0
100.0
200.0
300.0
400.0
500.0
600.0
700.0
800.0
2011E 2012E 2013E 2014E 2015E 2016E
in $ bn.
0.0
500.0
1,000.0
1,500.0
2,000.0
2,500.0
3,000.0
3,500.0
2009 2013 2017 2021 2025 2029 2033 2037
in $ bn.
China U.S.

4. Business Dynamics

TresVista Financial Services
15
Industry Supply Chain
Overview
Business Dynamics
Fragmented industry with multiple layers in the supply chain
Primes - Control design, manufacturing and assembly function, the most critical component of value chain
Tier 1 - Support Primes by providing them with equipments and systems like engines, Wings, Fuselage
Tier 2 - Manufacture and develop parts as per the specifications provided by primes and Tier 1 suppliers
Tier 3 - Responsible for supplying basic products, components and other non-core value added services
Airframe Manufacturer
Engine Manufacturer Mechanical Parts Accessories
Landing Gear Manufacturer
Wheels & Brakes Bearings
WingsFlight Control
ActuatorsPlastic Parts &
Castings
Fuselage Avionics & HydraulicsInteriors & In-Flight
Entertainment
Prime Tier-1 Tier-2 Tier-3

TresVista Financial Services
16
Industry Supply Chain
Various Components In Play Across The Industry (1)
Business Dynamics
(1) Commercial Aerospace: Industry Overview by Bank of America Merrill Lynch.
TresVista Financial Services
17
Supply Chain Components
Airframe Primes (1)
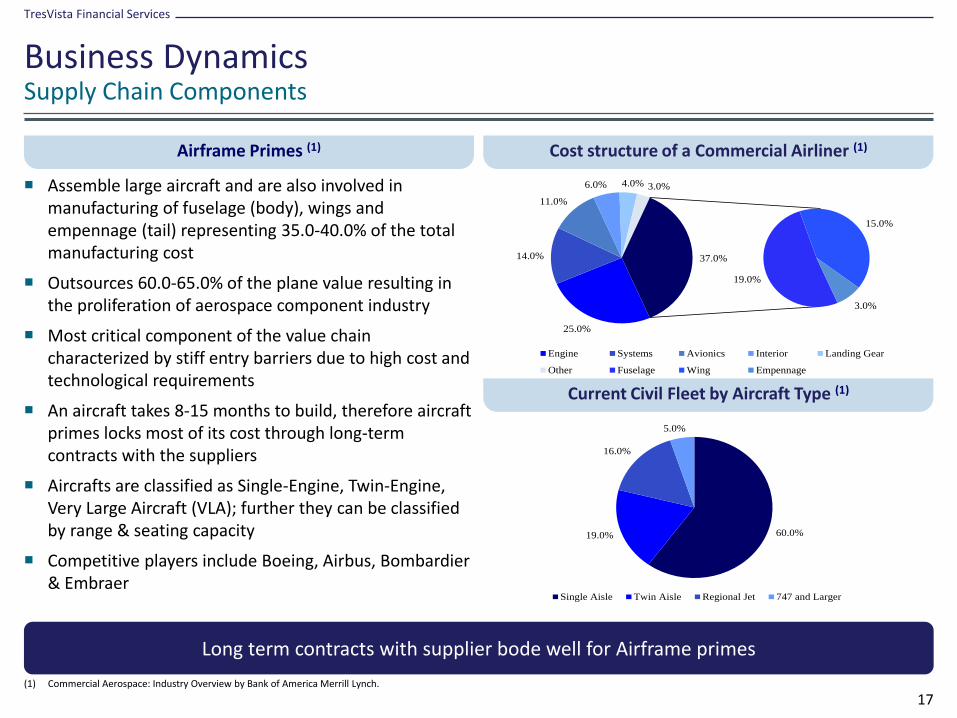
Assemble large aircraft and are also involved in manufacturing of fuselage (body), wings and empennage (tail) representing 35.0-40.0% of the total manufacturing cost
Outsources 60.0-65.0% of the plane value resulting in the proliferation of aerospace component industry
Most critical component of the value chain characterized by stiff entry barriers due to high cost and technological requirements
An aircraft takes 8-15 months to build, therefore aircraft primes locks most of its cost through long-term contracts with the suppliers
Aircrafts are classified as Single-Engine, Twin-Engine, Very Large Aircraft (VLA); further they can be classified by range & seating capacity
Competitive players include Boeing, Airbus, Bombardier & Embraer
Business Dynamics
Cost structure of a Commercial Airliner (1)
Current Civil Fleet by Aircraft Type (1)
(1) Commercial Aerospace: Industry Overview by Bank of America Merrill Lynch.
Long term contracts with supplier bode well for Airframe primes
60.0% 19.0%
16.0%
5.0%
Single Aisle Twin Aisle Regional Jet 747 and Larger
25.0%
14.0%
11.0%
6.0% 4.0% 3.0%
19.0%
15.0%
3.0%
37.0%
Engine Systems Avionics Interior Landing Gear
Other Fuselage Wing Empennage
TresVista Financial Services
18
Supply Chain Components
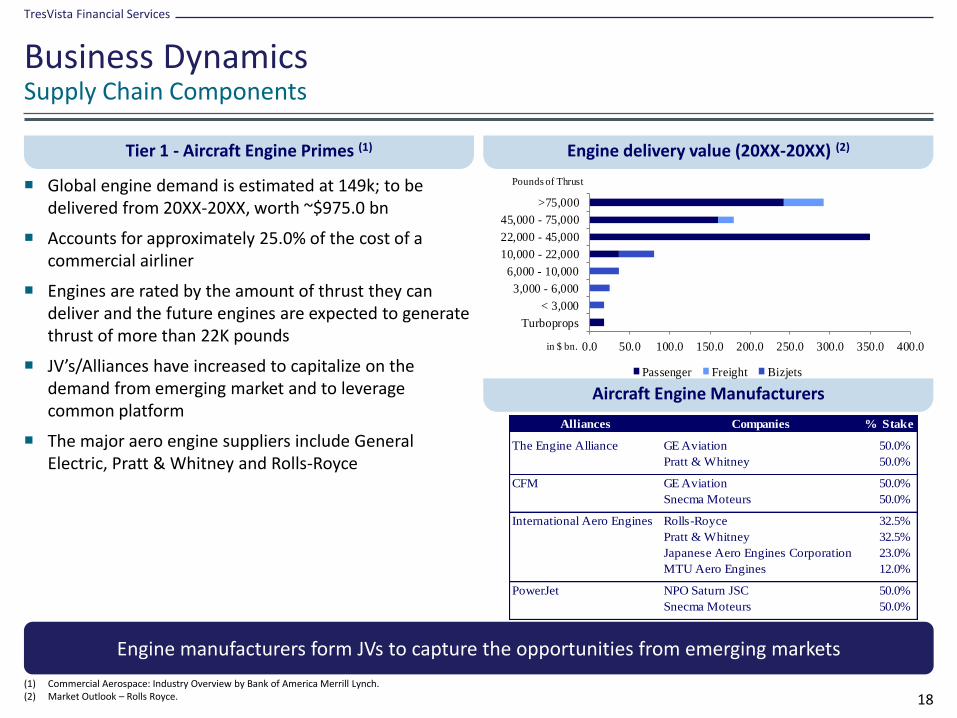
Tier 1 - Aircraft Engine Primes (1)
Global engine demand is estimated at 149k; to be delivered from 20XX-20XX, worth ~$975.0 bn
Accounts for approximately 25.0% of the cost of a commercial airliner
Engines are rated by the amount of thrust they can deliver and the future engines are expected to generate thrust of more than 22K pounds
JV’s/Alliances have increased to capitalize on the demand from emerging market and to leverage common platform
The major aero engine suppliers include General Electric, Pratt & Whitney and Rolls-Royce
Business Dynamics
Engine delivery value (20XX-20XX) (2)
Aircraft Engine Manufacturers
(1) Commercial Aerospace: Industry Overview by Bank of America Merrill Lynch.(2) Market Outlook – Rolls Royce.
Engine manufacturers form JVs to capture the opportunities from emerging markets
0.0 50.0 100.0 150.0 200.0 250.0 300.0 350.0 400.0
Turboprops
< 3,000
3,000 - 6,000
6,000 - 10,000
10,000 - 22,000
22,000 - 45,000
45,000 - 75,000
>75,000
Pounds of Thrust
Passenger Freight Bizjets
in $ bn.
Alliances Companies % Stake
The Engine Alliance GE Aviation 50.0%
Pratt & Whitney 50.0%
CFM GE Aviation 50.0%
Snecma Moteurs 50.0%
International Aero Engines Rolls-Royce 32.5%
Pratt & Whitney 32.5%
Japanese Aero Engines Corporation 23.0%
MTU Aero Engines 12.0%
PowerJet NPO Saturn JSC 50.0%
Snecma Moteurs 50.0%

TresVista Financial Services
19
Supply Chain Components
Tier 1 - Aerostructures, Nacelles and Gears
Aerostructures are used to provide stability and aero-dynamicity, includes all or part of the fuselage, wings and flight control surfaces
Spirit is the largest aerostructure manufacturer with ~16.0% market share of $40.0 bn
Nacelle is an aerodynamic structure around engine, containing nozzle and thrust reverser
Independent nacelle suppliers include Goodrich, Spirit, Aircelle and GKN
Landing gear constitutes 4.0% of the plane value with the market dominated by Safran and Goodrich
Large jet aircraft have one nose gear to allow the aircraft to maneuver while on the ground; with two wheel set at the back to absorb shock while landing
Business Dynamics
Aerostructures and Nacelles (1)
Landing Gear(1)
(1) Commercial Aerospace: Industry Overview by Bank of America Merrill Lynch.
Aerostructures are built to have high strength to weight ratio, with low drag

TresVista Financial Services
20
Supply Chain Components
Tier 2 - Tires and Brakes (1)
Aircraft tires are filled with nitrogen as they expand/contract less at extreme temperatures
Single-aisle aircraft use steel disc brakes, while larger, twin-aisle aircraft use carbon brakes as they have more stopping power
Major manufacturers include Goodrich, Messier Dowty, Honeywell and K&F
Hydraulic servo-valves are used to manipulate primary and secondary flight control, landing gear, and steering system
It is also used to provide additional power
Recently the hydraulic systems are being replaced by digital system as they are:
- Much lighter than hydraulic system, hence fuel
efficient
- Less susceptible to mechanic failure
- Requires less physical maintenance
- Can relay positioning feedback information to
pilot
Airbus pioneered the use of digital control and uses this system on all of its aircraft models, except for the A300 and A310
Includes radios, navigation equipment, sensors, processors, and electronic displays
Avionics are different from electronics as they operate under extreme temperatures
Avionics has moved towards integrated system or “glass cockpit”, which displays wide range of operating data on a single main screen
Business Dynamics
Tier 2 - Hydraulic System (1)
Tier 2 - Avionics (Aviation Electronics)
(1) Commercial Aerospace: Industry Overview by Bank of America Merrill Lynch.
Hydraulic systems are replaced by more precise electrical systems

TresVista Financial Services
21
Supply Chain Components
Tier 3 - Industry Characteristics (1)
Includes hardware, bearing, electrical component and machined part
Total addressable market of $6.5 bn with 69.0% sold to OEMs/subcontractors and the remaining to airlines and aftermarket MRO
North America and Europe constitutes ~68.0% of the market
Sales channel weighted towards distribution (~64.0%)
Distribution market relatively consolidated (especially hardware) with the top four companies constituting ~50.0% of the market
Commercial Aerospace controls 56.0% of the market with the remaining contributed by defense
Key Players – B/E Aerospace, Wesco, Precision Castparts
Business Dynamics
Product Mix (2)
Geographic Segmentation (2)
(1) Commercial Aerospace: Industry Overview by Bank of America Merrill Lynch.(2) Wesco Aircraft Initiating Coverage by Citigroup.
Large and fragmented addressable market
46%
26%
16%
12%
Hardware Bearings Electric Comps Machined Parts
39%
29%
16%
5%
11%
North America Europe Asia Pasific Latin America Other

TresVista Financial Services
22
Supply Chain Components
Materials
Aluminum and aluminum alloys are the principal structural material used in aircraft as they have good strength-to-weight and stiffness characteristics, provides good corrosion resistance and is relatively inexpensive
Titanium is 60.0% heavier and 10.0x costlier than aluminum but is twice as strong and has higher melting point, hence used in structures surrounding hot areas
Unlike aluminum, composites are ~25.0% lighter with higher strength-to-weight ratio and can be made available in complex shapes associated with modern aircraft
Estimated demand for composite engine structures to grow at CAGR of 7.0%, reaching a high of 1,324.5 MT in 20XX; representing market value of ~$800.0 mn
Relative to traditional materials, composites are expensive; costs expected to decline significantly through the automation of manufacturing processes going forward
Major players comprise of Hexcel, Amoco, Toray & Toho
Business Dynamics
Composites - Niche Focus (1)
(1) Commercial Aerospace: Industry Overview by Bank of America Merrill Lynch.
Usage of composite is increasing significantly over traditional materials like aluminum & steel
0.0%
20.0%
40.0%
60.0%
80.0%
100.0%
B747 B777 A340 A380 B787 A350 XWB
Composite Titanium Steel Alum/Lithium Alloys Other Aluminum

TresVista Financial Services
23
Supply Chain Components
MRO (1)(2)
Global MRO market valued at $45.7 bn (20XX) consists primarily of airframe maintenance, engine and component work as well as line maintenance● Global MRO industry is expected to reach $50.0 bn
by 2015, implying a 20XX-20XX CAGR of 3.5%
Key revenue from MRO is derived from engine maintenance (43%), followed by heavy maintenance visits and modifications (21%)
Emerging markets to dominate MRO sector with India and China growing at ~9.5% over 20XX-20XX
Major players include Triumph Group, Helico, and AAR
Business Dynamics
Breakout of MRO market (1)
Market Overview (2)
(1) Commercial Aerospace: Industry Overview by Bank of America Merrill Lynch; Aerospace Global Report 20XX.(2) Commercial Services Report by AAR.
North American market to experience 1.0% growth against a global CAGR of ~4.0%
35.0%
23.0%
20.0%
15.0%
7.0%
Engine Component Line Airframe Heavy Modification
Line Airframe Heavy Modification
0.0
10.0
20.0
30.0
40.0
50.0
60.0
Segment Geography
Engine
Component
Line
Heavy
N.America
Europe
Asia
ME
Other
10-year
Projected
CAGR
10-year
Projected
CAGR
3.0%
3.0%
4.0%
4.0%
3.0%
5.0%
6.0%
2.0%
1.0%
in $ bn.

5. Key Performance Metrics

TresVista Financial Services
25
Value Chain Comparison
LTM EBITDA Margin
Key Performance Metrics
LTM EV/EBITDA Multiple
(1)Airframe Manufacturers - BA US, AM FP, BBD/B CN, TXT US, UNAC RM, UUAZ RM, IRKT RM, RTVL RU; Tier 1 - UTX US, GR US, SAF FP, MTX GR, SPR US, FNC IM; Tier 2 - LMT US, RTN US, NOC US, LLL US, HO FP, ZC FP, TDY US, ESL US, MOG/A US, SAABB SS, XLS US, ULE LN, CW US, MANT US, GY US, MAL CN, LAT FP; Tier 3 - PCP US, COL US, TDG US, MGGT LN, BEAV US, COB LN, TGI US, HEI US, SNR LN, ROLL US, AIR US, ATRO US, HRX CN, LMIA US, SIF US, DCO US; Materials - HXL US, CRDN US, UMC LN, AVON LN.(2)Enterprise Value calculation as of July 20XX
Tier 3 trades at a premium on account of higher EBITDA Margin
0.0%
5.0%
10.0%
15.0%
20.0%
25.0%
Airframe Manufacturers Tier 1 Tier 2 Tier 3 Materials
EBITDA Margin
0.0x
2.0x
4.0x
6.0x
8.0x
10.0x
12.0x
Airframe Manufacturers Tier 1 Tier 2 Tier 3 Materials
EV/EBITDA

TresVista Financial Services
26
Category Comparison
LTM EBITDA Margin
Key Performance Metrics
LTM EV/EBITDA Multiple
Prime -BA US, EAD FP, AM FP, BBD/B CN, TXT US, SPR US, UNAC RM, UUAZ RM, IRKT RM, RTVL RU; Engine Manufacturer - UTX US, RR/ LN, SAF FP, MTX GR; Electronic Systems - LMT US, RTN US, NOC US, LLL US, COL US, HO FP , ZC FP, MGGT LN, COB LN, TDY US, FNC IM, ESL US, MOG/A US, SAABB SS, XLS US, ULE LN, CUB US, MANT US, ATRO US; Mechanical Components - PCP US, GR US, TDG US, SNR LN, ROLL US, LMIA US, LAT FP; MRO - TGI US, HEI US, AIR US, HRX CN, MAL CN; Sundry Equipment - SIF US; Interiors - BEAV US, DCO US; Space Systems - CW US, GY US Enterprise Value calculation as of July 20XX
Mechanical Component manufactures have the highest EBITDA margin
0.0%
5.0%
10.0%
15.0%
20.0%
25.0%
30.0%
Prime Engine
Manufacturer
Electronic
Systems
Mechanical
Components
MRO Sundry
Equipment
Interiors Space Systems
EBITDA Margin
0.0x
2.0x
4.0x
6.0x
8.0x
10.0x
12.0x
Prime Engine
Manufacturer
Electronic
Systems
Mechanical
Components
MRO Sundry
Equipment
Interiors Space Systems
EV/EBITDA

TresVista Financial Services
27
Recent Deals
Precedence Transaction Comparable
Key Performance Metrics
(1) Source: Bloomberg and press Release.(2) Deals as of June 20XX.
Tier 3 dominates the deal activity with average EV/Revenue of 2.31 x
Announced Enterprise Enterprise Value /
Date Target Acquirer Value (in USD) Revenue EBITDA
5/8/2012 Composite Engineering Inc Kratos Defense & Security Solutions Inc 155.0 1.65x 9.7x
1/20/2012 AMSAFE Global Holdings Inc TransDigm Group Inc 750.0 2.88x NA
11/7/2011 Force Protection Inc General Dynamics Corp 237.9 0.41x 12.5x
8/16/2011 Vangent Holding Corp General Dynamics Corp 960.0 1.37x NA
8/5/2011 Schneller Holdings LLC TransDigm Group Inc 288.5 3.43x NA
6/29/2011 Sensis Corp Saab AB 155.0 1.19x NA
5/16/2011 Integral Systems Inc/MD Kratos Defense & Security Solutions Inc 291.2 1.47x NM
5/5/2011 Souriau Esterline Technologies Corp 589.5 2.91x NA
3/9/2011 Ansaldo Energia SpA First Reserve Corp 1,772.7 1.02x NA
2/7/2011 Herley Industries Inc Kratos Defense & Security Solutions Inc 262.2 1.36x 8.1x
1/18/2011 Pacific Scientific Aerospace Meggitt PLC 685.0 1.81x 8.7x
1/14/2011 Norkom Group PLC BAE Systems PLC 165.6 2.47x 13.8x
12/22/2010 Dalsa Corp Teledyne Technologies Inc 330.4 1.56x 8.6x
12/22/2010 ETI A/S BAE Systems PLC 210.7 3.22x NA
12/20/2010 Raytheon Applied Signal Technology Inc Raytheon Co 457.6 2.03x 15.7x
11/16/2010 Abraxas Corp Cubic Corp 124.0 2.07x NA
10/13/2010 Enterprise Integration Group Business Veritas Capital 815.0 1.30x NA
6/30/2010 Argon ST Inc Boeing Co/The 707.8 2.28x 41.0x
3/23/2010 Babcock Southern Holdings Ltd Babcock International Group PLC 2,485.4 1.31x 14.7x
3/23/2010 Vought Aircraft Industries Inc Triumph Group Inc 1,440.0 0.74x 6.2x
3/5/2010 Saab AB Investor AB 1,460.6 0.43x 3.7x
2/26/2010 ODIM ASA Rolls-Royce Holdings PLC 243.0 0.71x 6.7x
1/12/2010 Gichner Holdings Inc Kratos Defense & Security Solutions Inc 133.0 0.90x NA

6. Recent Trends
TresVista Financial Services
29
Key Trends
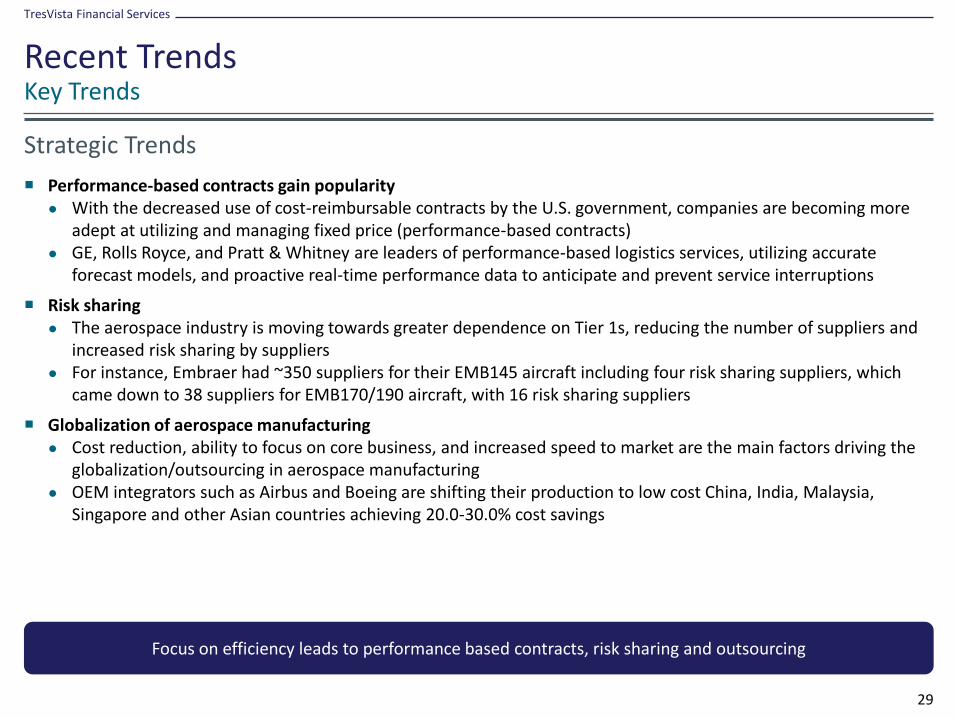
Strategic Trends
Performance-based contracts gain popularity● With the decreased use of cost-reimbursable contracts by the U.S. government, companies are becoming more
adept at utilizing and managing fixed price (performance-based contracts)● GE, Rolls Royce, and Pratt & Whitney are leaders of performance-based logistics services, utilizing accurate
forecast models, and proactive real-time performance data to anticipate and prevent service interruptions
Risk sharing● The aerospace industry is moving towards greater dependence on Tier 1s, reducing the number of suppliers and
increased risk sharing by suppliers ● For instance, Embraer had ~350 suppliers for their EMB145 aircraft including four risk sharing suppliers, which
came down to 38 suppliers for EMB170/190 aircraft, with 16 risk sharing suppliers
Globalization of aerospace manufacturing● Cost reduction, ability to focus on core business, and increased speed to market are the main factors driving the
globalization/outsourcing in aerospace manufacturing● OEM integrators such as Airbus and Boeing are shifting their production to low cost China, India, Malaysia,
Singapore and other Asian countries achieving 20.0-30.0% cost savings
Recent Trends
Focus on efficiency leads to performance based contracts, risk sharing and outsourcing
TresVista Financial Services
30
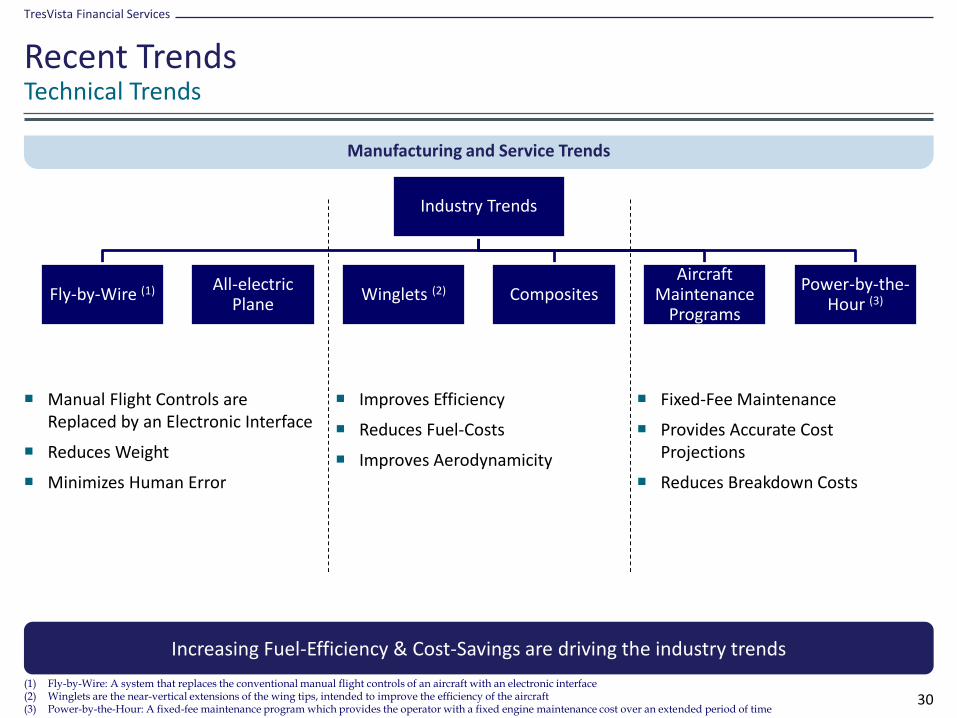
Technical Trends
Manufacturing and Service Trends
Recent Trends
(1) Fly-by-Wire: A system that replaces the conventional manual flight controls of an aircraft with an electronic interface(2) Winglets are the near-vertical extensions of the wing tips, intended to improve the efficiency of the aircraft(3) Power-by-the-Hour: A fixed-fee maintenance program which provides the operator with a fixed engine maintenance cost over an extended period of time
Increasing Fuel-Efficiency & Cost-Savings are driving the industry trends
Manual Flight Controls are Replaced by an Electronic Interface
Reduces Weight
Minimizes Human Error
Improves Efficiency
Reduces Fuel-Costs
Improves Aerodynamicity
Fixed-Fee Maintenance
Provides Accurate Cost Projections
Reduces Breakdown Costs
Industry Trends
Fly-by-Wire (1) All-electric Plane
Winglets (2) CompositesAircraft
Maintenance Programs
Power-by-the-Hour (3)

Contact Us
Locations
MumbaiPremier House, Phase 2, 2nd Floor, Plot 38, MIDC Central Road, Andheri (East), Mumbai 400 093, IndiaTel: +91 22 6156 7301 Fax: + 91 22 6156 7302
London23 Hanover Square,Mayfair,London W1S 1JBUnited Kingdom
E-mail: [email protected]
Disclaimer: This document is provided for information purposes only. The information is believed to be reliable, but TresVista does not warrant its completeness or accuracy. It should not be used, relied upon, or treated as a substitute for specific professional advice. Opinions, estimates, and assumptions constitute our judgment as of the date hereof and are subject to change without notice. This material is not intended as an offer or solicitation for the purchase or sale of any financial instrument. Additional information is available upon request. Images used in this document are for reference only and may not be reproduced, copied, transmitted or manipulated in any way.
© TresVista Financial Services 20XX