Aerosol radiative, physical, and chemical properties in...
12
JOURNAL OF GEOPHYSICAL RESEARCH, VOL. 106, NO. D16, PAGES 17,969-17,980, AUGUST 27, 2001 Aerosol radiative, physical, and chemical properties in Beijing during June 1999 M. H. Bergin, 1,2 G.R.Cass, 1,2 j. Xu, 2C.Fang, 3 L. M. Zeng, 3 T. Yu, 4 L. G.Salmon, s C.S. Kiang, • X. Y. Tang, 3 y. H. Zhang, 3 and W.L. Chameides • Abstract. Beijing experiences air pollution such that theskyoverhead is gray much of the timeeven on cloudless days. In order to understand thecause of this problem, the aerosol light scattering coefficient Cysp and absorption coefficient (Jap were measured under dry conditions (instrumental relative humidity < 40%) during a 1-week intensive field sampling period in June 1999 in Beijing, China. Additional measurements included theaerosol mass size distribution, chemical composition of the aerosol mass having particle diameters less than 2.5 •m (PM2.5) aswell asthechemical composition of thetotal suspended particulate matter. Themean (and standard deviation) forhourly averages of (jsp, (jap, and thesingle- scattering albedo to were 488 Mm -1 (370 Mm-•), 83 Mm -•(40 Mm-•), and 0.81 (0.08), respectively, which is significantly higher than values reported in urban regions of the United States. Therelatively high values of (jsp were accompanied by a daily mean value for the PM2.5 mass concentration of 136 •g m -3 (48 •g m-3), which is significantly higher than theproposed U.S. 24-hour average mean National Ambient Air Quality Standard of 65 •g -3 rn . Thevisual range during thefieldstudy, based onmeasurements of Cy•p and CYap, was typically less than6 km. For several days thatdidnothave rain or fog,there wasa clear diurnal trend in Cy•p, Cyap, and to, with peak values in the early morning and minima that occur in theevenings. Thepeaks correspond to minima in ambient temperature andmaxima in relative humidity. Mass sizedistribution measurements indicate thatalthough -80% of the aerosol mass was located in thecoarse particle mode (Dp > 1.0•m), thesubmicron aerosol wasresponsible for- 80% of thelightscattering at 530 nm. The largest contribution to the PM2.5 aerosol mass wasdueto organic compounds, whichaccounted for-30% of the mass.The contributions of sulfate, ammonium, and nitrate to the PM2.5 mass concentration were-15%, 5%, and8%, respectively. Mineral aerosol contributed-16%to thePM2.5 aerosol mass. These datashow thatcombustion-related particles rather than wind-blown dust dominated the light extinction budget during June 1999. 1. Introduction The rapid industrialization of China sincethe mid-1970s hasbeenaccompanied by significant increases in regional air pollution, including aerosol particles [Li e! al., 1995]. Aerosols influence both visibility and climate through the scattering and absorption of solar radiation [Waggoner e! at., 1981; Chartson e! at., 1992; Schwartz, 1996]. It is also believed that aerosols influencecrop production due to the attenuation of solar radiation [Chameides e! at., 1999]. The key parameter needed to estimate the influence of aerosols on •School of Earth and Atmospheric Sciences, Georgia Institute of Technology, Atlanta,GA. 2School of Civil and Environmental Engineering, Georgia Institute of Technology, Atlanta,GA. 3State Key Laboratory of Environmental Simulation and Pollution Control, Center for EnvironmentalSciences,Peking University, Beiiing, China. Beijing Environmental Protection Bureau, Beijing, China 5Environmental Engineering and Science Department, California Institute of Technology, Pasadena, CA. Copyright 2001by theAmerican Geophysical Union Paper number 2001 JD900073. 0148-0227/01/2001 JD900073 $09.00 visibility istheaerosol lightextinction coefficient C•ep which is the sum of the aerosol light scattering coefficient C•sp and absorption coefficient C•,p. Thedirect influence of aerosols on climate due to attenuation of light and hencereduced surface irradiance under clear-sky conditions dependson several factors, one of which is the aerosol single-scattering albedo co which is theratioof C•sp to C•ep. At thistime it is difficult to estimate the influence of aerosols on both visibility and the radiation balance of the Earth in this regionof the world due to the lack of information on aerosol properties in general and light extinction properties in particular. A recentstudyof temperature trends in China foundthat a broad region extendingfrom the Sichuanprovince to the Yangtze delta region has cooled by - 0.2 - 0.4 øCoverthe past 25 years [Li e! al., 1995]. The cooling trend begins with the start of the industrialization of China in the mid-1970s. Li e! at. [1995] attribute the cooling trendto an increase in the attenuationof solar radiation by anthropogenic aerosols, which are believed to have significantly increased over this time period. Implicit in this attribution is the assumption that changes in wind-blown dust donot contribute to the observed cooling trend. Wind-blown dust can be an important source of aerosol overChina [Gao e! at., 1997], andthe possibility that dustis in part responsible for the observed trend cannot be ruled out. 17,969
Transcript of Aerosol radiative, physical, and chemical properties in...

JOURNAL OF GEOPHYSICAL RESEARCH, VOL. 106, NO. D16, PAGES 17,969-17,980, AUGUST 27, 2001
Aerosol radiative, physical, and chemical properties
in Beijing during June 1999
M. H. Bergin, 1,2 G. R. Cass, 1,2 j. Xu, 2 C. Fang, 3 L. M. Zeng, 3 T. Yu, 4 L. G. Salmon, s C. S. Kiang, • X. Y. Tang, 3 y. H. Zhang, 3 and W. L. Chameides •
Abstract. Beijing experiences air pollution such that the sky overhead is gray much of the time even on cloudless days. In order to understand the cause of this problem, the aerosol light scattering coefficient Cysp and absorption coefficient (Jap were measured under dry conditions (instrumental relative humidity < 40%) during a 1-week intensive field sampling period in June 1999 in Beijing, China. Additional measurements included the aerosol mass size distribution, chemical composition of the aerosol mass having particle diameters less than 2.5 •m (PM2.5) as well as the chemical composition of the total suspended particulate matter. The mean (and standard deviation) for hourly averages of (jsp, (jap, and the single- scattering albedo to were 488 Mm -1 (370 Mm-•), 83 Mm -• (40 Mm-•), and 0.81 (0.08), respectively, which is significantly higher than values reported in urban regions of the United States. The relatively high values of (jsp were accompanied by a daily mean value for the PM2.5 mass concentration of 136 •g m -3 (48 •g m-3), which is significantly higher than the proposed U.S. 24-hour average mean National Ambient Air Quality Standard of 65 •g
-3
rn . The visual range during the field study, based on measurements of Cy•p and CYap, was typically less than 6 km. For several days that did not have rain or fog, there was a clear diurnal trend in Cy•p, Cyap, and to, with peak values in the early morning and minima that occur in the evenings. The peaks correspond to minima in ambient temperature and maxima in relative humidity. Mass size distribution measurements indicate that although -80% of the aerosol mass was located in the coarse particle mode (Dp > 1.0 •m), the submicron aerosol was responsible for- 80% of the light scattering at 530 nm. The largest contribution to the PM2.5 aerosol mass was due to organic compounds, which accounted for-30% of the mass. The contributions of sulfate, ammonium, and nitrate to the PM2.5 mass concentration were-15%, 5%, and 8%, respectively. Mineral aerosol contributed-16% to the PM2.5 aerosol mass. These data show that combustion-related particles rather than wind-blown dust dominated the light extinction budget during June 1999.
1. Introduction
The rapid industrialization of China since the mid-1970s has been accompanied by significant increases in regional air pollution, including aerosol particles [Li e! al., 1995]. Aerosols influence both visibility and climate through the scattering and absorption of solar radiation [Waggoner e! at., 1981; Chartson e! at., 1992; Schwartz, 1996]. It is also believed that aerosols influence crop production due to the attenuation of solar radiation [Chameides e! at., 1999]. The key parameter needed to estimate the influence of aerosols on
•School of Earth and Atmospheric Sciences, Georgia Institute of Technology, Atlanta, GA.
2School of Civil and Environmental Engineering, Georgia Institute of Technology, Atlanta, GA.
3State Key Laboratory of Environmental Simulation and Pollution Control, Center for Environmental Sciences, Peking University,
Beiiing, China. Beijing Environmental Protection Bureau, Beijing, China
5Environmental Engineering and Science Department, California Institute of Technology, Pasadena, CA.
Copyright 2001 by the American Geophysical Union
Paper number 2001 JD900073. 0148-0227/01/2001 JD900073 $09.00
visibility is the aerosol light extinction coefficient C•ep which is the sum of the aerosol light scattering coefficient C•sp and absorption coefficient C•,p. The direct influence of aerosols on climate due to attenuation of light and hence reduced surface irradiance under clear-sky conditions depends on several factors, one of which is the aerosol single-scattering albedo co which is the ratio of C•sp to C•ep. At this time it is difficult to estimate the influence of aerosols on both visibility and the radiation balance of the Earth in this region of the world due to the lack of information on aerosol properties in general and light extinction properties in particular.
A recent study of temperature trends in China found that a broad region extending from the Sichuan province to the Yangtze delta region has cooled by - 0.2 - 0.4 øC over the past 25 years [Li e! al., 1995]. The cooling trend begins with the start of the industrialization of China in the mid-1970s. Li
e! at. [1995] attribute the cooling trend to an increase in the attenuation of solar radiation by anthropogenic aerosols, which are believed to have significantly increased over this time period. Implicit in this attribution is the assumption that changes in wind-blown dust do not contribute to the observed cooling trend. Wind-blown dust can be an important source of aerosol over China [Gao e! at., 1997], and the possibility that dust is in part responsible for the observed trend cannot be ruled out.
17,969
17,970 BERGIN ET AL.' AEROSOL PROPERTIES IN BEIJING
Although there are few studies, to our knowledge, that have reported aerosol light extinction properties in China, several studies indicate extremely high aerosol mass concentrations in urban regions. Hashimoto et al. [1994] report annual mean total suspended particulate (TSP) concentrations in several major cities of-•300 gg m -3. This value is roughly 6 times greater than the current annual average U.S. National Ambient Air Quality Standard (NAAQS) for particles having diameters less than 10 gm (PM10) of 50 gg m -3. Over a several week wintertime intensive sampling period in Wuhan, an industrialized city in central China, Waldman et al. [1991] found daily mean concentrations of particulate matter having diameters less than 2.5 gm (PM2.5) ranging from-•50 to 210 gg m -3. These values are also generally higher than the proposed U.S. 24- hour average NAAQS for PM2.5 of 65 gg m -3. Salmon et al. [1994] made measurements at the Yungang Grottoes near Datong in Shanxi province and found annual mean concentrations for total suspended particulate matter as well as for PM2.1 of 378 and 130 •tg m -3 respectively. In a recent study in four urban areas of China, Wei et al. [ 1999] measured mass concentrations of PM10 and PM2.5 and found annual
means ranging from 115 to 257 •tg m -3 and from 76 to 160 •tg -3
m , respectively. Since there is a strong relationship between PM2.5 mass concentration and (jee [Waggoner et al., 1981], these measurements also suggest relatively high values of (jee. Waldman et al. [1991] conducted analyses of ionic compounds and trace metals and found that during the winter in Wuhan, sulfate was responsible for a significant fraction (10-15%) of the identifiable PM2.5 aerosol mass. Roughly 50% of the PM2.5 mass was not identified in terms of specific chemical composition, and Waldman et al. [ 1991 ] suggest that organic compounds might account for the remaining mass. Salmon et al. [1994] did measure organic carbon concentrations and found that organic compounds dominated the fine particulate mass near Datong. Overall, previous measurements in urban areas of China show values high enough to play an important role in visibility reduction and climate modification.
In this paper we present continuous measurements of the aerosol light scattering coefficient (j•p and absorption coefficient (jap made in Beijing during a 1-week period in June 1999. We also present aerosol mass size distributions, as well as the chemical composition of PM2.5 and total aerosol mass. Also shown are meteorological parameters that influence (j•p and (Jap which include wind speed, direction, and ambient temperature and relative humidity (RH). In addition, we present measurements of 03, NO2, SO2, HNO3, and NH3 and discuss the possible link between these measurements and (jsp'
2. Experimental Methods
2.1. Meteorological Measurements
The field measurements began at 22:00 LT on June 10, 1999, and continued until 11:00 on June 16, 1999. Temperature (T), relative humidity (RH), wind speed, and wind direction were continuously measured at the Beijing Olympic Center Air Monitoring Station, roughly 6 km away from Peking University. The station is maintained by the Beijing Environmental Municipal Protection Bureau (EPB). The measurements presented in this paper represent hourly averages of the above quantities.
2.2. Aerosol Measurements
Aerosol measurements were made at Peking University located in the northwest section of the city. The university is unique in that traffic is for the most part prohibited on campus and therefore the measurements do not include short-term
peaks from very nearby mobile sources, but instead reflect the broad average conditions over northwest Beijing. Aerosol light scattering and absorption coefficient measurements were made from the third floor of the Old Geosciences building. In addition, mass size distribution, fine particle (PM2.5; particulate matter having a diameter < 2.5 gm) and total suspended particulate mass and chemical composition measurements were made on the third floor roof of the
Guanghua Business Administration Institute building located roughly 100 m from the Old Geosciences building. A Radiance Research nephelometer was used to measure the light scattering coefficient at a wavelength of 530 nm. Air was drawn through 3 m of 0.5" ID low-density polyethylene (LDPE) tubing at a flow rate of 6 L min -•. The RH within the nephelometer had a mean value of 38% with a standard deviation of 10%. The RH within the nephelometer was less than ambient since the instrument was located in a room that
was significantly warmer than the outside atmosphere. The instrument was calibrated prior to the field experiment using clean (particle-free) air as well as HFC-134a for the span gas. Several times during the field experiment a HEPA capsule filter was placed upstream of the nephelometer to insure that the instrument was working properly. In all cases the scattering coefficient for filtered air was between 0 and 1 Mm -•. The aerosol light absorption coefficient (jap was measured at a wavelength of 565 nm using a Radiance Research Particle Soot Absorption Photometer (PSAP). Air was sampled through 0.25" ID, 3-m-long LDPE tubing. The absorption coefficient was corrected for both light scattering and instrument overestimation as described by Bond et al. [ 1999]. Aerosol mass size distributions were measured using a Micro-Orifice Uniform Deposit Impactor (MOUDI) as described by Marple et al. [1991]. Samples were taken for several (n=5) -24-hour periods during the field study. MOUDI samples were collected on preweighed perchlorinated polyvinyl chloride impaction substrates manufactured in China. The mass of the substrates was
determined before and after sampling at Peking University using a Mettier-Toledo AG balance. Samples were conditioned in a clean room at an RH of 65+/-5% for several
days prior to being weighed. The upper size limit for the MOUDI mass size distribution measurements is -10 gm, which corresponds to the cut point of the first collection stage.
The filter-based ambient particle samplers used have been described previously [Salmon et al., 1994]. In brief, the ambient samplers measured airborne particle concentrations and chemical composition in two size ranges: fine particles (Dp < 2.5 •tm) and total suspended particles (TSP; no size discrimination). The fine particle size cut was achieved using a cyclone separator to remove coarse particles [John and Reischl, 1980]. In each particle size range, samples were taken in parallel on three 47 mm diameter filter substrates: one prebaked quartz fiber filter (Pallflex 2500 QAO) and two polytetrafluoroethylene (PTFE) membrane filters (Gelman Teflo, 2-gm pore size). In addition, backup filters were located following Teflon filters on the TSP sampling line for determination of gas phase HNO3 and NH3 concentrations. HNO3 samples were collected on nylon filters (Gelman

BERGIN ET AL.' AEROSOL PROPERTIES IN BEIJING 17,971
lOO
90
80
70
o--*. 60-
n,' 50
•, 40
• west (w)
o NW
o ._
-• North (N)
-• NE
- - o - RH - T
i
(,"ai
9 • i_• 6 ' •" o , o ,'
,. 30 " ""'
10 ! • ,,d• ' , ,
0 161 162 163 164 165 166 167
June 10 Julian Date (1999)
South(S) ' i ' ' ' , i ' ', ' i I " ', ',
' -• Wind Dir.
SW ' • •• • Wind 8p. -
- i o: ,i
East (E) 2
SE 1
' ' I ',
South (S) i•ii•, i I/i i,, i l, i i•ilitll, 0 161 162 163 164 165 166 167 168
June J0 Julian Date (1999) June 17
Figure 1. (a) Ambient temperature T and relative humidity (•) and (b) wind direction and wind speed in Beijing during the field study.
Dionex model 2020i ion chromatograph. The PTFE and oxalic acid impregnated filter extracts were also analyzed for particulate and gas phase ammonium ion (NH4 +) by an indophenol colorimetric procedure employing a rapid flow analyzer (RFA-300 TM, Alpkem Corp.). Organic carbon and elemental carbon concentrations of the aerosol samples were determined from quartz fiber filters by the thermal-optical method of Birch and Car), [ 1996]. Prior to sample collection these filters were heat treated at 550 øC in air for at least 8 hours to lower their carbon blank levels.
Aerosol sampling was also conducted at the Beijing Olympic Center Air Monitoring Station. A Tapered Element Oscillating Microbalance (TEOM) model 1400a manufactured by Rupprecht and Patashnick was used to measure the mass concentration of particulate matter having a diameter < 10 gm (PM10). The TEOM was operated at 50 øC.
Nylasorb), while NH3 samples were collected on oxalic acid impregnated Gelman AE glass fiber filters as described by Salmon et al. [1994]. One Teflon filter of each pair was used for mass plus ionic species determination by ion chromatography. The second Teflon filter of each pair was used for the analysis of mass and trace elements by X-ray fluorescence (XRF). Gravimetric measurements were made on PTFE filters using a mechanical microgram balance (Model M-SS-A, Mettler Instruments). Unexposed and collected PTFE filters were equilibrated at 22 +/- 1 øC and 40 +/- 3 % relative humidity for at least 24 hours prior to weighing each filter. Concentrations of the major water- soluble particulate species (SO4 2-, NO3-, and C1-) as well as gas phase NO3- from the nylon filters were determined using a
2.3. Gas Phase Measurements
In addition to the measurements of NH3 and HNO3 described previously, continuous measurements of O3 and
168 NO2 were also made at the Olympic Center station maintained June 17 by the Beijing EPB. The instruments used for the
measurement of NO2 and O3 were Thermo-Electron models 8 42 and 49. The NO2 instrument uses a catalytic surface to
reduce NO2 to NO, which is then measured by chemiluminescence. The catalytic process can convert additional reactive nitrogen oxides to NO [Fehsenfeld et al., 1987], and therefore the NO2 values presented in this paper 6
must be viewed as upper limit estimates. The instruments are
5'r, calibrated daily by personnel from the Beijing EPB. E Measurements of 03 were also made from the third floor of • the Old Geosciences building at Peking University using a
4 • Thermo-Electron model 49C UV photometric ozone monitor. m The instrument was calibrated prior to and following the
3 .c_ week-long measurement period. In addition, measurements of 3 SO: were made at Peking University using a Thermo-Electron
model 43C pulsed fluorescence sulfur dioxide analyzer, which was calibrated both before and after the field experiment. The gas phase measurements of 03, NO2, and SO2 presented in this paper represent hourly averaged 5-minute data, while the NH3 and HNO3 concentrations measured by the filter-based samplers are 24-hour average values.
3. Theory
The mass size distributions measured by the MOUDI are used to estimate the light scattering coefficient for each impactor stage C•sp,/. The light scattering coefficient C•sp at a given wavelength X can be estimated from impactor mass size distribution measurements as
m m
O'sp = Z CYsp,i = Z Escat,i Mi , i=l i=l
(1)
where i is the number of the particular impactor stage, Escat, i is the mass scattering efficiency of particles having diameters equivalent to the log-mean diameter of the particles collected on the specific impactor stage, and M•. is the mass concentration measured from the particular impactor stage. The mass scattering efficiency for particles collected on a particular impactor stage is estimated as follows:
Esca,,i =•3 Qsca,iCp,i,F[), (2) 2 lO pDp,i
17,972 BERGIN ET AL.' AEROSOL PROPERTIES IN BEIJING
600 i ':, .•,•i•'•ii !: 'i,i :: ! 0.6
I I I "I I I I I I" "I t" a I" t" I I"
161 162 163 164 165 166 167 168
June 10 Julian Date (1999) June 17 Figure 2. Aerosol light scattering coefficient %p (530 nm), absorption coefficient c•,p (565 nm), and single-scattering albedo, c0, measured at low RH (RH -40%).
where De, i is the log-mean midpoint diameter of particles collected on impactor stage i, pp the particle density, and Qsc,,i is the Mie scattering efficiency which depends on both Dp, i and the refractive index ri. It is worthwhile to point out that the De.i value used for the estimation of c•,p is the Stokes diameter (defined as the diameter of the sphere having the same density and settling velocity as the particle of interest) which is estimated here from the impactor cut points under the assumption that the aerosol has a density similar to that of ammonium sulfate (1.7 g cm-3). Based on this assumption, the Stokes diameter is estimated for each stage by multiplying the impactor log-mean midpoint aerodynamic diameter by 0.77. For estimation of c•,e we assume ape of 1.7 and ri of 1.52 and estimate Q,c,,• using the method of Bohren and Huffman [1983] as described by Bergin et al. [1997].
4. Results
4.1. Meteorological Measurements Figures la and lb depict the meteorological conditions
prior to and during the field study period. The weather -• 300 conditions during the field sampling period were typically clear to partly cloudy. Precipitation occurred from---06:00 to -14:00 LT on June 14 (day 165). This period of rain was a. 200 followed by fog which lasted until ---06:00 on June 15. The relative humidity during the rain and fog events was -100% , as shown in Figure l a. Daytime maxima in temperature 100 ranged from 28 to 36 øC and typically occurred at -16:00. The daily minimum temperatures typically occurred at -05:00 in the morning and ranged from 22 to 24 øC. With the exception of the rain and fog periods, the RH ranged from -20% during the late afternoon temperature maxima to -60% during the early morning temperature minima.
Figure lb shows the wind speed and direction during the field study. Prior to the rain event, wind directions from the late afternoon (-18:00) until the early morning (---06:00) were
from the west to southwest. For the late mornings and early afternoons the wind was typically from the northeast to northwest. The wind speed ranged from 0.5 to 5 m s -• during our study. There is not a clear relationship between Oep and the wind speed and wind direction during the measurement period, which suggests that aerosols were distributed throughout the region in a fairly uniform fashion.
4.2. Aerosol Measurements
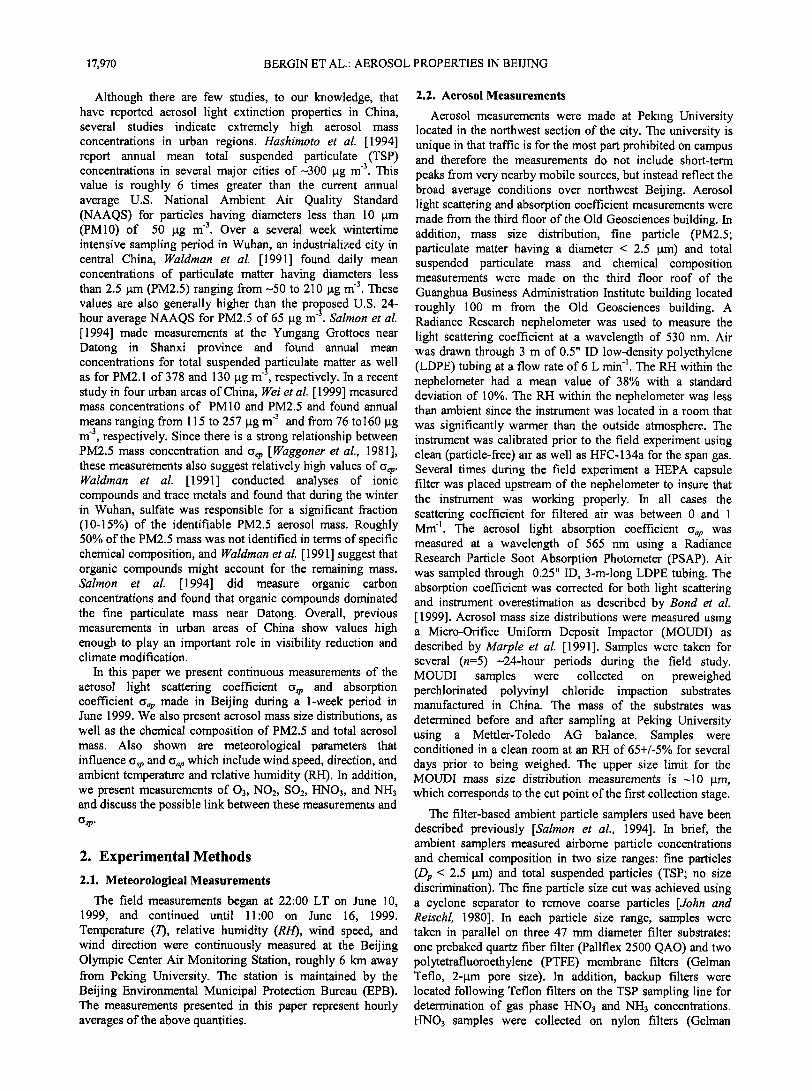
The aerosol light scattering coefficient O•p light absorption coefficient O•p and single-scattering albedo c0 are shown in Figure 2. The mean (and standard deviation) for Osp, O.,p, and c0 for the entire field study are 488 Mm -• (370 Mm-•), 83 Mm -• (40 Mm-•), and 0.81 (0.08), respectively. Prior to and after the rain/fog event all of these aerosol properties exhibit a characteristic diurnal cycle. Minimum values for both O•p and Oap Occur in the evening (i.e., between 18:00 and 00:00). With the exception of the period immediately following the rain/fog event, the minimum values of O•p typically range from 100 to 200 Mm -•, while for O•p the minimum values are from 30 to 50 Mm -•. After reaching minimum values overnight, the scattering and absorption coefficients begin to rise, typically reaching peak values sometime in the morning between -06:00 and 12:00. Not including the rain/fog event, the peak O•p values range from 400 to 900 Mm -• and the peak values of • lie in the range 100- 200 Mm -•. The single-scattering albedo also shows a weak diurnal dependence with values tending to be highest (0.8-0.9) during the morning peaks in O•p, and lowest (0.7-0.8) at the times of the minimum values in Osp. The mean (and standard deviation) for the PM10 mass concentration measured by the TEOM, shown in Figure 3, are 210 I. tg m -3 (106 I. tg m-3). The PM 10 mass concentration also shows a diurnal trend similar to O•p and •,• with the highest concentrations in the morning and lowest concentrations in the early evening, with the exception that for the days prior to
, ,,,,, •I-Pa-FH, ! ,,' 18.0 600 I • • • I • • , • .... ! ' '
I --I- Escat lO i ! "i [li : ,, ,, ,, 'i'ii '
:,,,, 400 :: ' O. 12.0
' "•5 • I• :::: 'i•K•
, i , , , , , , .... , , , , ,
0 ......... 0.0
EJ•ure •. •]0 •s co•c•at•o• fro•
BERGIN ET AL.: AEROSOL PROPERTIES IN BEIJING 17,973
5OO
400
• 300
ß
o
• 200 '-•._
loo
o
o.1
6oo
500 -
400-
300-
200-
i i i i i i i , ! ,
Sample 1 --- Sample2 --- Sample 3 --- Sample4 ....... Sample 5
, i i , i , !
r' '--'
100- - - __ ._•..
!n.•.•.n•: .... ß - - . 0 ß , ß ,,,! ß , , 2 • 456 • • 456
0.1 1 10
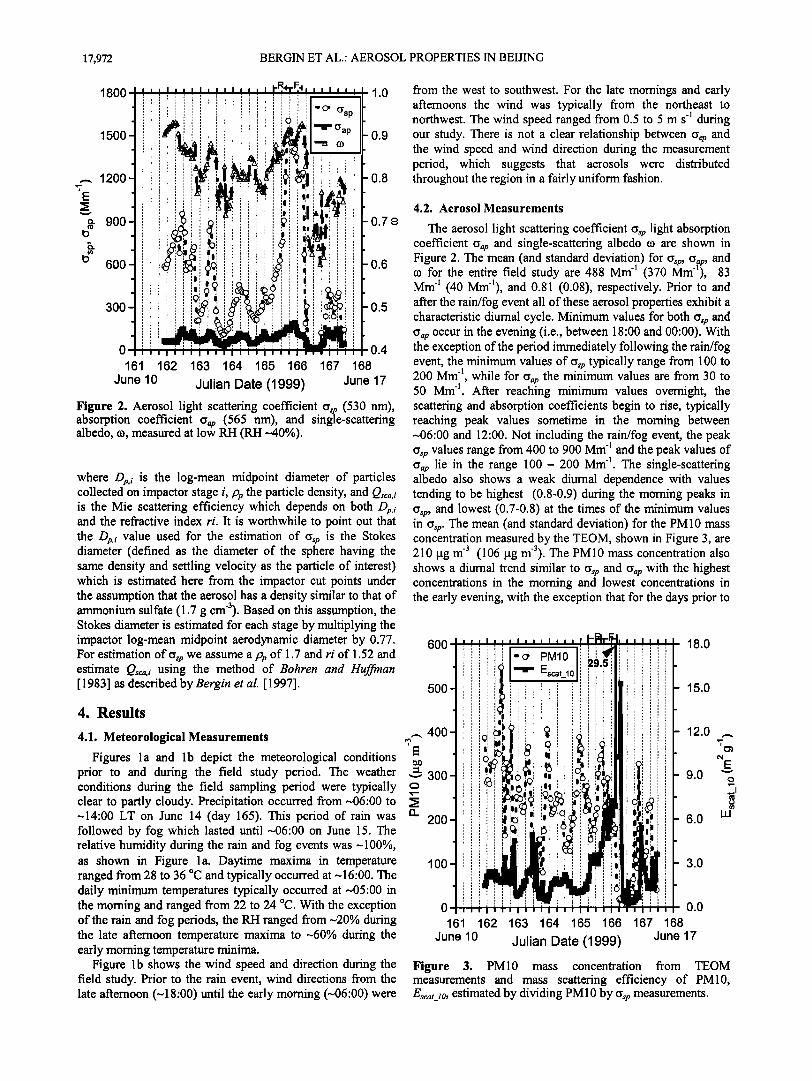
Aerodynamic Diameter, Dp (pm) Figure 4. (a) Aerosol mass size distributions from MOUDI measurements collected at ambient RH (collection substrates conditioned at 65% RH) and (b) aerosol light scattering coefficient (530 nm) distributions estimated from MOUDI samples.
2 3 4 567 2 3 4 567
1 10
Aerodynamic Diameter, Dp (pm)
(b) Sample 1
--- Sample2 --- Sample 3 --- Sample4 ....... Sample 5
concentration is not significantly higher during the rain/fog event than for other days.
The sample time intervals for the MOUDI mass size distribution measurements and other related measurements are
given in Table 1. The PM10 mass concentrations estimated from TEOM measurements made at the Olympic Center Meteorological Station integrated over the MOUDI sampling times are typically within 20% of MOUDI PM10 measurements made at Beijing University. Figure 4a shows
the airborne particle mass size distribution functions as measured by the impactor MOUDI. The mass size distributions are, in general, bimodal with modes centered at aerodynamic diameters of-0.8 and 8 pm. As seen in Figure 4a, the majority of the aerosol mass is in the coarse (Dp > 1.0 pm) mode. The fraction of the PM10 mass found in the submicron (Dp < 1.0 pm) range varies from 16% to 30%, with a mean and standard deviation of 23% and 6%, respectively. The light scattering coefficient (•sp (at 530 nm) as a function of particle size is estimated using (1). The light scattering distribution function A (•s½,,//A log De, as a function of particle size is presented in Figure 4b. The peak in the aerosol light scattering distribution occurs at an aerodynamic diameter of- 0.8 pm. The fraction of the estimated aerosol light scattering coefficient that is due to submicron aerosols ranges from 68% to 82%, with a mean and standard deviation of 75% +/- 5%. Therefore the majority of the light scattering at 530 nm is due to submicron particles, even though they contribute only 23% of the particle mass concentration measured by the impactor.
Table 1 also compares (•sp values estimated from the impactor samples by integrating (1) over the entire mass size distribution with (•s/, measured with the nephelometer averaged over the impactor sampling time periods. Mass size distribution measurements were not made during the rain event on June 14. With the exception of the sample obtained during the fog event (June 14, 20'15 to June 15, 20:30), (•p values calculated from MOUDI data are within -10% of
measured values. During the fog event, (•p estimated from the impactor measurements is roughly a factor of 2 lower than the nephelometer measurement. There are several possible reasons for this. If an increase in the semivolatile aerosol
components during the fog event occurred, then an underestimation of aerosol mass could result due to impactor sampling artifacts. Another possible explanation is that the nephelometer is not completely drying the aerosol, and therefore a significant amount of the measured light scattering is due to condensed water. As shown in Figure 3, the light scattering coefficient per unit PM10 mass concentration, E•cat/o, is as high as - 30 m 2 g-1 during the fog event. This
_
number is significantly higher than the theoretical estimate of the maximum mass scattering efficiency at 530 nm of -7 m 2
-1
g (under the assumption of spherical particles and a refractive index of 1.52). One possible explanation for the fourfold difference in theoretical versus measured Escat values is that semivolatile aerosol components evaporated in the heated (50 øC) TEOM during the rain/fog event to a greater extent than in the nephelometer, resulting in the overestimation of E•c,t. It has been previously observed that semi-volatile aerosol species can evaporate within the TEOM, resulting in the underestimation of the actual ambient mass concentration [Ayers e! al., 1999]. This unintended defect in the TEOM actually has the beneficial side effect of turning the TEOM into a detector for semivolatile aerosol
the rain event an additional peak in the PM10 mass concentration typically occurs in the late evening.
During the rain event, beginning at-06:00 on June 14, (•sp and (•,p continue to rise throughout the day. During the fog event following the rain event both (•p and (•p exhibit the highest values measured during the field study of 1500 and 200 Mm -•, respectively. As the fog dissipated in the early morning of June 15, (•p and (•p decrease to 14 and 6 Mm -•, which are the lowest values measured for these parameters during the field experiment. The peak in the PM10 mass
"1

!7,974 BERGIN ET AL.: AEROSOL PROPERTIES IN BEIJING
o
o
o
o
o
BERGIN ET AL.: AEROSOL PROPERTIES IN BEIJING 17,975
800
•, 700
ß 600
• $oo
'•400
ß • 300
= 200
ff• 100
(a) [] Nitrate
•:D Sulfate
[] Unidentified [] Chloride
[] Organics
...................... ß EC
,,,• [] Trace Metal .................... [] Mineral
: ', 1 ', 1 ', ', ', ', :
::::::::: :::::::::: ':::::::::'
6/11, 08:30 - 6/12, 13:00 - 6/13, 10:00 - 6/14, 10:40 - 6/15, 10:50 - 6/12, 12:30 6/13, 09:00 6/14, 07:00 6/15, 10:00 6/16, 10:20
200
• 100
(b) [] Nitrate .111•!11::?i!i!•i•i•iiiii•i•:;i:i:i•i::•:: :12] Sulfate
::::::::::, iiiiiiiiii .....
................... ....................
...........................................
180
160
•4o
120
80
60
40
20
0
6/11, 08:30 - 6/12, 13:00 - 6/13, 10:00 - 6/14, 10:40 - 6/15, 10:50 - 6/12, 12:30 6/13, 09:00 6114, 07:00 6/15, 10:00 6/16, 10:20
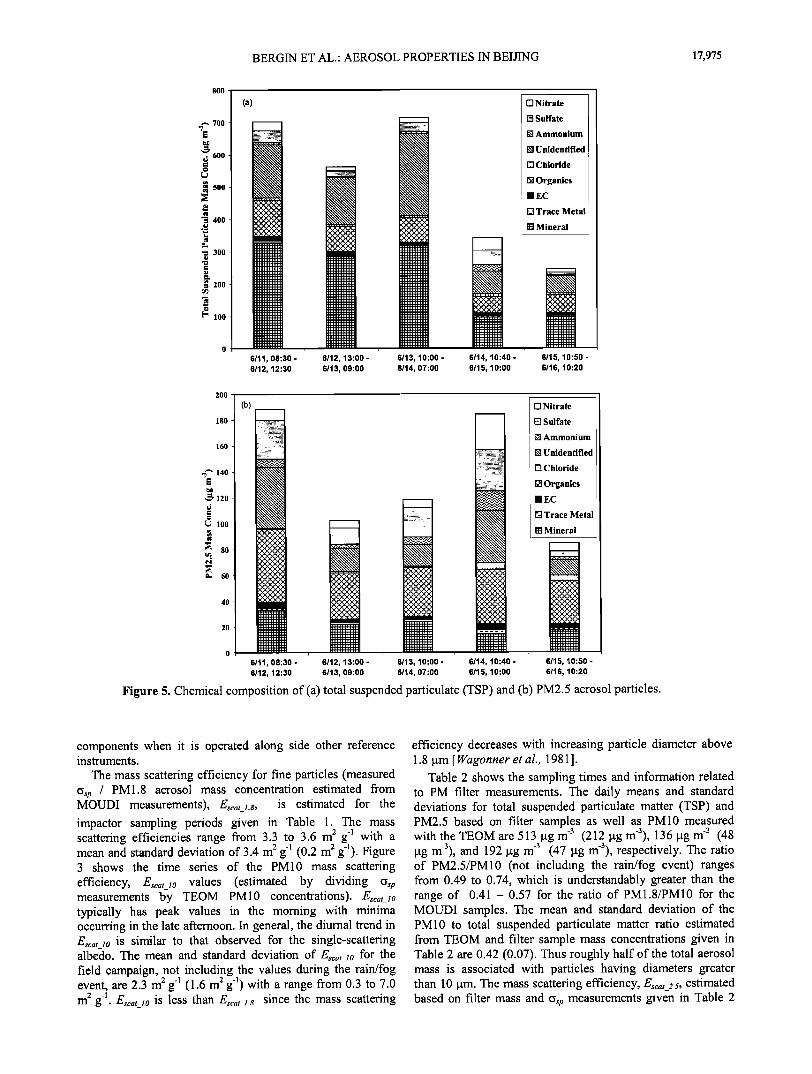
Figure 5. Chemical composition of (a) total suspended particulate (TSP) and (b) PM2.5 aerosol particles.
components when it is operated along side other reference instruments.
The mass scattering efficiency for fine particles (measured O•p / PM1.8 aerosol mass concentration estimated from MOUDI measurements), gscat 1.8, is estimated for the
_
impactor sampling periods given in Table 1. The mass scattering efficiencies range from 3.3 to 3.6 m 2 g-• with a mean and standard deviation of 3.4 m 2 g-• (0.2 m 2 g-•). Figure 3 shows the time series of the PM10 mass scattering efficiency, Escat lO values (estimated by dividing C•sp
_
measurements by TEOM PM10 concentrations). E•cat_1o typically has peak values in the morning with minima occurring in the late afternoon. In general, the diurnal trend in Escat lO is similar to that observed for the single-scattering albedo. The mean and standard deviation of Escat lO for the
_
field campaign, not including the values during the rain/fog event, are 2.3 m 2 g-1 (1.6 m 2 g-•) with a range from 0.3 to 7.0 m 2 g-1. Esca t lO is less than E•cat_l.8 since the mass scattering
_
efficiency decreases with increasing particle diameter above 1.8 gm[ Wagonner et al., 1981 ].
Table 2 shows the sampling times and information related to PM filter measurements. The daily means and standard deviations for total suspended particulate matter (TSP) and PM2.5 based on filter samples as well as PM10 measured with the TEOM are 513 gg m -3 (212 gg m-3), 136 gg m -3 (48 gg m-3), and 192 gg m -3 (47 gg m-3), respectively. The ratio of PM2.5/PM10 (not including the rain/fog event) ranges from 0.49 to 0.74, which is understandably greater than the range of 0.41 - 0.57 for the ratio of PM1.8/PM10 for the MOUDI samples. The mean and standard deviation of the PM10 to total suspended particulate matter ratio estimated from TEOM and filter sample mass concentrations given in Table 2 are 0.42 (0.07). Thus roughly half of the total aerosol mass is associated with particles having diameters greater than 10 gm. The mass scattering efficiency, Escat 2.5, estimated
_
based on filter mass and O•p measurements given in Table 2

17,976 BERGIN ET AL.' AEROSOL PROPERTIES IN BEIJING
140 ' '
130
120
110
100- -
90 .
80 -
70 ß
60 -
50 '
40 ß
30 ß
20 ß
lO ß
0 •i
161 June 10
' ' i
' !' i -"- øa (Olympic Cen.) .-•.. NO 2 (Olympic Cen.) p -•- SO 2 (Beijing Univ.)
: 1': i ! : : : : :
162 163 164 165 166 167 168
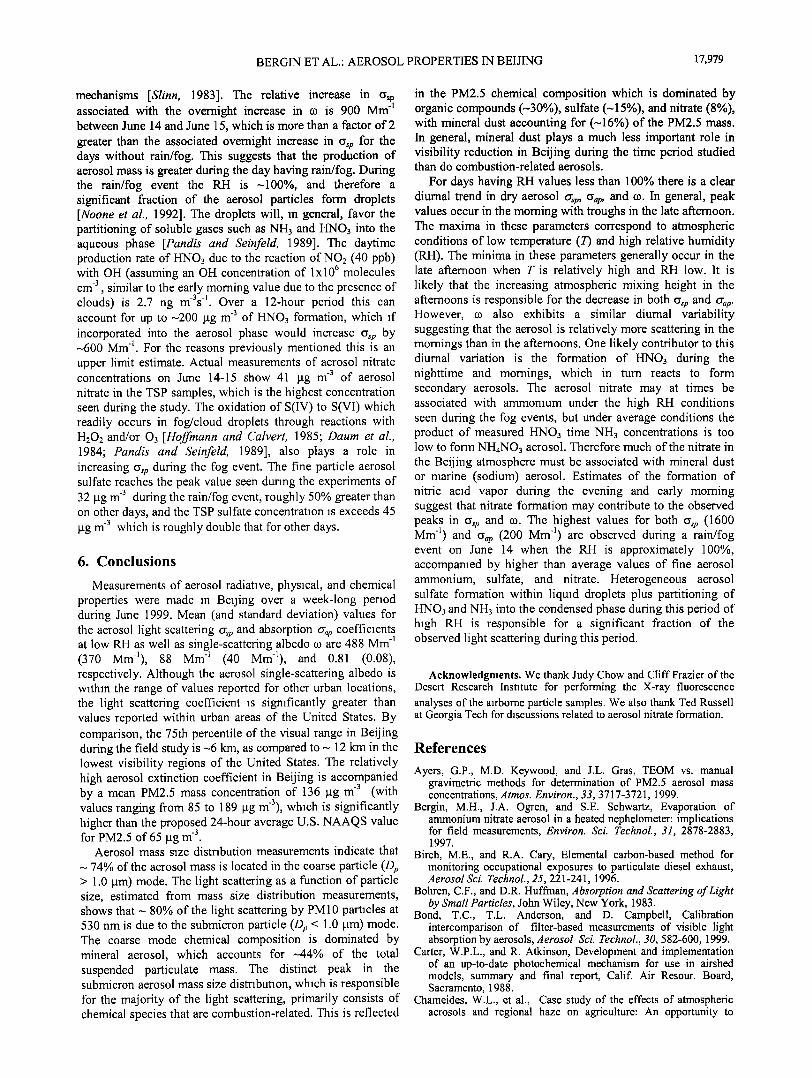
Julian Date (1999) June 17 Figure 6. O3, NO2, and SO2 concentrations in Beijing.
(not including the rain/fog period) has a mean and standard deviation of 2.6 m 2 g-] (0.3 m 2 g-J). The mean value is roughly 25% lower than E•c,t ].s estimated from MOUDI
_
measurements, which is likely due to the additional particle mass present in the 1.8-2.5 pm particle diameter range that does not efficiently scatter light.
Figures 5a and 5b show the PM2.5 and total PM aerosol chemical composition for the filter samples. Organic compounds contribute the largest identified portion of the PM2.5 mass concentration, accounting for-30% of the fine aerosol mass. The ions sulfate, ammonium, and nitrate combined are responsible for- 28% of the PM2.5 mass. The ratio of the PM2.5 organic carbon to elemental carbon mass is unusually high having a mean and standard deviation of 11.6 (1.3). This is not because there is so little elemental carbon in the Beijing atmosphere but rather because the concentration of organic carbon particles are unusually high with respect to elemental carbon. Mineral aerosol, estimated by converting the crustal elements measured by XRF to the mass of their common oxides, contributes-16% to the PM2.5 fraction. The total aerosol mass is dominated by mineral dust, which accounts for -44% of the mass. During the rain/fog period (event 4) the majority of the aerosol mass based on filter measurements is present in the fine particulate fraction (-54%), and the relative contributions of ammonium and nitrate to the total mass have maximum values observed
during the field campaign of 6% and 12%, respectively. For all filter samples there is a residual fraction of the PM2.5 mass that is not identified chemically (-20%).
4.:3. Gas Phase Measurements
Figure 6 shows measurements of 03 and NO2 made at the Beijing Olympic Center as well as 03 and SO2 made at Peking University. As previously discussed, the NO2 measurements represent an upper limit due to the measurement technique that is used. Ozone measurements from both locations
typically agree to within -10%. Not including the rainy day, 03 concentrations show a diurnal trend with maximum values
of 85 - 100 ppb in the afternoon. There are typically two nighttime 03 minima. The first occurs at 21:00, while the second takes place in the early morning at 06:00. The 03 concentrations during the first and second minima range from 28 to 35 ppb and from 22 to 25 ppb, respectively. For the period prior to the rain event, NO2 displays two daily peaks. The NO2 maxima occur in the early morning between - 00:00 and 03:00 and in the afternoon from-12:00 and 18:00.
The afternoon peak values range from- 40 to 60 ppb, while the early morning peak values range from 20 to 50 ppb. The minimum NO2 concentrations each day are - 10 ppb. The SO2 concentrations have two daily peaks that occur in the early morning at -08:00 and in the evening at -21:00. The peak concentrations range from 10 to 15 ppb, with minimum reported concentrations below 1 ppb.
Within several hours of the beginning of the rain event on June 14 the 03 concentration falls to below 10 ppb, which is significantly lower than the minimum values of 22 - 35 ppb observed on previous days. The peak 03 concentration during the rain event is 30 ppb, which is the lowest daily maximum value observed during the measurement period. The NO2 concentration builds up during the evening of June 14 and maintains relatively high concentrations (> 40 ppb) during the entire day. During the fog, which occurred through the evening and into the following morning, the ozone and NO2 concentrations remained relatively low at values of-10 - 20 ppb. During the day following the fog event, the NO2 concentrations are roughly constant at 30 -40 ppb as is similar to the case during the previous day. The daily peak 03 concentration of 55 ppb is relatively low as compared to days prior to the rain event. The SO2 concentrations remain relatively high (5-15 ppb) during the fog event, with low values following the fog event (0 -3 ppb), and during the entire day of June 15.
Filter-based measurements of the gas phase concentrations of NH3 and HNO3 corresponding to the sampling times given in Table 2 have means and standard deviations of 20.6 gg m -3, 29.8 ppb (4.6 gg m -3, 6.7 ppb), and 1.9 gg m -3, 0.7 ppb (0.6 gg m -3, 0.2 ppb), respectively. Therefore the fractions of total (gas + aerosol) NH3 and HNO3 that partitioned into the aerosol phase are ---25% and-90%, respectively.
5. Discussion
5.1. Comparison of Aerosol Radiative Properties With U.S. Values
The mean value of %p (at low RH) in Beijing during the June 1999 field study (488 Mm -•) is significantly higher than measurements reported for urban locations in the United States. Measurements of %p (550 nm) made in several urban areas of the United States over varying time periods during the 1970s have mean values ranging from 30 to 210 Mm -• [Waggoner et al., 1981]. Recent measurements of %p (530 nm) made at low RH during the month of August 1999 in Atlanta, Georgia have a mean and standard deviation of 120 Mm -• (48 Mm -•) (M. H. Bergin, unpublished data, 1999). The estimated 75th percentile (75% of observations lower than given value) of the visual range Lv during the field study (Lv =1.9 / Oep; based on a modified version of the Koschmieder equation as discussed by Husar et al. [1994]) is 6 km with values ranging from 1 to100 km. This value is significantly lower than the 75th percentile annual mean visual range values of-12 km reported at ambient RH in the Los Angeles

BERGIN ET AL.: AEROSOL PROPERTIES IN BEIJING 17,977
area and over parts of the eastern United States [Husar et al., 1994] during the summer. Therefore the mean light extinction coefficient value of 488 Mm -• in Beijing is roughly a factor of 4 greater than recent measurements in Atlanta and more than a factor of 2 higher than measurements made in urban regions of the United States during the 1970s. In addition, the visual range is approximately a factor of 2 less than the lowest visibility regions of the United States.
Mean values of c•ap reported for several locations in the United States ranged from 27 to 118 Mm -• during the 1970s [Waggoner et al., 1981]. More recent measurements of C•ap in Atlanta have a mean and standard deviation of 16 Mm -• (12 Mm -•) (M. H. Bergin, unpublished data, 1999). The mean value for Beijing (80 Mm -•) is within the range of values reported for urban areas within the United States during the 1970s as well as other urban locations around the world
[Horvath, 1993], although it is roughly a factor of 6 greater than recent measurements made in Atlanta. The mean single- scattering albedo in Beijing (0.81), measured at an RH < 40%, is higher than the mean values reported by Waggoner et al. [1981], which ranged from 0.50 to 0.65, due to the fact that C•sp is much higher in Beijing than for the measurements reported in urban areas of the United States. The values in Beijing are within the range of reported single-scattering albedos for other urban areas of the world [Horvath, 1993]. The mean fine particle mass scattering efficiencies, Esc,t 2.5 and E•c,t •.8, estimated from filter and MOUDI measurements range fr6m 2.3 to 3.6 m 2 g-•. These values are in agreement with the range reported by Wagonnet et al. [1981]. The mean
mass light absorption efficiency estimated by dividing by• the measured elemental carbon concentration E,b• of 8 •P2 g- is within the range of values reported by Horvath [1993], which range from- 4 to 17 m 2 g-•. Overall, the light scattering and absorption values per unit particle concentration are consistent with previous studies elsewhere, but the absolute value of light extinction by particles Crep is significantly higher in Beijing than in urban regions of the United States. In the next section we address the likely source of aerosol light scattering.
5.2. Source of Aerosol Light Scattering
The northern part of China is widely known for its dust storms [Winchester and Bi, 1984; Parungo et al., 1994; Zhang et al., 1996; Xiao, et al. 1997] and therefore one possibility is that the low visibilities in Beijing might be due to wind-blown dust. The MOUDI mass size distribution measurements for
each 24-hour sampling period are illustrated in Figure 4a, and indeed most of the aerosol mass is in the supermicron mode, where we would expect to find wind-blown dust. However, the light scattering distribution functions, Ac•p,i / ,5 log Dp, obtained from (1) and plotted in Figure 4b, show that the submicron aerosol dominates the light scattering. The peak in the aerosol light scattering occurs at an aerodynamic particle diameter of- 0.8 gm, and the fraction of aerosol light scattering that is due to submicron aerosols ranges from 68 to 82%, with a mean and standard deviation of 75+/-5%. Since the lower tail of the size distribution of dust from fugitive sources and/or wind-blown mineral aerosols extends into the
submicron region, dust does contribute somewhat to the submicron peak in light scattering. However, the existence of the distinct submicron peak in the aerosol size distribution suggests that an accumulation mode aerosol is present that is not just due to the lower tail of the coarse particle soil dust
distribution. Submicron accumulation mode aerosols are more
commonly associated with combustion-related sources (i.e., direct emission of particles from combustion and secondary sulfate, nitrate, and organic aerosols formed from the products of atmospheric gas phase reactions involving SO2, NOx, and organic vapors from combustion). This is supported by the chemical composition data, shown in Figures 5a and 5b. The PM2.5 mass is dominated by organic compounds (---30%) and ionic species (---30%). Sulfate, nitrate, chloride, and ammonium ion account for 15%, 8%, 2%, and 5% of the PM2.5 mass, respectively. It is important to point out that nitrate aerosol can be lost by volatilization from filters due to changes in equilibrium between the deposited aerosol particles and NH3 and HNO3 in the atmosphere [Zhang and McMurry, 1992]. Thus the mass concentration of atmospheric nitrate aerosol could be higher than measured. Although mineral aerosol accounts for-16% of the PM2.5 mass, it is not the dominant chemical species in the PM2.5 mass fraction and is not the dominant source of the Beijing visibility problem at this time of year. Instead, combustion-related fine particles are responsible for most of the local light scattering in June 1999.
5.3. Diurnal Variation
There are several possible factors that influence the diurnal pattern observed in both %p, Or, p, and co. As seen by comparing Figures 1 and 3, the peaks in these parameters generally correspond to minima in daily temperature while the troughs correspond to daily temperature maxima. There are a number of possible explanations for this behavior. It is worthwhile to point out that the effect of ambient RH on most days does not significantly influence the C•p measurements through the additional light scattering by condensed water since the nephelometer measurements were made under typically dry (RH < 40% except during the rain/fog event; see Table 1) conditions. Since atmospheric mixing height generally varies with surface temperature, the diurnal variation in c•sp and c•av can likely be explained in part by changes in mixing height. However, co also exhibits the same general diurnal pattern, reflecting the fact that the relative peak-to-trough variation in C•p is larger than that of Crop. This suggests that the diurnal variation in C•p cannot be solely explained by dilution as the mixing depth increases during the day. Since the peaks in C•p and C•,p occur at about the same time as the typical morning "rush hour" traffic, these peaks could also be explained in part by the direct emission of aerosols (elemental carbon, organic carbon, etc.) and related gas phase precursors (volatile organic compounds and NOx)
from mobile sources. For this explanation to be viable the single-scattering albedo for mobile source aerosols emitted during the morning traffic peak would have to be larger than the average ambient value for co. That is indeed likely since diesel truck traffic in much of Beijing is restricted to the nighttime hours, leaving a largely gasoline-powered automobile fleet on the streets during the morning traffic peak. Gasoline-powered vehicles generally emit only small quantities of black carbon [Kleeman et al., 1999], thereby producing an exhaust aerosol with a high value of co.
A third explanation for the observed variations in c•sp that would not require a relatively high co for mobile source aerosols is presented below. It is also worthwhile to point out that the diurnal variability is observed for E•,t •o, as shown in Figure 3. As previously discussed, the unrealistically high

17,978 BERGIN ET AL.: AEROSOL PROPERTIES IN BEIJING
values of Escat lO (> 10 m 2 g-l) observed during the fog event suggest the presence of semivolatile aerosol chemical components that evaporate after being deposited on the heated TEOM sampling substrate. The result is an underestimation of the aerosol mass concentration and thus an overestimation of
Escat lO. It is possible that the peaks in Escat lO observed during _ _
the mornings indicate the presence of semivolatile aerosol chemical species that contribute light scattering but not light absorption, thus raising the value of c0 at that time of day.
5.4. Relationship Between Gas Phase Measurements and O'sp
5.4.1. Days without precipitation. As noted above, the relative increase in {X•p observed during the night is greater than that for {Xap. A possible explanation for this is the formation of nitrate aerosol (i.e., ammonium nitrate, or nitrate associated with mineral dust species or with sodium from marine aerosol) via gas-to-particle conversion during the nighttime and/or early morning. Since these nitrate aerosols scatter but do not absorb visible radiation, their formation could in part explain the increase in both %p and c0. Sodium nitrate and mineral dust nitrates would be expected to be associated with nonvolatile coarse particles, and since mineral dust makes up 16% of the fine particle mass, there could be fine particle non-volatile nitrate as well. Ammonium nitrate is typically found in semi-volatile fine particles that effectively scatter light. Ammonium nitrate aerosol formation is generally favored by low temperatures and high RH, while evaporation is enhanced by increasing temperatures and decreasing RH [Stelson and Seinfeld, 1982,' Wexler and Seinfeld, 1990; Mozurkevich, 1993]. The observed decrease in {X•p and c0 as the day progresses could be explained in part by the evaporation of ammonium nitrate aerosol during conditions that favor the gas phases of HNO3 and NH3. However, the vapor pressure product of HNO3 times NH3, based on mean values from daily filter measurements, is approximately an order of magnitude lower than the vapor pressure product needed to form ammonium nitrate under typical atmospheric conditions in Beijing (T = 25 øC, RH = 70%), as estimated from the theory presented by Mozurkevich [ 1993]. This suggests that ammonium nitrate aerosol did not exist in the Beijing atmosphere on most of the days studied during June 1999. Instantaneous measurements of HNO3 and NH3 would be needed to further refine this assessment. The samples taken at Beijing University in June 1999 show an average of 11 •tg m -3 of fine particle nitrate compared to 10
-3
gg m of coarse nitrate and thus an equal amount of nitrate in both modes.
Gas phase measurements made in Beijing during June 1999 show an average of approximately 21 •tg m -3 (30 ppb) of NH3 and 2 •tg m -3 (1 ppb) of HNO3. The total amount of nitrate (particulate + gas phase) is 23 •tg m -3 indicating that -90% of the nitrate exists in particle phase. There are two likely mechanisms by which nitric acid vapor could be formed leading to the nitrate aerosol' a nighttime mechanism, and a daytime mechanism. In the discussion below, we present rough estimates of the amount of excess light scattering that could be due to aerosol nitrate formation according to each of these mechanisms in the Beijing atmosphere. For each estimate we assume that HNO3 production limits the rate of aerosol nitrate formation. The amount of nitric acid vapor produced places an obvious upper
limit on the amount of aerosol nitrate that can be found in the
Beijing atmosphere. Our estimates of HNO3 production will be based on the NO2 data collected during the sampling period and, as discussed previously, these values may be greater than the actual ambient NO2 concentrations. For these reasons the following estimates of aerosol nitrate formation and the effect of aerosol nitrate formation on light scattering can be viewed as upper limits.
The nighttime reaction mechanism for aerosol nitrate formation occurs when NO2 reacts with 03 to form NO3, which in tums reacts with NO2 to create N205 which forms HNO3 by reacting with H20 [Russell et al., 1985; Russell et al., 1986]. This reaction pathway is unimportant during the day since NO3 is photolyzed back to NO2 immediately after being formed. It is worthwhile to point out that the concentration of 03 in Beijing does not go to zero at night, as is often the case for other urban locations. Based on the
typical measured nighttime concentrations of NO2 (-20 ppb) and 03 (-40 ppb) and assuming that NO is a small fraction of the total NOx (-0.1 ppb) due to reactions with 03 the production rate of HNO3 based on the mechanism of Russell et al. [1985] is 0.7 ng m-3s -•. If all of the HNO3 produced were to form nitrate aerosol then the corresponding increase in aerosol mass concentration during the night could be as large as -30 gg m -3. Some loss due to HNO3 and aerosol nitrate dry deposition is to be expected. This value generally agrees with the observed amount of aerosol nitrate formation. Since the peaks in {X•p occur several hours after sunrise, it is also possible that HNO3 is formed through the reaction of NO2 with OH. Assuming an early morning OH concentration of lx106 molecules cm -3 [HoJSumahaus et al., 1996], an NO2 concentration of 20 ppb and the reaction rate presented by Carter and Atkinson [1988], the aerosol nitrate formation over the 2-hour period from sunrise to the peak in {X•p could be as high as - 24 gg m -3. Given the measured value of 21 gg m -3 of fine plus coarse particulate NO3- plus roughly 6 gg m -3 of associated cation mass (such as NH4 +, Na +, Ca 2+) and our earlier estimate of mass scattering efficiency of 2.3 m2g -• for PM10 size particles, we infer an increase in the light scattering coefficient of-62 Mm -•. If these concentrations are modulated according to a diurnal cycle that depends on HNO3 production as well as ambient T and RH, then the diurnal swings in {X•p due to nitrate aerosol production could be substantially larger than the average value just estimated. The relative changes in {X•p needed to increase c0 from late afternoon minimum values to peak values during the following days range from 120 to 474 Mm -• for the days not having extremely high relative humidities (i.e., rain or fog). Thus, aerosol nitrate formation may explain a significant fraction of the relative increase in light scattering observed in the mornings. On days with 100% RH however, the increase in {X•p is significantly larger (i.e., - 900 Mm -•) than can be explained by nitrate formation alone.
5.4.2. Rain/fog event. During the rain/fog event on June 14 and 15, {X•p and {Xap reach the highest values observed during the experiments. These high values are probably due in part to reduced vertical mixing as compared to previous days. This is reflected in the maximum midday temperature which is - 10 øC less than previous days. Clearly, the below cloud scavenging of aerosols by raindrops is not sufficient to reduce {X•p and {X•p to the lower values observed for other days. This is due to the fact that the fine accumulation mode particles are not effectively removed by below cloud scavenging
BERGIN ET AL.: AEROSOL PROPERTIES IN BEIJING 17,979
mechanisms [Slinn, 1983]. The relative increase in {jsp associated with the overnight increase in co is 900 Mm -1 between June 14 and June 15, which is more than a factor of 2 greater than the associated overnight increase in {j•p for the days without rain/fog. This suggests that the production of aerosol mass is greater during the day having rain/fog. During the rain/fog event the RH is -100%, and therefore a significant fraction of the aerosol particles form droplets [Noone e! al., 1992]. The droplets will, in general, favor the partitioning of soluble gases such as NH3 and HNO3 into the aqueous phase [Pandis and Seinfeld, 1989]. The daytime production rate of HNO3 due to the reaction of NO2 (40 ppb) with OH (assuming an OH concentration of lxl 06 molecules
-3
cm , similar to the early morning value due to the presence of clouds) is 2.7 ng m-3s -1 Over a 12-hour period this can ß
account for up to -200 gg m -3 of HNO3 formation, which if incorporated into the aerosol phase would increase oxp by -600 Mm -1. For the reasons previously mentioned this is an upper limit estimate. Actual measurements of aerosol nitrate concentrations on June 14-15 show 41 gg m -3 of aerosol nitrate in the TSP samples, which is the highest concentration seen during the study. The oxidation of S(IV) to S(VI) which readily occurs in fog/cloud droplets through reactions with H202 and/or 03 [Hoffmann and Calvert, 1985; Daum et al., 1984; Pandis and Seinfeld, 1989], also plays a role in increasing oxp during the fog event. The fine particle aerosol sulfate reaches the peak value seen during the experiments of 32 gg m -3 during the rain/fog event, roughly 50% greater than on other days, and the TSP sulfate concentration is exceeds 45
-3
txg m which is roughly double that for other days.
6. Conclusions
Measurements of aerosol radiative, physical, and chemical properties were made in Beijing over a week-long period during June 1999. Mean (and standard deviation) values for the aerosol light scattering Crxp and absorption cr_•p coefficients at low RH as well as single-scattering albedo co are 488 Mm -1 (370 Mm-1), 88 Mm -• (40 Mm-1), and 0.81 (0.08), respectively. Although the aerosol single-scattering albedo is within the range of values reported for other urban locations, the light scattering coefficient is significantly greater than values reported within urban areas of the United States. By comparison, the 75th percentile of the visual range in Beijing during the field study is --6 km, as compared to - 12 km in the lowest visibility regions of the United States. The relatively high aerosol extinction coefficient in Beijing is accompanied
-3
by a mean PM2.5 mass concentration of 136 gg m (with values ranging from 85 to 189 gg m-3), which is significantly higher than the proposed 24-hour average U.S. NAAQS value for PMJ.5 of 65 gg m -3.
Aerosol mass size distribution measurements indicate that
- 74% of the aerosol mass is located in the coarse particle (Dp > 1.0 gm) mode. The light scattering as a function of particle size, estimated from mass size distribution measurements, shows that - 80% of the light scattering by PM10 particles at 530 nm is due to the submicron particle (Dp < 1.0 gm) mode. The coarse mode chemical composition is dominated by mineral aerosol, which accounts for--44% of the total suspended particulate mass. The distinct peak in the submicron aerosol mass size distribution, which is responsible for the majority of the light scattering, primarily consists of chemical species that are combustion-related. This is reflected
in the PM2.5 chemical composition which is dominated by organic compounds (--30%), sulfate (--15%), and nitrate (8%), with mineral dust accounting for (--16%) of the PM2.5 mass. In general, mineral dust plays a much less important role in visibility reduction in Beijing during the time period studied than do combustion-related aerosols.
For days having RH values less than 100% there is a clear diurnal trend in dry aerosol •p, {Jap, and co. In general, peak values occur in the morning with troughs in the late afternoon. The maxima in these parameters correspond to atmospheric conditions of low temperature (7) and high relative humidity (RH). The minima in these parameters generally occur in the late afternoon when T is relatively high and RH low. It is likely that the increasing atmospheric mixing height in the afternoons is responsible for the decrease in both {j•p and Crop. However, co also exhibits a similar diurnal variability suggesting that the aerosol is relatively more scattering in the mornings than in the afternoons. One likely contributor to this diurnal variation is the formation of HNO• during the nighttime and mornings, which in turn reacts to form secondary aerosols. The aerosol nitrate may at times be associated with ammonium under the high RH conditions seen during the fog events, but under average conditions the product of measured HNO• time NH• concentrations is too low to form NH4NO• aerosol. Therefore much of the nitrate in the Beijing atmosphere must be associated with mineral dust or marine (sodium) aerosol. Estimates of the formation of nitric acid vapor during the evening and early morning suggest that nitrate formation may contribute to the observed peaks in oxp and co. The highest values for both osp (1600 Mm -•) and o•p (200 Mm -•) are observed during a rain/fog event on June 14 when the RH is approximately 100%, accompanied by higher than average values of fine aerosol ammonium, sulfate, and nitrate. Heterogeneous aerosol sulfate formation within liquid droplets plus partitioning of HNO3 and NH• into the condensed phase during this period of high RH is responsible for a significant fraction of the observed light scattering during this period.
Acknowledgments. We thank Judy Chow and Cliff Frazier of the Desert Research Institute for performing the X-ray fluorescence analyses of the airborne particle samples. We also thank Ted Russell at Georgia Tech for discussions related to aerosol nitrate formation.
References
Ayers, G.P., M.D. Keywood, and J.L. Gras, TEOM vs. manual gravimetric methods for determination of PMJ.5 aerosol mass concentrations, Atmos. Environ., 33, 3717-3721, 1999.
Bergin, M.H., J.A. Ogren, and S.E. Schwartz, Evaporation of ammonium nitrate aerosol in a heated nephelometer: implications for field measurements, Environ. Sci. Technol., 31, 2878-2883, 1997.
Birch, M.E., and R.A. Cary, Elemental carbon-based method for monitoring occupational exposures to particulate diesel exhaust, Aerosol Sci. Technol., 25, 221-241, 1996.
Bohren, C.F., and D.R. Huffman, Absorption and Scattering of Light by Small Particles, John Wiley, New York, 1983.
Bond, T.C., T.L. Anderson, and D. Campbell, Calibration intercomparison of filter-based measurements of visible light absorption by aerosols, Aerosol Sci. Technol., 30, 582-600, 1999.
Carter, W.P.L., and R. Atkinson, Development and implementation of an up-to-date photochemical mechanism for use in airshed models, summary and final report, Calif. Air Resour. Board, Sacramento, 1988.
Chameides, W.L., et al., Case study of the effects of atmospheric aerosols and regional haze on agriculture: An opportunity to

17,980 BERGIN ET AL.: AEROSOl., PROPERTIES IN BEIJING
enhance crop yields in China through emission controls, Proc. Natl. Acad. Sci. U.S.A., 96, 13,626-13,633, 1999.
Charlson, R.J., S.E. Schwartz, J.M. Hales, R.D. Cess, J.A. Coakley, J.E. Hansen, and D.J. Hofmalm, Climate forcing by anthropogenic aerosols, Science, 255, 423-430, 1992.
Daum, P.H., T.J. Kelly, S.E. Schwartz, and L. Newman, Measurements of the chemical composition of stratoform clouds, Atmos. Environ., 18, 2671-2684, 1984.
Fehsenfeld, F. C., et al., A ground-based intercomparison of NO, NOx, and NO•, measurement techniques, J. Geophys. Res., 92, 14,710-14,722, 1987.
Gao, Y., R. Arimoto, R.A. Duce, X.Y. Zhang, G.Y. Zhang, Z.S. An, L.Q. Chen, M.Y. Zhou, D.Y. Gu, Temporal and spatial distributions of dust and its deposition to the China Sea, Tellus, 49B, 172-189, 1997.
Hashimoto, Y., Y. Sekine, H.K. Kim, Z.L. Chen, and Z.M. Yang, Atmospheric fingerprints of east Asia: 1986-1991. An urgent record of aerosol analysis by the JACK network, Atmos. Environ., 28, 1437-1445, 1994.
Hoffmalm, M.R., and J.G. Calvert, Chemical transformation modules for Eulerian acid deposition modules, Vol. 2, The aqueous-phase chemistry, Rep. EPA/600/3-85/017, Environ. Prot. Agency, Research Triangle Park, N. C., 1985.
Hofzumahaus, A., U. Aschmutat, M. Hessling, F. Holland, and D.H. Ehhalt, The measurement of tropospheric OH radicals by laser- induced fluorescence during the POPCORN field campaign, Geophys. Res. Lett., 23,2541-2544, 1996.
Horvath, H., Atmospheric light absorption: A review, Atmos. Environ., 27A, 294-337, 1993.
Husar, R.B., J.B. Elkins, W.E. Wilson, U.S. visibility trends, 1960- 1992, Center for Air Pollution Impact and Trend Analysis report, Washington Univ., St. Louis, Mo., 1994.
John, W., and G. Reischl, A cyclone for size-selective sampling of ambient air, J. Air Pollut. Control Assoc., 30, 872-876, 1980.
Kleeman, M.J., L.S. Hughes, J.O. Allen, and G.R. Cass, Source contributions to the size and composition distribution of atmospheric particles: Southern California in September, 1996, Environ. Sci. Technol., 33, 4331-4341, 1999.
Li, X., X. Zhou, W. Li, and L. Chen, The cooling of Sichuan province in recent 40 years and its probable mechanisms, Acta Metall. Sin. Engl. Lett., 9, 57-68, 1995.
Marple, V.A., K.L. Rubow, and S.M. Behm, A microorifice uniform deposit impactor (MOUDI): Description, calibration, and use, Aerosol Sci. Technol., 14, 434-446, 1991.
Mozurkevich, M., The dissociation constant of ammonium nitrate and its dependence on temperature, relative humidity and particle size, Atmos. Environ., 27A, 261-270, 1993.
Noone, K.J., et al., Changes in aerosol size-and-phase distributions due to physical and chemical processes in fog, Tellus, 44B, 489- 504, 1992.
Pandis, S.N., and J.H. Seinfeld, Mathematical modeling of acid deposition due to radiation fogs, J. Geophys. Res., 94, 12,911- 12,923, 1989.
Parungo, P., Z. Li, X. Li, D. Yang, and J. Harris, Gobi dust storms and the great green wall, Geophys. Res. Lett., 21,999-1002, 1994.
Russell, A.G., G.J. McRae, and G.R. Cass, The dynamics of nitric acid production and the fate of nitrogen oxides, Atmos. Environ., 19, 893-903, 1985.
Russell, A.G., G.R. Cass, and J.H. Seinfeld, On some aspects of nighttime chemistry, Environ. Sci. Technol., 20, 1167-1172, 1986.
Salmon, L.G., C.S. Christoforou, and G.R. Cass, Air pollutants in the Buddhist cave temples at the Yungang Grottoes, China, Environ. Sci. Technol., 28, 805-811, 1994.
Schwartz, S.E., The whitehouse effect-shortwave radiative forcing of climate by anthropogenic aerosols: An overview, J. Aerosol Sci., 3, 359-382, 1996.
Slilm, W.G.N., Precipitation scavenging, in Atmospheric Sciences and Power Production-1979, chap. 11, Div. of Biomed. Environ. Res., U.S. Dep. of Energy, Washington, D.C., 1983.
Stelson, A.W., and J.H. Seinfeld, Relative humidity and temperature dependence of the ammonium nitrate dissociation constant, Atmos Environ., 16, 983-992, 1982.
Waggoner, A. P., R.E. Weiss, N.C. Ahlquist, D.S. Covert, S. Will, and R.J. Charlson, Optical characteristics of atmospheric aerosols, Atmos. Environ., 15, 1891-1909, 1981.
Waldman, J.M., P.J. Lioy, M. Zelenka, L. Jing, Y.N. Lin, Q.C. He, Z.M. Qian, R. Chapman, and W.E. Wilson, Wintertime measurements of aerosol acidity and trace elements in Wuhan, a city in central China, Atmos. Environ., 25B, 113-120, 1991.
Wei, F., E. Teng, G. Wu, W. Hu, W.E. Wilson, R.S. Chapman, J.C. Pau, and J. Zhang, Ambient concentrations and elemental compositions of PM10 and PM2.5 in four Chinese cities, Environ. Sci. Technol., 33, 4188-4193, 1999.
Wexler, A.S., and J.H. Seinfeld, The distribution of ammonium salts among a size and composition dispersed aerosol, Atmos. Environ., 24A, 1231-1246, 1990.
Winchester, J.W., M. Bi, Fine and coarse aerosol composition in an urban setting: A case study in Beijing, China, Atmos. Environ., 18, 1399-1409, 1984.
Xiao, H., G.R. Carmichael, J. Durchenwald, D. Thornton, and A. Bandy, Long-range transport of Sox and dust in East Asia during the PEM B Experiment, J. Geophys. Res., 102, 28,589-28,612, 1997.
Zhang, X, and P.H. McMurry, Evaporative losses of fine particulate nitrates during sampling, Atmos. Environ., 26A, 3305-3312, 1992.
Zhang, X.Y., R. Arimoto, and Z.S. An, Dust emission from Chinese desert sources linked to variations in atmospheric circulation, J. Geophys. Res., 101, 4341-4350, 1996.
M.H. Bergin, G.R. Cass, W.L. Chameides, and C.S. Kiang, School of Earth and Atmospheric Sciences, Georgia Institute of Technology, Atlanta, GA 30332. (mike.bergin•ce.gatech. edu)
C. Fang, X.Y. Tang, L.M. Zeng, and Y.H. Zhang, State Key Laboratory of Environmental Simulation and Pollution Control, Center for Environmental Sciences, Peking University, Beijing, China.
L.G. Salmon, Environmental Engineering and Science Department, California Institute of Technology, Pasadena, CA 91125.
J. Xu, School of Civil and Environmental Engineering, Georgia Institute of Technology, Atlanta, GA 30332.
T. Yu, Beijing Environmental Protection Bureau, Beijing, China.
(Received October 12, 2000; accepted January 30, 2001 .)