Aerosol measurements by spectral instrumentation€¦ · 7x7 km2 vs. 13x24 km2 ... and desert dust...
31
Aerosol measurements by spectral instrumentation Pieternel Levelt, Pepijn Veefkind, and Piet Stammes Prof. dr. Pieternel F. Levelt Head Climate Observations KNMI Professor at TU Delft (Climate Centre) Principal Investigator OMI
Transcript of Aerosol measurements by spectral instrumentation€¦ · 7x7 km2 vs. 13x24 km2 ... and desert dust...
Aerosol measurements by spectral instrumentation Pieternel Levelt, Pepijn Veefkind, and Piet Stammes
Prof. dr. Pieternel F. Levelt Head Climate Observations KNMI Professor at TU Delft (Climate Centre) Principal Investigator OMI
Prof. dr. P.F. Levelt, KNMI & TUD, EGU, Wenen, Auatria 11 April, 2013
2
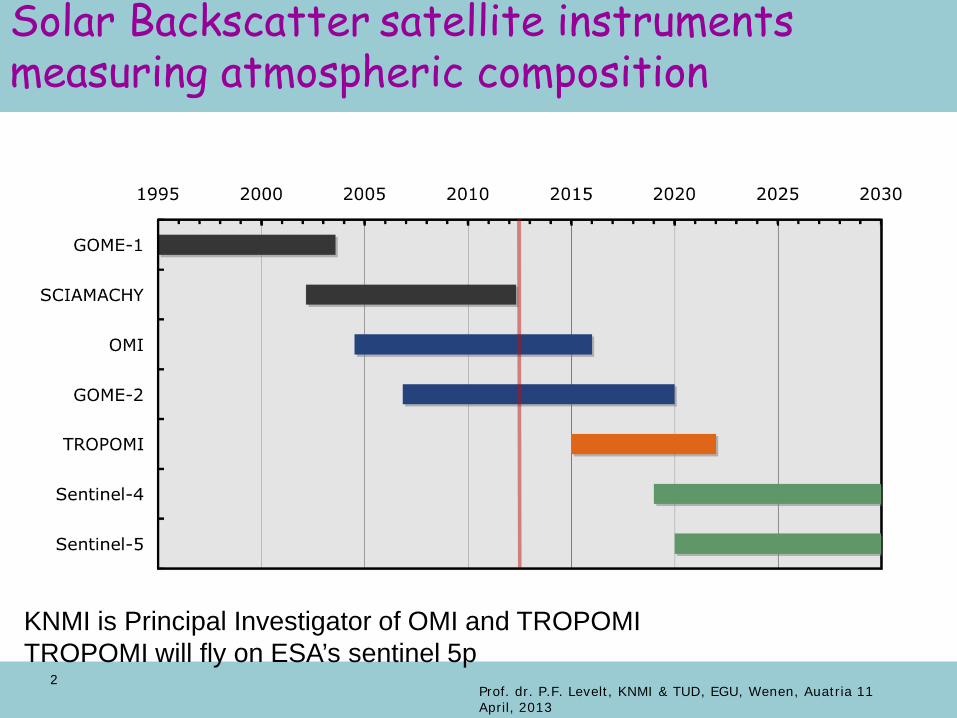
Solar Backscatter satellite instruments measuring atmospheric composition
KNMI is Principal Investigator of OMI and TROPOMI TROPOMI will fly on ESA’s sentinel 5p
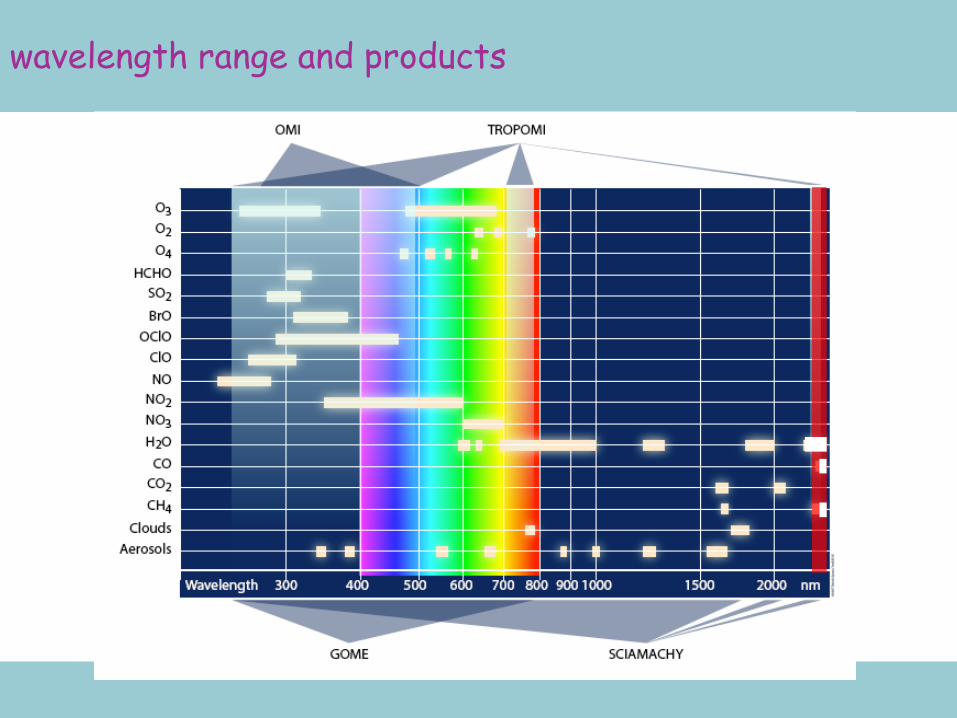
wavelength range and products
Prof. dr. P.F. Levelt, KNMI & TUD, EGU, Wenen, Auatria 11 April, 2013
4
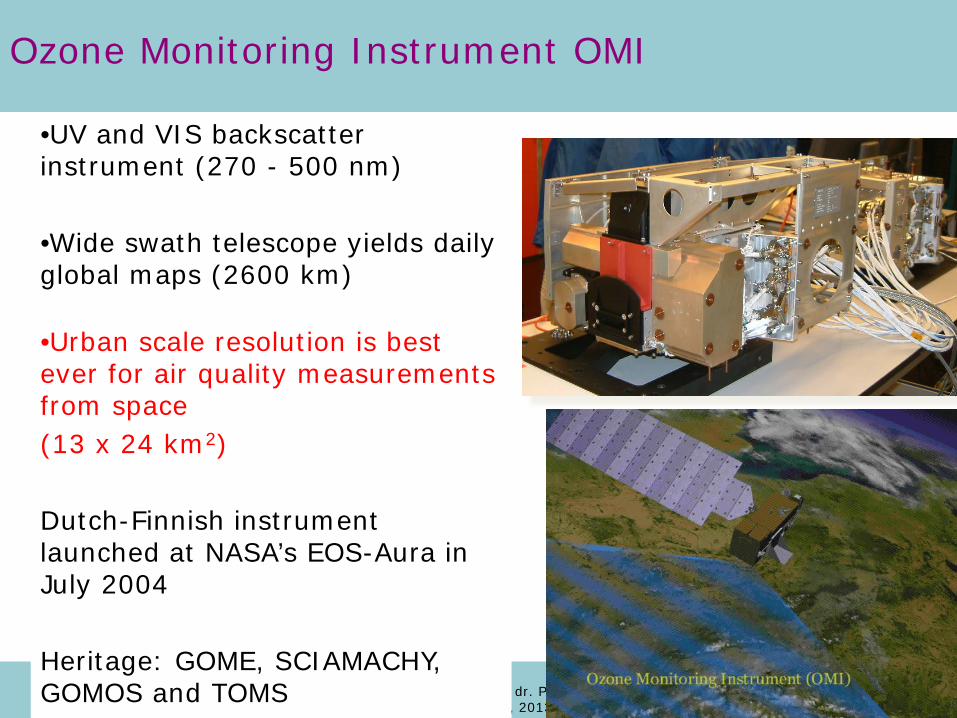
Ozone Monitoring Instrument OMI
•UV and VIS backscatter instrument (270 - 500 nm)
•Wide swath telescope yields daily global maps (2600 km)
•Urban scale resolution is best ever for air quality measurements from space (13 x 24 km2) Dutch-Finnish instrument launched at NASA’s EOS-Aura in July 2004 Heritage: GOME, SCIAMACHY, GOMOS and TOMS
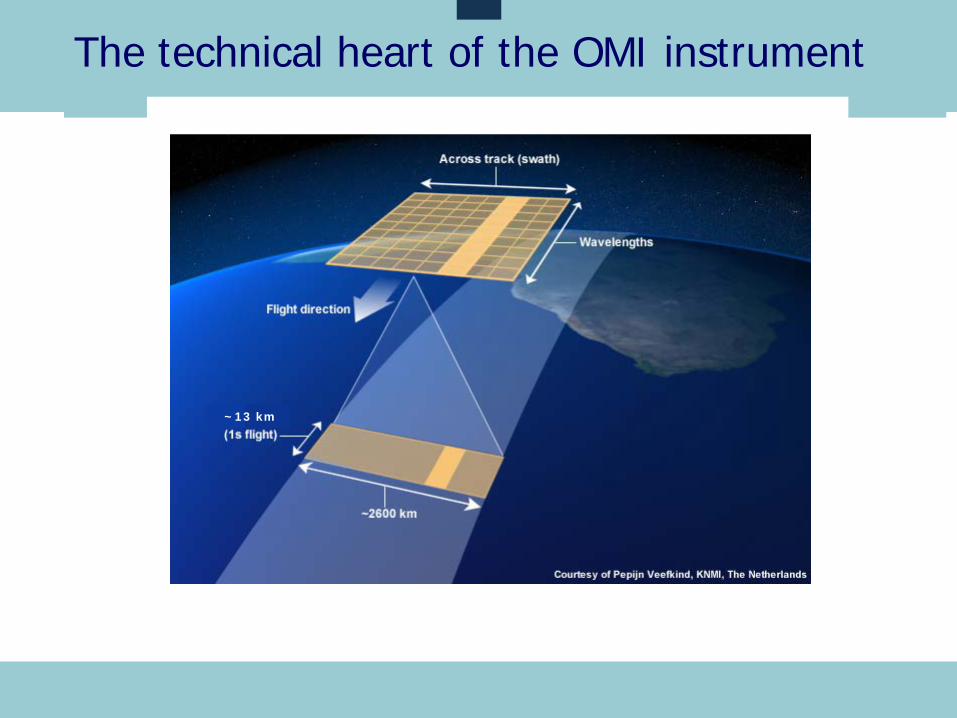
The technical heart of the OMI instrument
~13 km
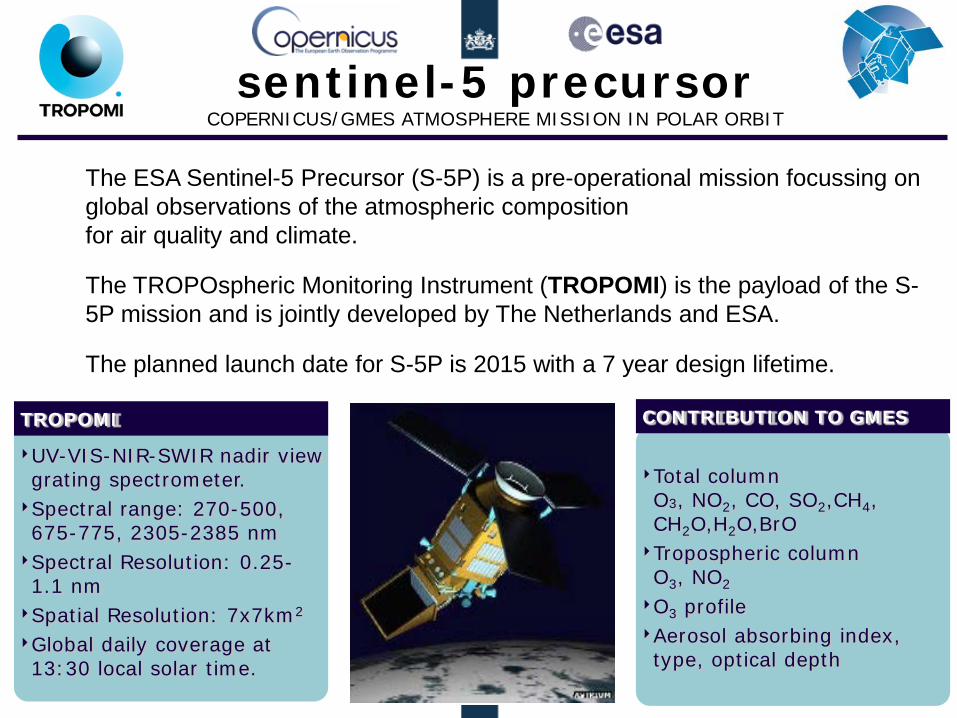
The ESA Sentinel-5 Precursor (S-5P) is a pre-operational mission focussing on global observations of the atmospheric composition for air quality and climate.
The TROPOspheric Monitoring Instrument (TROPOMI) is the payload of the S-5P mission and is jointly developed by The Netherlands and ESA.
The planned launch date for S-5P is 2015 with a 7 year design lifetime.
sentinel-5 precursor COPERNICUS/GMES ATMOSPHERE MISSION IN POLAR ORBIT
‣UV-VIS-NIR-SWIR nadir view grating spectrometer.
‣Spectral range: 270-500, 675-775, 2305-2385 nm
‣Spectral Resolution: 0.25-1.1 nm
‣Spatial Resolution: 7x7km2
‣Global daily coverage at 13:30 local solar time.
TROPOMI
‣Total column O3, NO2, CO, SO2,CH4, CH2O,H2O,BrO
‣Tropospheric column O3, NO2
‣O3 profile ‣Aerosol absorbing index, type, optical depth
CONTRIBUTION TO GMES
Prof. dr. P.F. Levelt, KNMI & TUD, EGU, Wenen, Auatria 11 April, 2013
7
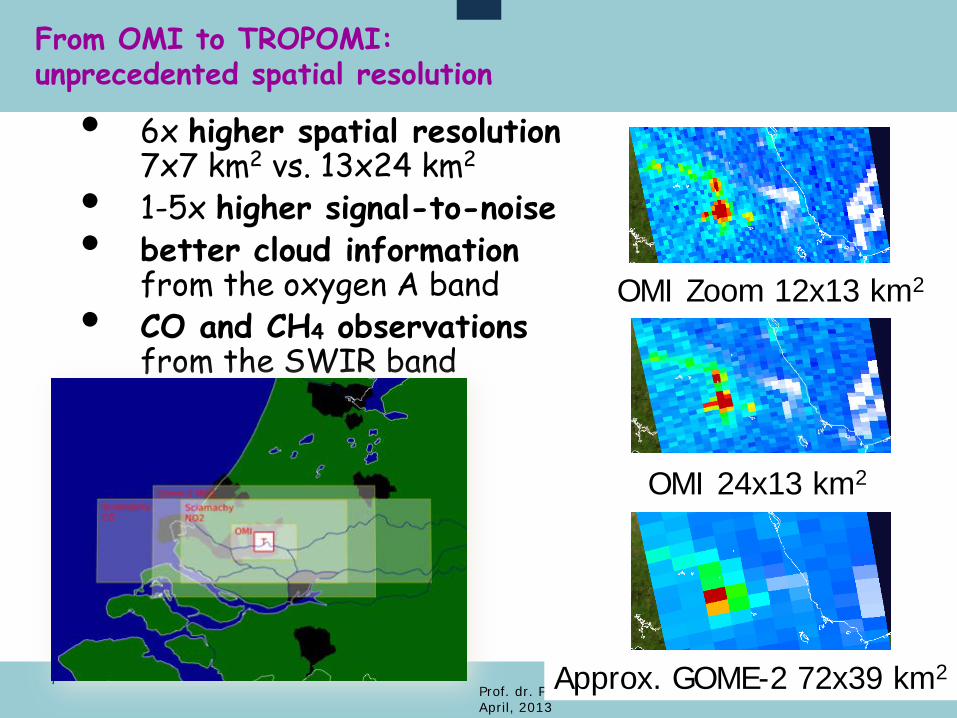
• 6x higher spatial resolution 7x7 km2 vs. 13x24 km2
• 1-5x higher signal-to-noise • better cloud information
from the oxygen A band • CO and CH4 observations
from the SWIR band
From OMI to TROPOMI: unprecedented spatial resolution
OMI Zoom 12x13 km2
OMI 24x13 km2
Approx. GOME-2 72x39 km2
Prof. dr. P.F. Levelt, KNMI & TUD, EGU, Wenen, Auatria 11 April, 2013
8
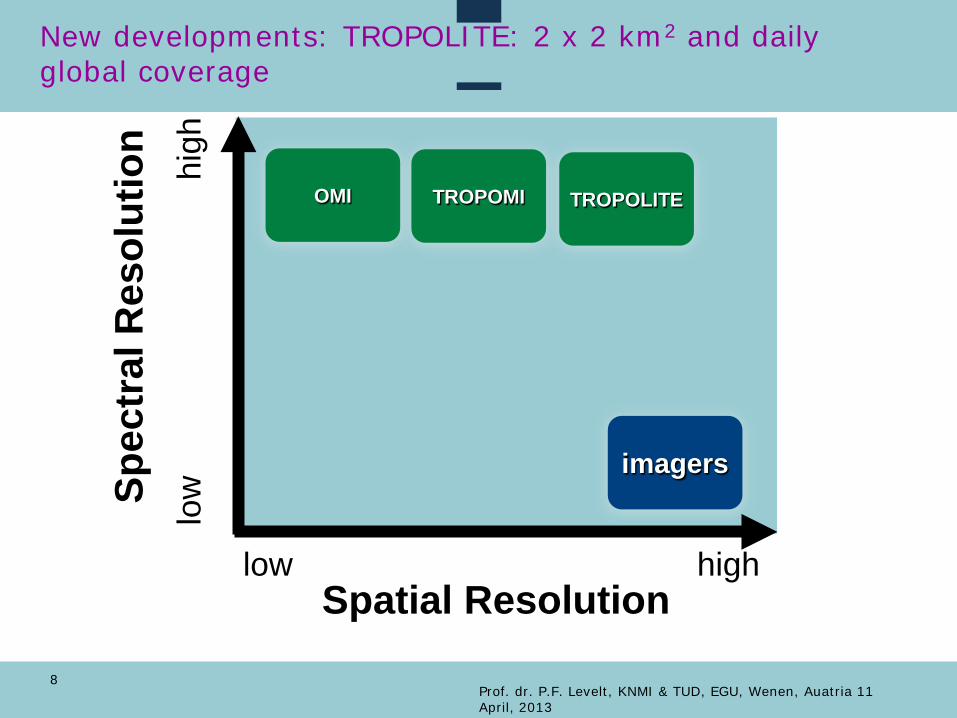
New developments: TROPOLITE: 2 x 2 km2 and daily global coverage
Spec
tral
Res
olut
ion
Spatial Resolution low high
high
lo
w imagers
OMI TROPOMI TROPOLITE
9
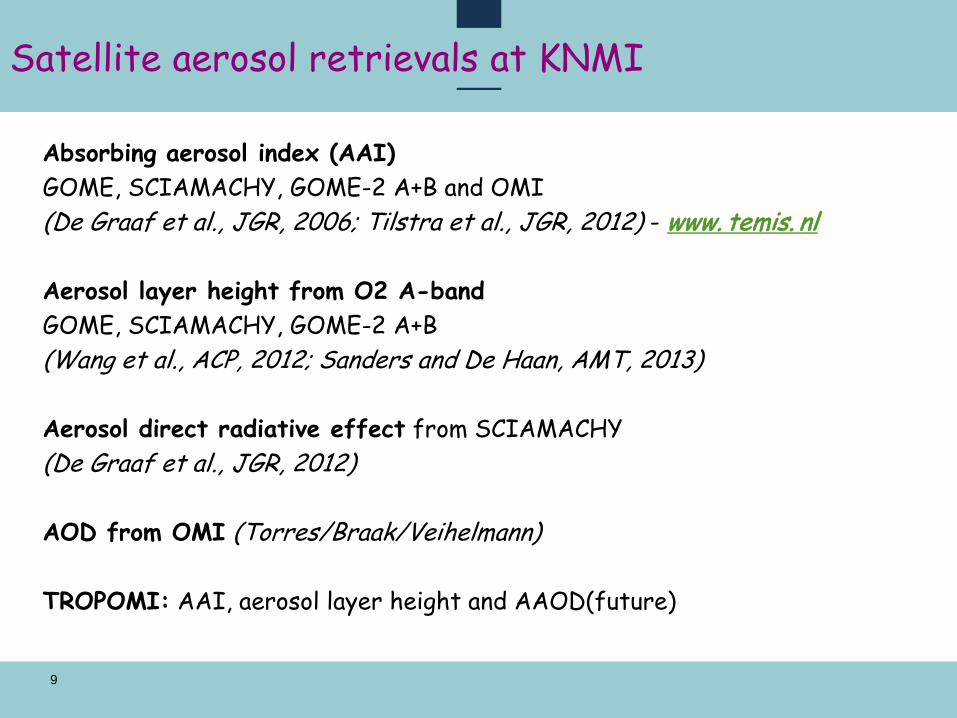
Satellite aerosol retrievals at KNMI
Absorbing aerosol index (AAI) GOME, SCIAMACHY, GOME-2 A+B and OMI (De Graaf et al., JGR, 2006; Tilstra et al., JGR, 2012) - www. temis. nl Aerosol layer height from O2 A-band GOME, SCIAMACHY, GOME-2 A+B (Wang et al., ACP, 2012; Sanders and De Haan, AMT, 2013) Aerosol direct radiative effect from SCIAMACHY (De Graaf et al., JGR, 2012) AOD from OMI (Torres/Braak/Veihelmann) TROPOMI: AAI, aerosol layer height and AAOD(future)
10
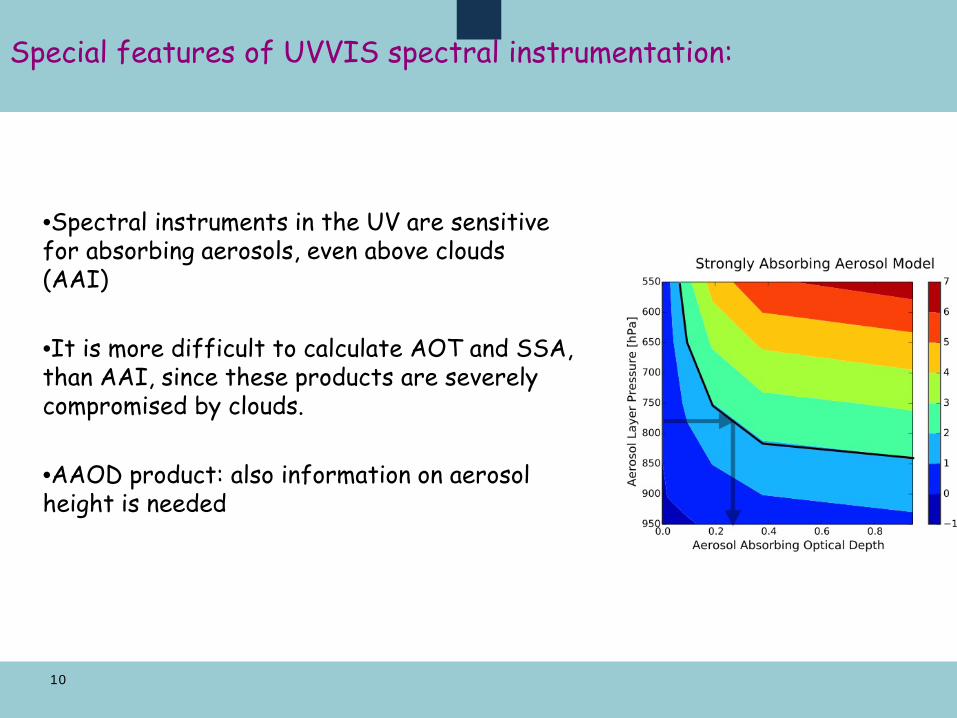
Special features of UVVIS spectral instrumentation:
•Spectral instruments in the UV are sensitive for absorbing aerosols, even above clouds (AAI)
•It is more difficult to calculate AOT and SSA, than AAI, since these products are severely compromised by clouds.
•AAOD product: also information on aerosol height is needed
Prof. dr. P.F. Levelt, KNMI & TUD, EGU, Wenen, Auatria 11 April, 2013
11
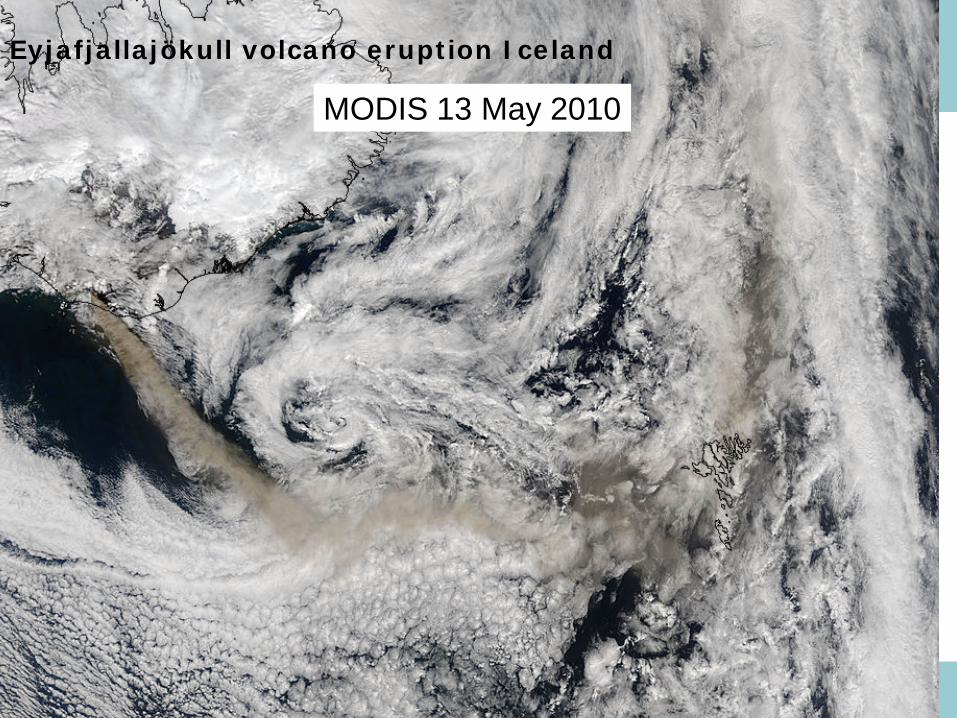
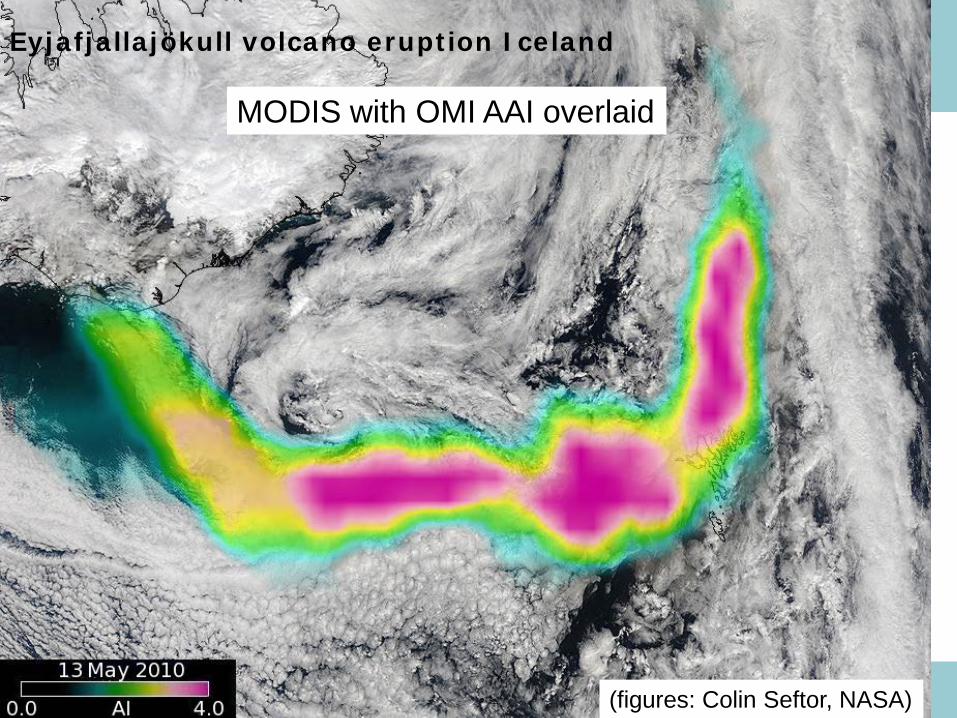
MODIS 13 May 2010
Eyjafjallajökull volcano eruption Iceland
Prof. dr. P.F. Levelt, KNMI & TUD, EGU, Wenen, Auatria 11 April, 2013
12
MODIS with OMI AAI overlaid
(figures: Colin Seftor, NASA)
Eyjafjallajökull volcano eruption Iceland
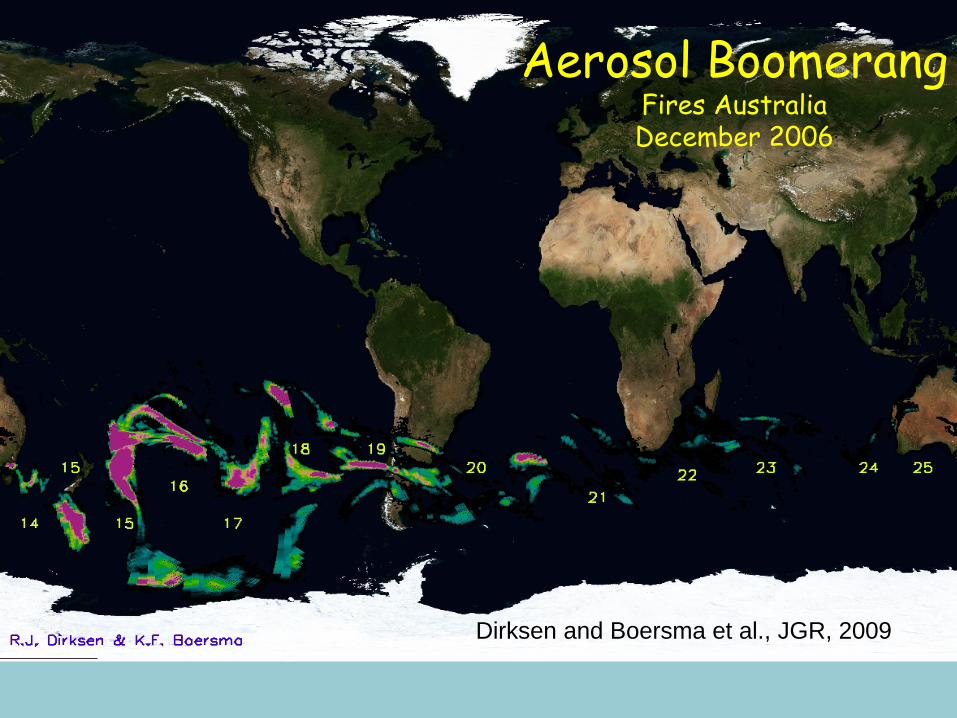
Dirksen and Boersma et al., JGR, 2009
Aerosol Boomerang Fires Australia December 2006
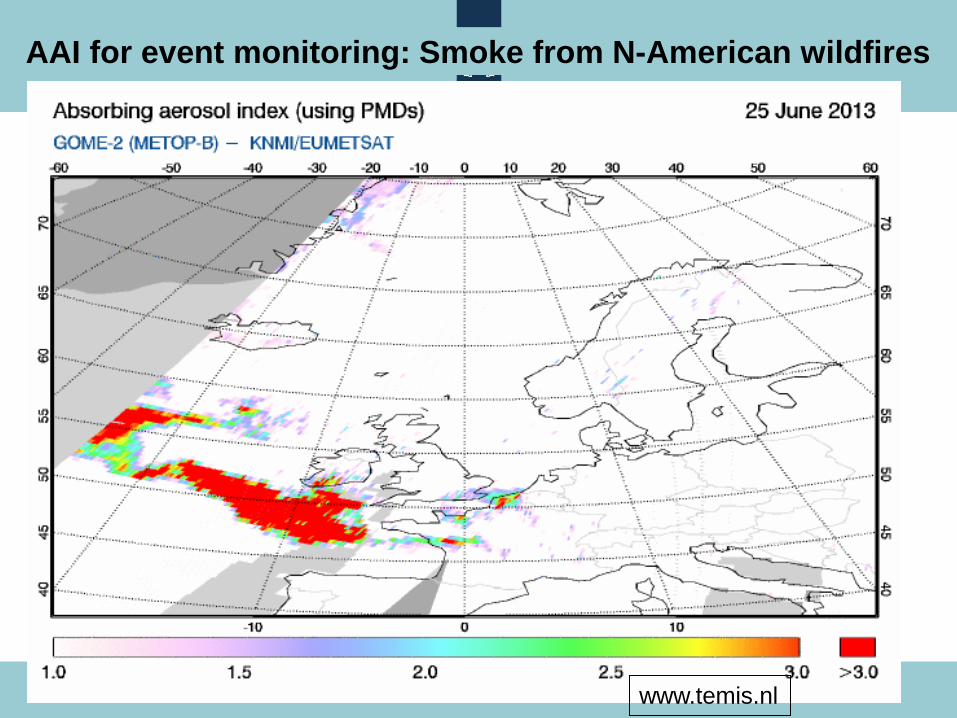
AAI for event monitoring: Smoke from N-American wildfires
www.temis.nl
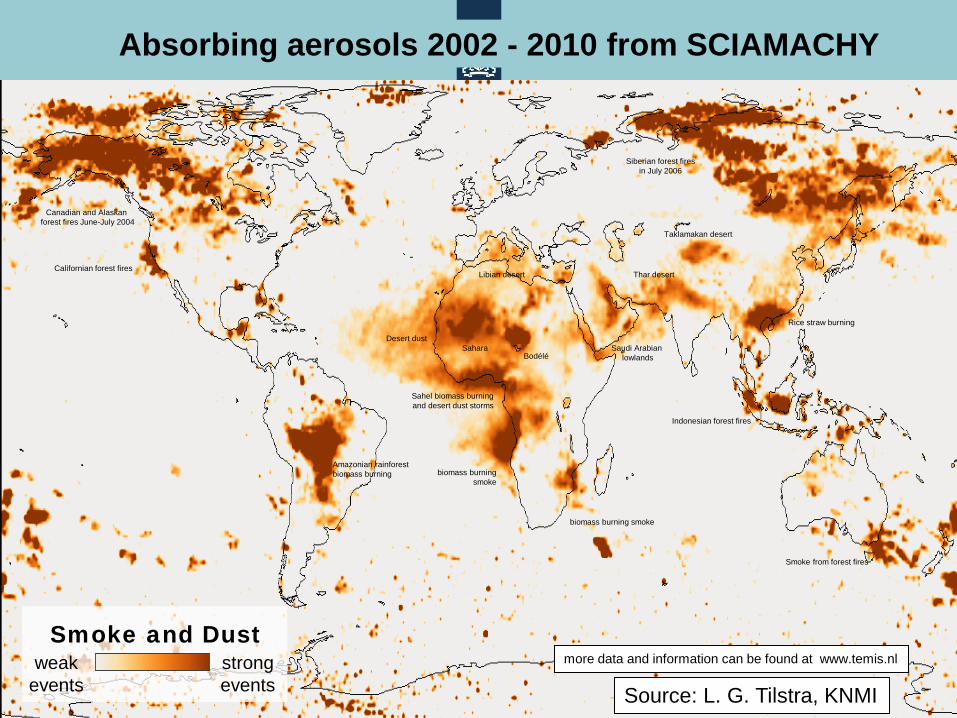
weak events
strong events
Smoke and Dust
Amazonian rainforest biomass burning
Sahel biomass burning and desert dust storms
Desert dust Sahara
Bodélé
Libian desert
Saudi Arabian lowlands
Thar desert
Taklamakan desert
Indonesian forest fires
Siberian forest fires in July 2006
Californian forest fires
Canadian and Alaskan forest fires June-July 2004
biomass burning smoke
Smoke from forest fires
Rice straw burning
biomass burning smoke
more data and information can be found at www.temis.nl
Absorbing aerosols 2002 - 2010 from SCIAMACHY
Source: L. G. Tilstra, KNMI
Prof. dr. P.F. Levelt, KNMI & TUD, AEROSAT, Hamburg, 27 September 2013
16
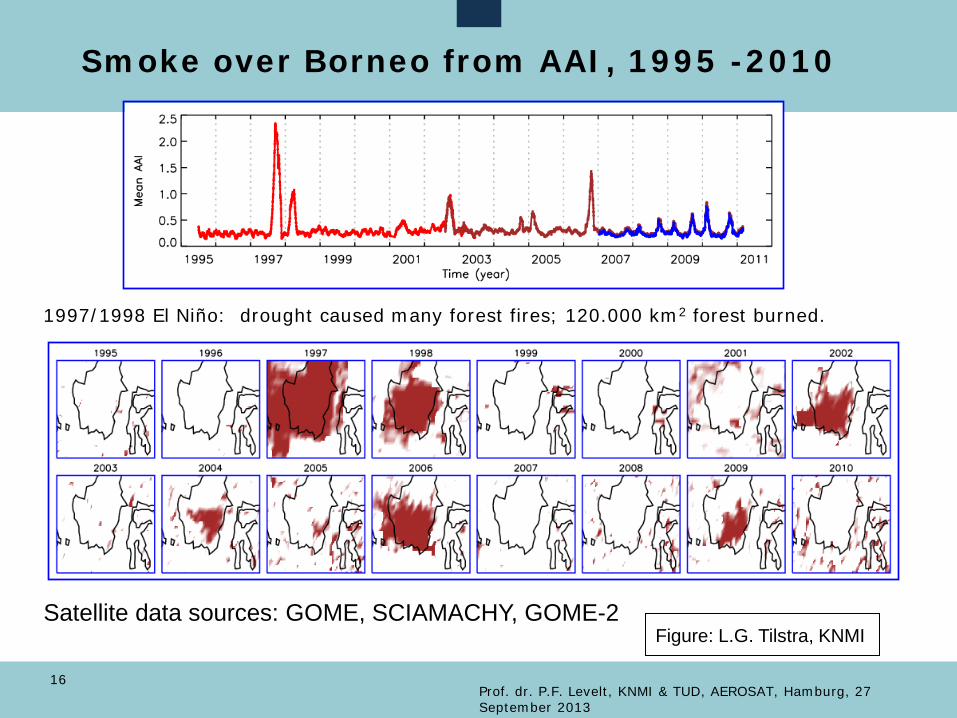
Smoke over Borneo from AAI, 1995 -2010
1997/1998 El Niño: drought caused many forest fires; 120.000 km2 forest burned.
Satellite data sources: GOME, SCIAMACHY, GOME-2 Figure: L.G. Tilstra, KNMI
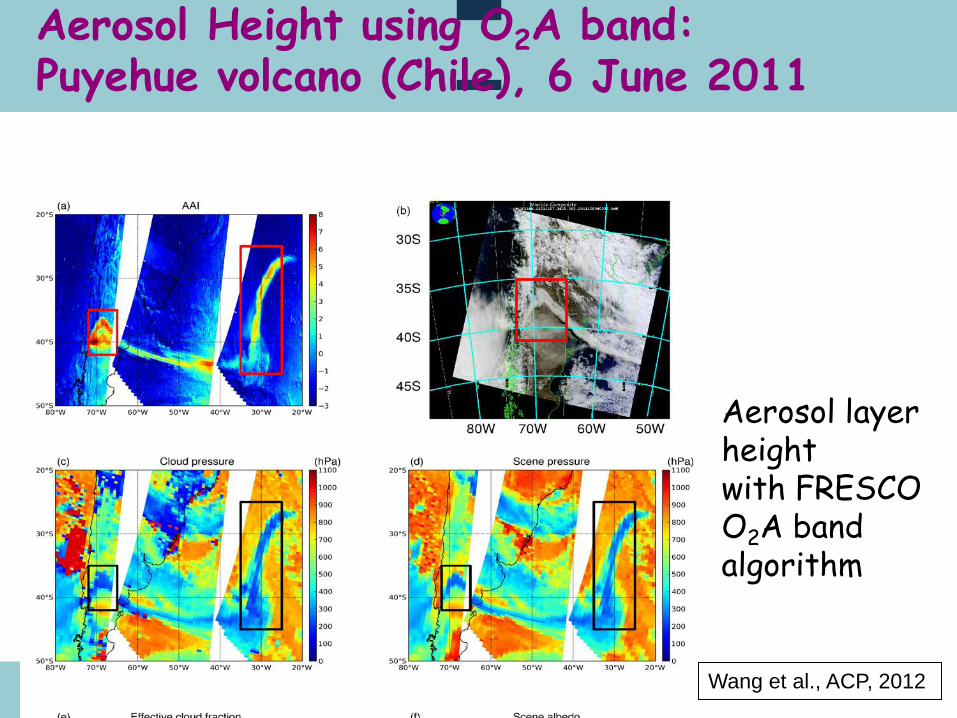
Aerosol Height using O2A band: Puyehue volcano (Chile), 6 June 2011
Aerosol layer height with FRESCO O2A band algorithm
Wang et al., ACP, 2012
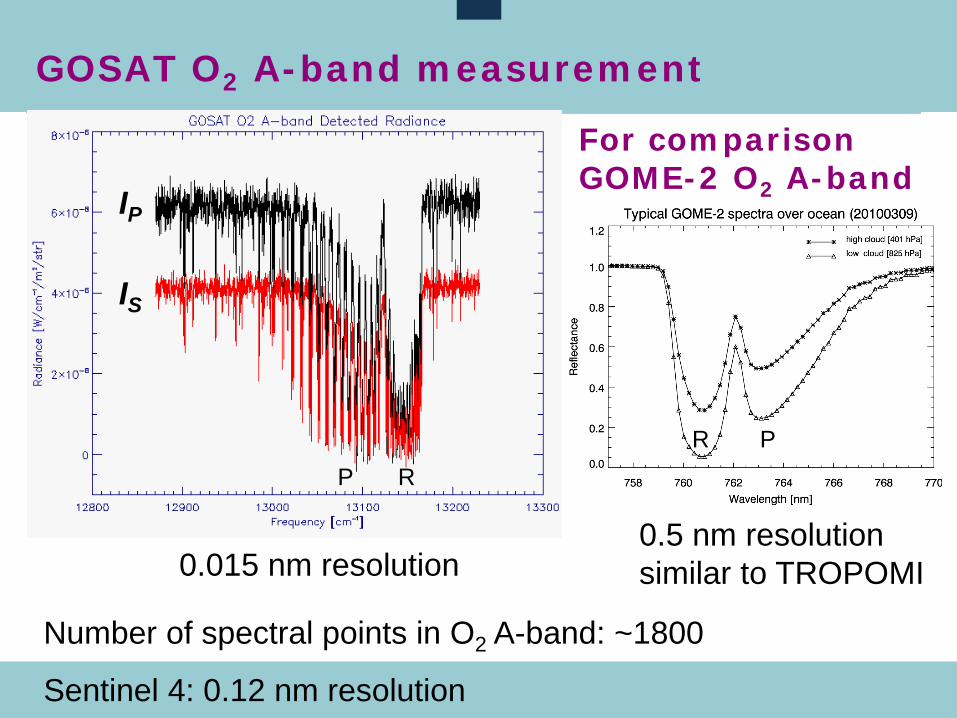
GOSAT O2 A-band measurement
IP
IS
For comparison GOME-2 O2 A-band
0.015 nm resolution 0.5 nm resolution similar to TROPOMI
R P R P
Number of spectral points in O2 A-band: ~1800
Sentinel 4: 0.12 nm resolution
De Graaf et al., JGR, 2012.
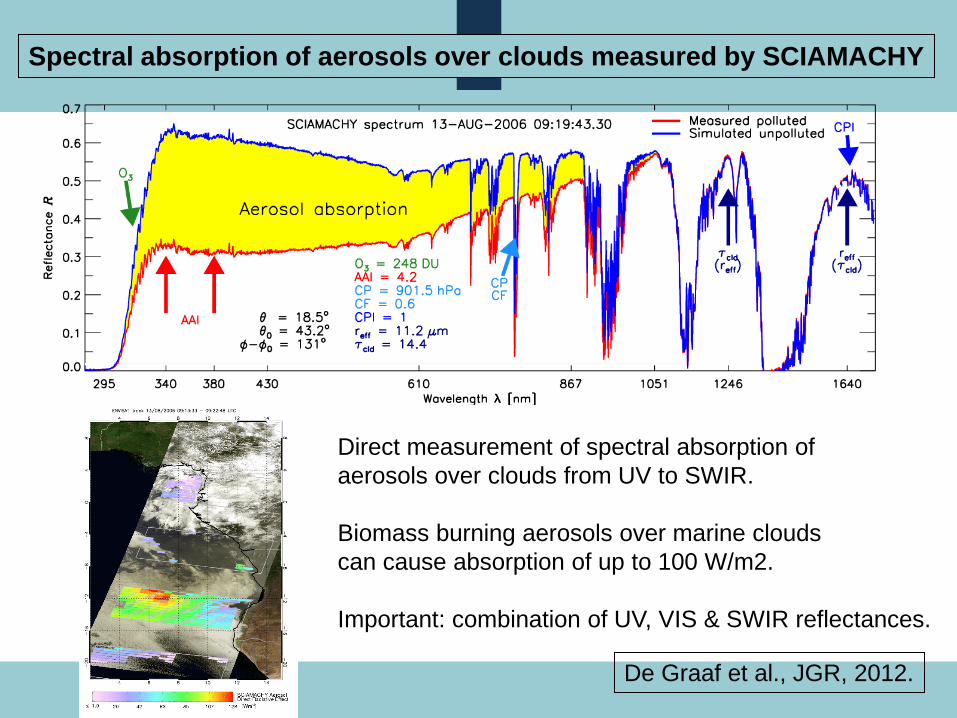
Spectral absorption of aerosols over clouds measured by SCIAMACHY
Direct measurement of spectral absorption of aerosols over clouds from UV to SWIR. Biomass burning aerosols over marine clouds can cause absorption of up to 100 W/m2. Important: combination of UV, VIS & SWIR reflectances.
20
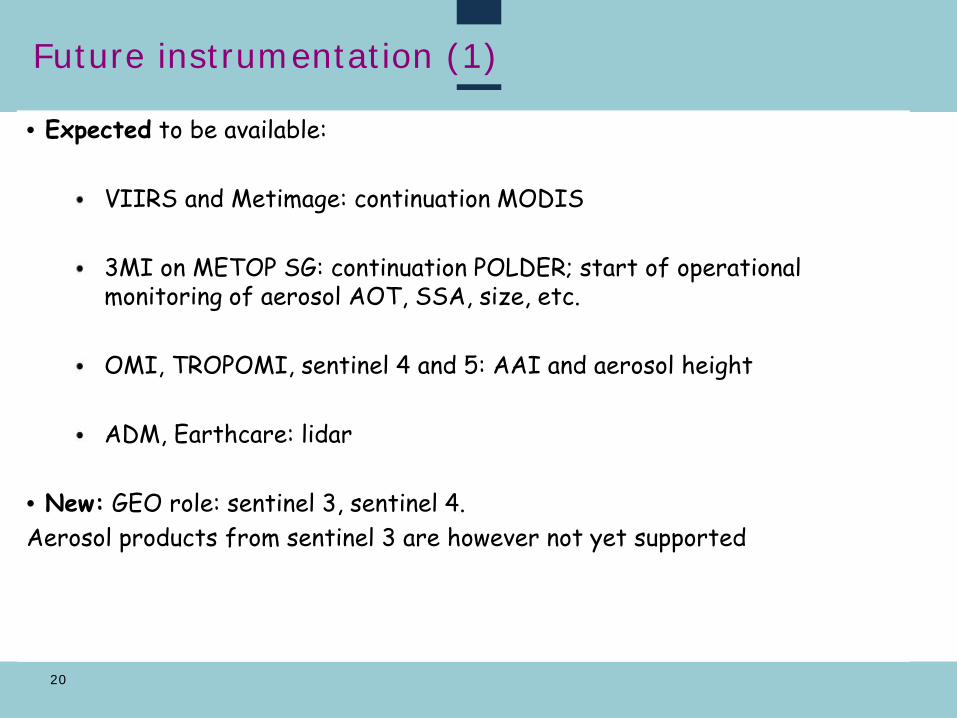
Future instrumentation (1)
• Expected to be available:
VIIRS and Metimage: continuation MODIS 3MI on METOP SG: continuation POLDER; start of operational monitoring of aerosol AOT, SSA, size, etc. OMI, TROPOMI, sentinel 4 and 5: AAI and aerosol height ADM, Earthcare: lidar
• New: GEO role: sentinel 3, sentinel 4. Aerosol products from sentinel 3 are however not yet supported
21
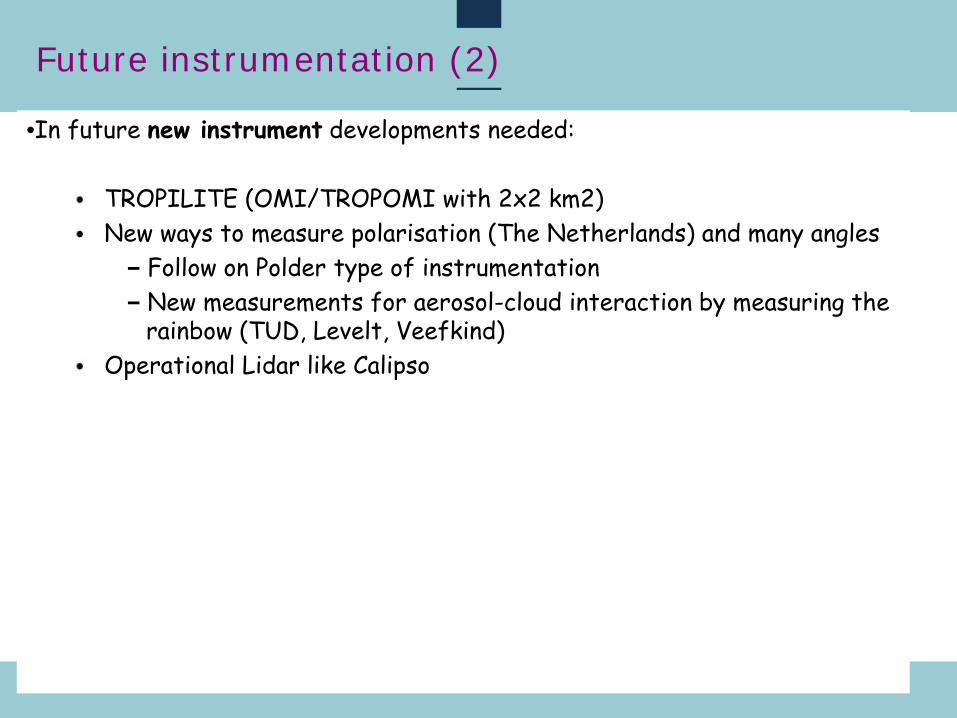
Future instrumentation (2)
•In future new instrument developments needed:
TROPILITE (OMI/TROPOMI with 2x2 km2) New ways to measure polarisation (The Netherlands) and many angles
Follow on Polder type of instrumentation New measurements for aerosol-cloud interaction by measuring the rainbow (TUD, Levelt, Veefkind)
Operational Lidar like Calipso
22
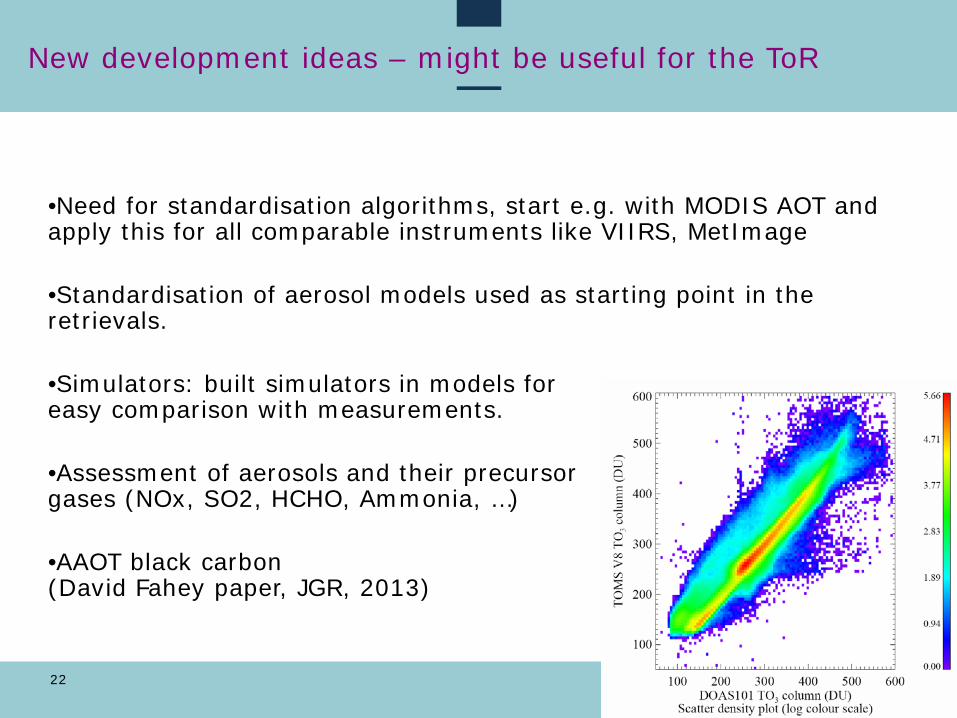
New development ideas – might be useful for the ToR
•Need for standardisation algorithms, start e.g. with MODIS AOT and apply this for all comparable instruments like VIIRS, MetImage
•Standardisation of aerosol models used as starting point in the retrievals.
•Simulators: built simulators in models for easy comparison with measurements.
•Assessment of aerosols and their precursor gases (NOx, SO2, HCHO, Ammonia, …)
•AAOT black carbon (David Fahey paper, JGR, 2013)
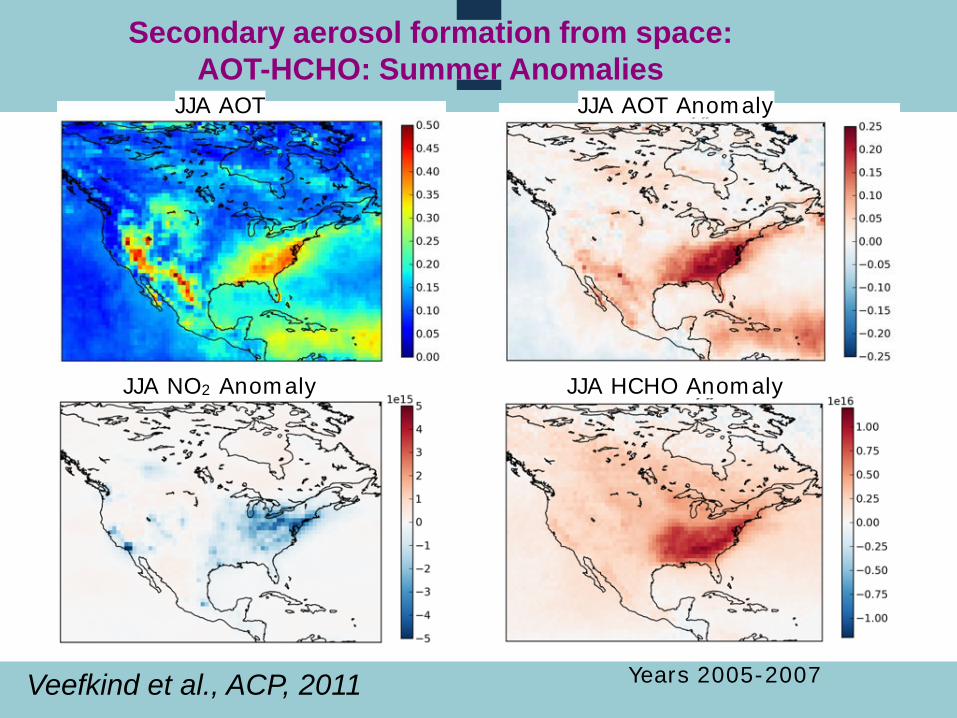
Secondary aerosol formation from space: AOT-HCHO: Summer Anomalies
Years 2005-2007
JJA AOT JJA AOT Anomaly
JJA NO2 Anomaly JJA HCHO Anomaly
Veefkind et al., ACP, 2011
24
Users
•Air quality community (EU MACC) •Climate community •Rerouting aviation (VAACs) •Assimilation of aerosols for atmospheric corrections (e.g. for land applications)

Thank you for your attention!
Prof. dr. P.F. Levelt, KNMI & TUD, EGU, Wenen, Auatria 11 April, 2013
26
backup
Nodig • Aerosol boomerang • O2A band plaatje van resultaat! Niet retrieval • Uitleg absorbing aerosols – AAI plaatje van Kopenhagen • Andere plaatjes Piet kan ik niet volgen • SPEX : noemen, ook ons eigen project noemen? • David Fahey boodschap
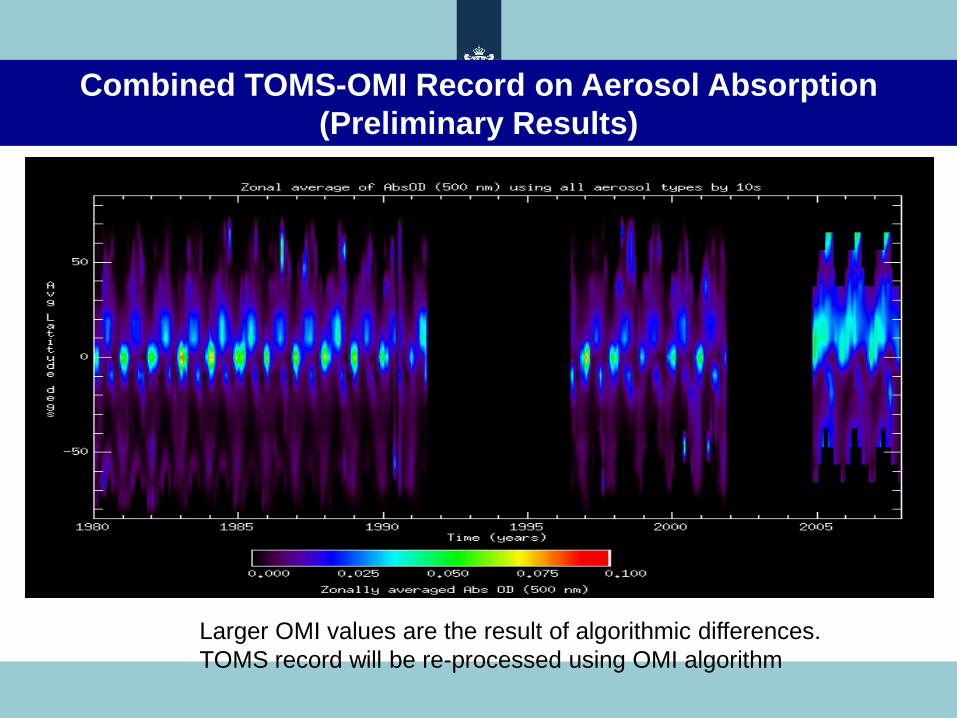
Combined TOMS-OMI Record on Aerosol Absorption (Preliminary Results)
Larger OMI values are the result of algorithmic differences. TOMS record will be re-processed using OMI algorithm
Prof. dr. P.F. Levelt, KNMI & TUD, EGU, Wenen, Auatria 11 April, 2013
29
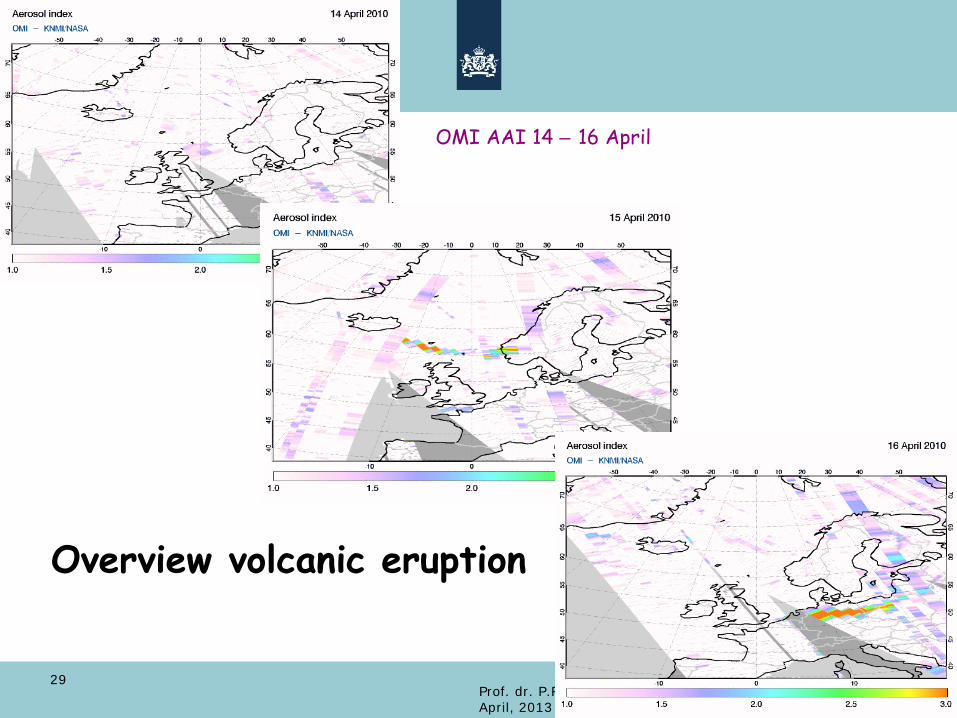
OMI AAI 14 – 16 April
Overview volcanic eruption
In December 2006 southeastern Australia suffered from severe forest fires. Using the OMI instrument we observed how a smoke plume released by these fires on 14 December rapidly crossed the Pacific and reached southern America only five days later. After passing south America the plume continued its journey over the Atlantic and the Indian Ocean to return to home base on 25 December, making it the first-time observation of rapid around-the-world transport in the extra-tropical southern hemisphere.
Dirksen, R. J., K. Folkert Boersma, J. de Laat, P. Stammes, G. R. van der Werf, M. Val Martin, and H. M. Kelder
(2009), An aerosol boomerang: Rapid around-the-world transport of smoke from the December 2006 Australian forest fires
observed from space, J. Geophys. Res., 114, D21201, doi:10.1029/2009JD012360.

Map of global tropospheric NO2, an important air pollutant and precursor of greenhouse gases and aerosols