Aerosol climatology over Japan site measured by ground-based sky ...
5
This document is downloaded at: 2018-04-07T10:36:59Z Title Aerosol climatology over Japan site measured by ground-based sky radiometer Author(s) Aoki, Kazuma; Takemura, Toshihiko; Kawamoto, Kazuaki; Hayasaka, Tadahiro Citation AIP Conference Proceedings, 1531, pp.284-287; 2013 Issue Date 2013 URL http://hdl.handle.net/10069/32863 Right © 2013 American Institute of Physics. This article may be downloaded for personal use only. Any other use requires prior permission of the author and the American Institute of Physics. The following article appeared in AIP Conference Proceedings, 1531, pp.284-287; 2013 and may be found at http://dx.doi.org/10.1063/1.4804762 NAOSITE: Nagasaki University's Academic Output SITE http://naosite.lb.nagasaki-u.ac.jp
Transcript of Aerosol climatology over Japan site measured by ground-based sky ...

This document is downloaded at: 2018-04-07T10:36:59Z
Title Aerosol climatology over Japan site measured by ground-based skyradiometer
Author(s) Aoki, Kazuma; Takemura, Toshihiko; Kawamoto, Kazuaki; Hayasaka,Tadahiro
Citation AIP Conference Proceedings, 1531, pp.284-287; 2013
Issue Date 2013
URL http://hdl.handle.net/10069/32863
Right
© 2013 American Institute of Physics. This article may be downloaded forpersonal use only. Any other use requires prior permission of the authorand the American Institute of Physics. The following article appeared inAIP Conference Proceedings, 1531, pp.284-287; 2013 and may be found athttp://dx.doi.org/10.1063/1.4804762
NAOSITE: Nagasaki University's Academic Output SITE
http://naosite.lb.nagasaki-u.ac.jp
Aerosol Climatology over Japan Site Measured by Ground-based Sky Radiometer
Kazuma Aokia, Toshihiko Takemurab, Kazuaki Kawamotoc and Tadahiro Hayasakad
aFaculty of Science, University of Toyama, 3190 Gofuku, Toyama 930-8555, Japan bRIAM, Kyushu University, 6-1 Kasuga-koen, Kasuga, Fukuoka 816-8580, Japan
cFaculty of Environmental Studies, Nagasaki University, 1-14 Bunkyo-cho, Nagasaki 852-8521, Japan dCOAS, Graduate School of Science, Tohoku University, 6-3 Aoba Aramakiaza, Aoba-ku, Sendai 980-8578, Japan
Abstract. Aerosol and cloud optical properties are studied using data from ground-based and ship-borne sky radiometer measurements in the world. We are seeking in this data information on the aerosol optical characteristics with respect to their temporal and spatial variability and validation of Satellite and numerical models. The aerosol optical thickness has clear temporal and spatial variability at six sites in Japan. Comparisons between aerosol optical thickness at 0.5 µm retrieved with a sky radiometer and SPRINTAS at six Japan sites. Model of all sky AOT500 is good correlation. But, model of clear sky AOT500C is not good correlation. We will confirm the trends of aerosol climatology and help explain the reason.
Keywords: Aerosol optical characteristics, Sky radiometer, SKYNET, SPRINTARS.
INTRODUCTION
Temporal and spatial variability of aerosol and cloud optical characteristics play important roles in the earth climate change [1]. A validation study was undertaken to assess the operationally retrieving the aerosol and cloud characteristics by using the ground-based measurements. For the purpose of solar direct and aureole observing, aerosol and cloud optical characteristics by using a Sky radiometer (POM series: PREDE Co. Ltd., Tokyo, Japan) on SKYNET observation network project (http://atmos.cr.chiba-u.ac.jp/). SKYNET is a grass roots effort to make an observation network of atmospheric radiation and related atmospheric parameter to help the analysis. These were studied using data from ground-based and ship-borne (on-board research vessel) sky radiometer measurements about sixty sites in the world [2, 3] (http://skyrad.sci.u-toyama.ac.jp/). The distributions of aerosol and/or cloud have been derived from earth observing satellite data (e.g. MODIS, GOSAT/CAI, CALIPSO) [4], and have been simulated in general circulation model (e.g. SPRINTARS) [5, 6], which assume optical parameters. However, these are difficult to derive because of temporal and spatial variability. Recent studies have shown that dust aerosols are transported one full circuit around the globe [7]. Osada et al. [8] observed wet deposition flux of mineral dust in Japan. They indicated that the temporal and spatial variations of Asian dust in Japanese six sites. Therefore, measurement of aerosol and cloud is necessary to validate. This study noted above underscore the important of long-term monitoring aerosol and cloud. We present the temporal and spatial variability of the aerosol optical properties in Japan site and the comparison of aerosol optical thickness from observation (sky radiometer) and model (SPRINTARS).
SKY RADIOMETER MEASUREMENTS
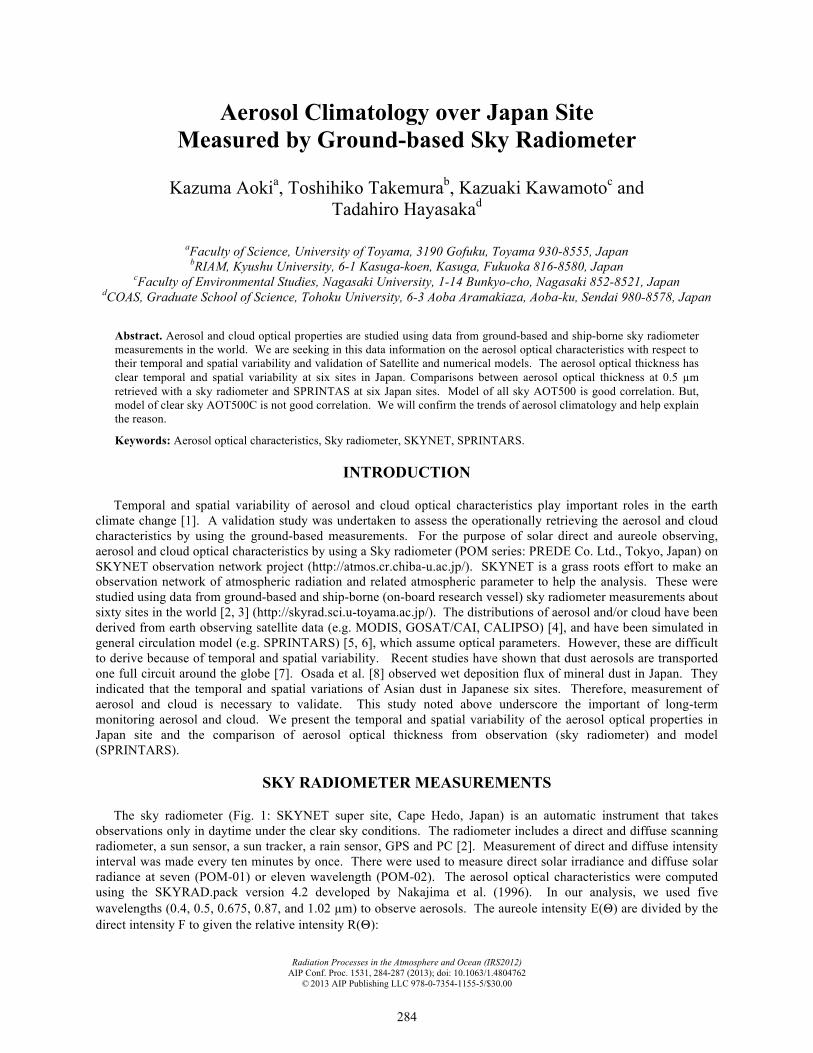
The sky radiometer (Fig. 1: SKYNET super site, Cape Hedo, Japan) is an automatic instrument that takes observations only in daytime under the clear sky conditions. The radiometer includes a direct and diffuse scanning radiometer, a sun sensor, a sun tracker, a rain sensor, GPS and PC [2]. Measurement of direct and diffuse intensity interval was made every ten minutes by once. There were used to measure direct solar irradiance and diffuse solar radiance at seven (POM-01) or eleven wavelength (POM-02). The aerosol optical characteristics were computed using the SKYRAD.pack version 4.2 developed by Nakajima et al. (1996). In our analysis, we used five wavelengths (0.4, 0.5, 0.675, 0.87, and 1.02 µm) to observe aerosols. The aureole intensity E(Θ) are divided by the direct intensity F to given the relative intensity R(Θ):
Radiation Processes in the Atmosphere and Ocean (IRS2012)AIP Conf. Proc. 1531, 284-287 (2013); doi: 10.1063/1.4804762
© 2013 AIP Publishing LLC 978-0-7354-1155-5/$30.00
284

R(Θ) ≡ E(Θ)
FmΔΩ=ωτP(Θ)+ q Θ( ) (1)
m is the optical air mass, ΔΩ is the solid view angle, ω is the single scattering albedo, τ is the optical thickness, P(Θ) is the total phase function, q(Θ) is multiple scattering parts. We used the ground albedo as 0.1 except for winter at Sapporo site (0.4: snow covered). In this study, we present the temporal and spatial variation and the relationship of Aerosol optical thickness at 0.5µm at Sapporo/Hokkaido (SPK: 43N08N, 141.34E), Toyama/Toyama (TOY: 36.70N, 137.19E), Kasuga/Fukuoka (KSG: 33.52N, 130.48E), Nagasaki/Nagasaki (NGS: 32.79N.129.87E), Fukue-jima/Nagasaki (FUJ: 32.75N, 128.68E) and Cape Hedo/Okinawa (CHD: 26.87N, 128.25E) at six Japan site.
FIGURE 1. Sky radiometers in Sapporo/Hokkaido (SPK: 43N08N, 141.34E), Toyama/Toyama (TOY: 36.70N, 137.19E), Kasuga/Fukuoka (KSG: 33.52N, 130.48E), Nagasaki/Nagasaki (NGS: 32.79N.129.87E), Fukue-jima/Nagasaki (FUJ: 32.75N,
128.68E) and Cape Hedo/Okinawa (CHD: 26.87N, 128.25E), Japan (left to right).
TEMPORAL AND SPATIAL VARIABILITY OFAEROSOL OPTICAL THICKNESS
The aerosol optical thickness was derived from direct and diffuse intensity measured with a sky radiometer at six Japan site. Figure 2 shows that the monthly mean of the aerosol optical thickness at 0.5 µm at Sapporo, Toyama, Kasuga, Nagasaki, Fukue-jima, and Cape hedo site during January 2008 to December 2010. The monthly mean of aerosol optical thickness at 0.5 µm shows seasonal cycle, with a spring to early summer maximum and autumn to winter minimum. Aoki and Fujiyoshi, (2003) showed that clearly seasonal cycle with maxima and minima appearing in spring and autumn to winter in the latter of 1990’s to early 2000’s. However, recently, we observed maximum at early summer. There was influence of anthropogenic aerosols. The monthly mean of aerosol optical thickness at 0.5 µm in Japan site decreased over a long-term monitoring at the observation site.
FIGURE 2. The monthly mean of the aerosol optical thickness at 0.5 µm at Sapporo, Toyama, Kasuga, Nagasaki, Fukue-jima, and Cape Hedo site during January 2008 to December 2010.
285

COMPARISON OF OPTICAL THICKNESS FROM OBSERVATION AND MODEL
By comparing observation (sky radiometer) with satellite and model (SPRINTARS) results, we can learn more about the long-term variation of the aerosol optical properties. For the better understanding of the aerosol optical properties shown in sky radiometer results of monthly mean were compared with those from SPRINTARS Model. Figure 3 shows comparison of monthly mean of aerosol optical thickness at 0.5 µm in Sapporo, Toyama, Kasuga, Nagasaki, Fukue-jima, and Cape Hedo during January 2008 to December 2010. AOT500_Sitename(site_code)_SP is aerosol optical thickness at 0.5 µm for all sky from SPRINTARS, AOT500C_Sitename_SP is aerosol optical thickness at 0.5 µm for clear sky from SPRINTARS, and AOT500_Sitename_SR is aerosol optical thickness at 0.5 µm for sky radiometer results with cloud screening at each observation site. Both results show the almost same seasonal cycle, AOT500_SP(SPRINTARS) was slightly smaller than AOT500_SR(ground-based: sky radiometer). However, there is a not good correlation with the model results. Because, direct comparison of observation results with model results is not possible. We observed only daytime under clear sky condition and other.
FIGURE 3. Comparison of monthly mean of aerosol optical thickness at 0.5 µm in Sapporo, Toyama, Kasuga, Nagasaki, Fukue-jima, and Cape Hedo during January 2008 to December 2010.
To confirm these trends and to help explain the reason for the difference, Figure 4 shows a comparison of the
monthly aerosol optical thickness at 0.5 µm at six sites for the monthly mean results during January 2008 to December 2010. Model of all sky (AOT500: left figure) is good correlation. However, Model of clear sky (AOT500C: right figure) is not good correlation. Especially, model of clear sky results were under estimate. Further the aerosol optical characteristics with sky radiometer will confirm the trends and help explain the reason.
286

FIGURE 4. A comparison of the monthly aerosol optical thickness at 0.5 µm at Sapporo, Toyama, Kasuga, Nagasaki, Fukue-jima, and Cape hedo site for the monthly mean results during January 2008 to December 2010.
SUMMARY
We examined aerosol optical properties comparisons between ground observations (sky radiometer) and numerical model (SPRINTARS) with respect to their temporal and spatial variability over Japan site. From the observation, we found that result is good temporal and spatial distribution. Furthermore, by comparing observation with model results, we can learn more about the long-term variation yielded the following conclusions: (1) The aerosol optical thickness has a clearly temporal and spatial variability at six Japan sites. (2) Comparison between observation and model of aerosol optical thickness at 0.5 µm. Model of all sky AOT500 is good correlation. However, model of clear sky AOT500C is not good correlation. We will confirm the trends and help explain the reason.
ACKNOWLEDGMENTS
We are grateful to the SKYNET for the data that they shared. This work was supported by Grant-in-Aid for Scientific Research (C: 22510008).
REFERENCES
1. International Panel on Climate Change (IPCC), Climate Change 2007, The Physical Science Basis, edited by S. Solomon et al., pp. 996, Cambridge University Press, New York (2007).
2. K. Aoki and Y. Fujiyoshi, J. Meteor. Soc. Japan 81, 493-513 (2003). 3. K. Aoki, Proceedings of SPIE 7027, doi: 10.1117/12.822504 (2008). 4. J. R. Campbell, J. S. Reid, D. L. Westphal, J. Zhang, J. L. Tackett, B. N. Chew, E. J. Welton, A. Shimizu, N. Sugimoto, K.
Aoki and D. M. Winker (2012), Characterizing Aerosol Optical Properties and Particle Composition over Southeast Asia and the Maritime Continent: The 2007-2009 View from CALIOP, Atmospheric Research in press.
5. T. Takemura, H. Okamoto, Y. Maruyama, A. Numaguti, A. Higurashi and T. Nakajima, J. Geophys. Res. 105, 17,853-17,873 (2000).
6. T. Takemura, T. Nozawa, S. Emori, T. Y. Nakajima and T. Nakajima, J. Geophys. Res. 110, D02202, doi:10.1029/2004 JD005029 (2005).
7. I. Uno, K. Eguchi, K. Yumimoto, T. Takemura, A. Shimizu, M. Uematsu, Z. Liu, Z. Wang, Y. Hara and N. Sugimoto, Nature Geoscience 2, DOI:10.1038/NGEO0583 (2009).
8. K. Osada, S. Ura, M. Kagawa, M. Mikami, T. Y. Tanaka, S. Matoba, K. Aoki, M. Shinoda, Y. Kurosaki, M. Hayashi, A. Shimizu and M. Uematsu, SOLA 7, 49-52, doi:10.2151/sola.2011-013 (2011).
9. T. Nakajima, G. Tonna, R. Rao, P. Boi, Y. Kaufman and B. Holben, Appl. Opt. 35, 2672-2686 (1996).
287