Aeromedical Causes of Accident Errors among Pilots and ...
20
67 Aeromedical Causes of Accident Errors among Pilots and Aircraft Engineers in Nigeria Andrew Egba Ubogu 1 Adedotun Joseph Adenigbo 2 * Ishaya Idris Akaaba 3 Abstract Errors in the aviation industry are considered among experts as major factors that cause accidents and incidents. This paper examines the aeromedical factors that account for incident or accident errors among pilots and aircraft engineers in Nigeria. The paper made use of data collected by administering questionnaires to randomly sampled respondents. A total of 300 questionnaires were administered to both pilots and aircraft engineers. Data were analysed using a combination of factor and multiple regression analyses. The extracted variables after factor rotation show that general health (78.20%) is the most significant cause of errors among air craft engineers. As regards pilots, disorientation (79.20%) was found as the most critical aeromedical cause of errors. The results of the multiple regression analysis show R = 0.651 for aircraft engineers and R = 0.607 for pilots. These findings reveal that aviation accidents and incidents arising from errors could be traceable to these aeromedical factors. The paper recommends that stringent enforcement of aeromedical conditions should be added to the licensing and recertification guidelines for aviation professionals so that accidents and incidents traceable to errors can be reduced to the barest minimum in the Nigeria aviation industry. Keywords: aeromedical factors, aviation accident, pilots, aircraft engineers, error 1 Department of Geography and Regional Planning, Federal University Dutsin-ma, Nigeria. 2 Department of Transport Management Technology, Federal University of Technology Akure, Nigeria. 3 Nigerian College of Aviation Technology, Zaria, Nigeria. *Corresponding author’s email: [email protected] Ghana Journal of Geography Vol. 10(2), 2018 pages 67 – 86 DOI: https://dx.doi.org/10.4314/gjg.v10i2.5
Transcript of Aeromedical Causes of Accident Errors among Pilots and ...

67
Aeromedical Causes of Accident Errors among Pilots and Aircraft Engineers in Nigeria
Andrew Egba Ubogu1
Adedotun Joseph Adenigbo2*
Ishaya Idris Akaaba3
AbstractErrors in the aviation industry are considered among experts as major factors that cause accidents and incidents. This paper examines the aeromedical factors that account for incident or accident errors among pilots and aircraft engineers in Nigeria. The paper made use of data collected by administering questionnaires to randomly sampled respondents. A total of 300 questionnaires were administered to both pilots and aircraft engineers. Data were analysed using a combination of factor and multiple regression analyses. The extracted variables after factor rotation show that general health (78.20%) is the most significant cause of errors among air craft engineers. As regards pilots, disorientation (79.20%) was found as the most critical aeromedical cause of errors. The results of the multiple regression analysis show R = 0.651 for aircraft engineers and R = 0.607 for pilots. These findings reveal that aviation accidents and incidents arising from errors could be traceable to these aeromedical factors. The paper recommends that stringent enforcement of aeromedical conditions should be added to the licensing and recertification guidelines for aviation professionals so that accidents and incidents traceable to errors can be reduced to the barest minimum in the Nigeria aviation industry.
Keywords: aeromedical factors, aviation accident, pilots, aircraft engineers, error
1Department of Geography and Regional Planning, Federal University Dutsin-ma, Nigeria.
2Department of Transport Management Technology, Federal University of Technology Akure, Nigeria.
3Nigerian College of Aviation Technology, Zaria, Nigeria.
*Corresponding author’s email: [email protected]
Ghana Journal of Geography Vol. 10(2), 2018 pages 67 – 86 DOI: https://dx.doi.org/10.4314/gjg.v10i2.5

68
IntroductionOne of the major threats to flight safety relates to the incapacitation of pilots (Newman, 2007) and aircraft engineers who are responsible for the technical functionality of aircrafts. Incapacitation is classified as subtle or sudden, partial or complete, and may result from the effects of a pre-existing medical condition, an acute medical condition or a physiological event (Newman.2007).
Improvements in the overall aviation industry are major factors for the advancement of safety in the technology and engineering of aircraft. The increasing demand for air transport across the world is connected to the safety assurance that is guaranteed over other modes. However, this demand will invariably put pressure on air transport operations, which may result in cases of aviation incidents and accidents. The rate of aviation accidents is a reflection of the safety level of the air transportation of a country. As a result, safety experts within the aviation community are constantly working towards an incident-free or accident-free flying environment (Houston, Walton & Conway, 2012). The industry has made vast improvements to reduce the rate of aviation incidents and accidents, although there is still much to be done to further advance safety in the industry (Wood & Sweginnis, 2007). The improvements were made via technology and development, and the implementation of several regulations and policies towards safe air transportation. Further efforts have been made by examining the causes of aircraft accidents, which have been the focus of many studies.
Since aircrafts have become more reliable, the major causes of aviation accidents may arise from human errors; this has led to the proposition of several human error frameworks and concepts, and many accident investigation guidelines. Despite the technological advancement recorded to improve aircraft operations, there are records of accidents around the world in recent times. This means the issues that contribute to aviation accidents are complex, and efforts to reduce such accidents must take cognizance of these factors. Human factors remain a constraint to aviation safety despite all the changes in technology to improve flight safety. This therefore calls for a further examination of errors culminating in accidents among personnel in the aviation industry in Nigeria. Errors may be due to the medical condition of personnel at the time of carrying out their duties. It goes without saying that errors will abound among personnel in the handling of aircraft with highly robotic and technological improvement if aeromedical factors negatively influence pilots and aircraft engineers.
The fundamental purpose of this paper is to examine the underlying aeromedical factors contributing to errors among pilots and aircraft engineers in Nigeria. The objective is to identify and examine the extent to which significant aeromedical factors contribute to accident errors, individually among pilots and aircraft engineers in the country. The aeromedical conditions are examined as variables capable of causing errors based on the responses of pilots and aircraft engineers surveyed. This is done in order to group the individual aeromedical conditions into factors so as to explain the weight of the variables that contribute to errors among aviation personnel and their implications for aviation safety in Nigeria.
This paper is prepared under six sections. Section 1 presents the introduction. Section 2 covers the review of literature. The description of data and methods for the study are presented in section 3. Section 4 deals with the results and discussion, section 5 policy recommendations and section 6 the conclusion of the study.
Ghana Journal of Geography Vol. 10(2), 2018 pages 67–86

69
Review of LiteratureMany scholars in Nigeria have attempted to study aviation safety in relation to accidents from different dimensions. Also, scholars from other countries of the world have conducted extensive studies into aviation safety. Stephens & Ukpere (2014) carried out an empirical analysis of the causes of air crashes from all over the world based on continental locations of accidents. Their results showed that certain continents have similar causes of air accidents, and they concluded that other continents have safer air transport than Asia and Africa. A study by Fadugba, Oluwajana, Busari & Oyedepo (2015) evaluated the safety of Nigerian air transport since 1960. The study showed that aviation accidents in Nigeria have increased per decade, with the highest record of 27 accidents occurring between 2000 and 2009. Weli & Ifediba (2014) took a different dimension, looking at the implications of poor weather conditions on flight operations for hazard management in Nigeria.
Furthermore, a research project conducted by Newman (2007) investigated the prevalence, type, nature and significance of in-flight medical conditions and incapacitation events occurring in civil aviation in Australia. The study stated that the incapacitation of a pilot due to a medical condition or a physiological impairment represents a serious potential threat to flight safety.
The contribution of human errors to aviation accidents has been found to be substantial in the overall rates of aircraft accidents worldwide. Errors arise as a result of wrong interpretation of a problem or the choice of a wrong course of action after an accurate picture of a situation has been established. Generally, the concept of the Human Factors Analysis and Classification System (HFACS) which was originally developed for military aviation has been used to analyse various accident data across the world. In the United States of America (USA), Wiegmann (2001) carried out a study for the United States Department of Transportation, Federal Aviation Administration, which analysed human errors in commercial aviation accidents using HFACS. The paper established that HFACS can serve as a viable tool for analysing commercial aviation accidents. In Australia, Inglis, Sutton & McRandle (2007) worked on human factor analysis of Australian aviation and compared it with the United States using HFACS. Similarly, Wiegmann et al, (2005) applied HFACS to general aviation accidents for the Federal Aviation Administration in a study of Atlantic City International Airport in New Jersey, United States of America. In Brazil, Fajer (2011) also applied HFACS to compare the results of aviation accident analyses performed by the Centre for Investigation and Prevention of Aviation Accidents (CENIPA) and concluded that CENIPA reports did not contemplate the organisational factors associated with aviation accidents.
Reason (1990) asserted that mistakes made by different actors in the aviation industry in turn create the conditions that promote the errors prevalent in the industry. A study by Lee (2009) argued that nowhere in life can errors be completely eliminated. Human errors may be behavioural or medically induced, and their negative consequences can decrease in three ways: through system design, training and personnel selection. The author then concluded that although personnel selection and training are extremely important factors, it is generally accepted that even the best-trained pilot and aircraft maintenance engineer, like all humans, are susceptible to errors. Human error can then be defined as inappropriate human behaviour that lowers levels of system effectiveness or safety, which may or may not result in an accident or injury (Wickens, Gordon & Liu, 1998). Indeed, a study by Moon, Kwang-Eui & Youn-Chul (2011) suggested that data obtained from
Aeromedical Causes of Accident Errors among Pilots and Aircraft Engineers

70
the Boeing Company for ten (10) years showed that of all commercial aircraft accidents within the period studied, 55% were caused by pilot errors, 17% by aircraft defects, 13% by adverse weather conditions, 5% by airport and air traffic control, 3% by maintenance personnel and 7% by miscellaneous matters. They therefore concluded that many of the causal factors that contribute to accidents can be viewed as different types of human errors. Nevertheless, the fact remains that almost all accidents do involve human error.
Reinhart (1996) proposed the aeromedical perspective of errors based on the principle that errors are merely the symptoms of underlying physiological or mental conditions such as illness or fatigue. This perspective argues that such conditions exist insidiously with the crew until environmental conditions trigger them, leading to their manifestation as errors. The author posited that being medically fit has a direct relationship with performance and aviation safety. Apart from the medical standards contained in the mandatory disqualification conditions which determine that an airman is safe to be licensed, there are other health and physiological factors that affect pilots’ and engineers’ performance. These aeromedical conditions can lead to in-flight emergencies. Some are minor while others are major. The major ones include hypoxia, sinus problems, stress, fatigue, motion sickness, decompression sickness and spatial disorientation. Incidentally, while military aviators and their flight physiologists take these aeromedical issues seriously, the seriousness of these issues has typically been minimized in civil aviation in Nigeria. Consequently, pilots and aircraft engineers may be downplaying the significance of these factors within the aviation industry. This paper intends to fill this gap in knowledge.
Data and Methods The study made use of primary data collected through questionnaires administered to pilots and aircraft engineers of airlines in Nigeria at the four major international airports in the country. The airports are Lagos airport, Abuja airport, Port-Harcourt airport, and Kano airport. The study collected the total population of registered pilots and aircraft engineers in Nigeria, which was 1053 and 937 for pilots and aircraft engineers respectively. A sample size of 150 was taken for each group of respondents to represent 14.2 percent and 16 percent respectively for pilots and engineers. The adequacy of the sample size for the study was determined following Hair, Anderson, Tatham, and Black (1995), cited in Williams, Brown and Onsman (2010), who stated that a population of this nature should have a sample size of 100 or more. The distribution of the respondents by airline (aircraft engineers and pilots) from the questionnaire administration is presented in Tables 1 and 2 respectively. The questionnaires were designed to elicit information from the respondents on the subject matter. The distribution of the questionnaires was done randomly among the respondents irrespective of the airline they work for, although the response from the questionnaires included such details, as presented in Tables 1 and 2.
Ghana Journal of Geography Vol. 10(2), 2018 pages 67–86

71
Table 1: Distribution of Questionnaires to Aircraft Engineers by Airlines S/N Airlines Number Percent1. Aero Contractor 37 24.73. Allied Air 19 12.74. Arik Air 17 11.32. Associated Air 8 5.35. Bristow Aviation 3 26. Capital Air 2 1.37. Chanchangi 8 5.38. Dana Air 12 89. IRS Airline 2 1.310. JT TEHA 1 0.711. Max-air 1 0.712. Medview 17 11.313. NCAT, Zaria 16 10.714. Nings Aviation 1 0.715. Overland Air 6 4 Total
150 100
Source: Authors’ Field Survey 2017
Table 2: Distribution of Questionnaires to Pilots by Airlines S/N Airlines Number Percent1. Aero Contractors 35 23.32. Allied 8 5.3 3. Arik 28 18.64. Associated Airlines 9 65. Briston 12 86. Chanchangi 8 5.37. Dana Air 9 68. Dornier 9 69. IRS 5 3.310. Max Air 3 211. Medview 5 3.312. NCAT 8 5.313. Overland 8 5.314. Wing Aviation 3 3.3 Total
150 100
Source: Authors’ Field Survey 2017
The distribution of the questionnaires at the four major international airports in Nigeria is presented in Table 3. It shows that more of the questionnaires were administered to pilots and aircraft engineers at Lagos airport than at the other airports. This emphasizes the fact that Lagos airport remains the major hub of air transport operations in Nigeria.
Aeromedical Causes of Accident Errors among Pilots and Aircraft Engineers

72
Table 3: Distribution of Questionnaires by Airport Airport Respondents Pilots EngineersLagos 110 57 53Abuja 64 34 30Kano 66 33 33
Port-Harcourt 60 26 34
300 150 150
Source: Authors’ Field Survey 2017
The study employed a combination of stratified and simple random sampling techniques to collect data with the aid of research assistants. The stratified method was used to ensure that the questionnaires were distributed among the sub populations of the respondents, that is, pilots and aircraft engineers operating across the four major international airports in Nigeria. The random sampling was used to ensure that each respondent had an equal chance of being sampled. The information in the questionnaires was presented in a way that required respondents to indicate the weight they attached to the aeromedical causes of aviation accidents in Nigeria.
The research tool was constructed on a 5-point Likert Scale to allow a wide measurement of the degree of pilots’ and engineers’ opinions of each aeromedical condition presented in the questionnaires. These items include memory mind-set, general health, sensory acuity, fatigue, sleep deprivation, self-prescribed medication, doctor’s prescribed medication, circadian dysrhythmia (jet lag), drug/alcohol ingestion, disorientation, motion sickness, hypoxia, stress, reaction time, and trapped gasses. The variables were tabulated for the respondents to rank them in order of significance from 1 (the most significant) to 5 (the least significant), as each contributes to errors on the part of pilots and aircraft engineers in aviation related operations in Nigeria.
A combination of factor analysis (FA) and multiple linear regression was employed as techniques for data analysis. The aim of FA was to reduce the variables to a few orthogonal ones that could be used to explain the major aeromedical conditions that account for aviation accidents in Nigeria from the operational viewpoint of pilots and aircraft maintenance engineers. Furthermore, FA also measures the extent of the contribution of the few variables to accidents among pilots and aircraft engineers. The FA was used to highlight the most significant factors (with eigenvalue greater than 1) contributing to aviation accidents as a result of aeromedical conditions of pilots and aircraft engineers. The main purpose of FA is to determine the number of factors needed that can adequately describe the correlations between the observed variables and to estimate how the factor is related to each observed variable by determining the factor loading (Oyesiku, 2000). This study adopted the notation of FA presented by Okoko (2001) as;
F = W1X1 + W2X2 + … WnXnwhere,
W1 – Wn = Factor weights
X1 - Xn = original variables
The computation of the values of W and X are done by the computer to generate the correlation matrix. The
Ghana Journal of Geography Vol. 10(2), 2018 pages 67–86
73
communalities as a major output of factor analysis indicate the amount of variance in each variable that is accounted for by the FA. Communalities estimates give the initial and extracted values of the variance in each variable accounted for by the factors in the factor solution. For this study, values less than 0.400 at extraction are said to be small and indicate variables that do not fit well with the factor solution, and which therefore should possibly be dropped from the analysis. The estimates of communalities are computed by taking the sum of the squared loadings for each variable.
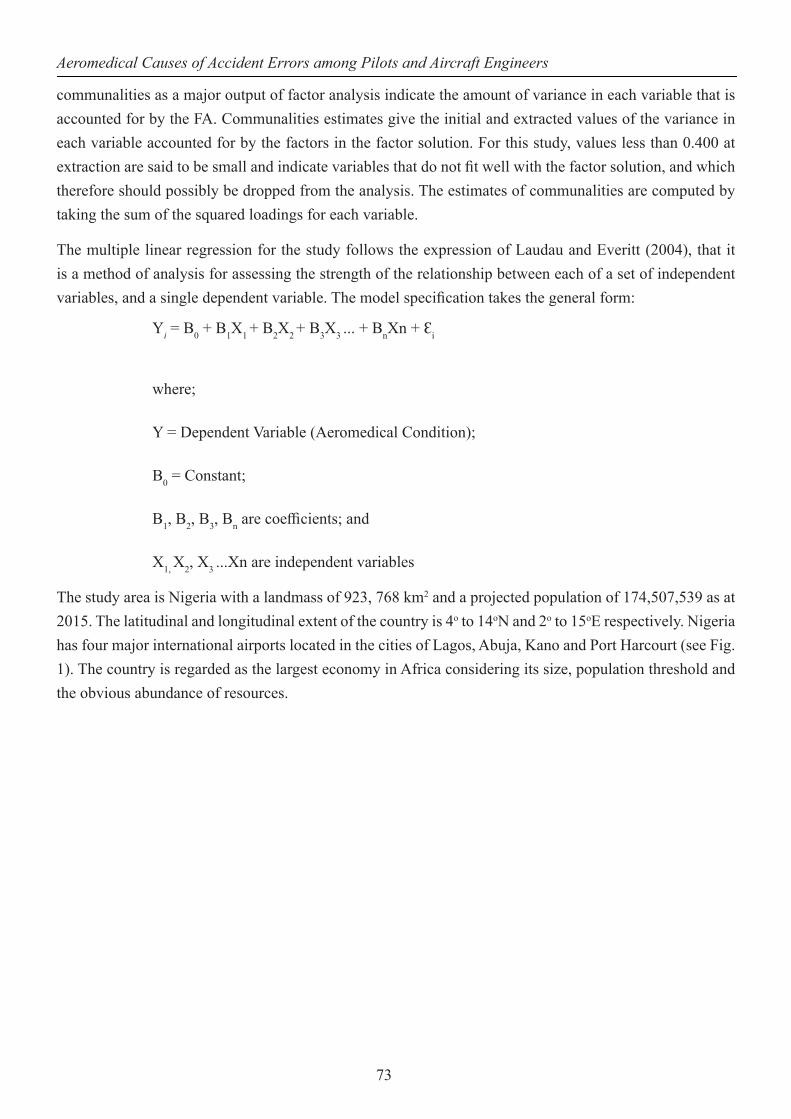
The multiple linear regression for the study follows the expression of Laudau and Everitt (2004), that it is a method of analysis for assessing the strength of the relationship between each of a set of independent variables, and a single dependent variable. The model specification takes the general form:
Yi = B0 + B1X1 + B2X2 + B3X3 ... + BnXn + Ɛi
where;
Y = Dependent Variable (Aeromedical Condition);
B0 = Constant;
B1, B2, B3, Bn are coefficients; and
X1, X2, X3 ...Xn are independent variables
The study area is Nigeria with a landmass of 923, 768 km2 and a projected population of 174,507,539 as at 2015. The latitudinal and longitudinal extent of the country is 4o to 14oN and 2o to 15oE respectively. Nigeria has four major international airports located in the cities of Lagos, Abuja, Kano and Port Harcourt (see Fig. 1). The country is regarded as the largest economy in Africa considering its size, population threshold and the obvious abundance of resources.
Aeromedical Causes of Accident Errors among Pilots and Aircraft Engineers

74
Source: Adapted and modified from Airport map of Nigeria 2017
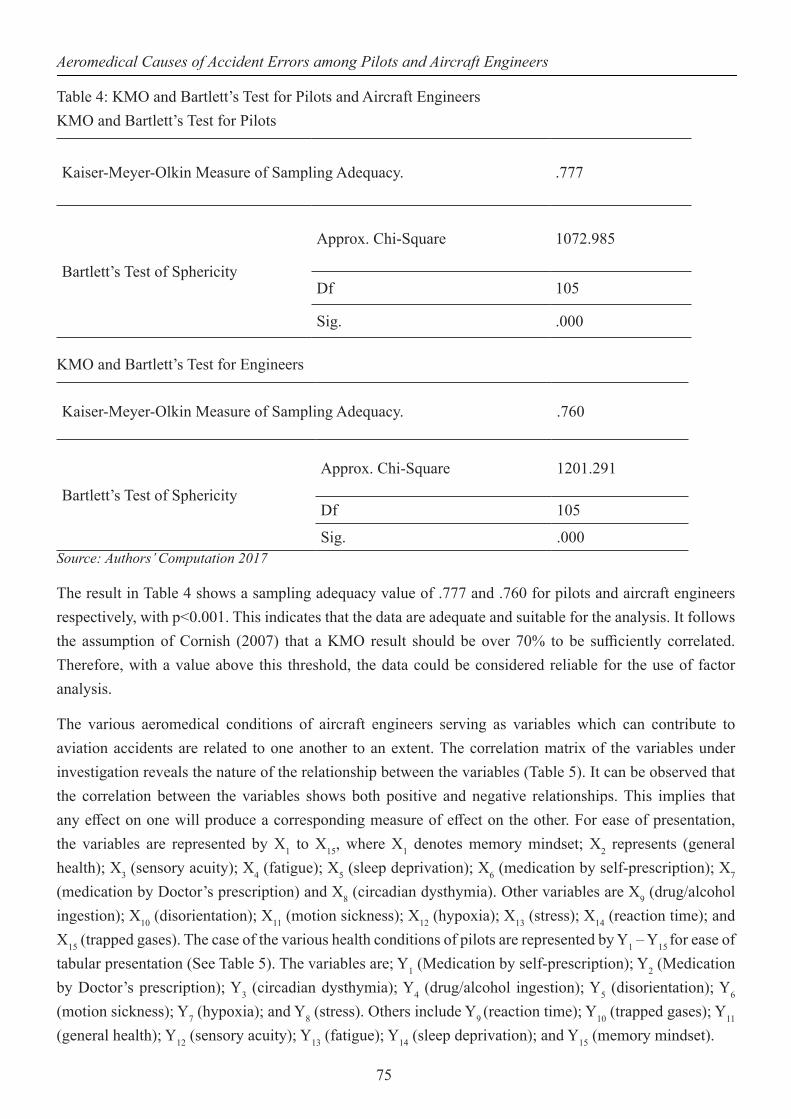
Results and DiscussionIn spite of the general medical conditions stipulated in the standard health conditions for the licensing of airmen, various medical-related variables have a direct influence on one’s ability to coordinate and function optimally while carrying out a task. In order to examine this influence, it is important to subject the data set to a test of suitability and adequacy. The prime purpose of this test is to assess the suitability of the data and its internal consistency using the Kaiser-Meyer-Olkin (KMO) measure of sample adequacy and the Bartlett test of sphericity (See Table 4). These tests were employed based on the requirement of the data reduction technique prior to factor extraction as suggested by Williams et al. (2010). The importance of the test is to verify whether the samples were adequate to meet the assumptions of the use of factor analysis.
Ghana Journal of Geography Vol. 10(2), 2018 pages 67–86
75
Table 4: KMO and Bartlett’s Test for Pilots and Aircraft EngineersKMO and Bartlett’s Test for Pilots
Kaiser-Meyer-Olkin Measure of Sampling Adequacy. .777
Bartlett’s Test of Sphericity
Approx. Chi-Square 1072.985
Df 105
Sig. .000
KMO and Bartlett’s Test for Engineers
Kaiser-Meyer-Olkin Measure of Sampling Adequacy. .760
Bartlett’s Test of Sphericity
Approx. Chi-Square 1201.291
Df 105
Sig. .000Source: Authors’ Computation 2017
The result in Table 4 shows a sampling adequacy value of .777 and .760 for pilots and aircraft engineers respectively, with p<0.001. This indicates that the data are adequate and suitable for the analysis. It follows the assumption of Cornish (2007) that a KMO result should be over 70% to be sufficiently correlated. Therefore, with a value above this threshold, the data could be considered reliable for the use of factor analysis.
The various aeromedical conditions of aircraft engineers serving as variables which can contribute to aviation accidents are related to one another to an extent. The correlation matrix of the variables under investigation reveals the nature of the relationship between the variables (Table 5). It can be observed that the correlation between the variables shows both positive and negative relationships. This implies that any effect on one will produce a corresponding measure of effect on the other. For ease of presentation, the variables are represented by X1 to X15, where X1 denotes memory mindset; X2 represents (general health); X3 (sensory acuity); X4 (fatigue); X5 (sleep deprivation); X6 (medication by self-prescription); X7 (medication by Doctor’s prescription) and X8 (circadian dysthymia). Other variables are X9 (drug/alcohol ingestion); X10 (disorientation); X11 (motion sickness); X12 (hypoxia); X13 (stress); X14 (reaction time); and X15 (trapped gases). The case of the various health conditions of pilots are represented by Y1 – Y15 for ease of tabular presentation (See Table 5). The variables are; Y1 (Medication by self-prescription); Y2 (Medication by Doctor’s prescription); Y3 (circadian dysthymia); Y4 (drug/alcohol ingestion); Y5 (disorientation); Y6 (motion sickness); Y7 (hypoxia); and Y8 (stress). Others include Y9 (reaction time); Y10 (trapped gases); Y11 (general health); Y12 (sensory acuity); Y13 (fatigue); Y14 (sleep deprivation); and Y15 (memory mindset).
Aeromedical Causes of Accident Errors among Pilots and Aircraft Engineers

76
Table 5: Correlation Matrix for Aircraft Engineers’ Aeromedical ConditionsX1 X2 X3 X4 X5 X6 X7 X8 X9 X10 X11 X12 X13 X14 X15
X1 1.000
X2 .379 1.000
X3 .503 .777 1.000
X4 .384 .569 .585 1.000
X5 .322 .841 .696 .567 1.000
X6 .342 .583 .412 .370 .456 1.000
X7 -.106 .580 .487 .354 .447 .235 1.000
X8 .236 .215 .262 .065 .223 .113 -.085 1.000
X9 -.237 .249 .057 .075 .239 .454 .268 -.070 1.000
X10 -.204 .003 -.013 -.115 .031 .310 .147 .016 .565 1.000
X11 -.150 .208 .061 .208 .240 .251 .378 .074 .381 .322 1.000
X12 .048 .645 .575 .277 .574 .316 .594 .348 .258 .198 .146 1.000
X13 .042 .470 .196 .140 .468 .400 .247 .099 .425 .288 .284 .433 1.000
X14 -.002 .158 .161 .162 .124 .223 .164 .156 .154 .292 .330 .344 .179 1.000
X15 .336 .391 .449 .394 .307 .295 .082 .251 .034 -.054 .025 .197 -.007 .334 1.000
Source: Authors’ Computation 2017
The result presented in Table 5 shows that the strongest correlated pair of variables are sleep deprivation (X5) and general health (X2) with r = 0.841. This is followed by sensory acuity (X3) and general health (X2) with r = 0.777, sleep deprivation and fatigue (r = 0.696), and hypoxia with general health (r = 0.645). Other variables that are considered to have strong relationships are those with r ≥ 0.500. A further look at Table 5 shows that general health (X2) has a strong and positive relationship with six other health conditions of aircraft engineers. The health conditions are X3, X4, X5, X6, X7, and X12. This indicates that the general health condition of aircraft engineers is considerably influenced by sensory acuity, fatigue, sleep deprivation, doctors’ prescribed medication and hypoxia. Three of the health conditions related to sensory acuity (X3) include fatigue (X4 with r = .585), sleep deprivation (X5 with r = .696), and hypoxia (X12 with r = .575). The influence of hypoxia on general health of aircraft engineers (r = .645), sensory acuity (r = .575), sleep deprivation (r = .574), and doctor’s prescribed medication (r = .594) indicates the risk that sensory acuity as a health condition of aircraft engineers could contribute to errors that can lead to aviation accidents.
A perusal of Table 6 shows that fatigue (Y13) has the most significant relationship with other health conditions. These health conditions are drug/alcohol ingestion (r = .634), stress (r = .587), reaction time (r = .549), trapped gases (r = .512), general health (r = .611), and sensory acuity (r = .512). The significant relationship between fatigue and drug/alcohol (r = .634) and stress (r = .587) shows that the effect of drug/alcohol often results in fatigue and emotional pressure, which are prime contributors to errors by pilots.
Ghana Journal of Geography Vol. 10(2), 2018 pages 67–86

77
Table 6: Correlation Matrix for Pilots’ Aeromedical ConditionsY1 Y2 Y3 Y 4 Y 5 Y 6 Y 7 Y 8 Y 9 Y 10 Y 11 Y 12 Y 13 Y 14 Y 15
Y1 1.000
Y2 .318 1.000
Y3 -.020 .031 1.000
Y4 .030 -.092 .267 1.000
Y5 .129 -.026 .132 .541 1.000
Y6 .188 .181 .487 .413 .088 1.000
Y7 .049 -.131 .071 .452 .413 .233 1.000
Y8 .139 -.084 .402 .429 .209 .433 .269 1.000
Y9 -.074 -.288 .367 .450 .511 .128 .409 .339 1.000
Y10 -.112 -.129 .394 .391 .137 .524 .186 .402 .205 1.000
Y11 -.005 -.098 .656 .514 .198 .620 .214 .471 .362 .628 1.000
Y12 .186 .075 .332 .313 .103 .313 .205 .478 .206 .163 .372 1.000
Y13 .031 -.285 .273 .634 .458 .343 .319 .587 .549 .512 .611 .512 1.000
Y14 .197 -.023 .172 .607 .550 .281 .408 .391 .391 .426 .468 .356 .621 1.000
Y15 .315 -.094 .259 .090 -.093 .302 -.111 .361 .102 .167 .289 .333 .337 .143 1.000
Source: Authors’ Computation 2017
It should also be noted from Table 6 that the extent of the relationship that general health has with other health conditions such as circadian dysrhythmia (r = 0.635), drug/alcohol ingestion (r = .514), motion sickness (r = .620), and trapped gases ( r = .628) makes it a significant health condition of pilots that may lead to errors with significant implications for aviation accidents.
Table 7: Total Variance of Aircraft Engineers’ Health Condition ExplainedFactor Initial Eigenvalues Extraction Sums of Squared
LoadingsRotation Sums of Squared Loadings
Total % of Variance
Cumulative %
Total % of Variance
Cumulative %
Total % of Variance
Cumulative %
1 5.168 34.456 34.456 4.893 32.621 32.621 3.341 22.272 22.2722 2.434 16.224 50.680 2.002 13.346 45.967 2.192 14.610 36.8823 1.338 8.917 59.597 .963 6.418 52.384 1.594 10.626 47.5084 1.143 7.620 67.217 .774 5.159 57.543 1.272 8.477 55.9855 1.075 7.169 74.386 .624 4.159 61.702 .857 5.716 61.7026 .776 5.176 79.5627 .650 4.336 83.8978 .586 3.904 87.8019 .429 2.862 90.66310 .391 2.609 93.27211 .300 1.998 95.27012 .277 1.849 97.11913 .178 1.185 98.30414 .162 1.081 99.38515 .092 .615 100.000Extraction Method: Principal Axis Factoring.
Source: Authors’ Computation 2017
The total variance of the health conditions of aircraft engineers explained is presented in Table 7. The result indicates that the percentage of the total variance accounted for by the factor analysis shows five variables
Aeromedical Causes of Accident Errors among Pilots and Aircraft Engineers

78
with eigenvalues greater than 1. The percentage of total variance explained indicates that factor one has an eigenvalue of 5.168, accounting for 34.5% of the total variance explained by the analysis. Similarly, factor two reveals an eigenvalue of 2.434, thereby accounting for 16.2%. Factor 3 has an eigenvalue of 1.338, accounting for 8.9%. Factors 4 and 5 with eigenvalues of 1.143 and 1.075 accounted for 7.6% and 7.2% respectively. The significance of these factor loadings provides a clear indication of the underlying dimensions of the perception of aeromedical conditions by aircraft engineers as contributory factors to errors that could result into aviation incidents/accidents in Nigeria. In all, the variables have been reduced to five major factors with eigenvalues greater than 1.00. These are the dominant loadings for each factor. These eigenvalues are the proportion of the total variation of the data set that is explained or at best summarized by the factors. The cumulative percentage of the variance revealed that the five main factors alone account for 74.4% of the health conditions that contribute to aviation accidents in Nigeria, according to aircraft engineers.
Table 8: Total Variance of Pilots’ Health Condition ExplainedFactor Initial Eigenvalues Extraction Sums of Squared
LoadingsRotation Sums of Squared Loadings
Total % of Variance
Cumulative %
Total % of Variance
Cumulative %
Total % of Variance
Cumulative %
1 5.397 35.979 35.979 5.003 33.350 33.350 2.961 19.738 19.7382 1.959 13.058 49.037 1.511 10.076 43.426 2.726 18.172 37.9093 1.535 10.232 59.269 1.064 7.093 50.519 1.566 10.437 48.3464 1.204 8.030 67.298 .776 5.174 55.693 1.102 7.347 55.693
5 .858 5.723 73.021
6 .768 5.123 78.144
7 .700 4.668 82.812
8 .492 3.282 86.094
9 .454 3.028 89.122
10 .388 2.586 91.707
11 .333 2.222 93.929
12 .310 2.065 95.995
13 .250 1.667 97.661
14 .232 1.549 99.210
15 .118 .790 100.000Extraction Method: Principal Axis Factoring.
Source: Authors’ Computation 2017
The total variance explained by the pilots’ data set is shown in Table 8. Unlike the total variance from the aircraft engineers’ data set, the total variance explained by pilots’ view of aeromedical conditions indicates that four factors with eigenvalues greater than 1 were extracted. Cumulatively, this accounts for 67.29%. Factor 1 shows an eigenvalue of 5.397 that accounts for 35.98%. Factor 2 has an eigenvalue of 1.959 accounting for 13.05%. Similarly, the eigenvalues of Factor 3 (1.535) and Factor 4 (1.204) accounted for 10.23% and 8.03% respectively.
The issue under consideration requires that attempts must be made to identify the variables that can be used to explain the underlying dimensions of the major factors in line with the suggestions of Laudau and
Ghana Journal of Geography Vol. 10(2), 2018 pages 67–86
79
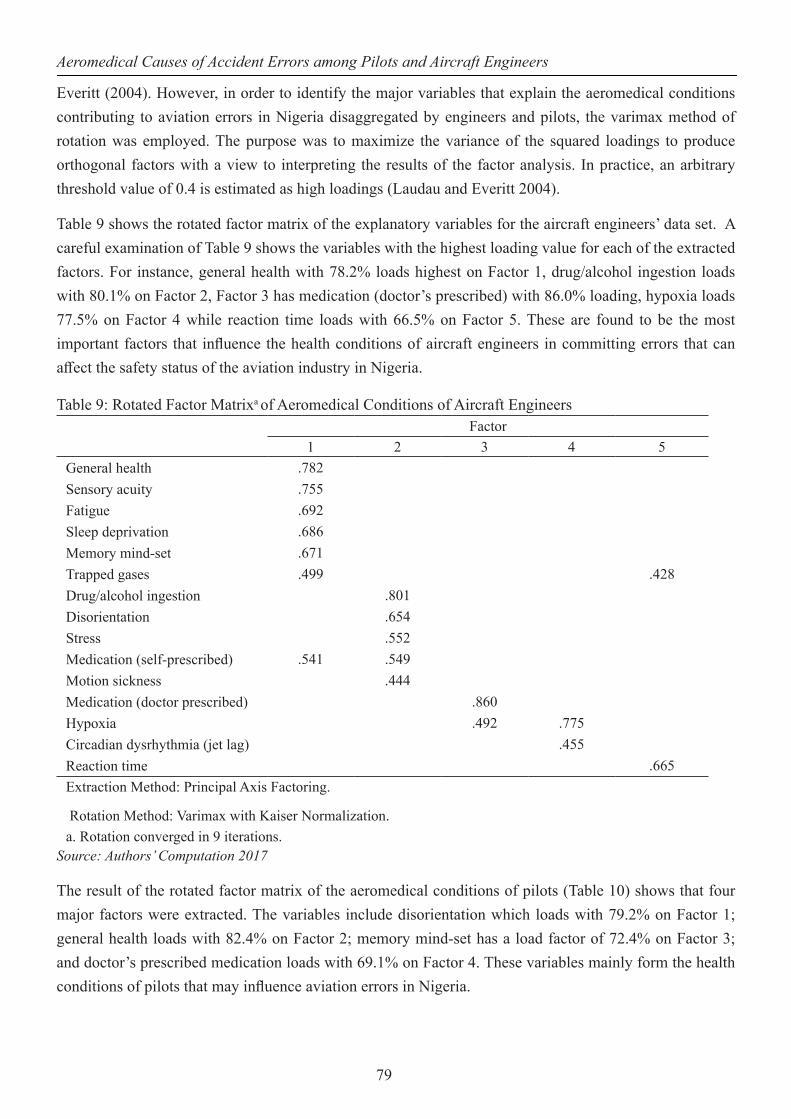
Everitt (2004). However, in order to identify the major variables that explain the aeromedical conditions contributing to aviation errors in Nigeria disaggregated by engineers and pilots, the varimax method of rotation was employed. The purpose was to maximize the variance of the squared loadings to produce orthogonal factors with a view to interpreting the results of the factor analysis. In practice, an arbitrary threshold value of 0.4 is estimated as high loadings (Laudau and Everitt 2004).
Table 9 shows the rotated factor matrix of the explanatory variables for the aircraft engineers’ data set. A careful examination of Table 9 shows the variables with the highest loading value for each of the extracted factors. For instance, general health with 78.2% loads highest on Factor 1, drug/alcohol ingestion loads with 80.1% on Factor 2, Factor 3 has medication (doctor’s prescribed) with 86.0% loading, hypoxia loads 77.5% on Factor 4 while reaction time loads with 66.5% on Factor 5. These are found to be the most important factors that influence the health conditions of aircraft engineers in committing errors that can affect the safety status of the aviation industry in Nigeria.
Table 9: Rotated Factor Matrixa of Aeromedical Conditions of Aircraft EngineersFactor
1 2 3 4 5General health .782Sensory acuity .755Fatigue .692Sleep deprivation .686Memory mind-set .671Trapped gases .499 .428Drug/alcohol ingestion .801Disorientation .654Stress .552Medication (self-prescribed) .541 .549Motion sickness .444Medication (doctor prescribed) .860Hypoxia .492 .775Circadian dysrhythmia (jet lag) .455Reaction time .665Extraction Method: Principal Axis Factoring.
Rotation Method: Varimax with Kaiser Normalization.a. Rotation converged in 9 iterations.
Source: Authors’ Computation 2017
The result of the rotated factor matrix of the aeromedical conditions of pilots (Table 10) shows that four major factors were extracted. The variables include disorientation which loads with 79.2% on Factor 1; general health loads with 82.4% on Factor 2; memory mind-set has a load factor of 72.4% on Factor 3; and doctor’s prescribed medication loads with 69.1% on Factor 4. These variables mainly form the health conditions of pilots that may influence aviation errors in Nigeria.
Aeromedical Causes of Accident Errors among Pilots and Aircraft Engineers

80
Table 10: Rotated Factor Matrixa of Aeromedical Conditions of PilotsFactor
1 2 3 4Disorientation .792
Drug/alcohol ingestion .693
Sleep deprivation .693
Fatigue .613 .481
Hypoxia .573
Reaction time .573
General health .824
Motion sickness .731
Trapped gases .653
Circadian dysrhythmia (jet lag) .634
Memory mind-set .724
Sensory acuity .475
Stress .421 .460
Medication (doctor prescribed) .691
Medication (self-prescribed) .415 .560
Extraction Method: Principal Axis Factoring.
Rotation Method: Varimax with Kaiser Normalization.a. Rotation converged in 6 iterations.
Source: Authors’ Computation 2017
It is important to state that the major contributors to operational errors among aircraft engineers and pilots differ to a certain degree. The general health condition of an aircraft engineer and the effect of drug/alcohol ingestion, doctor’s prescribed medication, hypoxia and reaction time, contribute to the causation of errors in the operational performance of aircraft maintenance engineers. The pilots’ data set extracted significant aeromedical variables like disorientation, general health, memory mindset and doctors’ prescribed medication as prime causes of errors in the aviation industry. As a consequence, the effectiveness and efficiency of vital decisions by airmen will be grossly affected. For instance, one of the critical health contributors of operational mistakes reported by pilots was disorientation, which indicates the state of the brain, as it is a reflection of the loss of sense of time, place, person and date. Disorientation usually manifests itself in a certain degree of confusion or incomprehension, and this could ultimately lead to panic. The consequence of these symptoms is usually operational errors that have catastrophic outcomes.
The most significant variables from both aircraft engineers’ and pilots’ responses identified by factor analysis were subjected to regression analysis to determine the extent of their contribution to aviation errors. For aircraft engineers, the aeromedical conditions are general health; drug/alcohol ingestion; medication prescribed by doctors; hypoxia and reaction time serve as independent variables, with aeromedical conditions serving as dependent variable. For pilots, the aeromedical conditions are motion sickness, disorientation, medication prescribed by doctors and memory mindset.
Ghana Journal of Geography Vol. 10(2), 2018 pages 67–86

81
The coefficient of aircraft engineers’ aeromedical conditions presented in Table 11 shows the estimates of the regression coefficient, standard errors of the estimates, t-tests showing that a coefficient takes the value zero, and confidence intervals, alongside the collinearity statistics of Tolerance and VIF. The estimated coefficients presented as ‘Unstandardized Coefficients B’ give each of the explanatory variables, the predicted change in the dependent variable when each explanatory variable is increased by one unit, on condition that all the other variables in the model remain constant. It therefore shows that the aeromedical conditions of aircraft engineers tend to be increasing by 30.3% and 35.3% for every additional score in general health and doctor’s prescribed medication respectively. The negative relationship indicates a decrease by 42.9%, 26.1% and 12.6% for every additional score on the influence of drug/alcohol ingestion, hypoxia and reaction time respectively (See Table 11). It further shows that only reaction time is found not to be significant at p = 0.05.
Table 11: Coefficient of Aircraft Engineers Aeromedical ConditionsModel Unstandardized
CoefficientsStandardized Coefficients
T Sig. Collinearity Statistics
B Std. Error
Beta Tolerance VIF
1
(Constant) 2.513 .150 16.719 .000
General health .303 .067 .401 4.557 .000 .518 1.931Drug/alcohol ingestion -.429 .056 -.512 -7.686 .000 .902 1.109Medication (doctor prescribed)
.353 .091 .326 3.895 .000 .572 1.747
Hypoxia -.261 .070 -.346 -3.715 .000 .460 2.173Reaction time -.126 .068 -.126 -1.861 .065 .867 1.153
a. Dependent Variable: Aeromedical ConditionSource: Authors’ Computation 2017
The VIF statistics is presented to measure the level of multicollinearity in the model. The VIF values of all the variables are greater than 1 and less than 10. The Tolerance values of the variables are also greater than 0.1. Therefore, the VIF and Tolerance of the analysis indicate some correlations which are not enough to raise concerns; that is, a minimal level of multicollinearity may exist in the model.
Table 12 presents an ANOVA result providing an F-Test equal to 21.171 when the explanatory variables are set at zero. The result shows F(5,144) = 21, p = 0.001, from which it can be concluded that the independent variables (reaction time, drug/alcohol ingestion, general health, medication by doctor’s prescription and hypoxia) significantly contribute to errors arising from the aeromedical conditions of aircraft engineers in Nigeria.
Table 12: ANOVA of Aircraft Engineers Aeromedical ConditionsModel Sum of Squares Df Mean Square F Sig.
1Regression 65.868 5 13.174 21.171 .000b
Residual 89.605 144 .622Total 155.473 149
a. Dependent Variable: Aeromedical Conditionb. Predictors: (Constant), Reaction time, Drug/alcohol ingestion, General health, Medication (doctor prescribed), Hypoxia
Source: Authors’ Computation 2016
Aeromedical Causes of Accident Errors among Pilots and Aircraft Engineers

82
Table 13 presents the model summary of the multiple linear regression analysis in order to assess the strength of the relationship between the independent variables and the dependent variable. It further shows the model correlation coefficient (R), its square (R2), and an adjusted version of this coefficient as summary measures of model fit. The multiple correlation coefficient (R = 0.651) predicts that there is a strong correlation in the relationships between and within the independent variables of reaction time, drug/alcohol ingestion, general health, medication (doctor’s prescribed), and hypoxia, and the dependent variable of aeromedical condition.
Table 13: Model Summary of Aircraft Engineers’ Aeromedical ConditionModel R R Square Adjusted R Square Std. Error of the
Estimate1 .651a .424 .404 .78883
a. Predictors: (Constant), Reaction time, Drug/alcohol ingestion, General health, Medication (doctor prescribed), Hypoxia
Source: Authors’ Computation 2017
The R2 value showing 0.424 indicates that the variables can explain 42.4% of the variance in the aeromedical conditions of aircraft engineers to contribute to errors of aviation accidents. In other words, 42.4% of the variance in the aeromedical conditions can be explained by the contributions of reaction time, drug/alcohol ingestion, general health, medication (doctor prescribed), and hypoxia. Since, by definition, R2 will increase when further terms are added to the model, even if this does not explain variability in the population, the adjusted R2 is an attempt at improving the estimation of R2 in the population. The index is adjusted down to compensate for the chance increase in R2, with bigger adjustments for larger sets of explanatory variables. The use of this adjusted measure leads to a revised estimate that 40.4% of the variability of the aeromedical conditions of aircraft engineers in Nigeria can be explained by the three explanatory variables. The R2 can be considered to be low because it is an estimate of the psychology of aircraft engineers surveyed, which supports the difficulty of accurately measuring human feeling. It is expected that R2 value for psychology studies will be lower than in other studies.
Table 14 presents the coefficient of pilots’ aeromedical conditions to show the estimates of the regression coefficient, standard errors of the estimates, t-tests which verify that a coefficient takes the value zero, and confidence intervals as well as the collinearity statistics of Tolerance and VIF values. The estimated coefficients presented as ‘Unstandardized Coefficients B’ give each of the explanatory variables the predicted change in the dependent variable when each explanatory variable is increased by one unit, on condition that all the other variables in the model remain constant. It therefore shows that the aeromedical conditions of pilots tend to be increasing by 41.4% and 40.9% for every additional score in disorientation and motion sickness respectively. The negative relationship indicates a decrease by 11.1% and 5.0% for every additional score on the influence of memory mindset and doctor’s prescribed medication respectively (See Table 14). It further shows that disorientation and motion sickness are significant at p<0.001. This indicates the seriousness of the contributions of disorientation to aviation accidents and supports the claim of Cutler (2017) that 5 – 10% of general aviation accidents result from spatial disorientation.
Ghana Journal of Geography Vol. 10(2), 2018 pages 67–86

83
Table 14: Coefficient of Pilot Aeromedical ConditionsModel Unstandardized
CoefficientsStandardized Coefficients
T Sig. Collinearity Statistics
B Std. Error
Beta Tolerance VIF
1
(Constant) .528 .261 2.020 .045
Memory mind-set -.111 .070 -.112 -1.586 .115 .870 1.149Medication (doctor
prescribed)-.005 .072 -.004 -.065 .948 .939 1.064
Disorientation .414 .069 .403 6.020 .000 .973 1.028Motion sickness .409 .068 .430 6.000 .000 .849 1.177
a. Dependent Variable: Aeromedical ConditionSource: Authors’ Computation 2017
Similarly, the VIF statistics is presented to measure the level of multicollinearity in the analysis. VIF values for the variables greater than 1 but even less than 1.5 imply that multicollinearity is not a matter of concern in the buildup of the model.
Table 15 shows the ANOVA result with an F-Test equal to 21.144 when the explanatory variables are set at zero. The result shows F (4,145) = 21, p<0.001, where a conclusion can be drawn that the independent variables [motion sickness, disorientation, medication (doctor prescribed), and memory mind-set] significantly contribute to errors due to aeromedical conditions of pilots, and hence, can result in aviation accidents in Nigeria.
Table 15: ANOVA of Pilots Aeromedical ConditionsModel Sum of Squares df Mean Square F Sig.
1
Regression 55.014 4 13.754 21.144 .000b
Residual 94.319 145 .650
Total 149.333 149
a. Dependent Variable: Aeromedical Conditionb. Predictors: (Constant), Motion sickness, Disorientation, Medication (doctor prescribed), Memory mind-set
Source: Authors’ Computation 2017
Table 16 presents the model summary of the multiple linear regression analysis for pilots’ aeromedical conditions in order to assess the strength of the relationship between the independent variables and the dependent variable. It further shows the model correlation coefficient (R), its square (R2), and an adjusted version of this coefficient as summary measures of model fit. The multiple correlation coefficient (R = 0.607) predicts that there is a strong correlation in the relationships between and within the independent variables of motion sickness, disorientation, medication (doctor prescribed) and memory mindset, and the dependent variable of aeromedical conditions.
Aeromedical Causes of Accident Errors among Pilots and Aircraft Engineers

84
Table 16: Model Summary of Aircraft Engineers’ Aeromedical ConditionsModel R R Square Adjusted R Square Std. Error of the Estimate
1 .607a .368 .351 .80652
a. Predictors: (Constant), Motion sickness, Disorientation, Medication (doctor prescribed), Memory mind-set
Source: Authors’ Computation 2017
The R2 value showing 0.368 indicates that the variables can explain 36.8% of the variance in the aeromedical conditions of pilots. This implies that 36.8% of the variance in the aeromedical conditions of pilots can be explained by the influence of motion sickness, disorientation, medication (doctor prescribed), and memory mindset, which contribute to errors among pilots. The adjusted R2 is an attempt at improving the estimation of R2 in the population. The index is adjusted down to compensate for the chance increase in R2, with bigger adjustments for larger sets of explanatory variables. The Adjusted R2 indicates 35.1% of the variance in the variables, which explains that aeromedical conditions of pilots contribute to accident errors in Nigeria.
Policy RecommendationsThe perceived unsafe nature of the airspace in Nigeria is a concern that needs to be given adequate attention with a view to reducing the rate of aviation errors across the country. The various professionals in the aviation sector of Nigeria need to be awakened to their duties and accept the responsibility of ensuring the overall safety of the industry. Aviation professionals need to facilitate safe air transport at all cost with zero percent room for errors. This should be done in a way that gives the highest possible attention to the aeromedical conditions of pilots and aircrafts engineers. Doing so will ensure that pilots and aircraft engineers are always in their right frame of mind to work professionally without a chance for errors. There is the need for the government to draw up a health policy that will streamline the peculiarities of the working environment of maintenance engineers and pilots. Furthermore, it is essential that stringent enforcement of aeromedical conditions such as taking drugs as prescribed by doctors are incorporated into the licensing and decertification guidelines for aviation professionals. Such regulation will go a long way to reduce to the barest minimum avoidable incidents/accidents that are traceable to errors as a result of one or two aeromedical conditions. The air transport industry, being a sensitive and safety conscious industry, requires that all its personnel must be in the right frame of mind both physically and psychologically. Therefore, apart from routine medical fitness tests, other relevant psychosocial and physiological tests should be regularly conducted on aviation personnel to ascertain their overall fitness as needed in the industry.
Airlines should ensure that aircraft is not solely assigned to young pilots who are yet to completely overcome the syndrome of motion sickness. This issue should be handled with care so that young pilots will not be denied the opportunity to garner experience. The issue with disorientation among pilots requires that the civil aviation authority in Nigeria obligates pilots to constantly develop the skills to fly with instruments as technology advances.
Ghana Journal of Geography Vol. 10(2), 2018 pages 67–86
85
Conclusion This study has examined the various aeromedical conditions that can contribute to operational errors, and as a result, lead to the occurrence of aviation accidents in Nigeria. The study subjected 15 aeromedical conditions to factor analysis for pilots and aircraft engineers. It found that general health condition, drugs/alcohol intake, hypoxia, doctor’s prescribed medications, and reaction time were the most significant aeromedical conditions of aircraft engineers that lead to operational errors. In contrast, disorientation, motion sickness, memory mindset and doctor’s prescribed medications are the four most critical forms of aeromedical condition among pilots that cause operational errors in Nigeria’s aviation industry. These aeromedical conditions were further subjected to regression analysis separately for aircraft engineers and pilots. The analysis established that general health, drugs/alcohol ingestion, hypoxia and doctor’s prescribed medication were significant at p<0.001 for aircraft engineers, while disorientation and motion sickness were significant at p<0.001 for pilots.
AcknowledgementsThe authors are grateful to the pilots and aircraft engineers who were surveyed for the study.
ReferencesCutler C. (2017). 6 Ways Pilots get confused in the cloud – How to prevent it. Bolmethod www.boldmethod.
com
Cornish, K., 2007. Statistics: Factor Analysis. Mathematics Learning Support Centre.
http://mlsc.lboro.ac.uk/resources/statistics/Factoranalysis.pdf.
Fadugba O. G., Oluwajana S. D., Busari A. A. and Oyedepo O. J. (2015). Post-Independence evaluation of air transport safety in Nigeria. European International Journal of Science and Technology Vol. 4 No. 4 April. ISSN: 2304-9693 www.eijst.org.uk
Fajer M. (2011). Contributive factors to aviation accidents. Rev Saude Publica 45(2). Article Available from: www.scielo.br/rsp
Hair J, Anderson R. E, Tatham R. L, Black W.C. (1995). Multivariate data analysis. 4th ed. New Jersey: Prentice-Hall Inc.
Houston S. J., Walton R. O. and Conway B. A. (2012). Analysis of general aviation i n s t r u c t i o n a l loss of control accidents. Journal of Aviation/Aerospace Education and Research, 22 (1) 35 – 49.
Inglis M, Sutton J. and McRandle, B. (2007). Human factor analysis of Australian aviation accidents and comparison with the United States. Australian Transport Safety Bureau. www.atsb..gov.au. Report No B2004/0321.
Laudau S and Everitt B. (2004). A Handbook of Statistical Analyses using SPSS. New York: Chapman and Hall/CRC Press.
Lee, C. A. (2009). Human errors in aviation. http://carrielee.net/pdfs/HumanError.pdf Assessed 27/1/2017.
Aeromedical Causes of Accident Errors among Pilots and Aircraft Engineers

86
Moon, W. C., Kwang-Eui, Y. and Youn-Chul, C. (2011). Air traffic volume and air traffic control human errors, Journal of Transportation Technologies, 1, 47-53.
Newman D. G. (2007). Analysis of medical conditions affecting pilots involved in accidents and incidents 1 January 1975 to 31 March 2006. ATSB Transport Safety Report Aviation Research and Analysis Report - B2006/0170 Final.
Okoko E. (2001). Quantitative Techniques in urban Analysis. Ibadan Kraft Books Ltd.
Oyesiku K. O. (2000). Fundamentals of research methodology. HEBP, Lagos.
Reason, J. (1990). Human Error, Cambridge University Press, England.
Reinhart R. O. (1996). Basic flight psychology. New York: McGraw-Hill.
Stephens M. S. and Ukpere W. I. (2014). An empirical analysis of the causes of air crashes from a transport management perspective. Mediterranean Journal of Social Sciences Vol. 5 No 2 January, pg 699 – 711. Rome: MCSER Publishing.
Wickens, C. D., Gordon, S. E. and Liu, Y. (1998). An introduction to human factors engineering. New York: Addison-Wesley Educational Publishers Inc.
Weli V. E. and Ifediba, U. E. (2014). Poor weather conditions and flight operations: implications for air transport hazard management in Nigeria. Ethiopian Journal of Environmental Studies and Management 7(3): 235 – 243. ISSN: 1998- 0507 doi:http://dx.doi.org/10.4314/ejesm.v7i3.2
Wiegmann, D. A. (2001). A human error analysis of commercial aviation accidents using human factors analysis and classification system (HFACS). U.S Department of Transportation, Federal Aviation Administration.
Wiegnamn, D.A, Shappell S.A, Boquet A, Detwiler C, Holcomb K, and Faaborg T. (2005). H u m a n error and general aviation accidents: a comprehensive, fine-grained analysis using HFACS. Final Technical Report AHFD-05-08/FAA-05-03, Federal Aviation Administartion, Atlantic City International Airport, NJ.
Williams, B., Brown, T., and Onsman, A. (2010). Exploratory factor analysis: a five-step guide for novices. Australasian Journal of Paramedicine, 8(3). Retrieved from http://ro.ecu.edu.au/jephc/vol8/iss3/1
Wood, R., and Sweginnis, R. (2007). Aircraft accident investigation (2nd ed). Casper, WY: Endeavour Books.
Ghana Journal of Geography Vol. 10(2), 2018 pages 67–86