Aeroflot Group Q4 / Full Year 2013 Financial...
37
Aeroflot Group Q4 / Full Year 2013 Financial Results Moscow March 12, 2014 Speaker: Shamil Kurmashov Chief Financial Officer, Head of Network and Revenue Management
Transcript of Aeroflot Group Q4 / Full Year 2013 Financial...
1
Aeroflot GroupQ4 / Full Year 2013 Financial Results
MoscowMarch 12, 2014
Speaker:Shamil KurmashovChief Financial Officer, Head of Network and Revenue Management

2
Table of Contents
1. Key Highlights
2. Market Update
3. Operating Performance
4. Financial Performance
5. Capital Structure and Liquidity
6. Fleet Dynamics
7. Appendix
3
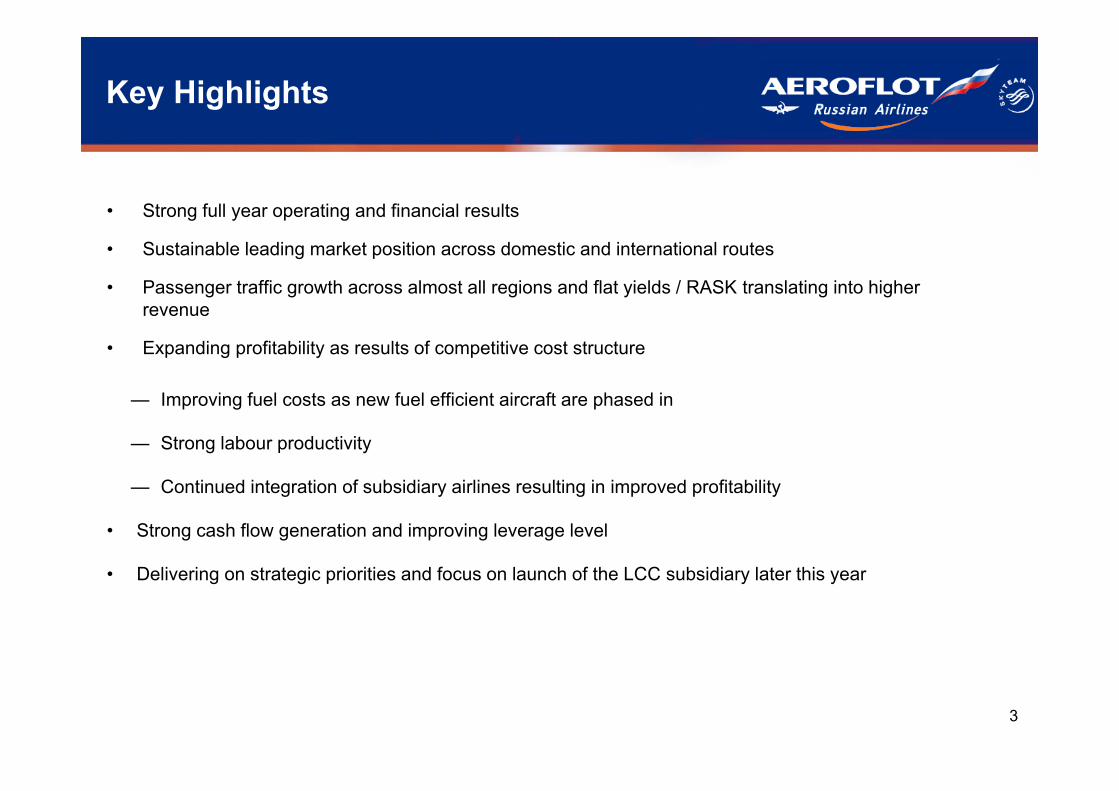
Key Highlights
• Strong full year operating and financial results
• Sustainable leading market position across domestic and international routes
• Passenger traffic growth across almost all regions and flat yields / RASK translating into higher revenue
• Expanding profitability as results of competitive cost structure
— Improving fuel costs as new fuel efficient aircraft are phased in
— Strong labour productivity
— Continued integration of subsidiary airlines resulting in improved profitability
• Strong cash flow generation and improving leverage level
• Delivering on strategic priorities and focus on launch of the LCC subsidiary later this year
4
Table of Contents
1. Key Highlights
2. Market Update
3. Operating Performance
4. Financial Performance
5. Capital Structure and Liquidity
6. Fleet Dynamics
7. Appendix
5
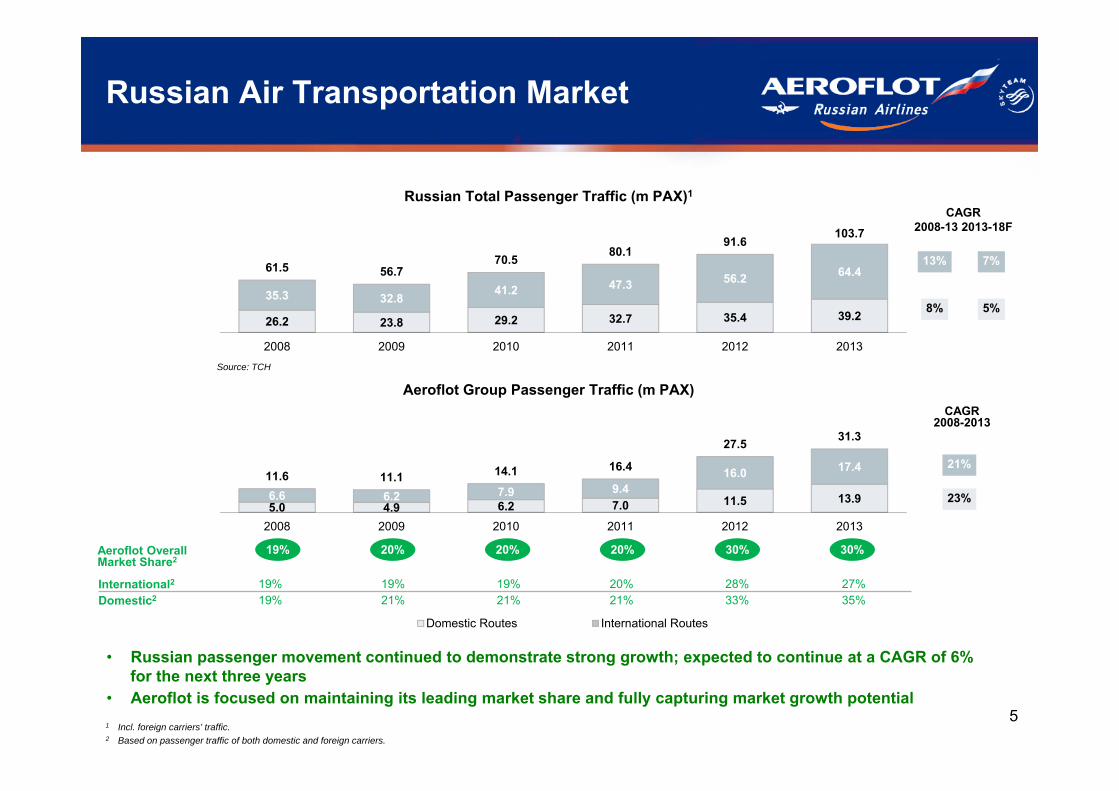
5.0 4.9 6.2 7.0 11.5 13.96.6 6.2 7.9 9.416.0 17.4
11.6 11.1 14.1 16.4
27.5 31.3
2008 2009 2010 2011 2012 2013
Domestic Routes International Routes
Russian Air Transportation Market
26.2 23.8 29.2 32.7 35.4 39.235.3 32.8 41.2 47.3 56.2 64.461.5 56.7
70.5 80.191.6
103.7
2008 2009 2010 2011 2012 2013
Aeroflot Group Passenger Traffic (m PAX)
Russian Total Passenger Traffic (m PAX)1
• Russian passenger movement continued to demonstrate strong growth; expected to continue at a CAGR of 6% for the next three years
• Aeroflot is focused on maintaining its leading market share and fully capturing market growth potential
30%20%20%20%19%
International2 19% 19% 19% 20% 28% 27%Domestic2 19% 21% 21% 21% 33% 35%
CAGR 2008-13 2013-18F
7%
5%
CAGR 2008-2013
Aeroflot Overall Market Share2
30%
Source: TCH
13%
8%
21%
23%
1 Incl. foreign carriers’ traffic.2 Based on passenger traffic of both domestic and foreign carriers.
6
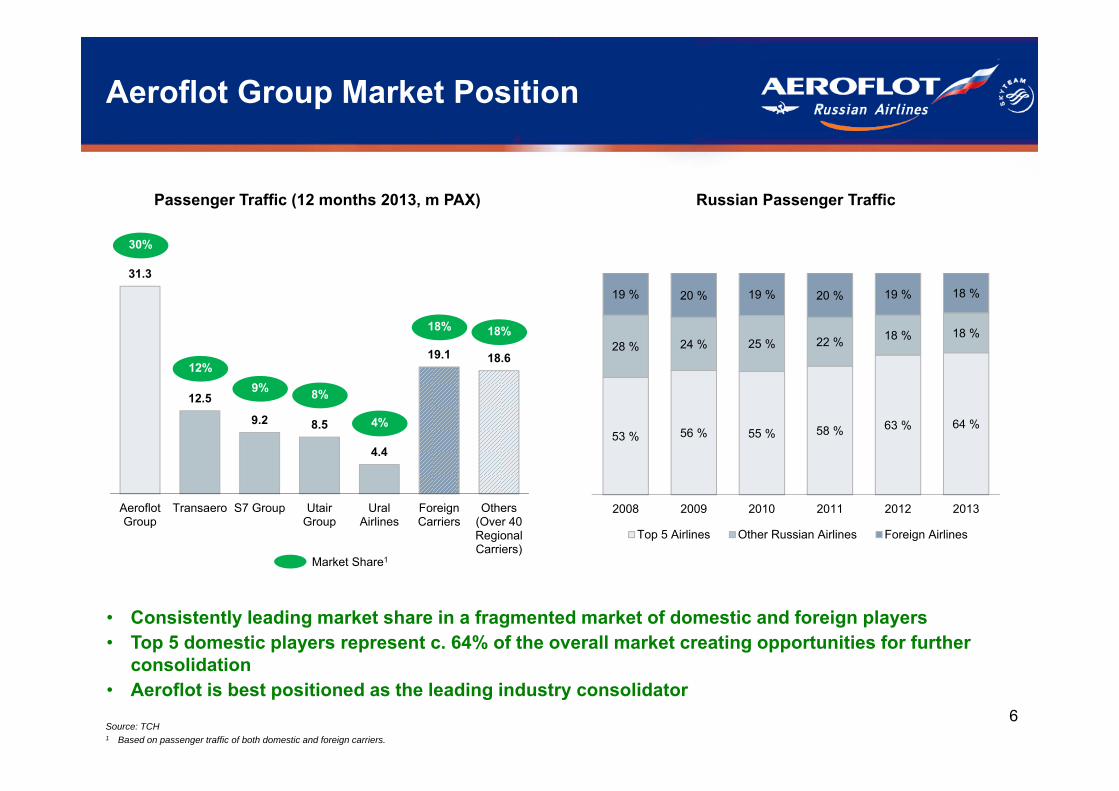
Aeroflot Group Market Position
31.3
12.5
9.2 8.5
4.4
19.1 18.6
AeroflotGroup
Transaero S7 Group UtairGroup
UralAirlines
ForeignCarriers
Others(Over 40RegionalCarriers)
30%
12%9%
18%
4%
Market Share1
8%
• Consistently leading market share in a fragmented market of domestic and foreign players• Top 5 domestic players represent c. 64% of the overall market creating opportunities for further
consolidation • Aeroflot is best positioned as the leading industry consolidator
Source: TCH1 Based on passenger traffic of both domestic and foreign carriers.
Passenger Traffic (12 months 2013, m PAX) Russian Passenger Traffic
18%
53 % 56 % 55 % 58 % 63 % 64 %
28 % 24 % 25 % 22 % 18 % 18 %
19 % 20 % 19 % 20 % 19 % 18 %
2008 2009 2010 2011 2012 2013
Top 5 Airlines Other Russian Airlines Foreign Airlines
7
Table of Contents
1. Key Highlights
2. Market Update
3. Operating Performance
4. Financial Performance
5. Capital Structure and Liquidity
6. Fleet Dynamics
7. Appendix
8
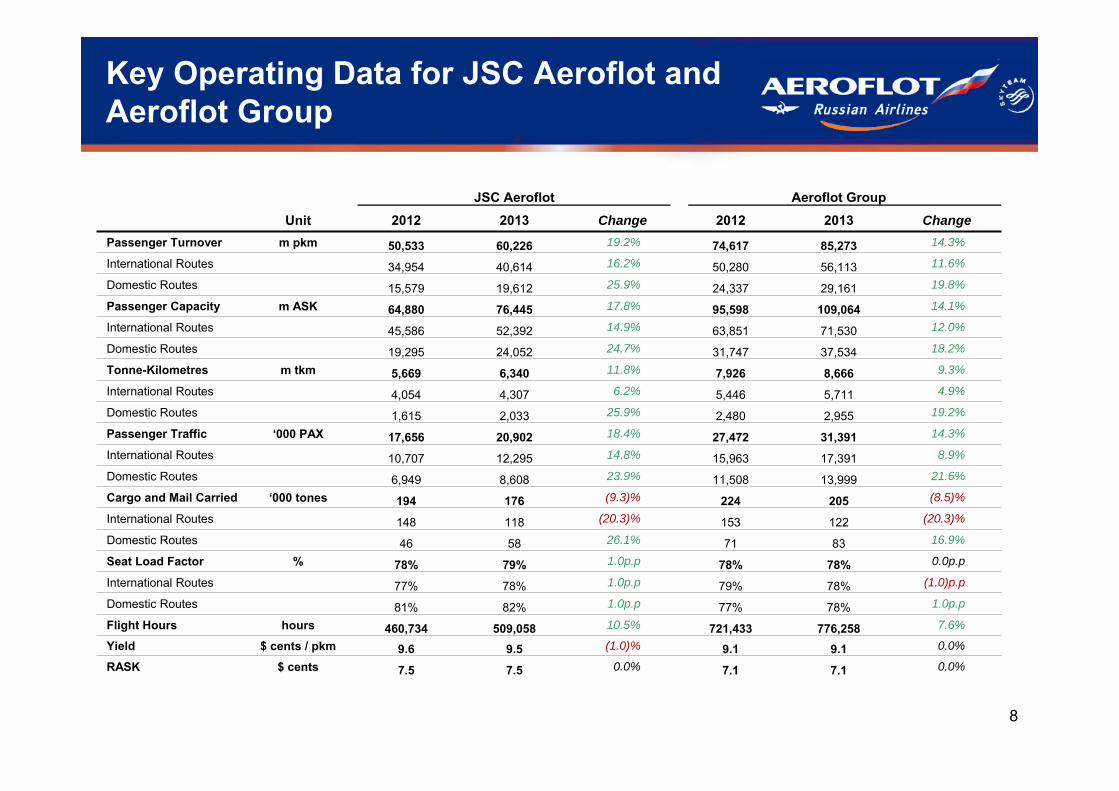
Key Operating Data for JSC Aeroflot and Aeroflot Group
JSC Aeroflot Aeroflot GroupUnit 2012 2013 Change 2012 2013 Change
Passenger Turnover m pkm 50,533 60,226 19.2% 74,617 85,273 14.3%
International Routes 34,954 40,614 16.2% 50,280 56,113 11.6%
Domestic Routes 15,579 19,612 25.9% 24,337 29,161 19.8%
Passenger Capacity m ASK 64,880 76,445 17.8% 95,598 109,064 14.1%
International Routes 45,586 52,392 14.9% 63,851 71,530 12.0%
Domestic Routes 19,295 24,052 24.7% 31,747 37,534 18.2%
Tonne-Kilometres m tkm 5,669 6,340 11.8% 7,926 8,666 9.3%
International Routes 4,054 4,307 6.2% 5,446 5,711 4.9%
Domestic Routes 1,615 2,033 25.9% 2,480 2,955 19.2%
Passenger Traffic ‘000 PAX 17,656 20,902 18.4% 27,472 31,391 14.3%
International Routes 10,707 12,295 14.8% 15,963 17,391 8.9%
Domestic Routes 6,949 8,608 23.9% 11,508 13,999 21.6%
Cargo and Mail Carried ‘000 tones 194 176 (9.3)% 224 205 (8.5)%
International Routes 148 118 (20.3)% 153 122 (20.3)%
Domestic Routes 46 58 26.1% 71 83 16.9%
Seat Load Factor % 78% 79% 1.0p.p 78% 78% 0.0p.p
International Routes 77% 78% 1.0p.p 79% 78% (1.0)p.p
Domestic Routes 81% 82% 1.0p.p 77% 78% 1.0p.p
Flight Hours hours 460,734 509,058 10.5% 721,433 776,258 7.6%
Yield $ cents / pkm 9.6 9.5 (1.0)% 9.1 9.1 0.0%
RASK $ cents 7.5 7.5 0.0% 7.1 7.1 0.0%
9
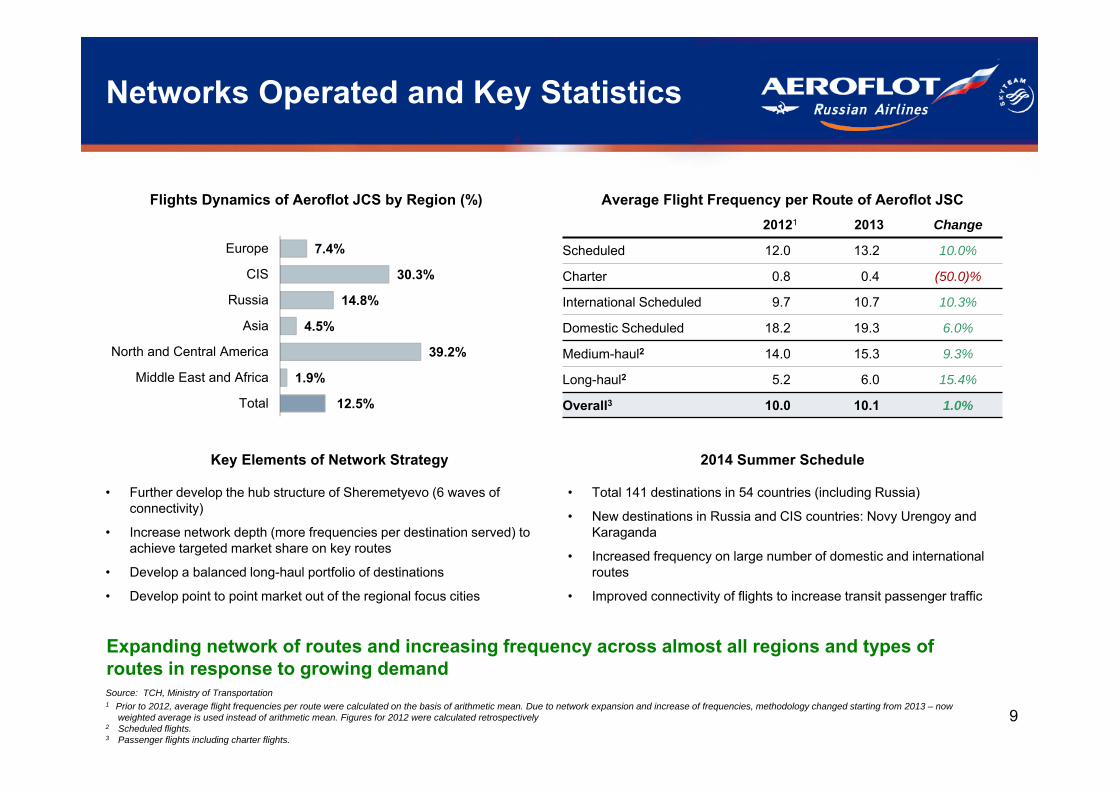
Networks Operated and Key Statistics
Flights Dynamics of Aeroflot JCS by Region (%)
2014 Summer Schedule
Average Flight Frequency per Route of Aeroflot JSC20121 2013 Change
Scheduled 12.0 13.2 10.0%
Charter 0.8 0.4 (50.0)%
International Scheduled 9.7 10.7 10.3%
Domestic Scheduled 18.2 19.3 6.0%
Medium-haul2 14.0 15.3 9.3%
Long-haul2 5.2 6.0 15.4%
Overall3 10.0 10.1 1.0%
Source: TCH, Ministry of Transportation1 Prior to 2012, average flight frequencies per route were calculated on the basis of arithmetic mean. Due to network expansion and increase of frequencies, methodology changed starting from 2013 – now
weighted average is used instead of arithmetic mean. Figures for 2012 were calculated retrospectively2 Scheduled flights.3 Passenger flights including charter flights.
Key Elements of Network Strategy
• Further develop the hub structure of Sheremetyevo (6 waves of connectivity)
• Increase network depth (more frequencies per destination served) to achieve targeted market share on key routes
• Develop a balanced long-haul portfolio of destinations
• Develop point to point market out of the regional focus cities
Expanding network of routes and increasing frequency across almost all regions and types of routes in response to growing demand
12.5%
1.9%
39.2%
4.5%
14.8%
30.3%
7.4%
Total
Middle East and Africa
North and Central America
Asia
Russia
CIS
Europe
• Total 141 destinations in 54 countries (including Russia)
• New destinations in Russia and CIS countries: Novy Urengoy and Karaganda
• Increased frequency on large number of domestic and international routes
• Improved connectivity of flights to increase transit passenger traffic
10
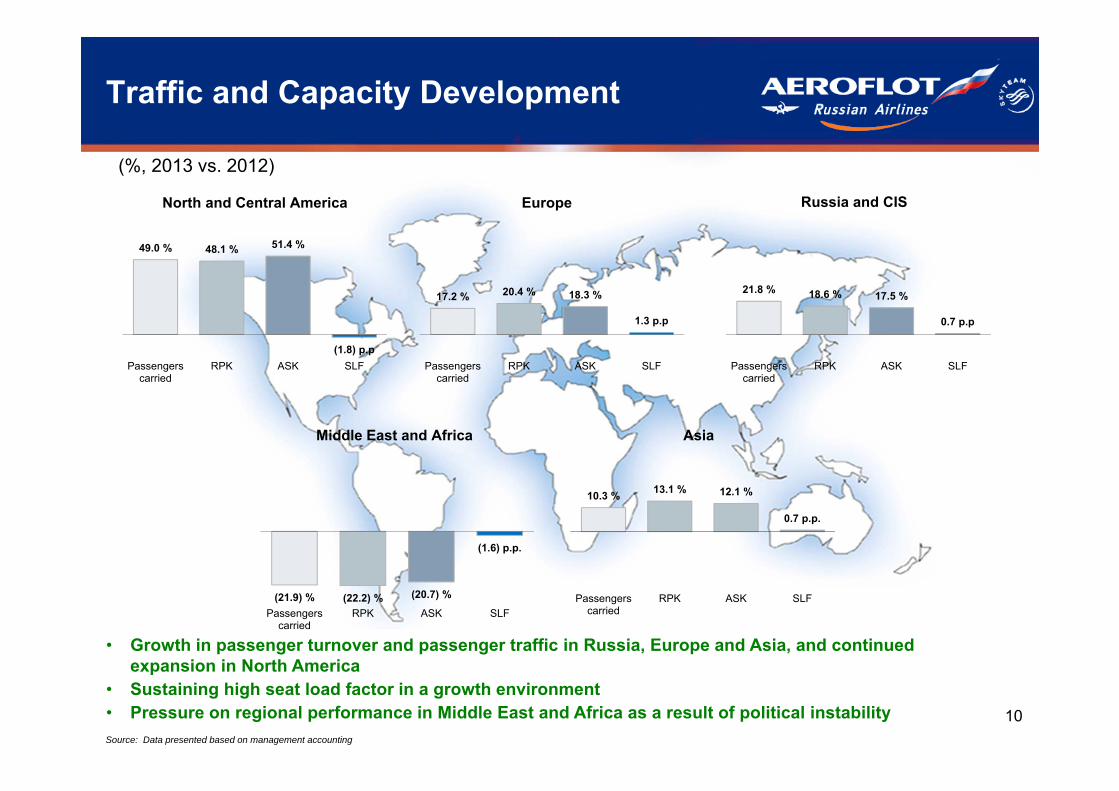
49.0 % 48.1 % 51.4 %
(1.8) p.pPassengers
carriedRPK ASK SLF
Traffic and Capacity Development
North and Central America Europe Russia and CIS
17.2 % 20.4 % 18.3 %
1.3 p.p
Passengerscarried
RPK ASK SLF
21.8 % 18.6 % 17.5 %
0.7 p.p
Passengerscarried
RPK ASK SLF
(21.9) % (22.2) % (20.7) %
(1.6) p.p.
Passengerscarried
RPK ASK SLF
10.3 % 13.1 % 12.1 %
0.7 p.p.
Passengerscarried
RPK ASK SLF
• Growth in passenger turnover and passenger traffic in Russia, Europe and Asia, and continued expansion in North America
• Sustaining high seat load factor in a growth environment• Pressure on regional performance in Middle East and Africa as a result of political instability
(%, 2013 vs. 2012)
Middle East and Africa Asia
Source: Data presented based on management accounting

11
Table of Contents
1. Key Highlights
2. Market Update
3. Operating Performance
4. Financial Performance
5. Capital Structure and Liquidity
6. Fleet Dynamics
7. Appendix
12
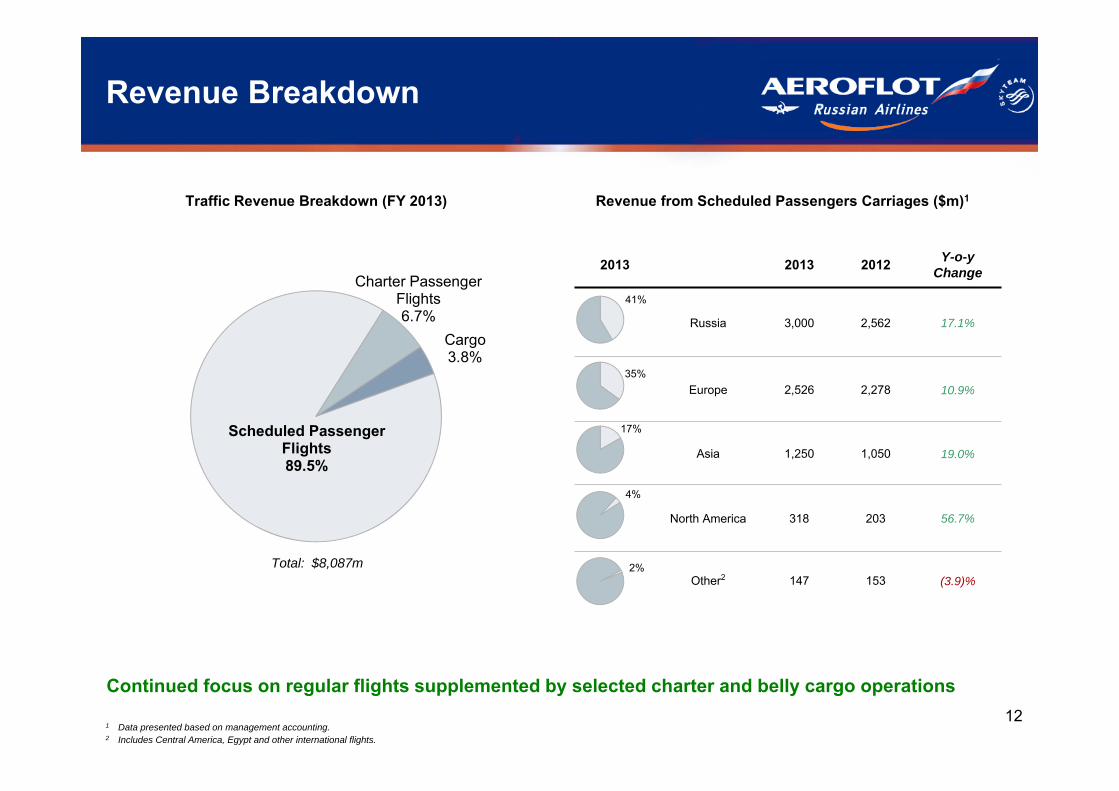
Revenue Breakdown
Continued focus on regular flights supplemented by selected charter and belly cargo operations
Revenue from Scheduled Passengers Carriages ($m)1
1 Data presented based on management accounting.2 Includes Central America, Egypt and other international flights.
Traffic Revenue Breakdown (FY 2013)
Total: $8,087m
2013 2013 2012 Y-o-yChange
Russia 3,000 2,562 17.1%
Europe 2,526 2,278 10.9%
Asia 1,250 1,050 19.0%
North America 318 203 56.7%
Other2 147 153 (3.9)%2%
35%
17%
4%
41%
Scheduled Passenger Flights89.5%
Charter Passenger Flights6.7%
Cargo3.8%
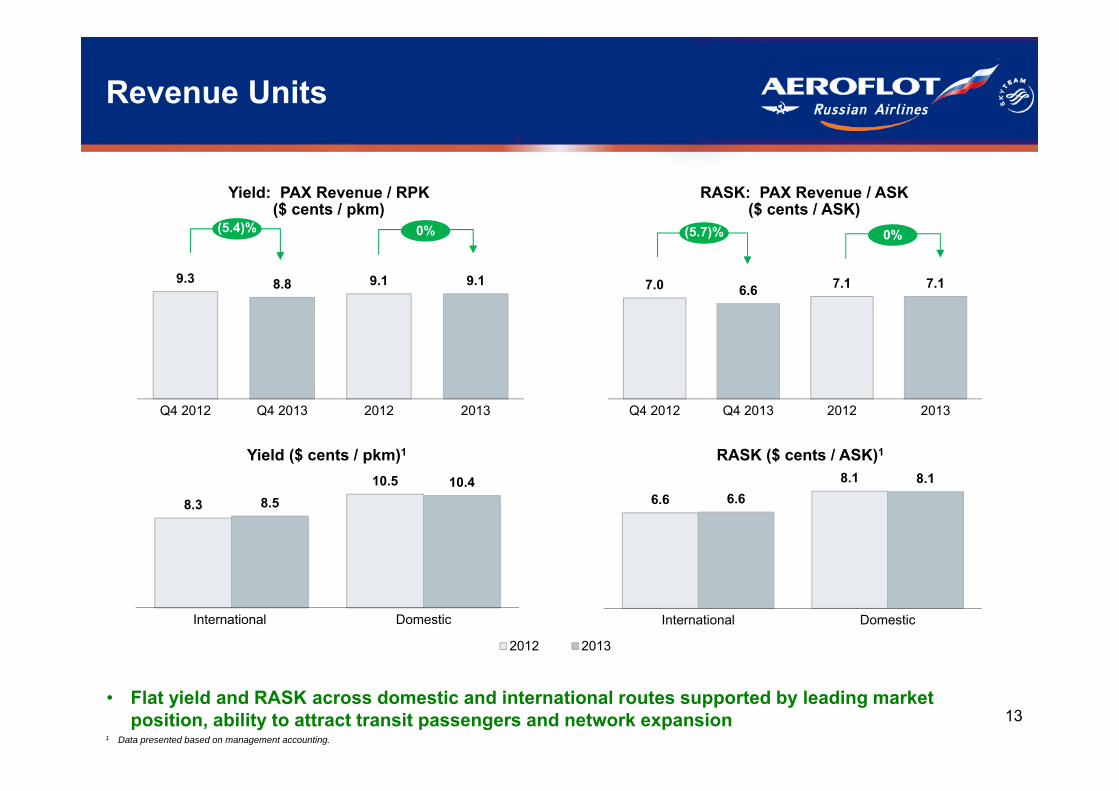
13
9.3 9.18.8 9.1
Q4 2012 Q4 2013 2012 2013
7.0 7.16.6 7.1
Q4 2012 Q4 2013 2012 2013
2012 2013
Revenue Units
Yield: PAX Revenue / RPK($ cents / pkm)
RASK: PAX Revenue / ASK($ cents / ASK)
8.3
10.5 8.5
10.4
International Domestic
Yield ($ cents / pkm)1
6.68.1
6.6 8.1
International Domestic
RASK ($ cents / ASK)1
• Flat yield and RASK across domestic and international routes supported by leading market position, ability to attract transit passengers and network expansion
0%(5.4)%
1 Data presented based on management accounting.
0%(5.7)%
14
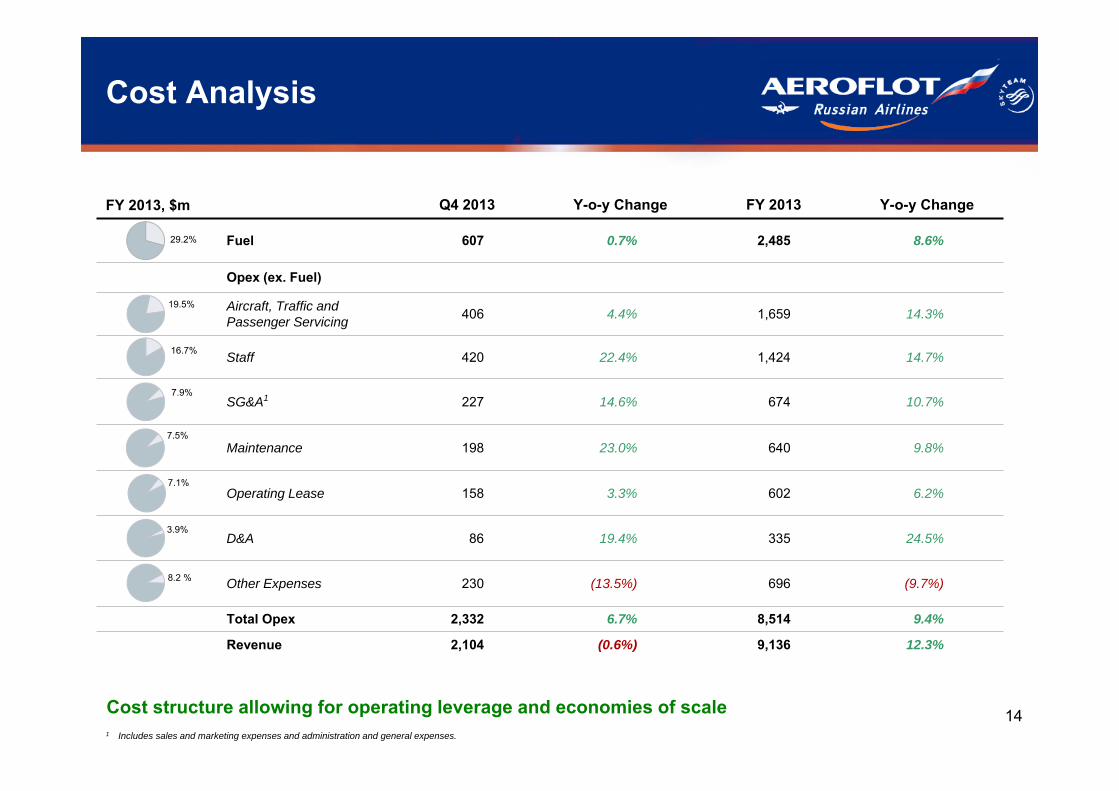
FY 2013, $m Q4 2013 Y-o-y Change FY 2013 Y-o-y Change
Fuel 607 0.7% 2,485 8.6%
Opex (ex. Fuel)
Aircraft, Traffic and Passenger Servicing 406 4.4% 1,659 14.3%
Staff 420 22.4% 1,424 14.7%
SG&A1 227 14.6% 674 10.7%
Maintenance 198 23.0% 640 9.8%
Operating Lease 158 3.3% 602 6.2%
D&A 86 19.4% 335 24.5%
Other Expenses 230 (13.5%) 696 (9.7%)
Total Opex 2,332 6.7% 8,514 9.4%
Revenue 2,104 (0.6%) 9,136 12.3%
7.5%
7.9%
29.2%
Cost Analysis
Cost structure allowing for operating leverage and economies of scale
16.7%
1 Includes sales and marketing expenses and administration and general expenses.
7.1%
19.5%
8.2 %
3.9%
15
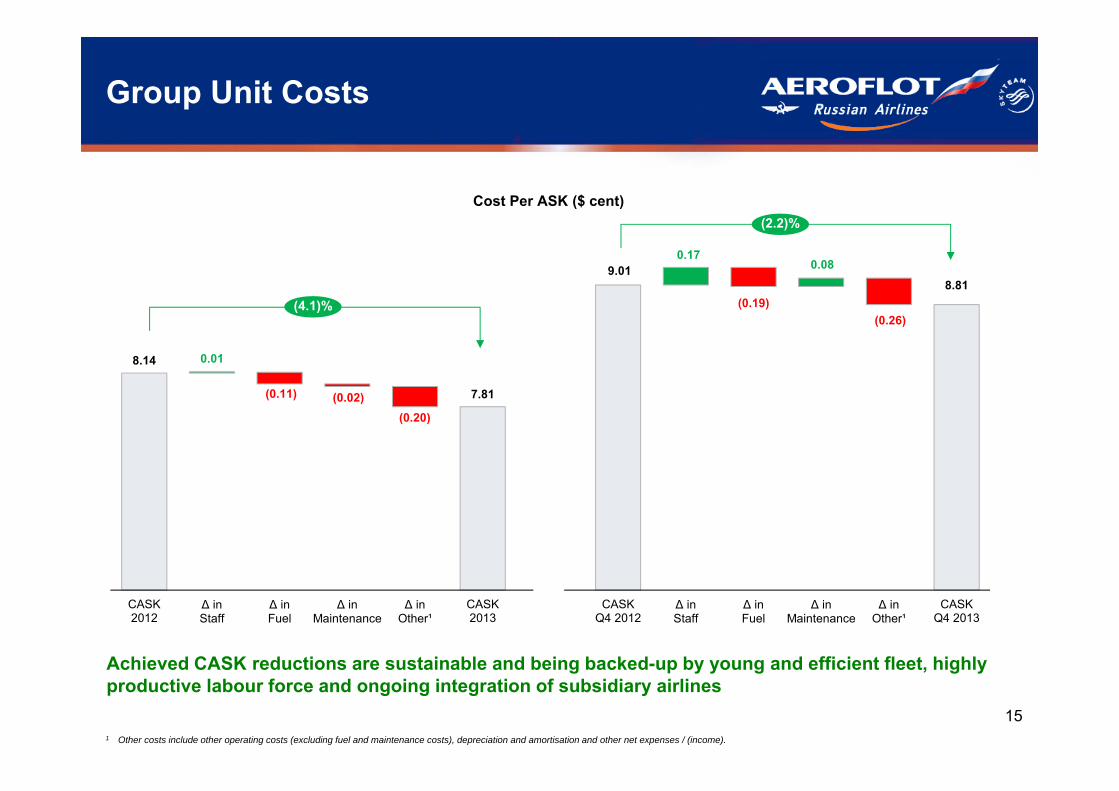
Group Unit Costs
Cost Per ASK ($ cent)
Achieved CASK reductions are sustainable and being backed-up by young and efficient fleet, highly productive labour force and ongoing integration of subsidiary airlines
1 Other costs include other operating costs (excluding fuel and maintenance costs), depreciation and amortisation and other net expenses / (income).
8.81
8.14 0.01
(0.11) (0.02)(0.20)
7.81
9.01 0.17
(0.19)
0.08
(0.26)
CASK2012
∆ in Staff
∆ in Fuel
∆ in Maintenance
∆ in Other¹
CASK2013
CASKQ4 2012
∆ in Staff
∆ in Fuel
∆ in Maintenance
∆ in Other¹
CASKQ4 2013
(4.1)%
(2.2)%
16
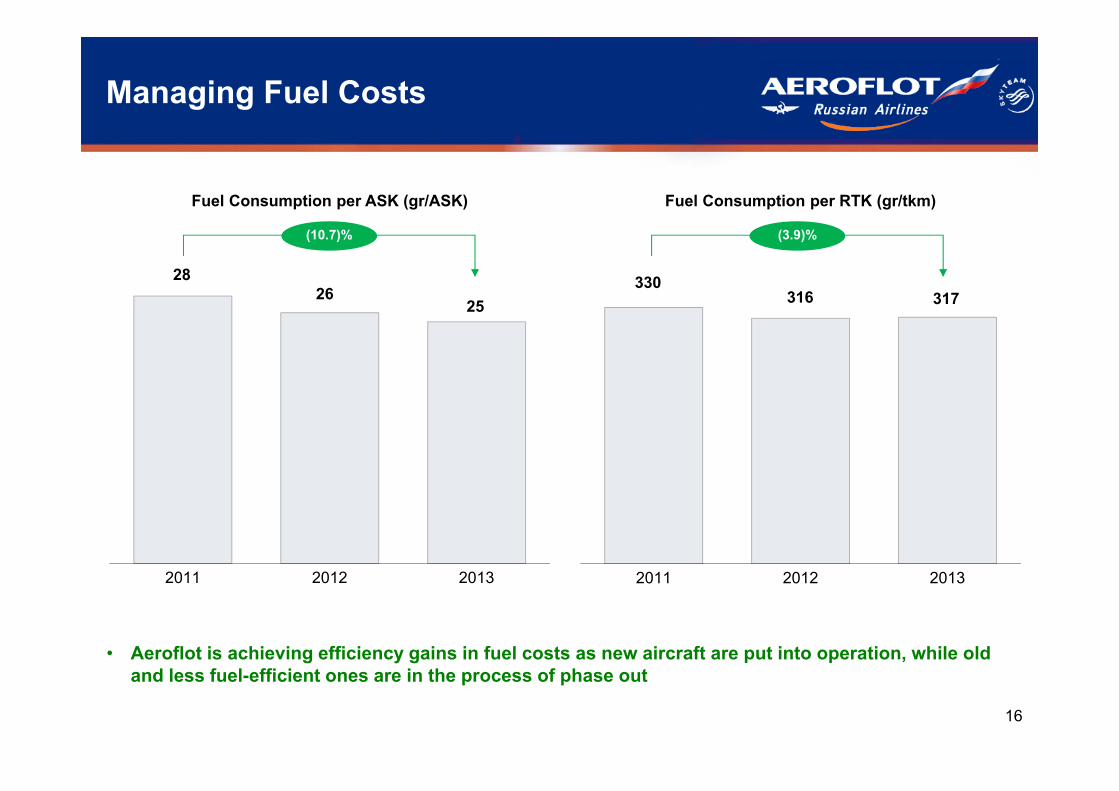
Managing Fuel Costs
Fuel Consumption per ASK (gr/ASK)
• Aeroflot is achieving efficiency gains in fuel costs as new aircraft are put into operation, while old and less fuel-efficient ones are in the process of phase out
Fuel Consumption per RTK (gr/tkm)
330 316 317
2011 2012 2013
2826
25
2011 2012 2013
(10.7)% (3.9)%
17
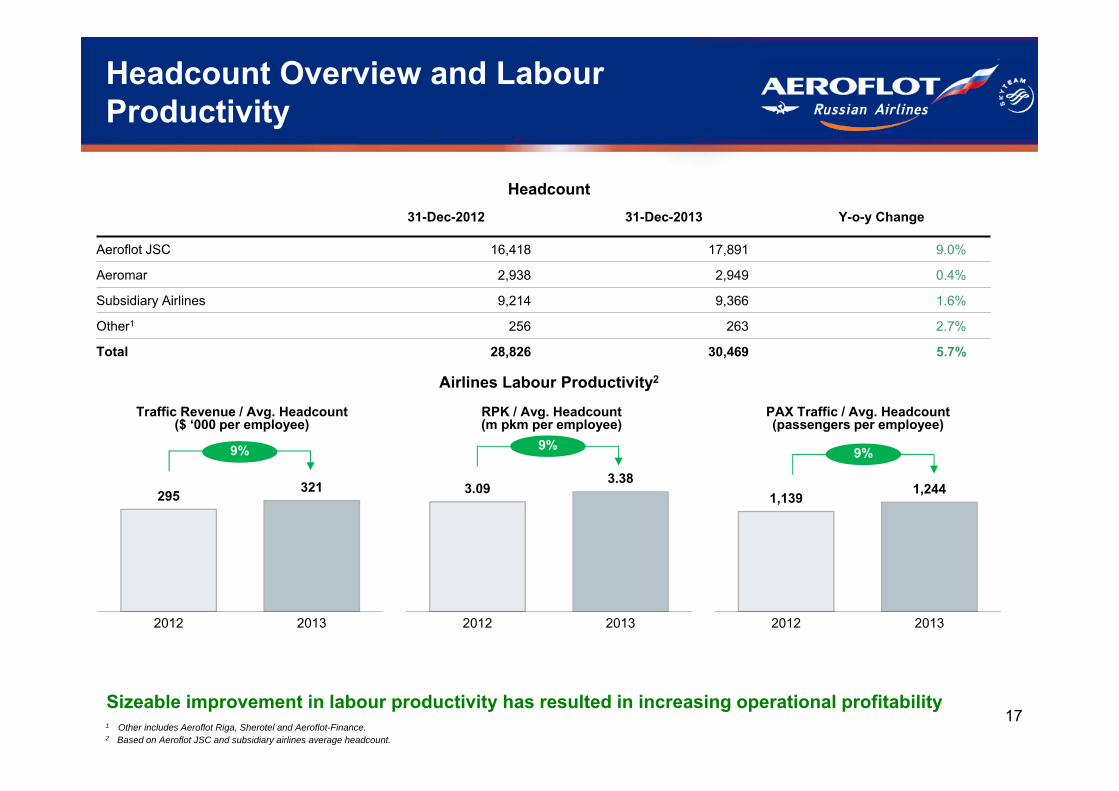
1,139 1,244
2012 2013
295 321
2012 2013
3.093.38
2012 2013
RPK / Avg. Headcount (m pkm per employee)
Headcount Overview and Labour Productivity
Traffic Revenue / Avg. Headcount ($ ‘000 per employee)
PAX Traffic / Avg. Headcount (passengers per employee)
31-Dec-2012 31-Dec-2013 Y-o-y Change
Aeroflot JSC 16,418 17,891 9.0%
Aeromar 2,938 2,949 0.4%
Subsidiary Airlines 9,214 9,366 1.6%
Other1 256 263 2.7%
Total 28,826 30,469 5.7%
Sizeable improvement in labour productivity has resulted in increasing operational profitability
Airlines Labour Productivity2
9% 9%9%
1 Other includes Aeroflot Riga, Sherotel and Aeroflot-Finance.2 Based on Aeroflot JSC and subsidiary airlines average headcount.
Headcount
18
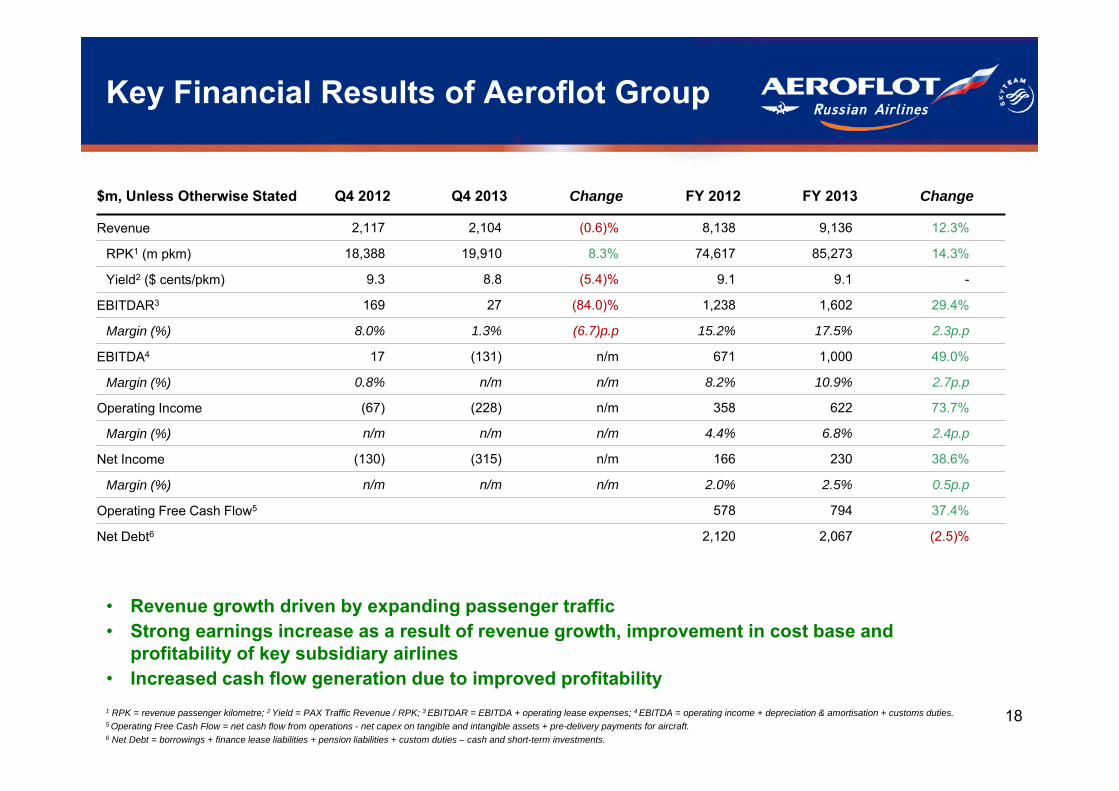
Key Financial Results of Aeroflot Group
$m, Unless Otherwise Stated Q4 2012 Q4 2013 Change FY 2012 FY 2013 Change
Revenue 2,117 2,104 (0.6)% 8,138 9,136 12.3%
RPK1 (m pkm) 18,388 19,910 8.3% 74,617 85,273 14.3%
Yield2 ($ cents/pkm) 9.3 8.8 (5.4)% 9.1 9.1 -
EBITDAR3 169 27 (84.0)% 1,238 1,602 29.4%
Margin (%) 8.0% 1.3% (6.7)p.p 15.2% 17.5% 2.3p.p
EBITDA4 17 (131) n/m 671 1,000 49.0%
Margin (%) 0.8% n/m n/m 8.2% 10.9% 2.7p.p
Operating Income (67) (228) n/m 358 622 73.7%
Margin (%) n/m n/m n/m 4.4% 6.8% 2.4p.p
Net Income (130) (315) n/m 166 230 38.6%
Margin (%) n/m n/m n/m 2.0% 2.5% 0.5p.p
Operating Free Cash Flow5 578 794 37.4%
Net Debt6 2,120 2,067 (2.5)%
• Revenue growth driven by expanding passenger traffic• Strong earnings increase as a result of revenue growth, improvement in cost base and
profitability of key subsidiary airlines• Increased cash flow generation due to improved profitability1 RPK = revenue passenger kilometre; 2 Yield = PAX Traffic Revenue / RPK; 3 EBITDAR = EBITDA + operating lease expenses; 4 EBITDA = operating income + depreciation & amortisation + customs duties.5 Operating Free Cash Flow = net cash flow from operations - net capex on tangible and intangible assets + pre-delivery payments for aircraft. 6 Net Debt = borrowings + finance lease liabilities + pension liabilities + custom duties – cash and short-term investments.
19
Group Operating Income Analysis
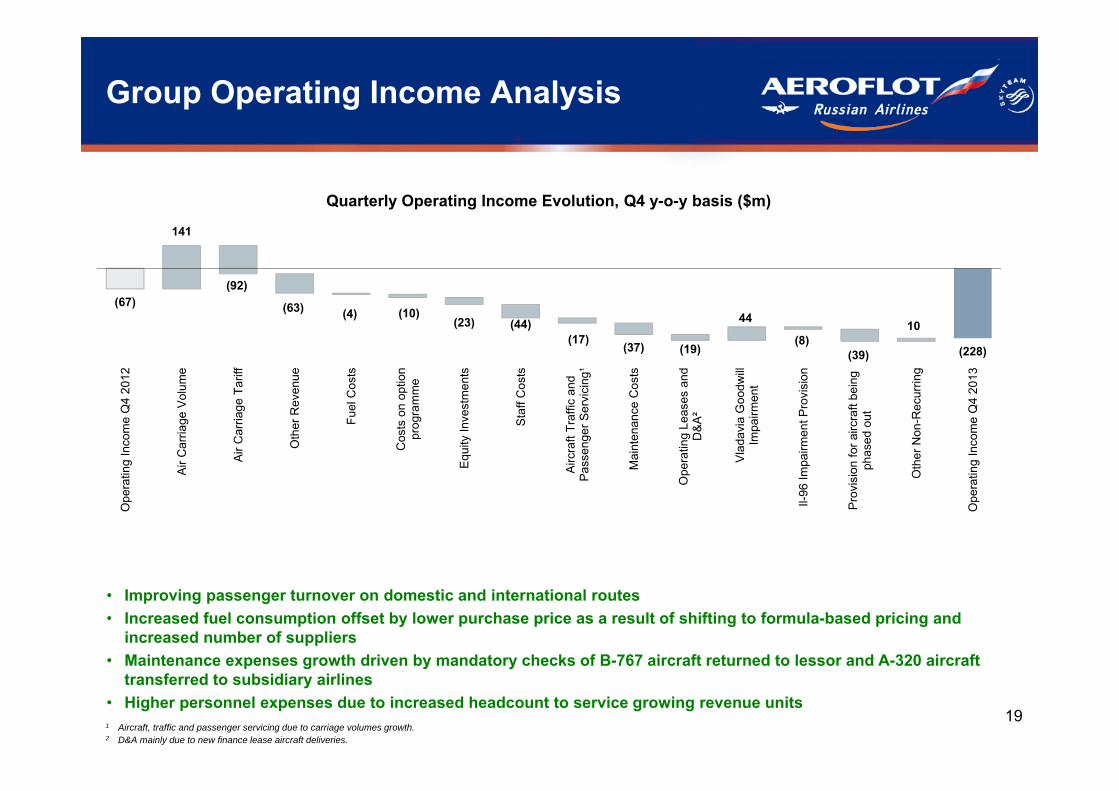
Quarterly Operating Income Evolution, Q4 y-o-y basis ($m)
141
(92)
(63) (4) (10)(23) (44)
(17) (37) (19)
44
(8)(39)
10
(67)
(228)
Ope
ratin
g In
com
e Q
4 20
12
Air
Car
riage
Vol
ume
Air
Car
riage
Tar
iff
Oth
er R
even
ue
Fuel
Cos
ts
Cos
ts o
n op
tion
prog
ram
me
Equ
ity In
vest
men
ts
Sta
ff C
osts
Airc
raft
Traf
fic a
ndP
asse
nger
Ser
vici
ng¹
Mai
nten
ance
Cos
ts
Ope
ratin
g Le
ases
and
D&
A²
Vla
davi
a G
oodw
illIm
pairm
ent
Il-96
Impa
irmen
t Pro
visi
on
Pro
visi
on fo
r airc
raft
bein
gph
ased
out
Oth
er N
on-R
ecur
ring
Ope
ratin
g In
com
e Q
4 20
13
1 Aircraft, traffic and passenger servicing due to carriage volumes growth.2 D&A mainly due to new finance lease aircraft deliveries.
• Improving passenger turnover on domestic and international routes • Increased fuel consumption offset by lower purchase price as a result of shifting to formula-based pricing and
increased number of suppliers • Maintenance expenses growth driven by mandatory checks of B-767 aircraft returned to lessor and A-320 aircraft
transferred to subsidiary airlines • Higher personnel expenses due to increased headcount to service growing revenue units
20
Group Operating Income Analysis
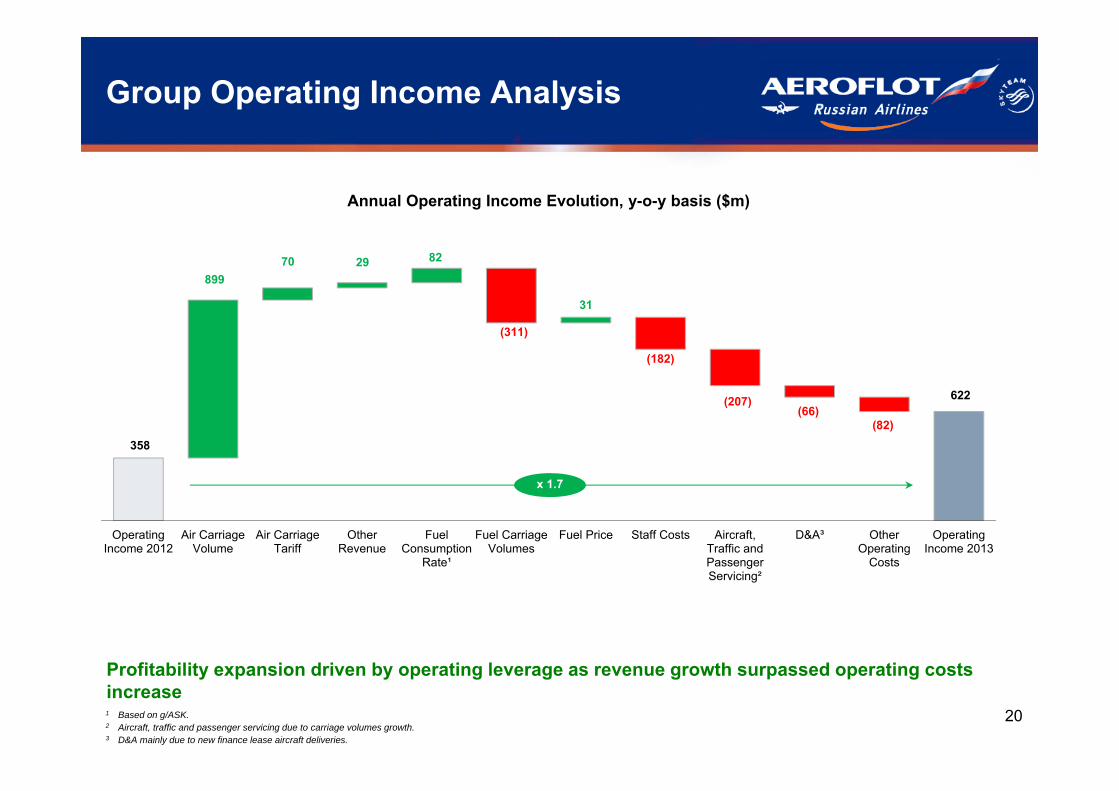
Annual Operating Income Evolution, y-o-y basis ($m)
Profitability expansion driven by operating leverage as revenue growth surpassed operating costs increase
89970 29 82
(311)
31
(182)
(207)(66)
(82)358
622
OperatingIncome 2012
Air CarriageVolume
Air CarriageTariff
OtherRevenue
FuelConsumption
Rate¹
Fuel CarriageVolumes
Fuel Price Staff Costs Aircraft,Traffic andPassengerServicing²
D&A³ OtherOperating
Costs
OperatingIncome 2013
1 Based on g/ASK.2 Aircraft, traffic and passenger servicing due to carriage volumes growth.3 D&A mainly due to new finance lease aircraft deliveries.
x 1.7
21
(21) (2)(17) (3)
(63)
5
25 0.424
281
230
166
JSCAeroflot
RossiyaAirlines
Donavia Orenair Aurora VladivostokAir¹
Sherotel Aeromar Aerofirst² Other(includingminority)
GroupNet
Income2013
GroupNet
Income2012
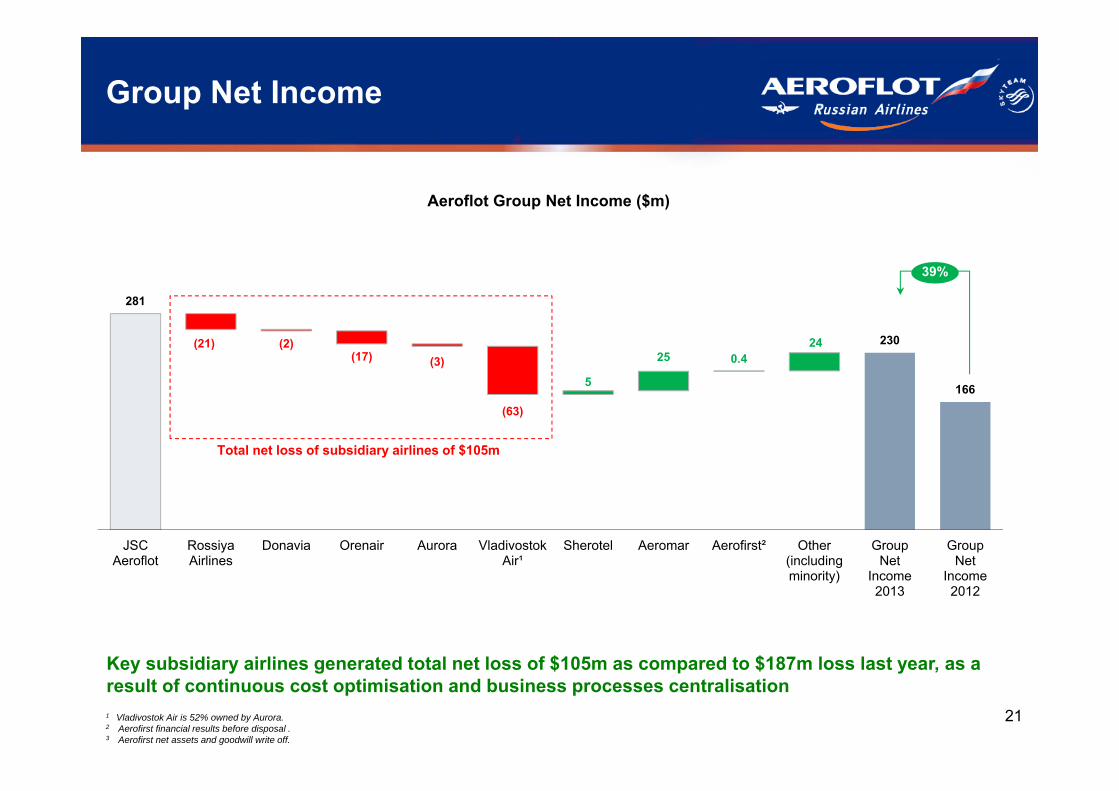
Group Net Income
Key subsidiary airlines generated total net loss of $105m as compared to $187m loss last year, as a result of continuous cost optimisation and business processes centralisation
Aeroflot Group Net Income ($m)
Total net loss of subsidiary airlines of $105m
1 Vladivostok Air is 52% owned by Aurora. 2 Aerofirst financial results before disposal .3 Aerofirst net assets and goodwill write off.
39%
22
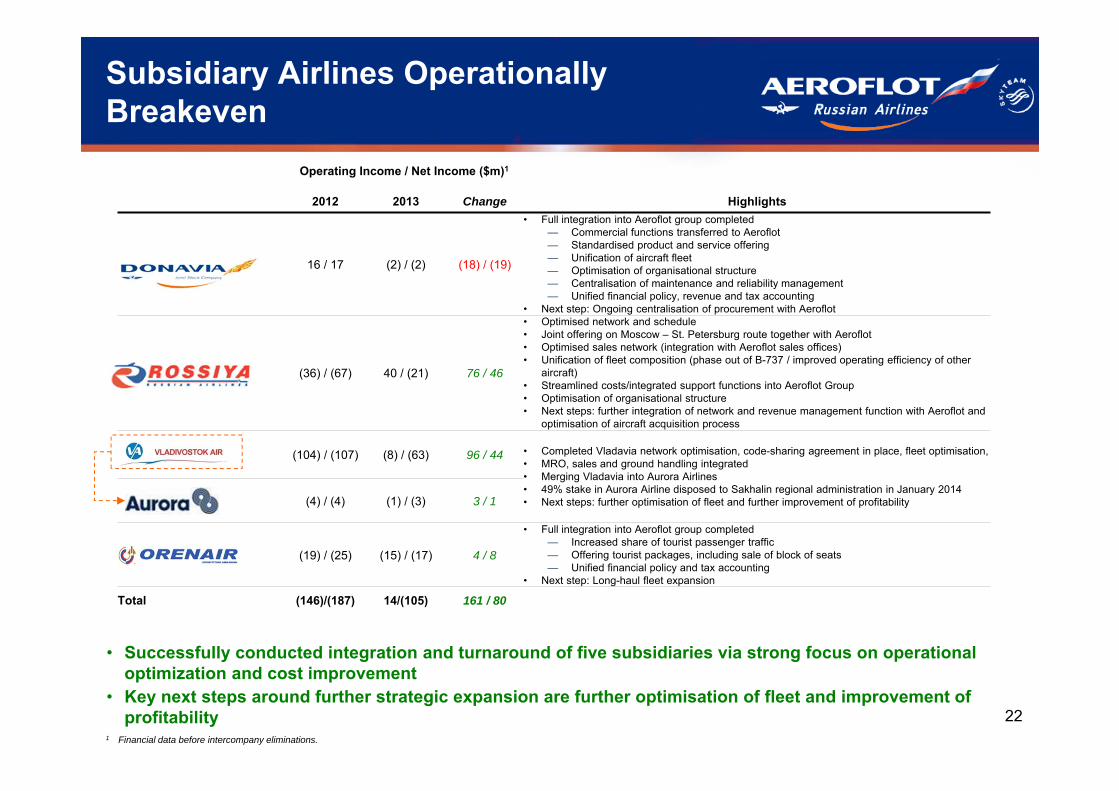
Operating Income / Net Income ($m)1
2012 2013 Change Highlights
16 / 17 (2) / (2) (18) / (19)
• Full integration into Aeroflot group completed — Commercial functions transferred to Aeroflot — Standardised product and service offering — Unification of aircraft fleet — Optimisation of organisational structure— Centralisation of maintenance and reliability management— Unified financial policy, revenue and tax accounting
• Next step: Ongoing centralisation of procurement with Aeroflot
(36) / (67) 40 / (21) 76 / 46
• Optimised network and schedule• Joint offering on Moscow – St. Petersburg route together with Aeroflot • Optimised sales network (integration with Aeroflot sales offices)• Unification of fleet composition (phase out of B-737 / improved operating efficiency of other
aircraft) • Streamlined costs/integrated support functions into Aeroflot Group• Optimisation of organisational structure• Next steps: further integration of network and revenue management function with Aeroflot and
optimisation of aircraft acquisition process
(104) / (107) (8) / (63) 96 / 44 • Completed Vladavia network optimisation, code-sharing agreement in place, fleet optimisation, • MRO, sales and ground handling integrated • Merging Vladavia into Aurora Airlines• 49% stake in Aurora Airline disposed to Sakhalin regional administration in January 2014• Next steps: further optimisation of fleet and further improvement of profitability (4) / (4) (1) / (3) 3 / 1
(19) / (25) (15) / (17) 4 / 8
• Full integration into Aeroflot group completed — Increased share of tourist passenger traffic— Offering tourist packages, including sale of block of seats — Unified financial policy and tax accounting
• Next step: Long-haul fleet expansion
Total (146)/(187) 14/(105) 161 / 80
Subsidiary Airlines Operationally Breakeven
• Successfully conducted integration and turnaround of five subsidiaries via strong focus on operational optimization and cost improvement
• Key next steps around further strategic expansion are further optimisation of fleet and improvement of profitability
1 Financial data before intercompany eliminations.
23
Table of Contents
1. Key Highlights
2. Market Update
3. Operating Performance
4. Financial Performance
5. Capital Structure and Liquidity
6. Fleet Dynamics
7. Appendix
24
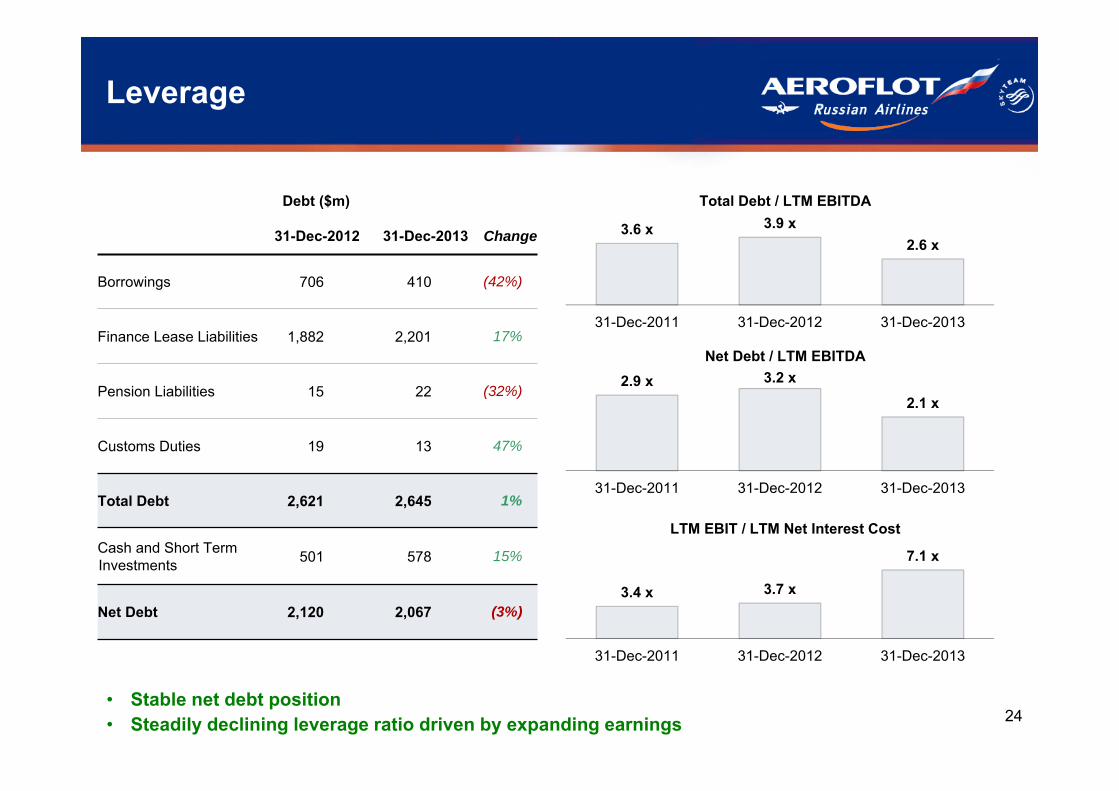
31-Dec-2012 31-Dec-2013 Change
Borrowings 706 410 (42%)
Finance Lease Liabilities 1,882 2,201 17%
Pension Liabilities 15 22 (32%)
Customs Duties 19 13 47%
Total Debt 2,621 2,645 1%
Cash and Short TermInvestments 501 578 15%
Net Debt 2,120 2,067 (3%)
Leverage
Debt ($m)
2.9 x 3.2 x
2.1 x
31-Dec-2011 31-Dec-2012 31-Dec-2013
Net Debt / LTM EBITDA
LTM EBIT / LTM Net Interest Cost
3.4 x 3.7 x
7.1 x
31-Dec-2011 31-Dec-2012 31-Dec-2013
• Stable net debt position• Steadily declining leverage ratio driven by expanding earnings
3.6 x 3.9 x2.6 x
31-Dec-2011 31-Dec-2012 31-Dec-2013
Total Debt / LTM EBITDA
25
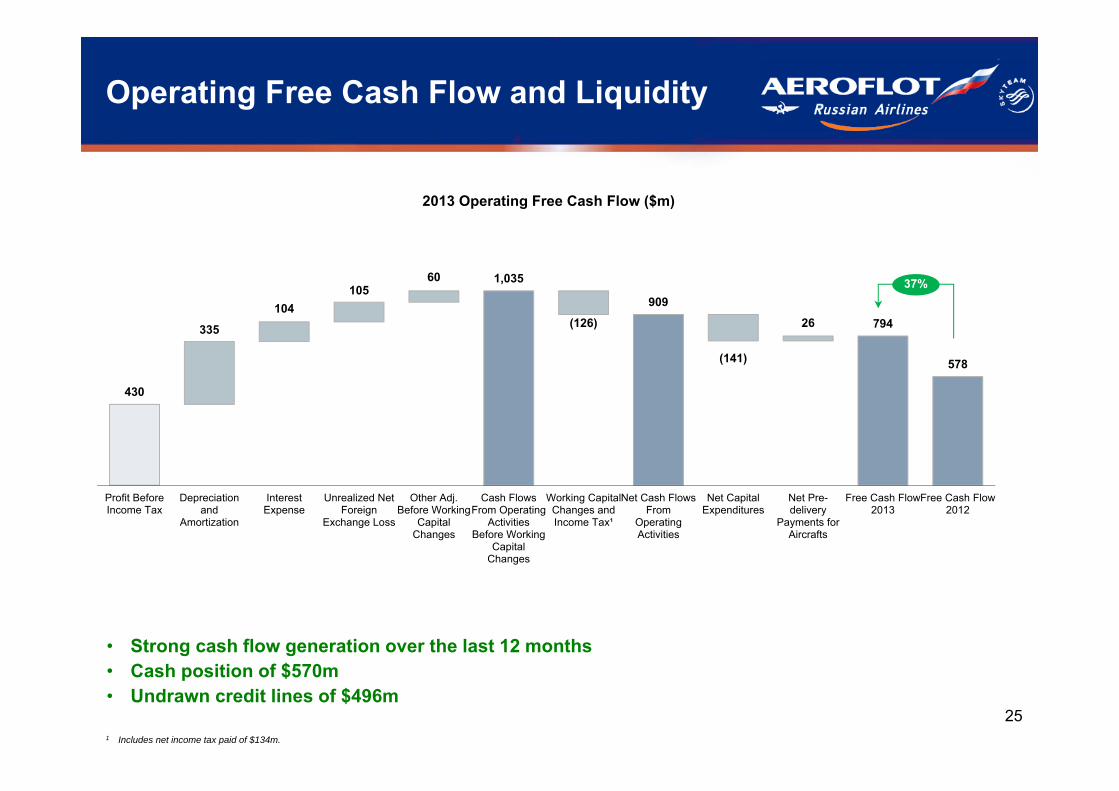
Operating Free Cash Flow and Liquidity
• Strong cash flow generation over the last 12 months• Cash position of $570m• Undrawn credit lines of $496m
335
104 105
60
(126)
(141)
26
430
1,035
909
794
578
Profit BeforeIncome Tax
Depreciationand
Amortization
InterestExpense
Unrealized NetForeign
Exchange Loss
Other Adj.Before Working
CapitalChanges
Cash FlowsFrom Operating
ActivitiesBefore Working
CapitalChanges
Working CapitalChanges andIncome Tax¹
Net Cash FlowsFrom
OperatingActivities
Net CapitalExpenditures
Net Pre-delivery
Payments forAircrafts
Free Cash Flow2013
Free Cash Flow2012
2013 Operating Free Cash Flow ($m)
37%
1 Includes net income tax paid of $134m.
26
Table of Contents
1. Key Highlights
2. Market Update
3. Operating Performance
4. Financial Performance
5. Capital Structure and Liquidity
6. Fleet Dynamics
7. Appendix
27
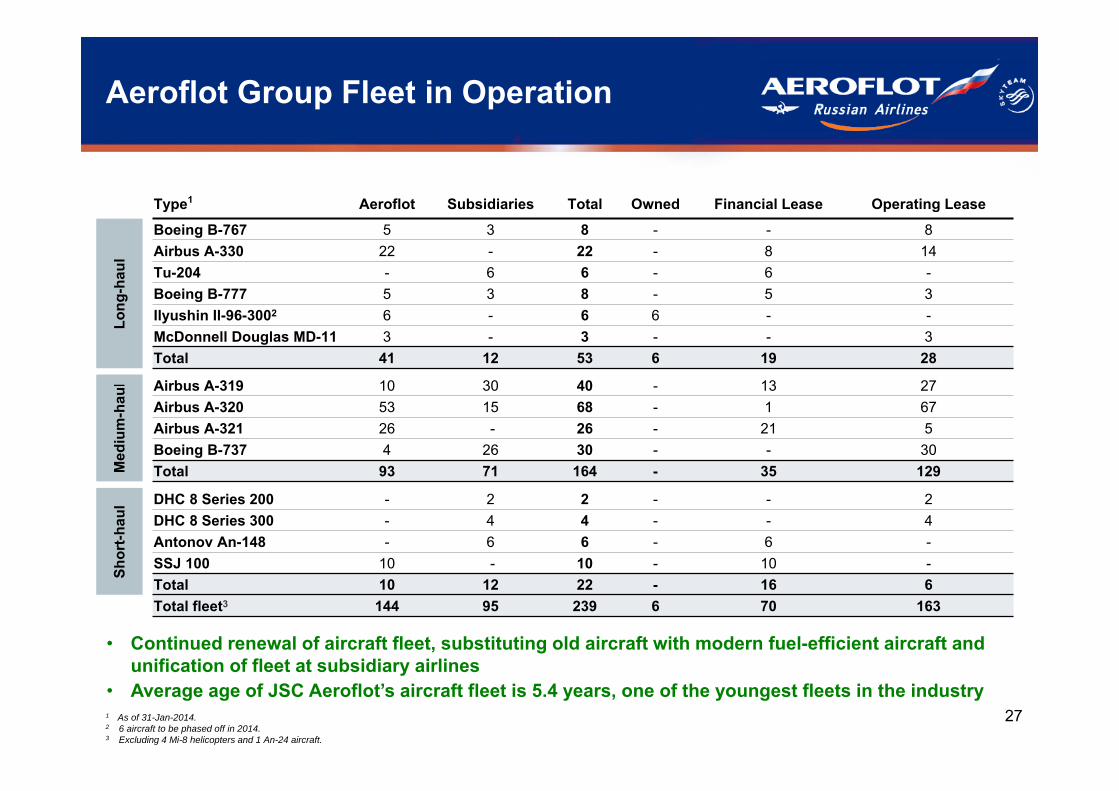
Aeroflot Group Fleet in Operation
• Continued renewal of aircraft fleet, substituting old aircraft with modern fuel-efficient aircraft and unification of fleet at subsidiary airlines
• Average age of JSC Aeroflot’s aircraft fleet is 5.4 years, one of the youngest fleets in the industry 1 As of 31-Jan-2014.2 6 aircraft to be phased off in 2014.3 Excluding 4 Mi-8 helicopters and 1 An-24 aircraft.
Type1 Aeroflot Subsidiaries Total Owned Financial Lease Operating Lease
Long
-hau
l
Boeing B-767 5 3 8 - - 8Airbus A-330 22 - 22 - 8 14Tu-204 - 6 6 - 6 -Boeing B-777 5 3 8 - 5 3Ilyushin Il-96-3002 6 - 6 6 - -McDonnell Douglas MD-11 3 - 3 - - 3Total 41 12 53 6 19 28
Med
ium
-hau
l Airbus A-319 10 30 40 - 13 27Airbus A-320 53 15 68 - 1 67Airbus A-321 26 - 26 - 21 5Boeing B-737 4 26 30 - - 30Total 93 71 164 - 35 129
Shor
t-hau
l DHC 8 Series 200 - 2 2 - - 2DHC 8 Series 300 - 4 4 - - 4Antonov An-148 - 6 6 - 6 -SSJ 100 10 - 10 - 10 -Total 10 12 22 - 16 6Total fleet3 144 95 239 6 70 163
28
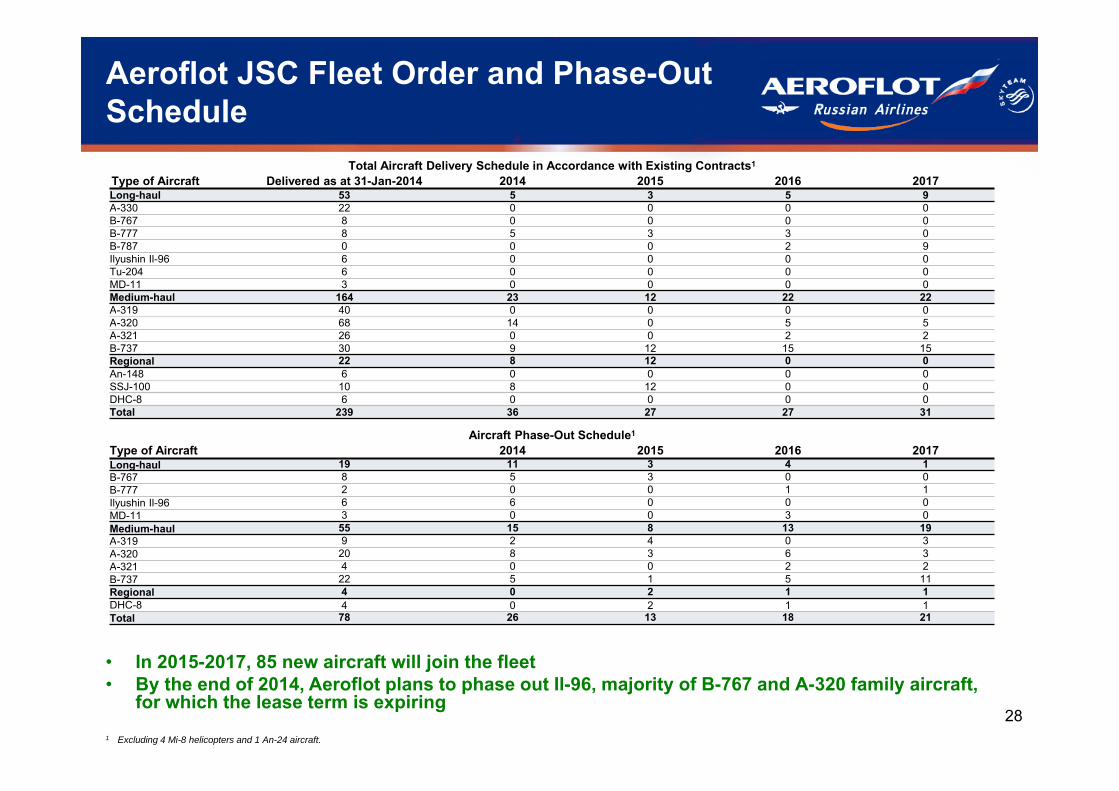
• In 2015-2017, 85 new aircraft will join the fleet• By the end of 2014, Aeroflot plans to phase out Il-96, majority of B-767 and А-320 family aircraft,
for which the lease term is expiring
Aeroflot JSC Fleet Order and Phase-Out Schedule
Total Aircraft Delivery Schedule in Accordance with Existing Contracts1
Type of Aircraft Delivered as at 31-Jan-2014 2014 2015 2016 2017Long-haul 53 5 3 5 9A-330 22 0 0 0 0B-767 8 0 0 0 0B-777 8 5 3 3 0B-787 0 0 0 2 9Ilyushin Il-96 6 0 0 0 0Tu-204 6 0 0 0 0MD-11 3 0 0 0 0Medium-haul 164 23 12 22 22A-319 40 0 0 0 0A-320 68 14 0 5 5A-321 26 0 0 2 2B-737 30 9 12 15 15Regional 22 8 12 0 0An-148 6 0 0 0 0SSJ-100 10 8 12 0 0DHC-8 6 0 0 0 0Total 239 36 27 27 31
Aircraft Phase-Out Schedule1
Type of Aircraft 2014 2015 2016 2017Long-haul 19 11 3 4 1B-767 8 5 3 0 0B-777 2 0 0 1 1Ilyushin Il-96 6 6 0 0 0MD-11 3 0 0 3 0Medium-haul 55 15 8 13 19A-319 9 2 4 0 3A-320 20 8 3 6 3A-321 4 0 0 2 2B-737 22 5 1 5 11Regional 4 0 2 1 1DHC-8 4 0 2 1 1Total 78 26 13 18 21
1 Excluding 4 Mi-8 helicopters and 1 An-24 aircraft.
29
Table of Contents
1. Key Highlights
2. Market Update
3. Operating Performance
4. Financial Performance
5. Capital Structure and Liquidity
6. Fleet Dynamics
7. Appendix
30
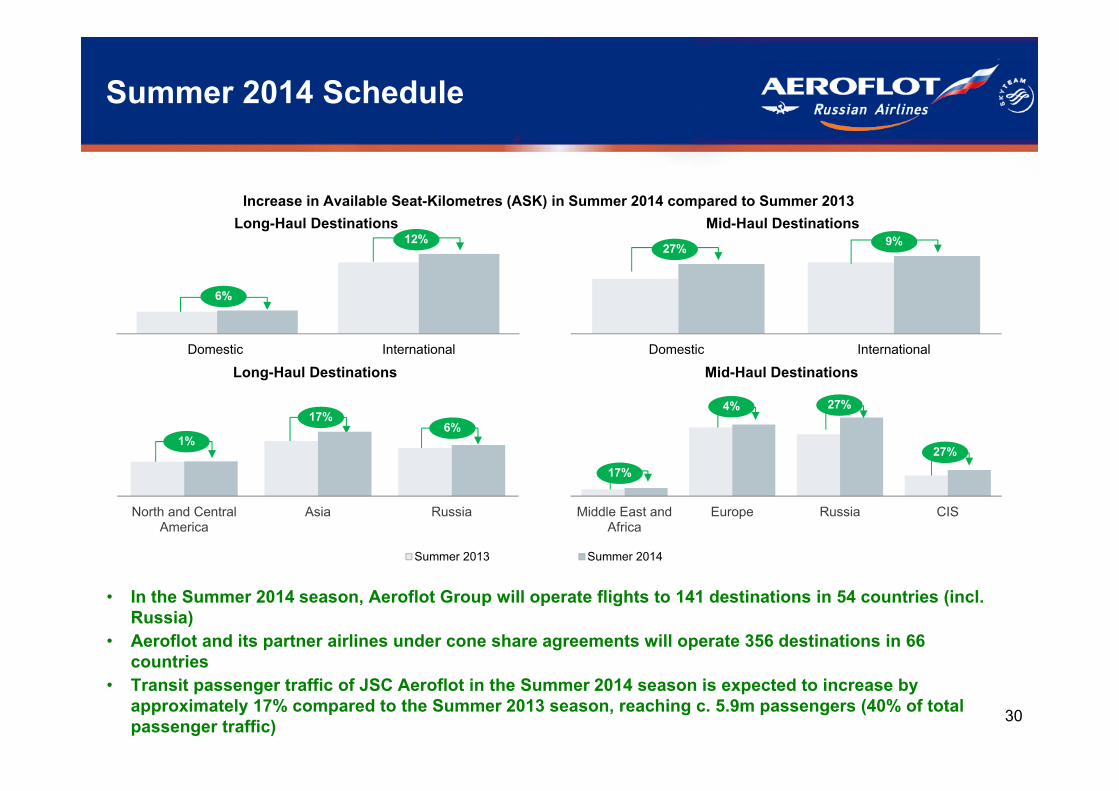
Summer 2014 Schedule
• In the Summer 2014 season, Aeroflot Group will operate flights to 141 destinations in 54 countries (incl. Russia)
• Aeroflot and its partner airlines under cone share agreements will operate 356 destinations in 66 countries
• Transit passenger traffic of JSC Aeroflot in the Summer 2014 season is expected to increase by approximately 17% compared to the Summer 2013 season, reaching c. 5.9m passengers (40% of total passenger traffic)
Increase in Available Seat-Kilometres (ASK) in Summer 2014 compared to Summer 2013Long-Haul Destinations Mid-Haul Destinations
Long-Haul Destinations Mid-Haul Destinations
Summer 2013 Summer 2014
Domestic International
North and CentralAmerica
Asia Russia
Domestic International
Middle East andAfrica
Europe Russia CIS
6%
12% 9%27%
4% 27%
27%1%
17%6%
17%
31
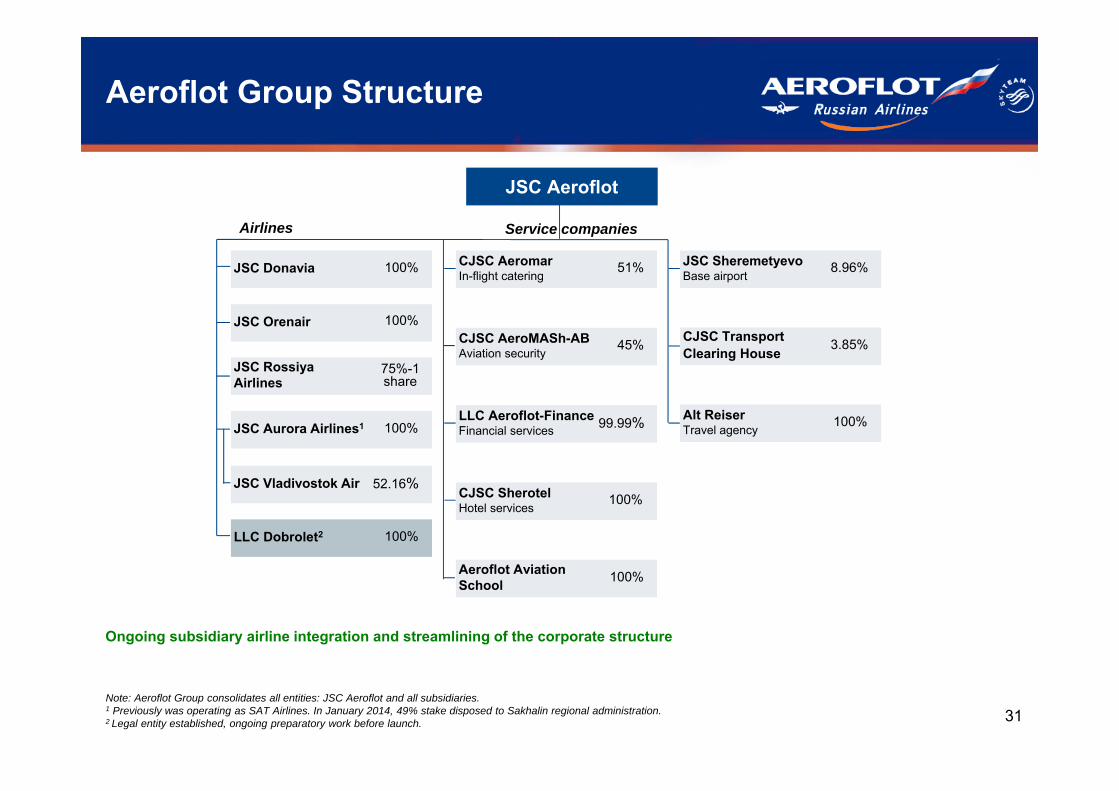
Aeroflot Group Structure
JSC Aurora Airlines1 100%
JSC Donavia 100%
JSC Rossiya Airlines
75%-1 share
JSC Orenair 100%
LLC Dobrolet2 100%
Aeroflot AviationSchool 100%
CJSC SherotelHotel services
100%
LLC Aeroflot-FinanceFinancial services 99.99%
CJSC AeroMASh-ABAviation security
45%
CJSC AeromarIn-flight catering
51%
CJSC Transport Clearing House 3.85%
Alt ReiserTravel agency
100%
Airlines Service companies
JSC Vladivostok Air 52.16%
JSC SheremetyevoBase airport
8.96%
Note: Aeroflot Group consolidates all entities: JSC Aeroflot and all subsidiaries. 1 Previously was operating as SAT Airlines. In January 2014, 49% stake disposed to Sakhalin regional administration.2 Legal entity established, ongoing preparatory work before launch.
Ongoing subsidiary airline integration and streamlining of the corporate structure
JSC Aeroflot
32
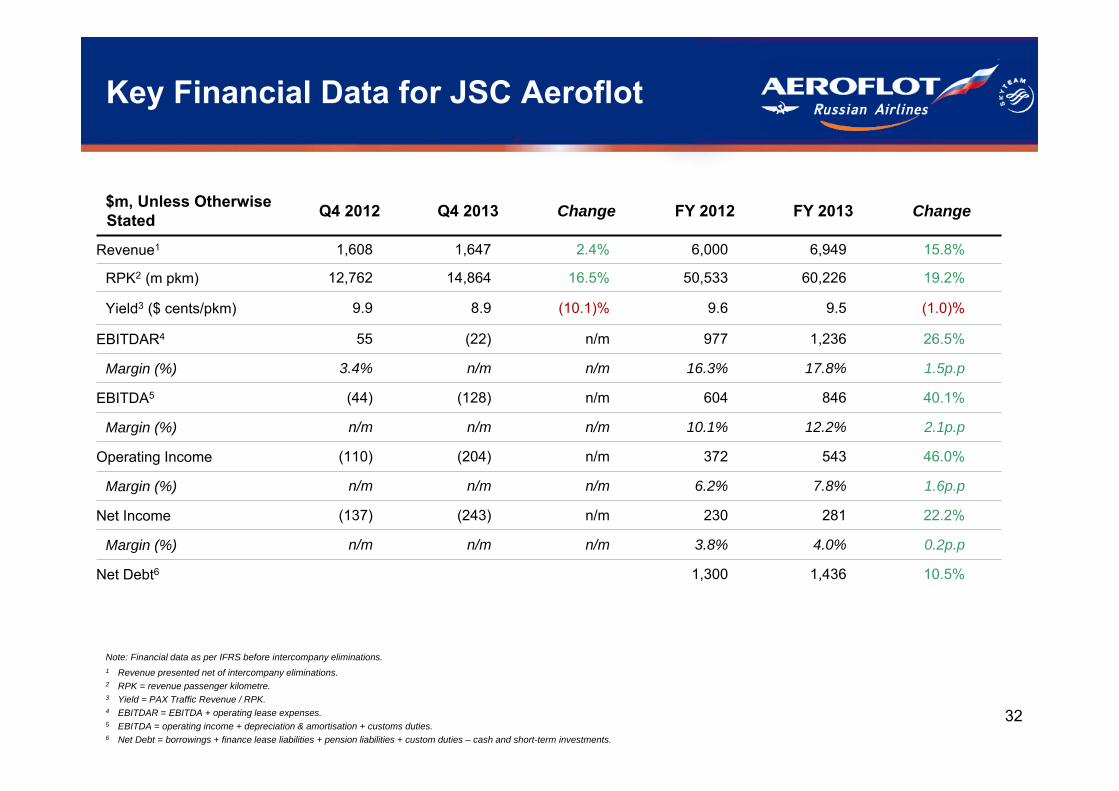
Key Financial Data for JSC Aeroflot
$m, Unless Otherwise Stated Q4 2012 Q4 2013 Change FY 2012 FY 2013 Change
Revenue1 1,608 1,647 2.4% 6,000 6,949 15.8%
RPK2 (m pkm) 12,762 14,864 16.5% 50,533 60,226 19.2%
Yield3 ($ cents/pkm) 9.9 8.9 (10.1)% 9.6 9.5 (1.0)%
EBITDAR4 55 (22) n/m 977 1,236 26.5%
Margin (%) 3.4% n/m n/m 16.3% 17.8% 1.5p.p
EBITDA5 (44) (128) n/m 604 846 40.1%
Margin (%) n/m n/m n/m 10.1% 12.2% 2.1p.p
Operating Income (110) (204) n/m 372 543 46.0%
Margin (%) n/m n/m n/m 6.2% 7.8% 1.6p.p
Net Income (137) (243) n/m 230 281 22.2%
Margin (%) n/m n/m n/m 3.8% 4.0% 0.2p.p
Net Debt6 1,300 1,436 10.5%
1 Revenue presented net of intercompany eliminations. 2 RPK = revenue passenger kilometre. 3 Yield = PAX Traffic Revenue / RPK.4 EBITDAR = EBITDA + operating lease expenses.5 EBITDA = operating income + depreciation & amortisation + customs duties.6 Net Debt = borrowings + finance lease liabilities + pension liabilities + custom duties – cash and short-term investments.
Note: Financial data as per IFRS before intercompany eliminations.
33
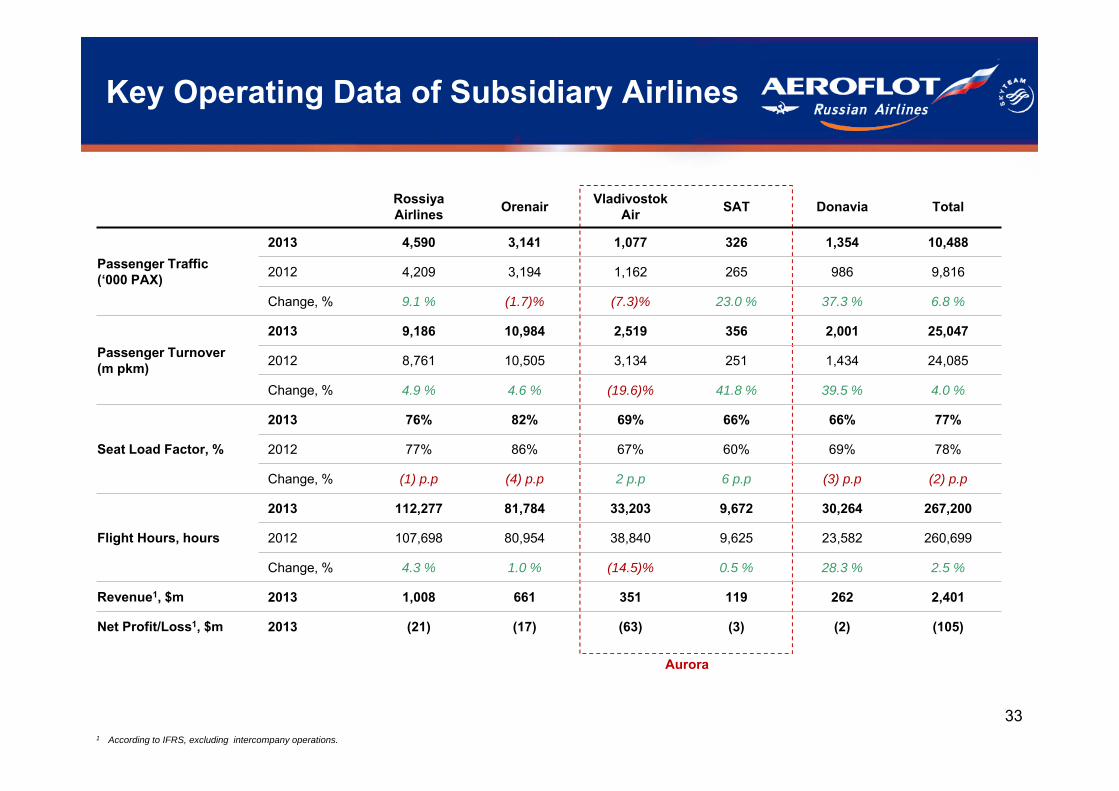
Rossiya Airlines Orenair Vladivostok
Air SAT Donavia Total
Passenger Traffic (‘000 PAX)
2013 4,590 3,141 1,077 326 1,354 10,488
2012 4,209 3,194 1,162 265 986 9,816
Change, % 9.1 % (1.7)% (7.3)% 23.0 % 37.3 % 6.8 %
Passenger Turnover (m pkm)
2013 9,186 10,984 2,519 356 2,001 25,047
2012 8,761 10,505 3,134 251 1,434 24,085
Change, % 4.9 % 4.6 % (19.6)% 41.8 % 39.5 % 4.0 %
Seat Load Factor, %
2013 76% 82% 69% 66% 66% 77%
2012 77% 86% 67% 60% 69% 78%
Change, % (1) p.p (4) p.p 2 p.p 6 p.p (3) p.p (2) p.p
Flight Hours, hours
2013 112,277 81,784 33,203 9,672 30,264 267,200
2012 107,698 80,954 38,840 9,625 23,582 260,699
Change, % 4.3 % 1.0 % (14.5)% 0.5 % 28.3 % 2.5 %
Revenue1, $m 2013 1,008 661 351 119 262 2,401
Net Profit/Loss1, $m 2013 (21) (17) (63) (3) (2) (105)
Key Operating Data of Subsidiary Airlines
1 According to IFRS, excluding intercompany operations.
Aurora
34
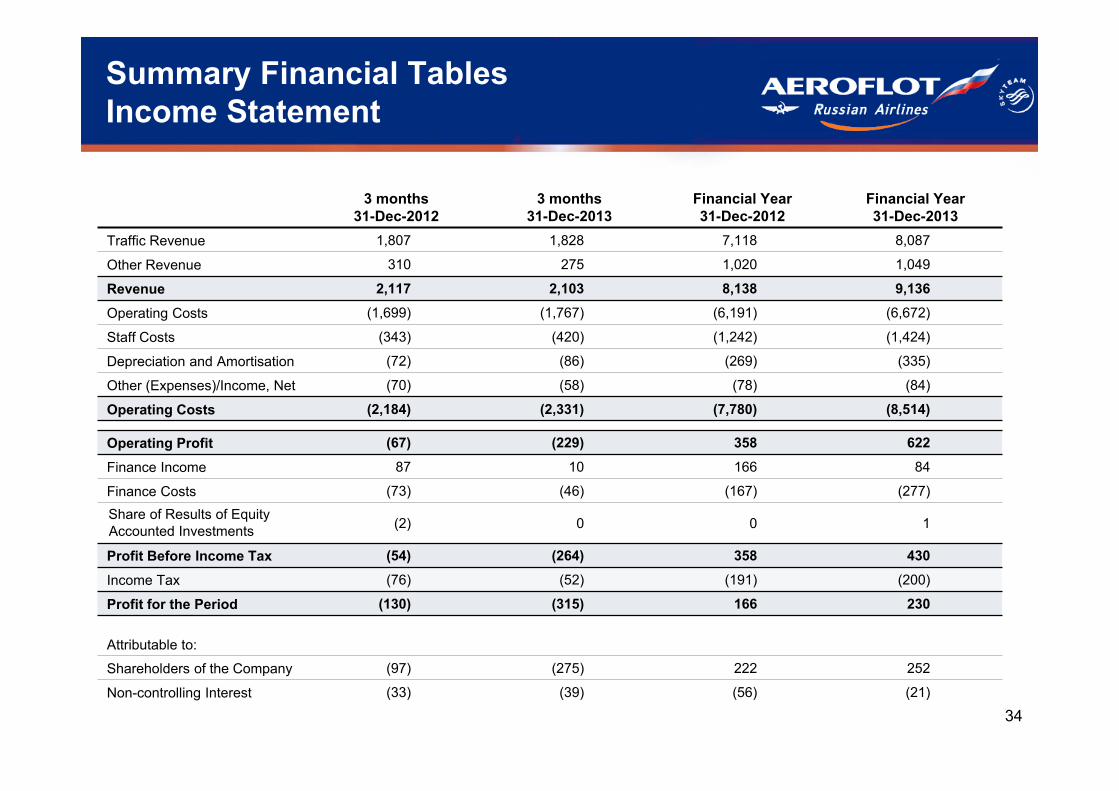
Summary Financial TablesIncome Statement
3 months31-Dec-2012
3 months31-Dec-2013
Financial Year31-Dec-2012
Financial Year31-Dec-2013
Traffic Revenue 1,807 1,828 7,118 8,087
Other Revenue 310 275 1,020 1,049
Revenue 2,117 2,103 8,138 9,136
Operating Costs (1,699) (1,767) (6,191) (6,672)
Staff Costs (343) (420) (1,242) (1,424)
Depreciation and Amortisation (72) (86) (269) (335)
Other (Expenses)/Income, Net (70) (58) (78) (84)
Operating Costs (2,184) (2,331) (7,780) (8,514)
Operating Profit (67) (229) 358 622
Finance Income 87 10 166 84
Finance Costs (73) (46) (167) (277)Share of Results of Equity Accounted Investments (2) 0 0 1
Profit Before Income Tax (54) (264) 358 430
Income Tax (76) (52) (191) (200)
Profit for the Period (130) (315) 166 230
Attributable to:
Shareholders of the Company (97) (275) 222 252
Non-controlling Interest (33) (39) (56) (21)
35
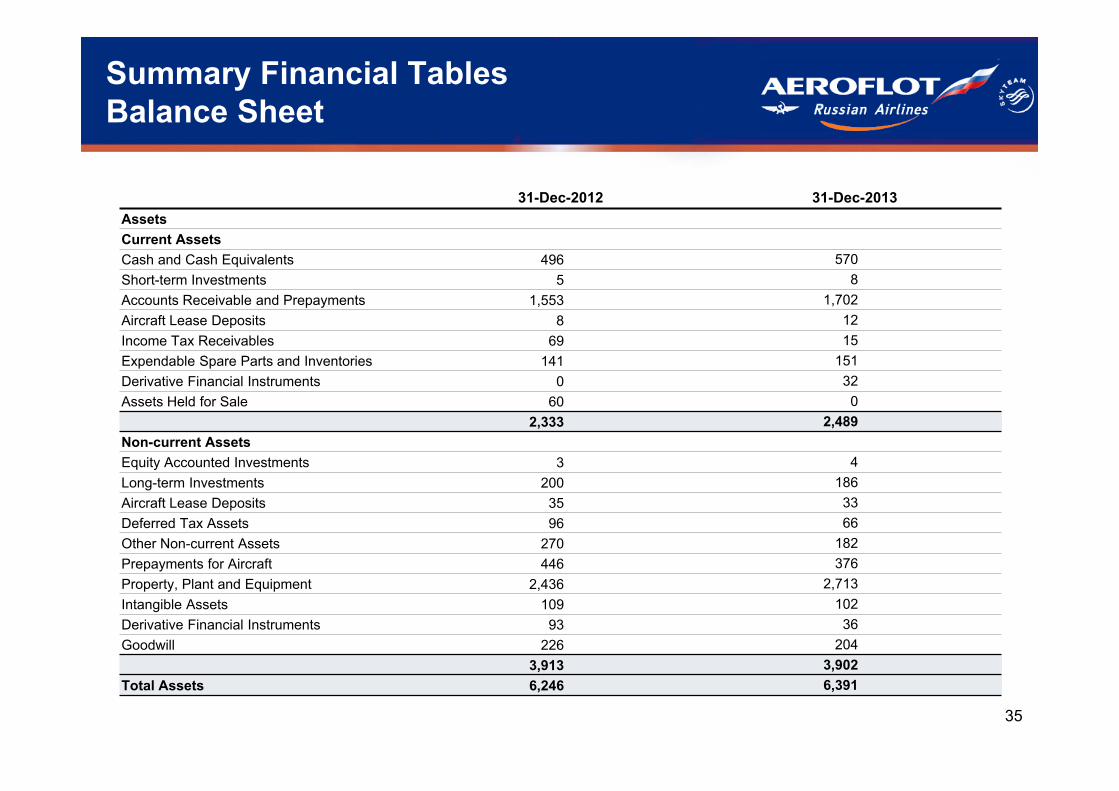
Summary Financial TablesBalance Sheet
31-Dec-2012 31-Dec-2013AssetsCurrent AssetsCash and Cash Equivalents 496 570 Short-term Investments 5 8 Accounts Receivable and Prepayments 1,553 1,702 Aircraft Lease Deposits 8 12 Income Tax Receivables 69 15 Expendable Spare Parts and Inventories 141 151 Derivative Financial Instruments 0 32 Assets Held for Sale 60 0
2,333 2,489 Non-current AssetsEquity Accounted Investments 3 4 Long-term Investments 200 186 Aircraft Lease Deposits 35 33 Deferred Tax Assets 96 66 Other Non-current Assets 270 182 Prepayments for Aircraft 446 376 Property, Plant and Equipment 2,436 2,713 Intangible Assets 109 102 Derivative Financial Instruments 93 36 Goodwill 226 204
3,913 3,902 Total Assets 6,246 6,391
36
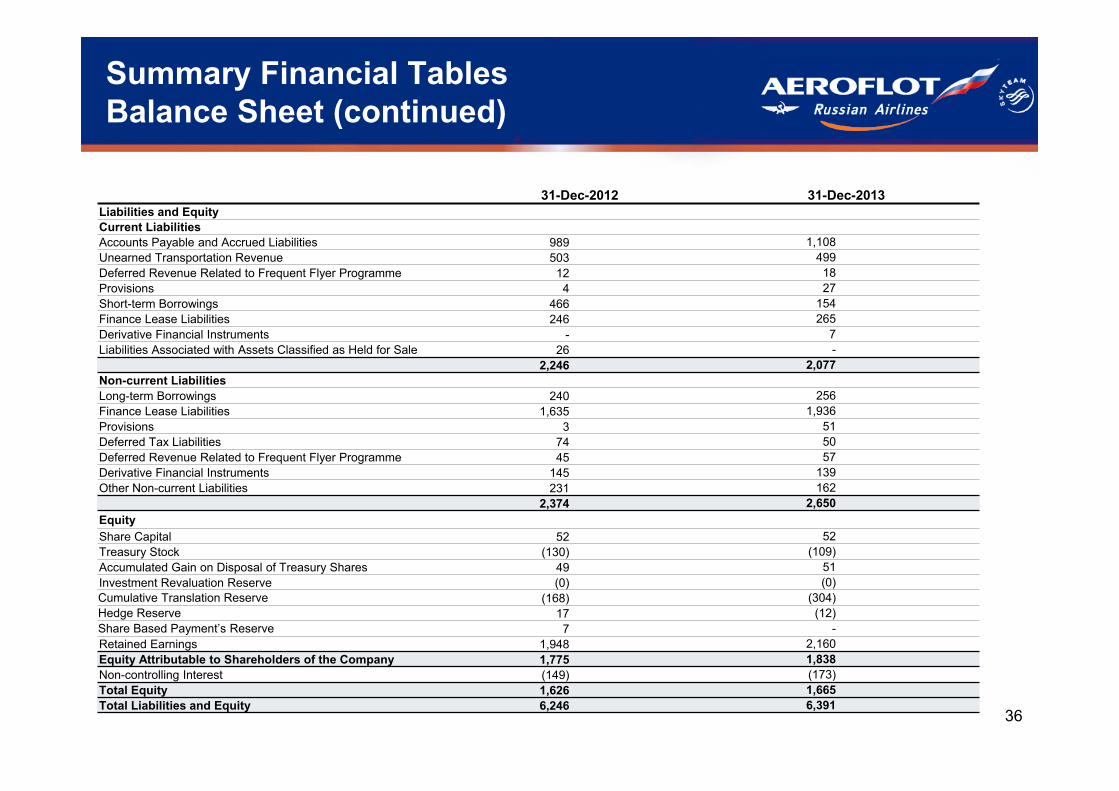
Summary Financial TablesBalance Sheet (continued)
31-Dec-2012 31-Dec-2013Liabilities and EquityCurrent LiabilitiesAccounts Payable and Accrued Liabilities 989 1,108 Unearned Transportation Revenue 503 499 Deferred Revenue Related to Frequent Flyer Programme 12 18 Provisions 4 27 Short-term Borrowings 466 154 Finance Lease Liabilities 246 265 Derivative Financial Instruments - 7 Liabilities Associated with Assets Classified as Held for Sale 26 -
2,246 2,077 Non-current LiabilitiesLong-term Borrowings 240 256 Finance Lease Liabilities 1,635 1,936 Provisions 3 51 Deferred Tax Liabilities 74 50 Deferred Revenue Related to Frequent Flyer Programme 45 57 Derivative Financial Instruments 145 139 Other Non-current Liabilities 231 162
2,374 2,650 EquityShare Capital 52 52 Treasury Stock (130) (109)Accumulated Gain on Disposal of Treasury Shares 49 51 Investment Revaluation Reserve (0) (0)Cumulative Translation Reserve (168) (304)Hedge Reserve 17 (12)Share Based Payment’s Reserve 7 -Retained Earnings 1,948 2,160 Equity Attributable to Shareholders of the Company 1,775 1,838 Non-controlling Interest (149) (173)Total Equity 1,626 1,665 Total Liabilities and Equity 6,246 6,391

37
Financial Year31-Dec-2012
Financial Year31-Dec-2013
Operating Profit Before Working Capital Changes 700 1,035
Net Cash Flows from Operating Activities 541 909
Net Cash Flows Used in Investing Activities 41 (113)
Net Cash Flows Used in Financing Activities (502) (684)
Net Increase/(Decrease) in Cash and Cash Equivalents 103 74
Cash and Cash Equivalents at the End of the Period 496 570
Summary Financial TablesCondensed Cash Flow Statement