Aerial survey Cruise No. TO11-02 summer 2011 November 2011 Page 1 CRUISE RESULTS Aerial survey...
18
16 November 2011 Page 1 CRUISE RESULTS Aerial survey Cruise No. TO11-02 North Atlantic Shelf Marine Mammal and Turtle Aerial Abundance Survey: part of the AMAPPS project summer 2011 ABSTRACT During 7 - 26 August 2011, the Northeast Fisheries Science Center (NEFSC) conducted an aerial abundance survey targeting marine mammals and sea turtles. The NEFSC’s survey covered waters from Long Island, New York, USA to the southern tip of Nova Scotia, Canada, and from the coast line to about the 100 m depth contour. This aerial survey was a component of the AMAPPS project, where the Southeast Fisheries Science Center’s aerial survey covered Atlantic Ocean waters from the southern tip of Florida to Long Island, New York and also targeted marine mammals and sea turtles. The results from the NEFSC aerial survey are reported in this document. The airplane flew at 600 feet above the water surface at about 110 knots. The two independent team data collection methods were used. Within the study area of 199,656 km 2 , there were about 6,481 km of on-effort track lines, of which 5,979 km were conducted in sea state conditions less than Beaufort 4. On these track lines, there were 10 species of identifiable cetaceans, and 3 sea turtle species detected. CRUISE PERIOD AND AREA The aerial survey was scheduled for 1 – 31 August 2011. The survey was conducted during 7 - 26 August 2011. The plane was unavailable during 1 – 6 August as the 100 hour normal maintenance was conducted during this week. The plane was also unavailable during 27 – 31 August because it was re-assigned to cover emergency weather related flights in the southern US. The study area extended from Long Island, New York, USA to the southern tip of Nova Scotia, Canada, from the coast line to about the 100 m depth contour (Figure 1). OBJECTIVES The objectives of the NEFSC aerial survey were 1) to estimate abundance of cetaceans and turtles in waters north of New Jersey and shallower than 100 m depth and 2) to investigate how the animal’s distribution and abundance relate to their physical and biological ecosystem. This survey was part of the AMAPPS project. The cetacean and turtle abundance estimates will form part of the information essential to assess the impact of anthropogenic threats on those populations. It is also important
Transcript of Aerial survey Cruise No. TO11-02 summer 2011 November 2011 Page 1 CRUISE RESULTS Aerial survey...
16 November 2011 Page 1
CRUISE RESULTS
Aerial survey Cruise No. TO11-02
North Atlantic Shelf Marine Mammal and Turtle Aerial Abundance Survey:
part of the AMAPPS project summer 2011
ABSTRACT During 7 - 26 August 2011, the Northeast Fisheries Science Center (NEFSC) conducted an aerial abundance survey targeting marine mammals and sea turtles. The NEFSC’s survey covered waters from Long Island, New York, USA to the southern tip of Nova Scotia, Canada, and from the coast line to about the 100 m depth contour. This aerial survey was a component of the AMAPPS project, where the Southeast Fisheries Science Center’s aerial survey covered Atlantic Ocean waters from the southern tip of Florida to Long Island, New York and also targeted marine mammals and sea turtles. The results from the NEFSC aerial survey are reported in this document. The airplane flew at 600 feet above the water surface at about 110 knots. The two independent team data collection methods were used. Within the study area of 199,656 km2, there were about 6,481 km of on-effort track lines, of which 5,979 km were conducted in sea state conditions less than Beaufort 4. On these track lines, there were 10 species of identifiable cetaceans, and 3 sea turtle species detected.
CRUISE PERIOD AND AREA
The aerial survey was scheduled for 1 – 31 August 2011. The survey was conducted during 7 - 26 August 2011. The plane was unavailable during 1 – 6 August as the 100 hour normal maintenance was conducted during this week. The plane was also unavailable during 27 – 31 August because it was re-assigned to cover emergency weather related flights in the southern US. The study area extended from Long Island, New York, USA to the southern tip of Nova Scotia, Canada, from the coast line to about the 100 m depth contour (Figure 1). OBJECTIVES The objectives of the NEFSC aerial survey were 1) to estimate abundance of cetaceans and turtles in waters north of New Jersey and shallower than 100 m depth and 2) to investigate how the animal’s distribution and abundance relate to their physical and biological ecosystem. This survey was part of the AMAPPS project. The cetacean and turtle abundance estimates will form part of the information essential to assess the impact of anthropogenic threats on those populations. It is also important

16 November 2011 Page 2
in determining appropriate management actions to ensure the favorable conservation status of cetacean populations and in monitoring whether the management actions are having the desired effect. The cetacean data from the line transect aerial survey will be analyzed to estimate abundance which can then be used to calculate PBR, the Potential Biological Removal level. The PBR level can then be compared to levels of bycatch to assess the status of a cetacean population. In addition, the spatially-explicit distribution and abundance of cetaceans and turtles will be compared to physical and biological features of their environment. Physical features that will be investigated include the bottom water depth, slope and sediment type. Biological features include surface chlorophyll levels and indirect measurements such as the surface water temperature, currents and fronts. METHODS The aerial survey (Figure 1) were conducted on a DeHavilland Twin Otter DHC-6 aircraft over Atlantic Ocean waters off the east coast of the US and Canada. Track lines were flown 183 m (600 ft) above the water surface, at about 200 kph (110 knots), when Beaufort sea state conditions were below five, and when there was at least two miles of visibility. There were two pilots and six scientists onboard. There are three observers, two recorders and one person on rest. One of the observers was searching through the belly window, one in the starboard (right) bubble window and one in the port (left) bubble window. These scientists comprised two teams. One team, the primary forward team, consisted of two observers viewing through the two forward bubble windows and a recorder. The other team, the independent back team, consisted of one observer viewing through the belly window and a recorder. The two teams did not communicate with each other. Scientists rotated amount the observations positions at the end of track lines or about every 30-40 minutes. The belly window observer was limited to approximately a 30º view on both sides of the track line. The bubble window observers searched from straight down to the horizon, with a concentration on waters between straight down (0º) and about 60º up from straight down. When a cetacean, seal, turtle, sunfish, or basking shark was observed the following data were collected:
· time animal passed perpendicular to the observer; species identification; best
estimate of the group size; · angle of declination between the track line and location of the animal group when it
passed abeam (measured by inclinometers or marks on the windows, where 0º is straight down);
· cue (animal, splash, blow, footprint, birds, vessel/gear, windrows, disturbance, or other);

16 November 2011 Page 3
· swim direction (0º indicates swimming parallel to the track line in the direction the plane was flying, 90º indicates swimming perpendicular to the track line and towards the right, etc.);
· if the animal appeared to react to the plane (yes or no); · if the animal was diving (yes or no), and; · comments, if any. Other fish species were also recorded opportunistically. Species identifications were recorded to the lowest taxonomic level possible. This resulted in species specific identifications only when the observers were certain of the identification; otherwise, the group was identified to a higher level of identification (e.g. fin or sei whale, or unidentified dolphin). At the beginning of each leg, and when conditions changed the following effort data were collected:
· initials of person in the two pilot seats and three observation stations; · Beaufort sea state recorded to one decimal place; · water turbidity (clear, moderately clear or turbid); · percentage of cloud cover (0-100%); · angle glare swath started and ended at (0-359º), where 0º was the track line in the
direction of flight and 90º was directly abeam to the right side of the track line; · magnitude of glare (none, slight, moderate, and excessive); and · subjective overall quality (excellent, good, moderate, fair, and poor), where data
collected in poor conditions indicated conditions were so poor that that part of the track line should not be used in analyses.
In addition, the location of the plane was recorded every two seconds with a GPS that was attached to the data entry program. Sightings and effort data were collected by a computer program called VOR.exe, version 8.75 originally created by Lovell and Hiby. RESULTS Of the 31 days allocated to this project, 11 days had sufficiently good weather to conduct the survey and the plane was available. The study area was 199,656 km2. There were 6,481 km of “on-effort” track lines, of which 5,979 km (92%) were surveyed in Beaufort 3 or less (Table 1). On the on-effort track lines, there were 10 species of identifiable cetaceans detected. These included minke, fin, sei, right, sperm, and humpback whales, white-sided, common, and bottlenose dolphins; and harbor porpoises. In addition, leatherback, loggerhead, and green turtles, basking sharks, hammerhead sharks, sunfish and seals were also seen (Table 2).

16 November 2011 Page 4
The locations of sightings seen on the on-effort transect legs, by species, are displayed in Figures 2 to 12, where porpoises are in Figure 2, dolphins in Figures 3 – 4, whales in Figures 5 – 7, seals in Figure 8, sea turtles in Figure 9, and other species in Figures 10 – 12. LIST OF TABLES Table 1. Lengths of on-effort track lines covered during summer 2011 NEFSC aerial abundance survey during various Beaufort sea states. Table 2. Number of groups and individuals of the species detected by each team, while on-effort. LIST OF FIGURES Figure 1. On-effort tracklines completed during the August 2011 AMAPPS aerial survey. Line colors correspond to Beaufort sea state survey was conducted in. Figure 2-16. Location of sightings detected during 7 – 26 August 2011 aerial abundance survey. Figure 2. Harbor porpoises
Figure 3. White-sided dolphins and common dolphins Figure 4. Bottlenose dolphins and unidentified dolphins Figure 5. Fin whales, sei whales, and whales that were either a fin or sei whale Figure 6. Minke whales Figure 7. Humpback, right, sperm, and unidentified whales Figure 8. Seals Figure 9. Green, leatherback, loggerhead, and unidentified turtles Figure 10. Basking sharks Figure 11. Ocean sun fishes Figure 12. Blue, hammerhead, thrasher and unidentified sharks

16 November 2011 Page 5
Table 1. Lengths of on-effort track lines covered during summer 2011 NEFSC aerial abundance survey during various Beaufort sea states. Beaufort sea states
0 1 2 3 4 5 Total
Lengths(km) 132.4 2271.4 2069.3 1506 501.2 0.1 6480.4 Percent 0.02 0.35 0.32 0.23 0.08 0.00 1
Cum percentage 0.02 0.37 0.69 0.92 1 1

16 November 2011 Page 6
Table 2. Number of groups and individuals of the species detected by each team, while on-effort.
Species number of groups
number of individuals
back front back front Bottlenose dolphin spp. Tursiops truncatus 0 3 0 4 Common dolphin Delphinus delphis 8 11 113 415 Fin whale Balaenoptera physalus 0 7 0 7
Fin/sei whales B. physalus or B. borealis 0 4 0 4
Harbor porpoise Phocoena phocoena 60 129 185 375
Humpback whale Megaptera novaeangliae 0 8 0 10
Minke whale B. acutorostrata 3 18 3 18 Right whale Eubalaena glacialis 0 1 0 1 Sei whale Balaenoptera borealis 1 1 1 1
Sperm whale Physeter macrocephalus 0 2 0 2
Common or white-sided dolphin 3 2 7 20 Unid. Dolphin Delphinidae 2 6 2 29 Unid. Whale Mysticeti 2 8 2 8
White-sided dolphin Lagenorhynchus acutus 11 16 122 234
TOTAL CETACEANS 90 216 435
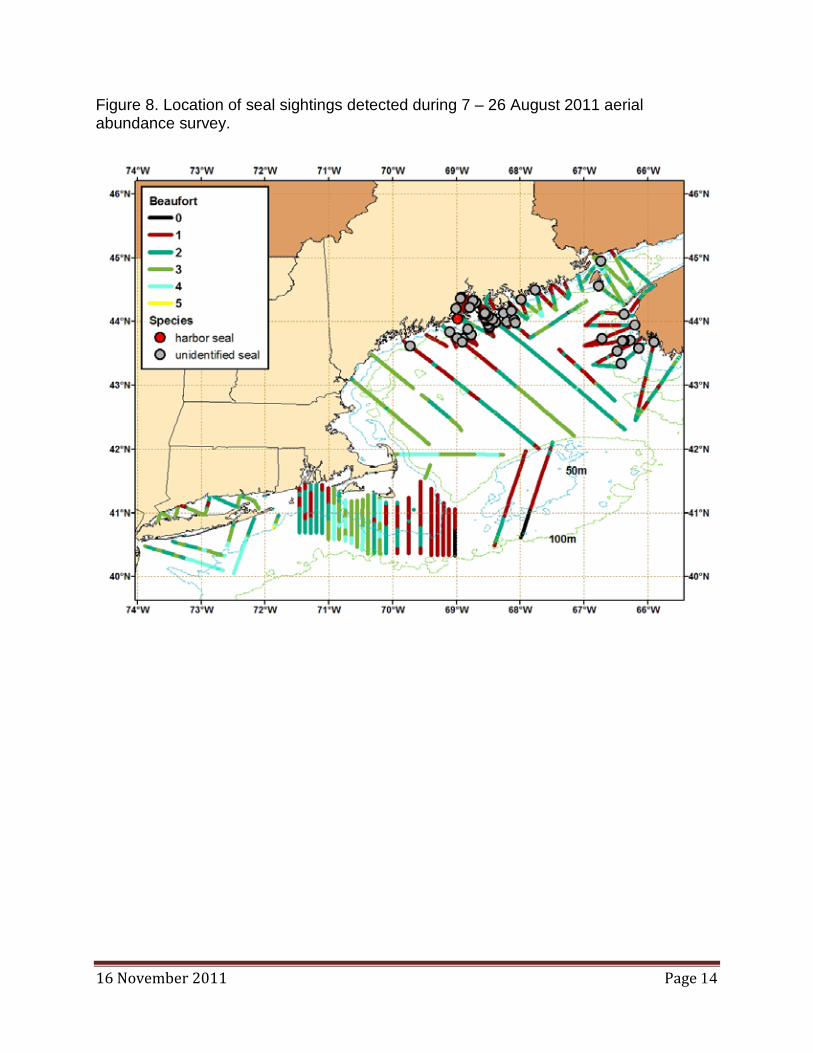
1,128 Basking shark Cetorhinus maximus 24 61 27 65 Ocean sunfish Mola mola 71 236 73 253 Hammerhead shark Sphyrnidae 1 1 1 1 Leatherback turtle Dermochelys coriacea 9 31 9 32 Loggerhead turtle Caretta caretta 12 21 12 22 Green turtle Chelonia mydas 0 5 0 5 Unid turtle Chelonioidea 3 3 3 3
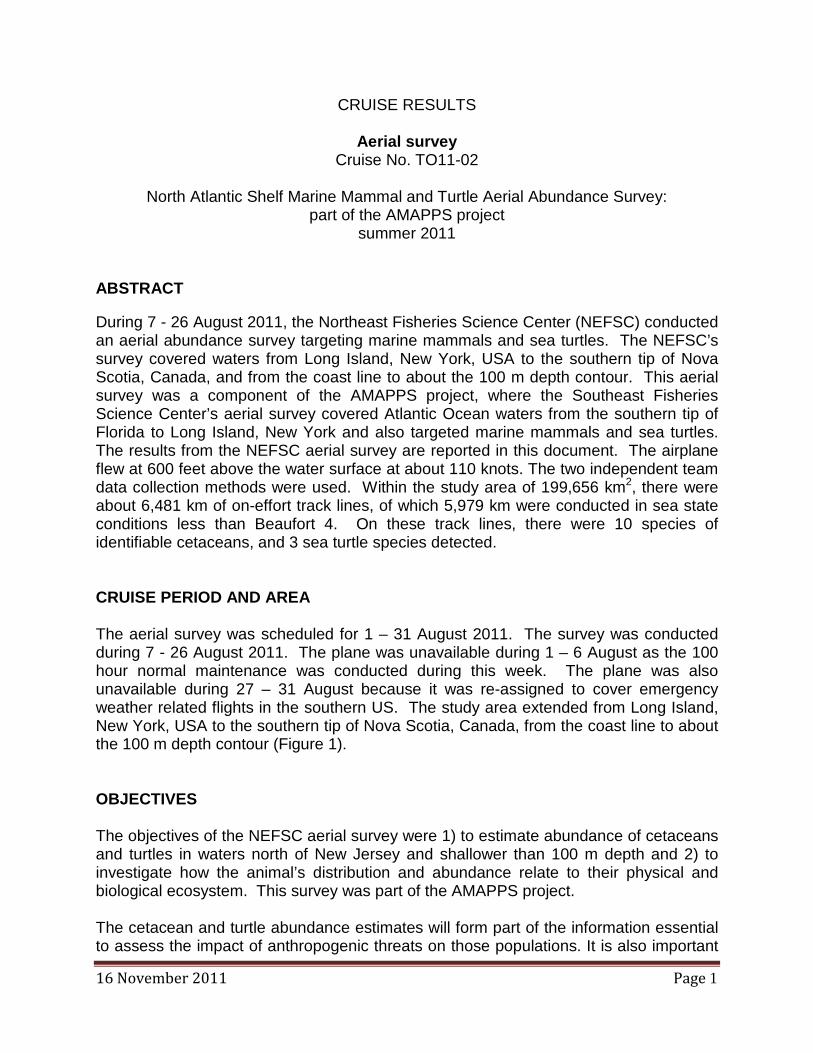
harbor seal Phoca vitulina 2 2 2 2 Unid seal Pinniped 12 35 13 38
TOTAL ALL SPECIES 224 611
575
1,549

16 November 2011 Page 7
Figure 1. On-effort tracklines completed during the August 2011 AMAPPS aerial survey. Line colors correspond to Beaufort sea state survey was conducted in.

16 November 2011 Page 8
Figure 2. Location of harbor porpoise sightings detected during 7 – 26 August 2011 aerial abundance survey.

16 November 2011 Page 9
Figure 3. Location of white-sided and common dolphin sightings detected during 7 – 26 August 2011 aerial abundance survey.

16 November 2011 Page 10
Figure 4. Location of bottlenose dolphin and unidentified dolphin sightings detected during 7 – 26 August 2011 aerial abundance survey.

16 November 2011 Page 11
Figure 5. Location of sightings of fin whales, sei whales, and whales that were either a fin or sei whale which were detected during 7 – 26 August 2011 aerial abundance survey.

16 November 2011 Page 12
Figure 6. Location of minke whale sightings detected during 7 – 26 August 2011 aerial abundance survey.

16 November 2011 Page 13
Figure 7. Location of humpback, right, sperm, and unidentified whales sightings detected during 7 – 26 August 2011 aerial abundance survey.
16 November 2011 Page 14
Figure 8. Location of seal sightings detected during 7 – 26 August 2011 aerial abundance survey.

16 November 2011 Page 15
Figure 9. Location of green, leatherback, loggerhead, and unidentified turtle sightings detected during 7 – 26 August 2011 aerial abundance survey.

16 November 2011 Page 16
Figure 10. Location of basking shark sightings detected during 7 – 26 August 2011 aerial abundance survey.
16 November 2011 Page 17
Figure 11. Location of ocean sun fish sightings detected during 7 – 26 August 2011 aerial abundance survey.

16 November 2011 Page 18
Figure 12. Location of blue, hammerhead, thrasher and unidentified sharks detected during 7 – 26 August 2011 aerial abundance survey.