Aerial Deployable Autonomous Solar Powered Glider
39
1 American Institute of Aeronautics and Astronautics Senior Project Final Draft: Aerial Deployable Autonomous Solar Powered Glider Brandon Groshong 1 and Jacob Ohana 1 California Polytechnic State University, San Luis Obispo, CA Awareness of green solutions to powered flight is a new trend taking the Aerospace Industry by storm. One particular application that shows high promise is that of photovoltaics on small UAV-type aircraft to help extend flight time. The purpose of this report is to document both research and experimentation performed on a small RC aircraft in order to better understand the electrical requirements of such a device. Using that research, speculation on how it can be used to design a mobile Aerial Deployable Autonomous Solar Powered Glider will be performed. Technologies such as CIGS solar cells and Lithium Polymer batteries showed potential as light-weight, high-efficiency sources of power and energy for our system. A theoretical power output of 66.7 W could be produced if the entire .356 m 2 surface of the RC aircraft was covered in CIGS solar cells. As far as experimentation is concerned, it was found that a modest system current of 550 mA and voltage 5.4 V were required to run the RC aircraft servos and receiver at max conditions, using a set of four Ni-Cd batteries. At this current, the glider can last one hour (with margin) using 600mAh Li-Po batteries at that critical 550 mA current. A system power rating of 2.97 W was identified in the RC aircraft, compared to the 39.15 W generated by the solar panels experimented on separately. This led research to focus on the charging requirements as a driver for design rather than the power consumption of the servos. Further research showed that an average voltage of 12V is used for charging most hand-held devices. Ultimately, design created an aircraft that would operate at 14.8V (the voltage of four combined Li-Po batteries in series), being charged by CIGS solar cells. Nomenclature = total ampere flow through solar cell (amperes) = area of rectangle (inches 2 ) = area of solar panels (inches 2 ) = area of triangle (inches 2 ) = area of wings (inches 2 ) AC = alternating current (amperes) ADASPG = aerial deployable autonomous solar powered glider BOM = bill of materials , = ideal maximum capacity (watt-hours) , = ideal maximum capacity (watt-hours) = actual solar cell efficiency CIGS = copper indium gallium diselenide DC = direct current (amperes) = solar panel efficiency GPS = global positioning system h = height (inches) = current passing through battery (amperes) l = length (inches) Li-Ion = lithium ion Li-Po = lithium polymer 1 Student, California Polytechnic San Luis Obispo, 93410
Transcript of Aerial Deployable Autonomous Solar Powered Glider
1
American Institute of Aeronautics and Astronautics
Senior Project Final Draft:
Aerial Deployable Autonomous Solar Powered Glider
Brandon Groshong1 and Jacob Ohana1 California Polytechnic State University, San Luis Obispo, CA
Awareness of green solutions to powered flight is a new trend taking the Aerospace Industry by storm. One
particular application that shows high promise is that of photovoltaics on small UAV-type aircraft to help
extend flight time. The purpose of this report is to document both research and experimentation performed
on a small RC aircraft in order to better understand the electrical requirements of such a device. Using that
research, speculation on how it can be used to design a mobile Aerial Deployable Autonomous Solar Powered
Glider will be performed. Technologies such as CIGS solar cells and Lithium Polymer batteries showed
potential as light-weight, high-efficiency sources of power and energy for our system. A theoretical power
output of 66.7 W could be produced if the entire .356 m2 surface of the RC aircraft was covered in CIGS solar
cells. As far as experimentation is concerned, it was found that a modest system current of 550 mA and
voltage 5.4 V were required to run the RC aircraft servos and receiver at max conditions, using a set of four
Ni-Cd batteries. At this current, the glider can last one hour (with margin) using 600mAh Li-Po batteries at
that critical 550 mA current. A system power rating of 2.97 W was identified in the RC aircraft, compared to
the 39.15 W generated by the solar panels experimented on separately. This led research to focus on the
charging requirements as a driver for design rather than the power consumption of the servos. Further
research showed that an average voltage of 12V is used for charging most hand-held devices. Ultimately,
design created an aircraft that would operate at 14.8V (the voltage of four combined Li-Po batteries in series),
being charged by CIGS solar cells.
Nomenclature
����� = total ampere flow through solar cell (amperes)
�������� = area of rectangle (inches2)
����� ���� = area of solar panels (inches2) �� ���� = area of triangle (inches2)
��� = area of wings (inches2)
AC = alternating current (amperes) ADASPG = aerial deployable autonomous solar powered glider BOM = bill of materials
����,������ = ideal maximum capacity (watt-hours)
����,����� = ideal maximum capacity (watt-hours)
�������� = actual solar cell efficiency CIGS = copper indium gallium diselenide DC = direct current (amperes) ����� ���� = solar panel efficiency GPS = global positioning system h = height (inches) ����� = current passing through battery (amperes) l = length (inches) Li-Ion = lithium ion Li-Po = lithium polymer
1
Student, California Polytechnic San Luis Obispo, 93410
2
American Institute of Aeronautics and Astronautics
�������� = actual maximum power available from each solar cell (watts) MPPT = max power point tracker Ni-Cd = nickel cadmium NPS = naval post-graduate school ����� = power output by battery (watts) Pin = power in (watts) Pout = power out (watts) Pin/Pout = battery recharge coefficient ���� = maximum power (watts)
����� ���� = power of a single solar cell (watts)
��� = battery internal resistance (ohms) RC = remote control SF = solar flux (watts per meter squared) SOC = state of charge (percent) � = time when battery is fully discharged (hours) �!"��#� �� = time of flight desired for aircraft with no solar energy provided (hours) ������ ����# = total cost of entire solar array (dollars) TFPV = thin film photovoltaic
T� �$�� �� = total power available to be collected by flying wing (watts)
������ % �& = total power supplied to motor by solar array (watts)
UAV = unmanned air vehicle '� = unit cost (dollars) V = voltage (volts) (���� = voltage across battery (volts) (�� = open circuit voltage (volts) w = width (inches) Wh = Watt-hours
3
American Institute of Aeronautics and Astronautics
I. Introduction
There has emerged a recent urgency for the Aerospace industry to find more sustainable solutions to existing technologies. Burning jet fuel is one of the many contributors to carbon dioxide emissions (amongst others). A bulk of our research was dedicated to evaluating the potential of solar power as an alternative power source. Through this research - as well as some initial design – it was decided to augment an RC model aircraft to harness solar power in conjunction with its standard battery system. In particular, the power system of a flying wing RC aircraft glider will be used, in addition to testing separate solar panels. The future potential of such technology will be speculated through research and ongoing industry projects relevant to the field.
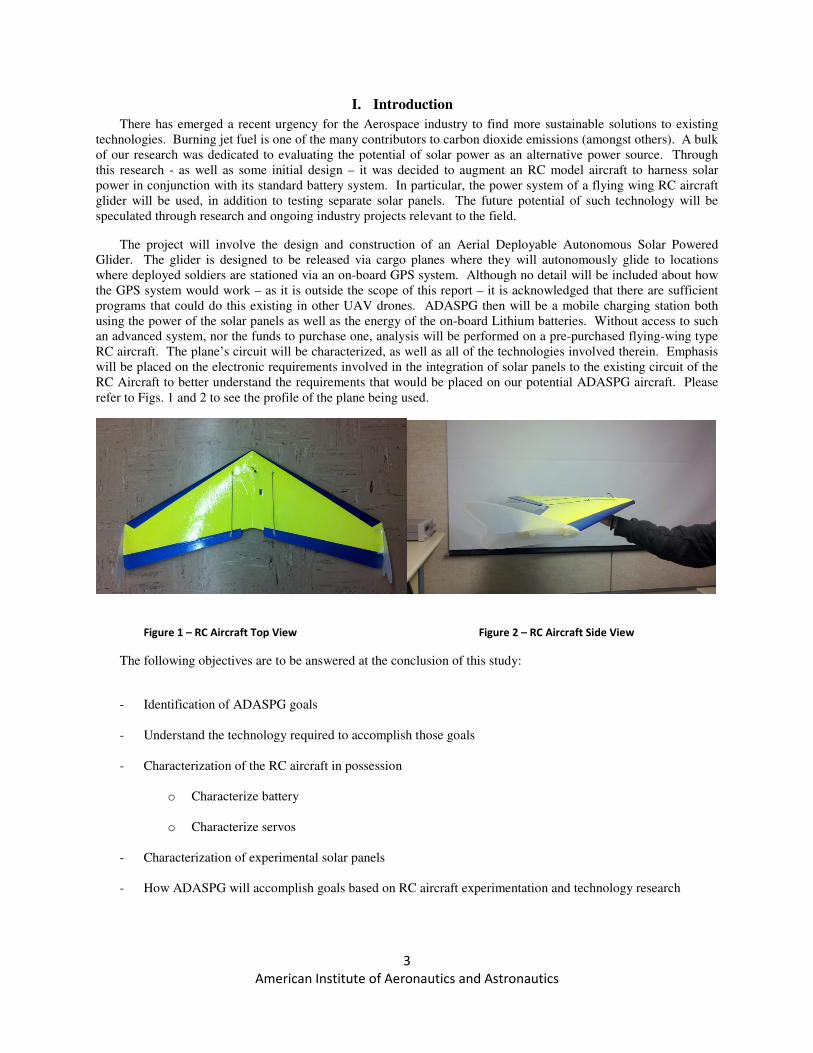
The project will involve the design and construction of an Aerial Deployable Autonomous Solar Powered Glider. The glider is designed to be released via cargo planes where they will autonomously glide to locations where deployed soldiers are stationed via an on-board GPS system. Although no detail will be included about how the GPS system would work – as it is outside the scope of this report – it is acknowledged that there are sufficient programs that could do this existing in other UAV drones. ADASPG then will be a mobile charging station both using the power of the solar panels as well as the energy of the on-board Lithium batteries. Without access to such an advanced system, nor the funds to purchase one, analysis will be performed on a pre-purchased flying-wing type RC aircraft. The plane’s circuit will be characterized, as well as all of the technologies involved therein. Emphasis will be placed on the electronic requirements involved in the integration of solar panels to the existing circuit of the RC Aircraft to better understand the requirements that would be placed on our potential ADASPG aircraft. Please refer to Figs. 1 and 2 to see the profile of the plane being used.
Figure 1 – RC Aircraft Top View Figure 2 – RC Aircraft Side View
The following objectives are to be answered at the conclusion of this study:
- Identification of ADASPG goals
- Understand the technology required to accomplish those goals
- Characterization of the RC aircraft in possession
o Characterize battery
o Characterize servos
- Characterization of experimental solar panels
- How ADASPG will accomplish goals based on RC aircraft experimentation and technology research
4
American Institute of Aeronautics and Astronautics
II. Research
A. Projects
Having little knowledge about UAVs or the technologies required to power such aircraft, it was decided to look
up past projects that are similar in scope. In particular, Raven and Predator drones were observed, as well as some reports by NPS graduate students performed specifically on solar powered RC aircraft.
1. Predator
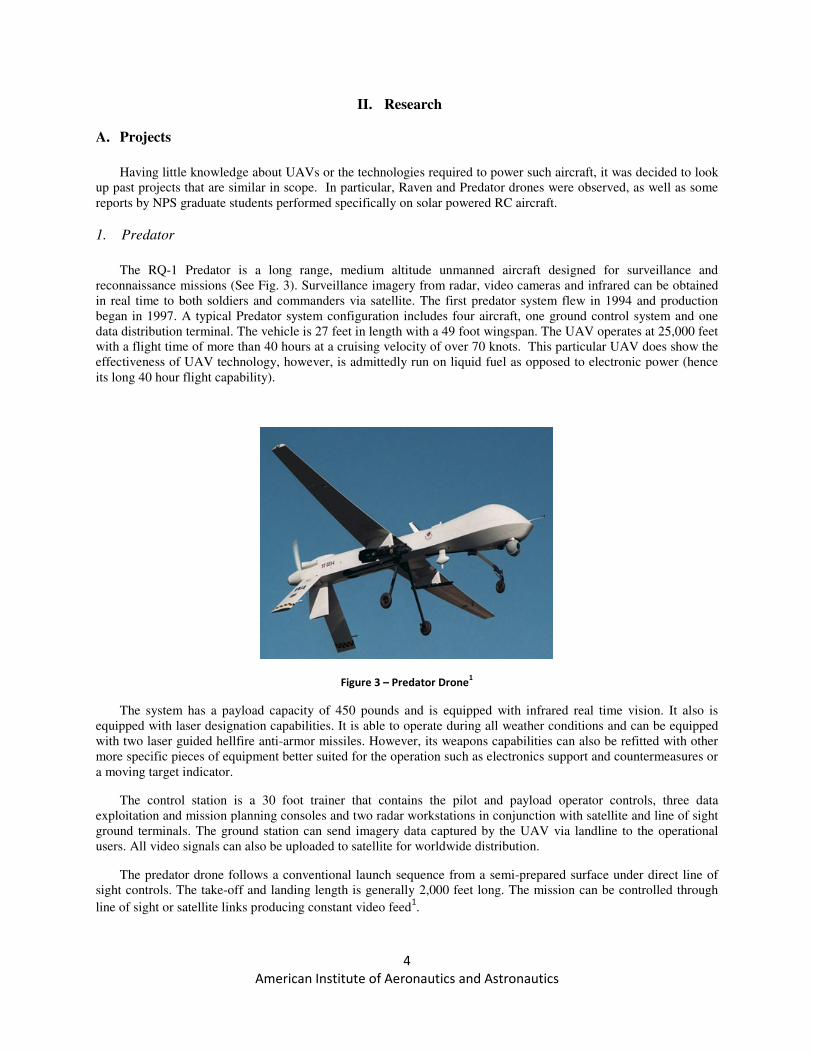
The RQ-1 Predator is a long range, medium altitude unmanned aircraft designed for surveillance and
reconnaissance missions (See Fig. 3). Surveillance imagery from radar, video cameras and infrared can be obtained in real time to both soldiers and commanders via satellite. The first predator system flew in 1994 and production began in 1997. A typical Predator system configuration includes four aircraft, one ground control system and one data distribution terminal. The vehicle is 27 feet in length with a 49 foot wingspan. The UAV operates at 25,000 feet with a flight time of more than 40 hours at a cruising velocity of over 70 knots. This particular UAV does show the effectiveness of UAV technology, however, is admittedly run on liquid fuel as opposed to electronic power (hence its long 40 hour flight capability).
Figure 3 – Predator Drone1
The system has a payload capacity of 450 pounds and is equipped with infrared real time vision. It also is equipped with laser designation capabilities. It is able to operate during all weather conditions and can be equipped with two laser guided hellfire anti-armor missiles. However, its weapons capabilities can also be refitted with other more specific pieces of equipment better suited for the operation such as electronics support and countermeasures or a moving target indicator.
The control station is a 30 foot trainer that contains the pilot and payload operator controls, three data exploitation and mission planning consoles and two radar workstations in conjunction with satellite and line of sight ground terminals. The ground station can send imagery data captured by the UAV via landline to the operational users. All video signals can also be uploaded to satellite for worldwide distribution.
The predator drone follows a conventional launch sequence from a semi-prepared surface under direct line of sight controls. The take-off and landing length is generally 2,000 feet long. The mission can be controlled through
line of sight or satellite links producing constant video feed1.
5
American Institute of Aeronautics and Astronautics
2. Raven
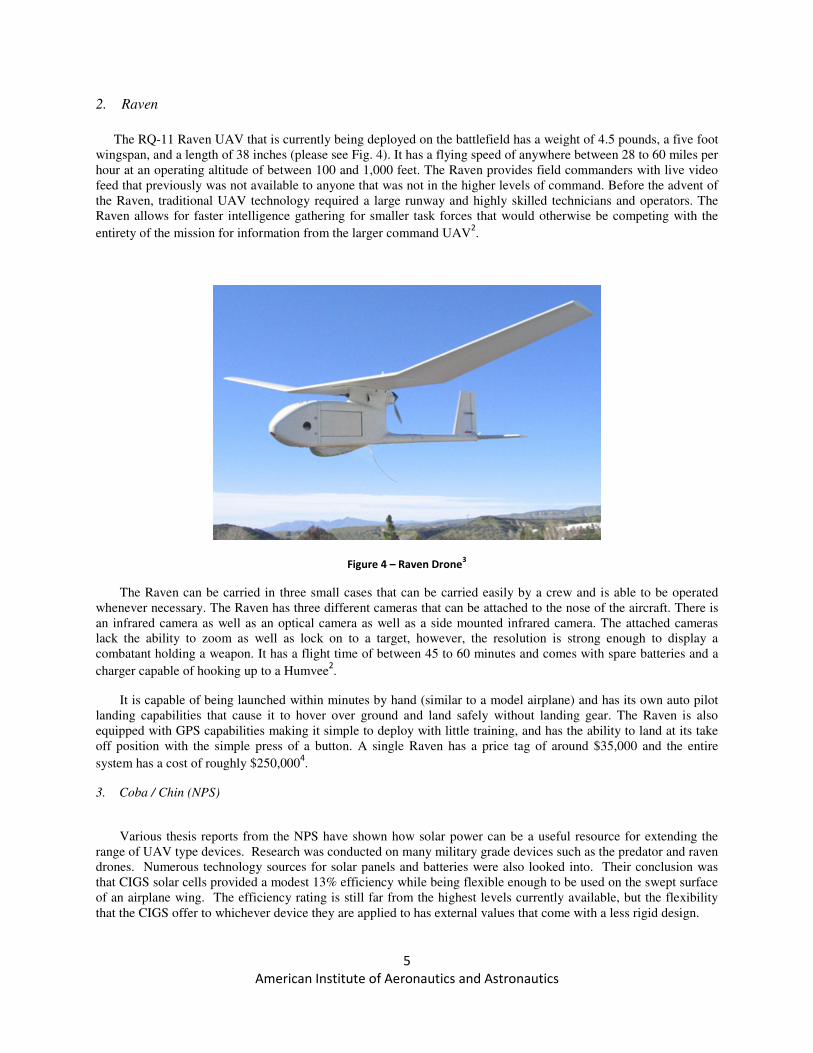
The RQ-11 Raven UAV that is currently being deployed on the battlefield has a weight of 4.5 pounds, a five foot
wingspan, and a length of 38 inches (please see Fig. 4). It has a flying speed of anywhere between 28 to 60 miles per hour at an operating altitude of between 100 and 1,000 feet. The Raven provides field commanders with live video feed that previously was not available to anyone that was not in the higher levels of command. Before the advent of the Raven, traditional UAV technology required a large runway and highly skilled technicians and operators. The Raven allows for faster intelligence gathering for smaller task forces that would otherwise be competing with the
entirety of the mission for information from the larger command UAV2.
Figure 4 – Raven Drone3
The Raven can be carried in three small cases that can be carried easily by a crew and is able to be operated whenever necessary. The Raven has three different cameras that can be attached to the nose of the aircraft. There is an infrared camera as well as an optical camera as well as a side mounted infrared camera. The attached cameras lack the ability to zoom as well as lock on to a target, however, the resolution is strong enough to display a combatant holding a weapon. It has a flight time of between 45 to 60 minutes and comes with spare batteries and a
charger capable of hooking up to a Humvee2.
It is capable of being launched within minutes by hand (similar to a model airplane) and has its own auto pilot landing capabilities that cause it to hover over ground and land safely without landing gear. The Raven is also equipped with GPS capabilities making it simple to deploy with little training, and has the ability to land at its take off position with the simple press of a button. A single Raven has a price tag of around $35,000 and the entire
system has a cost of roughly $250,0004.
3. Coba / Chin (NPS)
Various thesis reports from the NPS have shown how solar power can be a useful resource for extending the range of UAV type devices. Research was conducted on many military grade devices such as the predator and raven drones. Numerous technology sources for solar panels and batteries were also looked into. Their conclusion was that CIGS solar cells provided a modest 13% efficiency while being flexible enough to be used on the swept surface of an airplane wing. The efficiency rating is still far from the highest levels currently available, but the flexibility that the CIGS offer to whichever device they are applied to has external values that come with a less rigid design.
6
American Institute of Aeronautics and Astronautics
In order to properly control the current coming from the solar cells into the attached battery it was determined necessary to employ a DC/DC converter as well as an MPPT in order to get the most out of the energy being collected from the solar cells. The DC/DC converter functions by regulating the voltage at a specific level rather than the continuously varying voltage being collected by the solar cells. This allows for the electrical processes that are connected to the solar cells to work properly. The Maximum Power Point Tracker works in order to pin-point the perfect current and voltage in order to produce the maximum amount of power that is available at each moment in
time from the solar cells5.
B. Technology
1. Solar Panels
The main green source of energy that we wish to examine is that of solar cell technology. It is a fast growing
industry and uses a fuel source that is abundant and relatively untapped. According to Coba’s report, there is a theoretical 1000 W/m2 amount of solar flux at the earth’s surface to take advantage of. Since solar energy also does
not produce any amount of harmful byproducts, it is ideal to use on our aircraft5.
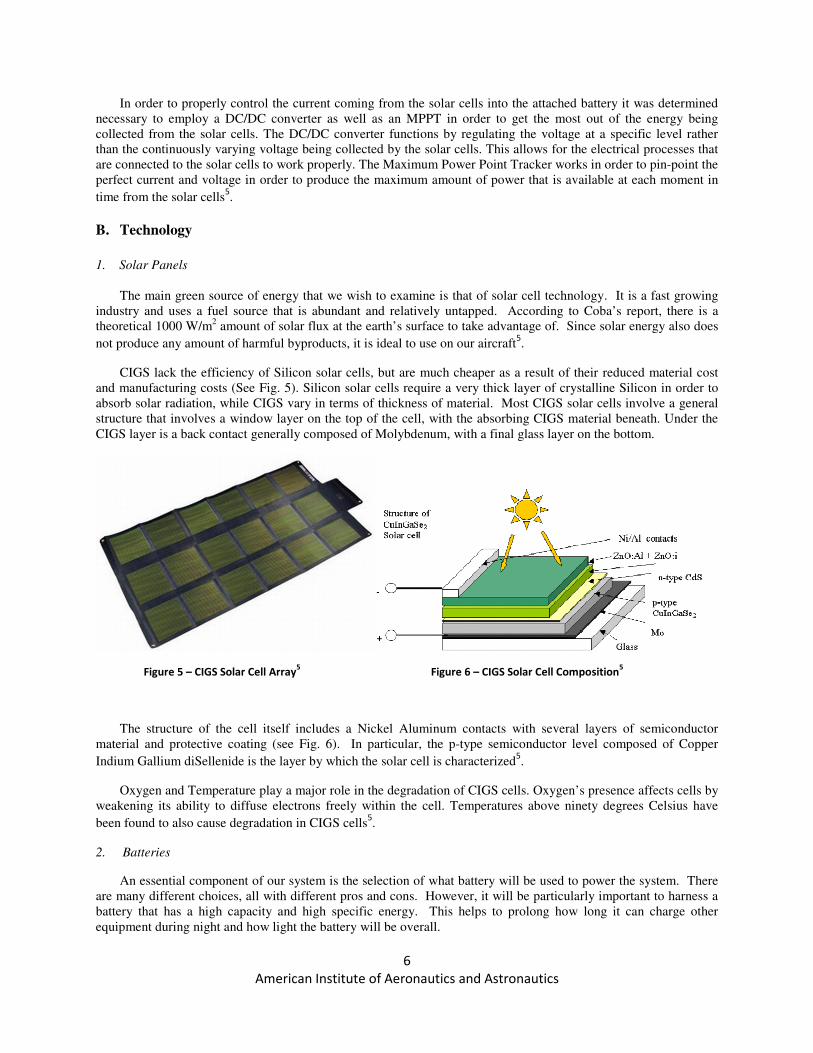
CIGS lack the efficiency of Silicon solar cells, but are much cheaper as a result of their reduced material cost and manufacturing costs (See Fig. 5). Silicon solar cells require a very thick layer of crystalline Silicon in order to absorb solar radiation, while CIGS vary in terms of thickness of material. Most CIGS solar cells involve a general structure that involves a window layer on the top of the cell, with the absorbing CIGS material beneath. Under the CIGS layer is a back contact generally composed of Molybdenum, with a final glass layer on the bottom.
Figure 5 – CIGS Solar Cell Array5 Figure 6 – CIGS Solar Cell Composition
5
The structure of the cell itself includes a Nickel Aluminum contacts with several layers of semiconductor material and protective coating (see Fig. 6). In particular, the p-type semiconductor level composed of Copper
Indium Gallium diSellenide is the layer by which the solar cell is characterized5.
Oxygen and Temperature play a major role in the degradation of CIGS cells. Oxygen’s presence affects cells by weakening its ability to diffuse electrons freely within the cell. Temperatures above ninety degrees Celsius have
been found to also cause degradation in CIGS cells5.
2. Batteries
An essential component of our system is the selection of what battery will be used to power the system. There are many different choices, all with different pros and cons. However, it will be particularly important to harness a battery that has a high capacity and high specific energy. This helps to prolong how long it can charge other equipment during night and how light the battery will be overall.
7
American Institute of Aeronautics and Astronautics
Lithium-Ion batteries are sought after because of their high energy densities and low maintenance required. Lithium-Ion batteries have twice the energy density of traditional Nickel Cadmium (NI-Cd) batteries. Ni-Cd batteries have a cycle memory that allow it to remember how much energy was taken from it before being discharged and this causes them to run into problems. Lithium-Ion batteries do not suffer from this limitation. Lithium-Ion batteries will discharge slowly on their own when not being used or are being stored. A limitation of Lithium-Ion batteries, however, is that they require protection in order to limit their peak voltages while charging and protection from voltages dropping too low during discharging. Nominal cell voltage for Li-Ion batteries is 3.6-3.7V with 100-250 Wh/kg. Nominal cell voltage for Ni-Cd batteries is 1.2V with a specific energy of 40-60 Wh/kg.
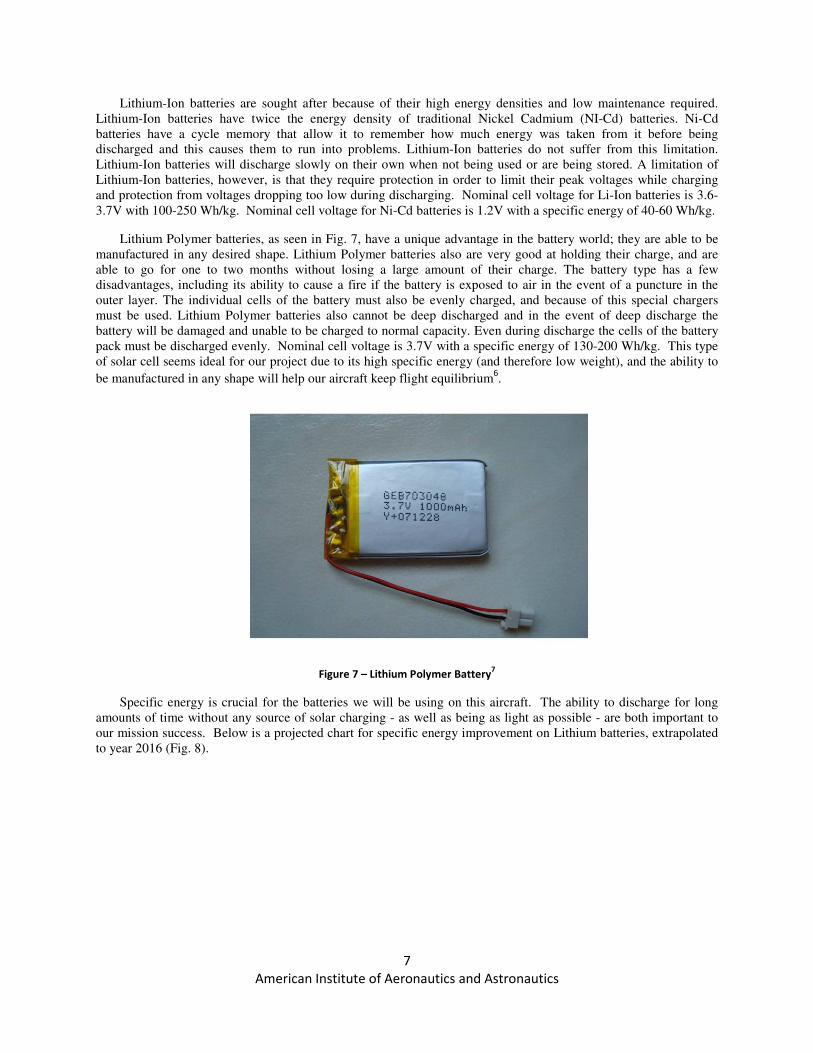
Lithium Polymer batteries, as seen in Fig. 7, have a unique advantage in the battery world; they are able to be manufactured in any desired shape. Lithium Polymer batteries also are very good at holding their charge, and are able to go for one to two months without losing a large amount of their charge. The battery type has a few disadvantages, including its ability to cause a fire if the battery is exposed to air in the event of a puncture in the outer layer. The individual cells of the battery must also be evenly charged, and because of this special chargers must be used. Lithium Polymer batteries also cannot be deep discharged and in the event of deep discharge the battery will be damaged and unable to be charged to normal capacity. Even during discharge the cells of the battery pack must be discharged evenly. Nominal cell voltage is 3.7V with a specific energy of 130-200 Wh/kg. This type of solar cell seems ideal for our project due to its high specific energy (and therefore low weight), and the ability to
be manufactured in any shape will help our aircraft keep flight equilibrium6.
Figure 7 – Lithium Polymer Battery7
Specific energy is crucial for the batteries we will be using on this aircraft. The ability to discharge for long amounts of time without any source of solar charging - as well as being as light as possible - are both important to our mission success. Below is a projected chart for specific energy improvement on Lithium batteries, extrapolated to year 2016 (Fig. 8).
8
American Institute of Aeronautics and Astronautics
Figure 8 - Highest Energy Density Extrapolation for Lithium batteries for year 2016.
Courtesy Aerospace Grad Design Lab, Voltaire’s BLITZ8
Fig. 8 shows promise for batteries to improve to specific energies as high as 300 Wh/kg by 2016. Since the
mission depends on deploying light-weight and long-discharge (high capacity) batteries, the usefulness of a charging station only goes up if it can continue to charge equipment even when sun is not available. For example, if a 300 Wh/kg Li-Po battery pack of four is used, versus the current 60 Wh/kg Ni-Cd batteries, overall battery mass can be reduced by 80% by the year 2016, while still maintaining the same amount of energy storage. Then, the choice between Li-Po and Li-Ion simply falls to the fact that Li-Po can take on any variety of shapes or sizes, making them convenient for a custom-built aircraft.
3. Servos
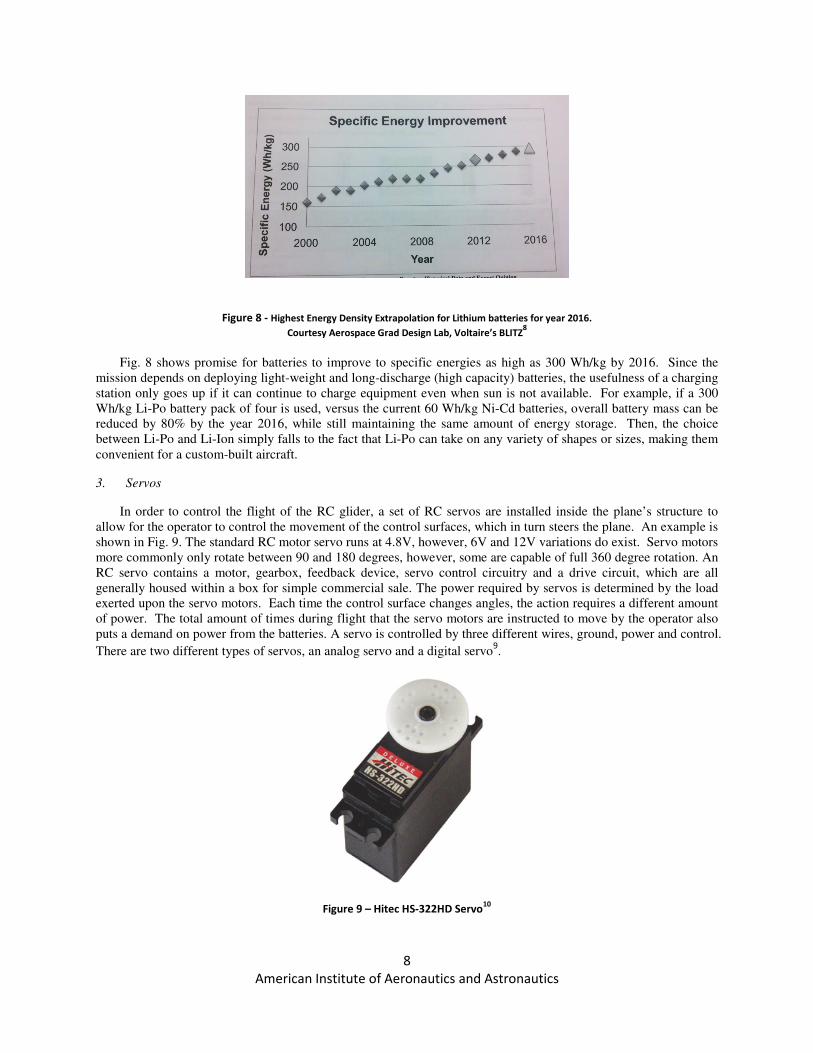
In order to control the flight of the RC glider, a set of RC servos are installed inside the plane’s structure to allow for the operator to control the movement of the control surfaces, which in turn steers the plane. An example is shown in Fig. 9. The standard RC motor servo runs at 4.8V, however, 6V and 12V variations do exist. Servo motors more commonly only rotate between 90 and 180 degrees, however, some are capable of full 360 degree rotation. An RC servo contains a motor, gearbox, feedback device, servo control circuitry and a drive circuit, which are all generally housed within a box for simple commercial sale. The power required by servos is determined by the load exerted upon the servo motors. Each time the control surface changes angles, the action requires a different amount of power. The total amount of times during flight that the servo motors are instructed to move by the operator also puts a demand on power from the batteries. A servo is controlled by three different wires, ground, power and control.
There are two different types of servos, an analog servo and a digital servo9.
Figure 9 – Hitec HS-322HD Servo10
9
American Institute of Aeronautics and Astronautics
Analog servos function by turning voltage signals on and off through electrical pulses. The voltage will remain constant, but the on-off frequency has been standardized to be 50 cycles per second. The longer the pulses are, the faster the motor turns and the more torque that is produced. Typically every 20 milliseconds the servo moves based on pulses sent by throughout the wires that govern the correct angle the control surfaces need to be at. Different pulse lengths correspond to different control surface angles. The problem with analog servos is that they do not react quickly or produce much torque when given small movement commands or when outside forces are forcing them off
of their held position. This area of weak response and torque is referred to as the “deadband.” 11
Digital servos have all of the same hardware as their analog counter-part, the difference is in how the pulses are relayed to the servo motor. A small microprocessor is also inside the servo, which allows for higher frequency voltage pulses, and therefore higher possible pulses of upwards of 300 pulses per second as opposed to just 50 pulses per second of an analog servo. Higher pulses per second provides the servo with a faster reaction speed and stronger constant torque throughout operation. Digital servos, however, are very power hungry in comparison to an analog servo. The power drain is not much in comparison though with how much energy is stored in today’s battery
packs.11
4. DC/DC Converter
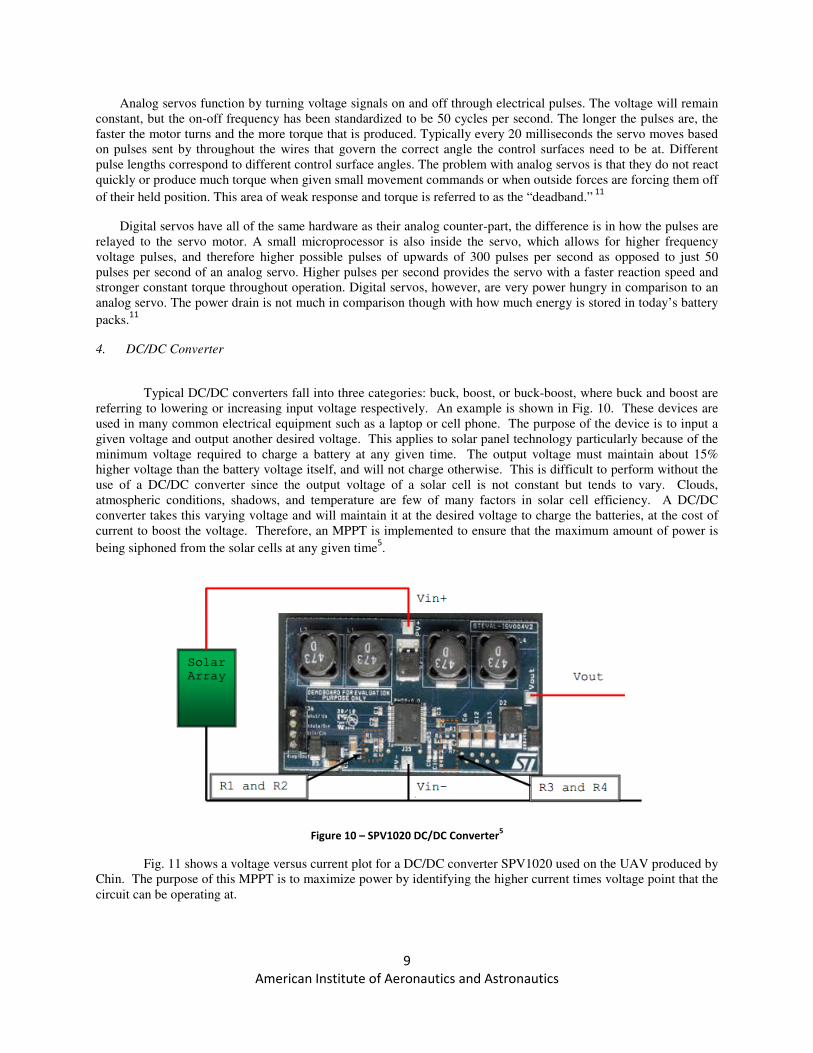
Typical DC/DC converters fall into three categories: buck, boost, or buck-boost, where buck and boost are referring to lowering or increasing input voltage respectively. An example is shown in Fig. 10. These devices are used in many common electrical equipment such as a laptop or cell phone. The purpose of the device is to input a given voltage and output another desired voltage. This applies to solar panel technology particularly because of the minimum voltage required to charge a battery at any given time. The output voltage must maintain about 15% higher voltage than the battery voltage itself, and will not charge otherwise. This is difficult to perform without the use of a DC/DC converter since the output voltage of a solar cell is not constant but tends to vary. Clouds, atmospheric conditions, shadows, and temperature are few of many factors in solar cell efficiency. A DC/DC converter takes this varying voltage and will maintain it at the desired voltage to charge the batteries, at the cost of current to boost the voltage. Therefore, an MPPT is implemented to ensure that the maximum amount of power is
being siphoned from the solar cells at any given time5.
Figure 10 – SPV1020 DC/DC Converter5
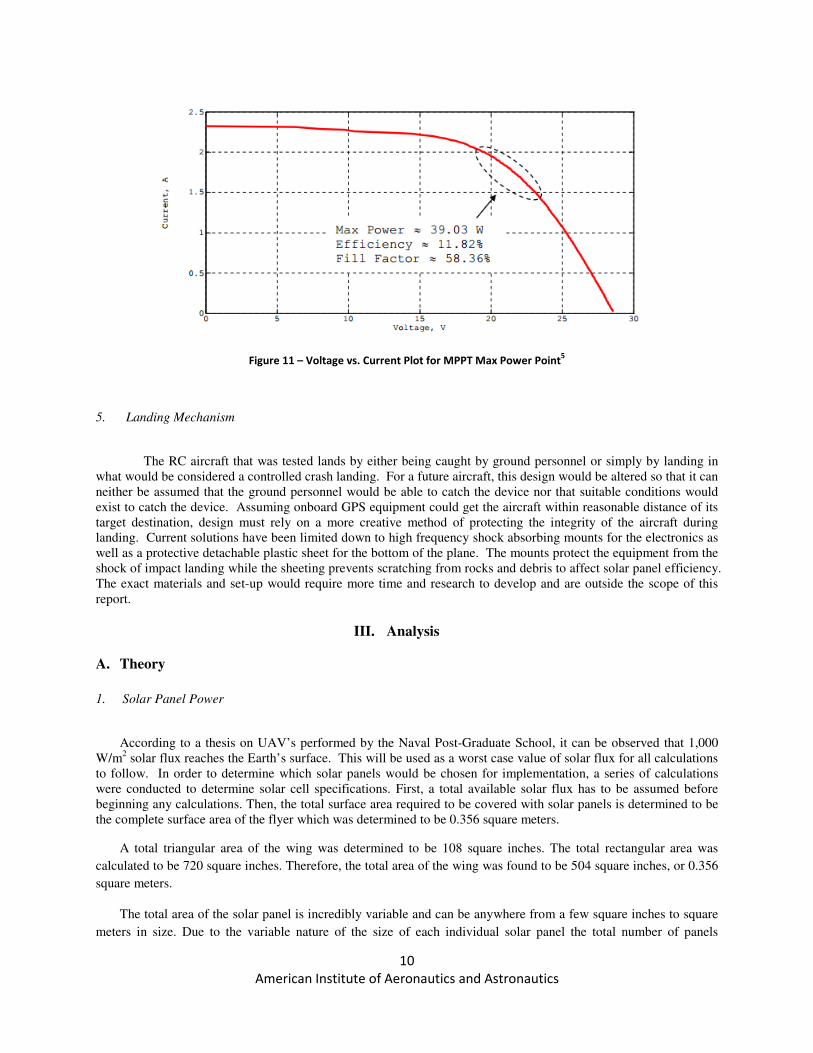
Fig. 11 shows a voltage versus current plot for a DC/DC converter SPV1020 used on the UAV produced by Chin. The purpose of this MPPT is to maximize power by identifying the higher current times voltage point that the circuit can be operating at.
10
American Institute of Aeronautics and Astronautics
Figure 11 – Voltage vs. Current Plot for MPPT Max Power Point5
5. Landing Mechanism
The RC aircraft that was tested lands by either being caught by ground personnel or simply by landing in what would be considered a controlled crash landing. For a future aircraft, this design would be altered so that it can neither be assumed that the ground personnel would be able to catch the device nor that suitable conditions would exist to catch the device. Assuming onboard GPS equipment could get the aircraft within reasonable distance of its target destination, design must rely on a more creative method of protecting the integrity of the aircraft during landing. Current solutions have been limited down to high frequency shock absorbing mounts for the electronics as well as a protective detachable plastic sheet for the bottom of the plane. The mounts protect the equipment from the shock of impact landing while the sheeting prevents scratching from rocks and debris to affect solar panel efficiency. The exact materials and set-up would require more time and research to develop and are outside the scope of this report.
III. Analysis
A. Theory
1. Solar Panel Power
According to a thesis on UAV’s performed by the Naval Post-Graduate School, it can be observed that 1,000 W/m2 solar flux reaches the Earth’s surface. This will be used as a worst case value of solar flux for all calculations to follow. In order to determine which solar panels would be chosen for implementation, a series of calculations were conducted to determine solar cell specifications. First, a total available solar flux has to be assumed before beginning any calculations. Then, the total surface area required to be covered with solar panels is determined to be the complete surface area of the flyer which was determined to be 0.356 square meters.
A total triangular area of the wing was determined to be 108 square inches. The total rectangular area was
calculated to be 720 square inches. Therefore, the total area of the wing was found to be 504 square inches, or 0.356
square meters.
The total area of the solar panel is incredibly variable and can be anywhere from a few square inches to square
meters in size. Due to the variable nature of the size of each individual solar panel the total number of panels
11
American Institute of Aeronautics and Astronautics
required to cover the entire surface is also variable. For example the experimental solar array used during testing has
a surface area of 0.4166 square meters, which is more than the available area of the wing. Therefore only 0.855 or
85% of the solar panel can be used to cover the wing (found by dividing total area of wing by total area of solar
panel).
The total cost of the entire solar array of panels is also variable based upon both the cost of each panel, as well
as the total number of panels required to cover the surface. Again, using the experimental solar panels, there would
be a total cost of $251 which is the cost of one single solar panel which would then need to be carefully cut in order
to fit the wing.
The current and voltage of all solar panels is highly variable as well depending on which model is being used.
For the experimental solar panels, the current when rated at maximum power is 5.8 Amperes and 13.3 Volts was
determined for the voltage at maximum power. Therefore, the maximum power generated by the individual solar
panel can be found to be 78.3 Watts. The solar panel’s efficiency was then determined to be 0.18 or 18% efficient at
converting solar energy into electrical energy.
For the experimental solar panel, there is only a single panel operating at 66.69 Watts, therefore it is capable of
supplying 66.69 Watts of power to the electrical circuit. Please refer to the appendix to view the actual calculation
of these values [containing Eqns. (1)-(12)].
Should CIGS cells be chosen for use, a solar cell area covering an entire side of the aircraft, using CIGS solar cells of 13% efficiency, 46.28 Watts of power could be supplied. This was calculated using a wing surface area of .356 m2, the solar flux of 1000 W/m2, and efficiency of .13. The completion of these calculations is identical to the calculation methods of the experimental solar panel trainer. No assumptions were made for other losses of efficiency, although further testing would be required to take other factors into account.
2. Ideal Battery Capacity and Discharge
The battery selection was ultimately based on floor requirements that the battery must meet in order to satisfy our system. Lithium Polymer was the type of battery selected due to its particularly high energy density (and therefore lowest mass required). The ideal requirement is that it must maintain at least 12V at all times. In addition, assuming having no solar supply, the plane must last at least 1 hour in flight. The wattage requirement was then calculated via Eqns. (13) and (14).
+, - �./0 1 �!"��#� �� (13)
�./0 - � 1 ( (14)
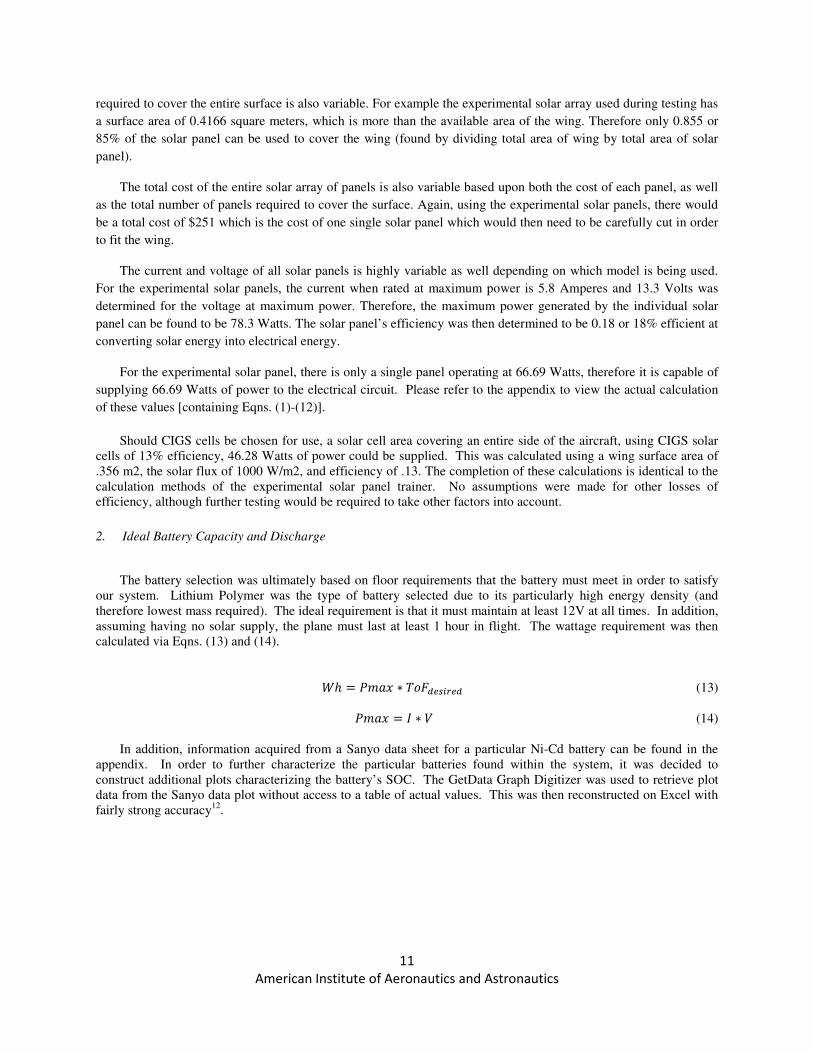
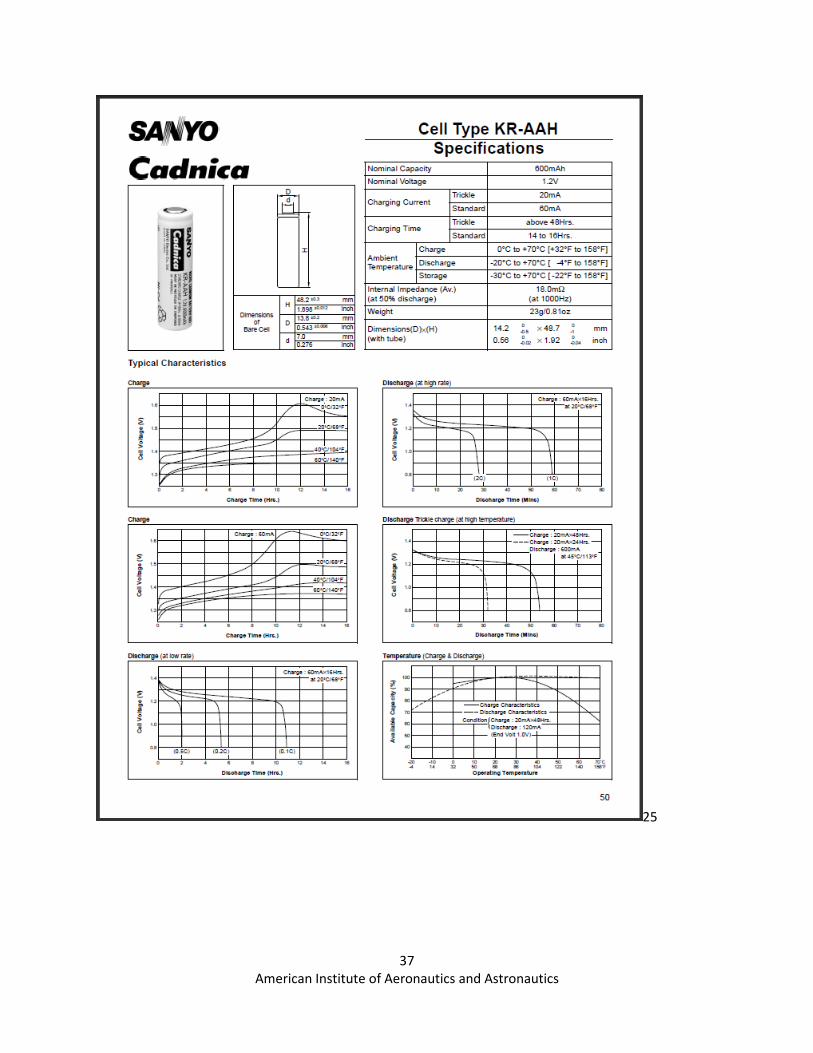
In addition, information acquired from a Sanyo data sheet for a particular Ni-Cd battery can be found in the appendix. In order to further characterize the particular batteries found within the system, it was decided to construct additional plots characterizing the battery’s SOC. The GetData Graph Digitizer was used to retrieve plot data from the Sanyo data plot without access to a table of actual values. This was then reconstructed on Excel with fairly strong accuracy12.
12
American Institute of Aeronautics and Astronautics
Figure 12 – Sanyo Cell Discharge Rate per Current
## Figure 13 – Digitized Discharge Rate per Current
The above given plots display information as discharge time versus cell voltage (Figs. 12 and 13). However, it is useful to know the voltage as a function of SOC, or the percent of battery remaining. This is similar to what the small battery symbol would indicate as battery remaining for many small devices (i.e. cell phone, laptop, etc). This was performed via the following Eqn. (15):
����,������ - ����� 1 � (15)
To accurately characterize a battery’s capacitance, the discharge rate must be very close to zero, i.e. a slow
discharge. However, due to the discrete nature of the currents given, the lowest current of 60mA was used to calculate Cmax [Eqn. (16)].
23� -4�567,89:6;<�567,6=>?6;@
�567,89:6; (16)
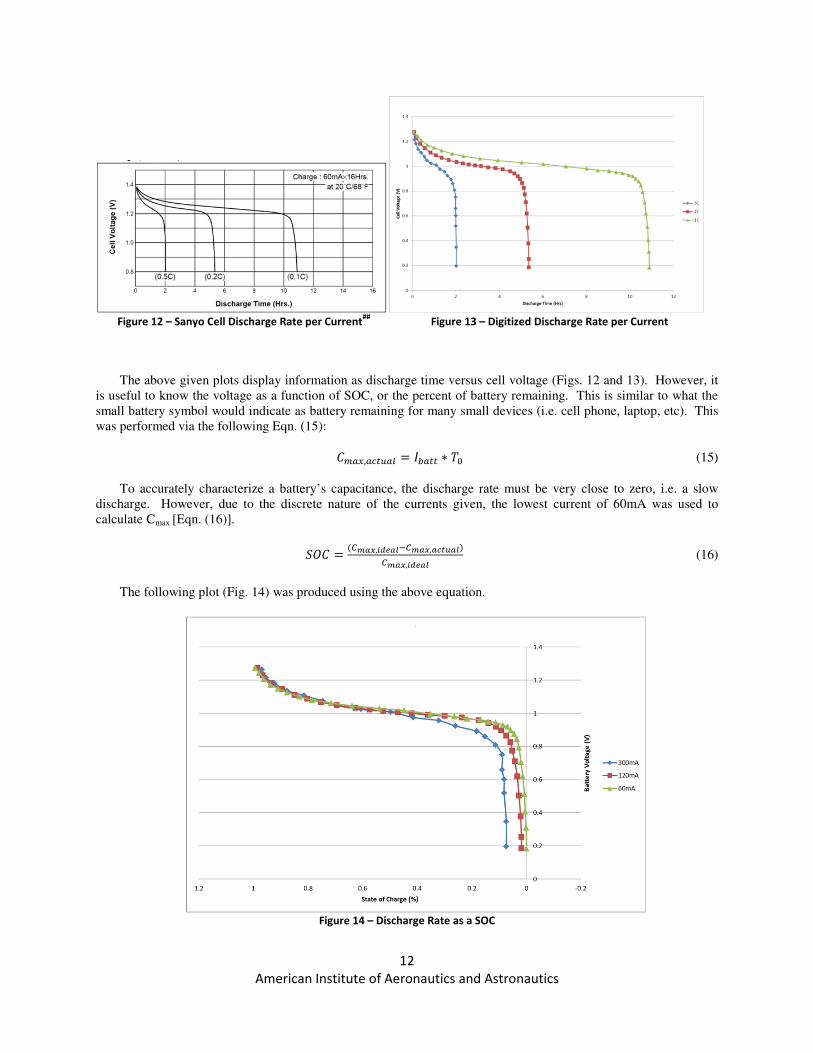
The following plot (Fig. 14) was produced using the above equation.
Figure 14 – Discharge Rate as a SOC
13
American Institute of Aeronautics and Astronautics
This plot is interesting and should be analyzed before these calculations are continued. At lower currents, the
battery initially begins at an ideal 1.3 V per cell. This quickly drops to a more nominal value of 1 V and maintained till about 10%. Upon reaching that value, the voltage exponentially drops to zero. Further analysis should be performed to discover why this phenomenon occurs.
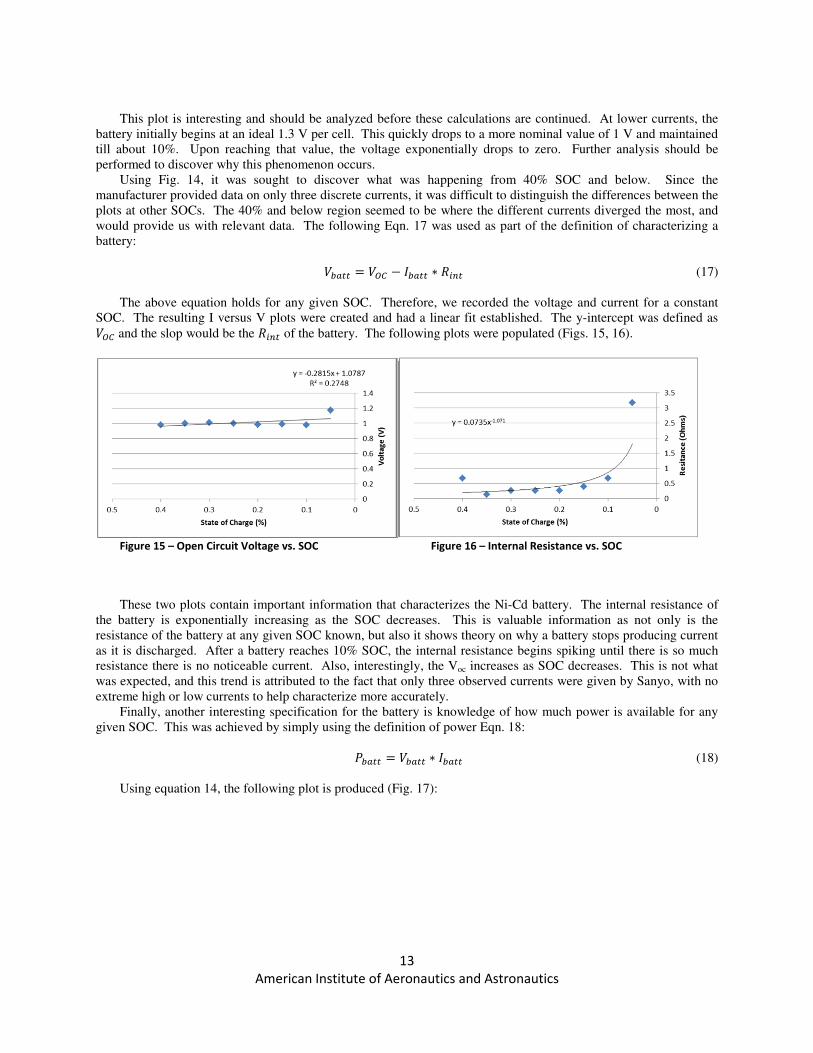
Using Fig. 14, it was sought to discover what was happening from 40% SOC and below. Since the manufacturer provided data on only three discrete currents, it was difficult to distinguish the differences between the plots at other SOCs. The 40% and below region seemed to be where the different currents diverged the most, and would provide us with relevant data. The following Eqn. 17 was used as part of the definition of characterizing a battery:
(���� - (A� B ����� 1 ��� (17)
The above equation holds for any given SOC. Therefore, we recorded the voltage and current for a constant
SOC. The resulting I versus V plots were created and had a linear fit established. The y-intercept was defined as (A� and the slop would be the ��� of the battery. The following plots were populated (Figs. 15, 16).
Figure 15 – Open Circuit Voltage vs. SOC Figure 16 – Internal Resistance vs. SOC
These two plots contain important information that characterizes the Ni-Cd battery. The internal resistance of the battery is exponentially increasing as the SOC decreases. This is valuable information as not only is the resistance of the battery at any given SOC known, but also it shows theory on why a battery stops producing current as it is discharged. After a battery reaches 10% SOC, the internal resistance begins spiking until there is so much resistance there is no noticeable current. Also, interestingly, the Voc increases as SOC decreases. This is not what was expected, and this trend is attributed to the fact that only three observed currents were given by Sanyo, with no extreme high or low currents to help characterize more accurately.
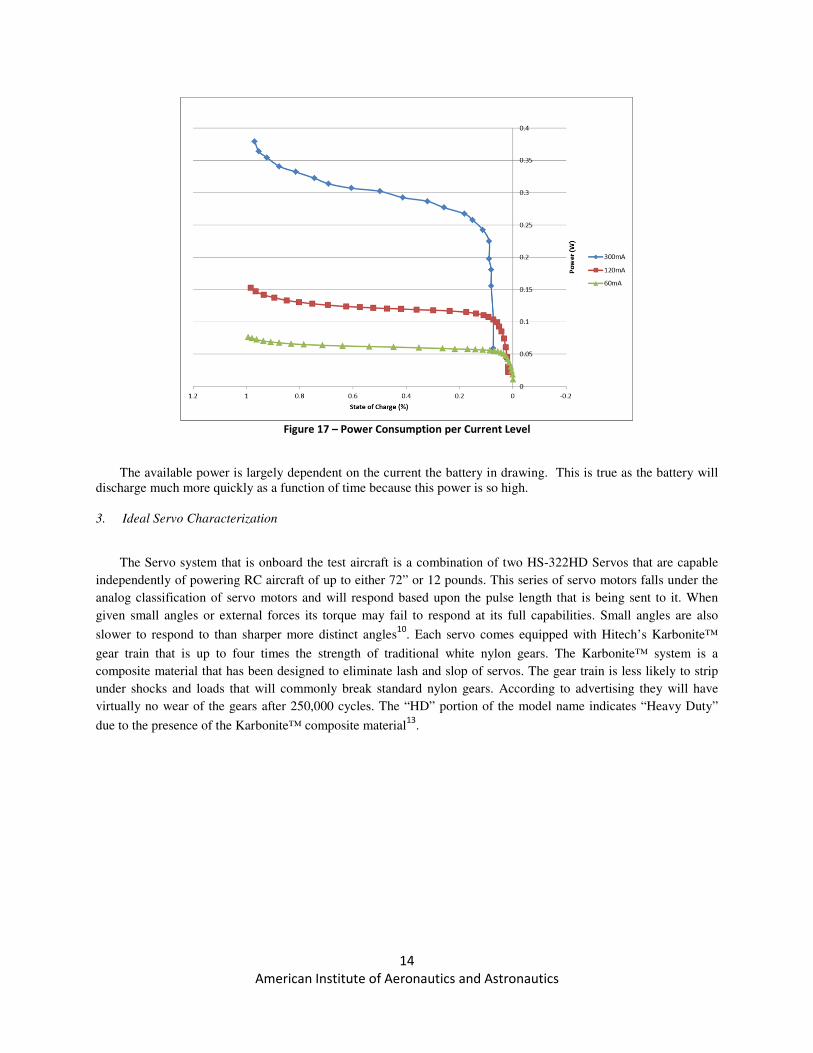
Finally, another interesting specification for the battery is knowledge of how much power is available for any given SOC. This was achieved by simply using the definition of power Eqn. 18:
����� - (���� 1 ����� (18)
Using equation 14, the following plot is produced (Fig. 17):
14
American Institute of Aeronautics and Astronautics
Figure 17 – Power Consumption per Current Level
The available power is largely dependent on the current the battery in drawing. This is true as the battery will
discharge much more quickly as a function of time because this power is so high.
3. Ideal Servo Characterization
The Servo system that is onboard the test aircraft is a combination of two HS-322HD Servos that are capable
independently of powering RC aircraft of up to either 72” or 12 pounds. This series of servo motors falls under the
analog classification of servo motors and will respond based upon the pulse length that is being sent to it. When
given small angles or external forces its torque may fail to respond at its full capabilities. Small angles are also
slower to respond to than sharper more distinct angles10
. Each servo comes equipped with Hitech’s Karbonite™
gear train that is up to four times the strength of traditional white nylon gears. The Karbonite™ system is a
composite material that has been designed to eliminate lash and slop of servos. The gear train is less likely to strip
under shocks and loads that will commonly break standard nylon gears. According to advertising they will have
virtually no wear of the gears after 250,000 cycles. The “HD” portion of the model name indicates “Heavy Duty”
due to the presence of the Karbonite™ composite material13
.
15
American Institute of Aeronautics and Astronautics
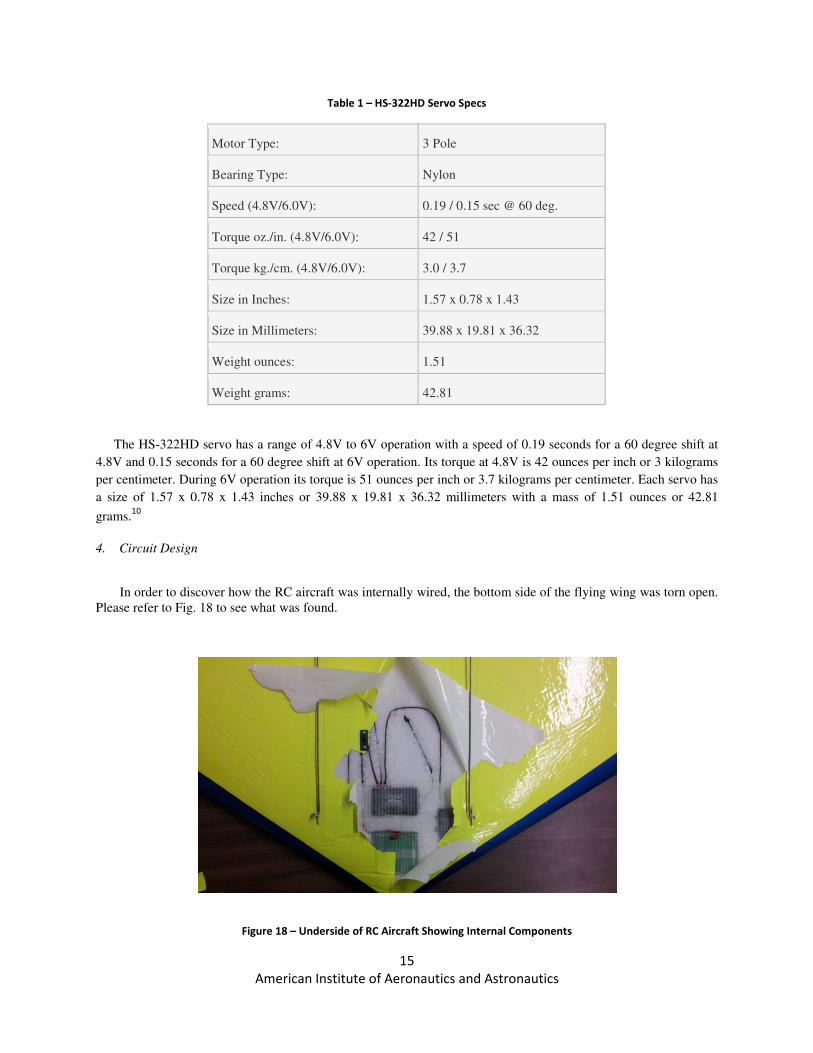
Table 1 – HS-322HD Servo Specs
Motor Type: 3 Pole
Bearing Type: Nylon
Speed (4.8V/6.0V): 0.19 / 0.15 sec @ 60 deg.
Torque oz./in. (4.8V/6.0V): 42 / 51
Torque kg./cm. (4.8V/6.0V): 3.0 / 3.7
Size in Inches: 1.57 x 0.78 x 1.43
Size in Millimeters: 39.88 x 19.81 x 36.32
Weight ounces: 1.51
Weight grams: 42.81
The HS-322HD servo has a range of 4.8V to 6V operation with a speed of 0.19 seconds for a 60 degree shift at
4.8V and 0.15 seconds for a 60 degree shift at 6V operation. Its torque at 4.8V is 42 ounces per inch or 3 kilograms
per centimeter. During 6V operation its torque is 51 ounces per inch or 3.7 kilograms per centimeter. Each servo has
a size of 1.57 x 0.78 x 1.43 inches or 39.88 x 19.81 x 36.32 millimeters with a mass of 1.51 ounces or 42.81
grams.10
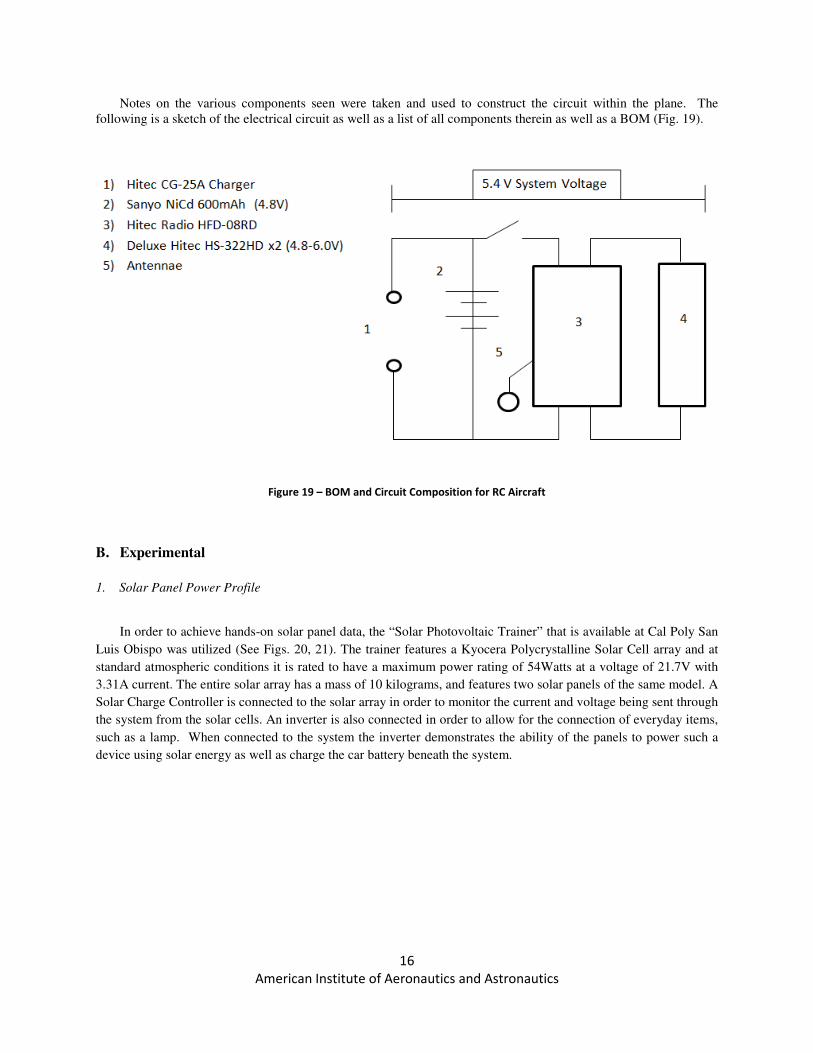
4. Circuit Design
In order to discover how the RC aircraft was internally wired, the bottom side of the flying wing was torn open. Please refer to Fig. 18 to see what was found.
Figure 18 – Underside of RC Aircraft Showing Internal Components
16
American Institute of Aeronautics and Astronautics
Notes on the various components seen were taken and used to construct the circuit within the plane. The following is a sketch of the electrical circuit as well as a list of all components therein as well as a BOM (Fig. 19).
Figure 19 – BOM and Circuit Composition for RC Aircraft
B. Experimental
1. Solar Panel Power Profile
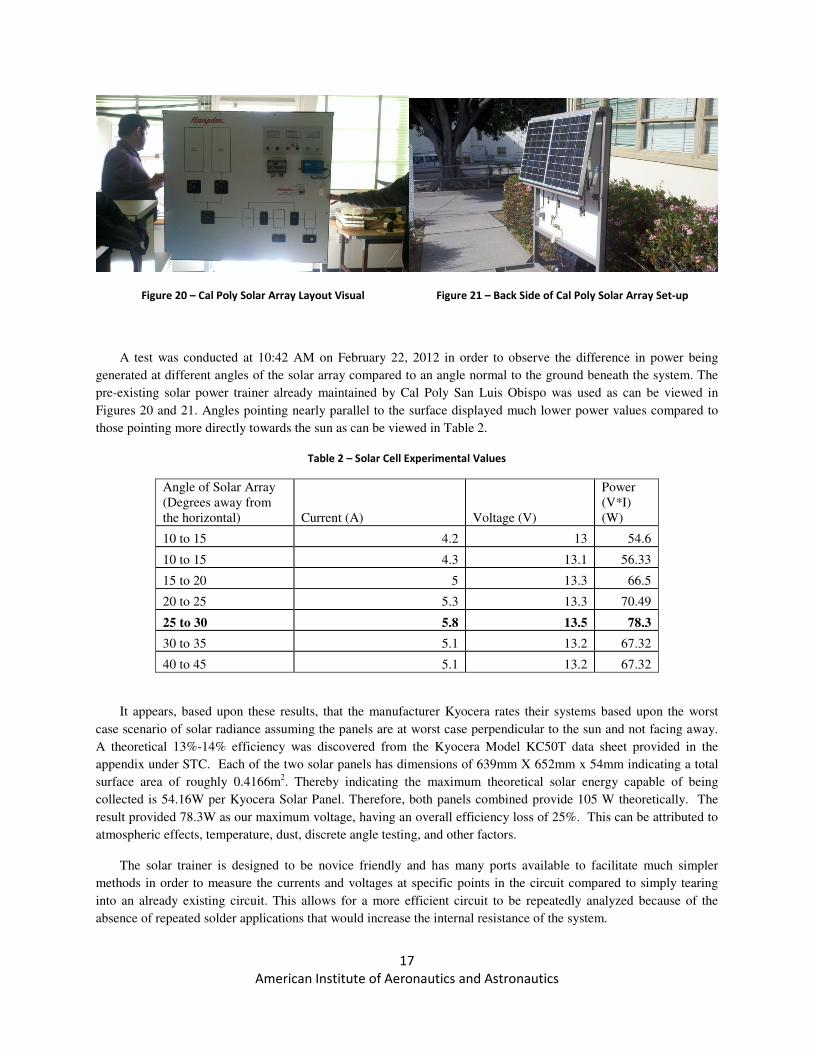
In order to achieve hands-on solar panel data, the “Solar Photovoltaic Trainer” that is available at Cal Poly San
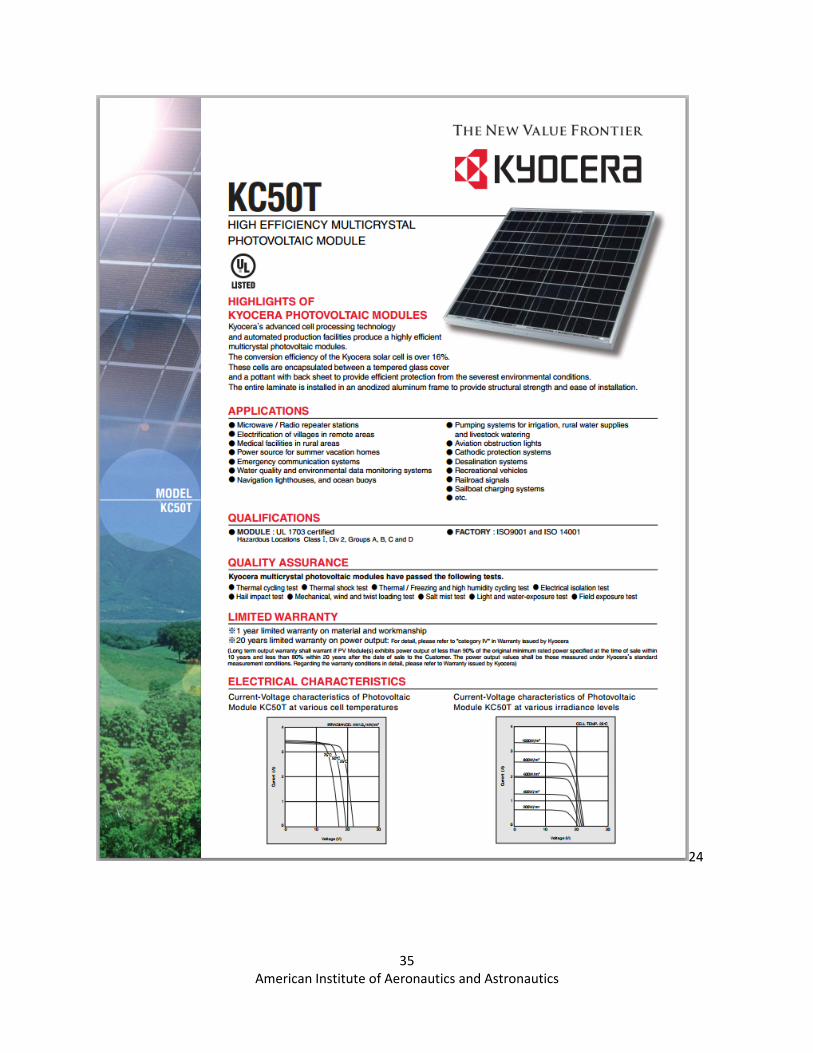
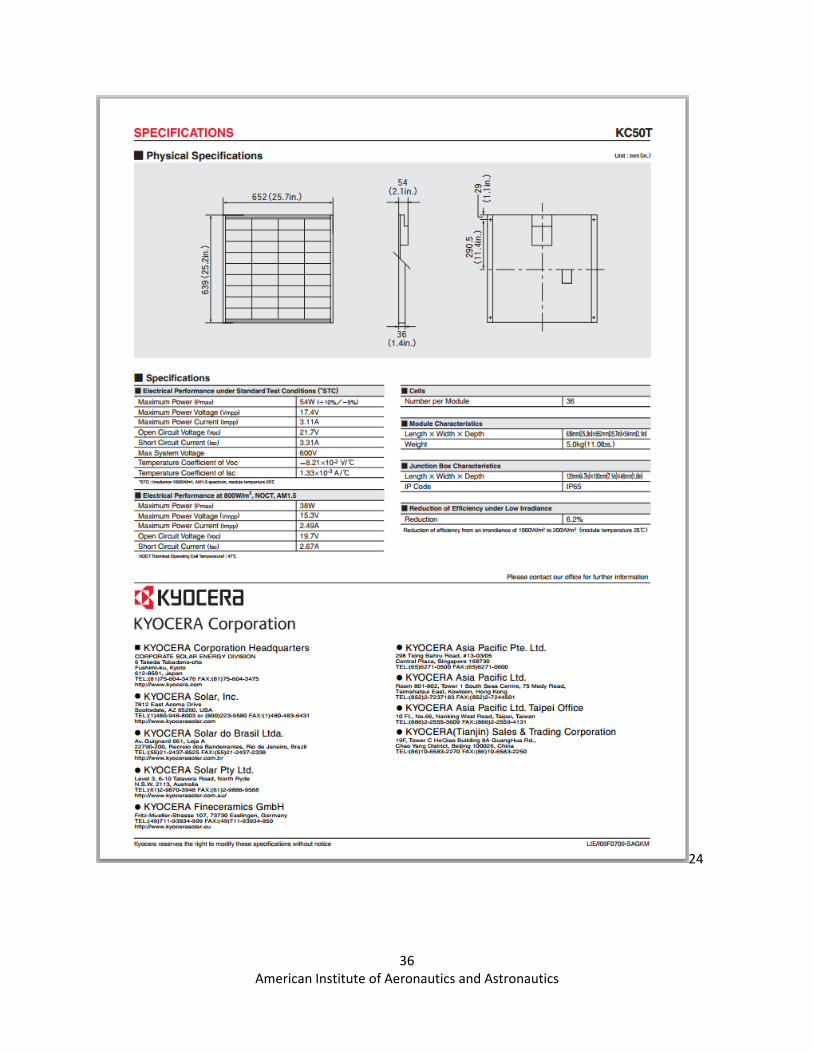
Luis Obispo was utilized (See Figs. 20, 21). The trainer features a Kyocera Polycrystalline Solar Cell array and at
standard atmospheric conditions it is rated to have a maximum power rating of 54Watts at a voltage of 21.7V with
3.31A current. The entire solar array has a mass of 10 kilograms, and features two solar panels of the same model. A
Solar Charge Controller is connected to the solar array in order to monitor the current and voltage being sent through
the system from the solar cells. An inverter is also connected in order to allow for the connection of everyday items,
such as a lamp. When connected to the system the inverter demonstrates the ability of the panels to power such a
device using solar energy as well as charge the car battery beneath the system.
17
American Institute of Aeronautics and Astronautics
Figure 20 – Cal Poly Solar Array Layout Visual Figure 21 – Back Side of Cal Poly Solar Array Set-up
A test was conducted at 10:42 AM on February 22, 2012 in order to observe the difference in power being
generated at different angles of the solar array compared to an angle normal to the ground beneath the system. The
pre-existing solar power trainer already maintained by Cal Poly San Luis Obispo was used as can be viewed in
Figures 20 and 21. Angles pointing nearly parallel to the surface displayed much lower power values compared to
those pointing more directly towards the sun as can be viewed in Table 2.
Table 2 – Solar Cell Experimental Values
Angle of Solar Array (Degrees away from the horizontal) Current (A) Voltage (V)
Power (V*I) (W)
10 to 15 4.2 13 54.6
10 to 15 4.3 13.1 56.33
15 to 20 5 13.3 66.5
20 to 25 5.3 13.3 70.49
25 to 30 5.8 13.5 78.3
30 to 35 5.1 13.2 67.32
40 to 45 5.1 13.2 67.32
It appears, based upon these results, that the manufacturer Kyocera rates their systems based upon the worst
case scenario of solar radiance assuming the panels are at worst case perpendicular to the sun and not facing away.
A theoretical 13%-14% efficiency was discovered from the Kyocera Model KC50T data sheet provided in the
appendix under STC. Each of the two solar panels has dimensions of 639mm X 652mm x 54mm indicating a total
surface area of roughly 0.4166m2. Thereby indicating the maximum theoretical solar energy capable of being
collected is 54.16W per Kyocera Solar Panel. Therefore, both panels combined provide 105 W theoretically. The
result provided 78.3W as our maximum voltage, having an overall efficiency loss of 25%. This can be attributed to
atmospheric effects, temperature, dust, discrete angle testing, and other factors.
The solar trainer is designed to be novice friendly and has many ports available to facilitate much simpler
methods in order to measure the currents and voltages at specific points in the circuit compared to simply tearing
into an already existing circuit. This allows for a more efficient circuit to be repeatedly analyzed because of the
absence of repeated solder applications that would increase the internal resistance of the system.
18
American Institute of Aeronautics and Astronautics
2. Circuit Power Characterization
Another important aspect of experimentation on the RC aircraft was to characterize the Ni-Cd batteries contained within. This is particularly important due to the fact that they have been run for an amount of cycles throughout their lifetime; a number that is unknown.
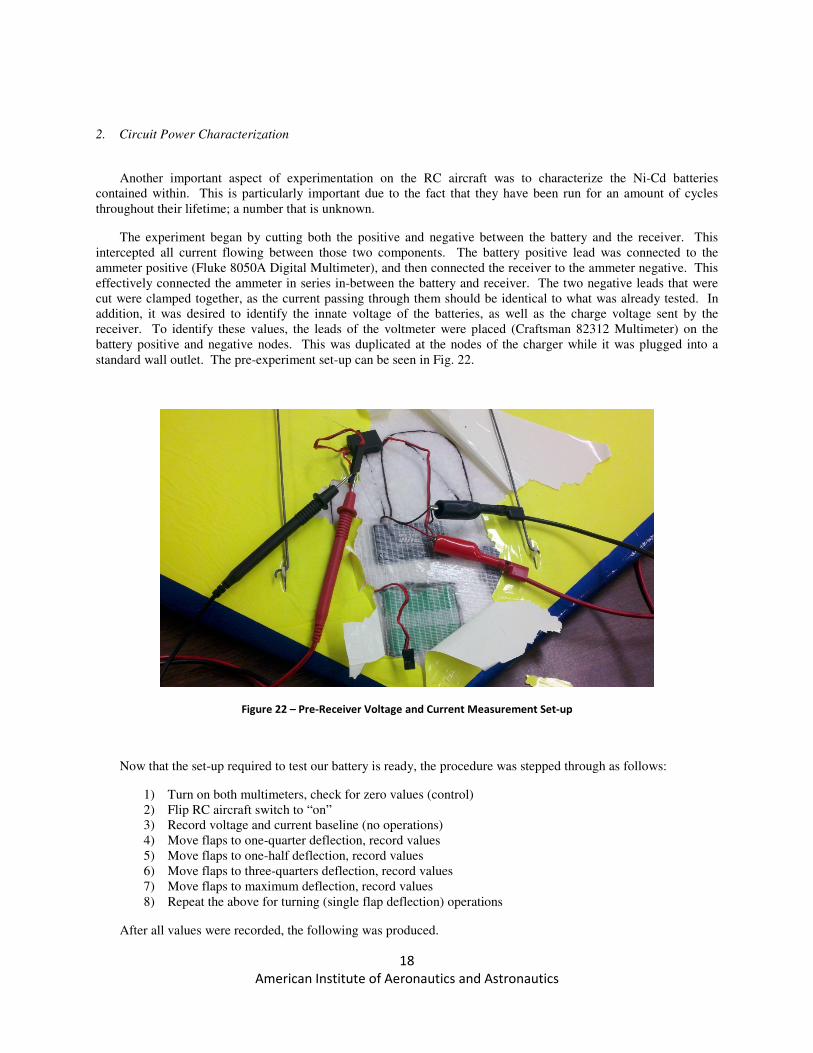
The experiment began by cutting both the positive and negative between the battery and the receiver. This intercepted all current flowing between those two components. The battery positive lead was connected to the ammeter positive (Fluke 8050A Digital Multimeter), and then connected the receiver to the ammeter negative. This effectively connected the ammeter in series in-between the battery and receiver. The two negative leads that were cut were clamped together, as the current passing through them should be identical to what was already tested. In addition, it was desired to identify the innate voltage of the batteries, as well as the charge voltage sent by the receiver. To identify these values, the leads of the voltmeter were placed (Craftsman 82312 Multimeter) on the battery positive and negative nodes. This was duplicated at the nodes of the charger while it was plugged into a standard wall outlet. The pre-experiment set-up can be seen in Fig. 22.
Figure 22 – Pre-Receiver Voltage and Current Measurement Set-up
Now that the set-up required to test our battery is ready, the procedure was stepped through as follows:
1) Turn on both multimeters, check for zero values (control) 2) Flip RC aircraft switch to “on” 3) Record voltage and current baseline (no operations) 4) Move flaps to one-quarter deflection, record values 5) Move flaps to one-half deflection, record values 6) Move flaps to three-quarters deflection, record values 7) Move flaps to maximum deflection, record values 8) Repeat the above for turning (single flap deflection) operations
After all values were recorded, the following was produced.
American Institute of Aeronautics and Astronautics
Figure 23 – Angle Deflection vs. Current for One Flap and Two Flap Deflections
With respect to voltage, all deflections read a nominal 5.4V, with a small amount of error involved that can be attributed to noise and the battery draining during experimentation. well. The deflection profile for current, however, created an interested “exponential” correlation between deflection and current. Currents as high and halfanticipated that higher deflections would draw more current; however, it was interesting that single flap deflection drew three times more current than double. Upon further investigation, it was found that this higher current was due to the servo physically bending the metal used to connect the servo the flaps. Since only one servo actuated during this run of experimentation, the servo had more power dedicated to it addition deflection was enough to bend the tie to the flThe following figure shows this deflection.
19
American Institute of Aeronautics and Astronautics
Angle Deflection vs. Current for One Flap and Two Flap Deflections
With respect to voltage, all deflections read a nominal 5.4V, with a small amount of error involved that can be attributed to noise and the battery draining during experimentation. A highest power of 2.97 W can be observed as
for current, however, created an interested “exponential” correlation between deflection half of an Ampere were recorded during max one-flap deflection.
that higher deflections would draw more current; however, it was interesting that single flap deflection drew three times more current than double. Upon further investigation, it was found that this higher current was due
the metal used to connect the servo the flaps. Since only one servo actuated during this run of experimentation, the servo had more power dedicated to it alone and therefore deflected further. This addition deflection was enough to bend the tie to the flap, therefore causing the servo to resist this strain energy. The following figure shows this deflection.
With respect to voltage, all deflections read a nominal 5.4V, with a small amount of error involved that can be A highest power of 2.97 W can be observed as
for current, however, created an interested “exponential” correlation between deflection flap deflection. It was
that higher deflections would draw more current; however, it was interesting that single flap deflection drew three times more current than double. Upon further investigation, it was found that this higher current was due
the metal used to connect the servo the flaps. Since only one servo actuated during and therefore deflected further. This
ap, therefore causing the servo to resist this strain energy.
20
American Institute of Aeronautics and Astronautics
Figure 24 – Experimental Set-up Showing Single Flap Wire Deflection
It was also found that the Fig. 23 values only held true during the transient times, or when the flaps were moving as the result of a command. Otherwise the baseline current would be given. The only case this was not true for was when the single flap test actually bent the metal connection. This led to a realization that this experimental set-up is not ideal. Since there is only a demand on the servo to actuate when it is moving, the steady state situations put nearly no resistance on the servo motor. However, during flight, the wind force would constantly be attempting to move the flaps, causing the motor to consume power attempting to maintain position. This is why the single flap maximum deflection would maintain the 550 mA current – because there was a force being constantly applied to the motor. This further led to investigation on this phenomenon by replicating the maximum deflection scenario while applying weight to the flaps. It was apparent that 550 mA was the average maximum current the system would draw during operation. Therefore, the operational assumption will be that while operating, our aircraft is required to draw the maximum current (550mA) at all times.
3. Post-Receiver Power Characterization
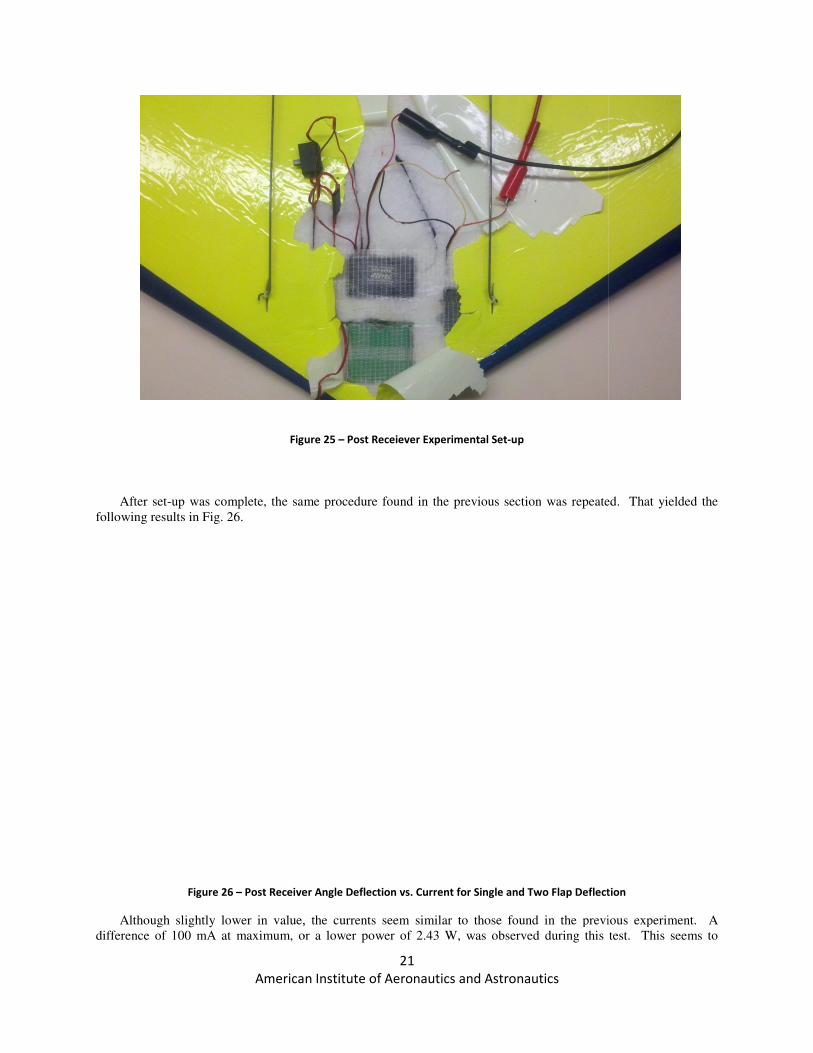
The previous section was an experiment to determine the current and voltage of the entire system during different operational requirements. The same experiment was replicated, however, at a different place in the circuit so it may sample the servo power consumption. Now, rather than testing the node between the battery and the receiver, one of the sets of wires between the receiver and a servo were cut. Three wires that were cut were identified as the negative (black), positive (red), and signal (yellow). The signal and negative wires were reconnected, leaving the positive lead to be inserted into the ammeter. The voltage was also measured between the now-exposed positive and negative wires. The set-up can be seen as follows in Fig. 25.
American Institute of Aeronautics and Astronautics
Figure
After set-up was complete, the same procedure found in the previous sectionfollowing results in Fig. 26.
Figure 26 – Post Receiver Angle Deflection vs. Current for Single and Two Flap Deflection
Although slightly lower in value, the currents seemdifference of 100 mA at maximum, or a lower power of 2.43 W, was observed during this test. This seems to
21
American Institute of Aeronautics and Astronautics
Figure 25 – Post Receiever Experimental Set-up
up was complete, the same procedure found in the previous section was repeated
Post Receiver Angle Deflection vs. Current for Single and Two Flap Deflection
er in value, the currents seem similar to those found in the previous experiment. difference of 100 mA at maximum, or a lower power of 2.43 W, was observed during this test. This seems to
was repeated. That yielded the
Post Receiver Angle Deflection vs. Current for Single and Two Flap Deflection
similar to those found in the previous experiment. A difference of 100 mA at maximum, or a lower power of 2.43 W, was observed during this test. This seems to
22
American Institute of Aeronautics and Astronautics
indicate a consumption of .54 W by the receiver. Therefore, the receiver’s consumption of power was relatively low when compared to that of the servos, which can be assumed to be the remaining 2.43 W. Similar results were found in terms of voltage, where a nominal 5.4V was observed for both experiments.
IV. Conclusion
A. Research and Experimentation
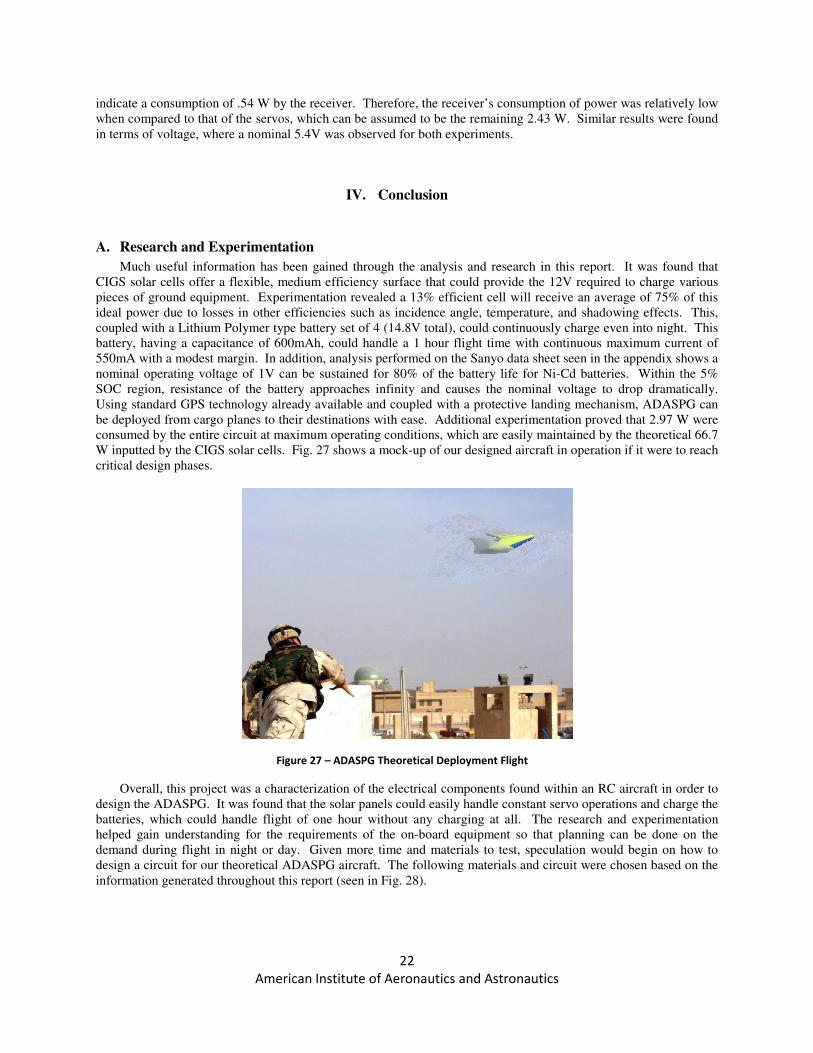
Much useful information has been gained through the analysis and research in this report. It was found that CIGS solar cells offer a flexible, medium efficiency surface that could provide the 12V required to charge various pieces of ground equipment. Experimentation revealed a 13% efficient cell will receive an average of 75% of this ideal power due to losses in other efficiencies such as incidence angle, temperature, and shadowing effects. This, coupled with a Lithium Polymer type battery set of 4 (14.8V total), could continuously charge even into night. This battery, having a capacitance of 600mAh, could handle a 1 hour flight time with continuous maximum current of 550mA with a modest margin. In addition, analysis performed on the Sanyo data sheet seen in the appendix shows a nominal operating voltage of 1V can be sustained for 80% of the battery life for Ni-Cd batteries. Within the 5% SOC region, resistance of the battery approaches infinity and causes the nominal voltage to drop dramatically. Using standard GPS technology already available and coupled with a protective landing mechanism, ADASPG can be deployed from cargo planes to their destinations with ease. Additional experimentation proved that 2.97 W were consumed by the entire circuit at maximum operating conditions, which are easily maintained by the theoretical 66.7 W inputted by the CIGS solar cells. Fig. 27 shows a mock-up of our designed aircraft in operation if it were to reach critical design phases.
Figure 27 – ADASPG Theoretical Deployment Flight
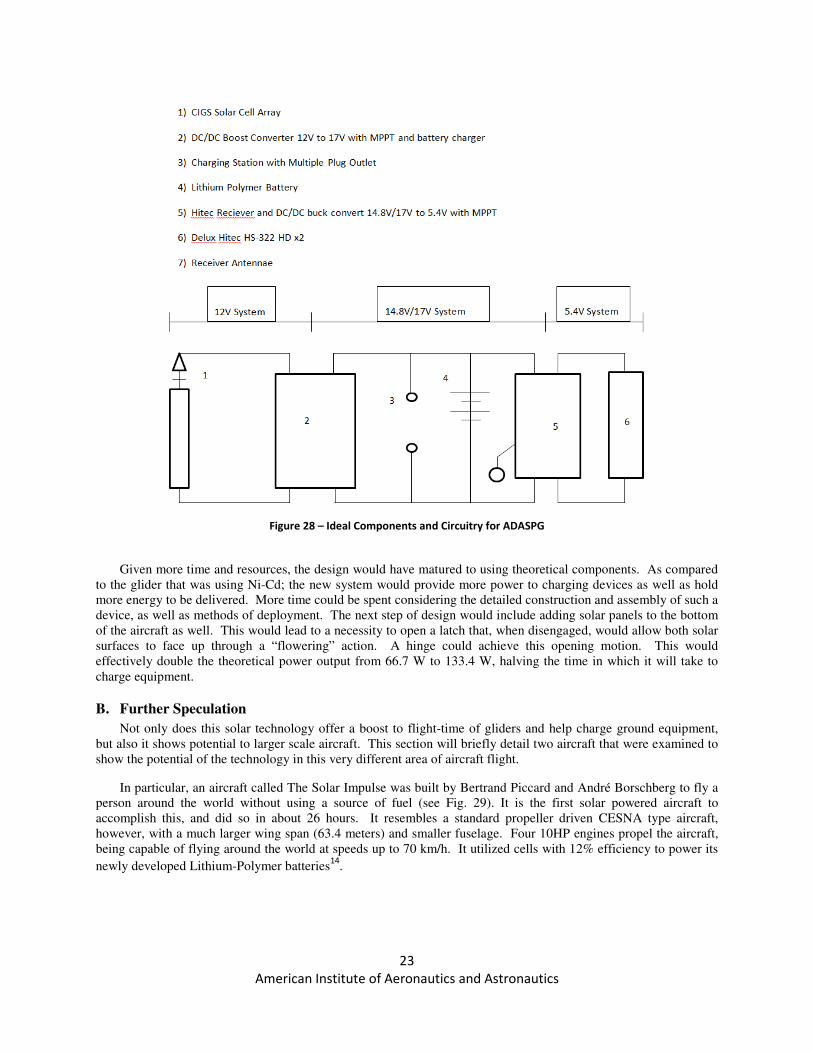
Overall, this project was a characterization of the electrical components found within an RC aircraft in order to design the ADASPG. It was found that the solar panels could easily handle constant servo operations and charge the batteries, which could handle flight of one hour without any charging at all. The research and experimentation helped gain understanding for the requirements of the on-board equipment so that planning can be done on the demand during flight in night or day. Given more time and materials to test, speculation would begin on how to design a circuit for our theoretical ADASPG aircraft. The following materials and circuit were chosen based on the information generated throughout this report (seen in Fig. 28).
23
American Institute of Aeronautics and Astronautics
Figure 28 – Ideal Components and Circuitry for ADASPG
Given more time and resources, the design would have matured to using theoretical components. As compared
to the glider that was using Ni-Cd; the new system would provide more power to charging devices as well as hold more energy to be delivered. More time could be spent considering the detailed construction and assembly of such a device, as well as methods of deployment. The next step of design would include adding solar panels to the bottom of the aircraft as well. This would lead to a necessity to open a latch that, when disengaged, would allow both solar surfaces to face up through a “flowering” action. A hinge could achieve this opening motion. This would effectively double the theoretical power output from 66.7 W to 133.4 W, halving the time in which it will take to charge equipment.
B. Further Speculation
Not only does this solar technology offer a boost to flight-time of gliders and help charge ground equipment, but also it shows potential to larger scale aircraft. This section will briefly detail two aircraft that were examined to show the potential of the technology in this very different area of aircraft flight.
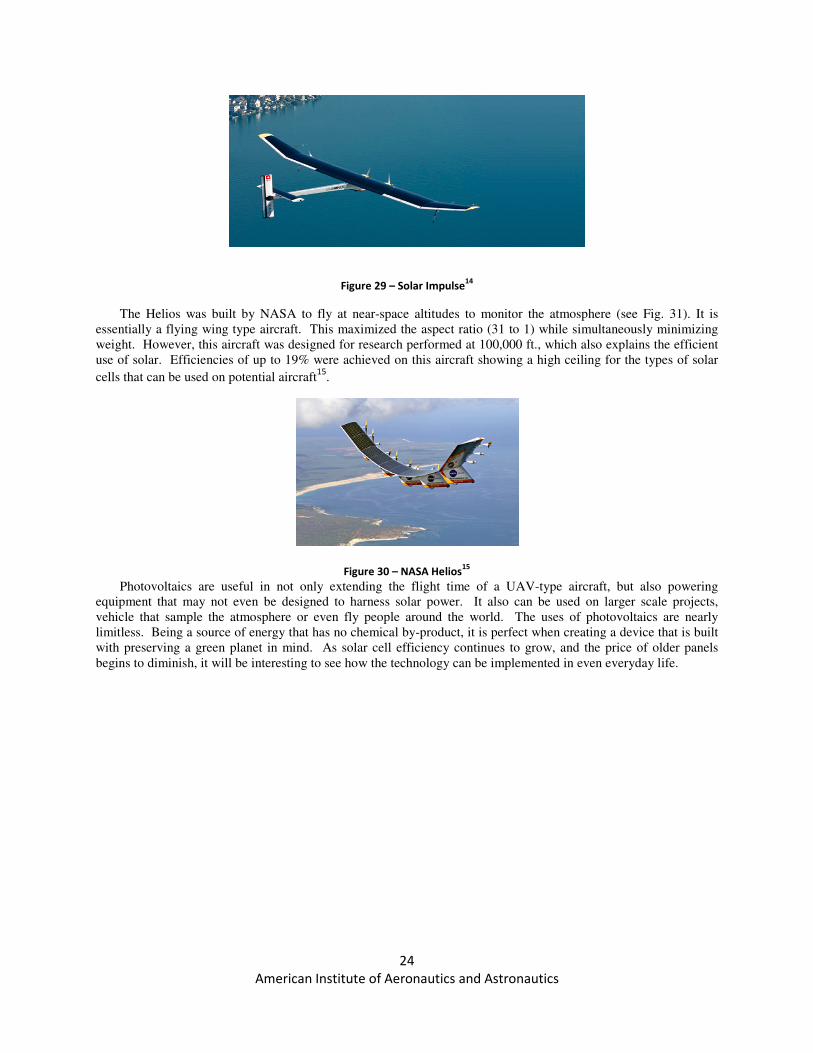
In particular, an aircraft called The Solar Impulse was built by Bertrand Piccard and André Borschberg to fly a person around the world without using a source of fuel (see Fig. 29). It is the first solar powered aircraft to accomplish this, and did so in about 26 hours. It resembles a standard propeller driven CESNA type aircraft, however, with a much larger wing span (63.4 meters) and smaller fuselage. Four 10HP engines propel the aircraft, being capable of flying around the world at speeds up to 70 km/h. It utilized cells with 12% efficiency to power its
newly developed Lithium-Polymer batteries14
.
24
American Institute of Aeronautics and Astronautics
Figure 29 – Solar Impulse14
The Helios was built by NASA to fly at near-space altitudes to monitor the atmosphere (see Fig. 31). It is essentially a flying wing type aircraft. This maximized the aspect ratio (31 to 1) while simultaneously minimizing weight. However, this aircraft was designed for research performed at 100,000 ft., which also explains the efficient use of solar. Efficiencies of up to 19% were achieved on this aircraft showing a high ceiling for the types of solar
cells that can be used on potential aircraft15
.
Figure 30 – NASA Helios15
Photovoltaics are useful in not only extending the flight time of a UAV-type aircraft, but also powering equipment that may not even be designed to harness solar power. It also can be used on larger scale projects, vehicle that sample the atmosphere or even fly people around the world. The uses of photovoltaics are nearly limitless. Being a source of energy that has no chemical by-product, it is perfect when creating a device that is built with preserving a green planet in mind. As solar cell efficiency continues to grow, and the price of older panels begins to diminish, it will be interesting to see how the technology can be implemented in even everyday life.
25
American Institute of Aeronautics and Astronautics
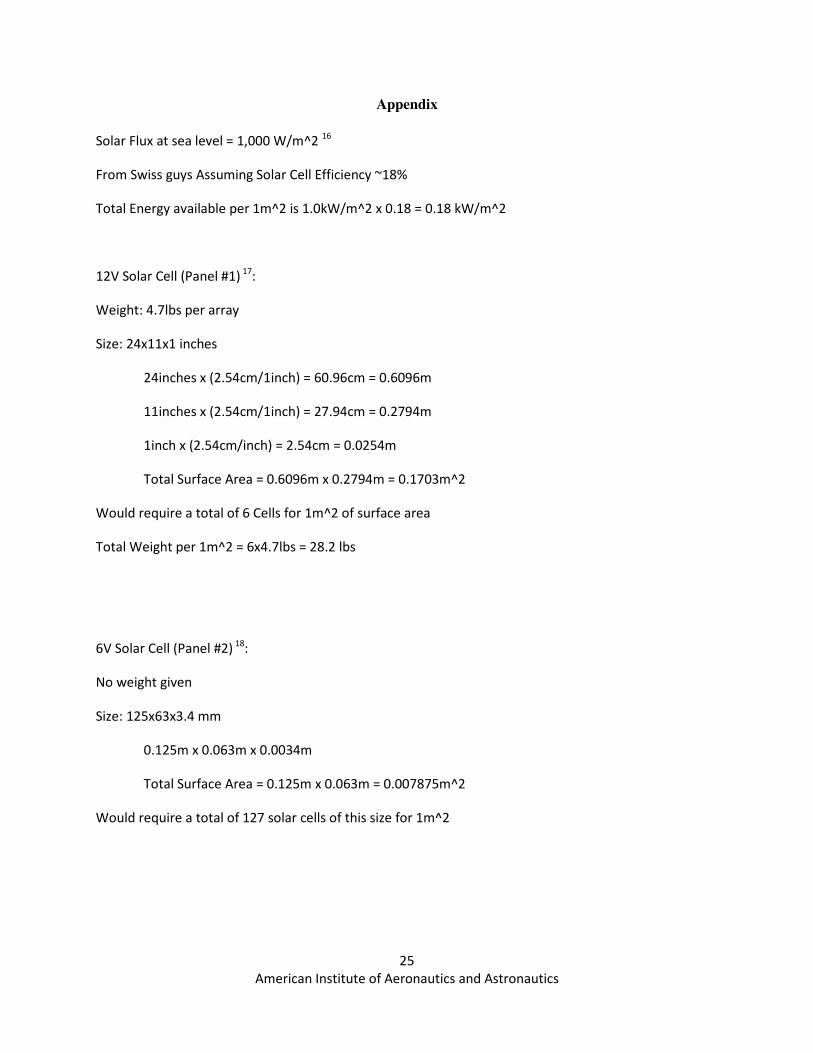
Appendix
Solar Flux at sea level = 1,000 W/m^2 16
From Swiss guys Assuming Solar Cell Efficiency ~18%
Total Energy available per 1m^2 is 1.0kW/m^2 x 0.18 = 0.18 kW/m^2
12V Solar Cell (Panel #1) 17:
Weight: 4.7lbs per array
Size: 24x11x1 inches
24inches x (2.54cm/1inch) = 60.96cm = 0.6096m
11inches x (2.54cm/1inch) = 27.94cm = 0.2794m
1inch x (2.54cm/inch) = 2.54cm = 0.0254m
Total Surface Area = 0.6096m x 0.2794m = 0.1703m^2
Would require a total of 6 Cells for 1m^2 of surface area
Total Weight per 1m^2 = 6x4.7lbs = 28.2 lbs
6V Solar Cell (Panel #2) 18:
No weight given
Size: 125x63x3.4 mm
0.125m x 0.063m x 0.0034m
Total Surface Area = 0.125m x 0.063m = 0.007875m^2
Would require a total of 127 solar cells of this size for 1m^2
26
American Institute of Aeronautics and Astronautics
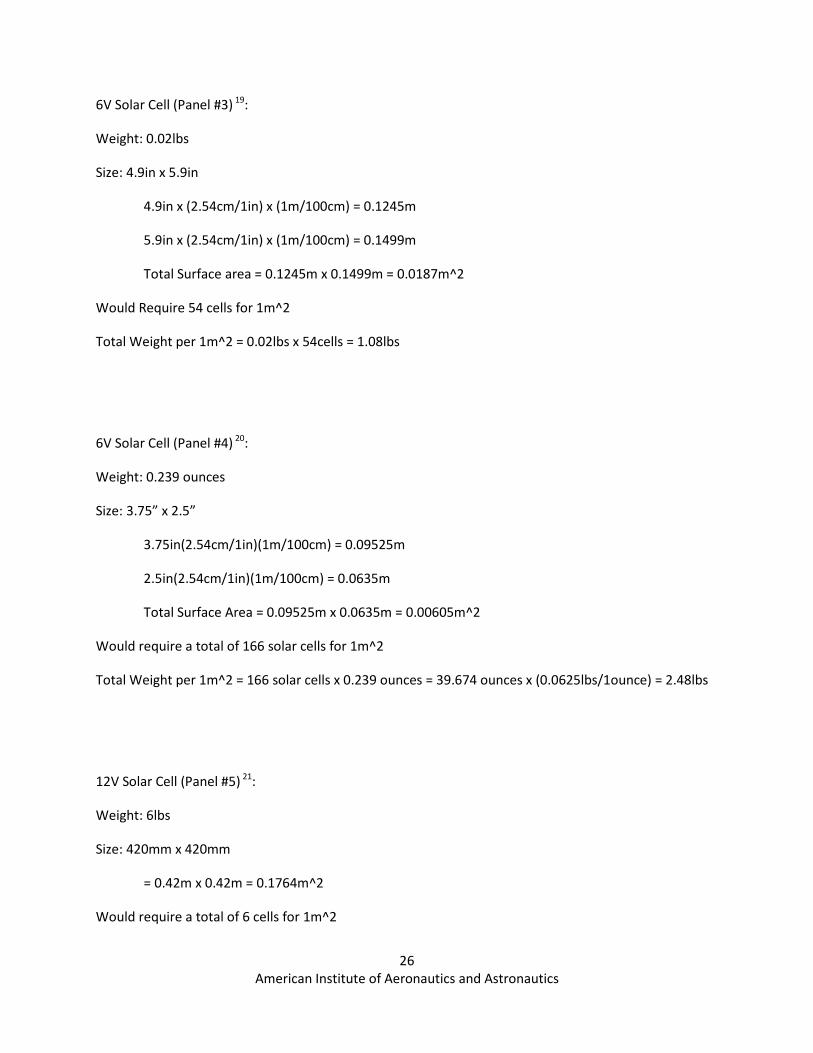
6V Solar Cell (Panel #3) 19:
Weight: 0.02lbs
Size: 4.9in x 5.9in
4.9in x (2.54cm/1in) x (1m/100cm) = 0.1245m
5.9in x (2.54cm/1in) x (1m/100cm) = 0.1499m
Total Surface area = 0.1245m x 0.1499m = 0.0187m^2
Would Require 54 cells for 1m^2
Total Weight per 1m^2 = 0.02lbs x 54cells = 1.08lbs
6V Solar Cell (Panel #4) 20:
Weight: 0.239 ounces
Size: 3.75” x 2.5”
3.75in(2.54cm/1in)(1m/100cm) = 0.09525m
2.5in(2.54cm/1in)(1m/100cm) = 0.0635m
Total Surface Area = 0.09525m x 0.0635m = 0.00605m^2
Would require a total of 166 solar cells for 1m^2
Total Weight per 1m^2 = 166 solar cells x 0.239 ounces = 39.674 ounces x (0.0625lbs/1ounce) = 2.48lbs
12V Solar Cell (Panel #5) 21:
Weight: 6lbs
Size: 420mm x 420mm
= 0.42m x 0.42m = 0.1764m^2
Would require a total of 6 cells for 1m^2
27
American Institute of Aeronautics and Astronautics
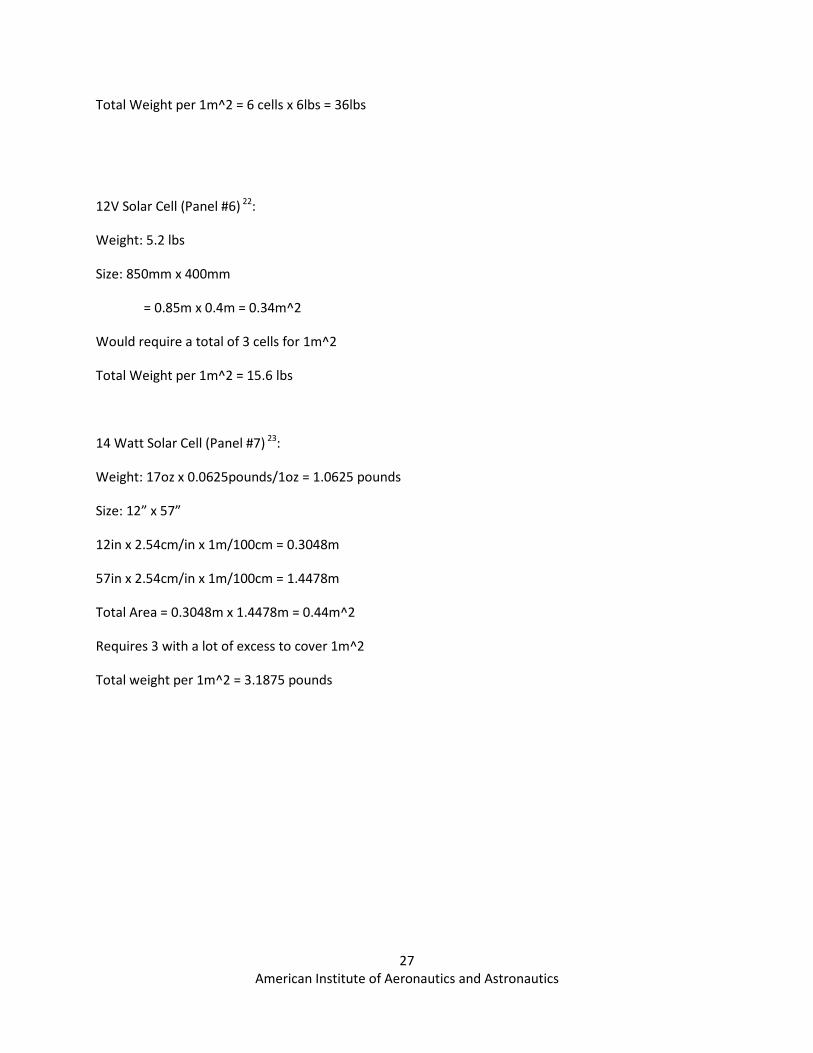
Total Weight per 1m^2 = 6 cells x 6lbs = 36lbs
12V Solar Cell (Panel #6) 22:
Weight: 5.2 lbs
Size: 850mm x 400mm
= 0.85m x 0.4m = 0.34m^2
Would require a total of 3 cells for 1m^2
Total Weight per 1m^2 = 15.6 lbs
14 Watt Solar Cell (Panel #7) 23:
Weight: 17oz x 0.0625pounds/1oz = 1.0625 pounds
Size: 12” x 57”
12in x 2.54cm/in x 1m/100cm = 0.3048m
57in x 2.54cm/in x 1m/100cm = 1.4478m
Total Area = 0.3048m x 1.4478m = 0.44m^2
Requires 3 with a lot of excess to cover 1m^2
Total weight per 1m^2 = 3.1875 pounds
28
American Institute of Aeronautics and Astronautics
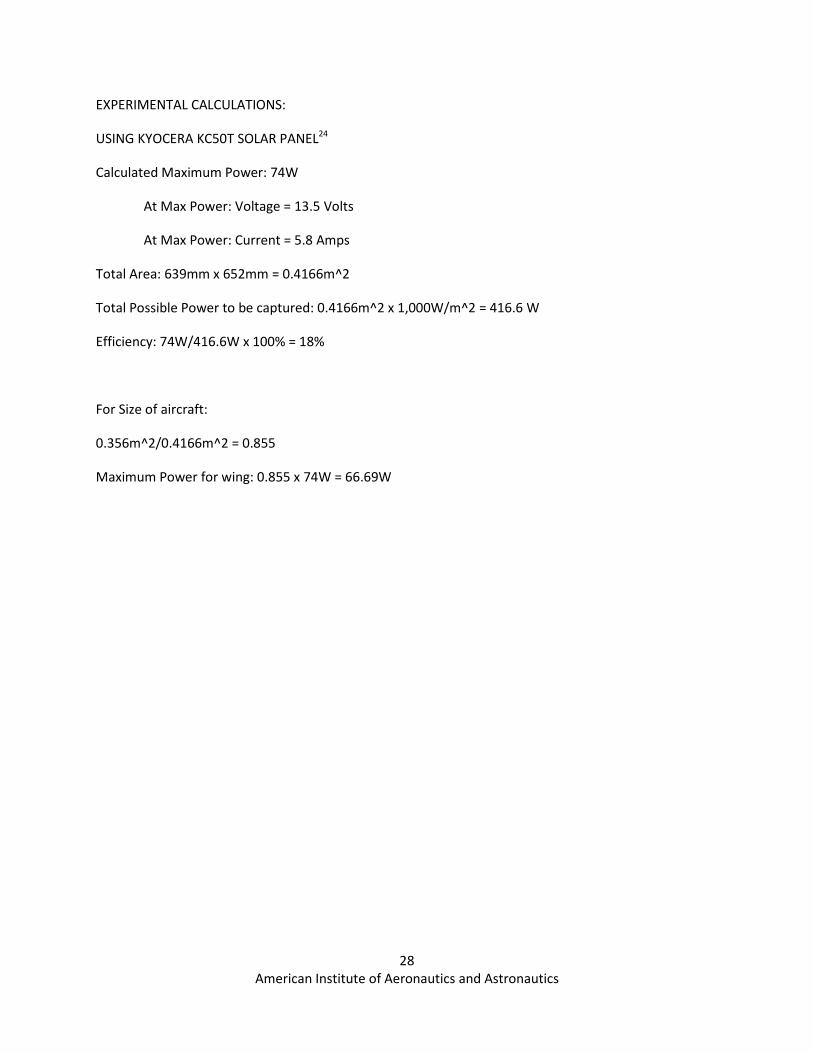
EXPERIMENTAL CALCULATIONS:
USING KYOCERA KC50T SOLAR PANEL24
Calculated Maximum Power: 74W
At Max Power: Voltage = 13.5 Volts
At Max Power: Current = 5.8 Amps
Total Area: 639mm x 652mm = 0.4166m^2
Total Possible Power to be captured: 0.4166m^2 x 1,000W/m^2 = 416.6 W
Efficiency: 74W/416.6W x 100% = 18%
For Size of aircraft:
0.356m^2/0.4166m^2 = 0.855
Maximum Power for wing: 0.855 x 74W = 66.69W
29
American Institute of Aeronautics and Astronautics
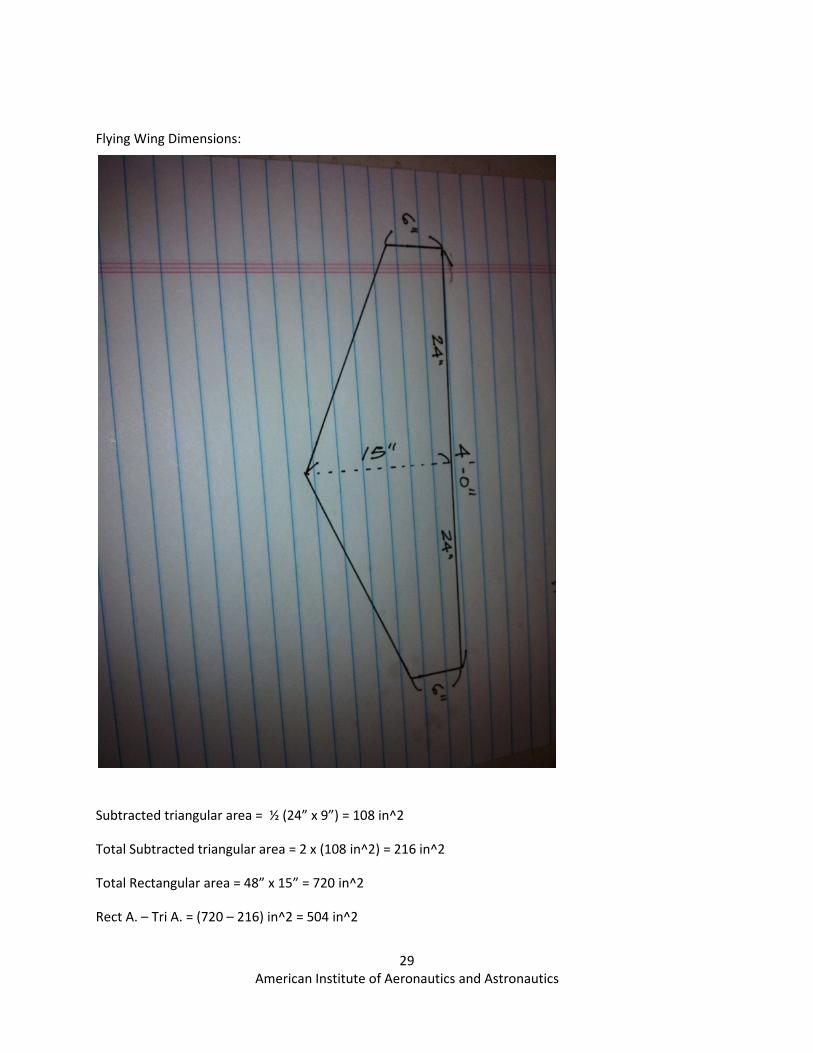
Flying Wing Dimensions:
Subtracted triangular area = ½ (24” x 9”) = 108 in^2
Total Subtracted triangular area = 2 x (108 in^2) = 216 in^2
Total Rectangular area = 48” x 15” = 720 in^2
Rect A. – Tri A. = (720 – 216) in^2 = 504 in^2

30
American Institute of Aeronautics and Astronautics
504 in^2 x (1ft^2 / 144in^2) = 3.5 ft^2
3.5 ft^2 x (1yd^2/9ft^2) = 0.3888888888 yd^2
0.389 yd^2 x (1m^2/1.094yd^2) = 0.356 m^2
Rough total surface area of the wing is 0.356 m^2
Actual Panel Efficiencies:
Panel #117: 6cells x 17.5V x 1.17A = 122.85W/m^2
(122.85W/m^2)/(1,000 W/m^2) = 0.12285 -> 12.3% Efficient
Panel #218: 127cells x 6V x 0.167A = 127.254W/m^2
(127.254W/m^2)/(1,000 W/m^2) = 0.127254 -> 12.7% Efficient
Panel #319: 54cells x 6V x 0.1A = 32.4W/m^2
(32.4W/m^2)/(1,000 W/m^2) = 0.0324 -> 3.2% Efficient
Panel #420: 166cells x 6V x 0.05A = 49.8W/m^2
(49.8W/m^2)/(1,000 W/m^2) = 0.0498 -> 4.98% Efficient
Panel #521: 6cells x 17.2V x 1.17A = 120.744W/m^2
(120.744W/m^2)/(1,000 W/m^2) = 0.120744 -> 12.1% Efficient
Panel #622: 3cells x 18V x 1.667A = 90.018W/m^2
(90.018W/m^2)/(1,000 W/m^2) = 0.090018 -> 9.0% Efficient
Panel #723: 3cells x 14W = 42W/m^2
31
American Institute of Aeronautics and Astronautics
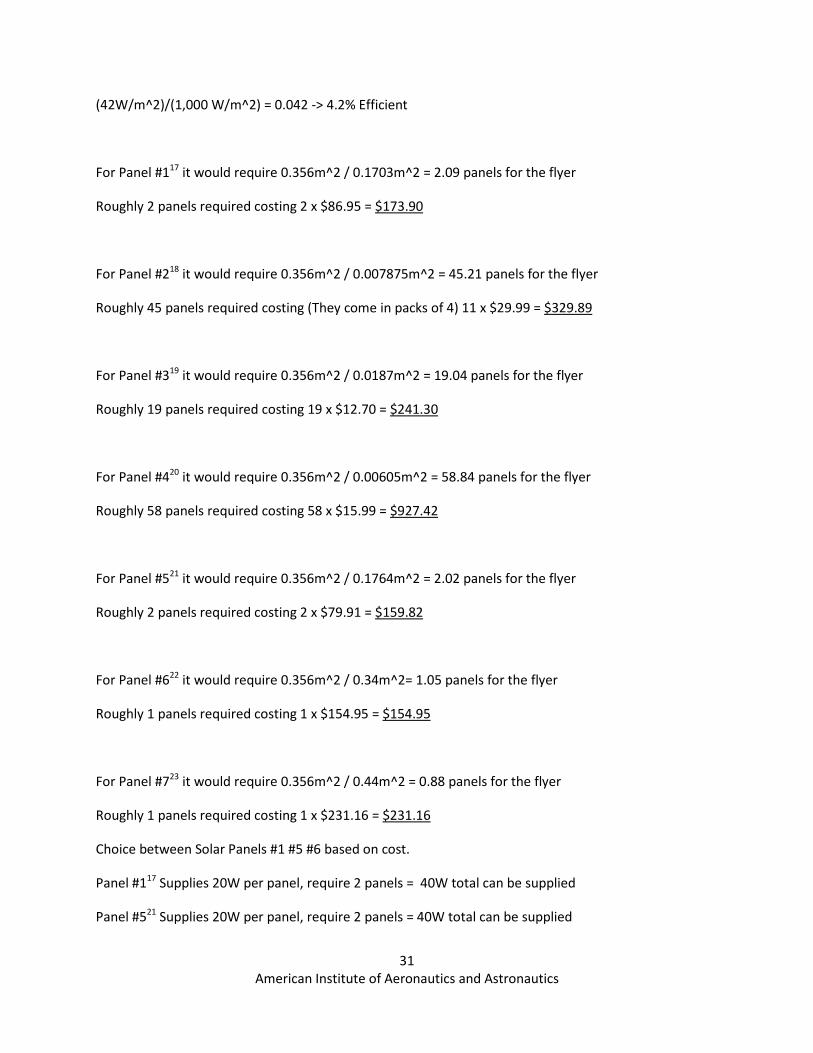
(42W/m^2)/(1,000 W/m^2) = 0.042 -> 4.2% Efficient
For Panel #117 it would require 0.356m^2 / 0.1703m^2 = 2.09 panels for the flyer
Roughly 2 panels required costing 2 x $86.95 = $173.90
For Panel #218 it would require 0.356m^2 / 0.007875m^2 = 45.21 panels for the flyer
Roughly 45 panels required costing (They come in packs of 4) 11 x $29.99 = $329.89
For Panel #319 it would require 0.356m^2 / 0.0187m^2 = 19.04 panels for the flyer
Roughly 19 panels required costing 19 x $12.70 = $241.30
For Panel #420 it would require 0.356m^2 / 0.00605m^2 = 58.84 panels for the flyer
Roughly 58 panels required costing 58 x $15.99 = $927.42
For Panel #521 it would require 0.356m^2 / 0.1764m^2 = 2.02 panels for the flyer
Roughly 2 panels required costing 2 x $79.91 = $159.82
For Panel #622 it would require 0.356m^2 / 0.34m^2= 1.05 panels for the flyer
Roughly 1 panels required costing 1 x $154.95 = $154.95
For Panel #723 it would require 0.356m^2 / 0.44m^2 = 0.88 panels for the flyer
Roughly 1 panels required costing 1 x $231.16 = $231.16
Choice between Solar Panels #1 #5 #6 based on cost.
Panel #117 Supplies 20W per panel, require 2 panels = 40W total can be supplied
Panel #521 Supplies 20W per panel, require 2 panels = 40W total can be supplied
32
American Institute of Aeronautics and Astronautics
Panel #622 Supplies 30W per panel, require 1 panel = 30W total can be supplied
Choose Panel #521
to use
Weight is negligible for our project, the plane will not be flown.
Solar panels available are much less efficient than our assumption of 18% meaning total power available
is even less than what was originally thought.
.239 oz / 0.00605m^2 x 0.356m^2 x 0.0625lb/1oz x 435.59g/1lb = 398.69g
33
American Institute of Aeronautics and Astronautics
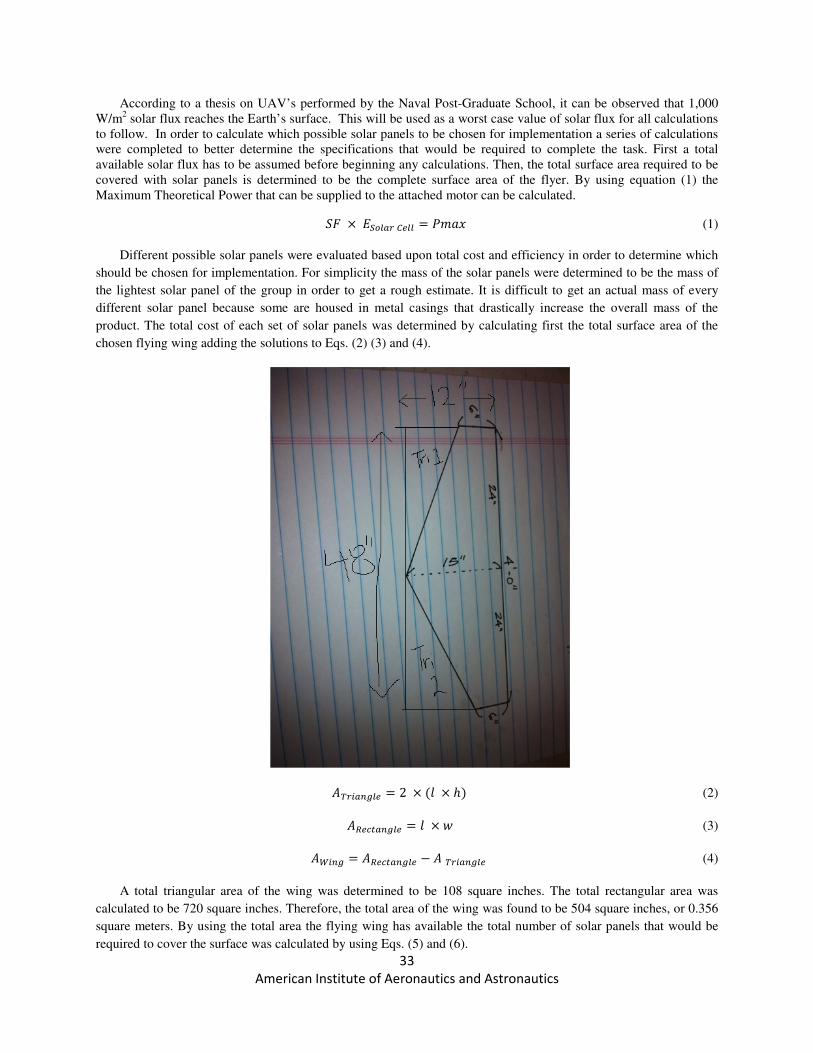
According to a thesis on UAV’s performed by the Naval Post-Graduate School, it can be observed that 1,000 W/m2 solar flux reaches the Earth’s surface. This will be used as a worst case value of solar flux for all calculations to follow. In order to calculate which possible solar panels to be chosen for implementation a series of calculations were completed to better determine the specifications that would be required to complete the task. First a total available solar flux has to be assumed before beginning any calculations. Then, the total surface area required to be covered with solar panels is determined to be the complete surface area of the flyer. By using equation (1) the Maximum Theoretical Power that can be supplied to the attached motor can be calculated.
2" C ����� ���� - �./0 (1)
Different possible solar panels were evaluated based upon total cost and efficiency in order to determine which
should be chosen for implementation. For simplicity the mass of the solar panels were determined to be the mass of
the lightest solar panel of the group in order to get a rough estimate. It is difficult to get an actual mass of every
different solar panel because some are housed in metal casings that drastically increase the overall mass of the
product. The total cost of each set of solar panels was determined by calculating first the total surface area of the
chosen flying wing adding the solutions to Eqs. (2) (3) and (4).
�� ���� - 2 C 4E C ,@ (2)
�������� - E C F (3)
��� - �������� B � � ���� (4)
A total triangular area of the wing was determined to be 108 square inches. The total rectangular area was
calculated to be 720 square inches. Therefore, the total area of the wing was found to be 504 square inches, or 0.356
square meters. By using the total area the flying wing has available the total number of solar panels that would be
required to cover the surface was calculated by using Eqs. (5) and (6).
34
American Institute of Aeronautics and Astronautics
����� ���� - E C F (5)
��� G ����� ���� - �� �$�� �� (6)
The total area of the solar panel is incredibly variable and can be anywhere from a few square inches to square
meters in size. Due to the variable nature of the size of each individual solar panel the total number of panels
required to cover the entire surface is also variable. For example the experimental solar array used during testing has
a surface area of 0.4166 square meters, which is more than the available area of the wing. Therefore only 0.855 or
85% of the solar panel can be used to cover the wing (found by dividing total area of wing by total area of solar
panel). After calculating the total required solar panels to cover the flying wing, the total cost of the panels was
determined by using Eq. (7).
������ ����# - �� C '� (7)
The total cost of the entire solar array of panels is also variable based upon both the cost of each panel, as well
as the total number of panels required to cover the surface. Again, using the experimental solar panels, there would
be a total cost of $251 which is the cost of one single solar panel which would then need to be carefully cut in order
to fit the wing. Any solar panels that lie completely out of the available budget are then immediately thrown out.
The actual efficiencies of the possible solar panels are then calculated in order to determine based upon cost and
actual efficiency which should be chosen for actual usage. By using Eqs. (8) and (9) the efficiencies can be
determined by using the given specifications available from the manufacturer.
� 1 ( - �������� (8)
�������� G 2" - �������� (9)
The current and voltage of all solar panels is highly variable as well depending on which model is being used.
For the experimental solar panels, the current when rated at maximum power is 5.8 Amperes and 13.3 Volts was
determined for the voltage at maximum power. Therefore, the maximum power generated by the individual solar
panel can be found to be 78.3 Watts. The solar panel’s efficiency was then determined to be 0.18 or 18% efficient at
converting solar energy into electrical energy. The total amount of power that can be provided by the solar array
may be calculated by completing Eq. (10).
������ % �& - ����� ���� C H����# (10)
For the experimental solar panel, there is only a single panel operating at 66.69 Watts, therefore it is capable of
supplying a total of 66.69 Watts of power to the electrical circuit.
35
American Institute of Aeronautics and Astronautics
24
36
American Institute of Aeronautics and Astronautics
24
37
American Institute of Aeronautics and Astronautics
25
38
American Institute of Aeronautics and Astronautics
References 1"Predator RQ-1." Predator RQ-1. Web. 22 Feb. 2012. <http://www.airforce-technology.com/Projects/predator-uav/>.
2"RQ-11 Raven." RQ-11 Raven. Web. 22 Feb. 2012. <http://www.globalsecurity.org/intell/systems/raven.htm>.
3“RQ-11B RAVEN” Web. 22 Feb. 2012. <http://www.af.mil/information/factsheets/factsheet.asp?id=10446>.
4"RQ-11 Raven." RQ-11 Raven Unmanned Aerial Vehicle. Web. 22 Feb. 2012. <http://www.army-
technology.com/projects/rq11-raven/>
5Coba, Javier V. Application of Copper Indium Gallium Diselenide Photovoltaic Cells to Extend the Endurance and
Capabilities of the Raven RQ-11B Unmanned Aerial Vehicle. Thesis. Naval Post Graduate School, 2010. Print.
6Moore, Aaron. “Lithium Polymer (Lipo) Battery Guide” Nov. 2008. <http://prototalk.net/forums/showthread.php?t=22>
7"Photograph." Lithium Polymer Battery. Web. 15 Feb. 2012. <http://www.bridgat.com/index.php?page=images>.
8“Voltaire BLITZ.” Thesis. California Polytechnic State University, 2010.
9"Actuators and Servos." How to Build a Robot. Web. 12 Feb. 2012.
<http://www.societyofrobots.com/actuators_servos.shtml>.
10"HS-322HD Standard Heavy Duty Servo." HS-322HD. Web. 25 Feb. 2012.
<http://www.hitecrcd.com/products/analog/standard-sport/hs-322hd.html>.
11"Understanding RC Servos." Web. 16 Feb. 2012. <http://www.rchelicopterfun.com/rc-servos.html>.
12"Get Data Graph Digitizer Program." Digitize Graphs and Plots. Web. 08 Mar. 2012. <http://www.getdata-graph-
digitizer.com/>.
13"Hitec Karbonite Gearsets." ServoCity. Web. 16 Feb. 2012. <http://servocity.com/html/hitec_karbonite_gearsets.html>.
14"Solar Impulse." Wikipedia, the Free Encyclopedia. Web. 09 Dec. 2011. <http://en.wikipedia.org/wiki/Solar_Impulse>.
15 "NASA - Helios Prototype Solar-Powered Aircraft." NASA - Home. Web. 09 Dec. 2011.
<http://www.nasa.gov/centers/dryden/history/pastprojects/Helios/index.html>.
16"Solar Radiation." Encyclopedia of Earth. Web. 09 Dec. 2011. <http://www.eoearth.org/article/Solar_radiation>.
17Amazon Shop listing. “Instapark® 20W Mono-crystalline Solar Panel with 12V Solar Charge Controller.” Amazon. Web.
08 Dec. 2011. <http://www.amazon.com/Instapark%C2%AE-Mono-crystalline-Solar-Charge-
Controller/dp/B004FOIDU6/ref=sr_1_5?ie=UTF8&qid=1319697679&sr=8-5>.
18"4 Pack of 6V Solar Panels." Parallax Home. Web. 08 Dec. 2011.
<http://www.parallax.com/Store/Accessories/PowerSupplies/tabid/165/ProductID/673/List/0/Default.aspx?SortField=ProductNa
me,ProductName>.
19"6V 100mA Flexible Solar Panel." Solar Panels, Fountains, Solar Lights, Thin Film Panels - Manufacturer. Web. 08 Dec.
2011. <http://www.siliconsolar.com/6v-100ma-flexible-solar-panel-p-501558.html>.
20"6V 50mAh Solar Cell Encap : Solar Power | RadioShack.com." RadioShack - Mobile Phones, MP3 Players, Laptops, and
More. Web. 08 Dec. 2011. <http://www.radioshack.com/product/index.jsp?productId=2131051>.
21"Amazon.com: HQRP 20W Mono-crystalline Solar Panel 20 Watt 12 Volt in Anodized Aluminum Frame Square Shape
plus HQRP Coaster.: Patio, Lawn & Garden."Amazon.com: Online Shopping for Electronics, Apparel, Computers, Books, DVDs
39
American Institute of Aeronautics and Astronautics
& More. Web. 08 Dec. 2011. <http://www.amazon.com/HQRP-Mono-crystalline-Anodized-Aluminum-
Coaster/dp/B002HT09TO/ref=pd_sim_sbs_ol_5>.
22"Amazon.com: HQRP 30W Flexible Solar Panel Power 30 Watt 12V Mono-crystalline PV Module W/ 4 Stainless
Grommets for RV Boat Yacht plus HQRP UV Chain / UV Radiation Health Tester: Home & Garden." Amazon.com: Online
Shopping for Electronics, Apparel, Computers, Books, DVDs & More. Web. 09 Dec. 2011. <http://www.amazon.com/HQRP-
Flexible-Mono-crystalline-Stainless-Radiation/dp/B003DVY27U/ref=sr_1_27?s=home-garden>.
23"Brunton SolarRoll Flexible Solar Panel from Backcountry.com." Backcountry.com: The North Face, Mountain Hardwear
and Arc'teryx Skiing, Camping, Hiking and Backpacking Gear. Web. 09 Dec. 2011. <http://www.backcountry.com/brunton-
solarroll-solar-panel?CMP_ID=PD_GOO001>.
24Kyocera Corporation. “KC50T: High Efficiency Multicrystal Photovoltaic Module”
25Sanyo. “Cell Type KR-AAH Specifications”