AEP Elical Assessment of Ageing Coal-Fired Generation ...
48
AEP Elical Pty Ltd ABN 74 168 930 032 Level 1 99 Melbourne Street South Brisbane QLD 4101 PO Box 3075 South Brisbane QLD 4101 T 07 3193 0444 E [email protected] W aep-elical.com.au Report Assessment of Ageing Coal-Fired Generation Reliability Australian Energy Market Operator Limited, for publication Document Name: Ageing Coal-Fired Generation Reliability Project No: P1712 Client Document No: N/A AEP Document No: P1712-00-E-RP-0001 Date: 30 June 2020 Revision: 1
Transcript of AEP Elical Assessment of Ageing Coal-Fired Generation ...

AEP Elical Pty Ltd ABN 74 168 930 032
Level 1 99 Melbourne Street
South Brisbane QLD 4101
PO Box 3075
South Brisbane QLD 4101
T 07 3193 0444
W aep-elical.com.au
Report Assessment of Ageing Coal-Fired Generation Reliability
Australian Energy Market Operator Limited, for
publication
Document Name: Ageing Coal-Fired Generation Reliability
Project No: P1712
Client Document No: N/A
AEP Document No: P1712-00-E-RP-0001
Date: 30 June 2020
Revision: 1

Australian Energy Market
Operator Limited, for publication
Ageing Coal-Fired Generation
Reliability
P1712-00-E-RP-0001
30 June 2020
P1712-00-E-RP-0001_0 Ageing Coal-Fired Generation Reliability (NEM) public draft.docx
© Copyright 2020 IN CONFIDENCE
2
Table of Contents
1 Introduction ....................................................................................................................................... 4
2 Methodology Overview ................................................................................................................... 6
3 Review of Outage Data .................................................................................................................. 8
3.1 Outage Categories .................................................................................................................. 8
3.2 Major (HILP) Events ................................................................................................................. 11
3.3 Allocation of Major Events ..................................................................................................... 11
3.4 Derivation of Start Point for Forward Predictions ................................................................ 12
4 Feedback from Station Representatives ..................................................................................... 17
4.1 International data comparison ............................................................................................. 17
5 Approach to Forecasting FORs and EPORs to End of Life ......................................................... 19
5.1 Generic Growth Factors ........................................................................................................ 19
5.2 HILP Events ............................................................................................................................... 23
5.3 End of Life Factors ................................................................................................................... 23
5.4 Summary Growth Factors for States and Fleet ................................................................... 24
5.5 Predicted FOR by State and Fleet ........................................................................................ 25
5.6 Predicted FOR, EPOR and EFOR for States and Fleet ......................................................... 26
7 Conclusions...................................................................................................................................... 29
List of Tables
Table 2-1: Coal fired generator in the NEM .......................................................................................... 6
Table 3-1: Outage category breakdown ............................................................................................. 8
Table 3-2: List of HILP events.................................................................................................................. 11
Table 3-3: Impact of HILP events on FOR, FY2016 to March 2020 ................................................... 12
Table 3-4: FOR starting points for forward projections ....................................................................... 12
Table 4-1: Weighting changes from 4-year rolling average ............................................................. 17
Table 4-2 Comparison of NERC and NEM Outage rates .................................................................. 18
Table 5-1: General ageing growth per annum for each outage cause ........................................ 22
Table 5-2: General ageing growth per annum for each outage cause (cont.) ........................... 23
Table 5-3: End of life growth per annum ............................................................................................. 23
Table 5-4: Summary of start points and growth factors .................................................................... 24

Australian Energy Market
Operator Limited, for publication
Ageing Coal-Fired Generation
Reliability
P1712-00-E-RP-0001
30 June 2020
P1712-00-E-RP-0001_0 Ageing Coal-Fired Generation Reliability (NEM) public draft.docx
© Copyright 2020 IN CONFIDENCE
3
List of Figures
Figure 3-1: Breakdown of forced outage rate by category ............................................................ 10
Figure 3-2: Breakdown of partial outages by category .................................................................... 10
Figure 3-3: NSW 4-year rolling averages .............................................................................................. 13
Figure 3-4: QLD 4-year rolling averages .............................................................................................. 13
Figure 3-5: VIC 4-year rolling averages ............................................................................................... 14
Figure 3-6: Fleet 4-year rolling averages ............................................................................................. 14
Figure 3-7: NSW 4-year rolling averages including HILP adjustment................................................ 15
Figure 3-8: QLD 4-year rolling averages including HILP adjustment ................................................ 15
Figure 3-9: VIC 4-year rolling averages including HILP adjustment ................................................. 16
Figure 3-10: Fleet 4-year rolling averages including HILP adjustment ............................................. 16
Figure 5-1: State and fleet forced outage rates ................................................................................ 25
Figure 5-2: NSW forced outage rates .................................................................................................. 26
Figure 5-3: QLD forced outage rates ................................................................................................... 26
Figure 5-4: VIC forced outage rates .................................................................................................... 27
Figure 5-5: Fleet forced outage rates .................................................................................................. 27

Australian Energy Market
Operator Limited, for publication
Ageing Coal-Fired Generation
Reliability
P1712-00-E-RP-0001
30 June 2020
P1712-00-E-RP-0001_0 Ageing Coal-Fired Generation Reliability (NEM) public draft.docx
© Copyright 2020 IN CONFIDENCE
4
1 Introduction
AEP Elical has been appointed by AEMO to provide support through the development of a
‘Projection of Thermal Generation Reliability and Forced Outage Rates (FOR)’ report, that may
be published on the AEMO website and may be used as an input by AEMO’s Forecasting and
Operations teams.
Thermal generation stations play a key role in providing a secure supply of electricity to the
National Electricity Market (NEM). As these stations draw towards their closure dates, it is
important to form an educated view on their future performance and ability to continue to
provide a secure supply.
Traditionally for base load power plant, AEMO has forecast future performance based on
historical performance. It acknowledges that this is not always the case and that owners of the
plants will strive to maintain a level of reliability and availability of plant consistent with their
business' economic models, with the market providing appropriate opportunity for
compensation.
Changing market conditions will encourage some plants to move away from the traditional
base load operation to load cycling. Such changes to the operating regime will result in a
revision to maintenance planning. Planned outages may become more frequent; metal fatigue
and creep on high pressure and temperature components will be accelerated; and asset
management plans may be required to reflect the need for greater levels of capital and
operational expenditure. Depending on the financial returns to the owners, decisions in this
regard may have a noticeable impact on a plant’s outage rates and reliability.
There is a need, therefore, for AEMO to consider each of the sixteen coal power stations in the
NEM on their individual merits, where they sit in the network with the growth of renewable energy
projects in the energy system as well as on a technology – black coal and brown coal – state
and fleet basis as well as the historical performance and trends.
To assist AEMO in this consideration, AEP Elical has been commissioned to provide forward-
looking projections for:
• Planned outage (maintenance) rates and either of the following:
o Full forced outage rates (FOR), partial forced outage rates (EPOH) and average
partial derating;
o Full forced outage rates and partial forced outage rates assuming the average
partial derating will not change; and
o Effective forced outage rates (EFOR) comprising the sum of FOR and EPOR (which
is the product of EPOH and average partial derating).

Australian Energy Market
Operator Limited, for publication
Ageing Coal-Fired Generation
Reliability
P1712-00-E-RP-0001
30 June 2020
P1712-00-E-RP-0001_0 Ageing Coal-Fired Generation Reliability (NEM) public draft.docx
© Copyright 2020 IN CONFIDENCE
5
AEP Elical has elected to provide forward looking projections for FOR, EPOR and EFOR.

Australian Energy Market
Operator Limited, for publication
Ageing Coal-Fired Generation
Reliability
P1712-00-E-RP-0001
30 June 2020
P1712-00-E-RP-0001_0 Ageing Coal-Fired Generation Reliability (NEM) public draft.docx
© Copyright 2020 IN CONFIDENCE
6
2 Methodology Overview
The approach adopted by AEP Elical, for predicting Forced Outage Rates (FOR) and Effective
Forced Outage Rates (EFOR) for the coal fired power plant in the NEM, has been through a
model that bases future performance on historical data modified by station specific and
generic changes ‘growth factors’ 1 . This analysis considers the mode of operation and
maintenance of the aging assets, particularly whether specific maintenance actions or capital
investments could influence the starting point for future projections. The analysis considers two
scenarios that comprise business as usual and a lower level of coal fired plant generation
caused by an increase in variable renewable generation.
The coal fired stations in the NEM are tabulated below.
TABLE 2-1: COAL FIRED GENERATOR IN THE NEM
Black Coal Fired Power Plant State Age (Years)
Bayswater NSW 36
Eraring A NSW 36
Liddell NSW 47
Mt Piper NSW 26
Vales Point B NSW 41
Callide B QLD 30
Callide C QLD 18
Gladstone QLD 43
Kogan Creek QLD 12
Millmerran QLD 17
Stanwell QLD 24
Tarong QLD 34
Tarong North QLD 16
Brown Coal Fired Power Plant State Age (Years)
Loy Yang A VIC 33
Loy Yang B VIC 24
Yallourn W VIC 39
1 The phrase ‘growth factors’ is used for brevity: growth factors can include shrinkage as well as
growth

Australian Energy Market
Operator Limited, for publication
Ageing Coal-Fired Generation
Reliability
P1712-00-E-RP-0001
30 June 2020
P1712-00-E-RP-0001_0 Ageing Coal-Fired Generation Reliability (NEM) public draft.docx
© Copyright 2020 IN CONFIDENCE
7
The forecasts developed are based on AEP Elical’s knowledge of the operation of some of these
assets and assets of a similar nature, as well as through discussions with representatives from most
of the stations.
The analysis assumes that the plants are being operated on the fuel for which they were
originally designed. For fuel availability, economic or environmental reasons, an owner may
attempt to operate on an alternative fuel with a different operating range. Such an action can
cause changes to a forecast model, however, there was no evidence to show that this was a
material concern for any of the assets considered in this study.
The performance of plants will depend on the owners' investment in refurbishment, strategic
spares and planned maintenance. This will also be influenced by expectations of market
revenue. While with enough incentive, almost any reasonable level of reliability is achievable
this was not considered explicitly.
Projections for FOR were predicated on the historical data supplied by AEMO but modified by
excluding, at a station level, a number of high impact low probability (HILP) events. The impact
of these events was incorporated at a state or fleet level.
The planned closure date of each station was considered. For plants approaching their end of
life, planned maintenance outages generally continue as normal until the last 4 or so years of
operation after which AEP Elical expects maintenance expenditure will be reduced to meet
statutory obligations only. This is expected to result in increases in FOR and EPOR values in the
final years of operation.

Australian Energy Market
Operator Limited, for publication
Ageing Coal-Fired Generation
Reliability
P1712-00-E-RP-0001
30 June 2020
P1712-00-E-RP-0001_0 Ageing Coal-Fired Generation Reliability (NEM) public draft.docx
© Copyright 2020 IN CONFIDENCE
8
3 Review of Outage Data
A review of documents provided by AEMO was undertaken. The primary documents comprised:
• Guidebook for Forced Outage Data Recording
• Coal Outage Events with Reasons (Excel), FY2016 to end March 2020, updated to include
partial outage data derating values, ’Outage Events’.
• Outage Data for Coal Units (Excel), FY2011to end March 2020, with weighted values for
full outage rates (FOR), partial outage hours (POH), and partial outage deratings,
‘Outage Data’.
AEP Elical used the Outage Data file to derive effective partial outage rates (EPOR) and effective
forced outage rates (EFOR) which are the sum of the FOR and EPOR.
While the data in the Outage Events file correlated fairly well with the summary data in the
Outage Data file, this events data was used to identify causes of outages, not to quantify the
overall outage rates as these were taken to be the values in the Outage Data file. The
identification of causes was constrained as the causes for outages have only been provided as
free format text box descriptions, but AEP Elical used its experience and judgement as
appropriate to interpret the phrases in the text boxes.
3.1 Outage Categories
Details of forced and partial outages as supplied to AEMO from the stations from FY2016 to
March 2020 were studied and analysed in order to understand and quantify the causes.
The outage data provided by AEMO included the number of hours units at each station suffered
full outages (i.e. a unit was offline) and partial outages (i.e. the number of hours a unit was
operating at an unplanned reduced load). The outage causes were reviewed by the AEP
Elical team and categorised as follows:
TABLE 3-1: OUTAGE CATEGORY BREAKDOWN
Category
Number
Description Explanation
1 Fuel supply In particular issues of coal quality and supply plus transfer
to bunkers
2 Fuel system Includes plant and equipment for processing and
transferring coal from bunkers to the furnace
3 Boiler Including furnace, water walls, superheaters, reheaters,
economisers and all headers and pressure parts plus main
steam lines

Australian Energy Market
Operator Limited, for publication
Ageing Coal-Fired Generation
Reliability
P1712-00-E-RP-0001
30 June 2020
P1712-00-E-RP-0001_0 Ageing Coal-Fired Generation Reliability (NEM) public draft.docx
© Copyright 2020 IN CONFIDENCE
9
Category
Number
Description Explanation
4 Flue gas and ash
systems
Includes FD and ID fans, air heaters, bag filters,
precipitators, fly ash and bottom ash handling plant, stack
(but not emissions constraints)
5 Steam turbine HP/IP/LP turbine plant plus auxiliaries
6 Condenser and feed
heating system
Condensers, HP/IP/LP heaters, deaerators, boiler feed
pumps, plus main cooling water system and water
treatment plant
7 Generator Generator plant including excitation and generator
auxiliaries
8 Transformers Generator and unit transformers
9 C&I systems Distributed control systems, plant controls and
instrumentation, data processing, logic controllers
10 Auxiliary mechanical
plant
Other mechanical plant not covered elsewhere including
compressed air, auxiliary cooling water plant and fire
protection systems
11 Auxiliary electrical
plant
Other electrical plant not covered elsewhere including
batteries, switchgear, secure and emergency supply
systems, diesel generator plant
12 Human factors Human error
13 Other / unspecified A bucket category for outages that could not be
categorised elsewhere
14 Environmental
emissions
Aqueous and gaseous excursions to environmental limits
There were approximately 480 forced outage entries and 7630 partial outage / derating entries.
While some entries were straightforward to categorise, there were many that required a
judgement regarding the primary cause of the outage / derating and some stations used a
‘Null’ descriptor. The Nulls were initially categorised as ‘Other / unspecified’ but in some
instances for forced outages, station representatives provided more data that allowed better
classification.
The causes of forced outages and of partial outages / deratings are very different as shown in
Figure 3-1 and Figure 3-2 below.

Australian Energy Market
Operator Limited, for publication
Ageing Coal-Fired Generation
Reliability
P1712-00-E-RP-0001
30 June 2020
P1712-00-E-RP-0001_0 Ageing Coal-Fired Generation Reliability (NEM) public draft.docx
© Copyright 2020 IN CONFIDENCE
10
FIGURE 3-1: BREAKDOWN OF FORCED OUTAGE RATE BY CATEGORY
FIGURE 3-2: BREAKDOWN OF PARTIAL OUTAGES BY CATEGORY
3-Boiler
4-Flue gas and ash systems
5-Steam Turbine
6-Condenser
and feedheati…
7-Generator
13-Other / unspecified
BREAKDOWN OF FORCED OUTAGES BY CATEGORY1-Fuel supply
2-Fuel system (from supply up toburners)3-Boiler
4-Flue gas and ash systems
5-Steam Turbine
6-Condenser and feedheating system
7-Generator
8-Transformers (generator and unittransformers)9-C&I system
10-Auxiliary mechanical
11-Auxiliary electrical
12-Human factors
13-Other / unspecified
1-Fuel supply
2-Fuel system (from supply up to burners)
3-Boiler
4-Flue gas and ash systems
5-Steam Turbine
6-Condenser and feedheating system
13-Other / unspecified
BREAKDOWN OF EFFECTIVE PARTIAL OUTAGES BY CATEGORY
1-Fuel supply
2-Fuel system (from supply upto burners)3-Boiler
4-Flue gas and ash systems
5-Steam Turbine
6-Condenser andfeedheating system7-Generator
8-Transformers (generatorand unit transformers)9-C&I system
10-Auxiliary mechanical
11-Auxiliary electrical
12-Human factors
13-Other / unspecified
14-Environmental emissions

Australian Energy Market
Operator Limited, for publication
Ageing Coal-Fired Generation
Reliability
P1712-00-E-RP-0001
30 June 2020
P1712-00-E-RP-0001_0 Ageing Coal-Fired Generation Reliability (NEM) public draft.docx
© Copyright 2020 IN CONFIDENCE
11
Figure 3-1 and Figure 3-2 above show that the primary causes for forced outages are quite
different from the causes for partial outages / deratings. The most significant cause of forced
outages is boiler problems, in particular steam leaks from failed tubing, with significant
contributions from steam turbine and generator issues. However, a major part of the forced
outage losses from turbine and generator outages are caused by a small number of high impact
low probability (HILP) events as discussed in the next section. Excluding these the condensate
and feedheating and flue gas and ash categories become more significant. For partial outages
/ deratings boiler issues are a secondary category with the major causes being the condensate
and feedheating and flue gas and ash categories plus fuel supply and fuel system losses which
cause a negligible proportion of the forced outages.
3.2 Major (HILP) Events
The Outage Events file included a number of high impact low probability (HILP) events that have
a large impact on the FOR of the stations in the years that they occur. Therefore, AEP Elical has
identified and quantified these HILP events as a separate category.
For the period from FY2016 onwards the following events have been categorised as HILP events
TABLE 3-2: LIST OF HILP EVENTS
Event Financial Year of
Event
Forced Outage
Hours
FOR Impact in Year
Steam turbine failure FY2017 1007 2.76%
Steam turbine failure FY2017 631 2.28%
Steam turbine failure FY2018 4227 13.57%
Generator failure FY2018 583 1.85%
Generator transformer
failure
FY2018 387 2.44%
Steam turbine failure FY2019 1865 7.73%
Arc flash incident causing
fatality
FY2019 1613 6.51%
Generator failure FY2020 4236 10.93%
Generator transformer
failure
FY2020 1153 13.93%
3.3 Allocation of Major Events
As shown in Table 3-2, HILP events are associated with the turbines, generators, and major
transformers plus electrical switchgear. These types of event can occur in any station, regardless
of the fuel type and the frequency of events by year is also variable. Given this uncertainty, AEP
Elical considers it reasonable to:

Australian Energy Market
Operator Limited, for publication
Ageing Coal-Fired Generation
Reliability
P1712-00-E-RP-0001
30 June 2020
P1712-00-E-RP-0001_0 Ageing Coal-Fired Generation Reliability (NEM) public draft.docx
© Copyright 2020 IN CONFIDENCE
12
• Average the impact of HILP events across the years for which there is data
• Average the impact of HILP events across stations
The following table shows the impact of HILP events when averaged by state and across the
fleet of coal-fired stations.
TABLE 3-3: IMPACT OF HILP EVENTS ON FOR, FY2016 TO MARCH 2020
Grouping Impact on FOR
Fleet 1.16%
NSW 1.18%
QLD 0.35%
VIC 2.46%
3.4 Derivation of Start Point for Forward Predictions
In order to produce a start point for its forward projections, AEP Elical has isolated the HILP events
from the individual financial year summaries of FOR. It has then determined a four- year 2rolling
average of FOR by state and fleet.
It then adjusted the 4-year FOR average by the statewide aggregated average of the impact
of HILP events over the past (approximately) five years. This removes the year on year variability
caused by these low probability events. This results in the adjusted FOR as shown in Table 3-4
below
TABLE 3-4: FOR STARTING POINTS FOR FORWARD PROJECTIONS
Station /
State
4-year rolling
average FOR all
data, for 2020
4-year rolling
average FOR
excluding HILP
events, for 2020
HILP event factor Adjusted 4-year
rolling average
FOR, for 2020
Fleet 5.77% 4.70% 1.16% 5.86%
VIC 7.74% 5.58% 2.46% 8.04%
NSW 6.92% 5.76% 1.18% 6.95%
QLD 3.15% 2.83% 0.35% 3.18%
The historical FOR for the fleet and states are shown in the figures below.
2 A four year rolling average was selected as this aligns with the four yearly maintenance cycle that
is typical for much of the fleet.

Australian Energy Market
Operator Limited, for publication
Ageing Coal-Fired Generation
Reliability
P1712-00-E-RP-0001
30 June 2020
P1712-00-E-RP-0001_0 Ageing Coal-Fired Generation Reliability (NEM) public draft.docx
© Copyright 2020 IN CONFIDENCE
13
FIGURE 3-3: NSW 4-YEAR ROLLING AVERAGES
FIGURE 3-4: QLD 4-YEAR ROLLING AVERAGES
0%
2%
4%
6%
8%
10%
12%
14%
2013-14 2014-15 2015-16 2016-17 2017-18 2018-19 2019-20
4-YEAR ROLLING AVERAGES NSW
4 Yr Rolling Average EFOR
4 Yr Rolling Average FOR
4 Yr Rolling Average EPOR
0%
1%
2%
3%
4%
5%
6%
2013-14 2014-15 2015-16 2016-17 2017-18 2018-19 2019-20
4-YEAR ROLLING AVERAGES QLD
4 Yr Rolling Average EFOR
4 Yr Rolling Average FOR
4 Yr Rolling Average EPOR

Australian Energy Market
Operator Limited, for publication
Ageing Coal-Fired Generation
Reliability
P1712-00-E-RP-0001
30 June 2020
P1712-00-E-RP-0001_0 Ageing Coal-Fired Generation Reliability (NEM) public draft.docx
© Copyright 2020 IN CONFIDENCE
14
FIGURE 3-5: VIC 4-YEAR ROLLING AVERAGES
FIGURE 3-6: FLEET 4-YEAR ROLLING AVERAGES
0%
2%
4%
6%
8%
10%
12%
2013-14 2014-15 2015-16 2016-17 2017-18 2018-19 2019-20
4-YEAR ROLLING AVERAGES VIC
4 Yr Rolling Average EFOR
4 Yr Rolling Average FOR
4 Yr Rolling Average EPOR
0%
1%
2%
3%
4%
5%
6%
7%
8%
9%
10%
2013-14 2014-15 2015-16 2016-17 2017-18 2018-19 2019-20
4-YEAR ROLLING AVERAGES FLEET
4 Yr Rolling Average EFOR
4 Yr Rolling Average FOR
4 Yr Rolling Average EPOR

Australian Energy Market
Operator Limited, for publication
Ageing Coal-Fired Generation
Reliability
P1712-00-E-RP-0001
30 June 2020
P1712-00-E-RP-0001_0 Ageing Coal-Fired Generation Reliability (NEM) public draft.docx
© Copyright 2020 IN CONFIDENCE
15
FIGURE 3-7: NSW 4-YEAR ROLLING AVERAGES INCLUDING HILP ADJUSTMENT
FIGURE 3-8: QLD 4-YEAR ROLLING AVERAGES INCLUDING HILP ADJUSTMENT
0%
2%
4%
6%
8%
10%
12%
14%
2013-14 2014-15 2015-16 2016-17 2017-18 2018-19 2019-20
4-YEAR ROLLING AVERAGES INCLUDING HILP ADJUSTMENTNSW
4 Yr Rolling Average EFOR(Excluding HILP Events)
4 Yr Rolling Average FOR(Excluding HILP Events)
4 Yr Rolling Average EPOR(Excluding HILP Events)
0%
1%
2%
3%
4%
5%
6%
7%
2013-14 2014-15 2015-16 2016-17 2017-18 2018-19 2019-20
4-YEAR ROLLING AVERAGES INCLUDING HILP ADJUSTMENTQLD
4 Yr Rolling Average EFOR(Excluding HILP Events)
4 Yr Rolling Average FOR(Excluding HILP Events)
4 Yr Rolling Average EPOR(Excluding HILP Events)

Australian Energy Market
Operator Limited, for publication
Ageing Coal-Fired Generation
Reliability
P1712-00-E-RP-0001
30 June 2020
P1712-00-E-RP-0001_0 Ageing Coal-Fired Generation Reliability (NEM) public draft.docx
© Copyright 2020 IN CONFIDENCE
16
FIGURE 3-9: VIC 4-YEAR ROLLING AVERAGES INCLUDING HILP ADJUSTMENT
FIGURE 3-10: FLEET 4-YEAR ROLLING AVERAGES INCLUDING HILP ADJUSTMENT
Note that the figures include the rolling averages for EPOR and EFOR as well as for FOR. There is
no impact of HILP events on the EPOR.
0%
2%
4%
6%
8%
10%
12%
2013-14 2014-15 2015-16 2016-17 2017-18 2018-19 2019-20
4-YEAR ROLLING AVERAGES INCLUDING HILP ADJUSTMENTVIC
4 Yr Rolling Average EFOR(Excluding HILP Events)
4 Yr Rolling Average FOR(Excluding HILP Events)
4 Yr Rolling Average EPOR(Excluding HILP Events)
0%
1%
2%
3%
4%
5%
6%
7%
8%
9%
10%
2013-14 2014-15 2015-16 2016-17 2017-18 2018-19 2019-20
4-YEAR ROLLING AVERAGES INCLUDING HILP ADJUSTMENTFLEET
4 Yr Rolling Average EFOR(Excluding HILP Events)
4 Yr Rolling Average FOR(Excluding HILP Events)
4 Yr Rolling Average EPOR(Excluding HILP Events)

Australian Energy Market
Operator Limited, for publication
Ageing Coal-Fired Generation
Reliability
P1712-00-E-RP-0001
30 June 2020
P1712-00-E-RP-0001_0 Ageing Coal-Fired Generation Reliability (NEM) public draft.docx
© Copyright 2020 IN CONFIDENCE
17
4 Feedback from Station Representatives
Discussions were held with representatives of most of the coal fired power stations to ascertain:
• History of major events that impact station FOR
• Planned maintenance and capital investments that might impact future FOR and EPOR
• Expected planned maintenance regime
• Engineering provisions to allow more flexible operation
The Station personnel were asked a series of questions that also provided AEP Elical with details
of the maintenance programmes for each unit and the long term planned operating and
maintenance regimes.
AEP Elical has reviewed the discussions with station representatives to identify any specific
instances where redesign or significant refurbishment is occurring that should reduce the
incidence of outages from particular categories of cause. This is considered to occur at
approximately half of the stations. The categories where changes have been made are
summarised below at state and fleet level, weighted by station capacity as shown in the table
below. Note that the weighting change is applied to the historical weighting. While most of the
changes are small this is due to the collation at state or fleet level: individual stations may have
zero or larger changes.
TABLE 4-1: WEIGHTING CHANGES FROM 4-YEAR ROLLING AVERAGE
Site Initial Weighting Changes From 4-Year Rolling Average
Categories
1 3 4 5 7 9
Fuel supply Boiler Flue gas and
ash systems
Steam
turbine
Generator C&I
system
NSW -6% -15% 0% -6% 0% -6%
QLD 0% -5% -4% -1% 0% 0%
VIC 0% -5% -3% 0% -38% 0%
FLEET -3% -10% -2% -3% -7% -3%
4.1 International data comparison
The most comprehensive data for FOR of coal-fired (and other) generating plant is for North
American stations as reported in the North American Electric Reliability Corporation (NERC) 2019
State of Reliability document3. This notes that the 2018 weighted equivalent generation forced
3 www.nerc.com

Australian Energy Market
Operator Limited, for publication
Ageing Coal-Fired Generation
Reliability
P1712-00-E-RP-0001
30 June 2020
P1712-00-E-RP-0001_0 Ageing Coal-Fired Generation Reliability (NEM) public draft.docx
© Copyright 2020 IN CONFIDENCE
18
outage rate is above the five-year average for the second year in a row and has also increased
since 2016. It also reports that coal-fired plant shows a slight increasing trend.
While there is no mention of station capacity factors, AEP Elical notes that it is common
knowledge that coal fired generation has decreased in North America in recent years due to
the growth of generation from, in particular, unconventional gas.
NERC also reports data in its ‘Generating Data Statistical Brochure’ collected as part of the
Generating Availability Data System (GADS). The 2014-20218 statistical data report dated 30 July
2019 gives FOR and EFOR values for coal-fired plant for different ranges of capacity. The overall
FOR and EFOR plus weighted averages for plants between 300 to 800MW are shown in Table
4-2.
TABLE 4-2 COMPARISON OF NERC AND NEM OUTAGE RATES
FOR EFOR
All NERC coal-fired plants 7.22% 9.63%
NERC coal-fired plants between 300 and 800 MW 6.80% 9.15%
All NERC brown coal (lignite) plants 4.55% 8.5%
All NEM coal-fired plants 5.86% 8.78%
NSW stations 6.95% 11.00%
QLD stations 3.18% 5.25%
VIC brown coal stations 8.04% 10.04%
The above table indicates that the stations in the NEM are performing to a standard consistent
with the stations reported in the NERC document, albeit better in general for FOR across the
fleet. The brown coal stations in Victoria have a higher FOR than the NERC average, while the
Queensland coal-fired plants have a lower FOR than the overall and 300MW to 800MW capacity
NERC units.

Australian Energy Market
Operator Limited, for publication
Ageing Coal-Fired Generation
Reliability
P1712-00-E-RP-0001
30 June 2020
P1712-00-E-RP-0001_0 Ageing Coal-Fired Generation Reliability (NEM) public draft.docx
© Copyright 2020 IN CONFIDENCE
19
5 Approach to Forecasting FORs and EPORs to
End of Life
The approach taken by AEP Elical is to take the start point for each station and state derived in
Section 3.4 and to adjust this, as appropriate by the maintenance / capex weighting factors
derived through reviews of the stations. This gives an adjusted starting point for FY2020.
In this section we will describe how we:
• Derive generic growth factors for each of the categories of causes of forced and partial
outages and for the likelihood of major events,
• Determine likely increases in FOR and EPOR in the years leading to station closure, and
• Combine these growth and end of factors with the weighted categories of causes of
forced and partial outages.to produce station and state-wide forecasts.
5.1 Generic Growth Factors
Generic growth factors have been produced for two scenarios as specified by AEMO:
• Business as usual with most operation at high load but reductions to minimum load at
periods of low prices, ‘business as usual’ scenario; and
• A combination of high load operation with significant operation at minimum load and
30 to 40 weekend (or longer) outages each year, the ‘weekend outage’ scenario
Factors have been derived for each of the fourteen categories as described below.
5.1.1 Fuel supply system
The historical data shows very low full outage losses and significant partial losses due to fuel
supply issues. In coming years, several plants will be obtaining coal from alternative sources or
from mines that are moving into more difficult conditions and potentially experiencing more
interruptions or poorer quality. The resulting losses are not likely to be significantly different for
the business as usual and weekend shutdown scenarios. Accordingly, a generic growth factor
of 1% has been assumed for both scenarios.
5.1.2 Fuel system from feeders through to burners
The historical data shows very low full outage losses but significant partial losses due to fuel
system issues. With aging plant, it can be assumed that there will be some increase in losses due
to materials handling system failures and deterioration of milling, pulverised fuel transport and
burner components. The weekend shutdown scenario is likely to add to losses in this area due
to more frequent start-up of milling and associated plant and of oil burners. For business as usual,

Australian Energy Market
Operator Limited, for publication
Ageing Coal-Fired Generation
Reliability
P1712-00-E-RP-0001
30 June 2020
P1712-00-E-RP-0001_0 Ageing Coal-Fired Generation Reliability (NEM) public draft.docx
© Copyright 2020 IN CONFIDENCE
20
a growth factor of 0.5% has been assumed, while for the weekend shutdown scenario a growth
factor of 2% is considered more likely.
5.1.3 Boiler system including pressure parts and main steam system
Boiler system losses represent about half of all full outage losses and a significant proportion of
partial losses. Boiler pressure parts and furnace components are particularly affected by
temperature related life issues and erosion related failures. As plants age, it is reasonable to
expect that these failures will increase. A growth factor of 2% has been assumed for the business
as usual case. For the weekend shutdown scenario, the more frequent shutdown and restart
cycles with associated temperature changes are likely to increase the frequency of tube leaks
and, also, the more frequent cycling of dampers and valves will add to availability losses. A
growth factor of 4% has been assumed for this scenario.
5.1.4 Flue gas and ash systems
Flue gas and ash systems make a small, but significant contribution to full forced outage losses
and a substantial contribution to partial losses. As the plants age, these losses can be expected
to show small increases, estimated at 0.5% for the business as usual case. For the weekend
shutdown scenario, a growth factor of 2% has been assumed to account for increased activity
of valves and dampers and temperature variations and effects of fuel oil contamination and
below dewpoint operation during start-up.
5.1.5 Steam turbine
Steam turbine losses represent the second highest contribution to full outage losses and a smaller
contribution to partial losses (but with a reduced impact once HILP events are considered). It is
likely that aging of turbines and associated steam admission systems will show some increases in
availability losses. A growth factor of 0.5% has been assumed for the business as usual scenario
and a slightly higher value of 0.75% assumed for the weekend shutdown scenario due to some
increased life consumption of high temperature components.
5.1.6 Condenser and feed heating systems
Condenser and feed heating systems represent a small proportion of full outage losses and a
substantial proportion of partial losses. As the plants age these losses can be expected to show
some increases due to condenser tube leaks, feed heater tube leaks and related failures of
valves and pipework. For the business as usual scenario, a relative low growth factor of 0.5% has
been assumed. For the weekend shutdown scenario, a higher growth factor of 1.5% has been
assumed due to likely start-up and other issues with feedpumps.

Australian Energy Market
Operator Limited, for publication
Ageing Coal-Fired Generation
Reliability
P1712-00-E-RP-0001
30 June 2020
P1712-00-E-RP-0001_0 Ageing Coal-Fired Generation Reliability (NEM) public draft.docx
© Copyright 2020 IN CONFIDENCE
21
5.1.7 Generator
The historical data shows a significant contribution to full outages due to generator issues and
an insignificant contribution to partial losses. The full outages generally relate to unit trips due to
automatic voltage regulator faults or generator protection faults, some of which result from
generator internal defects. These losses are likely to continue at much the same rate and are
not likely to be significantly impacted by the weekend shutdown scenario. Accordingly, the
same growth factor of 0.2% has been assumed for both cases.
5.1.8 Transformers
Generator and unit transformers have contributed only low levels of both full and partial
availability losses. There is no reason to suspect that this pattern is likely to change as plants age,
given that generators have generally implemented sound systems of transformer maintenance
and monitoring. A low growth factor of 0.1% has been assumed for both business as usual and
weekend shutdown scenarios.
5.1.9 C&I systems
Control and instrumentation systems have made insignificant contributions to both full and
partial losses and it is expected that there will be only a small growth in these losses in future
years. A growth factor of 0.5% has been assumed for both business as usual and weekend
shutdown scenarios.
5.1.10 Auxiliary mechanical systems
Auxiliary mechanical systems have made only small contributions to both full and partial losses
and are not expected to show substantial increases as the plants age. A growth factor of 0.1%
has been assumed for the business as usual scenario and a slightly higher value of 0.2% for the
weekend shutdown scenario.
5.1.11 Auxiliary electrical systems
Auxiliary electrical systems have made only small contributions to both full and partial losses and
are not expected to show substantial increases as the plants age. A growth factor of 0.1% has
been assumed for the business as usual scenario and a slightly higher value of 0.2% for the
weekend shutdown scenario.
5.1.12 Human factors
Reported availability losses due to human error have been quite low and are not expected to
increase substantially. For the weekend shutdown scenario, some increase in human error losses
can be assumed due to increased operational activities during shutdown and start-up cycles.

Australian Energy Market
Operator Limited, for publication
Ageing Coal-Fired Generation
Reliability
P1712-00-E-RP-0001
30 June 2020
P1712-00-E-RP-0001_0 Ageing Coal-Fired Generation Reliability (NEM) public draft.docx
© Copyright 2020 IN CONFIDENCE
22
There is also likely to be increasing pressure on availability of experienced operating staff due to
aging workforces. A growth factor of 0.1% has been assumed for the business as usual case and
0.5% for the weekend shutdown case.
5.1.13 Environmental emissions
Losses due to environmental emission issues have been quite low. However, it is likely that
increasing environmental pressures are likely to cause some increasing losses in this area and
the weekend shutdown scenario could further add to losses during start-up of emission control
equipment. A growth factor of 1% has been assumed for the business as usual case and 2% for
the weekend shutdown case.
5.1.14 Other / unspecified
The other/unspecified category represents a substantial proportion of both full and partial losses.
While the lack of information makes a detailed analysis impossible, growth factors of 2% for the
business as usual scenario and 3% for the weekend shutdown scenario are considered
reasonable.
TABLE 5-1: GENERAL AGEING GROWTH PER ANNUM FOR EACH OUTAGE CAUSE
General Ageing Growth Per Annum for Each Outage Cause
Categories
1 2 3 4 5 6 7
Scenario Fuel supply Fuel system
(from supply
up
to burners)
Boiler Flue gas
and ash
systems
Steam
turbine
Condenser
and feed-
heating system
Generator
Business as
usual
1.00% 0.50% 2.00% 0.50% 0.50% 0.50% 0.20%
Weekend
shutdowns
1.00% 2.00% 4.00% 2.00% 0.75% 1.50% 0.20%

Australian Energy Market
Operator Limited, for publication
Ageing Coal-Fired Generation
Reliability
P1712-00-E-RP-0001
30 June 2020
P1712-00-E-RP-0001_0 Ageing Coal-Fired Generation Reliability (NEM) public draft.docx
© Copyright 2020 IN CONFIDENCE
23
TABLE 5-2: GENERAL AGEING GROWTH PER ANNUM FOR EACH OUTAGE CAUSE (CONT.)
General Ageing Growth Per Annum for Each Outage Cause
Categories
8 9 10 11 12 13 14
Scenario Transformers
(generator
and unit
transformers)
C&I
system
Auxiliary
mechanical
Auxiliary
electrical
Human
factors
Other /
unspecified
Environmental
emissions
Business as
usual
0.10% 0.50% 0.10% 0.10% 0.10% 2.00% 1.00%
Weekend
shutdowns
0.10% 0.50% 0.20% 0.20% 0.50% 3.00% 2.00%
5.2 HILP Events
HILP events are expected to continue to occur occasionally though the causes and locations
cannot be predicted, except in general terms. For all the stations in the fleet a small growth rate
of 0.5% has been assumed for business as usual with a slightly higher growth rate of 1% for the
weekend shutdown scenario due to the increased cycling of the plants.
5.3 End of Life Factors
As stations draw towards their end of life, i.e. 6 to 7 years prior to scheduled closure, the asset
management plans generally consider reduced investment in plant maintenance. Station
owners will provide sufficient investment in order to meet plant certification requirements and to
meet any performance obligations under Power Purchase Agreements or other contractual
arrangements. Investment in capital plant and equipment is unlikely and focus is on extending
the life of critical items, rather than replacement. This inevitably results in a managed reduction
to overall plant availability, with increases to both forced and partial outages.
Table 5-3 below shows AEP Elical’s opinion on the impact that aging plant and equipment,
coupled with the aforementioned reduction in CAPEX and OPEX has on FORs in the final years
of Station operation. The increases are cumulative and show an increasing rate of change as
end of life is approached.
TABLE 5-3: END OF LIFE GROWTH PER ANNUM
End of Life Growth Per Annum
Scenario 3 years in 2 years in 1 year in EOL
Business as Usual 0.25% 0.30% 0.40% 0.50%
Weekend Shutdowns 0.25% 0.30% 0.40% 0.50%

Australian Energy Market Operator Limited, for
publication
Ageing Coal-Fired Generation Reliability
P1712-00-E-RP-0001
30 June 2020
P1712-00-E-RP-0001_0 Ageing Coal-Fired Generation Reliability (NEM) public draft.docx
© Copyright 2020 IN CONFIDENCE
24
5.4 Summary Growth Factors for States and Fleet
The table below shows summary start points and initial category and HILP growth factors for the
states and the fleet noting that the consolidated category growth factors will change as plants
retire from service. The category growth factors are determined using the generic values
presented in Section 5.1 multiplied by the fractional weightings for each category on a station
by station basis as adjusted according to the factors in Table 4-1 and renormalised (i.e. if a
particular category weighting is changed all the categories are revised to maintain a total of
100%). The increase in FOR (and EPOR) is determined by applying the growth factor to the
adjusted FOR (or EPOR) on an annual basis. Similarly the growth in HILP related FOR is determined
by applying the HILP growth factor given in Section 5.2 to the state (or fleet) HILP FOR. In
addition, when determining the overall FOR, EPOR etc the end of life factors given in Table 5-3
are applied to all stations.
TABLE 5-4: SUMMARY OF START POINTS AND GROWTH FACTORS
Site FOR
(FY20)
Adjusted FOR for
FY21, prior to
application of
growth factors
Category Growth Factor Per Annum State HILP FOR
Business As Usual Weekend Shutdowns
Fleet 4.70% 4.37% 1.41% 2.88% 1.16%
VIC 5.58% 5.18% 1.47% 2.95% 2.46%
NSW 5.76% 5.23% 1.50% 3.05% 1.18%
QLD 2.83% 2.71% 1.25% 2.62% 0.35%

Australian Energy Market
Operator Limited, for publication
Ageing Coal-Fired Generation
Reliability
P1712-00-E-RP-0001
30 June 2020
P1712-00-E-RP-0001_0 Ageing Coal-Fired Generation Reliability (NEM) public draft.docx
© Copyright 2020 IN CONFIDENCE
25
5.5 Predicted FOR by State and Fleet
The resulting FORs etc for the states, the fleet and the individual stations are given in the following
figures.
FIGURE 5-1: STATE AND FLEET FORCED OUTAGE RATES
0%
2%
4%
6%
8%
10%
12%
STATE AND FLEETFORCED OUTAGE RATES
FOR (Historical Rolling 4-Year Average)-VICFOR (WeekendShutdowns)-VICFOR (Business as Usual)-VICFOR (Historical Rolling 4-Year Average)-NSWFOR (WeekendShutdowns)-NSWFOR (Business as Usual)-NSWFOR (Historical Rolling 4-Year Average)-FleetFOR (WeekendShutdowns)-FleetFOR (Business as Usual)-FleetFOR (Historical Rolling 4-Year Average)-QLDFOR (WeekendShutdowns)-QLDFOR (Business as Usual)-QLD

Australian Energy Market Operator Limited, for
publication
Ageing Coal-Fired Generation Reliability
P1712-00-E-RP-0001
30 June 2020
P1712-00-E-RP-0001_0 Ageing Coal-Fired Generation Reliability (NEM) public draft.docx
© Copyright 2020 IN CONFIDENCE
26
5.6 Predicted FOR, EPOR and EFOR for States and Fleet
FIGURE 5-2: NSW FORCED OUTAGE RATES FIGURE 5-3: QLD FORCED OUTAGE RATES
0%
2%
4%
6%
8%
10%
12%
14%
NSW POWER STATIONS FORCED OUTAGE RATES
EFOR (HistoricalRolling 4-YearAverage)EFOR (WeekendShutdowns)
EFOR (Business asUsual)
FOR (HistoricalRolling 4-YearAverage)FOR (WeekendShutdowns)
FOR (Business asUsual)
EPOR (HistoricalRolling 4-YearAverage)EPOR (WeekendShutdowns)
EPOR (Business asUsual)
0%
2%
4%
6%
8%
10%
12%
14%
QLD POWER STATIONSFORCED OUTAGE RATES
EFOR (HistoricalRolling 4-YearAverage)EFOR (WeekendShutdowns)
EFOR (Business AsUsual)
FOR (HistoricalRolling 4-YearAverage)FOR (WeekendShutdowns)
FOR (Business AsUsual)
EPOR (HistoricalRolling 4-YearAverage)EPOR (WeekendShutdowns)
EPOR (Business AsUsual)

Australian Energy Market Operator Limited, for
publication
Ageing Coal-Fired Generation Reliability
P1712-00-E-RP-0001
30 June 2020
P1712-00-E-RP-0001_0 Ageing Coal-Fired Generation Reliability (NEM) public draft.docx
© Copyright 2020 IN CONFIDENCE
27
FIGURE 5-4: VIC FORCED OUTAGE RATES FIGURE 5-5: FLEET FORCED OUTAGE RATES
0%
2%
4%
6%
8%
10%
12%
14%
VIC POWER STATIONSFORCED OUTAGE RATES
EFOR (HistoricalRolling 4-YearAverage)EFOR (WeekendShutdowns)
EFOR (BusinessAs Usual)
FOR (HistoricalRolling 4-YearAverage)FOR (WeekendShutdowns)
FOR (Business AsUsual)
EPOR (HistoricalRolling 4-YearAverage)EPOR (WeekendShutdowns)
EPOR (BusinessAs Usual)
0%
2%
4%
6%
8%
10%
12%
14%
FLEET FORCED OUTAGE RATESEFOR (HistoricalRolling 4-YearAverage)EFOR (WeekendShutdown)
EFOR (Business AsUsual)
FOR (HistoricalRolling 4-YearAverage)FOR (WeekendShutdown)
FOR (Business AsUsual)
EPOR (HistoricalRolling 4-YearAverage)EPOR (WeekendShutdown)
EPOR (Business AsUsual)

Australian Energy Market
Operator Limited, for publication
Ageing Coal-Fired Generation
Reliability
P1712-00-E-RP-0001
30 June 2020
P1712-00-E-RP-0001_0 Ageing Coal-Fired Generation Reliability (NEM) public draft.docx
© Copyright 2020 IN CONFIDENCE
28
6 Feedback from Forecasting Reference Group
The approach described above, and the preliminary results were presented to the AEMO
Forecasting Reference Group on 10 June 2020. A copy of the AEP Elical presentation is shown
Appendix A.4
Following the presentation there was a general discussion which is summarised in the minutes of
the meeting. Key points raised included the observation that the higher FOR predicted in the
weekend shutdown scenario might be mitigated by opportunistic maintenance during the
shutdowns and that the more operation at lower loads might reduce the rate of damage to
some pressure tubing thereby leading to less outages due to tube leaks. AEP Elical considers
these valid observations but notes the lack of data to help quantify the factors.
4 At the time of the presentation one HILP event was not identified. The presentation has been
updated to include this. It does not impact the results to any significant extent.

Australian Energy Market
Operator Limited, for publication
Ageing Coal-Fired Generation
Reliability
P1712-00-E-RP-0001
30 June 2020
P1712-00-E-RP-0001_0 Ageing Coal-Fired Generation Reliability (NEM) public draft.docx
© Copyright 2020 IN CONFIDENCE
29
7 Conclusions
AEP Elical has used data provided by AEMO and the information provided by representatives
of most of the power stations to derive weightings for causes of full and partial outages /
deratings. It has derived underlying rates by considering high impact low probability outages
as a separate category and applied this HILP category on a state-wide or fleet basis to the 4-
year rolling averages of the underlying rates.
For each category of cause a best estimate growth factor has been derived based on
engineering knowledge of the cause and the plant. These category growth factors have been
multiplied by the category fraction to get overall category growth factors for each station. The
station outage rates are then consolidated into state and fleet values.
End of life factors have been derived based on the expectation of reduced expenditure on the
stations in the last few years of operation. These are additional to the growth factors and cause
an increase in outage rate growth in the last few years of each station’s life.
The resulting predictions are considered a potential alternative approach to using historical data
alone to predict future outage rates.

Australian Energy Market
Operator Limited, for publication
Ageing Coal-Fired Generation
Reliability
P1712-00-E-RP-0001
30 June 2020
P1712-00-E-RP-0001_0 Ageing Coal-Fired Generation Reliability (NEM) public draft.docx
© Copyright 2020 IN CONFIDENCE
30
Appendix A: AEP Elical Presentation to the
Forecasting Reference Group
Copy of presentation made to Forecasting Reference Group on 10 June 2020.

Client-In-Confidence
COAL FIRED GENERATION RELIABILITY AND FORCED OUTAGE RATES IN THE NEM
1

Client-In-Confidence
THE ASSIGNMENT
2
o Provide forward looking reliability projections for the coalfired generators in the NEM:
• Planned outage (maintenance rates)
• Full forced outage rates, plus partial forced outage rates(hours) and average partial derating or partial forcedoutage rates assuming derating does not change
• Effective forced outage rates (sum of above)
o Determine these on a station by station basis but summariseat a state and fleet level

Client-In-Confidence
INPUTS
3
o AEMO provided data:
• Forced and partial outage summaries by unit from FY2011onwards
• Calculated station factors for FOR, EPOR etc
• Lists of forced and partial outages with summary descriptions from FY2016 onwards
o Generator provided data:
• Teleconferences with representatives of most stations to discuss history and plans etc.

Client-In-Confidence
APPROACH
4
o Review reasons for outages and categorise these into 14
categories (examples of category splits are on next slide).
o Identify major events (low probability, high impact events)
from FY2016 onwards and separate these from other outage
events to get underlying rates.
o Reallocate the major events to stations on a flat, state-wide
basis. The assumption being major events could occur at
any station and that state-wide markets and capacities are
key.
o Establish 4-year rolling average values for FOR and EPOR by
station and state – the starting point for our projections. 4
years selected to reflect typical maintenance cycles.

Client-In-Confidence
CATEGORIES AND MAJOR EVENTS
5
3-Boiler
4-Flue gas and ash systems
5-Steam Turbine
6-Condenser and
feedheating system
7-Generator
13-Other / unspecified
BREAKDOWN OF FULL OUTAGES EXCLUDING MAJOR EVENTS
1-Fuel supply
2-Fuel system (from supply up
to burners)
3-Boiler
4-Flue gas and ash systems
5-Steam Turbine
6-Condenser and feedheating
system
13-Other / unspecified
BREAKDOWN OF PARTIAL OUTAGES
IMPACT OF MAJOR EVENTS (2016 – 2020)
Region FOR
Fleet 1.16%
NSW 1.18%
QLD 0.35%
VIC 2.46%

Client-In-Confidence
FORECASTING METHODOLOGY
6
o AEPE experience over many years and geographies employed to determine how different
categories of causes (and the frequency of major events) may change over time assuming ‘business
as usual’ and frequent low load operation with 30 to 40 weekend outages per year – the ‘growth
factors’
General ageing growth pa for each outage causeCategories
1 2 3 4 5 6 7
Scenario Fuel supply
Fuel system (from
supply up to
burners)
BoilerFlue gas and ash
systemsSteam turbine
Condenser and
feedheating
system
Generator
Business as usual 1.00% 0.50% 2.00% 0.50% 0.50% 0.50% 0.20%
Weekend
shutdowns 1.00% 2.00% 4.00% 2.00% 0.75% 1.50% 0.20%
General ageing growth pa for each outage causeCategories
8 9 10 11 12 13 14
Scenario
Transformers
(generator and
unit
transformers)
C&I systemAuxiliary
mechanical
Auxiliary
electricalHuman factors Other / unspecified
Environmental
emissionsMajor events
Business as usual 0.10% 0.50% 0.10% 0.10% 0.10% 2.00% 1.00% 0.50%
Weekend
shutdowns 0.10% 0.50% 0.20% 0.20% 0.50% 3.00% 2.00% 1.00%
Client-In-Confidence
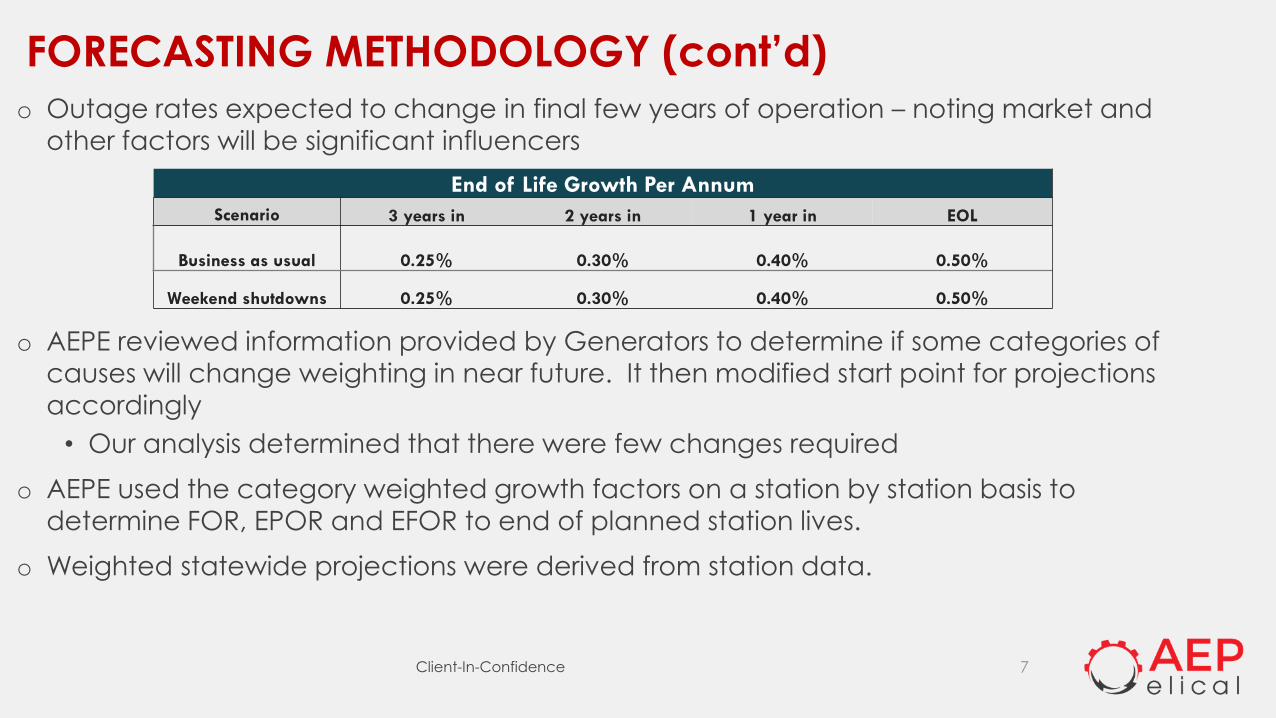
FORECASTING METHODOLOGY (cont’d)
7
o Outage rates expected to change in final few years of operation – noting market and
other factors will be significant influencers
o AEPE reviewed information provided by Generators to determine if some categories of
causes will change weighting in near future. It then modified start point for projections accordingly
• Our analysis determined that there were few changes required
o AEPE used the category weighted growth factors on a station by station basis to
determine FOR, EPOR and EFOR to end of planned station lives.
o Weighted statewide projections were derived from station data.
End of Life Growth Per Annum
Scenario 3 years in 2 years in 1 year in EOL
Business as usual 0.25% 0.30% 0.40% 0.50%
Weekend shutdowns 0.25% 0.30% 0.40% 0.50%

Client-In-Confidence
SUMMARY PROJECTIONS
8
0%
2%
4%
6%
8%
10%
12%
NSW POWER STATIONS
FORCED OUTAGE RATES
FOR (Historical
Rolling 4-Year
Average)
FOR (Weekend
Shutdowns)
FOR (Business as
Usual)

Client-In-Confidence
SUMMARY PROJECTIONS
9
0%
2%
4%
6%
8%
10%
12%
QLD POWER STATIONS
FORCED OUTAGE RATES
FOR (Historical
Rolling 4-Year
Average)
FOR (Weekend
Shutdowns)
FOR (Business
As Usual)

Client-In-Confidence
SUMMARY PROJECTIONS
10
0%
2%
4%
6%
8%
10%
12%
VIC POWER STATIONS
FORCED OUTAGE RATES
FOR (Historical
Rolling 4-Year
Average)FOR (Weekend
Shutdowns)
FOR (Business
As Usual)

Client-In-Confidence
SUMMARY PROJECTIONS
11
0%
2%
4%
6%
8%
10%
12%
FORCED OUTAGE RATES OF FLEET
FOR (Historical
Rolling 4-Year
Average)
FOR (Weekend
Shutdowns)
FOR (Business
As Usual)

Client-In-Confidence
SUMMARY PROJECTIONS
12
0%
2%
4%
6%
8%
10%
12%
VIC POWER STATIONS
FORCED OUTAGE RATES
0%
2%
4%
6%
8%
10%
12%
NSW POWER STATIONS
FORCED OUTAGE RATES
0%
2%
4%
6%
8%
10%
12%
QLD POWER STATIONS
FORCED OUTAGE RATES
0%
2%
4%
6%
8%
10%
12%
FORCED OUTAGE RATES OF FLEET
FOR
(Historical
Rolling 4-Year
Average)
FOR
(Weekend
Shutdowns)
FOR (Business
As Usual)

Client-In-Confidence
PROJECTIONS
13
0%
2%
4%
6%
8%
10%
12%
14%
FLEET FORCED OUTAGE RATESEFOR (Historical
Rolling 4-Year
Average)EFOR (Weekend
Shutdown)
EFOR (Business As
Usual)
FOR (Historical
Rolling 4-Year
Average)FOR (Weekend
Shutdown)
FOR (Business As
Usual)
EPOR (Historical
Rolling 4-Year
Average)EPOR (Weekend
Shutdown)
EPOR (Business As
Usual)

THANK YOU

Client-In-Confidence
APPENDIX
15
0%
2%
4%
6%
8%
10%
12%
14%
NSW POWER STATIONS
FORCED OUTAGE RATES
EFOR (Historical Rolling
4-Year Average)
EFOR (Weekend
Shutdowns)
EFOR (Business as
Usual)
FOR (Historical Rolling
4-Year Average)
FOR (Weekend
Shutdowns)
FOR (Business as
Usual)
EPOR (Historical Rolling
4-Year Average)
EPOR (Weekend
Shutdowns)
EPOR (Business as
Usual)

Client-In-Confidence
APPENDIX
16
0%
2%
4%
6%
8%
10%
12%
14%
QLD POWER STATIONS
FORCED OUTAGE RATES
EFOR (Historical
Rolling 4-Year
Average)EFOR (Weekend
Shutdowns)
EFOR (Business As
Usual)
FOR (Historical
Rolling 4-Year
Average)FOR (Weekend
Shutdowns)
FOR (Business As
Usual)
EPOR (Historical
Rolling 4-Year
Average)EPOR (Weekend
Shutdowns)
EPOR (Business As
Usual)

Client-In-Confidence
APPENDIX
17
0%
2%
4%
6%
8%
10%
12%
14%
VIC POWER STATIONS
FORCED OUTAGE RATES
EFOR (Historical Rolling
4-Year Average)
EFOR (Weekend
Shutdowns)
EFOR (Business As
Usual)
FOR (Historical Rolling
4-Year Average)
FOR (Weekend
Shutdowns)
FOR (Business As Usual)
EPOR (Historical Rolling
4-Year Average)
EPOR (Weekend
Shutdowns)
EPOR (Business As
Usual)

Australian Energy Market
Operator Limited, for publication
Ageing Coal-Fired Generation
Reliability
P1712-00-E-RP-0001
30 June 2020
P1712-00-E-RP-0001_0 Ageing Coal-Fired Generation Reliability (NEM) public draft.docx
© Copyright 2020 IN CONFIDENCE
31
Document Control
Revision Date
Issued
Author Approved
by
Status Comments
0 18 June
2020
BEE, TJ, MG,
GH, SS
B Eagers Issued to Client
1 30 June
2020
BEE, TJ, MG,
GH, SS
B Eagers Issued to Client
Reference Type: Report
Author (Company): AEP Elical
Title: Ageing Coal-Fired Generation Reliability
Year: 2020
Date: 30/06/2020
Document No: P1712-00-E-RP-0001
Client: Australian Energy Market Operator Limited, for publication
Site Location: Brisbane
Project No: P1712
Filename: P1712-00-E-RP-0001_0 Ageing Coal-Fired Generation Reliability (NEM)
public draft.docx