Temperaments, MTEMPERAMENTS, MOODS & EMOTIONS.oods & Emotions

A"en%on-deficit/hyperac%vitydisorder
(ADHD)
“Hewholovesprac%cewithouttheoryislikethesailorwhoboardsshipwithoutarudderandcompassandneverknowswherehemaycast”LeonardodaVinci(1452-1519)
Outline:q HistoryandBackgroundInforma%onq DSM-5ClinicalModelofADHD–basicassump%onsq Ini%alformula%onofthefunc%onalWMmodelofADHDq Baddeley’sWMmodelasanexperimentalparadigmq WMcomponentsimplicatedascoredeficitsinADHDq Hyperac%vityandIna"en%onassecondaryfeaturesofADHD

493 BC v Hippocrates described patients with "quickened responses to sensory experience,
but also less tenaciousness because the soul moves on quickly to the next impression".
v Condition attributed to an "overbalance of fire over water”. v Remedy: "barley rather than wheat bread, fish rather than meat, water drinks, and
many natural and diverse physical activities."
Circa 1600 v Shakespeare referred to a “malady of attention” in one of his characters in King
Henry VIII. Mid 1800s
v Heinrich Hoffman, a German physician, penned the poem “Fidgety Phil”. v Figety Phil
1890 v William James, in his Principles of Psychology text (1890), described a normal
variant of character which he called the “Explosive Will”: v “… impulses seem to discharge so promptly onto movements that inhibitions get
no time to arise. These are the ‘dare-devil’ and ‘mercurial temperaments, overflowing with animation, and fizzling with talk” (p.800).
Pre-twentieth Century

1902 English physician George Still (1902) reported on a group of children in his clinical practice whom he defined as having a deficit in “volitional inhibition” or a “defect in moral control” over their behavior.
v Their behavior was described as aggressive, passionate, lawless, inattentive, impulsive, and overactive.
v An over-representation of male subjects (3:1). v An aggregation of alcoholism, criminal conduct,
and depression among the biological relatives. v A familial predisposition to the disorder –
hereditary.
Twentieth Century

Minimal Brain Damage/Dysfunction
Interest in children with similar characteristics arose in North America around the time of the encephalitis epidemic of 1917-1918. v Children surviving these brain infections were
noted to have many behavioral problems similar to ADHD.
v These cases and others known to have arisen from birth trauma, head injury, toxin exposure, and infections gave rise to the concept of a brain-injured child syndrome (Strauus & Lehtinen, 1947).

v The brain-injured child syndrome eventually was applied to children manifesting these same behavior features but without evidence of brain damage or retardation.
v This concept would later evolve into the concept ‘minimal brain damage’, and eventually ‘minimal brain dysfunction’ (MBD), owing to the dearth of evidence of brain injury in most cases (Dolphin & Cruickshank, 1951; Strauus & Kephardt, 1955).
Minimal Brain Damage/ Dysfunction

Hyperkinetic _____________
v During the 1950’s, greater attention was paid to the specific behaviors of hyperactivity and impulsivity resulting in the label “hyperkinetic impulse disorder.” The disorder was attributed to poor thalamic filtering of stimuli entering the brain (Laufer, Denhoff, & Solomons, 1957) and eventually termed the “hyperactive child syndrome” (Chess, 1960).
v The influence of psychoanalytic thought at the time held sway when the DSM-II appeared and all childhood disorders were described as “reactions” – the hyperactive child syndrome became “hyperkinetic reaction of childhood” (DSM-II, 1968).

Hyperkinetic Reaction of Childhood DSM-II (1968)
Characterized by overactivity, restlessness, distractibility and short attention span, especially in young children; the behavior usually diminishes in adolescence. v Definition included problems of attention and
distractibility along with those of hyperactivity/ restlessness.
v The condition was assumed to be developmentally benign and not caused by brain damage - resulting in a departure from European thinking.

Attention
By the 1970s, research emphasizing the importance of problems with sustained attention and impulse control in addition to hyperactivity was emphasized (Douglas, 1972).
Douglas (1980; 1983) theorized that the disorder was comprised of four major deficits: v The investment, organization, and maintenance of attention and effort. v The ability to inhibit impulsive behavior. v The ability to modulate arousal levels to meet situational demands. v An unusually strong inclination to seek immediate reinforcement.

Douglas’s work coupled with numerous studies of attention, impulsiveness, and other cognitive sequelae resulted in the DSM-III (1980) moniker, Attention Deficit Disorder (ADD). v Psychoanalytic perspective discarded. v Cognitive-developmental nature emphasized. v Symptom lists, cutoff scores recommended. v Polythetic categorization scheme (3 major symptom
groupings required for a diagnosis). v Distinction between “with” and “without” hyperactivity.

Attention-Deficit/Hyperactivity Disorder (DSM-III-R; 1987)
Hyperactivity and impulsivity Needed to:
v Differentiate the disorder from other conditions, and v Predict developmental risks (Weiss & Hechtman, 1993).
Monothetic categorization scheme (14 symptoms - 1 list) ADD without hyperactivity replaced with undifferentiated Attention Deficit Disorder based on insufficient research.

Attention-Deficit/Hyperactivity Disorder (DSM-IV, 1994)
Three (3) subtypes of ADHD (predominantly inattention; predominantly hyperactivity-impulsive; and combine type).
v Hyperactivity-Impulsive Type appears to be a developmental
precursor to the combined type. v Hyperactive-Impulsive Type was comprised primarily of preschool
children (DSM-IV field trials). v Combined Type and Inattentive Type were comprised primarily of
school-age children. The Hyperactive-Impulsive behavior pattern seems to emerge first in
development during the preschool years, whereas symptoms of “inattention” associated with it appear to have their onset several years later (Loeber et al., 1992; Hart et al., 1995).
Attention-Deficit/Hyperactivity Disorder (DSM-IV, 1994)
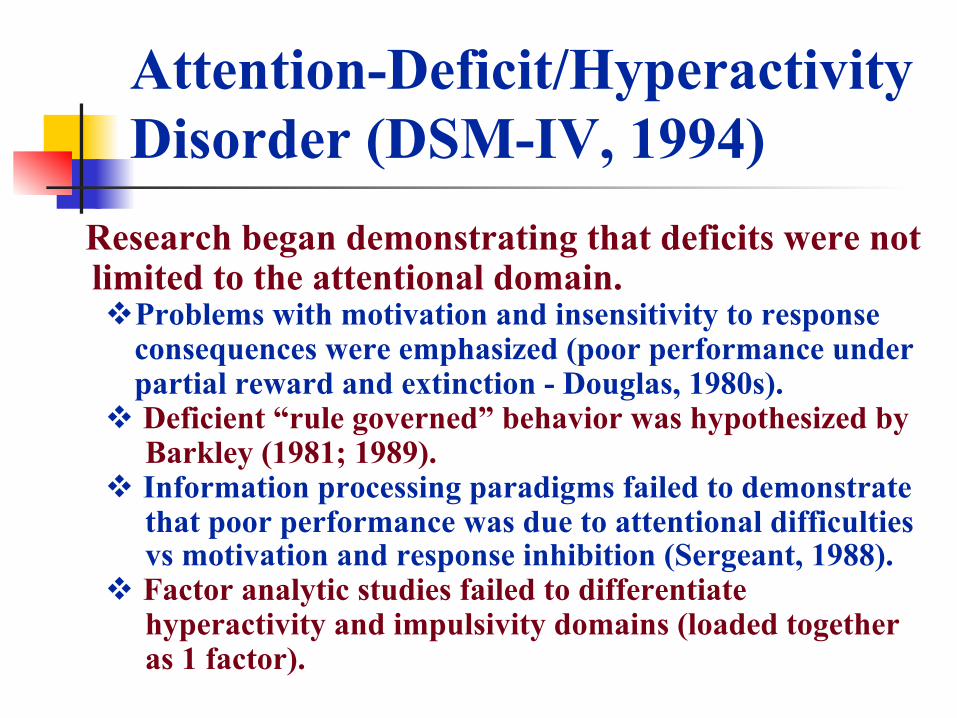
Research began demonstrating that deficits were not limited to the attentional domain. v Problems with motivation and insensitivity to response
consequences were emphasized (poor performance under partial reward and extinction - Douglas, 1980s).
v Deficient “rule governed” behavior was hypothesized by Barkley (1981; 1989). v Information processing paradigms failed to demonstrate that poor performance was due to attentional difficulties vs motivation and response inhibition (Sergeant, 1988). v Factor analytic studies failed to differentiate hyperactivity and impulsivity domains (loaded together as 1 factor).

Nomenclature
Attention-Deficit/Hyperactivity Disorder (DSM-III-R, DSM-IV, DSM-IV-TR, DSM-5: classified as a neurodevelopmental disorder)
1987
Attention Deficit Disorder (DSM-III) 1980
Hyperkinetic Reaction of Childhood (DSM-II) 1968
Hyperactive Child Syndrome (Chess) 1960
Hyperkinetic Impulse Disorder (Laufer, Denhoff, & Solomons) 1950s
Minimal Brain Dysfunction (Strauus & Kephardt)
Minimal Brain Damage (Dolphin & Cruikshank) 1940s
Brain Injured Child Syndrome (Strauus & Lehtinen) c. 1918
Volitional Inhibition
Deficit in Moral Control (Still)
1902
Explosive Will (James) 1890
Overbalance of fire over water (Hippocrates) 493 BC

Evolution of the DSM
Polythetic Categorization [multiple lists]
Polythetic Categorization [multiple lists]
Monothetic Categorization [single list]

Attention-Deficit/Hyperactivity Disorder (DSM-IV, 1994) continued
v Types of problems with “inattention” seen in the Inattentive Type appear to have their onset even later than those associated with hyperactive-impulsive behavior (Barkley, 1996).
v Implications: v Attentional impairment associated with the Predominantly
Inattentive Type may be different from those seen in the other two types.
v Inattentive Type symptoms: daydreaming, spacing out, in a fog, easily confused, staring frequently, lethargic, hypoactive, and passive. [DAMP: developmentally delayed attention, motor and perceptual abilities]
v Inattentive Type also appears to have deficits in speed of information processing & focused or selective attention (Goodyear & Hynd, 1992; Lahey & Carlson, 1992).
v Combined Type deficits are characterized as consisting of sustained attention (persistence) and distractibility difficulties.

Attention-Deficit/Hyperactivity Disorder (DSM-IV, 1994) continued
v Implications (Continued): v Current clinical view of ADHD may be clustering two
qualitatively different disorders into a single set of disorder.
v Children with ADHD Combined Type who move into the Inattentive Type (owing to developmental reduction in hyperactivity) as they get older are not actually changing types of ADHD; Their attentional problems should still be distinct (poor persistence, distractibility) from those seen in the Inattentive Type.

DSM-5 Criteria: 6 of 9 Inattention Symptoms
◆ fails to give close attention to details
◆ difficulty sustaining attention
◆ does not seem to listen
◆ does not follow through on instructions
◆ difficulty organizing tasks or activities
◆ avoids tasks requiring sustained mental effort
◆ loses things necessary for tasks
◆ easily distracted
◆ forgetful in daily activities

DSM-5 Criteria: 6 of 9 Hyperactive-Impulsive
◆ fidgets with hands or feet or squirms in seat
◆ leaves seat in classroom inappropriately
◆ runs about or climbs excessively
◆ has difficulty playing quietly
◆ is “on the go” or “driven by a motor”
◆ talks excessively
◆ blurts out answers before questions are completed
◆ has difficulty awaiting turn
◆ interrupts or intrudes on others

Other DSM-5 Criteria
n Developmentally Inappropriate Levels n Duration of 6 Months n Cross-setting Occurrence of Symptoms n Impairment in Major Life Activities n Onset of Symptoms/Impairment by 7 n Exclusions: Severe MR, Psychosis n Subtyping into Inattentive, Hyperactive, or
Combined Types

Unresolved Problems with DSM-5 Criteria
n Symptoms are not developmentally scaled n Need more appropriate items for adults
n Cutoffs are not developmentally referenced n May have to adjust thresholds if > 16 or < 4 yrs.
n Cutoffs not sex-referenced (lower for girls) n Duration may be too short for preschoolers
n Consider adjusting upward to 1 year
n Age of onset of 7 has no validity (childhood) n Developmental deviance undefined (93%??) n Implies need for parent-teacher agreement
n Blend reports and use history of cross setting impairment
n No requirement for corroboration by others (adults)

ADHD - Inattentive Type
n Daydreaming/Spacey/Stares n Slow Information Processing n Hypoactive/Lethargic/Sluggish n Easily Confused, Mentally “Foggy” n Poor Focused/Selective Attention n Erratic Retrieval - Long-Term Memory n Socially Reticent/Uninvolved

ADHD Inattentive Type (2)
n Rarely Aggressive or ODD/CD n Not Impulsive (By Definition) n Less Likely to Have a Clinically
Impressive Response to Stimulants (65% improve but only 20% show clinical response)
n Possibly Greater Family History of Anxiety Disorders and LD (?)

Inattentive Type is a New Disorder n Focus on sluggish cognitive tempo n Will not have same course and risks n Probably requires different interventions n Need to distinguish it from:
n Sub-threshold Combined Type n Central Auditory Processing Disorder n Situational Stress Events or PTSD n Schizophrenic Spectrum Disorders n Learning Disabilities n Anxiety Disorders or Depression n Substance Use/Abuse Disorder

Beck et al. (2016) Sluggish Cognitive Tempo
n Sluggish
n Tired/lethargic
n Slow thinking/processing cognitive set
n Sleepy/drowsy
n Spacey
n In a fog
n Underactive/slow moving
n Daydreams
n Lost in thoughts
n Stares blankly
n Easily confused
n Apathetic / unmotivated
n Easily bored
[items with high factor loadings]

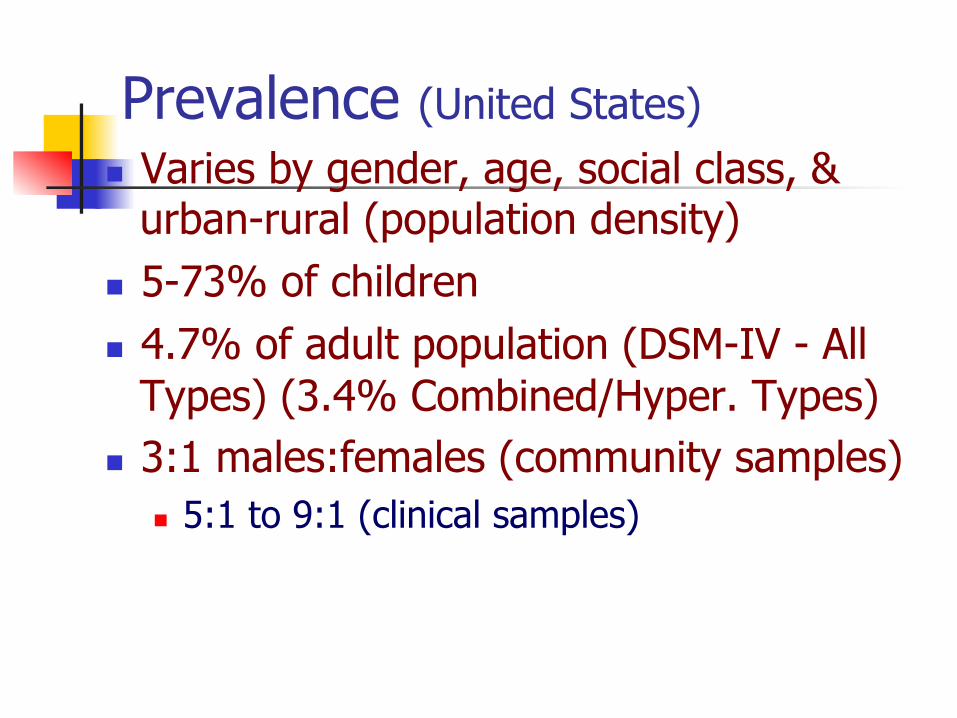
Prevalence (United States)
n Varies by gender, age, social class, & urban-rural (population density)
n 5-73% of children n 4.7% of adult population (DSM-IV - All
Types) (3.4% Combined/Hyper. Types) n 3:1 males:females (community samples)
n 5:1 to 9:1 (clinical samples)

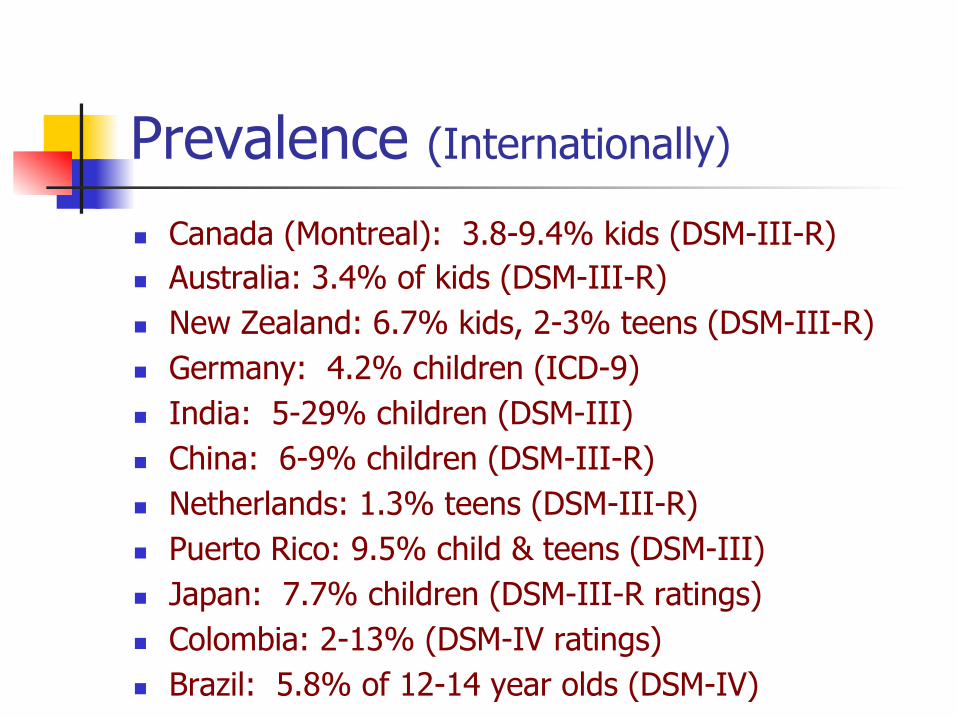
Prevalence (Internationally) n Canada (Montreal): 3.8-9.4% kids (DSM-III-R) n Australia: 3.4% of kids (DSM-III-R) n New Zealand: 6.7% kids, 2-3% teens (DSM-III-R) n Germany: 4.2% children (ICD-9) n India: 5-29% children (DSM-III) n China: 6-9% children (DSM-III-R) n Netherlands: 1.3% teens (DSM-III-R) n Puerto Rico: 9.5% child & teens (DSM-III) n Japan: 7.7% children (DSM-III-R ratings) n Colombia: 2-13% (DSM-IV ratings) n Brazil: 5.8% of 12-14 year olds (DSM-IV)
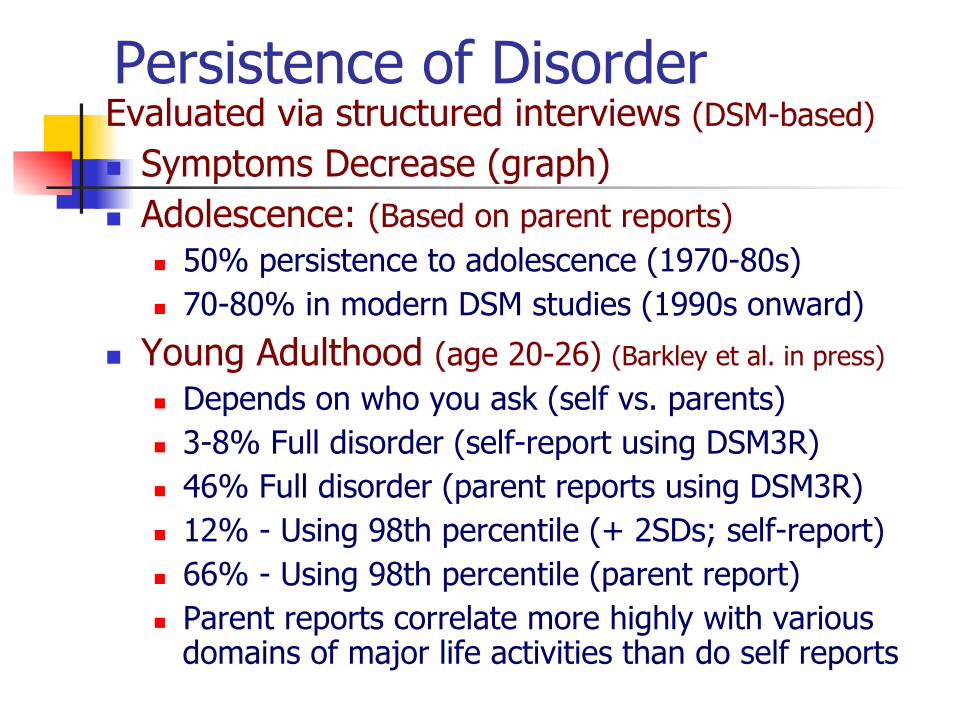
Persistence of Disorder Evaluated via structured interviews (DSM-based)
n Symptoms Decrease (graph) n Adolescence: (Based on parent reports)
n 50% persistence to adolescence (1970-80s) n 70-80% in modern DSM studies (1990s onward)
n Young Adulthood (age 20-26) (Barkley et al. in press)
n Depends on who you ask (self vs. parents) n 3-8% Full disorder (self-report using DSM3R) n 46% Full disorder (parent reports using DSM3R) n 12% - Using 98th percentile (+ 2SDs; self-report) n 66% - Using 98th percentile (parent report) n Parent reports correlate more highly with various
domains of major life activities than do self reports

Beck et al. (2016) Sluggish Cognitive Tempo
n Sluggish
n Tired/lethargic
n Slow thinking/processing cognitive set
n Sleepy/drowsy
n Spacey
n In a fog
n Underactive/slow moving
n Daydreams
n Lost in thoughts
n Stares blankly
n Easily confused
n Apathetic / unmotivated
n Easily bored
[items with high factor loadings]
Prevalence (United States) n Varies by gender, age, social class, &
urban-rural (population density) n 5-73% of children n 4.7% of adult population (DSM-IV - All
Types) (3.4% Combined/Hyper. Types) n 3:1 males:females (community samples)
n 5:1 to 9:1 (clinical samples)
Prevalence (Internationally) n Canada (Montreal): 3.8-9.4% kids (DSM-III-R) n Australia: 3.4% of kids (DSM-III-R) n New Zealand: 6.7% kids, 2-3% teens (DSM-III-R) n Germany: 4.2% children (ICD-9) n India: 5-29% children (DSM-III) n China: 6-9% children (DSM-III-R) n Netherlands: 1.3% teens (DSM-III-R) n Puerto Rico: 9.5% child & teens (DSM-III) n Japan: 7.7% children (DSM-III-R ratings) n Colombia: 2-13% (DSM-IV ratings) n Brazil: 5.8% of 12-14 year olds (DSM-IV)

Etiologies - Heredity/Genetics
n Family Aggregation of Disorder: - 25-35% of siblings - 55-92% of identical twins - 15-20% of mothers - 25-30% of fathers - If parent is ADHD, 20-54% of offspring
n Twin Studies of Heritability: - Heritability = 57-97% (Mean 80%+; 95%+ if DSM) - Shared Environment = 0-6% (Not significant) - Unique Environment = 15-20%
n Molecular Genetics (DRD4, DAT1, DBH?)

Etiologies: Food Allergies & Miscellaneous Factors
n Sugar (Disproven) n Hyper/hypoglycemia (No evidence) n Food Allergies (Largely Disproven)
n Possibly 5% of ADHD Preschoolers react adversely to high doses of food additives
n Side Effects of Anticonvulsants (10-35%) n mainly to phenobarbital and dilantin
n Thyroid abnormalities (unlikely) n Rare in children n Evidence is conflicting

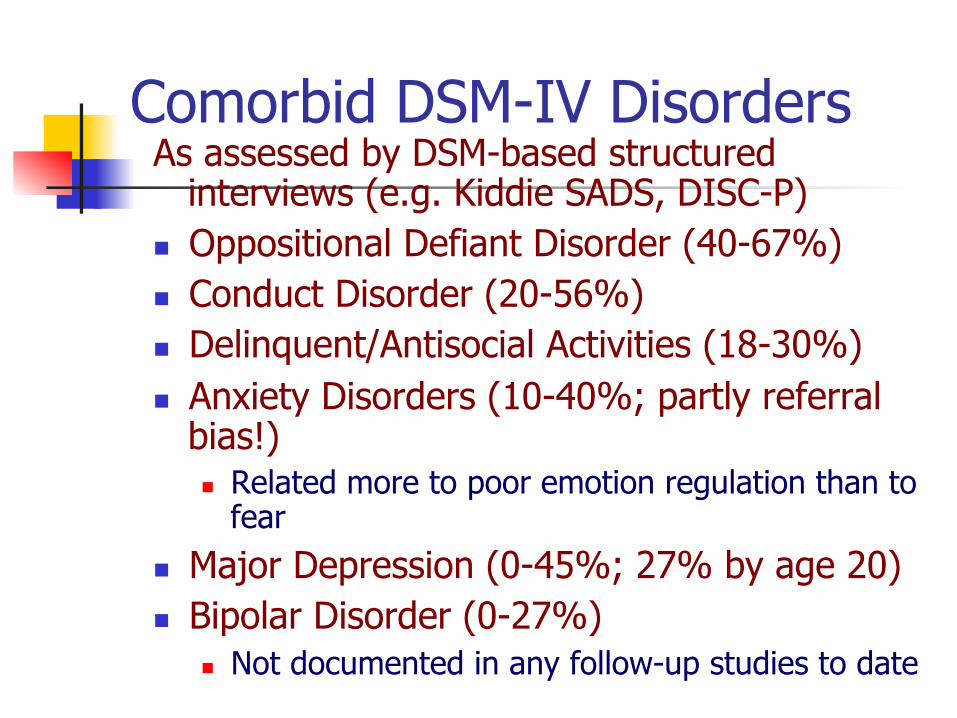
Comorbid DSM-IV Disorders As assessed by DSM-based structured
interviews (e.g. Kiddie SADS, DISC-P) n Oppositional Defiant Disorder (40-67%) n Conduct Disorder (20-56%) n Delinquent/Antisocial Activities (18-30%) n Anxiety Disorders (10-40%; partly referral
bias!) n Related more to poor emotion regulation than to
fear
n Major Depression (0-45%; 27% by age 20) n Bipolar Disorder (0-27%)
n Not documented in any follow-up studies to date
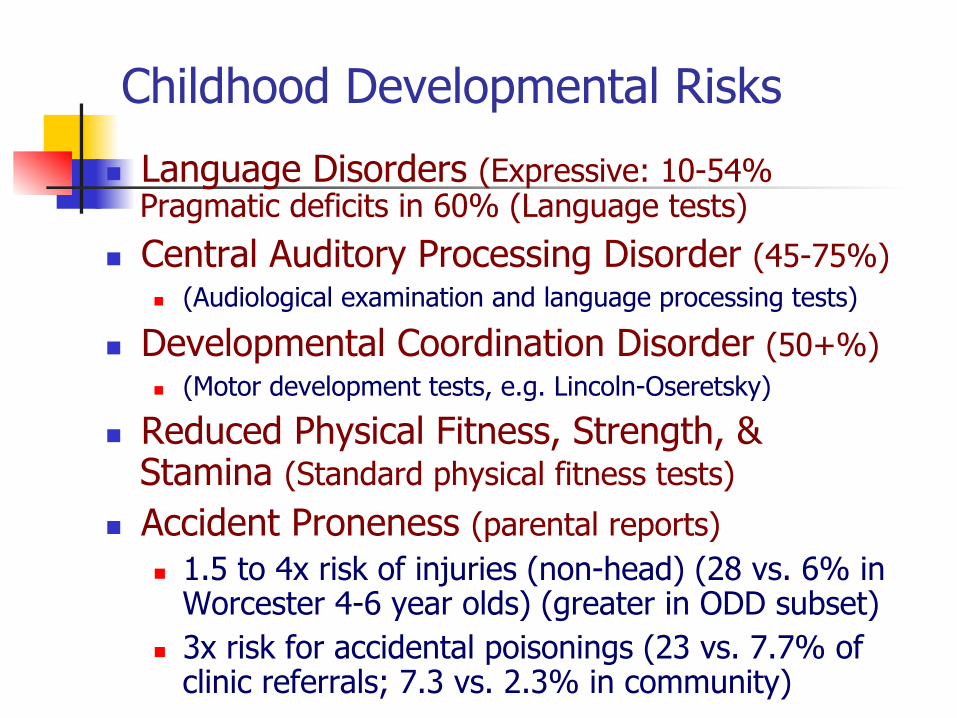
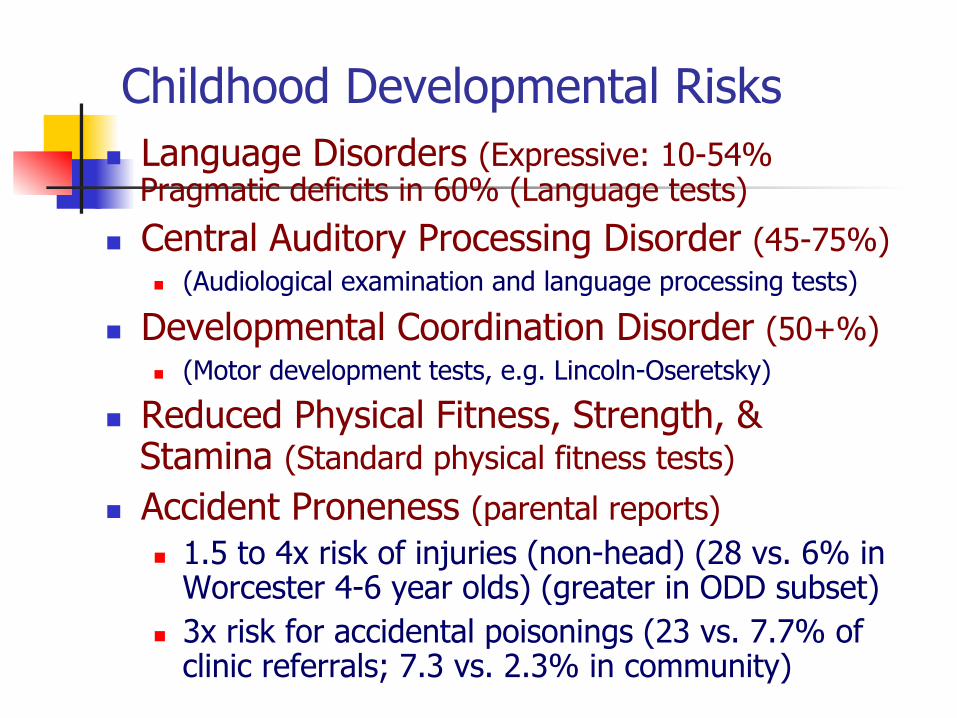
Childhood Developmental Risks
n Language Disorders (Expressive: 10-54% Pragmatic deficits in 60% (Language tests)
n Central Auditory Processing Disorder (45-75%) n (Audiological examination and language processing tests)
n Developmental Coordination Disorder (50+%) n (Motor development tests, e.g. Lincoln-Oseretsky)
n Reduced Physical Fitness, Strength, & Stamina (Standard physical fitness tests)
n Accident Proneness (parental reports) n 1.5 to 4x risk of injuries (non-head) (28 vs. 6% in
Worcester 4-6 year olds) (greater in ODD subset) n 3x risk for accidental poisonings (23 vs. 7.7% of
clinic referrals; 7.3 vs. 2.3% in community)

Seriousness and pervasiveness of impairments: Educational, Clinical, Interpersonal
n Poor School Performance (90%+) n More failing grades n Reduced productivity (greatest problem) n Lower GPA (1.7 vs 2.6) n Grade retentions (42% vs 13%) n Lower class rankings (69% vs 50%) n Higher rate of suspensions (60% vs 19%) and expulsions
(14% vs 6%)
n Low Academic Achievement (10-15 pt. deficit) n Low Average Intelligence (7-10 point deficit) n Learning Disabilities (10 to 70%)
n Reading (15-30%; 21% in Barkley, 1990) n Spelling (26% in Barkley, 1990) n Math (10-60%; 28% in Barkley, 1990) n Handwriting (common but % unspecified)
n Academic Outcomes n 23% to 32% fail to complete high school n 22% vs 77% enter college n 5% vs 35% complete college
[Barkley et al. 2006 Milwaukee Young Adult Outcome Study ]

Social-Emotional Impairments Assessed via parent ratings, peer sociometrics,
and videotaped interactions of ADHD children with others
n Increased parent-child conflict & stress n especially ODD/CD subgroup
n Peer Relationship Problems (50%+) n Less sharing, cooperation, turn-taking n More talking, commanding, intrusive, hostile n Most serious in ODD/CD subgroup
n Poor Emotional Control n More anger, frustration, hostility (ODD/CD) n Less self-regulation of emotional states

ADHD Cost of Illness (COI) in USA
COI = Educational accommodations Mental health care Parental work loss Juvenile justice system involvement
COI = Mean = $14,576 annually per child (Pelham et al., 2007)
Range = $12,005 to $17,458 COI = $40.8 billion annually (based on assumed 5%
prevalence rate and 2.8 million school age children in the United States (National Center for Education Statistics, 2010, enrollment data)

Persistence of Disorder Evaluated via structured interviews (DSM-based)
n Symptoms Decrease (graph) n Adolescence: (Based on parent reports)
n 50% persistence to adolescence (1970-80s) n 70-80% in modern DSM studies (1990s onward)
n Young Adulthood (age 20-26) (Barkley et al. in press)
n Depends on who you ask (self vs. parents) n 3-8% Full disorder (self-report using DSM3R) n 46% Full disorder (parent reports using DSM3R) n 12% - Using 98th percentile (+ 2SDs; self-report) n 66% - Using 98th percentile (parent report) n Parent reports correlate more highly with various
domains of major life activities than do self reports

Psychiatric Disorders (age 20-26) n ODD (12%+ by self-report) (Not Significant)
n Conduct Disorder (26%+ by self-report)*^ n Depression (27%)^ (not found in other studies)
n Substance Use/Abuse Disorders (10-24%)^ n Greater Use of Alcohol, Tobacco, and Marijuana n Milwaukee Study: Not different from controls due
to elevated drug use among controls
n Personality Disorders: - Antisocial (11-21%)*^ - Passive Aggr. (18%)*^ - Histrionic (12%)^ - Borderline (14%)*^ - *=greater risk if elevated child conduct problems - ^=greater risk if CD at adulthood

Educational Outcomes (ages 20-25)
Assessed by self-report and high school transcripts:
n More grade retention (25-45%; MKE: 42 vs. 13)
n More are suspended (40-60%; MKE: 60 vs. 19)
n Greater expulsion rate (10-18%; MKE: 14 vs. 6)
n Higher drop out rate (30-40%; MKE 32 vs 0)
n Lower Class Ranking (MKE: 69% vs. 50%)
n Lower GPA (MKE: 1.7 vs. 2.6)
n Fewer enter college (MKE: 22 vs. 77%) n Lower college graduate rate (5 vs. 35%) MKE = Milwaukee Young Adult Outcome Study

Employment Problems
n More likely to be fired n (MKE: 55 vs. 23%; Mean 1.1 vs. 0.3 jobs)
n Change jobs more often ( MKE: 2.7 vs. 1.3 over 2-8 years since leaving high school)
n More ADHD/ODD symptoms on the job n As rated by current supervisors (MKE)
n Lower work performance ratings n As reported by current supervisors (MKE)
n Lower social class (SES) (Hollingshead System) n By 30s, 35% self-employed (NY Study)

Motor Vehicle Driving Risks Assessed via self-report, driving records, lab testing,
driving simulators, and BTW tests (Barkley studies) n Poorer steering, more false braking, and slower
reaction times to significant events n Rated as using fewer safe driving habits n More likely to drive before licensing n More accidents (and more at faults) (2-3 vs. 0-2)
n % with 2+ crashes: 40 vs. 6 n % with 3+ crashes: 26 vs 9
n More citations (Speeding - mean 4-5 vs. 1-2)
n Worse accidents ($4200-5000 vs $1600-2200) n (% having a crash with injuries: 60 vs 17%)
n More Suspensions/Revocations (Mean 2.2 vs 0.7) n (% suspended: 22-24 vs. 4-5%)

Sexual-Reproductive Risks Assessed via self-reports: (MKE study) n Begin Sexual Activity Earlier (15 vs 16 yrs.)
n More Sexual Partners (18.6 vs. 6.5)
n Less Time with Each Partner n Less Likely to Employ Contraception n Greater Risk of Teen Pregnancy (38 vs. 4%) n Ratio for Number of Births (42:1)
n 54% Do Not Have Custody of Offspring
n Higher Risk for STDs (16 vs. 4%)

Etiologies - Heredity/Genetics
n Family Aggregation of Disorder: - 25-35% of siblings - 55-92% of identical twins - 15-20% of mothers - 25-30% of fathers - If parent is ADHD, 20-54% of offspring
n Twin Studies of Heritability: - Heritability = 57-97% (Mean 80%+; 95%+ if DSM) - Shared Environment = 0-6% (Not significant) - Unique Environment = 15-20%
n Molecular Genetics (DRD4, DAT1, DBH?)

Etiologies: Food Allergies & Miscellaneous Factors
n Sugar (Disproven) n Hyper/hypoglycemia (No evidence) n Food Allergies (Largely Disproven)
n Possibly 5% of ADHD Preschoolers react adversely to high doses of food additives
n Side Effects of Anticonvulsants (10-35%) n mainly to phenobarbital and dilantin
n Thyroid abnormalities (unlikely) n Rare in children n Evidence is conflicting
Comorbid DSM-IV Disorders As assessed by DSM-based structured
interviews (e.g. Kiddie SADS, DISC-P) n Oppositional Defiant Disorder (40-67%) n Conduct Disorder (20-56%) n Delinquent/Antisocial Activities (18-30%) n Anxiety Disorders (10-40%; partly referral
bias!) n Related more to poor emotion regulation than to
fear
n Major Depression (0-45%; 27% by age 20) n Bipolar Disorder (0-27%)
n Not documented in any follow-up studies to date
Childhood Developmental Risks n Language Disorders (Expressive: 10-54%
Pragmatic deficits in 60% (Language tests)
n Central Auditory Processing Disorder (45-75%) n (Audiological examination and language processing tests)
n Developmental Coordination Disorder (50+%) n (Motor development tests, e.g. Lincoln-Oseretsky)
n Reduced Physical Fitness, Strength, & Stamina (Standard physical fitness tests)
n Accident Proneness (parental reports) n 1.5 to 4x risk of injuries (non-head) (28 vs. 6% in
Worcester 4-6 year olds) (greater in ODD subset) n 3x risk for accidental poisonings (23 vs. 7.7% of
clinic referrals; 7.3 vs. 2.3% in community)

Employment Problems
n More likely to be fired n (MKE: 55 vs. 23%; Mean 1.1 vs. 0.3 jobs)
n Change jobs more often ( MKE: 2.7 vs. 1.3 over 2-8 years since leaving high school)
n More ADHD/ODD symptoms on the job n As rated by current supervisors (MKE)
n Lower work performance ratings n As reported by current supervisors (MKE)
n Lower social class (SES) (Hollingshead System) n By 30s, 35% self-employed (NY Study)

Motor Vehicle Driving Risks Assessed via self-report, driving records, lab testing,
driving simulators, and BTW tests (Barkley studies) n Poorer steering, more false braking, and slower
reaction times to significant events n Rated as using fewer safe driving habits n More likely to drive before licensing n More accidents (and more at faults) (2-3 vs. 0-2)
n % with 2+ crashes: 40 vs. 6 n % with 3+ crashes: 26 vs 9
n More citations (Speeding - mean 4-5 vs. 1-2)
n Worse accidents ($4200-5000 vs $1600-2200) n (% having a crash with injuries: 60 vs 17%)
n More Suspensions/Revocations (Mean 2.2 vs 0.7) n (% suspended: 22-24 vs. 4-5%)

Sexual-Reproductive Risks Assessed via self-reports: (MKE study) n Begin Sexual Activity Earlier (15 vs 16 yrs.)
n More Sexual Partners (18.6 vs. 6.5)
n Less Time with Each Partner n Less Likely to Employ Contraception n Greater Risk of Teen Pregnancy (38 vs. 4%) n Ratio for Number of Births (42:1)
n 54% Do Not Have Custody of Offspring
n Higher Risk for STDs (16 vs. 4%)

Current Models of ADHD
n Behavioral inhibition deficits (Barkley) n Cognitive-energetic model (Sergeant) n Delay aversion (Sonuga-Barke) n Dynamic developmental model
(Sagvolden) n State-regulation theory (van der Meere) n Working memory deficits (Rapport)

Ina"en%veBehavior
Behavioraldisinhibi/on
Deficientenerge%c
pools(effort/ac%va%on)
Subcor%calimpairment
Delayaversion
Unlinkedbehavior&
consequences
Deficientworkingmemory
Impulsivity
A"en%onDeficit
Barkley(1997)Sonuga-Barke(2010)Rapport(2001)
Halperin&Schulz(2006)
Sagvolde
n(200
5)
DSM-5(2
013)
Sergeant(2005)
Timing
DefaultModeNetwork
Castellanos(2010)

Behavioral Inhibition Theory of ADHD
n A deficit in response inhibition n That disrupts 4 executive functions
n Sensing to the self (nonverbal working memory) n Self-speech (verbal working memory) n Self-management of emotion/motivation n Self-play – Mental planning-problem solving
n Impairing self-regulation across time to maximize delayed social consequences
n Making ADHD a form of time blindness or myopia to the future – an intention deficit
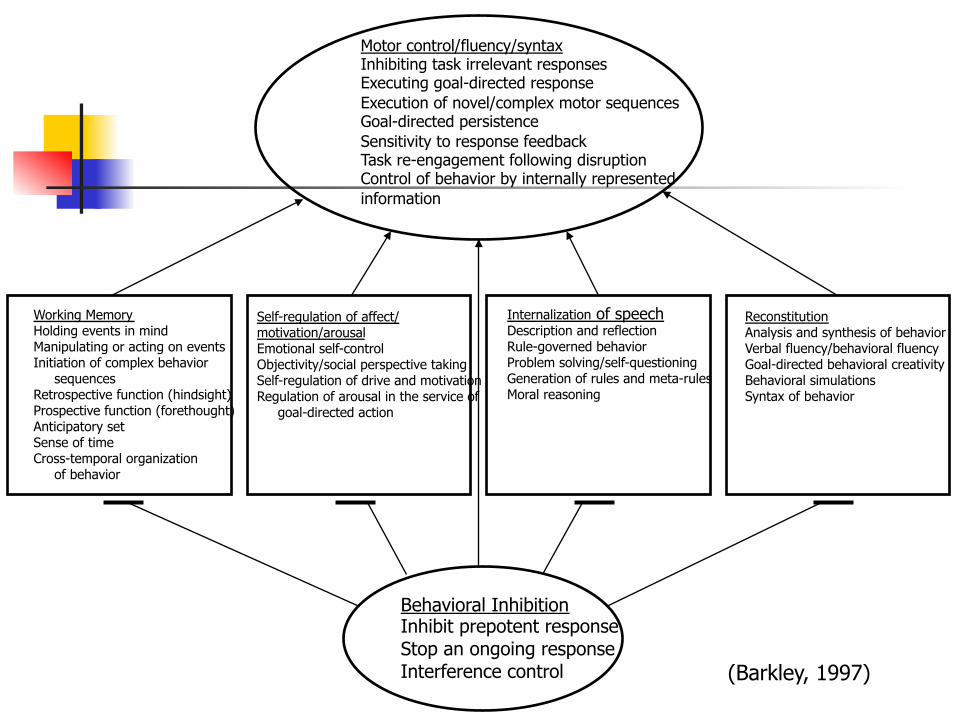
Behavioral Inhibition Inhibit prepotent response Stop an ongoing response Interference control
Motor control/fluency/syntax Inhibiting task irrelevant responses Executing goal-directed response Execution of novel/complex motor sequences Goal-directed persistence Sensitivity to response feedback Task re-engagement following disruption Control of behavior by internally represented information
Working Memory Holding events in mind Manipulating or acting on events Initiation of complex behavior sequences Retrospective function (hindsight) Prospective function (forethought) Anticipatory set Sense of time Cross-temporal organization of behavior
Self-regulation of affect/ motivation/arousal Emotional self-control Objectivity/social perspective taking Self-regulation of drive and motivation Regulation of arousal in the service of goal-directed action
Internalization of speech Description and reflection Rule-governed behavior Problem solving/self-questioning Generation of rules and meta-rules Moral reasoning
Reconstitution Analysis and synthesis of behavior Verbal fluency/behavioral fluency Goal-directed behavioral creativity Behavioral simulations Syntax of behavior
(Barkley, 1997)

Behavioral Inhibition (Barkley, 2007)
n Inhibition of a prepotent response n Stop an ongoing response n Interference Control

Evolution of the Stop-Signal Task n Logan (1981) developed his model following
the work of Lappin and Eriksen (1964, 1966), who were doing similar studies on ballistic responses.
n Logan, 1981, 1982a, 1982b, 1983 initially examined the ballistic responses of typists.
n Logan (1984) became interested in the extent to which choice reaction times are controlled or ballistic and ultimately developed his Race Horse Model of behavioral inhibition.

Continued Evolution of the Stop-Signal Task n Advantages over simple reaction time tasks,
such as the go, no-go paradigm (Tekok-Kilic et al., 2001), include: 1. A greater demand on cognitive resources
relevant to inhibitory processes (Logan, Cowan, & Davis, 1984)
2. The ability to examine speed-accuracy trade-off processes that reflect children’s strategic adjustment in primary task reaction time (Logan, 1981).
n Early version of the Stop-Signal Task relied on fixed stop-signal delays, inhibition slopes, and logarithmic calculations of SSRT.

l Go and stop processes race to the finish line
l If go process wins, response is executed l If stop process wins, response is
inhibited
Horse Race Model of Behavioral Inhibition (Logan, Cowan, & Davis, 1984)


Stop-Signal Task Variables n Go-Signal – stimuli (typically X or O) that signals
one to respond n Stop-Signal – stimuli (typically an auditory tone)
that signals one to withhold or stop a response. n Mean Reaction Time (MRT) – choice reaction time
to go-stimulus n Stop-Signal Delay (SSD) – stimulus onset
asynchrony between the presentation of the go-stimulus and stop-stimulus
n Stop-Signal Reaction Time (SSRT) – reaction time to the stop-stimulus, calculated as MRT-SSD

Behavioral Inhibition and
the Stop Signal Paradigm
SSRT = MRT – SSD SSRT = Stop Signal Reaction Time MRT = Mean Reaction Time SSD = Stop Signal Delay


Mean Reaction Time (MRT)
Stop Signal
Go Tone
Time (in ms)
Response accuracy varies with tone presentation – easier to stop when stop signal is closer to go-signal

Alderson, Rapport, Sarver & Kofler (2008) ADHD and Behavioral Inhibition: A Re-examination of the Stop-signal Task. Journal of Abnormal Child Psychology.

Meta-Analysis of the Stop-Signal Task (Alderson, Rapport, & Kofler, 2007)
n Compared 23 studies of children with ADHD and typically developing children on the stop-signal task
n Results: n MRT: ADHD > NC (ES = 0.45) n MRT Variability: ADHD > NC (ES = 0.73) n SSRT: ADHD > NC (ES = 0.63)
n Results were highly consistent across meta-analytic reviews: n MRT: ESs = 0.49, 0.52, and 0.45 n MRT Variability: 0.73, 0.72, and 0.72 n SSRT: 0.64, 0.58, and 0.63

Meta-Analysis of the Stop-Signal Task (Alderson, Rapport, & Kofler, 2007)
n SSD: ADHD = NC (ES = -0.02 unstandardized)
n SSD is direct reflection of inhibitory success.
n SSD was indirectly estimated

CORE FEATURE: WORKING MEMORY
INATTENTION HYPERACTIVITY IMPULSIVITY
Biological Influences, e.g., genetics
NEUROBIOLOGICAL SUBSTRATE
CORE FEATURES: INATTENTION HYPERACTIVITY IMPULSIVITY
SECONDARY FEATURES: Academic Underachievement Social Skill Deficits Poor Organizational Skills Classroom Deportment Cognitive Abilities
DSM-5 CLINICAL MODEL OF ADHD
ENVIRONMENTAL/ COGNITIVE DEMANDS
Behavioral Interventions Pharmacological
Treatment

Ini%alConceptualiza%onoftheFunc%onalWorkingMemory
ModelofADHD

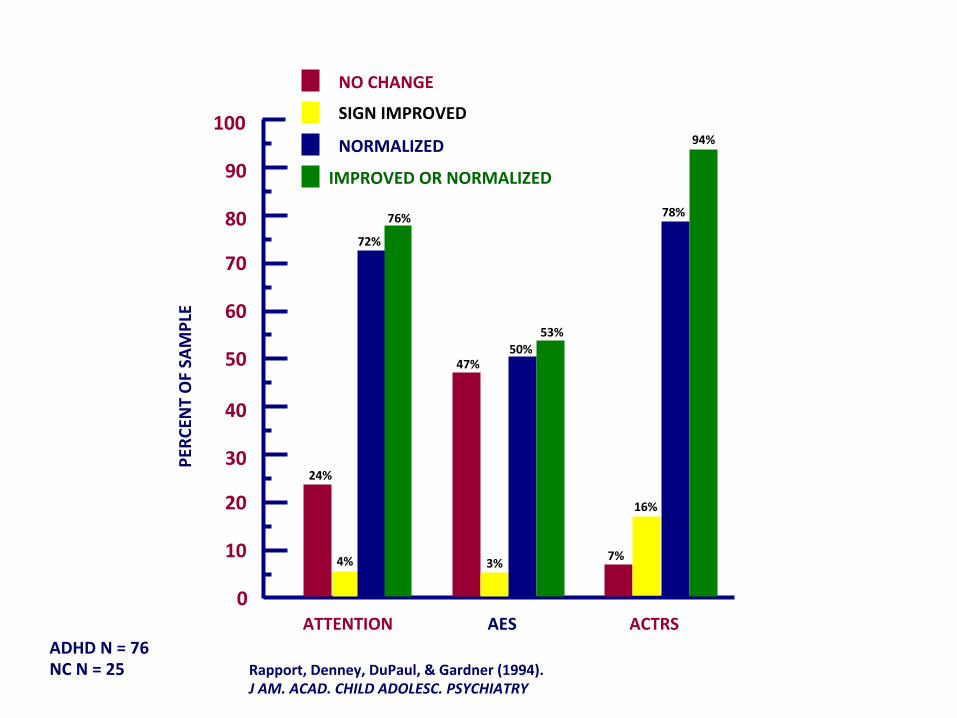
Theenigma–whydolargemagnitudechangesincoresymptomsnottranslateintosustainableorgeneralizable
changesintreatedchildren?
q PharmacodynamicstudiesrevealDAandNAac%va%onofcor%cal-subcor%calpathwaysinvolvingthefrontal/prefrontal,temporallobe,andbasalganglia–areasthatplayacri%calroleinexecu%vefunc%ons(EFs)
q Op%malac%va%onofstructuresunderlyingEFsandaccompanyingarousalisnecessarybutinsufficienttofacilitatethedevelopmentofexecu%vefunc%onprocessessupportedbythesestructuresandwiderangeofbehaviorsdependentupontheseprocesses
60
50
40
30
20
10
70
80
90
100
0
7%
50%53%
94%
72%
76%
4%
16%
47%
78%
3%
24%
NOCHANGE
SIGNIMPROVED
NORMALIZED
IMPROVEDORNORMALIZED
ATTENTION AES ACTRS
PERC
ENTOFSA
MPLE
ADHDN=76NCN=25 Rapport,Denney,DuPaul,&Gardner(1994).
JAM.ACAD.CHILDADOLESC.PSYCHIATRY

HYPERACTIVITY
IMPULSIVITY
ATTENTION
ACADEMIC PERFORMANCE
*CFI = 1.00
R2 = 0.27
HYPERACTIVITY
IMPULSIVITY
ATTENTION
ACADEMIC PERFORMANCE
*CFI = 0.99
R2 = 0.20
BASELINE MODEL
b TREATMENT MODEL
- 0.11
0.34
0.41
0.02, n.s.
- 0.41
0.37
0.71
- 0.18, n.s.
Rapport,Denney,DuPaul,&Gardner(1994).JAM.ACAD.CHILDADOLESC.PSYCHIATRY
N = 76 @ B, Pl, 5, 10, 15, 20 mg MPH
%academicassignmentscompletedcorrectly
DirectObserva%ons
Teacherra%ngs
*CFI=compara%vefitindex

FITTED STRUCTURAL EQUATION MODEL OF EARLY BEHAVIOR, EARLY IQ, AND LATER DELINQUENCY AND SCHOLASTIC ABILITY. [FERGUSSON & HORWOOD, 1995, J OF ABNORM CHILD PSYCHOLOGY, 23, 183-199]
.84
TOSCA = TEST OF SCHOLASTIC ABILITIES
LATER DELINQUENCY
15 YEARS
LATER SCHOOL
ACHIEVEMENT 13 YEARS
EARLY CONDUCT
PROBLEMS 8 YEARS
EARLY ATTENTION
DEFICIT 8 YEARS
EARLY IQ
8 YEARS
MOTHER SELF POLICE TOSCA-a TOSCA-b
ns
.68 -.27 .66
.68 .53 .95 .95
.78 -.41
-.38
MOTHER TEACHER MOTHER TEACHER TOSCA-a TOSCA-b
.54 .59 .55 .75
.94 .93

AX .75 .97*
BX .89*
L .66
H .25
L .46
H .50
E
E
E
E .86
Attention .80*
.97
D
.60
.24
D
D .71
.40* Classroom Behavior
E
E
E
.36
.28
.42 AS
AP
AE
.91 .96*
.93*
D .55
-.20* -.67*
.33*
.16*
.31*
-.07
.72*
.19*
-.23*
Verbal Memory
.54
.59
E
E
E .66 B12
B34
B56
.75
.81*
.84*
D .51
Scholastic Achievement
.52 E
E
E
Lang
.46
.41 Reading
Math .91 .89*
.85*
D .48
ADHD IQ E .42
E .50 Del
Agg
.87*
.91* CD .67* -.28*
14.27(1.095)
.05(.007)
-.63(.494)
1.66(.579)
.05(.009)
.13(.014)
-.66(.037)
.55(.162)
-.67(.153)
COMPARATIVE FIT INDEX = .94 ROBUST FIT INDEX = .93
77%
Rapport,Scanlan&Denney(1999)J.ofChildPsychiatryandPsychology
-.26
n=325SA=SAT
BehavioralPathway
Cogni%vePathway

Overview of Executive Functions (EFs)
Execu%veFunc%on(EF):anumbrellatermusedtodescribeabroadrangeof‘top-down’cogni%veprocessesandabili%esthatenableflexible,goal-directedbehavior;andrepresentsthedominantparadigmduringthepastdecadefollowingDr.Barkley’s(1997)seminaltheore%calpaperin1997.Ensuingdebatefocusedontwoalterna%vemodels:1. EFviewedasaunitaryconstructwithinterrelatedsub-processes.2. EFviewedasacomponen%almodelofdissociableEFprocessesAccumula%ngevidencesupportsanintegra%onofthetwoapproaches(i.e.,interrelatedsub-processesgovernedbyadomaingeneralexecu%veora"en%onalcontroller(e.g.,Miyakeetal.,2000)emphasizing3primaryexecu%vefunc%ons:§ Upda%ng:thecon%nuousmonitoringandquickaddi%onordele%onofcontentswithinone’sworkingmemory§ Inhibi%on:thecapacitytosupersederesponsesthatareprepotentinagivensitua%on§ Shising:thecogni%veflexibilitytoswitchbetweendifferenttasksormentalstates

Miyakeetal.(2000):3-factormodelofexecu%vefunc%onbasedonSEM
1Lehtoetal.(2003):replicatedfactorstructurein8-13yearoldchildren
2Huizingaetal.(2006):WM&setshisingaredevelopmentallycon%guousbetween7&21yearsofage
Supportsadomaingeneralexecu%vecontroller
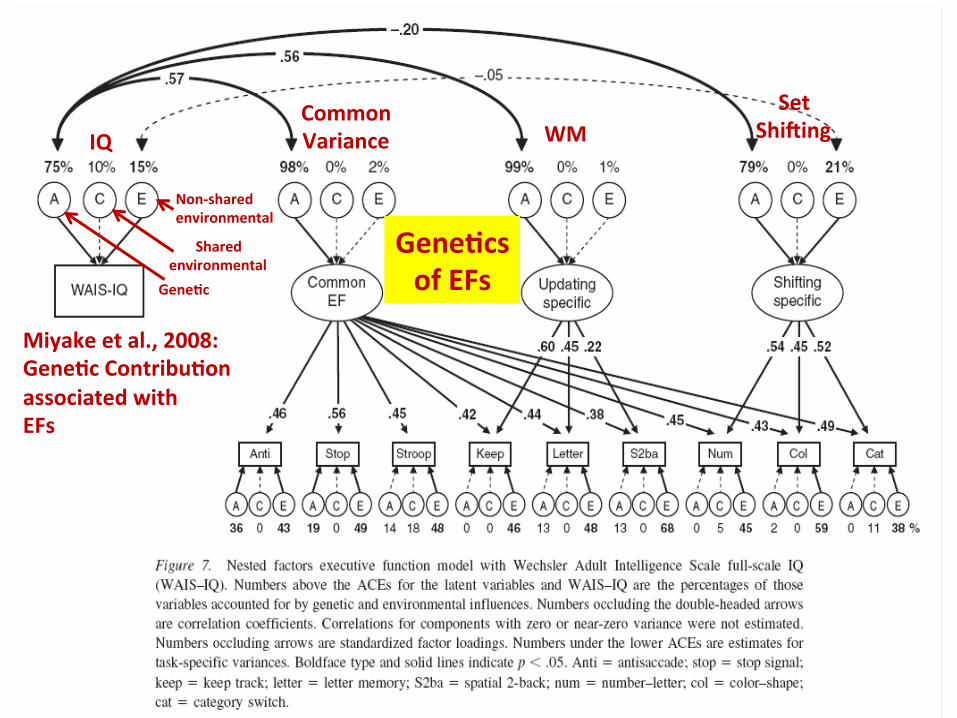
WMSet
ShisingCommonVarianceIQ
Gene%c
Sharedenvironmental
Non-sharedenvironmental
Miyakeetal.,2008:Gene%cContribu%onassociatedwithEFs
Gene%csofEFs

CORE FEATURE: WORKING MEMORY
INATTENTION HYPERACTIVITY IMPULSIVITY
Biological Influences, e.g., genetics
NEUROBIOLOGICAL SUBSTRATE
CORE FEATURES: INATTENTION HYPERACTIVITY IMPULSIVITY
SECONDARY FEATURES
DSM-IV CLINICAL MODEL OF ADHD
ENVIRONMENTAL/ COGNITIVE DEMANDS
WORKING MEMORY Rapport et al., 2001

BiologicalInfluences(e.g.,gene/cs)
NeurobiologicalSubstrate
Environmental/Cogni%veDemands
WorkingMemoryDeficits
Func%onalImpairmentsFamilyfunc/oningPeerrela/onships
Academicfunc/oning
CoreBehavioralSymptomsInaUen/onHyperac/vityImpulsivity
Genotype Endophenotype(s) Phenotype
Medica/on(e.g.,MPH)
BehavioralTreatment(e.g.,BPT,SST)
Cogni/veTraining
Accommoda/ons(e.g.,504Plans) IntraindividualVariability
BehavioralDisinhibi/onLowerIQTestPerformance
Opposi/onalBehavior

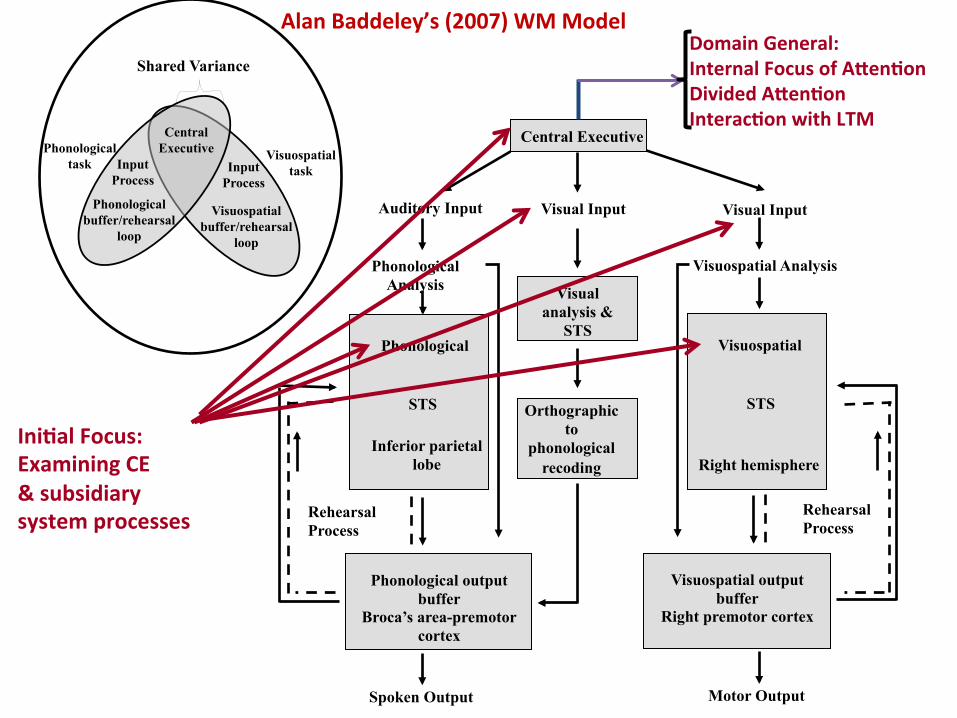
WhatisWorkingMemory?
– Workingmemoryisalimitedcapacitysystemthatenablesindividualstostorebrieflyandprocessinforma/on(Baddeley,2007).
hUp://usablealgebra.landmark.edu/wp-content/uploads/2008/12/working-memory-2.gif

Spoken Output
Visuospatial Analysis
Visuospatial
STS
Right hemisphere
Visuospatial output buffer
Right premotor cortex
Rehearsal Process
Motor Output
Visuospatial task
Phonological task
Central Executive
Input Process
Visuospatial buffer/rehearsal
loop
Phonological buffer/rehearsal
loop
Shared Variance
Input Process
Auditory Input
Phonological Analysis
Phonological
STS
Inferior parietal lobe
Phonological output buffer
Broca’s area-premotor cortex
Rehearsal Process
Central Executive
Visual analysis &
STS
Orthographic to
phonological recoding
Visual Input Visual Input
DomainGeneral
AlanBaddeley’s(2007)WMModel

CentralExecu%veProcesses:PastConceptualiza%on
Con%nuousUpda%ng
Manipula%on/DualProcessing
SerialReordering
[Baddeley,2007]
InterferenceControl
InterfaceWithLTM

Tillmanetal.(2011).DevelopmentalNeuropsychology,36,181-198
DevelopmentofWorkingMemoryinChildren:PeakDevelopmentalPeriods
AGE:6789101112131415
Phonological(Verbal)STM
Visuospa%alSTM
CentralExecu%ve(CE)
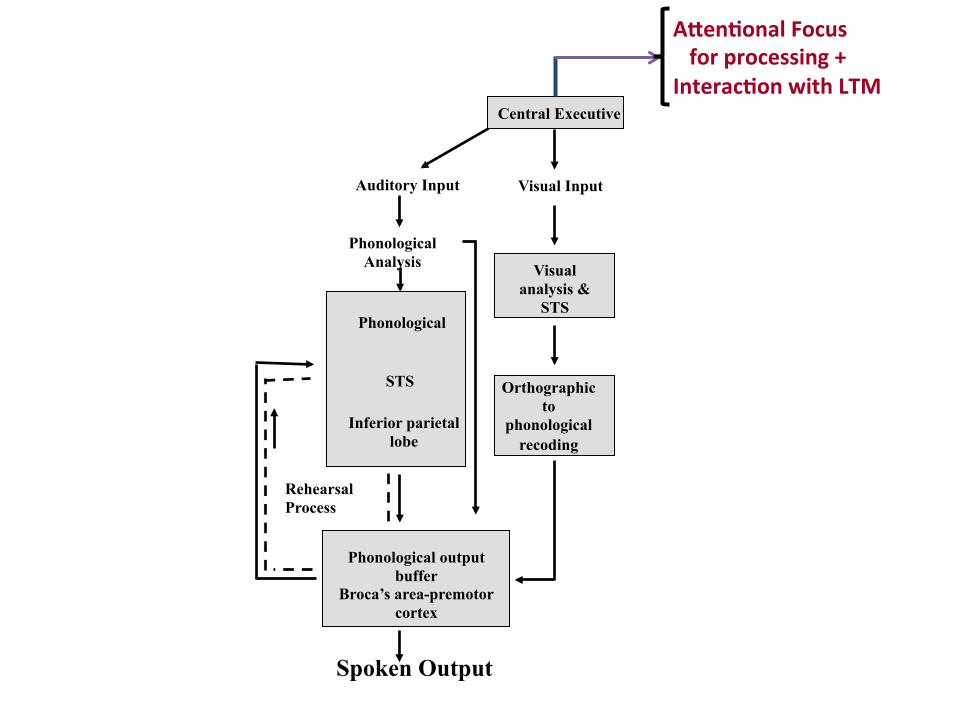
Auditory Input
Phonological Analysis
Phonological
STS
Inferior parietal lobe
Phonological output buffer
Broca’s area-premotor cortex
Rehearsal Process
Central Executive
Visual analysis &
STS
Orthographic to
phonological recoding
Visual Input
A"en%onalFocusforprocessing+Interac%onwithLTM
Spoken Output

ForwardandBackwardSpanTasks.63
.77
.80
opera/onspan
readingspan
coun/ngspan
.79
.63
.60
WorkingMemory
.60
.70
backwardspan
forwardspan,dissimilar
Forwardspan,similar
.67
.80
.71
Short-TermMemory
.74
.63
Forwardandback-wardspantasksloadonthesamedimension&arebothmeasuresofshort-termstorage(Engle,Tuholski,Laughlin,&Conway,1999).
Swanson&Kim,2007Colom,Abad,Rebollo,&Shih,2005Rosen&Engle,1997Swanson,Mink,&Bocian,1999Engle,Tuholski,Laughlin,&Conway1999
FluidIQ
.49
ns


The potential importance of working memory as a underlying core deficit in children with ADHD

Higher–ordercogni%vetasks,skills,andabili%esdependentonworkingmemorycomponents
CentralExecu%ve• Generalfluidintelligence• Verbalandvisualreasoning• Vocabularylearning• Literacy• Arithme%c• Readingcomprehension• Listeningcomprehension• Abilitytofollowdirec%ons• Notetaking• Wri%ng• Bridgeplaying• Chessplaying• Learningtoprogramcomputers• Verbalachievement• Mathachievement• Lexical-seman%cabili%es• Orthographicabili%es• Complexlearning• Motorac%vity• A"en%vebehavior
PhonologicalStorage/Rehearsal• Verbalreasoning• Vocabularylearning• Wordrecogni%on
• Verbalachievement• Mathachievement
• Phonological/syntac%cabili%es
• A"en%vebehavior
Visuospa%alStorage/Rehearsal• Visualreasoning• Speechproduc%on
• Mathachievement
• A"en%vebehavior

WMCapacity
Academicachievement
Computerprogramming
Reasoning/organiza%onalability
Literacy
Long-termmemoryretrieval
Bridge&chessplaying
Followingdirec%ons
Wri%ng;Notetaking
Reducedproac%veinterference
Generalfluidintelligence
Complexlearning
Lexical-seman%cabili%es

Reading
Math
Spelling
Reading
Math
Spelling
IQ
WorkingMemory
.329
.453
.419
ns
ns.285
5Years
5Years
IQ WM
WISC-IV
R2=.58 IQ WM
PreviousResearch
R2=.22-.81
Age11AcademicAchieve-ment
AllowayandGathercole,2008(Nature)

WorkingmemoryimpairmentsinchildrenwithADHD
WMSystems WMComponents
VSWorkingMemory
PHWorkingMemory
VSStorage/Rehearsal
PHStorage/Rehearsal CE
Meta-analyses
Mar%nussenetal.(2005)
-- -- 0.85 0.47 0.43-1.06
Willcu"etal.(2005) 0.63 0.55 -- -- --
Brockietal.(2008) 0.60 0.85 -- -- --
Mar%nussen&Tannock,(2006)
-- -- 0.70 0.04 0.60-1.10
Marzocchietal.(2008) 1.00 -- 0.74 --
Trends:(a)Deficitsinbothsystems/allthreesubcomponents(b)DeficitsinCE>VS>PH

WorkingMemoryDeficitsinADHD:Thefunc%onalrela%onshipbetweencentralexecu%ve
processes,hyperac%vity,andina"en%on
MarkD.Rapport,Ph.D.ProfessorofClinicalPsychologyAPAFellowDirector,Children’sLearningClinic-IVDepartmentofPsychologyUniversityofCentralFlorida(UCF)www.childrenslearningclinic.com

SarahOrban,M.S.LaurenFriedman,B.S.SamEckrich,M.S.CatrinaCalub,M.S.
DoctoralStudentMembers:UndergraduateStudentMembers:
KelceyWendyMelissaHonseeSveltaEmilySheiaTaylorLuke
AffiliateFacultyMembers:R.Ma"Alderson,Ph.D.OklahomaStateUniversityMichaelJ.Kofler,Ph.D.FSUJenniferBolden,Ph.D.UofTennesseeDus%nE.Sarver,Ph.D.UofMississippiMedicalSchoolJoeS.Raiker,Ph.D.FloridaInterna%onalUniversity
UCFChildren’sLearningClinic-IVResearchTeam
Spoken Output
Visuospatial Analysis
Visuospatial
STS
Right hemisphere
Visuospatial output buffer
Right premotor cortex
Rehearsal Process
Motor Output
Visuospatial task
Phonological task
Central Executive
Input Process
Visuospatial buffer/rehearsal
loop
Phonological buffer/rehearsal
loop
Shared Variance
Input Process
Auditory Input
Phonological Analysis
Phonological
STS
Inferior parietal lobe
Phonological output buffer
Broca’s area-premotor cortex
Rehearsal Process
Central Executive
Visual analysis &
STS
Orthographic to
phonological recoding
Visual Input Visual Input
DomainGeneral:InternalFocusofA"en%onDividedA"en%onInterac%onwithLTM
AlanBaddeley’s(2007)WMModel
Ini%alFocus:ExaminingCE&subsidiarysystemprocesses

Par%cipantsandInclusionCriteriaq Diagnos%cProcedures
v Extensivechildhistories(pre,pari,post-natal;earlydevelopmental;medical;educa%onal;psychiatric;parent/family)v K-SADSSemi-StructuredClinicalInterview,Life%meVersion[parentandchildinterviewedseparately]
q ParentRa%ngScales[ADHDfactorinclinicalrange;DSMcriteria]
v ChildSymptomInventory–4ParentForm(DSM-IVcriteria)v ChildBehaviorChecklist–ParentForm(ADHDfactorinclinicalrange)
q TeacherRa%ngScales[ADHDfactorinclinicalrange;DSMcriteria]
v ChildSymptomInventory–4TeacherReportForm(DSM-IVcriteria)v ChildBehaviorChecklist–TeacherReportForm(TRF)

Par%cipantsandInclusionCriteria
q OtherChildMeasuresandInclusion/ExclusionCriteria
v WISC-IVFullScaleIntellectualEvalua%onv KaufmannTestofEduca%onalAchievement–2ndEdi%on
v Children’sDepressionInventory(CDI)v RevisedChildren’sManifestAnxietyScale(RCMAS)v ForADHD:onsetpriorto7yearsofage;moderatetosevereimpairmentacrossmul%plese{ngs;notbe"eraccountedforbyotherDxorillness.v ComorbidityallowedforODD

AChildAssessmentrequiresthefollowing:" Detaileddevelopmentalhistory(includespre/pari/postnatal,medical,social,educa%on,familypsychiatric&medicalhistories)K-SADSsemi-structuredinterviewwithparentandchild" WISC-IV(fullIQba"ery)withchild" KTEA(fullachievementba"ery)withchild" CBCL,CSI-P(ChildSymptomInventory),BarkleyHSQ" TRFandCSI-T" Addi%onalClinicalScales(CDI,ManifestAnxietyScale,Behavioral/physicalComplaintsScale)" 4,3-hourassessmentsessions,onceperweekx4consecu%veweeks(Saturdays)x6adults" Protocolscoringanddatainput" NoldusObserverobserva%ons(perchild)" Caseconceptualiza%onandwri"enreport" Parentdebriefing
30par%cipantsrequireapproximately3750hours[excludingther/opar%cipantswhofailtomeetdxcriteria]
TimePerson1-1.5hrParent3hrParent4hrChild3hrChild3hrParent.5hrTeacher
.5hrChild72hrCLC4hrCLC24hrCLC8hrCLC1.5hrCLC125hourstotalperchild

PowerAnalysis
• An average effect size (ES) of 0.70 was calculated based on the average magnitude of ADHD PH and VS deficits reported by Martinussen et al. (2005).
• GPower software version 3.0.5 (Faul, Erdfelder, Lang, & Buchner,
2007) was used to determine needed sample size using this ES, with power set to .80 as recommended by Cohen (1992).
• For an ES of 0.70, α = .05, power (1 – β) = .80, 2 groups, and 4 repetitions (i.e., set sizes), 20 total subjects are needed for a repeated measures ANOVA to detect differences and reliably reject H0. 23 total children participated in the study

Sample and Demographic Variables Variable
ADHD (n = 12)
Typically Developing (n = 11)
Mean SD Mean SD F
Age 8.75 1.29 9.36 1.43 1.17
FSIQ 100.92 15.22 110.18 13.11 2.43
SES 43.46 12.25 52.50 7.57 6.13*
CBCL
Attention Problems 78.50 10.53 55.64 7.06 36.68***
TRF
Attention Problems 66.25 8.83 48.73 16.92 9.94**
CSI-Parent
ADHD, Combined 12.67 3.85 3.00 4.98 27.42***
CSI-Teacher
ADHD, Combined 9.83 5.32 2.73 3.93 13.06** Note: ADHD = attention-deficit/hyperactivity disorder; CBCL = Child Behavior Checklist; CSI = Child Symptom Inventory; FSIQ = Full Scale Intelligence Quotient; SES = Socioeconomic Status; TRF = Teacher Report Form. * p ≤ .05, ** p ≤ .01, *** p ≤ .001

Phonological (PH) Working
Memory Task
Storage component: child must hold 3 to 6 stimuli in memory Processing component: child must manipulate the order of stimuli from low to high, and mentally move the letter to the last place during recall

Phonological(PH)WMTask
Childrenareinstructedtorecallthenumbersinorderfromsmallesttolargest,andsaythele"erlast.
3, 4, 5, 6 stimuli sequences
6 2 5 M Verbal Response: 2, 5, 6, M
Correct Response Sequence
Phonological Task

Visuospa/al(VS)WMTask
Childrenareinstructedtoindicatetheserialposi%onofblackdotsintheorderpresentedbypressingthecorresponding
squaresonacomputerkeyboard,andindicatetheposi%onofthereddotlast.
Visuospa%alTask
BlackDot1 RedDot CorrectResponseSequence
BlackDot2 BlackDot3
1
2
34
3, 4, 5, 6 stimuli sequences

Phonological WM Visuospatial WM
Rapport, Alderson, Kofler, Sarver, Bolden, & Sims (2008). J of Abnormal Child Psychology, 36, 825-837.
Phonological and Visuospatial WM Deficits in boys with ADHD
ES=1.89 ES=2.31

PH3 VS3
PH4 VS4
PH5 VS5
PH6 VS6
CE
CE
CE
PH Storage/Rehearsal Performance
Composite Score
VS Storage/Rehearsal Performance
Composite Score
CE Performance Composite Score
PH, VS, and CE
Performance Composite Scores CE
CEES=2.76
PHES=.55[1.89w/CE]
VSES=.89[2.31w/CE]

0
1.5
1.0
0.5
-0.5
2.0
-1.0
-1.5
-2.0-2.5 4
5
67
89
10
YearsinAge
WMPerform
ance
ZScore
[Gathercole&Alloway,2008]
10thcen%le
90thcen%le

Shaw et al. 2007 ADHD & Cortical
Development


Spoken Output
Visuospatial Analysis
Visuospatial
STS
Right hemisphere
Visuospatial output buffer
Right premotor cortex
Rehearsal Process
Motor Output
Visuospatial task
Phonological task
Central Executive
Input Process
Visuospatial buffer/rehearsal
loop
Phonological buffer/rehearsal
loop
Shared Variance
Input Process
Auditory Input
Phonological Analysis
Phonological
STS
Inferior parietal lobe
Phonological output buffer
Broca’s area-premotor cortex
Rehearsal Process
Central Executive
Visual analysis &
STS
Orthographic to
phonological recoding
Visual Input Visual Input
DomainGeneral
AlanBaddeley’s(2007)WMModel
PHStoreSubvocalRehearsal
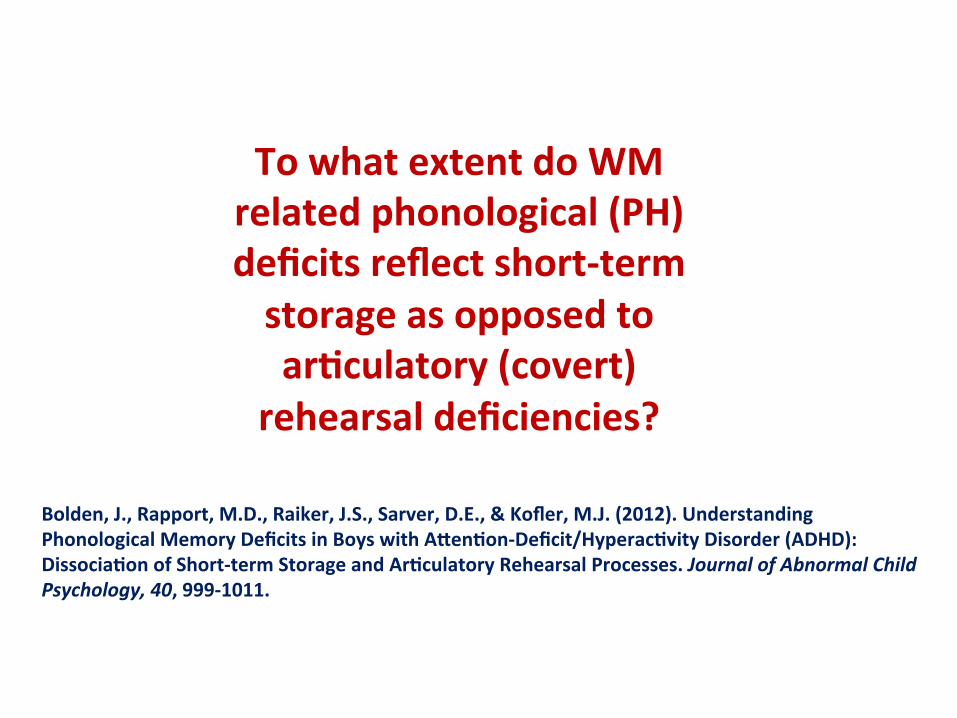
TowhatextentdoWMrelatedphonological(PH)deficitsreflectshort-termstorageasopposedtoar%culatory(covert)
rehearsaldeficiencies?
Bolden,J.,Rapport,M.D.,Raiker,J.S.,Sarver,D.E.,&Kofler,M.J.(2012).UnderstandingPhonologicalMemoryDeficitsinBoyswithA"en%on-Deficit/Hyperac%vityDisorder(ADHD):Dissocia%onofShort-termStorageandAr%culatoryRehearsalProcesses.JournalofAbnormalChildPsychology,40,999-1011.

Phonological output buffer
Broca’s area-premotor cortex
PhonologicalWorkingMemory
Auditory Input
Phonological Analysis
Phonological
STS
Inferior parietal lobe
Rehearsal Process
Central Executive
Visual analysis & STS
Orthographic to phonological
recoding
Visual Input
Spoken Output
h"p://docsbrainblocks.com/images/dyslexia_1.jpg
Baddeley,2007

LanguageProcessing(Adams&Gathercole,1995)
MathAchievement(Gathercole,Alloway,Willis,&Adams,2006)
ReadingDecodingandReadingComprehension(Swanson&Howell,2001)
UnderstandingClassroomInstruc%ons(Gathercole&Alloway,2008)
Contribu%onofPhonologicalProcessingtootherabili%es
Auditory Input
Phonological Analysis
Phonological
STS
Inferior parietal lobe
Phonological output buffer
Broca’s area-premotor cortex
Rehearsal Process
Spoken Output
Les,prefrontalregion(Broca’sarea)Awhetal.,1996;Smith&Jonides,1999)
Les,temporo-parietalcortex(Jonidesetal.,1998)

Presenta/onPhase
Storage/Rehearsal RecallPhase
2-Words 4-Words 6-Words
3-secondsdelay
12-secondsdelay
21-secondsdelay
Spoken Output
Auditory Input
Phonological Analysis
Phonological
STS
Inferior parietal lobe
Phonological output buffer
Broca’s area-premotor cortex
Rehearsal Process
Central Executive
PhonologicalMemoryTask
21dis%ncttrialsateachlistlength
Listlengthsetbasedoneachchild’sspan

4
2
1
3
042 6
S%muli(words)
80
60
50
70
40
123 21Seconds
0
ADHDTD
S%muliR
ecalledCo
rrectly
%Correct
Eachchildisperformingattheirestablishedmemoryspan3setsizecondi%onsat3-srecall
ADHDTD
ns
ns
**
**
****
~57%storagecapacitydeficit
ADHDslose~30%ofwordslearnedor.5SDper9-s
TDslose~10%ofwordslearned
Short-termstoragecapacityES=1.15to1.98Ar%culatoryrehearsalES=.47to1.02

Arecomponentsofworkingmemoryfunc%onallyrelatedtohyperac%vity?
Rapport,M.D.,Bolden,J.,Kofler,M.J.,Sarver,D.E.,Raiker,J.S.,Alderson,R.M.(2009).Hyperac%vityinBoyswithA"en%on-Deficit/Hyperac%vityDisorder(ADHD):AUbiquitousCoreSymptomorManifesta%onofWorkingMemoryDeficits?JournalofAbnormalChildPsychology,37,521-534.

BiologicalInfluences(e.g.,gene/cs)
NeurobiologicalSubstrate
Environmental/Cogni/veDemands
(CoreFeature)WorkingMemory
Deficits(AssociatedFeaturesand
Outcomes)Impaired• Cogni/veTestPerformance• AcademicAchievement• SocialSkills• Organiza/onalSkills• ClassroomDeportment• DelayAversion(SecondaryFeatures)
Hyperac%vityInaUen/venessImpulsivity
WorkingMemoryModelofADHD

Controls n = 12
Hyperactives n = 12
p < .05
25
50
75
100
125
150
0
1 5 10 15 20 24
Mea
n A
ctiv
ity C
ount
s Per
Hou
r
Hour
Porrino et al. (1983)
Arch Gen Psychiatry, 40, 681-687
MeanWeekdayHourlyAc/vityScores

“Little evidence was found, however, to support the hypothesis that hyperactivity is simply an artifact of the structure and attentional demands of a given setting.” p.681
“… a substantial ubiquitous increase in simple motor behavior is a clear characteristic of this group.” p. 685
“In a variety of situations with differing degrees of structure and attentional demand, hyperactives showed consistently higher levels of motor movement than did their normal controls.” p. 686
Porrino et al. (1983). Archives of General Psychiatry, 40, 681-687.

Mean Hourly Activity Scores During the Week
Overall Weekly Mean
20
40
60
80
100
120
140
160
180
200
Lunch/ Recess
Reading Mathematics Physical Education
Controls
Hyperac/ves
p<.01
Porrinoetal.,1983

DEPENDENTMEASURESANDTECHNIQUESACTIGRAPHSq AmbulatoryMonitoring,Inc.MicroMiniMo%onlogger®q SETTING:LowPIMMode[intensityofmovement][Propor%onalIntegra%ngMeasure]q SAMPLINGRATE=16samplespersecondcollapsedinto1-minuteepochsq Placement:bothankles;non-dominantwrist

ControlCondi/ons
" ChildrenwereinstructedtousetheMicrosog®Paintprogramforfiveconsecu/veminutesbothpriorto(C1)andager(C2)comple/ngtheVSandPHtasksduringfourconsecu/veSaturdayassessmentsessions.
" ThePaintprogramservedaspreandpostcondi/onstocontrolforpoten/alwithin-dayfluctua/onsinaUen/onandfa/gueeffects,andbecauseitrequiresnostorageorCEprocessing
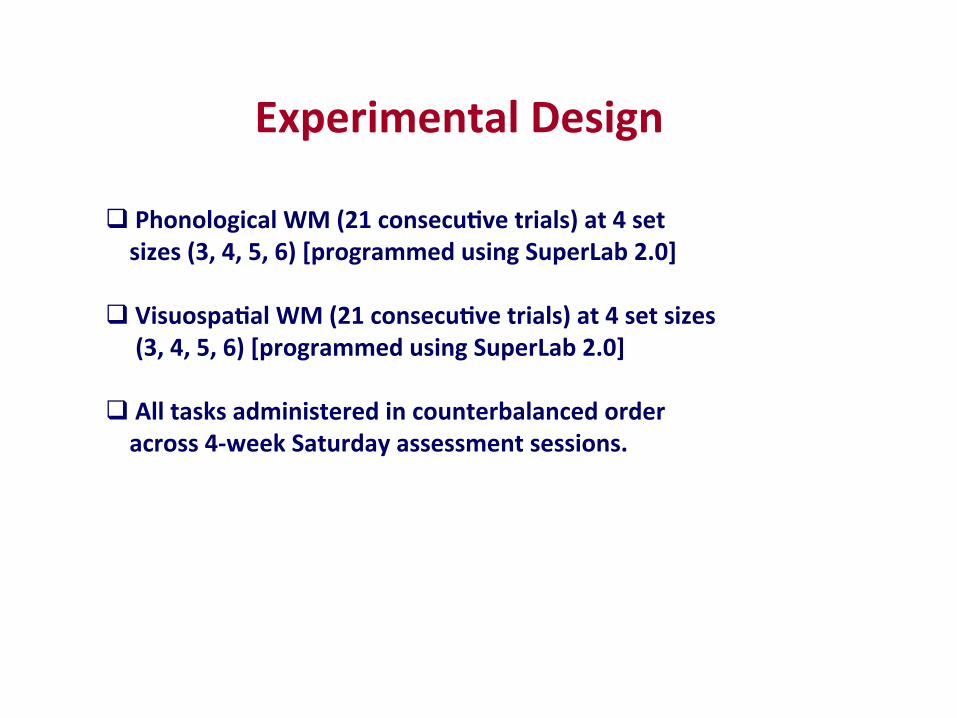
ExperimentalDesignq PhonologicalWM(21consecu%vetrials)at4setsizes(3,4,5,6)[programmedusingSuperLab2.0]q Visuospa%alWM(21consecu%vetrials)at4setsizes(3,4,5,6)[programmedusingSuperLab2.0]q Alltasksadministeredincounterbalancedorderacross4-weekSaturdayassessmentsessions.

PowerAnalysis
• An average effect size (ES) of 0.72 was calculated from two studies providing actigraph means and SDs for children with ADHD and typically developing (TD) children during laboratory tasks (Dane, Schachar, & Tannock, 2000; Halperin et al., 1992).
• GPower software version 3.0.5 (Faul, Erdfelder, Lang, & Buchner, 2007) was used to determine needed sample size using this ES, with power set to .80 as recommended by Cohen (1992).
• For an ES of 0.72, α = .05, power (1 – β) = .80, 2 groups, and 6 repetitions (C1, set sizes 3-6, C2 as described below), 18 total subjects are needed for a repeated measures ANOVA to detect differences and reliably reject H0.
• 23 total children participated in the study

q Ifac%vitylevelisfunc%onallyrelatedtoPH/VSsubsidiarysystemprocesses,wewouldexpectmovementtovarysystema%callyasgreaterdemandsareimposedonthestorage/rehearsalsystems.q Ifac%vitylevelisfunc%onallyrelatedtoCentralExecu%veprocesses,wewouldexpectmovementtoincreasefromcontrol(minimalCEorstoragedemands)toWMdemandcondi%ons,butnotvarybetweensetsizecondi%onsbecausenoaddi%onaldemandsareplacedontheCEwhenonlythenumberofs%muliincrease(i.e.,noaddi%onalprocessingdemandsareimposed).
PrimaryHypothesis
C3456CSetSize
C3456CSetSize
0
5000
10000
15000
20000
25000
30000
35000
40000
45000
50000
C1 PH3 PH4 PH5 PH6 C2
Activ
ityLe
vel(PIM)
ExperimentalConditions
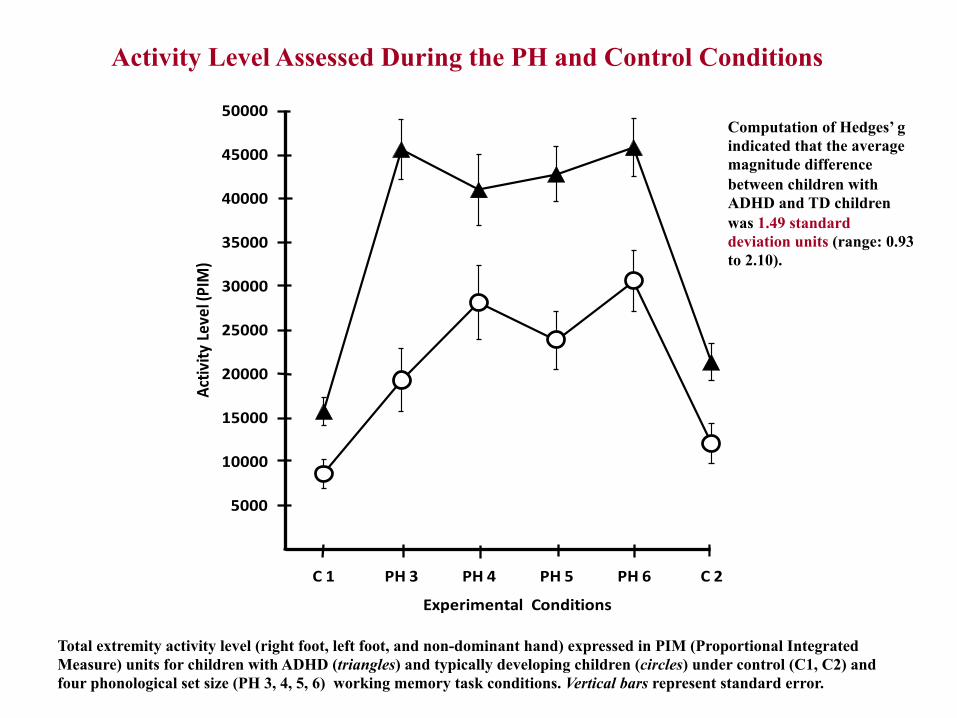
Activity Level Assessed During the PH and Control Conditions
Total extremity activity level (right foot, left foot, and non-dominant hand) expressed in PIM (Proportional Integrated Measure) units for children with ADHD (triangles) and typically developing children (circles) under control (C1, C2) and four phonological set size (PH 3, 4, 5, 6) working memory task conditions. Vertical bars represent standard error.
Computation of Hedges’ g indicated that the average magnitude difference between children with ADHD and TD children was 1.49 standard deviation units (range: 0.93 to 2.10).

0
5000
10000
15000
20000
25000
30000
35000
40000
45000
50000
C1 VS3 VS4 VS5 VS6 C2
Activ
ityLevel(P
IM)
ExperimentalConditions
Activity Level Assessed During the VS and Control Conditions
Total extremity activity level (right foot, left foot, and non-dominant hand) expressed in PIM (Proportional Integrated Measure) units for children with ADHD (triangles) and typically developing children (circles) under control (C1, C2) and four visuospatial set size (VS 3, 4, 5, 6) working memory task conditions. Vertical bars represent standard error.
Hedges’ g effect size indicated that the average magnitude difference in activity level between children with ADHD and TD children during visuospatial WM tasks was 1.83 standard deviation units (range=1.47 to 2.67).

PH3 VS3
PH4 VS4
PH5 VS5
PH6 VS6
CE
CE
CE
PH Storage/Rehearsal Performance
Composite Score
VS Storage/Rehearsal Performance
Composite Score
CE Performance Composite Score
STEP 1: PH, VS, and CE
Performance Composite Scores CE

PH3Storage/Rehearsal
PH3Ac%vityLevel
Ac%vityleveldirectlyrelatedtoPHStorage/Rehearsal
Ac%vityleveldirectlyrelatedtoVSStorage/Rehearsalfunc%oning
STEP 2: Activity Level Directly Related to PH and VS
Storage/Rehearsal Functioning
PH4Storage/Rehearsal
PH4Ac%vityLevel
PH5Storage/Rehearsal
PH5Ac%vityLevel
VS3Storage/Rehearsal
VS3Ac%vityLevel
VS3Storage/Rehearsal
VS3Ac%vityLevel
VS3Storage/Rehearsal
VS3Ac%vityLevel
VS3Storage/Rehearsal
VS3Ac%vityLevel
PH6Storage/Rehearsal
PH6Ac%vityLevel
Results indicated that PH functioning was NOT a significant contributor to
objectively measured activity level (average R2 = .10; values ranged from .06
to .21 and were all non-significant with one exception).
Results indicated that VS functioning was NOT a significant contributor to
objectively measured activity level (average R2 = .07; values ranged from less
than .001 to .14 and were all non-significant).

CE3VS3
Ac%vityLevel
CE4VS4
Ac%vityLevel
CE5VS5
Ac%vityLevel
Activity level during the PH task that is directly related to CE functioning
CE3PH3
Ac%vityLevel
CE4PH4
Ac%vityLevel
CE5PH5
Ac%vityLevel
CE6PH6
Ac%vityLevel
Activity level during the VS task that is directly related to CE functioning
STEP 3: Activity Level Directly Related
to CE Functioning
CE6VS5
Ac%vityLevel
Results indicated that CE functioning WAS A SIGNIFICANT CONTRIBUTOR
of objectively measured activity level (average R2 = .32; values ranged from .17
to .61; all p ≤ .04).
An independent samples t-test on the derived CE-activity level variable
indicated a significant between-group difference, t(21)=7.54, p<0.0005, with children with ADHD evincing higher
rates of activity directly associated with CE functioning relative to TD children.
Hedges’ g effect size indicated that the average magnitude difference between children with ADHD and TD children
was 3.03 standard deviation units (SE=0.60).

0
5000
10000
15000
20000
25000
30000
35000
40000
45000
50000
C1 PH3 PH4 PH5 PH6 C2
ActivityLevel(PIM)
ExperimentalConditions
Activity Level Assessed During the PH and Control Conditions
Total extremity activity level (right foot, left foot, and non-dominant hand) expressed in PIM (Proportional Integrated Measure) units for children with ADHD (triangles) and typically developing children (circles) under control (C1, C2) and four phonological set size (PH 3, 4, 5, 6) working memory task conditions. Vertical bars represent standard error.

C1Ac%vityLevel
CEVariable
C2Ac%vityLevel
CEVariable
STEP 4: Activity Level Assessed During the
Control Conditions that is unrelated to CE Functioning
The 2 (group: ADHD, TD) by 2 (condition: C1, C2) Mixed-
model ANOVA was non-significant for group, condition,
and the group by condition interaction (all p ≥ .52),
indicating that children with ADHD were not ubiquitously more motorically active than typically developing children during the clinical assessment
after accounting for task-related WM demands.
Hedges’ g effect size indicated that the average magnitude difference between children
with ADHD and TD children was 0.20 standard deviation
units (SE=0.29), with a confidence interval that
included 0.0.

Video examples of children while performing the phonological and
visuospatial task

Control Condition

FindingsSummaryv Allchildrenaresignificantlymoreac%vewhenengageintasksrequiringworkingmemory.v ChildrenwithADHDaresignificantlymoreac%vethanTDswhenengagedintasksrequiringWM.v ChildrenwithADHDarenotsignificantlymoreac%vethantypicallydevelopingchildrenasercontrollingfortheinfluenceofWM[notubiquitouslyhyperac%ve]v CentralExecu%vefunc%oning(notstorage/rehearsal)isfunc%onallyrelatedtochildren’sac%vitylevel.v Differencesinchildren’sac%vitylevelduringWMtaskmayreflectunderlyingdifferencesinarousal.

BiologicalInfluences(e.g.,gene/cs)
NeurobiologicalSubstrate
Environmental/Cogni/veDemands
(CoreFeature)WorkingMemory
Deficits(AssociatedFeaturesand
Outcomes)Impaired• Cogni/veTestPerformance• AcademicAchievement• SocialSkills• Organiza/onalSkills• ClassroomDeportment• DelayAversion(SecondaryFeatures)
Ina"en%venessHyperac/vityImpulsivity
WorkingMemoryModelofADHD
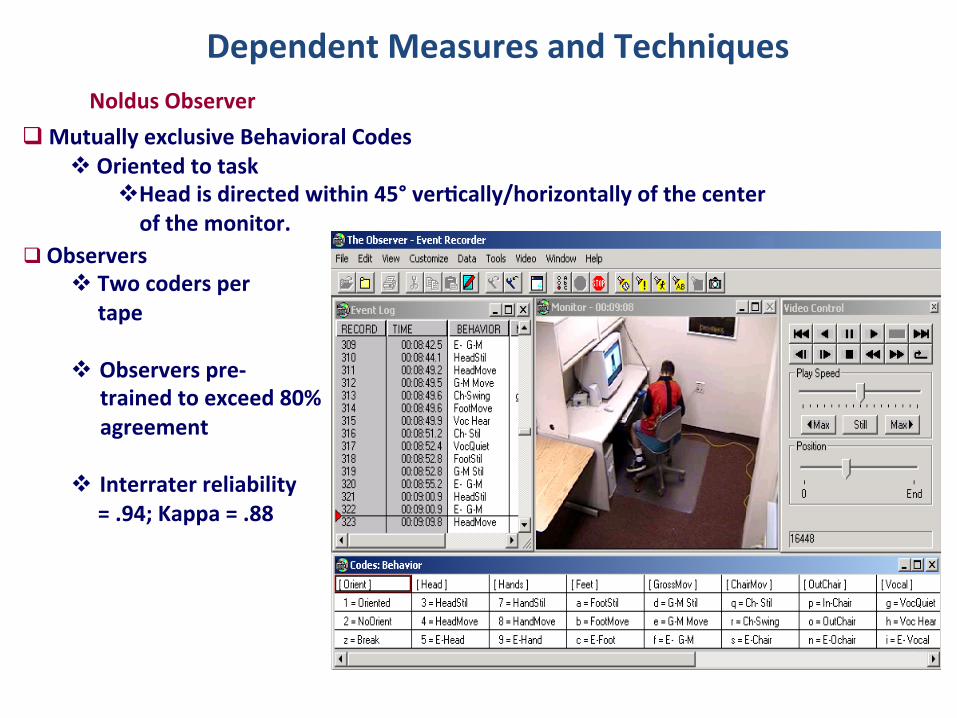
DependentMeasuresandTechniquesq MutuallyexclusiveBehavioralCodes
v Orientedtotaskv Headisdirectedwithin45°ver%cally/horizontallyofthecenterofthemonitor.
q Observersv Twocoderspertapev Observerspre-
trainedtoexceed80%agreement
v Interraterreliability=.94;Kappa=.88
NoldusObserver

Poweranalysis
• GPower3.0.5(Fauletal.,2007)• Power=.80(Cohen,1992)• ES=1.4(Kofleretal.,2008)• 2groups(ADHD,TDC)• 6repe//ons(C1,setsizes3-6,C2)• NeededN=12
– CurrentstudyN=29

Sampleanddemographicvariables
XX X

IQasacovariateofWM• Sharesignificantvariance(r=.47to.90)
– Ackermanetal.,2005;Colometal.,2005;Engleetal.,1999
• WM=1of4factorsonIQtest– WMI-FSIQ:r=.76(Wechsler,2003)
• r=.40to.56withPSI,PRI,&VCI
• Latentvariableanalysis– Regression:CE,phonologicalS/R,andvisuospa%alS/RvarianceremovedfromFSIQ(R2=.31,p=.02)
• ResidualFSIQ(IQunrelatedtoWM)
– ADHD=TDC(p=.92)

Working Memory and Children’s Inattentive behavior
Hypotheses:Ina"en%venessmaybeassociatedwithanyofthefollowingdeficiencies:I. DeficientCEprocesses[internalfocusofa"en%on]
II. Exceedingchild’sstoragecapacity[STS]
III. DeficienciesinboththeCEandPH/VSstoragecapacityIV. Ubiquitousina"en%venessunrelatedtoWMprocesses

ExperimentalDesignq PhonologicalWM(21consecu%vetrials)at4setsizes(3,4,5,6)[programmedusingSuperLab2.0]q Visuospa%alWM(21consecu%vetrials)at4setsizes(3,4,5,6)[programmedusingSuperLab2.0]q Alltasksadministeredincounterbalancedorderacross4-weekSaturdayassessmentsessions.q Controlcondi%ons(C-1,C-2):ChildrenusedthePaintProgramtheini%alandlastcondi%onforeachsession.

TierI:AUen/vebehaviorandphonologicalmemoryload
0
1
2
3
4
5
640
50
60
70
80
90
100
ADHD%Oriented
TD%Oriented
ADHDPerformance
TDPerformance
50
100
90
80
70
60
C1 PH3 PH4 PH5 PH6 C2
0
1
2
3
4
5
Percen
tOrie
nted
S%muliIncorrectPerTrial
• Group,setsize,andgroupxsetsize:allp<.0005• Posthocs:
• TDC>ADHDacrossallcondi/ons(allp≤.009)• ADHD:Pre=Post>3=4>5=6• TDC:Pre=Post>3=4=5>6• Pre=Post(p≥.18)• Hedges’g=1.55(SE=0.42)
76%[24%off-task]

Typically Developing Children
75% 88%
ADHD Children
X +1 SD-1 SD
Average Percent On-task
Table 2. Mean Off-task Rates, Standard Difference Scores, and Effect Sizes in Children with ADHD and Typically Developing Children
Study
ADHD % Off-task
M (SD)
Control % Off-task
M (SD)
Std. Diff. Scores (%)
Hedges’ g Effect Sizes (Std. Error)
Werry & Quay (1969) 46.3 (12.8) 23 (15.4) 50.3 2.09 (0.53) Forness & Esveldt (1975) 47.0 (16.5) 34 (12.4) 27.7 0.88 (0.30) Shecket & Shecket (1976) NR NR NR 0.004
Abikoff et al. (1977) 13.1 (10.0) 2.1 (2.6) 84.2 1.50 (0.21) Campbell et al. (1978) 16.73 (15.15) 12.41 (10.88) 25.8 0.32 (0.35) Jacob et al. (1978) 15.8 (NR) 10.5 (NR) 33.3 1.41 (0.53)3
Klein & Young (1979) 39.8 (9.0) 26.6 (5.0) 33.1 1.78 (0.40) Abikoff et al. (1980) 15.1 (23.4) 4.1 (7.8) 72.8 0.62 (0.19) Zentall (1980) 15.0 (NR) 7.1 (NR) 52.2 0.45 (0.25) Abikoff & Gittelman (1984) 17.4 (12.3) 3.5 (6.6) 79.7 1.39 (0.29) Abikoff & Gittelman (1985) 15.7 (10.4) 2.5 (4.6) 84.1 1.71 (0.31) Atkins et al. (1985) NR NR NR 0.59 (0.30)1
Book & Skeen (1987) 5.11 (4.82) 0.78 (1.47) 84.7 1.21 (0.17) Cunningham & Siegel (1987) 33.0 (NR) 26.4 (NR) 19.9 0.51 (0.26)2
Roberts (1990) 39.5 (18.8) 12.9 (20.9) 67.3 1.31 (0.39) DuPaul & Rapport (1993) 44.26 (16.56) 19.72 (11.56) 55.4 1.66 (0.31) Lett & Kamphaus (1997) 18.3 (16.5) 12.7 (12.7) 30.6 0.36 (0.29) Nolan & Gadow (1997) 30.5 (15.9) 13.3 (8.3) 56.4 1.34 (0.27) DuPaul et al. (1998) 33.0 (19.2) 9.5 (11.9) 71.2 1.31 (0.45) Skansgaard & Burns (1998) 23.8 (10.3) 4.8 (6.1) 79.8 2.23 (0.60) Solanto et al. (2001) NR NR NR 0.58 (0.19)5
Abikoff et al. (2002) 10.6 (24.0) 3.3 (13.2) 68.8 0.38 (0.06) Lauth & Mackowiak (2004) 83.0 (12.0) 70.0 (13.0) 15.7 1.03 (0.20) Column M (SD) = 28.15 (18.28) 14.96 (16.47) 54.65 (23.71) 0.71 (0.04)6
Bestcasees/ma/on:ES=1.40
Kofler,Rapport,&Alderson(2008).Quan%fyingADHDclassroomina"en%veness,itsmoderators,andvariability:ameta-analy%creview.JournalofChildPsychology&Psychiatry49,59–69.
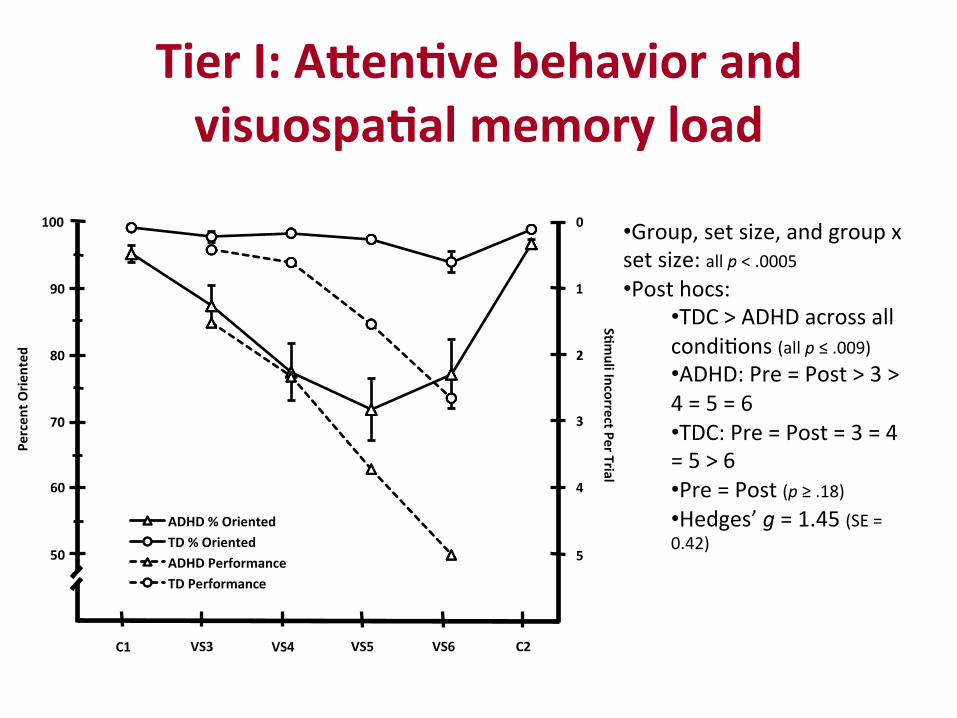
TierI:A"en%vebehaviorandvisuospa%almemoryload
0
1
2
3
4
5
640
50
60
70
80
90
100
ADHD%OrientedTD%OrientedADHDPerformanceTDPerformance
50
100
90
80
70
60
C1 VS3 VS4 VS5 VS6 C2
0
1
2
3
4
5
Percen
tOrie
nted
S%muliIncorrectPerTrial
• Group,setsize,andgroupxsetsize:allp<.0005• Posthocs:
• TDC>ADHDacrossallcondi/ons(allp≤.009)• ADHD:Pre=Post>3>4=5=6• TDC:Pre=Post=3=4=5>6• Pre=Post(p≥.18)• Hedges’g=1.45(SE=0.42)

WMComponentsandA"en%veBehavior[2(group)x3(condi/ons)mixed-modelANOVA]
ADHD % Oriented
TD % Oriented
100
90
80
70
Control A/B WM Span Above WM Span
Perc
ent O
rien
ted
Phonological 100
90
80
70
Control A/B Above
Visuospatial
100
90
80
70
Control A/B WM Span Above WM Span CE:CE<CE=CE
S/R:S/R≈S/R<S/R(S/RNotOverwhelmed)(S/ROverwhelmed)
16%
2.6%
9%
9%

0.0
0.5
1.0
1.5
2.0
2.5
1.9
1.1
2.3
1.5
Hedges'gES
MagnitudeofWorkingMemoryDeficitsinADHD
PHWM(Rapportetal.,2008)
PHWMAgerAccoun/ngforInaUen/veBehavior
VSWM(Rapportetal.,2008)
VSWMAgerAccoun/ngforInaUen/veBehavior
PHWM VSWM

0
0.5
1
1.5
2
2.5
1.6
0.0
1.5
0.0
Hedges'gES
MagnitudeofA"en%onDeficitsinADHDAUen/onDuringPHTasks
AUen/onDuringPHTasksAgerAccoun/ngforWMDeficits
AUen/onDuringVSWMTasks
AUen/onDuringVSTasksAgerAccoun/ngforWMDeficits
PHAUen/on
VSAUen/on

v Ini%alina"en%venessinADHDreflectsunderlyingdeficitsinCEprocesses–mostlikelytheinternalfocusofa"en%onv ExceedingWMstoragecapacityresultsinsimilarratesofina"en%venessinchildrenwithADHDandtypicallydevelopingchildrenv WMdeficitsremainaseraccoun%ngforbetween-groupdifferencesinina"en%veness.v Between-groupina"en%venessdifferencesarenolongersignificantaseraccoun%ngforWMdifferences
Summary

Spoken Output
Visuospatial Analysis
Visuospatial
STS
Right hemisphere
Visuospatial output buffer
Right premotor cortex
Rehearsal Process
Motor Output
Auditory Input
Phonological Analysis
Phonological
STS
Inferior parietal lobe
Phonological output buffer
Broca’s area-premotor cortex
Rehearsal Process
Central Executive
Visual analysis &
STS
Orthographic to
phonological recoding
Visual Input Visual Input
DeficientWMsystems/subsidiarysystems&processes
??
??
yes
??
??
Internal Focus
LTM interaction
Divided attention
??
no
ES=.55 ES=.89
ES=2.76
??
yesyes
yes

BiologicalInfluences(e.g.,gene/cs)
NeurobiologicalSubstrate
Environmental/Cogni/veDemands
(CoreFeature)WorkingMemory
Deficits(AssociatedFeaturesand
Outcomes)• Cogni%veTestPerformance• ImprovedLearning• AcademicAchievement• SocialSkills**• Organiza%onalSkills• ClassroomDeportment• BehavioralInhibi%on(SecondaryFeatures)
Ina"en%venessHyperac%vityImpulsivity**
Func%onalWorkingMemoryModelofADHDRapport, M.D., Chung, K.M., Shore, G., & Isaacs, P. (2001).JournalofClinicalChildPsychology–SpecialEdiOon,30,48-58.
D1receptor
Alderson et al. (2010)

InsertPPslidesofImpulsivityandSocialSkillDeficits

Consolida%on–theprocessbywhichshort-termmemoriesbecomelong-termmemories
Hippocampus:centraltotheconsolida%onofdeclara%vememoriesbasedontheseminalstudiesbyScovilleandMiller(1957;JNeurochem)followingthebilateralmedialtemporallobotomiesthatremovedthe‘H.M.’s”hippocampi,theparahippocampalcortex,andpartsofhisamygdala.
v H.M.losttheabilitytoformnewdeclara%vememoriesv Consolida%onrequires3interrelatedprocesses:
1. S%mula%onofglutamatereceptors[note:whichcanbeblockedbyinfusingglutamatereceptorantagonistsintothehippocampus]
2. Proteinsynthesis3. Genetranscrip%on–processoftransferringDNAsequence
informa%onintoRNAinforma%on[note:proteinsynthesis&genetranscrip%onarenotneededforSTM]
v LTMprocesscanbetestedata3-hourintervaltoensureconsolida%on
[Lombroso&Ogren,2008;JAmAcadChildAdolescentPsychiatry,47]


ADHD IQ E .42
E .50 Del
Agg
.87*
.91* CD .67* -.28*
-.23*
Scholastic Achievement
Language .50 E
E
E
.48
.42 Reading
Math .91 .88*
.87*
D
.83
-.26* .43* -.02 -.21(.716) 1.47(.186) -2.25(.598)
31%
Rapport,Scanlan&Denney(1999)J.ofChildPsychiatryandPsychology
N=325childrenSA=SATperformanceCD=TRFconductdisorderproblems

Visuospa%alsketchpad
EpisodicBuffer
Phonologicalloop
CentralExecu%ve
FocusedA"en%onDividedA"en%on
Fluidsystems
Crystallizedsystems
VisualSeman%cs
EpisodicLTM Language
Orthographicconversion
Spokenoutput
LoopLoop
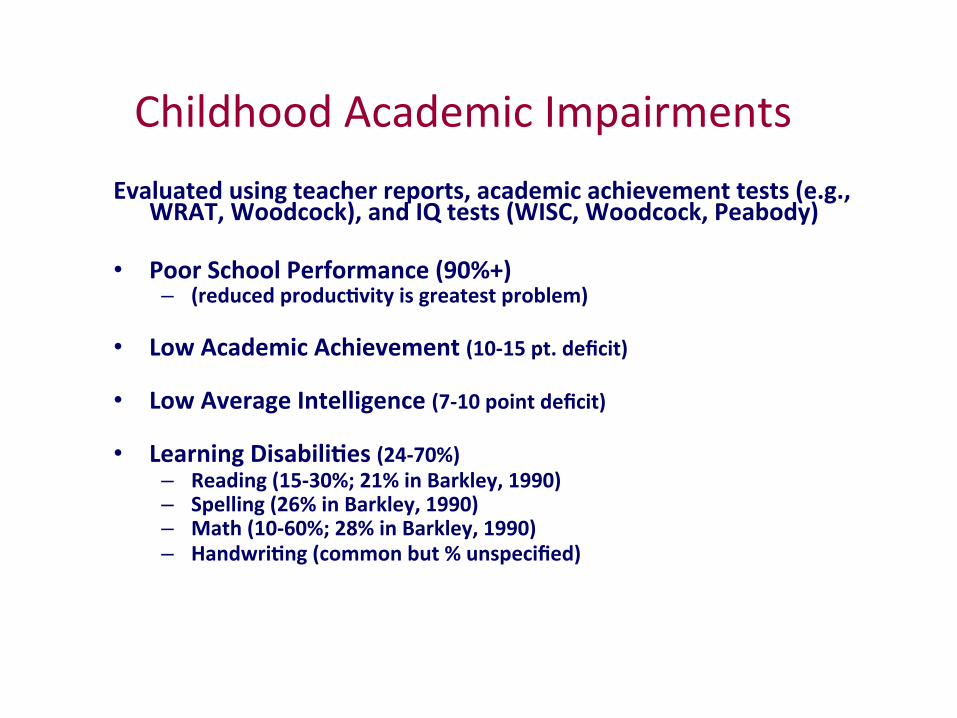
ChildhoodAcademicImpairmentsEvaluatedusingteacherreports,academicachievementtests(e.g.,
WRAT,Woodcock),andIQtests(WISC,Woodcock,Peabody)• PoorSchoolPerformance(90%+)
– (reducedproduc%vityisgreatestproblem)
• LowAcademicAchievement(10-15pt.deficit)• LowAverageIntelligence(7-10pointdeficit)• LearningDisabili%es(24-70%)
– Reading(15-30%;21%inBarkley,1990)– Spelling(26%inBarkley,1990)– Math(10-60%;28%inBarkley,1990)– Handwri%ng(commonbut%unspecified)

Characteris/csofReliableTests,Tasks,andParadigmsUsedtoDifferen/ateChildrenwithADHDfromNormalControls[n=439taskcomparisonsin142studies]Rapport,M.D.,Chung,K.M.,Shore,G.,Denney,C.B.,&Isaacs,P.(2000).JournalofClinicalChildPsychology–SpecialEdiOon,29,555-568.WorkingMemory Response Self-(S)/
TimeSubvocal S%mulus Other-(O)EffectTask Recogni%on RecallParameterSpeechBuffer Present PacedSizeReliableTasks:CPT yes no sormsecyesyes noO 0.85Go/No-Go yes no msecyesyes no O 0.31 StopSignal yes no msecyesyes no O 1.03VisMem(recall)no yes syesyes no S/O 0.78
UnreliableTasks:BostonNamingno yes s-minnono yes S 0.65Fingertapping no no s-minnono yes S 0.27Language no yes minnono no S 0.47Pegboard yes no s-minnono yes S 0.37ReyAVLT no yes s-minyesno no S n/aTowerofLondonno yes s-minnono yes S n/aTrailmaking yes no minnono yes S 0.55Visualmotor no no minnono yes S 0.30WRAML yes yes s-minyesno no S 0.35Note:AVLT=AuditoryVerbalLearningTest;CPT=Con%nuousPerformanceTest;WRAML=WideRangeAssessmentforMemoryandLearning;n/a=unabletocalculateeffectsizeowingtoinsufficientsta%s%calinforma%on.Rapport,M.D.,Chung,K.,&Shore,C.(2000).JournalofClinicalChildPsychology,29,555-568.[basedon439taskcomparisonsreportedin142independentstudies]
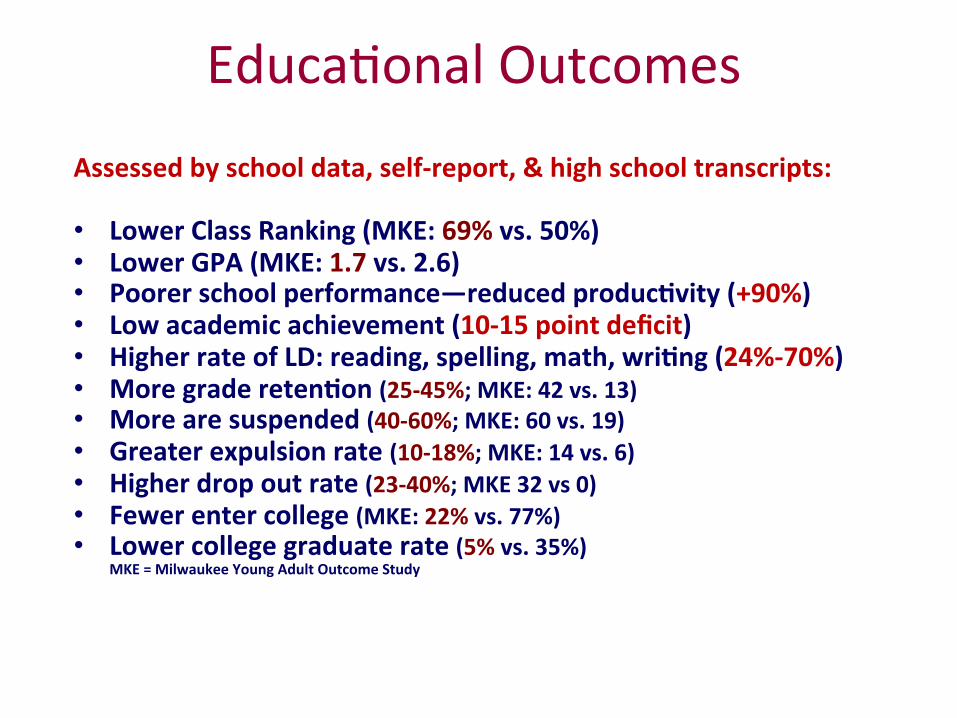
Educa/onalOutcomes
Assessedbyschooldata,self-report,&highschooltranscripts:• LowerClassRanking(MKE:69%vs.50%)• LowerGPA(MKE:1.7vs.2.6)• Poorerschoolperformance—reducedproduc%vity(+90%)• Lowacademicachievement(10-15pointdeficit)• HigherrateofLD:reading,spelling,math,wri%ng(24%-70%)• Moregradereten%on(25-45%;MKE:42vs.13)• Morearesuspended(40-60%;MKE:60vs.19)• Greaterexpulsionrate(10-18%;MKE:14vs.6)• Higherdropoutrate(23-40%;MKE32vs0)• Fewerentercollege(MKE:22%vs.77%)• Lowercollegegraduaterate(5%vs.35%)
MKE=MilwaukeeYoungAdultOutcomeStudy

What is Working Memory?
¤ Working memory is a limited capacity system that enables individuals to store briefly and process information (Baddeley, 2007).
http://usablealgebra.landmark.edu/wp-content/uploads/2008/12/working-memory-2.gif

Phonological output buffer
Broca’s area-premotor cortex
PhonologicalWorkingMemory
Auditory Input
Phonological Analysis
Phonological
STS
Inferior parietal lobe
Rehearsal Process
Central Executive
Visual analysis & STS
Orthographic to phonological
recoding
Visual Input
Spoken Output
h"p://docsbrainblocks.com/images/dyslexia_1.jpg
Baddeley,2007

Phonological
STS
Inferior parietal lobe
Phonological output buffer
Broca’s area-premotor cortex
Visual analysis &
STS
Orthographic to
phonological recoding
Visual Input
Rehearsal Process
Requiresshort-termstoragebutnoprocessing–limited
demandontheCEAr%culatory
Control
Loop
Spoken Output

What components of the WM Phonological Store are deficient?
Child must hold 2, 4, or 6 single syllable words under 3 distinct recall conditions: Recall conditions: 3-seconds 12-seconds 21-seconds
2 words 2 words 2 words 4 words 4 words 4 words 6 words 6 words 6 words
[Word lists and recall conditions completely counterbalanced over 4 sessions 1-week apart]

What components of the WM Phonological Store are deficient?
Analyses: ü Examine word list effect for ADHD & TD children under 3-sec [minimal delay condition – WM store can hold information for 2- 3-s without invoking the rehearsal mechanism] – results indicate whether storage capacity is limited in children with ADHD. ü Select the longest word list a child can successfully recall at 50% or greater to establish individual word span (Conway et al., 2005). ü Examine potential rehearsal mechanism deficiencies by comparing each child at his established span across the 3 recall (3-s, 12-s, 24-s) conditions.

Presentation Phase
Storage/Rehearsal Recall Phase
2-Words 4-Words 6-Words
3-secondsdelay
12-secondsdelay
21-secondsdelay
Spoken Output
Auditory Input
Phonological Analysis
Phonological
STS
Inferior parietal lobe
Phonological output buffer
Broca’s area-premotor cortex
Rehearsal Process
Central Executive
Phonological Memory Task

4
2
1
3
042 6
S%muli(words)
80
60
50
70
40
123 21Seconds
0
ADHDTD
S%muliR
ecalledCo
rrectly
%Correct
Eachchildisperformingattheirestablishedmemoryspan3setsizecondi%onsat3-srecall
ADHDTD
ns
ns
**
**
****
~57%storagecapacitydeficit
ADHDslose~30%ofwordslearned
TDslose~10%ofwordslearned

CORE FEATURE: WORKING MEMORY
INATTENTION HYPERACTIVITY IMPULSIVITY
Biological Influences, e.g., genetics
NEUROBIOLOGICAL SUBSTRATE
CORE FEATURES: INATTENTION HYPERACTIVITY IMPULSIVITY
SECONDARY FEATURES
DSM-IV CLINICAL MODEL OF ADHD
ENVIRONMENTAL/ COGNITIVE DEMANDS
WORKING MEMORY

BiologicalInfluences(e.g.,gene/cs)
NeurobiologicalSubstrate
Environmental/Cogni/veDemands
(CoreFeature)WorkingMemory
Deficits(AssociatedFeatures&Outcomes:Impaired• Learning• Cogni/veTestPerformance• AcademicAchievement• SocialSkills• Organiza/onalSkills• ClassroomDeportment• DelayAversion(SecondaryFeatures)
InaUen/venessHyperac/vityImpulsivity
Func%onalWorkingMemoryModelofADHDRapport, M.D., Chung, K.M., Shore, G., & Isaacs, P. (2001).JournalofClinicalChildPsychology–SpecialEdiOon,30,48-58.
?