AEDC-TR-79-98 ARCHIVE COPY IDO NOT LOAN · AEDC-TR-79-98 ARCHIVE COPY IDO NOT LOAN m ~.~r t~ o_ ~nJ...
26
AEDC-TR-79-98 ARCHIVE COPY IDO NOT LOAN m ~.~r t~ o_ ~ n J ~m Development and Testing of a Resonance Source Gas Filter Correlation Spectrometer C. J. Fisher and R. J. Bryson ARO, Inc. May 1980 Final Report for Period August - September 1979 Approved for public release; distribution unlimited. ARNOLD ENGINEERINGDEVELOPMENTCENTER ARNOLD AIR FORCESTATION, TENNESSEE AIR FORCESYSTEMS COMMAND UNITED STATES AIR FORCE
Transcript of AEDC-TR-79-98 ARCHIVE COPY IDO NOT LOAN · AEDC-TR-79-98 ARCHIVE COPY IDO NOT LOAN m ~.~r t~ o_ ~nJ...

AEDC-TR-79-98 ARCHIVE COPY IDO NOT LOAN
m
~ . ~ r
t ~
o_
~ n J
~ m
Development and Testing of a Resonance Source Gas Filter Correlation
Spectrometer
C. J. Fisher and R. J. Bryson ARO, Inc.
May 1980
Final Report for Period August - September 1979
Approved for public release; distribution unlimited.
ARNOLD ENGINEERING DEVELOPMENT CENTER ARNOLD AIR FORCE STATION, TENNESSEE
AIR FORCE SYSTEMS COMMAND UNITED STATES AIR FORCE
NOTICES
When U. S. Government drawings, specifications, or other data are used for any purpose other than a definitely related Government procurement operation, the Government thereby incurs no responsibility nor any obligation whatsoever, and the fact that the Government may have formulated, furnished, or in any way supplied the said drawings, specifications, or other data, is not to be regarded by implication or otherwise, or in any manner licensing the holder or any other person or corporation, or conveying any rights or permission to manufacture, use, or sell any patented invention that may in any way be related thereto.
Qualified users may obtain copies of this report from the Defense Technical Information Center.
References to named commerical products in this report are not to be considered in any sense as an indorsement of the product by the United States Air Force or the Government.
This report has been reviewed by the Office of Public Affairs (PA) and is releasable to the National Technical Information Service (NTIS). At NTIS, it will be available to the general public, including foreign nations.
APPROVAL STATEMENT
This report has been reviewed and approved.
EULES L. HIVELY Project Manager Directorate of Technology
Approved for publication:
FOR THE COMMANDER
MARION L. LASTER Director of Technology Deputy for Operations
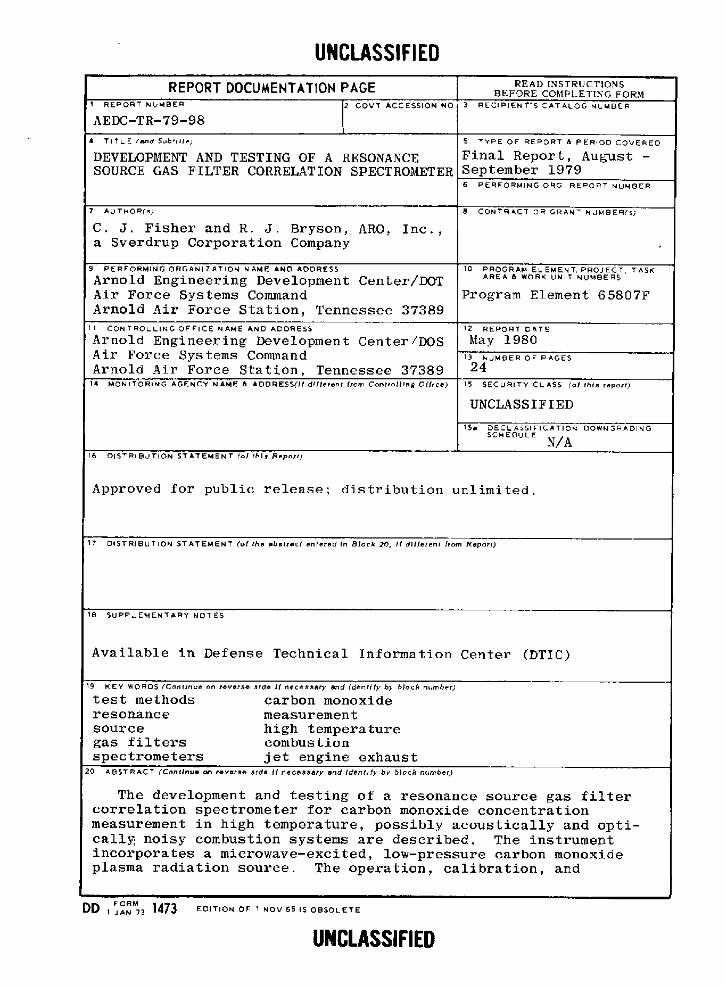
UNCLASSIFIED REPORT DOCUMENTATION PAGE READ INSTRUCTIONS
B E F O R E COMPLETING F O R M
~)ER 3 R E C I P l E N T ' S C A T A L O G N L M B E R 1 REPORT NUMBER 12 GOVT ACCESSION NO
L AEDC-TR-79-98
4 T I T L E ( ~ d Sub ' l t l e )
DEVELOPMENT AND TESTING OF A RESONANCE SOURCE GAS FILTER CORRELATION SPECTROMETER
7 A U T h O R ( s )
C. J. Fisher and R. J. Bryson, ARO, Inc., a Sverdrup Corporation Company
9 PERFORMING O R G A N I Z A T I O N NAME AND ADDRESS
Arnold Engineering Development Center/DOT Air Force Systems Command Arnold Air Force Station, Tennessee 37389
I I C O N T R O L L I N G O F F I C E NAME AND ADDRESS
Arnold Engineering Development Center/DOS Air Force Systems Command Arnold Air Force Station, Tennessee 37389
14 MONITORING AGENCY NAME & ADDRESS( I f d l l l e r e n t i ror. Con t ro l t t n~ Olhce)
S T Y P E OF REPORT 8 P E R ' D O C O V E R E D
Final Report, August - September 1979 6 PERFORMING ORG REPOC~T NUMBER
8 C O N T R A C T OR G R A N - N J M B E R ( s )
10 PROGRAM ELEMENT, P R O J E C T . TASK AREA & WORK UNIT NUMBERS
Program Element 65807F
t2 REPORT D A T E
May 1980 13 N J M B E R O F PAGES
24 15 S E C U R I T Y CLASS (o f th is repor t )
UNCLASSIFIED
1Sa D E C L A S S I F I C A T I O N DOWNGRADING SCHEDULE N/A
16 O I S ~ B I B J T I D N S T A T E M E N T ( o l t~Js Rept)ttJ
A p p r o v e d f o r p u b l i c r e l e a s e ; d i s t r i b u t i o n u n l i m i t e d .
17 D I S T R I B U T I O N S T A T E M E N T ( o f the a b s t r a c t e n t e r e d in B l o c k 20, I f d i f f e ren t from Repor t )
18 S U P P = E M E N T A R y NOTES
Available in Defense Technical Information Center (DTIC)
19 K EY WORDS (Con t inue on reve rse arde JI n e c e s s a ~ ~ d I d e n t t ~ b) b rock number)
test methods carbon monoxide resonance measurement source high temperature gas filters combustion spectrometers jet engine exhaust
20 A B S T R A C T ( C o n t i n u e on r e v e r s e .~tde H necessary and I den t i f y bv b l ock number)
The development and testing of a resonance source gas filter correlation spectrometer for carbon monoxide concentration measurement in high temperature, possibly acoustically and opti- call~ noisy combustion systems are described. The instrument incorporates a microwave-excited, low-pressure carbon monoxide plasma radiation source. The operation, calibration, and
FORM DD, JAN 73 1473 EDIT ION OF 1 NOV 65 IS O B S O L E T E
UNCLASSIFIED

UNCLASSIFIED
20. ABSTRACT (Continued)
modeling of the instrument response as well as application to the measurement of CO concentration in the exhaust of a jet engine combustor are described. The report concludes with suggestions for the further use and development of the instru- ment.
/
A F $ C A ~ d A F S T ~ n n
UNCLASSIFIED

A E D C-T R-79-98
PREFACE
The work reported herein v, as conducted by the Arnold Engineering Development
Center (AEDC), Air Force Systems Command (AFSC). The results of the research were
obtained by ~RO, Inc., AEDC DMsion (a Sverdrup Corporation Company), operating
contractor for the AEDC, AFSC, Arnold Air Force Station, Tennessee, under ARO Project
No. P321-14. The Air Force project managcr was E. L. Hively, DOT. The data analysis was
completed on September 15, 1979, and the manuscript was submitted for publication on November 21, 1979.
The resonance source gas filter correlation spectrometer design and a substantial portion
of its construction were directed by Dr. B. Krakow before his departure from AEDC. His contributions are gratefully acknowledged.

A E DC-T R -79-98
C O N T E N T S
Page
1.0 I N T R O D U C T I O N ........................................................ 5
2.0 I N S T R U M E N T D E S C R I P T I O N A N D O P E R A T I N G P R I N C I P L E S
A N D PROCEDURES
2.1 Instrument Description ................................................ 6
2.2 Operating Principles ................................................... 1 0
2.3 Operating Procedures .................................................. 1 2
3.0 D E V E L O P M E N T A N D C A L I B R A T I O N .................................... 14
4.0 P R E L I M I N A R Y M O D E L O F T H E I N S T R U M E N T R E S P O N S E . . . . . . . . . . . . . . . 15
5.0 T E S T C E L L A P P L I C A T I O N .............................................. 19
6.0 C O N S I D E R A T I O N S FOR F U T U R E I N S T R U M E N T D E V E L O P M E N T . . . . . . . . . 21
7.0 S U M M A R Y A N D C O N C L U S I O N S ......................................... 22
R E F E R E N C E S ........................................................... 22
I I , L U S T R A T I O N S
Figure
I. R S G F C Spec t rometer Transmi t te r Unit ....................................... 6
2. R S G F C Spect rometer Receiver Unit .......................................... 7
3. R S G F C Spect rometer Electronics Package ..................................... 8
4. R S G F C Spect rometer OpticaI Schemat ic ...................................... 9
5. R S G F C Spec t rometer Source Spec t rum - Pressure, 1.32 kPa;
Input Power , 42 w ........................................................ I 1
6. CO Fundamen ta l Interference Filter Transmi t t ance Plot . . . . . . . . . . . . . . . . . . . . . . . . . 13
7. CO P Branch Interference Filter Transmi t t ance Plot . . . . . . . . . . . . . . . . . . . . . . . . . . . . . 14
8. R S G F C Spect rometer Test Cell Ca l ib r a t i on 'Curve - Path Length,
10 cm; Tempera tu re , 300 K ................................... , . . . . . . . . . . . . . . 1 7
9. Diagram o f Research Cell R-2C-1 ............................................ 20
/
T A B L E S
1. R S G F C Spec t rometer L a b o r a t o r y Cal ibra t ions ................................. ! 6
2. Test Cell Results ........................................................... "2_0

AE DC-TR-79-98
1.0 INTRODUCTION
Concentration determinations of minor gaseous species in combustion systems have been
traditionally accomplished with probe extraction techniques and conventional commercial
gas analyzers. In recent years, the ability of probe sampling to preserve the chemical identity
of the sampled gas has been seriously questioned (Refs. 1 and 2). In addition to this possible
problem, physical limitations and material problems often render the use of probe
technology impractical. For these reasons, there has been a great deal of interest in
noninterference in situ optical techniques of combustion gas diagnostics.
Instruments designed for field use detection of minor gaseous species must be highly
sensitive and specific to the species of interest and be relatively immune to the deleterious
effects of acoustical and optical noise, degradation of exposed optical components, and
particulate attenuation of signals. A resonance source gas filter correlation (RSGFC)
spectrometer has been developed to meet these requirements for CO concentration determinations behind combustor and jet and rocket engines.
Gas filter correlation spectrometers have been developed for a variety of gaseous species
measurement applications including gaseous pollutant measurements in automobile and jet engine exhausts (Refs. 3 and 4), smokestack gases (Ref. 5), and detection of gaseous
atmospheric pollutants from high altitudes (Refs. 6 and 7). The common feature of these
instruments is the correlation cell, a cell containing the gas of interest, which is periodically
placed in the optical path. Typically, a single detector is employed which is alternately
exposed to radiation which has passed through the correlation cell, the correlated radiation
beam, and then to radiation which has not. The presence of the species of interest in the
sample volume changes the ratio of the correlated to the noncorrelated radiation intensities.
The use of the correlation cell in this arrangement provides a measure of discrimination
against other species with overlapping spectra as well as continuum interferences. Other molecular spectra ("uncorrelated" spectra) and continuum interferences would be expected
to affect the two beams proportional to their intensities and hence leave the intensity, ratio unchanged.
The instrument described in this report is an absorption correlation spectrometer
incorporating a narrow line CO resonance source. Narrow line resonance radiation is much
more strongly absorbed than continuum radiation and hence is more suitable for
applications for which high sensitivity is an important design criterion. A narrow line
resonance source radiates primarily at absorption line centers and thus samples the
absorption spectrum at the points of maximum absorption. The use of a narrow line
resonance source provides the advantage of the large line center absorption coefficients seen
A E DC-T R-79-98
under very high resolution without the use of sophisticated and delicate high resolution
instrumentation.
The goals of this project were to complete the development of the RSGFC spectrometer
and test it in a research combustor test cell. These goals were accomplished. The balance of
this report consists of a description of the instrument, an account of the development and
calibration of the instrument, the development of a preliminary model of the instrument response, and a description of a test cell application and conclusions.
2.0 INSTRUMENT DESCRIPTION AND OPERATING
PRINCIPLES AND PROCEDURES
2.1 INSTRUMENT DESCRIPTION
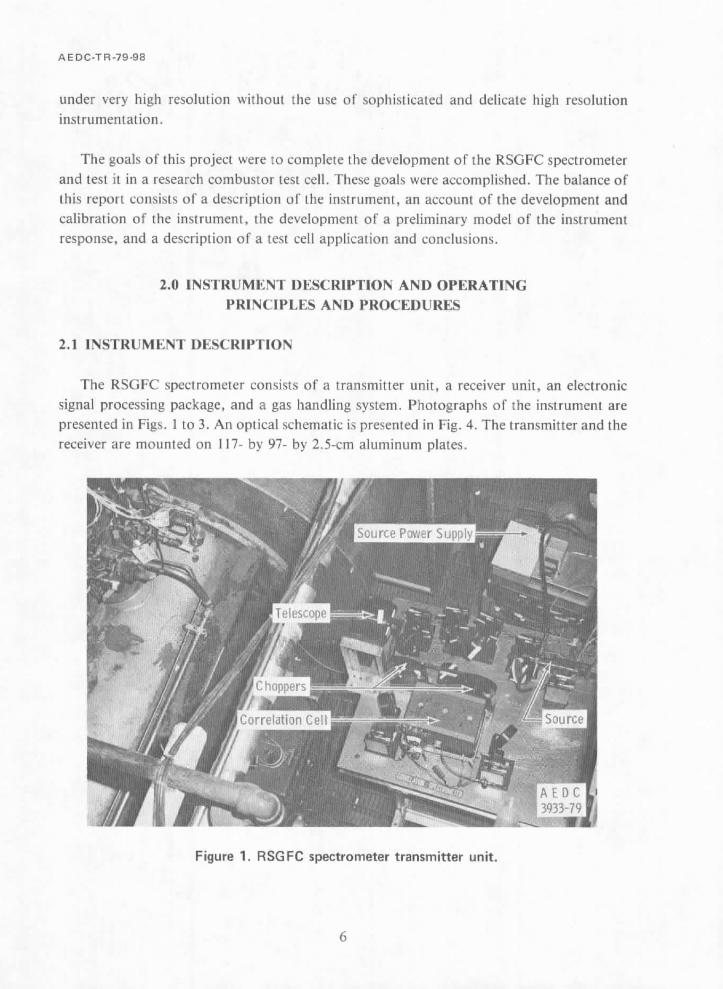
The RSGFC spectrometer consists of a transmitter unit, a receiver unit, an electronic
signal processing package, and a gas handling system. Photographs of the instrument are presented in Figs. 1 to 3. An optical schematic is presented in Fig. 4. The transmitter and the receiver are mounted on 117- by 97- by 2.5-cm aluminum plates.
Figure 1. RSGFC spectrometer transmitter unit.

A E DC-T R-79-98
Figure 2. RSGFC spectrometer receiver unit.
All concave mirrors in both the transmitter and receiver units are identical gold-coated
elliptical mirrors (M1 through M9 of Fig. 4). They are all mounted in optical orienting and translating holders equipped with five micrometer screw adjustments.
The transmitter source consists of a low-pressure flowing gas CO source tube with a
microwave antenna powered by an 85-w, 2,450-MHz power supply. The source tube is a
12-mm-OD by 12-cm-long Pyrex ® tube with gas intake and exhaust connections. It is
equipped with a 2.5-cm-diam by 3-mm-thick calcium fluoride end window.
The source beam is focused by mirror M1 on one of two mirrored choppers (CI). When
this chopper is open, the emerging beam is focused by mirror M3 at the center of the 10-cm- long by 7.5-cm-diam gas filter correlation cell. The cell, consisting of a copper body with
7.5-cm-diam by 6-mm-thick calcium fluoride windows, was filled with 720 torr of pure CO.
The beam is then refocused by mirror M4 on the second mirrored chopper. When this
chopper is open, the beam reaches mirror M6 which focuses the beam 3 cm in front of the
entrance of the 15-cm-diam cassegrainian transmitting telescope. The beam following this
route is designated the correlation cell beam.
7
A E DC-TR-79o98
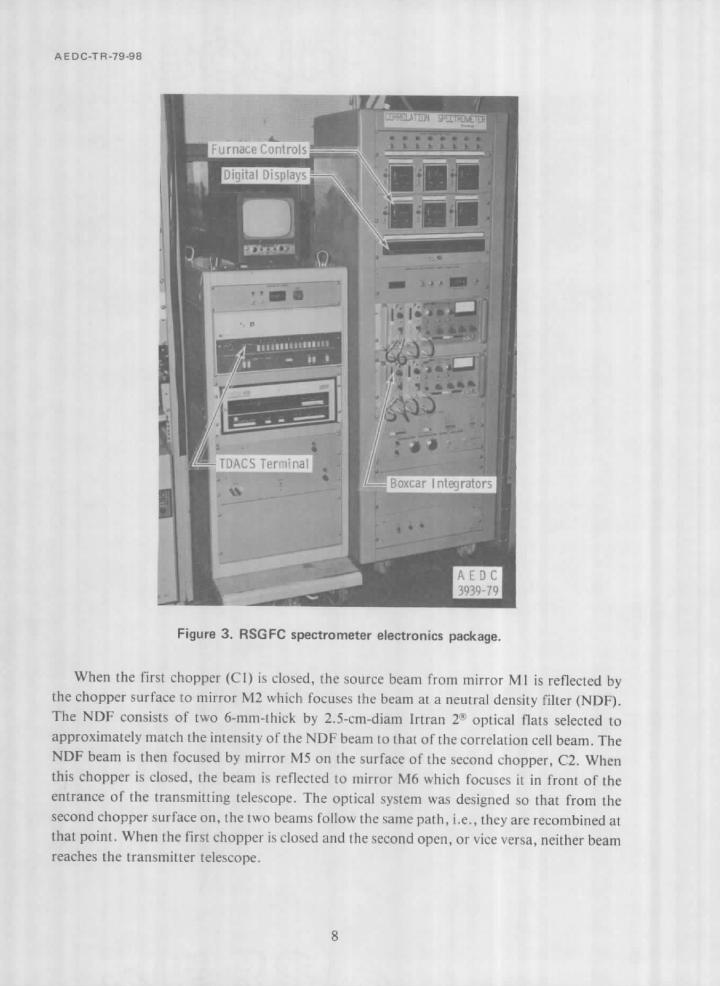
Figure 3. RSGFC spectrometer electronics package.
When the first chopper (CI) is closed, the source beam from mirror MI is reflected by the chopper surface to mirror M2 which focuses the beam at a neutral density filter (NDF).
The NDF consists of two 6-mm-thick by 2.5-cm-diam Irtran 2 ® optical fiats selected to
approximately match the intensity of the NDF beam to that of the correlation cell beam. The
NDF beam is then focused by mirror M5 on the surface of the second chopper, C2. When
this chopper is closed, the beam is reflected to mirror M6 which focuses it in front of the
entrance of the transmitting telescope. The optical system was designed so that from the
second chopper surface on, the two beams follow the same path, i.e., they are recombined at
that point. When the first chopper is closed and the second open, or vice versa, neither beam reaches the transmitter telescope.
8
AE DC-TR-79-98
The two double-bladed choppers are synchronously driven by an electric motor at
approximately 5,000 rpm by means of a timing belt-pulley system. The choppers are initially
set 45 deg out o f phase relative to each other resulting in the following sequence of intervals:
1. Both open - correlation cell beam transmitted;
2. CI closed, C2 open - source blocked;
3. Both closed - neutral density beam transmitted; and
4. Ci open, C2 closed - source blocked.
This sequence repeats about every 6 msec.
RT TT M6 MI SH
IF NDF
M5 0 M2 MI #//~MIO // C2 Cl k\
FC CC
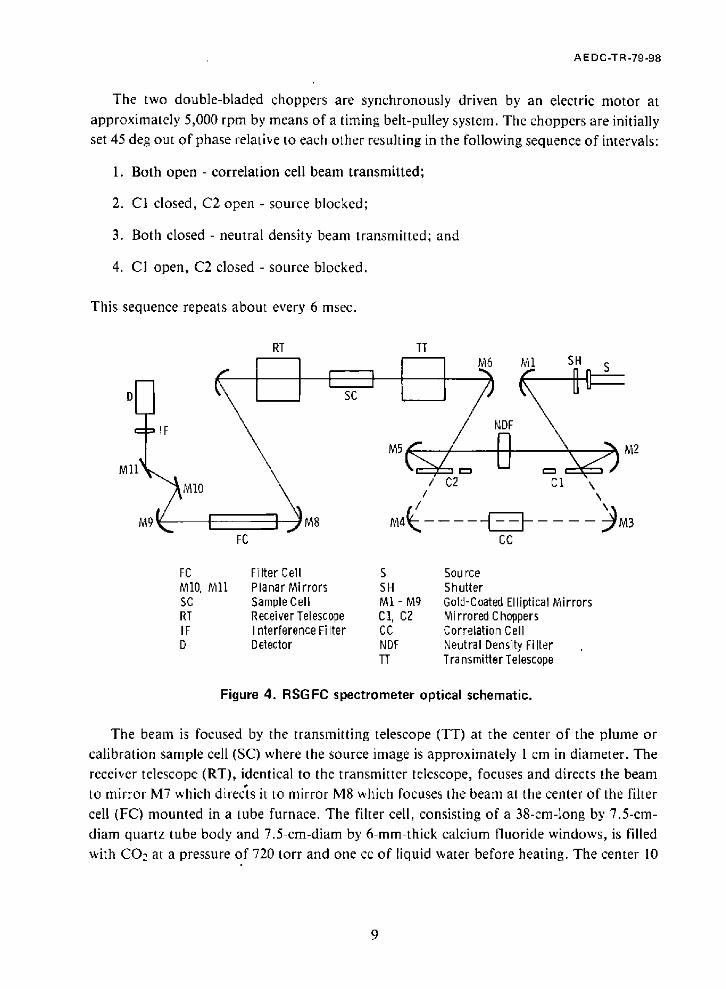
FC Filter Cell S Sou rce MIO, M11 Planar Mirrors SH Shutter SC Sample Cell MI - M9 Gold-Coated Elliptical Mirrors RT Receiver Telescope CI, C2 Mirrored Choppers IF Interference Filter CC Correlation Cell D Detector NDF Neutral Density Filter
TT Transmitter Telescope
Figure 4. RSGFC spectrometer optical schematic.
The beam is focused by the transmitting telescope (TT) at the center of the plume or
calibration sample cell (SC) where the source image is approximately 1 cm in diameter. The
receiver telescope (RT), identical to the transmitter telescope, focuses and directs the beam
to mirror M7 which directs it to mirror M8 which focuses the beam at the center of the filter
cell (FC) mounted in a tube furnace. The filter cell, consisting of a 38-cm-long by 7.5-cm-
diam quartz tube body and 7.5-cm-diam by 6-mm-thick calcium fluoride windows, is filled
with CO: at a pressure of 720 torr and one cc of liquid w.ater before heating. The center 10
9

A EDC-TR-79 -98
cm of the cell is heated to approximately 810 K. The beam emerging from the filter cell is
focused by mirror M9 via planar mirrors M10 and Ml l on a liquid-nitrogen-cooled indium
antimonide detector. An interference filter is mounted at the detector housing entrance window.
The source tube is supplied with low-pressure (1 to 5 torr) CO (99.99-percent purity)
after passing through an activated charcoal, glass wool filter. The pressure is monitored downstream of the source. The low pressure and flow are maintained by a 283-e/min- capacity vacuum pump.
The signal from the detector is amplified by a preamplifier and variable gain a-c
amplifier. The amplified signal is simultaneously fed into two dual-channel boxcar
integrators which provide signal averaging. The boxcars are triggered by a signal from the second chopper. The timing of the boxcars is set to sample at four times during each
complete chopper sequence corresponding to the four intervals described previously.
The number of cycles during which the boxcar integrators average is controlled by a
sample control panel. The averaged signals are displayed on four digital displays. Control of
the data acquisition as well as data recording can be accomplished automatically by the
Arnold Engineering Development Center (AEDC) Engine Test Facility (ETF) Technology
Data Acquisition System (TDACS) which digitizes the data and displays the averaged signals on a cathode ray tube.
2.2 OPERATING PRINCIPLES
The IR radiation emitted by the CO plasma generated in the source tube by absorption of microwave radiation is a multiline emission consisting of narrow lines (< 0.06 c m - l ) from
the fundamental (l-0) band and several hot bands (2-1, 3-2, 4-3, and others). An example of
this spectrum is presented in Fig. 5. Because of the nonequilibrium nature of the excitation
mechanism, the hot-band intensities are comparable to the fundamental intensity. CO at
temperatures of interest to this study, 300 to 2,000 K, is essentially transparent to the source
hot-band radiation, particularly the 3-2 and 4-3 band radiation. This radiation is said to be
uncorrelated to the CO absorption spectrum. After passing through the correlation cell,
essentially all of the radiation corresponding to transitions normally observed in CO in the
temperature range of interest is removed; any further attenuation of the beam on passing
through a plume or sample cell is attributed to uncorrelated absorption, i.e., particulate and window attenuations and absorptions attributed to other species.
10

A E D C-T R-79-98
The other beam, the NDF beam, contains both the correlated and uncorrelated radiation
and is absorbed by CO in the plume or sample. The difference of the absorption of the two
beams is therefore related to the CO content of the sample region.
¢-
2-1 P Branch 2-1 R Branch Strongest Line Strongest Line
(P 15) 1-0 P B ranch (R 14)
!L I :
2,000
Strongest Line (P17)
I
2, 050 2, I00 2, 150
Wave Number, cm -1
1-0 R Branch Strongest Line
(R 18)
/ ;t't!
2, 200 2, 250
Figure 5. RSGFC spectrometer source spectrum - pressure, 1.32 kPa, input power, 42 w.
The response (R) of the instrument to a sample is defined as follows: O"
IND (sample) ICC (no sample) R = 1 - ×
IND (no sample) ICC (sample) (1)
where IND is the neutral density beam intensity and Icc is the correlation cell beam intensity.
Both of these intensities are measured with respect to a source-blocked zero. In the limit that
the correlation cell beam is not attenuated by the sample, the instrument response reduces to
the absorptance of the sample as registered by the neutral density beam.
If the two beams are attenuated by uncorrelated absorptions to the same extent, then the
Icc ratio term corrects the INO ratio for these absorptions; and the instrument response is dependent only on the CO content of the sample or plume.
11

A E D C-TR-79-98
The two beams, after passing through the sample region, are optically filtered twice
before reaching the detector. The first filter, a heated CO2-HzO vapor cell, was described previously. The purpose of this cell is twofold:
1. It serves to attenuate source lines coincident with CO2 and H20 lines and thus
reduces the effects of "accidental" correlations between the CO spectrum and
the CO2 and H20 spectra (the tv,.o principal plume species with spectra overlapping the CO fundamental spectrum (Ref. 8)).
2. It serves to attenuate the possibly noisy plume CO2 and H20 emissions and
partially replace the plume emissions with less noisy hot-cell emissions.
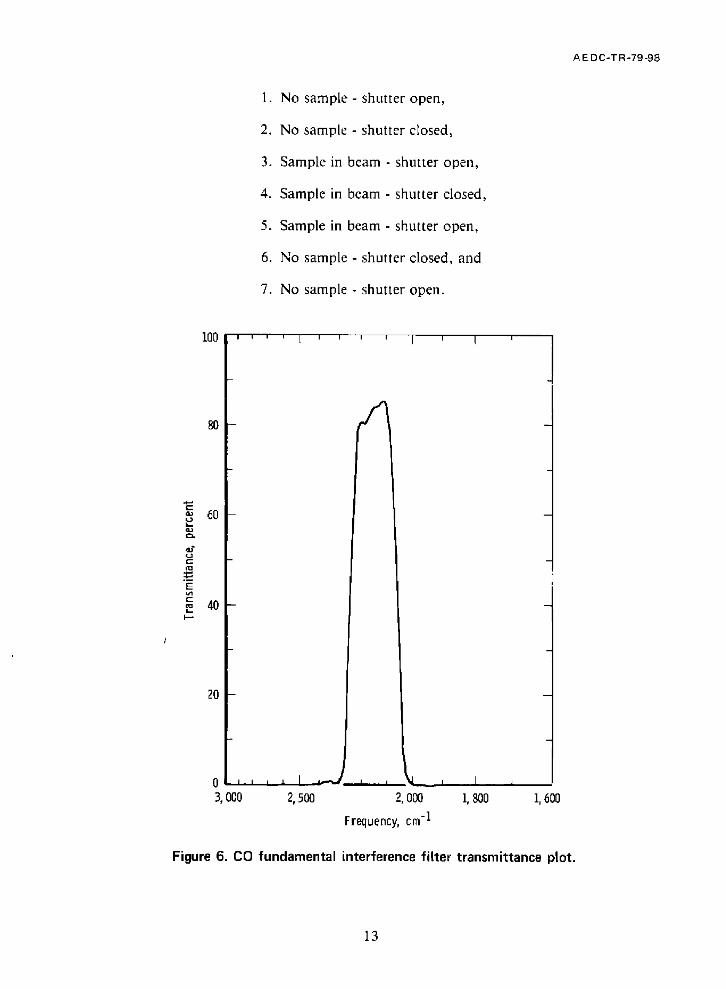
The second filter, one of two interference filters, is mounted at the detector. This filter
limits the spectral response of the instrument to the CO fundamental band and overlapping
hot bands. The transmittances of the two filters used are shown in Figs. 6 and 7. The
broader pass filter admits most of the CO fundamental band spectra and is designated the
CO fundamental filter (Fig. 6). The narrower pass filter admits a large portion of the P
branch of the fundamental and is designated the CO P branch filter (Fig. 7). The CO P
branch filter was used during the combustor tests because of signal/noise considerations,
even though laboratory studies indicated that greater instrument sensitivity to CO was obtained using the CO fundamental filter.
2.3 OPERATING PROCEDURES
Data acquisition is preceded by instrument maintainence Cand setup procedures.
Particular care must be taken to ensure that there are no deposits in the source tube from
previous use and that the two beams focus at the same point in front of the transmitting telescope.
Data acquisition consists of recording the accumulated boxcar integrator signals for all
four intervals of the chopper timing sequence as described previously. Normally, 2,000
sequences are accumulated in approximately two minutes before recording.
As a check for zero drifts (nonzero signals with grounded input) and amplification drifts
of individual channels as well as any synchronous noise, the entire data acquisition sequence is usually repeated with the source blocked by a shutter.
A typical complete measurement sequence is:
12
A E DC-TR -79-98
1. No sample - shutter open,
2. No sample - shutter closed,
3. Sample in beam - shutter open,
4. Sample in beam - shutter closed,
5. Sample in beam - shutter open,
6. No sample - shutter closed, and
7. No sample - shutter open.
(:p
&
E
I00
80
60
40
20
i i
3,000
' ' I ' ' ' ' I ' I '
:q
F I
2, 500 2, 000 1, 800
Frequency, cm -1
I, 600
Figure 6. CO fundamental interference filter transmittance plot.
13

A E DC-TR -79-98
100
80
60
eS u e--
E e"-
~ 40 F,-,
20
i i
O _ l J
3,000
i I I i i I i I
J I I l I , ' ~ [ ~ | I I , ,
2, 500 2, 000 I, 800 I, 600
Frequency, cm -I
Figure 7. CO P branch interference filter transmittance plot.
At each condition, as many as 20,000 chopper sequences are recorded, i.e., ten partial
accumulations o f 2,000 sequences. Each partial accumulation can be recorded on magnetic tape by the TDACS system.
3.0 DEVELOPMENT AND CALIBRATION
The instrument was originally developed and calibrated in the ETF R-2G laboratory area
and subsequently moved to the ETF Propulsion Research Cell (R-2C-I). After installation in
Research Cell R-2C-I, problems arose which necessitated further development and
modification of the instrument which ultimately improved the instrument performance.
14
AE DC-TR-79-98
The laboratory calibration was performed with the instrument equipped with the CO
fundamental filter and an unheated filter cell. The source operating conditions were 42 w of
microwave input power and 10-tort CO pressure. The instrument optimized for test cell
operating conditions was equipped with the CO P branch filter and a heated filter cell. The
source was operated at 3.5-w microwave input power and 1.0-torr CO pressure at the test
cell. These operating conditions minimized deposit buildup in the source tube and increased
the instrument sensitivity o f CO. The increased sensitivity to CO is attributed to lower tube
operating temperatures and hence lower hot parts continuum emission which effectively
dilutes the resonance radiation from the gaseous plasma. The sensitivity of the instrument
was approximately doubled when the source was operated at the lower pressure and power
conditions.
A study of the effects of sample temperature and pressure on the response o f the
instrument to CO was performed in the laboratory. It was found that in the temperature
range of 300 to 600 K and the pressure range of 48 to 97 kPa the response of the instrument
to CO-N2 mixtures is a function o f mainly the CO concentration and the path length, i.e., it
is not a function of temperature and only a very weak function of pressure within
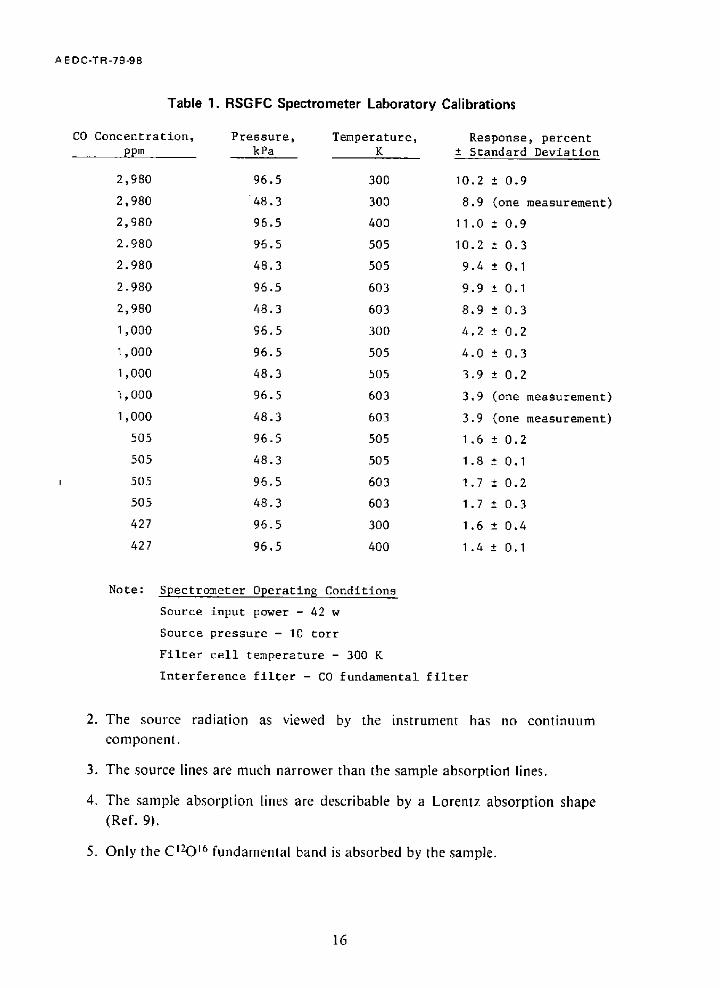
experimental error. Table 1 presents some results of these calibrations using a 10-cm path-
length cell. The very weak dependence of the instrument response with respect to
temperature and pressure is qualitatively accounted for by the preliminary model of the
instrument response.
Calibration of the instrument at the test cell using a calibration sample cell was also
conducted w, ith the instrument optimized for test cell operating conditions. The results of
the calibration using both the CO fundamental filter and the CO P branch filter, the filter
used during the tests, are presented in Fig. 8. Note that the instrument response of the test
cell optimized instrument using the CO fundamental filter is approximately twice that of the
laboratory calibration using the same filter (Table 1). Note also that the response of the
instrument equipped with the CO P branch filter is approximately 60 percent of the CO
fundamental filter equipped instrument response. The CO P branch filter calibration curve
was used to reduce the test cell plume data.
4.0 PRELIMINARY MODEL OF THE INSTRUMENT RESPONSE
A simple preliminary model of the instrument response was constructed using the
following approximations and assumptions:
1. The relative strengths of the source lines are constant with respect to time and
the source operating conditions.
15
A E D C-T R-79-98
Table 1. RSGFC Spectrometer Laboratory Calibrations
CO Concentration, ppm
2,980
2,980
2,980
2.980
2.980
2. 980
2 980
1 000
1 000
I 000
I 000
I 000
5O5
5O5
505
5O5
427
427
Pressure, Temperature, kPa K
96.5
48 3
96 5
96 5
48 3
96 5
48 3
96 5
96.5
48.3
96.5
48.3
96.5
48.3
96.5
48.3
96.5
96.5
300
300
400
505
505
603
603
300
505
505
603
603
505
505
603
603
3OO
4OO
Response, percent Standard Deviation
10.2
8.9
11.0
10.2
9.4
9.9
8.9
4.2
4.0
3.9
3.9
3.9
1 6
1 8
I 7
1 7
1 6
1 4
-+ 0.9
(one measurement)
+0.9
-+0.3
-+0.I
-+0.1
-+0.3
-+0.2
+0.3
-+0.2
(one measurement)
(one measurement)
-+0.2
-+0.I
+-0.2
- + 0 . 3
-+0.4
-+0.I
Note: Spectrometer Operating Conditions
Source input power - 42 w
Source pressure - 10 torr
Filter cell temperature - 300 K
Interference filter - CO fundamental filter
2. The source radiation as viewed by the instrument has no continuum
componem.
3. The source lines are much narrower than the sample absorption lines.
4. The sample absorption lines are describable by a Lorentz absorption shape
(Ref. 9).
5. Only the C12Oi6 fundamental band is absorbed by the sample.
16

A E DC-TR-79 -98
.
7.
.
.
10.
Overlap o f sample absorption lines can be ignored.
The detector response and the NDF transmittance is constant over the bandpass
of the interference filter.
The absorption line strengths can be adequately approximated by the Herman-
Wallis approximation (Ref. 10) as used by Hanson (Ref. 11) and the
fundamental band strength determined by Varanasi and Sarangi (Ref. 12).
Pressure brbadening is proportional to pressure and is characterized by a
temperature dependence of T -° 75 (Ref. 12).
The CO pressure broadening coefficients of the plume constituents are
approximately equal to the N2 coefficient (0.06 cm-1/arm at 298 K) (Ref. 12).
11. The heated filter cell does not influence the instrument response to CO.
22
20
18
16
~, 14 ¢ -
~- 12
10 E
~ 6
" 4
Spectrometer Operatln 9 Conditions
Source Input Power - 3.5 w
Source Pressure - 1.0 tort
Filter Cell Temperature - 810 K
Interference Fi Iter - as I ndicated
CO Fundamental Filter
CO P Branch Filter
I i ] 0 1, 000 2, 000 3, 000
CO Concentration, ppm
Figure 8. RSGFC spectrometer test cell calibration curve - path- length, 10 cm, temperature, 300 k.
The small pressure dependence of the calibration data (Table 1) is seen to be a
consequence of the Lorentz line shape assumption (4), the narrowness of source lines
17 i
A E D C-TR-79-98
relative to the absorpt ion line assumption (3), the absence of con t inuum source radiation
assumpt ion (2), and the pressure broadening coefficient pressure proport ional i ty
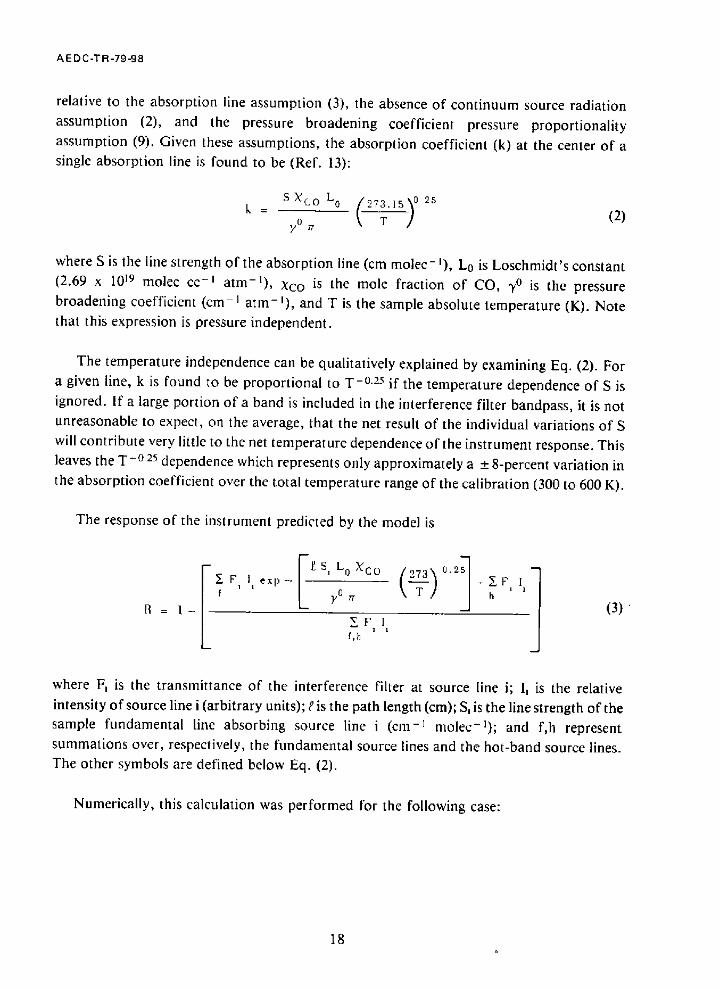
assumption (9). Given these assumptions, the absorpt ion coefficient (k) at the center of a single absorpt ion line is found to be (Ref. 13):
k = Co
k T / yo ~r (2)
where S is the line strength of the absorpt ion line (cm molec- I), L0 is Loschmidt ' s constant
(2.69 x 10¹⁹ molec cc -~ a tm-¿ ) , Xco is the mole fraction of CO, 3, 0 is the pressure
broadening coefficient ( cm- ~ a t m - ~), and T is the sample absolute temperature (K). Note that this expression is pressure independent .
The temperature independence can be qualitatively explained by examining Eq. (2). For
a given line, k is found to be proport ional to T -0-25 if the temperature dependence of S is
ignored. If a large port ion of a band is included in the interference filter bandpass, it is not unreasonable to expect, on the average, that the net result of the individual variations of S
will contr ibute very little to the net temperature dependence of the instrument response. This
leaves the T - ° 25 dependence which represents only approximately a _+ 8-percent variation in the absorpt ion coefficient over the total temperature range of the calibration (300 to 600 K).
The response of the instrument predicted by the model is
f E sLo co 021 1 I 1 1 1 f y0 h R _- t - ( 3 )
E F ! 1 1 f,h
where F, is the t ransmit tance of the interference filter at source line i; I, is the relative
intensity of source line i (arbitrary units); e is the path length (cm); S, is the line strength of the sample fundamenta l line absorbing source line i ( cm- I molec - l ) ; and f,h represent
summat ions over, respectively, the fundamenta l source lines and the hot-band source lines. The other symbols are defined below Eq. (2).
Numerically, this calculation was performed for the following case:
18
A E D C-T R-79-98
1. CO concentration - 2,980 ppm in N2;
2. T -298 K;
3. P - 101.325 kPa;
4. Path length - 10 cm; and
5. CO fundamental filter bandpass.
The calculation yields an instrument response of 0.185 as compared to the experimental
value of 0.202 _+ 0.005 (Fig. 8).
Although the agreement between experiment and theory for this case is adequate, more
work is needed to validate the model assumptions and to calculate the effect o f temperature,
pressure, CO concentration, and filter characteristics on the in~'trument response.
5.0 TEST CELL A P P L I C A T I O N
Experiments comparing RSGFC spectrometer CO concentration measurements with
measurements made with a conventional probe sampling system were conducted in the ETF
Research Cell R-2C-I. This cell is equipped with a 14-cm-diam turbine engine combustor
with an attached 5.5-cm-diam standard ASME long radius nozzle, a heated combust ion air
supply, a pressurized JP-4 fuel system, and a test section in which optical and probe sampled
emission measurements are made. The details of the test cell and its operation can be found
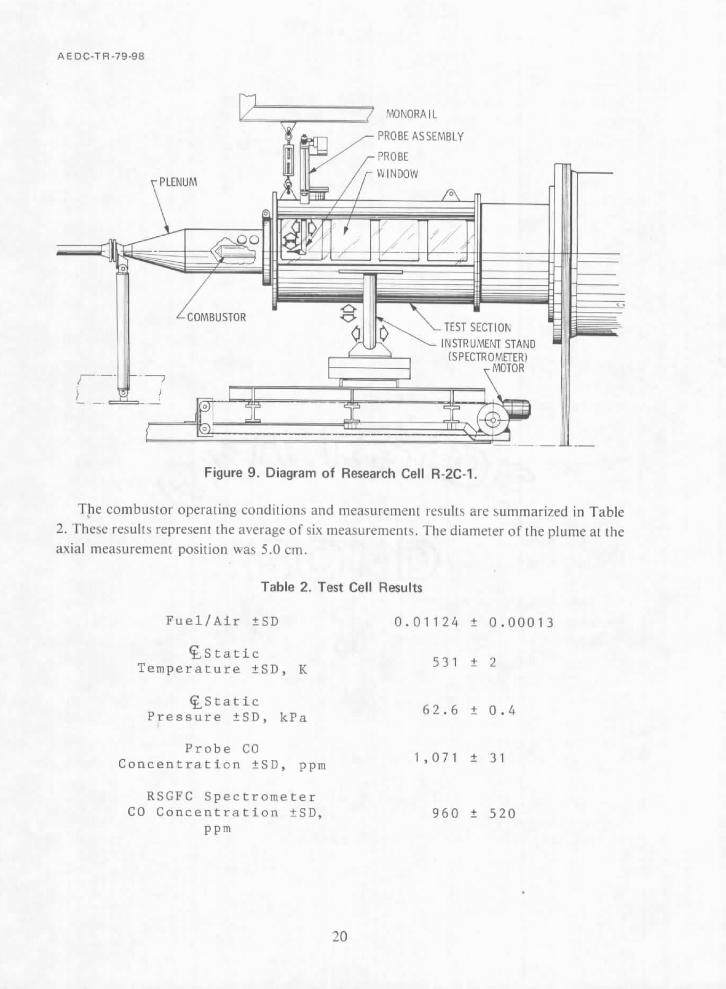
in Ref. 14. A schematic diagram of the test cell is presented in Fig. 9.
The sampling probe used to extract the gas sample from the exhaust stream is a stainless
steel expansion-type probe. This probe provides an expansion of the gas sample across an
entrance orifice. The pressure differential across the orifice is maintained by a positive
displacement pump. All probe measurements were made with the probe inlet located on the
exhaust stream centerline at an axial position of 2.3 cm downstream of the nozzle exit plane.
The probe was cooled by a closed system containing a mixture of ethylene glycol and water.
The gas samples v,,ere analyzed for CO content by a commercial nondispersive infrared
CO analyzer calibrated against standard commercial calibration gases.
The spectrometer optical axis was positioned perpendicular to the exhaust flow 2.3 cm
downstream of the nozzle exit plane at the plume centerline. The instrument was set up 'as
previously described for optimized test cell performance.
19
A E DC-T R-79-98
• P LENUM
MONORAIL
PROBE ASSEMBLY
PROBE
WINDOW
L COMBUSTOR TEST SECTION
INSTRUMENT STAND (SPECTROMETER)
• - MOTOR
Figure 9. Diagram of Research Cell R-2C-1.
The combustor operating conditions and measurement results are summarized in Table
2. These results represent the average of six measurements. The diameter of the plume at the
axial measurement position was 5.0 cm.
Table 2. Test Cell Results
Fuel/Air ±SD 0 . 0 1 1 2 4
Static Temperature ±SD, K
± 0 . 0 0 0 1 3
~Static Pressure ±SD, kPa
531 i 2
Probe CO Concentration ±SD, ppm
62.6 + 0.4
RSGFC Spectrometer CO Concentration ±SD,
ppm
1 , 0 7 1 ± 31
960 ± 520
20

A E D C - T R - 7 9 - 9 8
The static temperature and pressure were calculated from the isentropic equations
relating total to static conditions using the Mach number at the point of measurement
determined from a method of characteristics solution of the flow-field equations (Ref. 15).
The total temperature was calculated using the method of Ref. 16, and the total pressure in
the combustor was measured using a total-pressure probe.
6.0 CONSIDERATIONS FOR FUTURE INSTRUMENT DEVELOPMENT k
As indicated in Table 2, the RSGFC spectrometer measurements are in agreement with
the probe measurements within experimental error, but the experimental error is
unacceptably large ( _+ 54 percent). The principal reason for the large uncertainty is the poor
signal-to-noise ratio (S/N). Although precautions were taken to optically filter out the noisy
plume radiation, the S/N directly from the detector was only approximately 0.4. With
20,000 boxcar accumulations, the S/N is theoretically increased to 56.6. This corresponds to an instrument response uncertainty of approximately 0.018, which at the instrument
response level of the present experiment corresponds to a measurement uncertainty of + 70
percent.
There are several options available to reduce the experimental uncertainty:
.
, /
2.
Increase the path length using multiple pass optics. This would have the effect of
increasing the instrument response for a given CO concentration, it would also
be expected to increase the optical noise level somewhat and add to already
difficult alignment procedures.
Increase the number of boxcar accumulations. Given the instrument response
level of the present experiment, a _+ 10-percent experimental uncertainty goal would necessitate 1 x 10 6 accumulations which would lengthen the time of a
single complete measurement to approximately eight hours. Clearly, a faster
chopper system would need to be developed.
. Improve the optical noise filtering. If the optical noise is caused by molecular
species emission radiation, an improved filter cell and/or interference filter
would be expected to help; but if the noise is spectrally continuous (e.g.,
particulate radiation), this approach would probably be ineffective.
4. Intensify the source. Development of a more intense source should lead to
improved instrument performance by increasing the S/N.
21
AE DC-TR-79-98
The initial application of the instrument represents a rather severe test because of the
relatively noisy optical signal and the short path length. It would appear that unless the S/N
can be significantly improved, the current model of the RSGFC spectrometer will only be
useful for lower temperature or lower noise flows and/or higher concentration, longer path- length systems.
7.0 SUMMARY AND CONCLUSIONS
The development and testing of a resonance source gas filter correlation spectrometer for
CO measurement in high temperature, possibly acoustically and optically noisy combustion
systems, are described. The instrument incorporates a microwave-excited low-pressure CO plasma radiation source.
Calibration and preliminary modeling indicate the instrument response to CO is
characterized by a very weak function of temperature between 300 and 600 K and of pressure between 48 and 96 kPa.
A preliminary field test of the instrument behind a jet combustor revealed severe optical
noise interference. The CO concentration of the plume, as determined by the instrument,
was found to be 960 + 520 ppm as compared to 1,071 _+ 31 as determined by an orifice probe, gas analyzer measurement. It is concluded that improved instrument performance is
dependent upon improving the signal-to-noise ratio. If this is not possible, the instrument's usefulness will be limited to low temperature, low noise or high concentration, long path- length systems.
.
.
.
REFERENCES
Few, J. D., Bryson, R. J., and McGregor, W. K. "Evaluation of Probe Sampling versus
Optical In Situ Measurements of Nitric Oxide Concentrations in a Jet Engine Combustor Exhaust ." AEDC-TR-76-180 (ADA034726), January 1977.
Benson, R. and Samueisen, G. S. "Oxides of Nitrogen Transformation While Sampling
Combustion Products Containing Carbon Monoxide, Hydrogen and Hydrocarbons."
Presented at the 1977 Spring Meeting, Western States Section, Combustion Institute, University of Washington, Seattle, April 18-19, 1977.
Burch, D. E. and Pembrook, J. D. "Instrument to Monitor CH4, CO and CO, in Auto Exhaust ." EPA Report 650/2-73-030, October 1973.
22

A E DC-TR -79-98
4. Gryvnak, D. A. and Burch, D. E. "Monitoring NO and CO in Aircraft Jet Exhausts by a Gas-Filter Correlation Technique." AFAPL-75-101, January 1976.
. Herget, W. F., Jahnke, J. A., Burch, D. E., and Gryvnak, D. A. "Infrared Gas-Filter Cor re la t ion Ins t rument for In Situ Measurement of Gaseous Po l lu tan t Concentrations." Applied Optics, Vol. 15, May 1976, pp. 1222-1228.
6. Ludwig, C. B., Griggs, M., Malkmus, W., and Bartle, E. R. "Air Pollution
Measurements from Satellites." NASA CR-2324, 1973.
7. Bartle, E. R. and Halt, G. "Airborne HCI-CO Sensing System." NASA CR-145095, 1977.
. Lindquist, G. H., Arnold C. B., and Spellicy, R. L. "Atmospheric Absorption Applied to Plume Emission, Experimental and Analytical Investigations of Hot Gas Emissions
Attenuated by Cold Gases." AFRPL-TR-75-30 (ADA015075), August 1975.
9. Mitchell, A. C. G. and Zemansky, M. W. "Resonance Radtation and Excited A toms.'" The MacMillan Company, New York, 1934.
10. Herman, R. and Wallis, R. F. "Influence of Vibration-Rotation Interaction on Line Intensities in Vibration-Rotation Bands of Diatomic Molecules." The Journal of Chemical Physics, Vol. 23, April 1955, pp. 637-646.
11. Hanson, R. K. "Combustion Gas Measurements Using Tunable Laser Absorption
Spectroscopy." Proceedings of the 17th Aerospace Sciences Meeting, New Orleans, Louisiana, January 15-17, 1979.
12. Varanasi, P. and Sarangi, S. "Measurements of Intensities and Nitrogen Broadened Line Widths in the CO Fundamental at Low Temperatures." Journal of Quantitative Spectroscopy and Radiative Transfer, Vol. 15, June 1975, pp. 473-482.
13. Young, L. A. "CO Infrared Spectra." Journal o f Quantitative Spectroscopy and Radiative Transfer, Vol. 8, February 1968, pp. 693-716.
14. Few, J. D., Bryson, R. J., and Lowry, H. S., 11I. "Optical In Situ versus Probe
Measurements of Nitric Oxide Concentration as a Function of Axial Position in a
Combustor Exhaust." AEDC-TR-78-32 (ADA067329), March 1979.
23
A E DC-T R -79-98
15. "User Manual - Description of a Digital Computer Program for Nozzle and Plume
Analysis by Method of Characteristics." TM-54-20-108, Lockheed Missile and Space Company, Sunnyvale, California, December 1966.
16. Osgerby, 1. T. and Rhodes, R. P. "An Efficient Numerical Method for the Calculation of Chemical Equilibrium in the H / C / O / N / A System." AEDC-TR-71-256 (AD741825), April 1972.
24